


Abstract
Soil salinization stands out as a major factor contributing to the shrinkage of arable land. This study explored the salt tolerance mechanism of tillers in CMG and 9311 by evaluating morphophysiological, transcriptomic, and metabolomic characteristics under 0.3% NaCl stress. The activities of SOD, POD, and APX in the tiller nodes of the salt-tolerant variety CMG were higher than those of 9311, while the levels of MDA and hydrogen peroxide in the tiller nodes of CMG were relatively low. Both varieties responded to salt stress mainly by activating pathways such as amino acid metabolism (alanine, aspartic acid, glutamic acid metabolism, and arginine biosynthesis), amino acid acyl-trNA biosynthesis, oxidative phosphorylation, and phenylpropanin biosynthesis. The varieties differed in that CMG tillering nodes also have unique pathways of “glycerophospholipid metabolism” (related to membrane lipid remodeling) and “biosynthesis of the cuticle, suppositories and waxes”, which can effectively reduce water loss and prevent sodium ions from entering. In addition, CMG can regulate more plant hormone signaling pathways to coordinate the expression and metabolic activities of downstream defense genes, such as abscisic acid (ABA) and jasmonic acid (JA), and other hormone signals. After salt stress, the CMG tiller nodes tend to strengthen themselves, enabling them to resist stress and reduce Na+ toxicity, while the 9311 tiller nodes, under the condition of activating basal metabolism, transfer to the leaves to enhance photosynthetic efficiency and resist stress. Through comprehensive screening and analysis of the genes and metabolites of CMG and 9311 tillers under salt stress, the molecular mechanisms and metabolic pathway dynamics involved in their salt stress response were identified, thus providing a new perspective for in-depth research on rice salt tolerance mechanisms.
1. Introduction
Soil salinization is a major abiotic stress that severely constrains global crop production and agricultural sustainability, with salinized land increasing at a rate of 0.3–1.5 million hectares per year [1,2,3]. Soils with an electrical conductivity of 4 dS/m (approximately 40 mM NaCl) create osmotic pressure (0.2 MPa) that adversely affects most crops [4]. In response to salt stress, plants employ complex adaptive strategies [5], often involving reprogramming of gene expression and metabolite profiles [6,7]. For instance, sesame enhances tolerance through ABA biosynthesis [8], and kale upregulates antioxidant enzyme genes to improve oxidative defense [9]. However, the specific molecular mechanisms differ among species and genotypes, necessitating detailed investigations in economically important crops like rice.
Rice (Oryza sativa L.) is a staple food for over half of the world’s population, yet it is moderately sensitive to salinity [10,11]. Salt stress inhibits morphophysiological traits, reducing grain yield and quality [12,13]. The tillering stage is particularly critical because it determines plant architecture, panicle number, and final yield; tiller number and angle are key determinants of productivity [14]. Tillers arise from axillary buds on the main stem and develop their own root systems, contributing to plant survival and yield potential [15,16,17]. Consequently, tiller initiation and growth are important agronomic traits [18]. However, salinity significantly reduces tiller numbers [19], and primary and secondary tillers are more vulnerable to stress than the main stem, often leading to substantial yield reduction [20].
Salt stress induces osmotic stress, ionic toxicity due to excessive Na+ accumulation, and oxidative damage from elevated reactive oxygen species (ROS) [21,22]. To counteract these effects, plants activate ion homeostasis mechanisms, such as Na+ exclusion or vacuolar sequestration, to maintain Na+/K+ balance [23,24] and redox regulation through enzymatic and non-enzymatic antioxidant systems [25,26,27]. Plant hormones, including ABA, ethylene, and brassinosteroids, orchestrate these defense pathways [28]. Despite these general principles, the specific responses of tillering nodes—the sites of new tiller formation—to salt stress remain largely unexplored.
Recent advancements in transcriptomics and metabolomics have greatly facilitated the identification of salt tolerance pathways in rice. For example, comparative transcriptome analysis revealed key differentially expressed genes between salt-tolerant and salt-sensitive rice cultivars [11], while metabolomic profiling highlighted critical metabolic alterations, such as glutathione metabolism, associated with salinity resistance [29]. Beyond these, an increasing number of integrated multi-omics studies have substantially deepened our understanding of rice salt tolerance mechanisms. The integration of transcriptomic and metabolomic data can provide detailed information for better understanding the molecular mechanisms underlying salt tolerance [30].
For instance, comparative transcriptome and metabolome profiling of OsDRAP1-overexpressing rice revealed that this ERF transcription factor enhances salt tolerance by regulating redox homeostasis and membrane stability, with amino acid and carbohydrate metabolism pathways playing crucial roles [30]. Similarly, integrated analysis of salt-tolerant HD-961 and salt-sensitive IR29 roots demonstrated that flavonoid biosynthesis and galactose metabolism are critical pathways contributing to salt resistance [31].
In another study, combined transcriptome and metabolome analysis of the salt-tolerant landrace HD-961 identified glutathione metabolism as a specific and significantly affected pathway under salt stress, with Pearson correlation analysis revealing significant correlations between reduced glutathione and 16 candidate genes [29]. Despite these advances, most existing studies have predominantly focused on roots or leaves, and integrated multi-omics analyses of tiller nodes—the critical sites that determine panicle number and final yield—are severely lacking. Moreover, the dynamic interplay between transcriptional regulation and metabolic shifts specifically in tiller nodes under salt stress, particularly across varieties with contrasting salt tolerance, has not been systematically investigated.
Therefore, in this study, we selected two rice varieties, 9311 (salt-sensitive) and CMG (salt-tolerant), and conducted a combined morphophysiological, transcriptomic, and metabolomic analysis of their tiller nodes under 0.3% NaCl stress. A moderate salt concentration of 0.3% NaCl (approximately 51 mM, slightly above the 40 mM threshold) was selected to induce differential responses between the two varieties while maintaining plant viability. The reasons for this are detailed in Section 3.3. Our objectives were to (i) characterize the differences in antioxidant enzyme activities, ROS levels, and membrane damage between the two varieties; (ii) identify variety-specific genes and metabolites involved in salt response; and (iii) elucidate the unique pathways that may contribute to the superior salt tolerance of CMG. By integrating multi-omics data, we aim to provide a comprehensive view of the molecular mechanisms underlying salt tolerance at the tillering stage and to offer novel insights for breeding salt-tolerant rice varieties.
2. Results and Analysis
2.1. Effects of Salt Stress on Rice Tillering
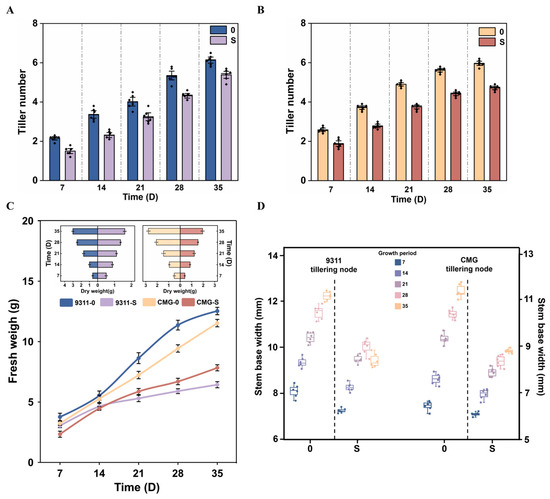
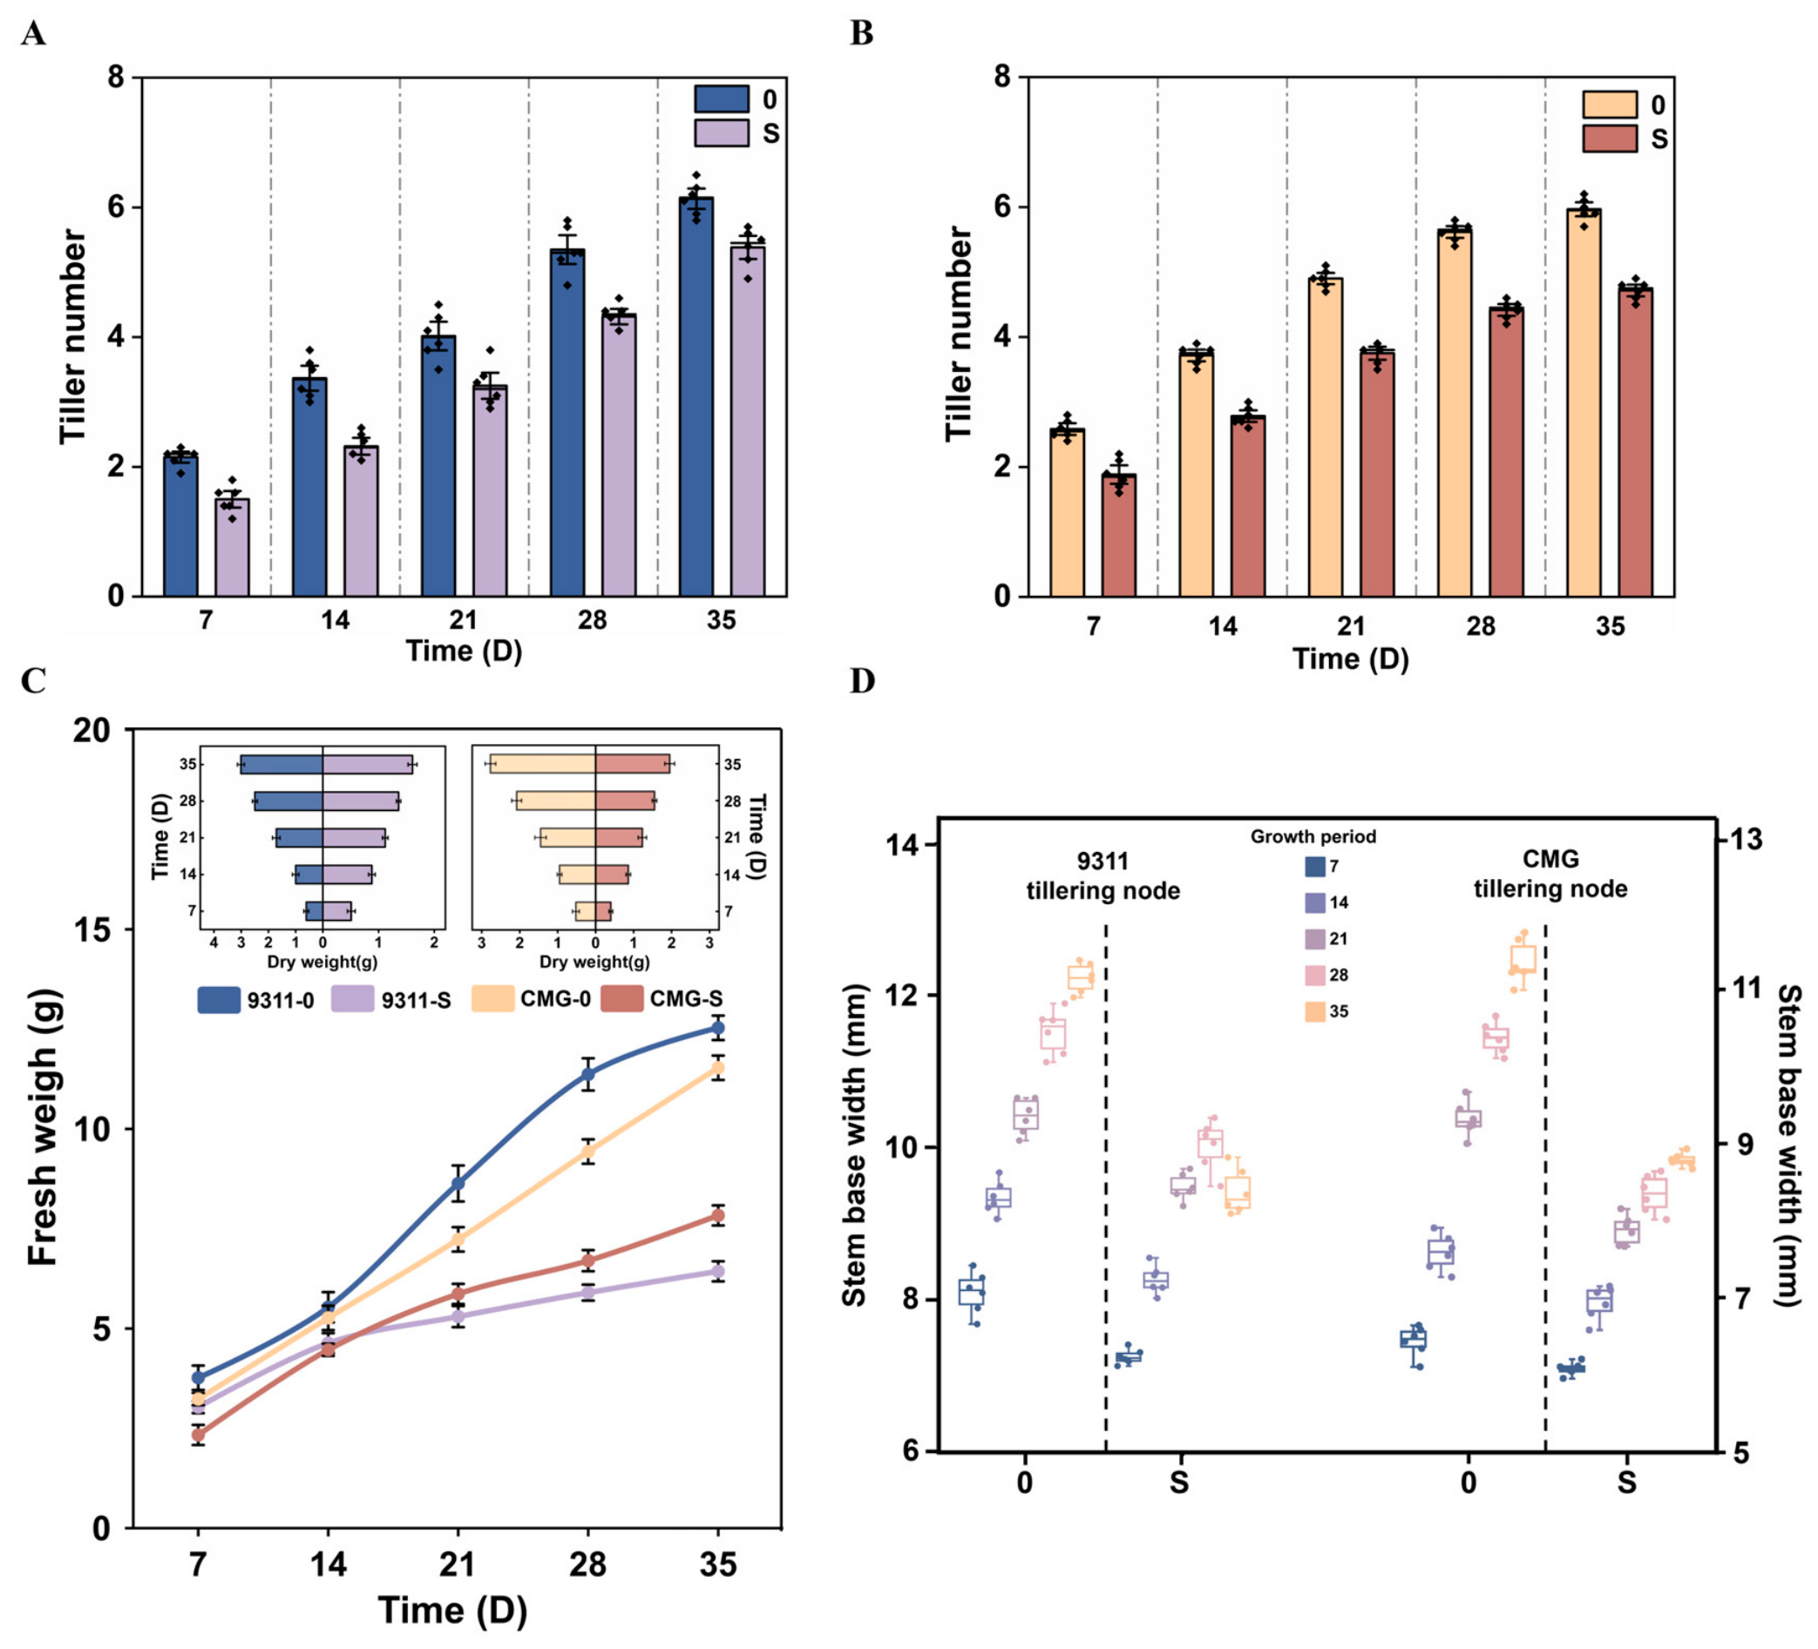
The tillering responses of rice varieties 9311 and CMG to salt stress were examined from 7 to 35 days, along with the dynamics of fresh and dry weights of tillering nodes. The results demonstrated that the occurrence of tillering in both varieties was significantly inhibited, although the extent of inhibition and recovery characteristics varied notably between them. The number of tillers for both varieties at each time point under salt stress was lower than that of the corresponding controls. Specifically, the degree of inhibition from 7 to 35 days for 9311 was 30.2%, 31.2%, 19.25%, 19.3%, and 12.2% lower than in the control group, respectively (Figure 1A). In comparison, CMG exhibited reductions of 27.1%, 25.3%, 23.5%, 21.4%, and 20.9% during the same period (Figure 1B). Under salt stress, the dry weight of both varieties at each time point was lower than that of the control. The inhibition rates for 9311 on the 7th, 14th, 21st, 28th, and 35th days were 16.4%, 12.0%, 34.5%, 45.6%, and 46.5%, respectively. In comparison, the corresponding inhibition rates for CMG were 23.1%, 9.5%, 15.2%, 25.5%, and 29.6%, indicating that the impact of salt stress on dry matter accumulation in CMG was relatively mild. The trend in fresh weight mirrored that in dry weight (Figure 1C). Additionally, under salt stress, the stem base widths of both varieties at each time point were lower than those of the respective controls. The inhibition rates for 9311 on the 7th, 14th, 21st, 28th, and 35th days were 10.4%, 11.6%, 8.9%, 12.9%, and 22.9%, respectively (Figure 1D). The corresponding inhibition rates for CMG were 5.4%, 8.6%, 15.5%, 19.6%, and 22.6%.
Figure 1.
The influence of salt stress on rice tillering. (A) The variation in tiller number of 9311 from 7 to 35 days (each processing is from left to right); (B) changes in the tillering number of CMG from 7 to 35 days. 0 represents the control group, and S represents the salt stress treatment group. (C) Changes in fresh and dry weights of 9311 and CMG under salt stress from 7 to 35 days. (D) Changes in stem base width of 9311 and CMG under salt stress from 7 to 35 days. The experimental data are expressed as the means and standard deviation (SE) of the four biological replicates. Significance analysis was conducted using the Duncan model. Different lowercase letters indicate statistically significant differences (p < 0.05).
When comparing the two varieties, under salt stress, CMG exhibited a significantly higher tiller number than 9311 from 7 to 21 days (Supplementary File S1, Table S1), indicating better tiller maintenance during early stress. In contrast, stem base width was consistently greater in 9311 across all time points (Supplementary File S1, Table S2). From 21 to 35 days, CMG showed significantly greater fresh and dry weights than 9311 (Supplementary File S1, Table S3 and S4), with the difference in dry weight increasing over time, suggesting superior biomass retention under salinity.
2.2. Effects of Salt Stress on MDA Content in Rice Tillers
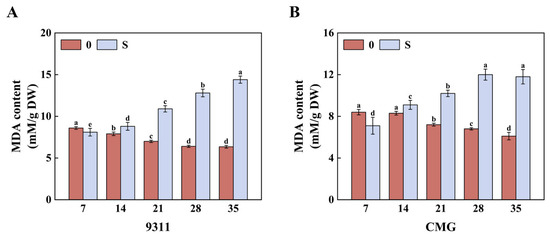
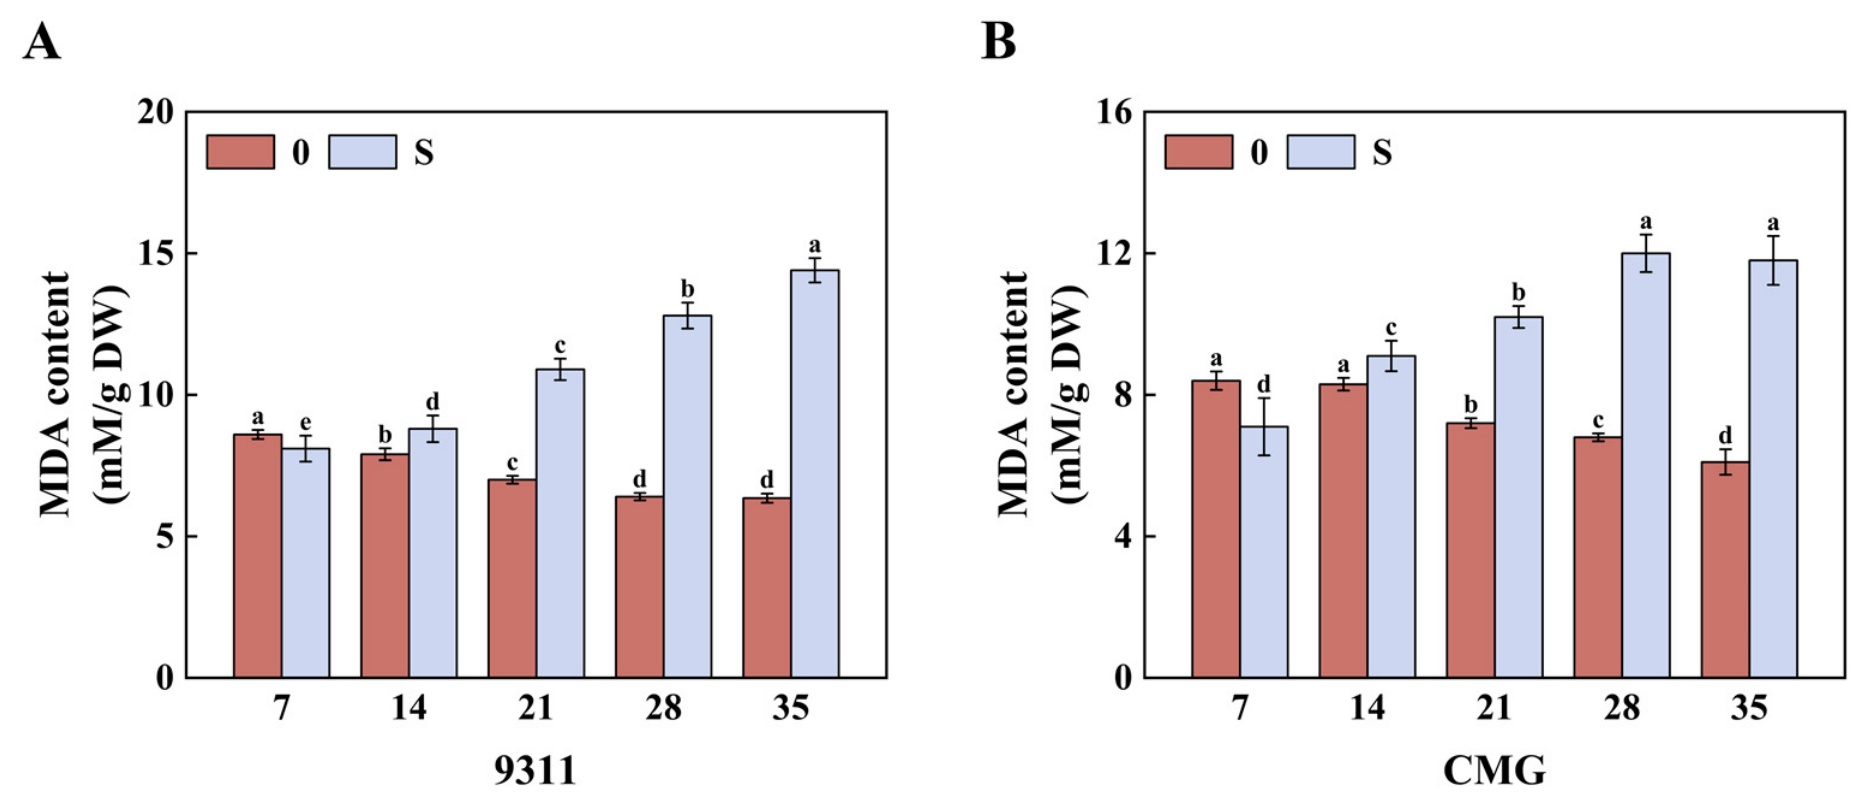
The effect of salt stress on the MDA content in rice tillers is shown in Figure 2. From 7 to 35 days, the MDA content in the control groups of 9311 and CMG gradually decreased, while that in the S treatment group gradually increased. Under salt stress, MDA increased in both, but CMG consistently exhibited lower levels than 9311 at all time points, with the difference widening from 4.6% at 14 days to 22.0% at 35 days (Figure 2). When comparing the two varieties from 21 to 35 days, the MDA content of CMG was always lower than that of 9311, with the greatest difference at 35 days, where that of CMG was 19.1% lower than that of 9311 (Supplementary File S1, Table S5).
Figure 2.
The effects of salt stress on MDA content in rice tillers. (A) MDA content in 9311 tiller nodes; (B) MDA content in CMG tiller nodes. 0 represents the control group, and S represents the salt stress treatment group. The experimental data are expressed using the means and standard deviation (SE) of four biological replicates. Significance analysis was conducted using the Duncan model, and different lowercase letters indicate statistically significant differences (p < 0.05).
2.3. Effects of Salt Stress on Hydrogen Peroxide Content in Rice Tillers
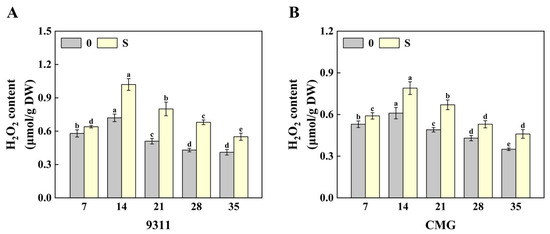
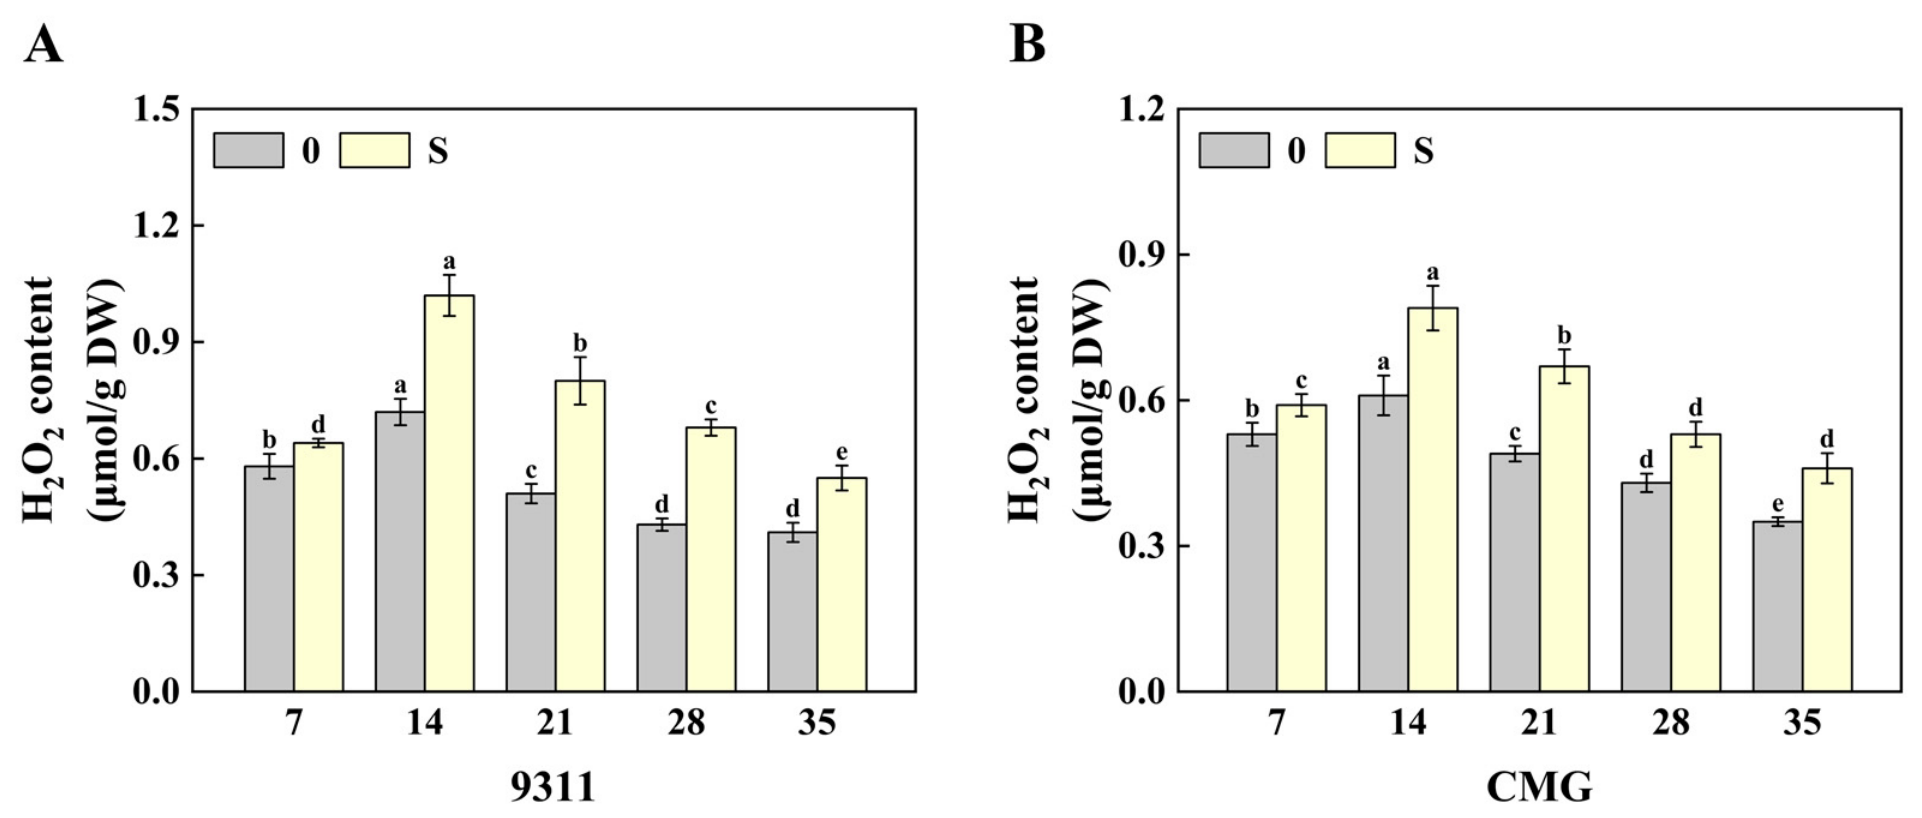
Under salt stress, the increase in hydrogen peroxide triggers oxidative damage to tillers, and the H2O2 clearance capabilities of different rice varieties vary (Figure 3A,B). From 7 to 35 days, the hydrogen peroxide content in the S treatment groups of 9311 and CMG first increased and then decreased, reaching the highest at 14 days. The hydrogen peroxide content in the S treatment group was higher than that in the control group. In the S treatment group of 9311, the hydrogen peroxide content on the 14th day increased significantly by 24.14% compared with that on the 7th day, and the content in CMG increased by 15.09%.
Figure 3.
The effect of salt stress on hydrogen peroxide content in rice tillers. (A) The hydrogen peroxide content of 9311 tiller nodes and (B) the hydrogen peroxide content of CMG tiller nodes, expressed as the means and standard deviation (SE) of four biological replicates. Significance analysis was conducted using the Duncan model, and different lowercase letters indicate statistically significant differences (p < 0.05).
2.4. The Effect of Salt Stress on the Activity of Antioxidant Enzymes in Rice Tillers
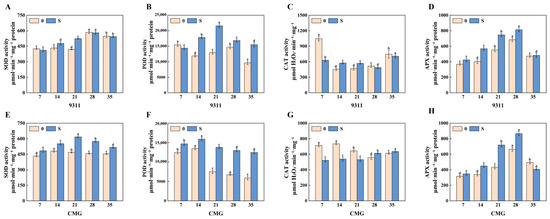
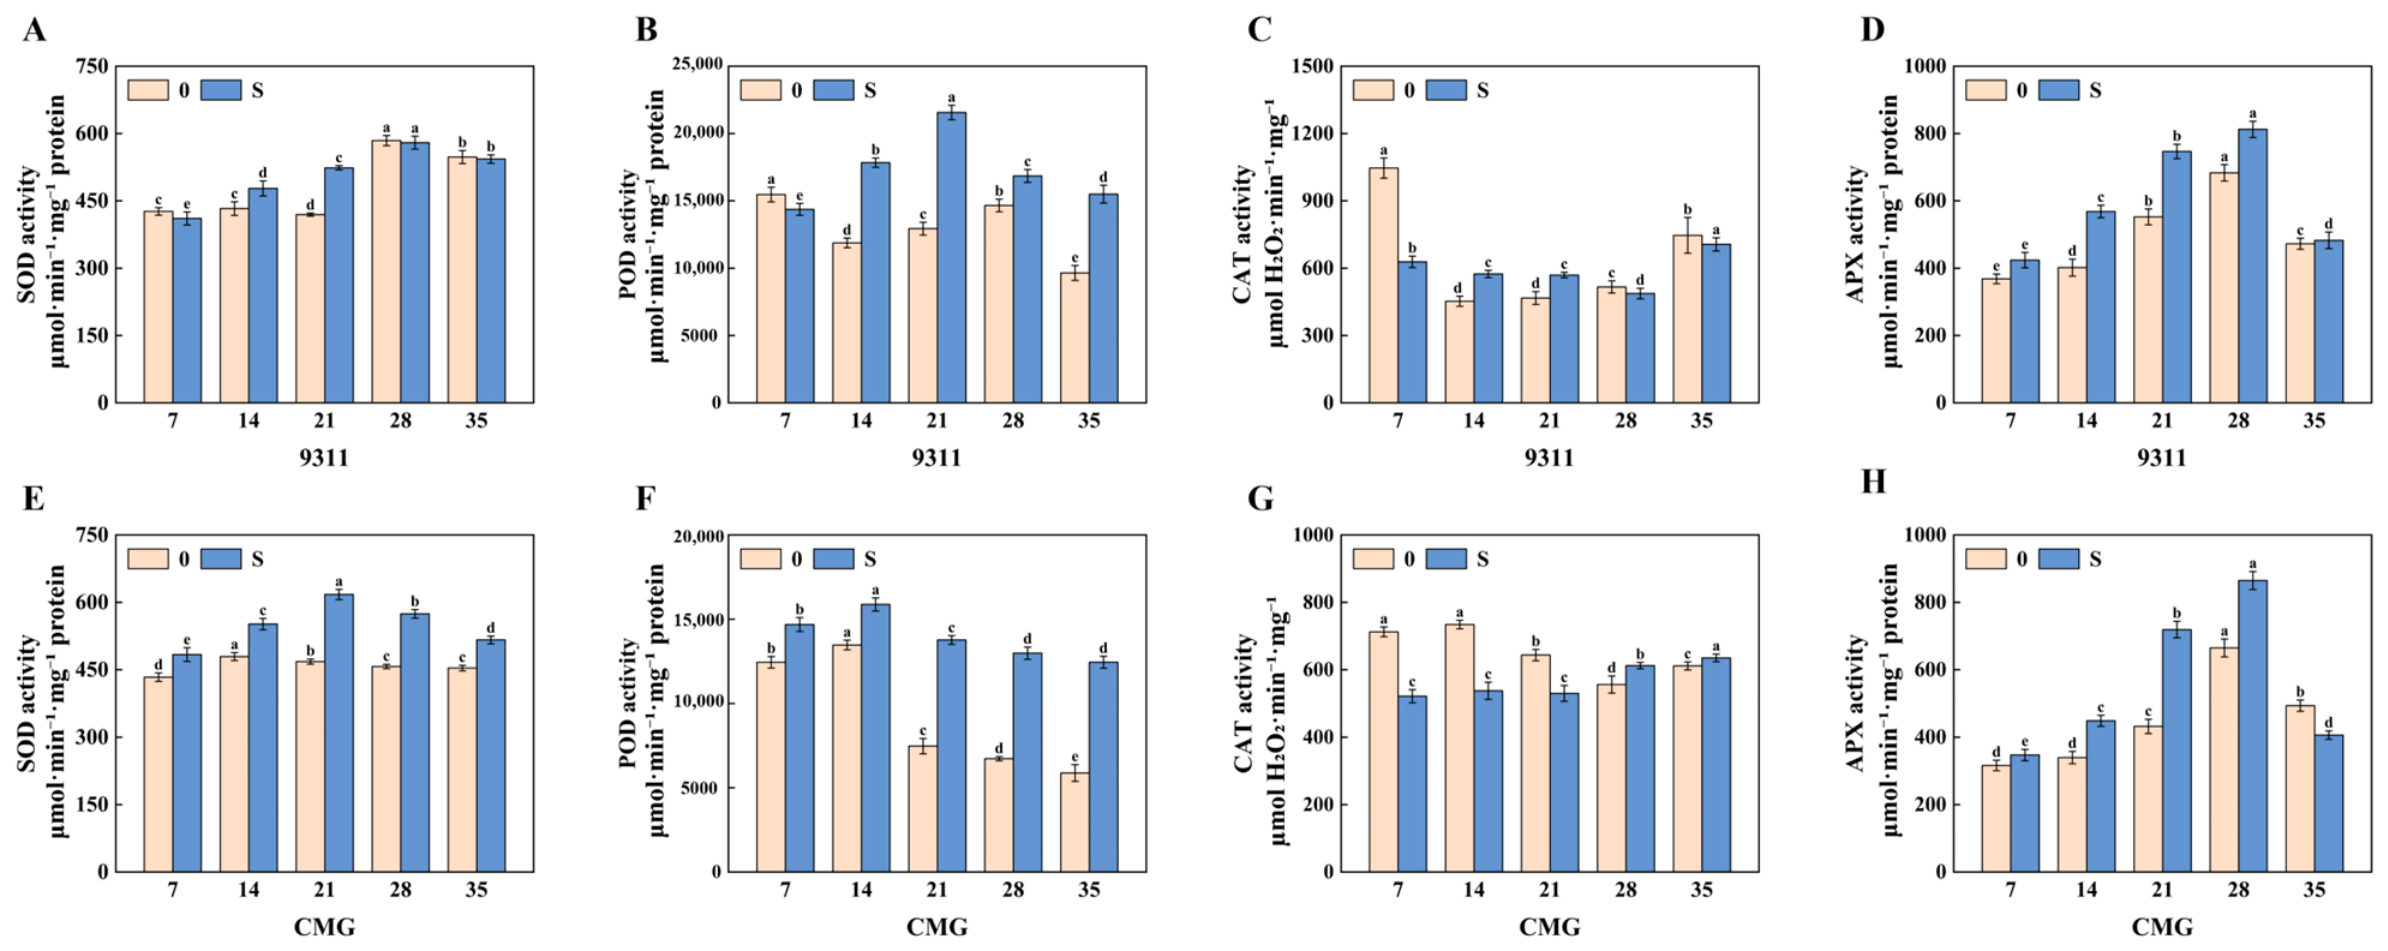
Salt stress significantly altered the activity of the antioxidant enzyme system in rice tillers, as shown in Figure 4. Compared with the control group, the activities of SOD, POD, and APX in the S treatment group of 9311 and CMG increased significantly from 7 to 28 days. The SOD activity in the S treatment group of 9311 first increased and then decreased from 7 to 35 days, reaching its peak on the 28th day, with a significant increase of 36.98% compared with the 7th day. The SOD activity in the S treatment group of CMG reached its peak on the 21st day, with a significant increase of 7.98% compared to the 7th day (Figure 4A,E). Peroxidase (POD) and ascorbic acid peroxidase (APX) showed similar trends. Under salt stress, the growth rate of peroxidase (APX) in CMG was much greater than that in 9311. CAT activity in the CMG salt treatment group continued to increase from 28 to 35 days, while there was no significant difference from 7 to 21 days. At 28 days, CAT activity in the S treatment group became higher than that in the control group (Figure 4G).
Figure 4.
The effect of salt stress on the specific activity of antioxidant enzymes in rice tillers. (A) SOD enzyme specific activity (9311); (B) POD enzyme specific activity (9311); (C) CAT enzyme specific activity (9311); (D) APX enzyme specific activity (9311); (E) SOD enzyme specific activity (CMG); (F) POD enzyme specific activity (CMG); (G) CAT enzyme specific activity (CMG); and (H) APX enzyme specific activity (CMG). The experimental data are expressed as the means and standard deviation (SE) of four biological replicates. Significance analysis was conducted using the Duncan model, and different lowercase letters indicate statistically significant differences (p < 0.05).
2.5. Transcriptomic Analysis
2.5.1. Transcriptome Sequencing Results and Identification of Differentially Expressed Genes
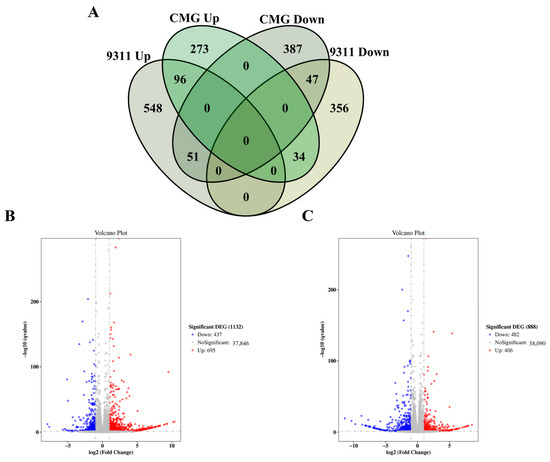
The tiller segments of 9311 and CMG treated with the control (distilled water + 0% NaCl) and S (distilled water + 0.3% NaCl) treatments were subjected to transcriptome sequencing so we could analyze the characteristics of gene expression changes. The results showed that a total of 37,421,954 to 554,333,410 high-quality valid reads were obtained for each sample. The Q20 and Q30 values of the sequencing data reached 98.39–98.58% and 95.28–95.71%, respectively (Supplementary File S2, Table S1), indicating that the quality of the transcriptome data was excellent and suitable for subsequent in-depth analysis. Differential gene expression analysis identified 1132 differentially expressed genes in 9311 tillers (DEGs, including 695 upregulated and 437 downregulated; Figure 5B) and 888 DEGs in CMG tillers (406 upregulated and 482 downregulated; Figure 5C). Among them, 96 genes were significantly upregulated in both 9311 and CMG tillers, and 47 genes were significantly downregulated in both the 9311 and CMG tillers. Venn diagram analysis indicated that 51 genes were upregulated in the 9311 tiller segment and significantly downregulated in the CMG tiller segment. There were 34 genes that were upregulated in the CMG tiller segment and significantly downregulated in the 9311 tiller segment (Figure 5A).
Figure 5.
Distribution of sequencing data and differentially expressed genes (DEGs). (A) Venn diagrams of DEGS in tiller nodes of 9311 and CMG. (B) Volcano map of differentially expressed genes at 9311 tiller joint. (C) Volcano map of differentially expressed genes in CMG tillers.
2.5.2. GO and KEGG Analyses of Differentially Expressed Genes (DEGs) of 9311 and CMG Tillers
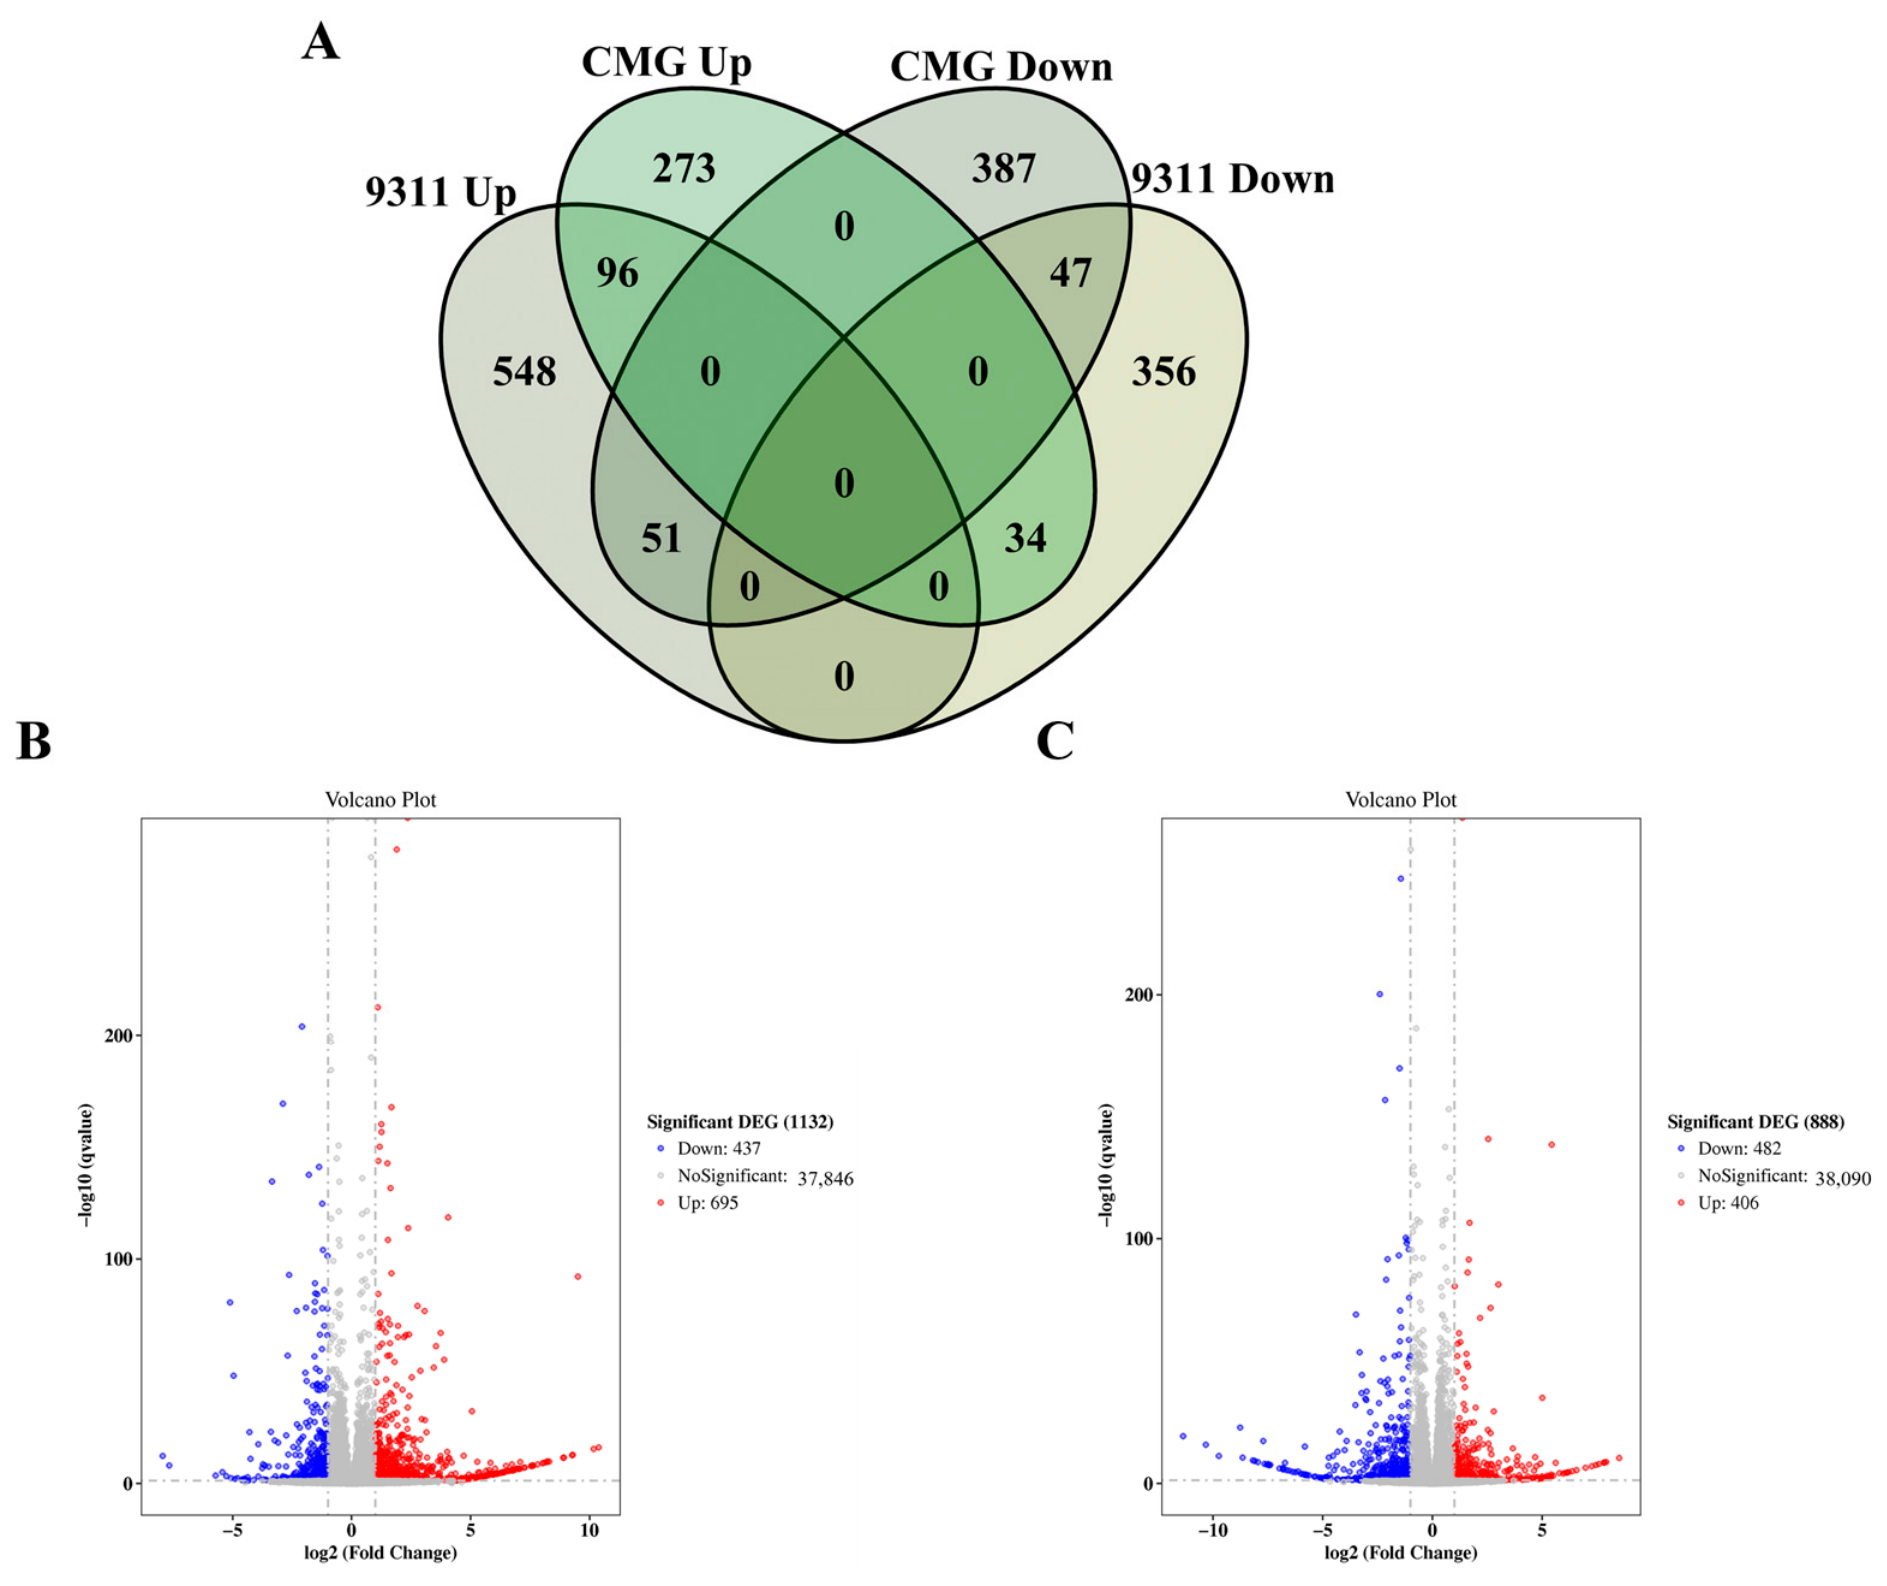
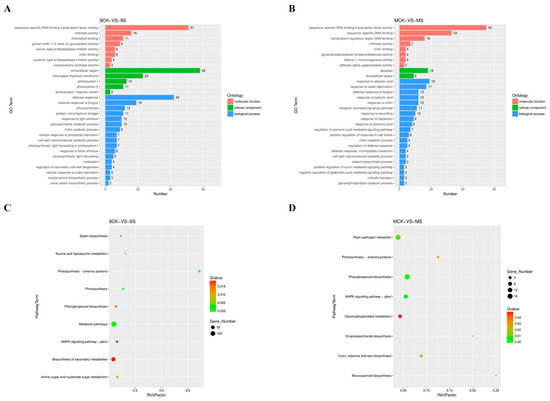
The biological functions of differentially expressed genes under salt stress conditions were evaluated via GO enrichment analysis. The top 30 GO terms with the lowest false discovery rate (FDR) were selected for display (Figure 6A,B), visually reflecting the biological processes, cellular components, and molecular functions observed. In the 9311 tillers, DEGs were significantly enriched in categories such as sequence-specific DNA-binding transcription factor activity, chitinase activity, chlorophyll binding, glucan endo-1,3-β-D-glucosidase activity, extracellular region, chloroplast thylakoid membrane, defense response, defense response against fungi, and photosynthesis (Figure 6A; Supplementary File S2, Table S2). The differentially expressed genes (DEGs) in the CMG tillers were primarily concentrated in functional categories such as sequence-specific DNA-binding transcription factor activity, sequence-specific DNA binding, DNA binding within transcriptional regulatory regions, extracellular region, extracellular space, responses to abscisic acid, drought stress, fungal defense, and salicylic acid (Figure 6B; Supplementary File S2, Table S3). Further KEGG enrichment analysis was conducted to explore the effects of salt stress on the DEGs of tiller nodes in 9311 and CMG rice (Figure 6C,D). The results show that the DEGs of 9311 tillers were co-enriched in multiple pathways, including “amino sugar and nucleotide sugar metabolism”, “phenylpropanoid biosynthesis”, “zeatin biosynthesis”, “MAPK signaling pathway-plant”, “photosynthesis-antenna proteins”, “photosynthesis”, etc. (Figure 6C; Supplementary File S2, Table S4). The co-enriched DEGs of the CMG tiller segments included “lipopolysaccharide biosynthesis”, “MAPK signaling pathway–plant”, “benzoxazine biosynthesis”, “cutin, suberin and wax biosynthesis”, “glycerophospholipid metabolism”, “phenylpropanoid biosynthesis”, “plant-pathogen interaction”, etc. (Figure 6D; Supplementary File S2, Table S5).
Figure 6.
GO enrichment analysis and KEGG enrichment analysis of differentially expressed genes (DEGs) in 9311 and CMG tillers. (A) The GO pathway is enriched in 9311 tiller nodes. (B) The GO pathway is enriched in the tillers of CMG. The KEGG pathway is enriched in the tillers of (C) 9311. (D) The KEGG pathway is enriched in the tillers of CMG. The GO enrichment bar chart, with the vertical axis representing the enriched GO terms and the horizontal axis indicating the number of differentially expressed genes in that term. Different colors are used to distinguish biological processes, cellular components, and molecular functions. In the KEGG enrichment plot, the horizontal axis represents enrichment values, and the vertical axis represents enrichment pathways. The size of each bubble indicates the number of differentially expressed genes. The color of each bubble indicates the size of the FDR value.
2.5.3. Identification and Analysis of DEGs Related to Antioxidant Enzymes
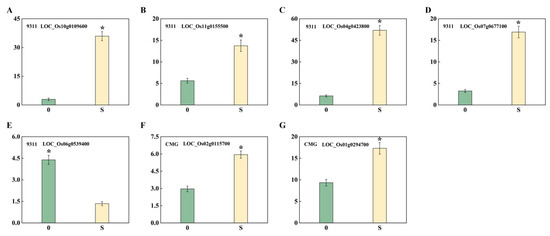
A total of 25 DEGs related to POD and CAT responded to salt stress in 9311 and CMG tillers (Supplementary File S2, Table S6). Among them, 13 were differentially expressed in 9311 tillers. The POD differentially expressed genes included Os10g0109600, Os07g0677100, and Os04g0423800, all of which were significantly upregulated. The CAT differentially expressed genes comprised Os11g0155500 and Os06g0539400; both were significantly downregulated. CMG contained 12 related differentially expressed genes, among which Os06g0539400 and Os02g0115700 were the only differentially expressed genes of POD and CAT, respectively, and both showed significant upregulation.
2.5.4. Verification of Differential Genes Through qRT-PCR Analysis
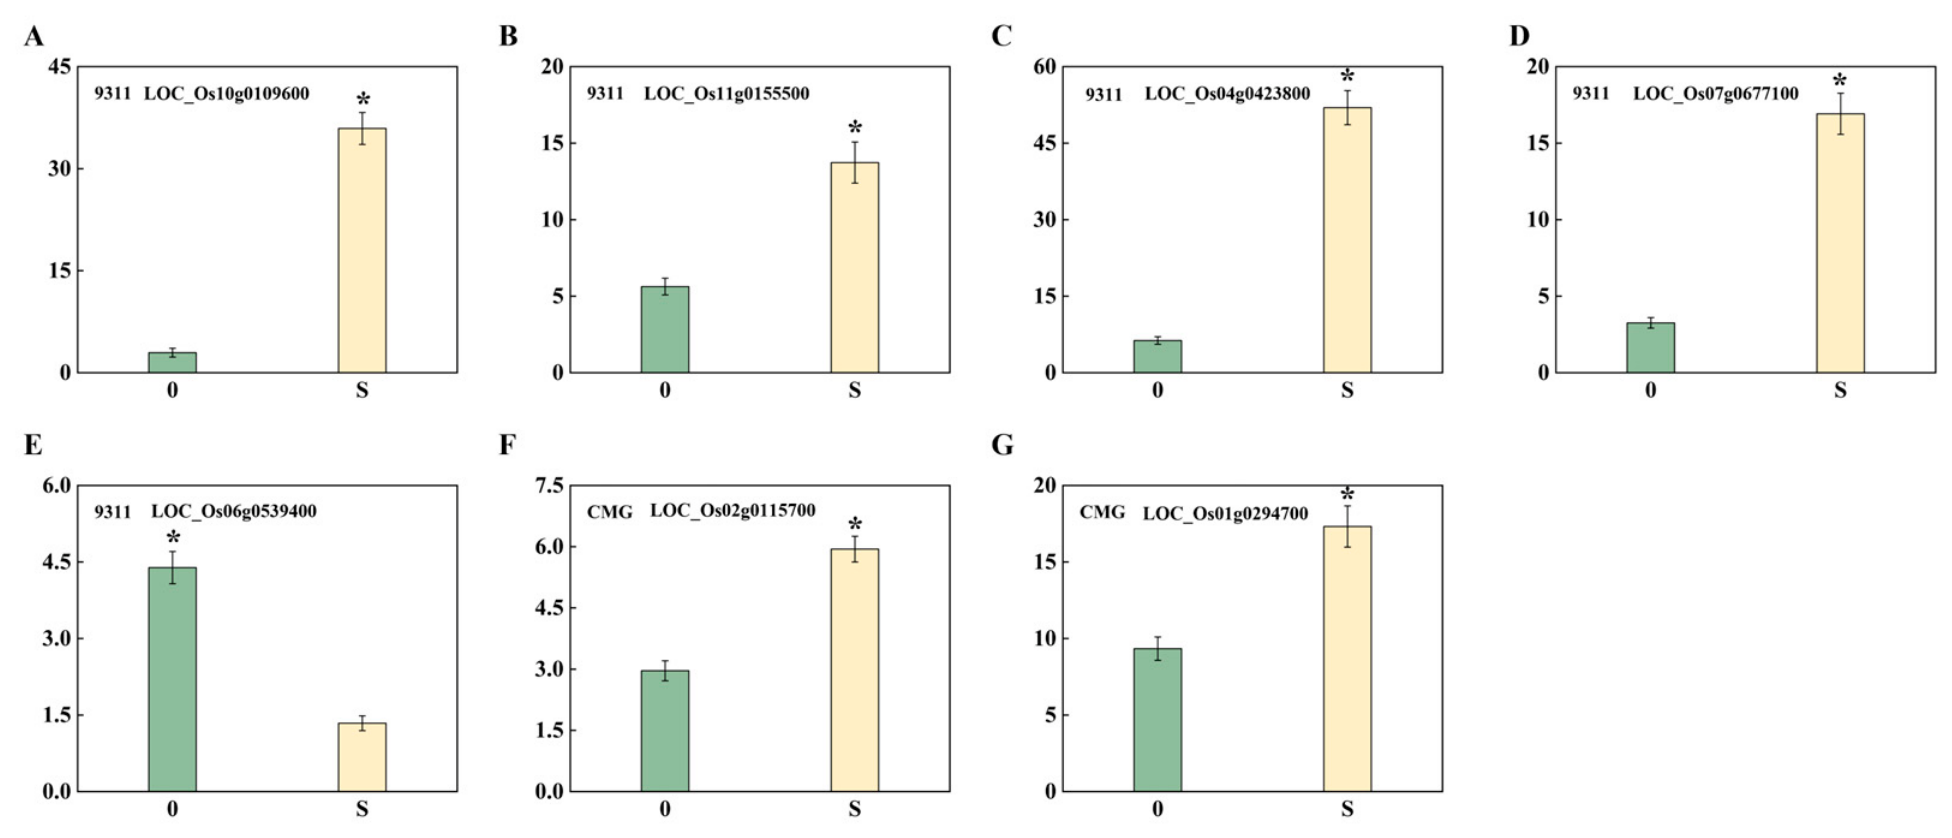
To analyze the expression levels of genes linked to two varieties under salt stress conditions, the expression pattern of DEGs was verified by qRT-PCR. It was found that the antioxidant enzymes responding to salt stress were mainly POD and CAT, among which the expression of seven enzymes was significantly different (Figure 7; Supplementary File S2, Table S1). Five DEGs were highly expressed under salt stress, namely, Os07g0677100, Os10g0109600, Os04g0423800, Os11g0155500, and Os06g0539400. Among them, only Os06g0539400 was downregulated under salt stress. Os01g0294700 and Os02g0115700 in CMG were significantly upregulated under salt stress, while Os10g0109600 was upregulated 12 times, the highest among all genes, when treated with a salt concentration of 0.3%.
Figure 7.
qRT-PCR detection results of 7 genes of CMG and 9311 tillers under normal and S treatment (0.3% NaCl). (A): 9311 gene Os11g0155500 fluorescence quantitative results. (B): 9311 gene Os10g0109600 fluorescence quantitative results. (C): 9311 gene Os04g0423800 fluorescence quantitative results. (D): 9311 gene Os07g0677100 fluorescence quantitative results. (E): 9311 gene Os06g0539400 fluorescence quantitative results. (F): 9311 gene Os02g0115700 fluorescence quantitative results. (G): 9311 gene Os01g0294700 fluorescence quantitative results. The expression patterns of the selected genes were analyzed. The data are the average values of three biological experiments ± standard error. The standard errors are displayed in the error bar above the column. * indicates significant differences among different treatments (p < 0.05).
2.6. Metabolomics Analysis
2.6.1. Analysis of Differential Metabolites
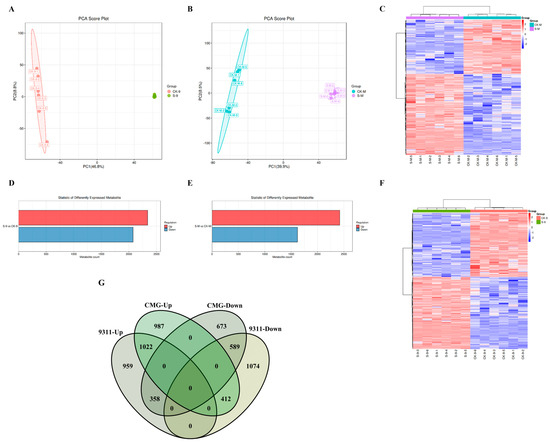
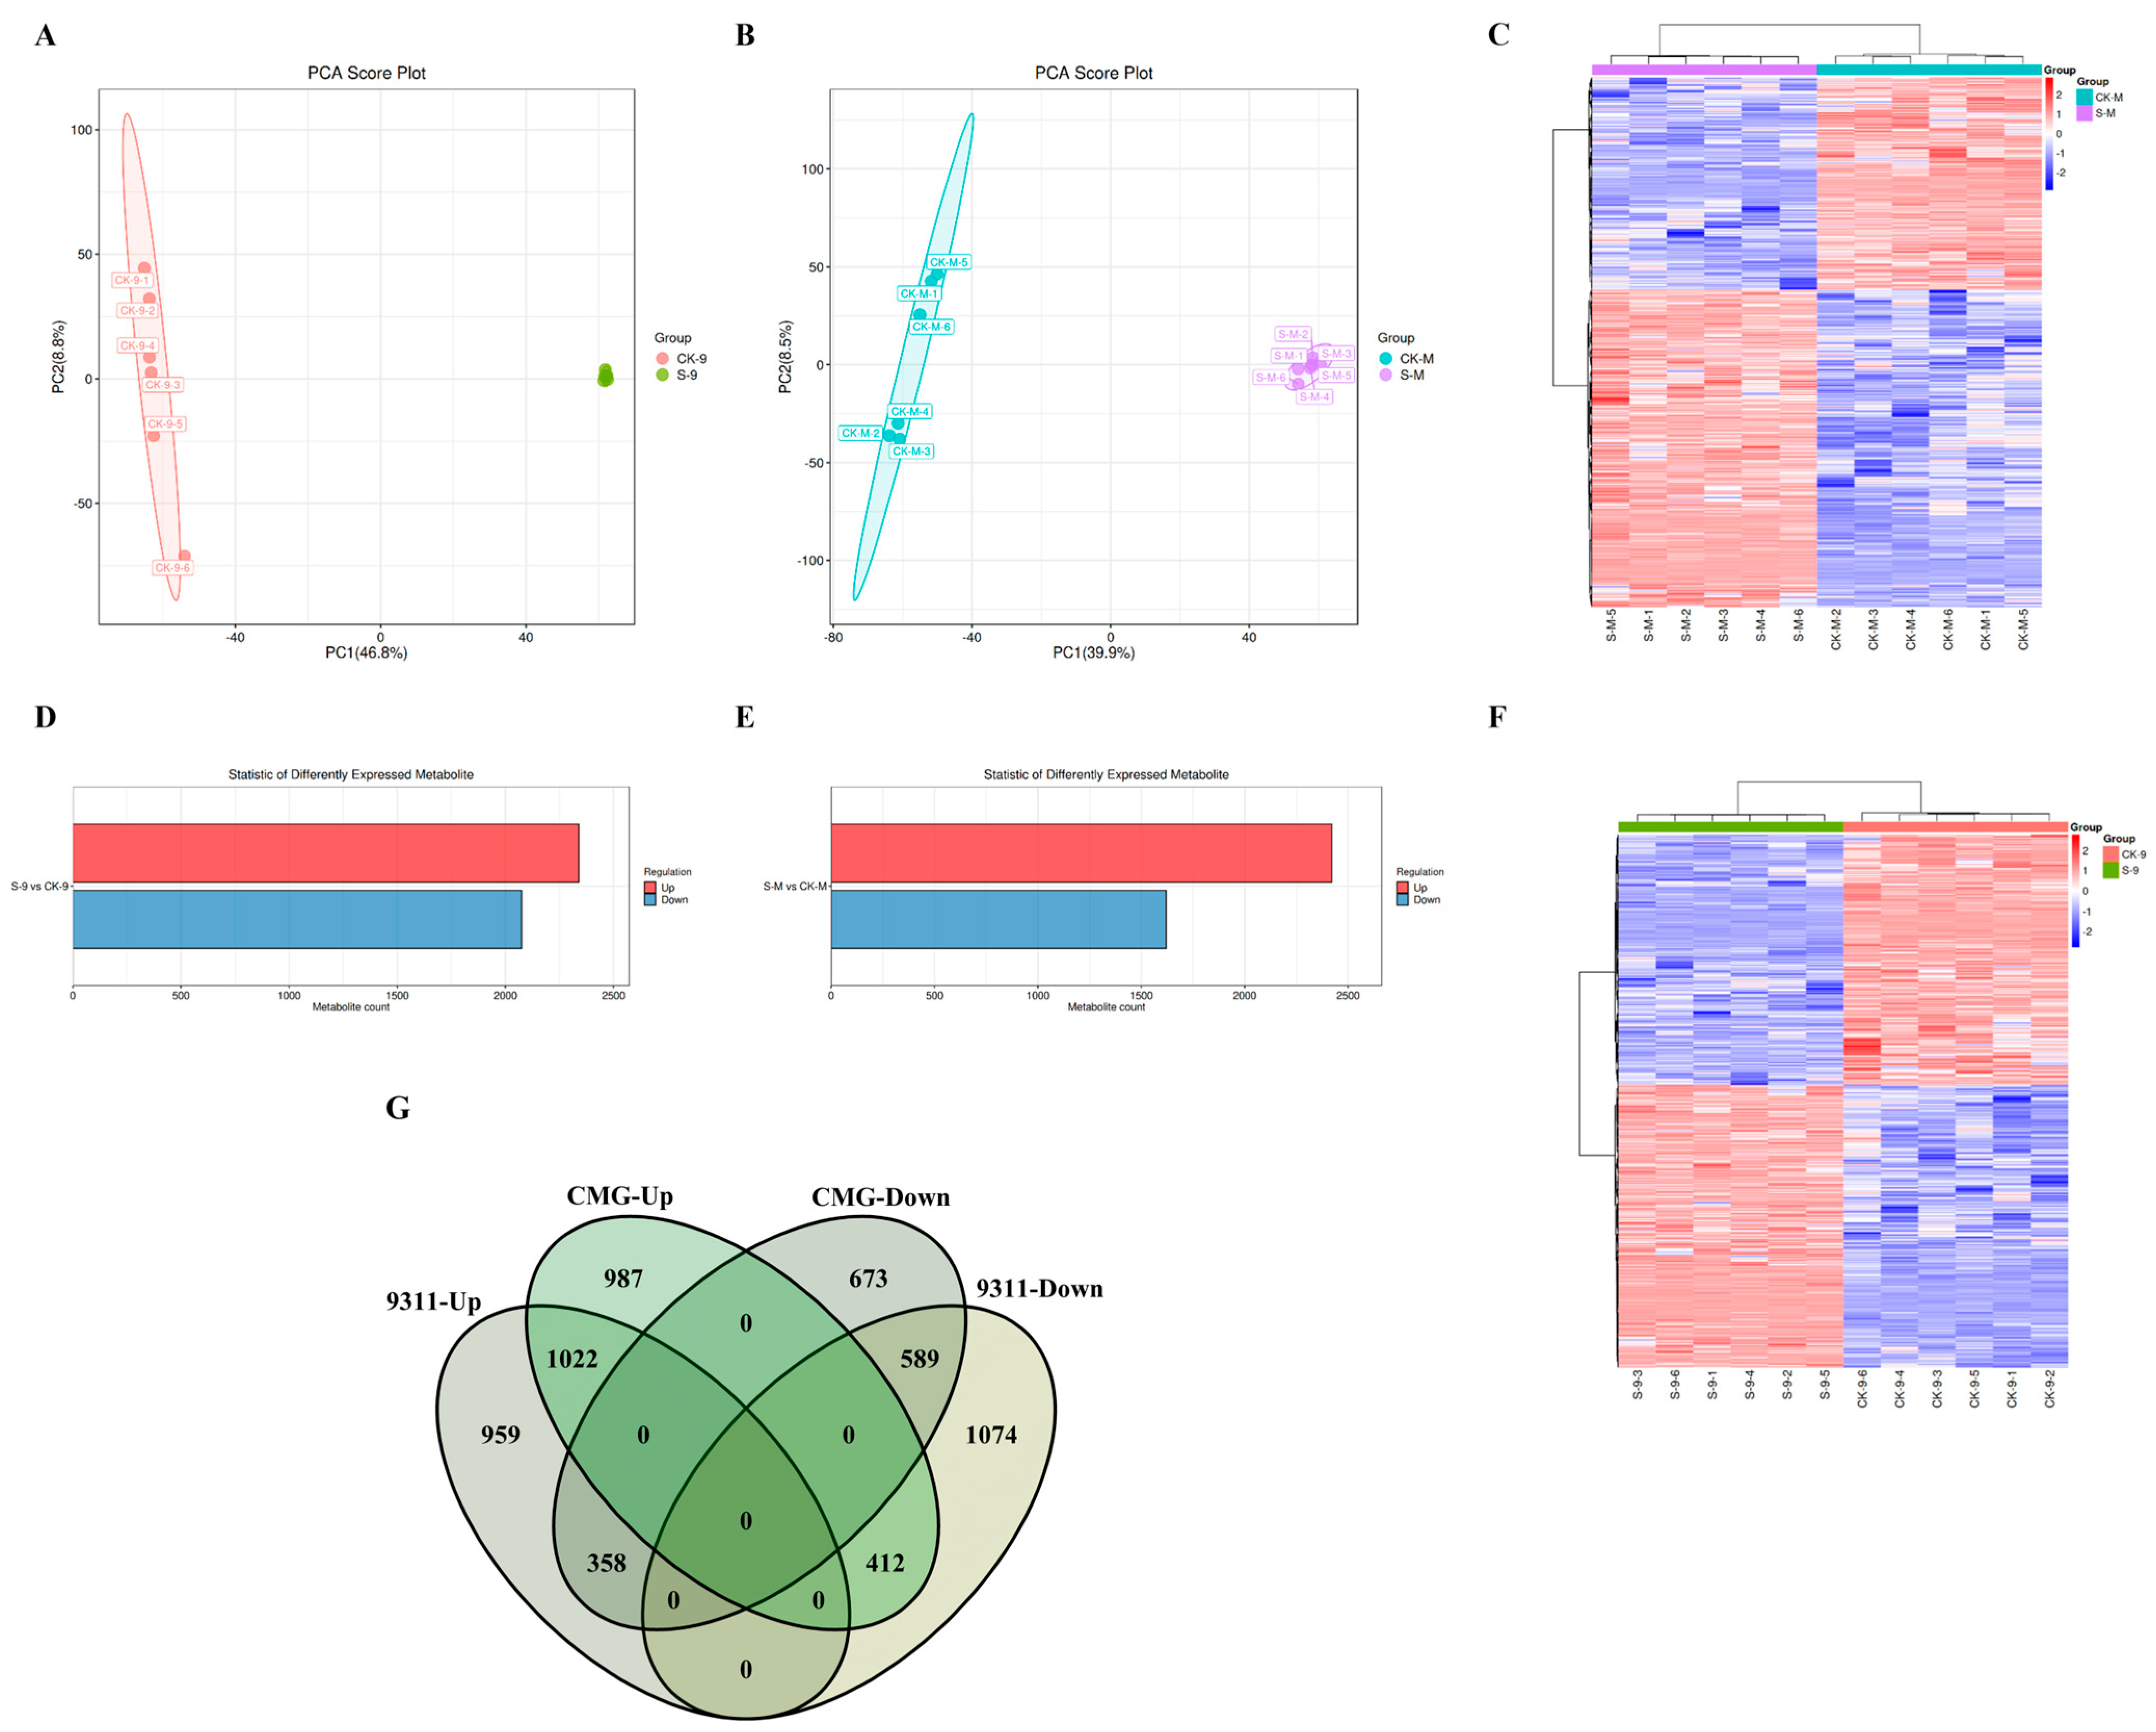
This study conducted a comparative analysis of differentially abundant metabolites in the 9CK-VS-9S and MCK-VS-MS treatment groups. The PCA and the overall heat map of metabolites show that the dispersion among samples is relatively small (Figure 8A,B), and there are significant differences among different treatments (Figure 8C,F), confirming the stability and reliability of the instrumental analysis and test results. The results indicate that 4414 and 4041 differential accumulation metabolites (DAMs) were identified, respectively, in the comparison of 9CK-VS-9S and MCK-VS-MS (Supplementary File S2, Table S7). Among all the samples, a total of 8455 DAMs were identified. For the 9CK-VS-9S comparison group, 2339 compounds were upregulated, and 2075 compounds were downregulated. For the MCK-VS-MS comparison group, 2421 compounds were upregulated, and 1620 compounds were downregulated. Among them, 1022 compounds were upregulated in 9311 and CMG, 589 compounds were downregulated in 9311 and CMG, 358 compounds were simultaneously upregulated in 9311 and downregulated in CMG, and 412 compounds were downregulated in 9311 and upregulated in CMG.
Figure 8.
Metabolome analysis of 9311 and CMG tillers. (A) PCA of the 9311 tiller joint; (B) PCA of CMG tiller nodes; (C) hierarchical clustering analysis of heat maps of CMG metabolites; (D) statistical table of differential metabolites of 9311; (E) statistical table of differential metabolites of CMG; (F) metabolite heat map of hierarchical clustering analysis for 9311; and (G) Venn diagram of differential metabolites. 9CK-VS-9S represents the water-only control group of rice variety 9311 compared with salt stress treatment, and MCK-VS-MS represents the water-only control group of rice variety CMG compared with salt stress treatment.
2.6.2. KEGG Analysis and Z-Score Analysis of Differential Metabolites
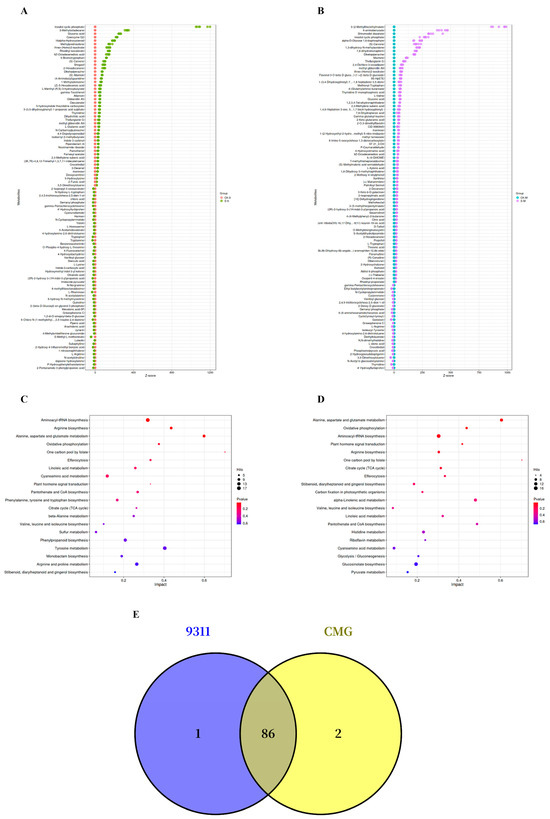
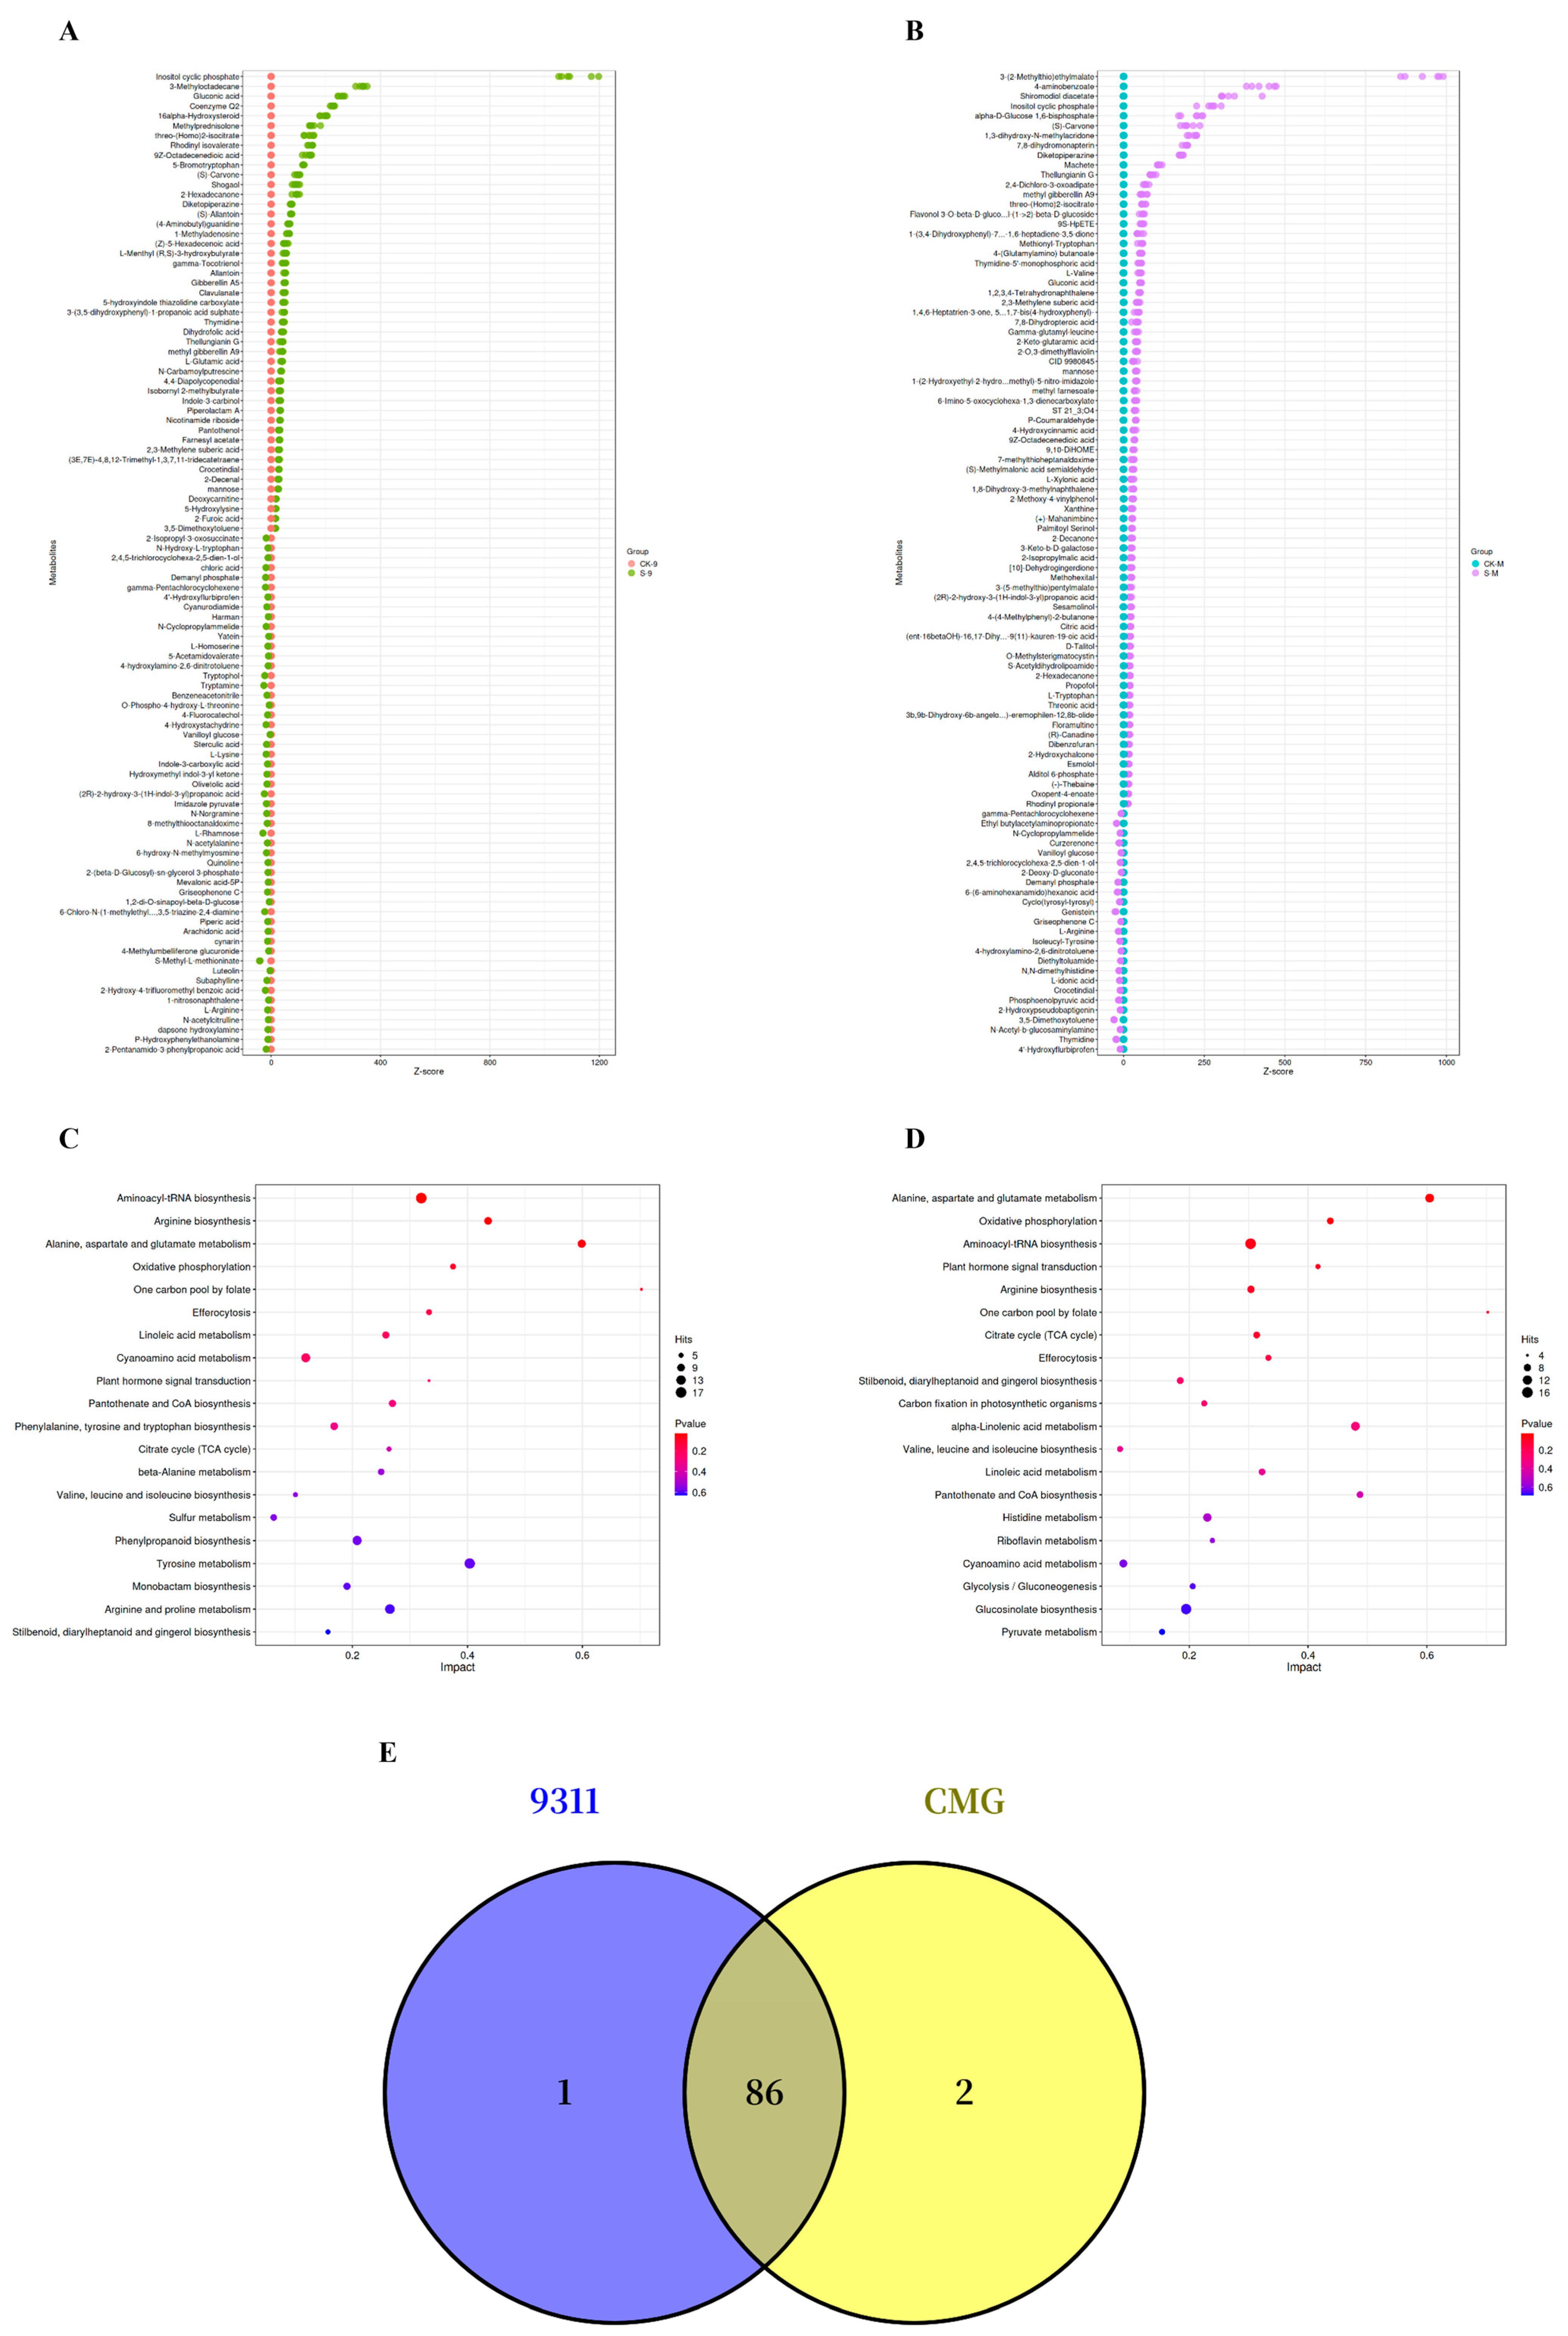
As shown in Figure 9A,B, the relative contents of inositol cyclic phosphate, 3-methyloctadecane, and gluconic acid were relatively high in the 9CK-vs-9S group. 3-(2-methylthio)ethylmalate, 4-aminobenzoate, shiromodiol diacetate, inositol cyclic phosphate, and α-D-glucose 1,6-bisphosphate were relatively high in the MCK-vs-MS group. Salt stress significantly affected the metabolic content in the tillers of 9311 and CMG. In the KEGG enrichment analysis, DAMs of CMG and 9311 tillers shared a total of 86 identical pathways (Figure 9E). The main metabolic pathways in the 9311 tillers included aminoacyl-tRNA biosynthesis; arginine biosynthesis; alanine, aspartate and glutamate metabolism; oxidative phosphorylation; phenylpropanoid biosynthesis; and linoleic acid metabolism (Figure 9C). The main metabolic pathways in CMG tillers included alanine, aspartate and glutamate metabolism; oxidative phosphorylation; aminoacyl-tRNA biosynthesis; plant hormone signal transduction; linoleic acid metabolism; and arginine biosynthesis (Figure 9D).
Figure 9.
KEGG analysis and Z-score analysis of differential metabolites in the tillers of 9311 and CMG. (A) Z-score analysis of differential metabolites in the 9311 tiller nodes; (B) Z-score analysis of differential metabolites of CMG tillers. (C) The enrichment of DAMs by 9CK-VS-9S according to KEGG analysis. (D) The enrichment of DAMs by MCK-VS-MS according to KEGG analysis. (E) Venn diagrams of the KEGG pathway for CMG and 9311 tillers.
2.7. Combined Analysis of Transcriptome and Metabolome
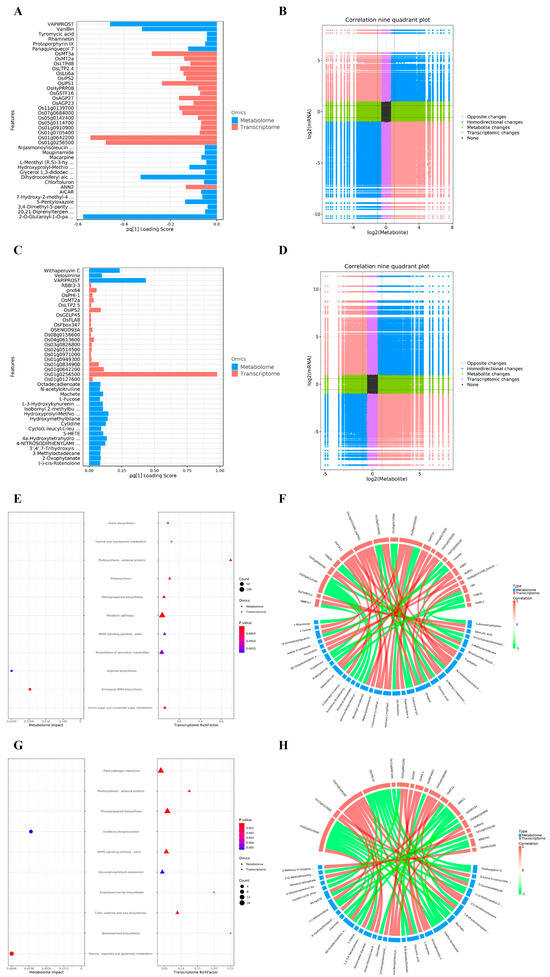
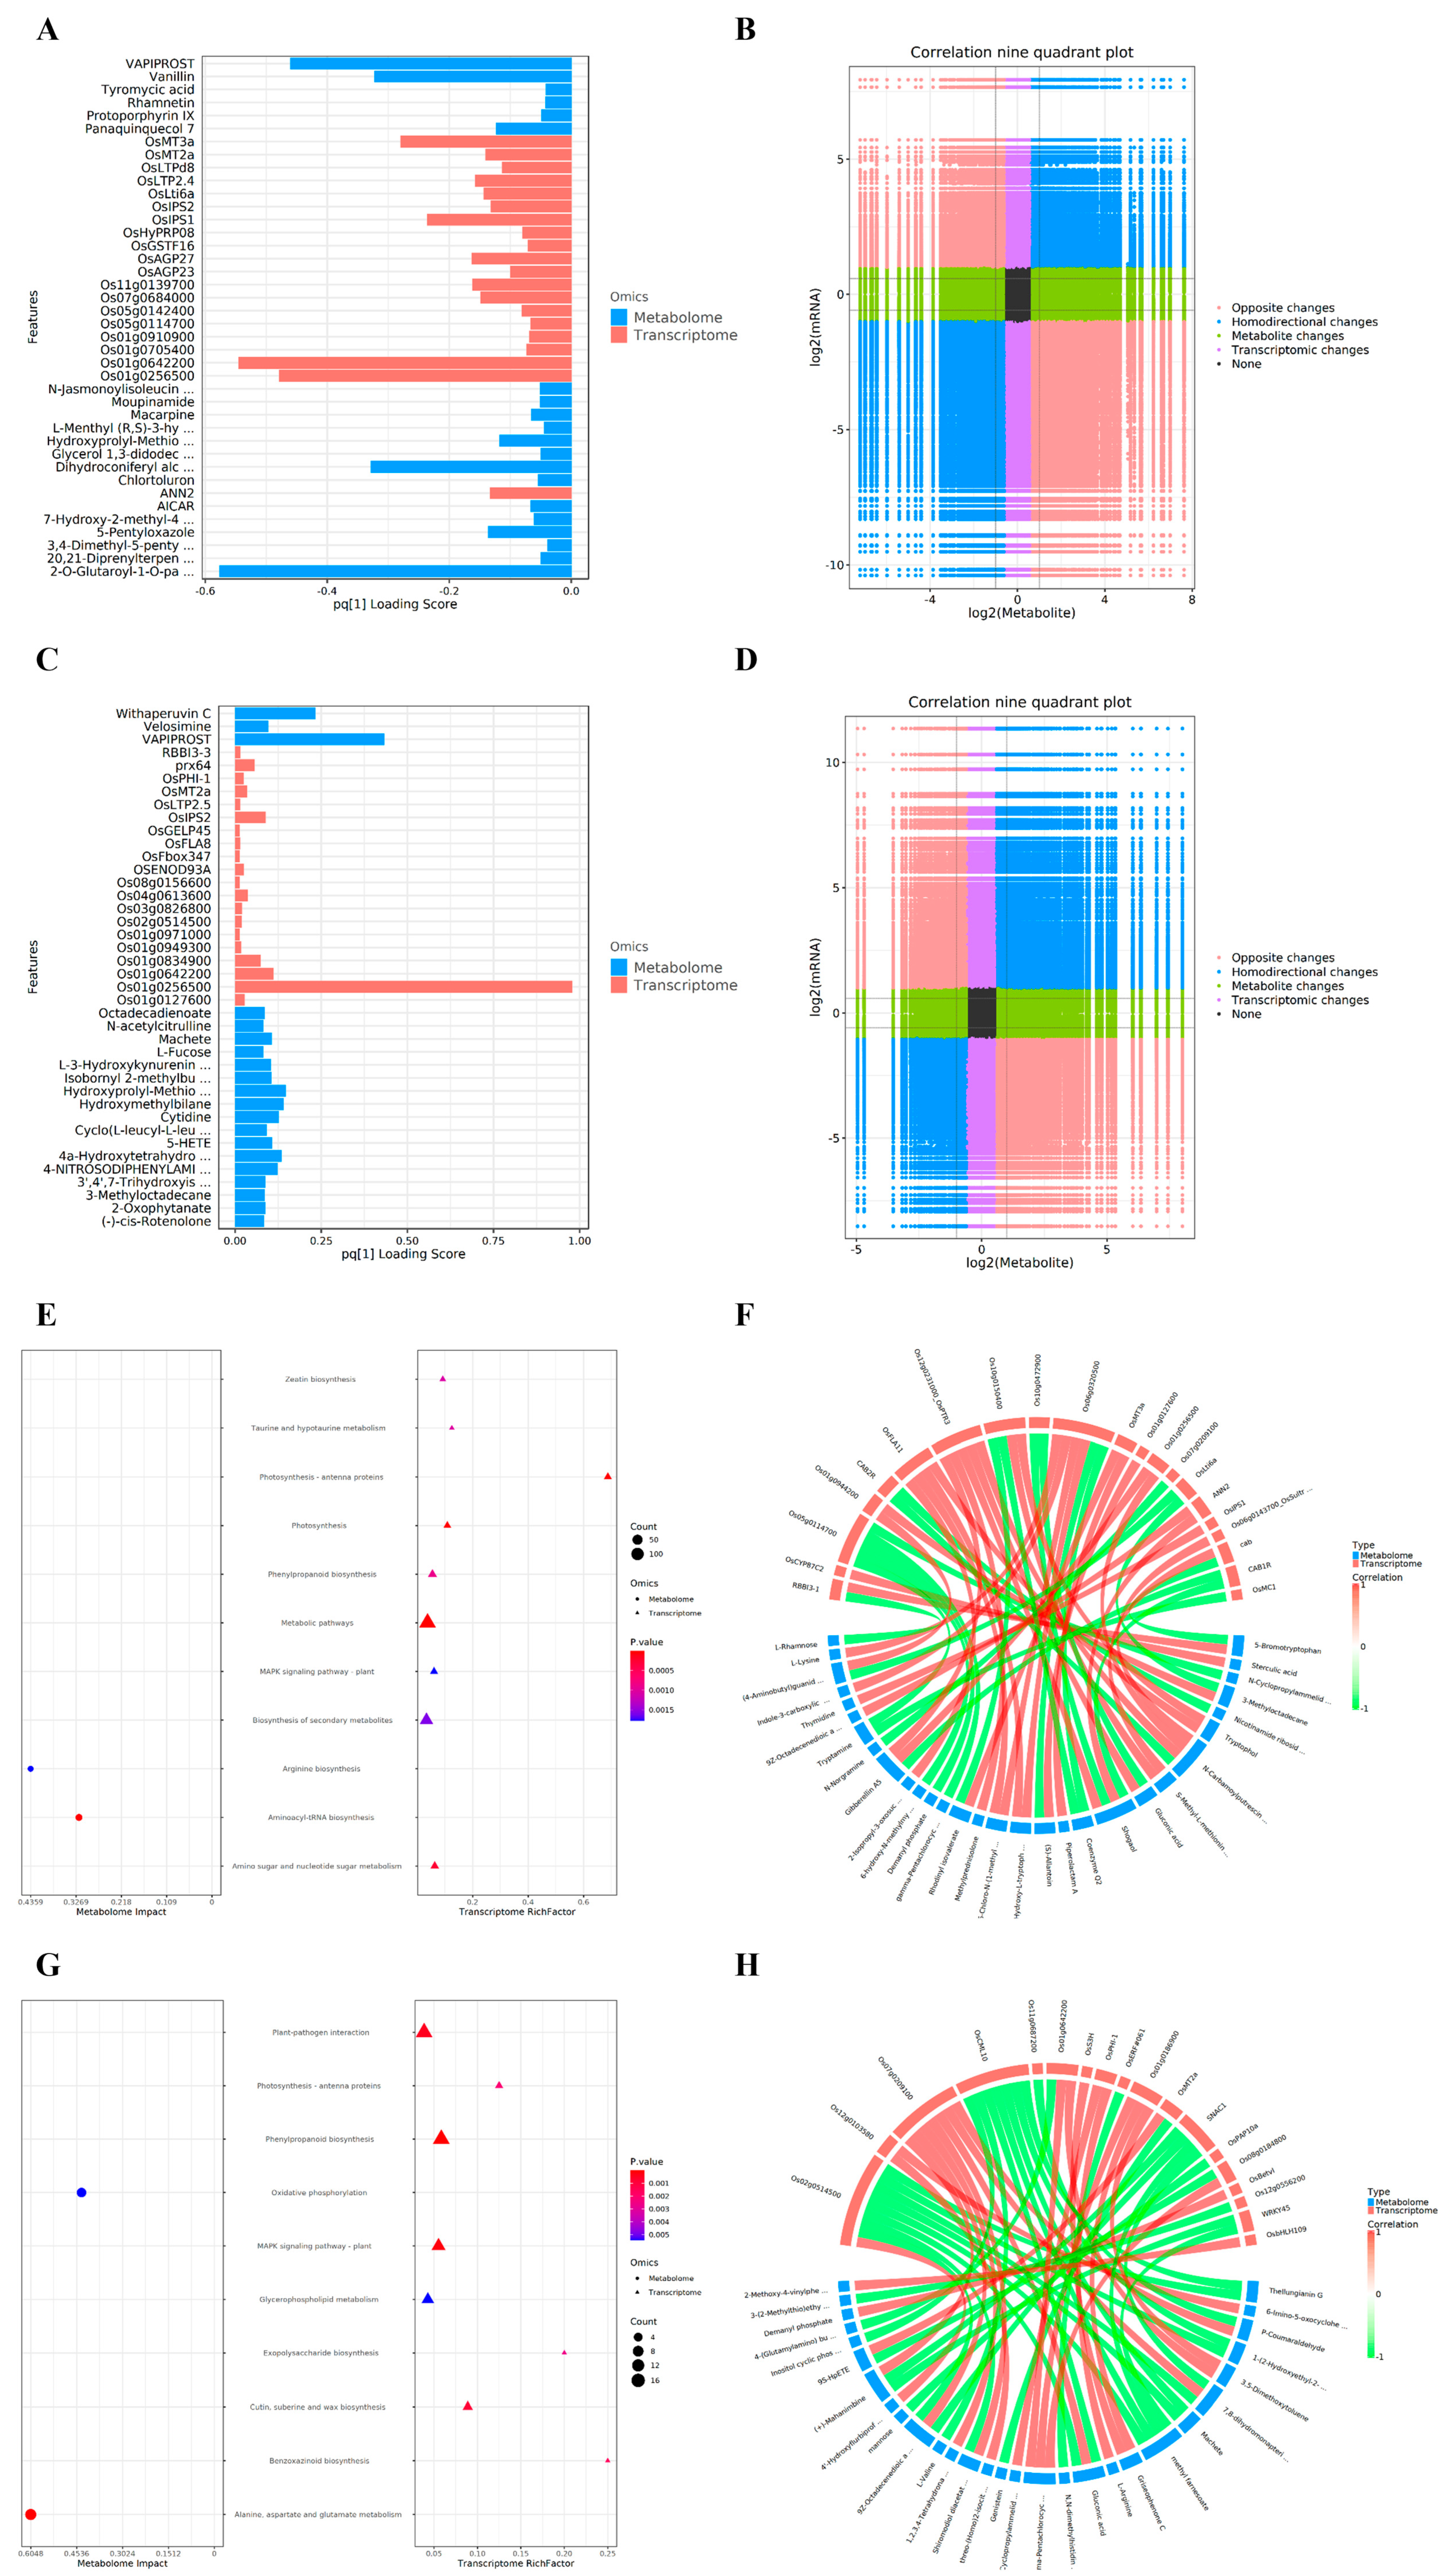
By analyzing the co-expression networks of differentially expressed genes (DEGs) and differentially accumulated metabolites (DAMs) in the 9311 and CMG tillers, the relationship between gene expression and metabolic regulation was explored. Selecting all of the differential metabolites and differential mRNAs to establish the O2PLS model enables us to more accurately identify key regulatory phenomena. As shown in Figure 10A, among the metabolites of 9CK-VS-9S, the most important ones include compounds such as 2-O-glutaroyl-1-O-pa, dihydroconiferyl alc, withaperuvin C, vanillin, and N-jasmonoylisoleucin. Genes such as Os01g0256500, Os01g0642200, OsMT3a, and OsIPS1 are of relatively high importance. Similarly, withaperuvin C and withaperuvin C are relatively important metabolites in MCK-VS-MS, and the gene Os01g0256500 is prominent in the transcriptome. This study employed a nine-quadrant graph to demonstrate the correlation between DEGs and DAMs (Figure 10B,D). The findings revealed that there was no notable discrepancy in the fifth quadrant. In the third and seventh quadrants, it was observed that the differential expression patterns of mRNA and metabolites were compatible, presenting a direct correlation between mRNA and metabolites. mRNA could positively regulate the changes in metabolites, whereas the first and ninth quadrants displayed the opposite regulatory pattern. The KEGG co-enrichment pathways of 9CK-VS-9S differentially expressed genes (DEGs) and differentially expressed metabolites (DAMs) include the biosynthesis of phenylpropanoids, arginine biosynthesis, and the metabolism of amino sugars and nucleotide sugars. The KEGG co-enrichment pathways of MCK-VS-MS include the biosynthesis of phenylalanine compounds; glycerophospholipid metabolism; the biosynthesis of the cuticle, suberin, and waxy substances; and the metabolic processes of alanine, aspartic acid, and glutamic acid (Figure 10E,G). By analyzing the correlation between differentially expressed genes (DEGs) and differentially expressed metabolites (DAMs), it was found that the differentially expressed metabolites N-carbamoylputrescine and gibberellin in the 9311 tiller were positively correlated with the differentially expressed gene Os01g0256500 (Figure 10F).
Figure 10.
Combined transcriptome and metabolome analysis of 9311 and CMG tillers. (A): O2PLS analysis of 9CK-VS-9S differentially expressed genes (DEGs) and differentially expressed metabolites (DAMs). The horizontal axis represents the size of the first principal component value, blue indicates metabolites, and orange indicates mRNA. Sorting was conducted using the first principal component, and by default, the top 20 most important features from each group were chosen for bar chart display. The longer the column, the stronger its importance. (B): Nine-quadrant graph analysis of 9CK-VS-9S differentially expressed genes (DEGs) and differentially expressed metabolites (DAMs). The X-axis represents the multiple of metabolite differences taken as log2 pairs, and the Y-axis represents the multiple of mRNA differences taken as log2 pairs. Red dots (opposite changes) indicate that the trends of metabolites and mRNA changes are opposite, blue dots (homodirectional changes) indicate that the trends of metabolites and mRNA changes are consistent, and green dots (metabolic changes) indicate only metabolic differences. Purple dots (transcriptomic changes) indicate only mRNA differences, while black dots (none) indicate non-differences in both metabolism and mRNA. (C): O2PLS analysis of differentially expressed genes (DEGs) and differentially expressed metabolites (DAMs) of MCK-VS-MS. (D): Nine-quadrant graph analysis of differentially expressed genes (DEGs) and differentially expressed metabolites (DAMs) of MCK-VS-MS. (E): KEGG co-enrichment analysis of 9CK-VS-9S differentially expressed genes (DEGs) and differentially expressed metabolites (DAMs). The X-axis represents the enrichment factor value, and the Y-axis represents the enrichment pathway. The color indicates the magnitude of the p. color value. The redder the color, the stronger the enrichment degree. The size of the dots represents the number of differentially expressed mRNAs or differentially expressed metabolites, with the left circle representing the metabolome and the right triangle representing the transcriptome. If a pathway corresponds to both triangles and circles, this indicates that the pathway is enriched in both omics. (F): Correlation chord chart of 9CK-VS-9S differentially expressed genes (DEGs) and differentially expressed metabolites (DAMs). The red nodes in the upper half represent differentially expressed mRNAs, while the blue nodes in the lower half represent differentially expressed metabolites. The lines connecting the nodes indicate the correlation between the two, with the red lines representing positive correlations and the green lines representing negative correlations. (G): KEGG co-enrichment analysis of 9CK-VS-9S differentially expressed genes (DEGs) and differentially expressed metabolites (DAMs). (H): Correlation chord chart of differentially expressed genes (DEGs) and differentially expressed metabolites (DAMs) of MCK-VS-MS.
3. Discussion
Salt stress causes substantial land degradation and economic losses worldwide, threatening global food security [32]. Enhancing salt tolerance in rice is, therefore, critical for sustainable agriculture. Here, we investigated the salt tolerance mechanisms of CMG and 9311 by integrating transcriptomic, metabolomic, and morphophysiological analyses to identify key genes and metabolites associated with salinity response.
3.1. Effects of Salt Stress on Photosynthetic Metabolism in Rice
Salt stress significantly reduced tillering number and stem base width in both varieties, though temporal dynamics differed. The stem base width in 9311 peaked at week 2, whereas CMG reached its maximum at week 4 under salt stress. CMG maintained a relatively stable stem base width over time, while 9311 showed a gradual decline after week 2. From 7 to 21 days, CMG exhibited significantly higher tiller numbers than 9311 under salt stress, with the tillering inhibition effect being more pronounced in CMG. These contrasting responses suggest distinct adaptive strategies: CMG prioritizes tiller viability maintenance, whereas 9311 shows stronger growth inhibition at the tillering stage. Previous studies have demonstrated that salt stress reduces tiller number, stem diameter, and biomass while elevating MDA and H2O2 levels [33,34]; our observed differences between varieties may, thus, reflect underlying disparities in photosynthetic carbon assimilation and resource allocation under salinity.
3.2. Effects of Salt Stress on MDA Content in Rice
Salt stress initially induces ionic and osmotic stress in plants, which subsequently leads to metabolic imbalance and the toxic accumulation of reactive oxygen species (ROS), resulting in oxidative damage [35]. Elevated levels of ROS can cause membrane lipid peroxidation, with malondialdehyde (MDA) serving as a critical marker of oxidative lipid damage [36]. In this study, MDA levels in the tiller nodes of both 9311 and CMG increased under salt stress conditions, signifying significant oxidative damage in rice plants and further corroborating the excessive accumulation of ROS in these environments. The rise in MDA content illustrates that salt stress triggers oxidative stress in rice cells, leading to considerable damage to the cell membrane system. Notably, the MDA content in CMG is lower than that in 9311, suggesting a reduced degree of oxidative damage in CMG.
3.3. Effects of Salt Stress on Activity of Antioxidant Enzymes and Hydrogen Peroxide Content in Rice
Various biotic and abiotic stresses, including salinity, induce ROS accumulation and oxidative stress. The primary ROS in plants—hydroxyl radicals, H2O2, superoxide anions, and singlet oxygen—are mainly generated in chloroplasts, mitochondria, and peroxisomes [37,38]. At low concentrations, ROS function as signaling molecules regulating growth and stress responses [38,39]. Salt stress upregulates RBOHD and RBOHF transcription, promoting H2O2 production [38]. In our study, H2O2 content significantly increased in both varieties under salt stress, peaking on day 14, with CMG showing slightly lower levels than 9311. To maintain ROS homeostasis, plants activate enzymatic and non-enzymatic antioxidant systems [38,40]. In S-type cytoplasmic male sterile maize lines, the mitochondrial gene ZmORF355 enhances salt tolerance by inducing ROS accumulation and activating antioxidant enzymes [41]. Plants have evolved sophisticated oxidative stress defense mechanisms involving SOD, CAT, POD, and APX [42]. Our physiological data show that SOD, APX, and POD activities increased significantly under salt stress in both varieties, with distinct temporal patterns: SOD activity peaked on day 28 in 9311 and on day 21 in CMG; APX peaked on day 21 in 9311 and day 14 in CMG; and POD peaked on day 28 in both. CMG, thus, exhibits a more rapid antioxidant enzyme response, contributing to its superior salt tolerance. The salt-tolerant receptor-like cytoplasmic kinase 1 (STRK1) phosphorylates and activates CATALASE C (Cat C), maintaining H2O2 homeostasis in rice; OsSTRK1-overexpressing plants show higher catalase activity, lower H2O2, and enhanced salt tolerance [43]. Our transcriptomic data revealed more differentially expressed antioxidant enzyme genes in CMG tillers, including upregulation of the POD regulatory gene Os01g0294700 and the CAT regulatory gene Os02g0115700, consistent with the lower H2O2 content and faster antioxidant response observed in CMG.
The selection of 0.3% NaCl (approximately 51 mM) was based on multiple considerations. This concentration is slightly above the general salinity threshold (EC 4 dS/m ≈ 40 mM NaCl) and is ecologically relevant to salinization levels commonly found in coastal agricultural fields in southern China, ensuring that our findings have practical implications [44]. Furthermore, this moderate stress level was critical for maintaining tiller node viability for transcriptomic and metabolomic profiling, ensuring that the observed molecular changes reflect active regulatory responses rather than passive cellular degradation.
3.4. Genes and Metabolites Related to Salt Tolerance in Rice Under Salt Stress
Transcriptomic analysis was employed to elucidate the molecular mechanisms underlying differential salt stress responses in tiller nodes of CMG and 9311. Both varieties showed significant enrichment of differentially expressed genes (DEGs) associated with transcription factor activity, particularly sequence-specific DNA binding, reflecting a universal and direct genomic response to salinity. Enrichment of defense response genes against fungi in both varieties suggests crosstalk between abiotic and biotic stress signaling pathways.
In 9311, significant GO enrichment was observed for terms including “chlorophyll binding,” “photosynthesis,” “photosynthetic antenna protein,” and “chloroplast thylakoid membrane,” indicating a specialized mechanism to protect and fine-tune the photosynthetic system, a primary target of salt-induced ROS damage. By modulating light-harvesting complexes and photosynthetic machinery, 9311 appears to alleviate photoinhibition and sustain energy production under stress. Additionally, strong enrichment of “chitinase activity” suggests that cell wall reinforcement may contribute to salt tolerance in this variety. CMG also exhibited transcription factor enrichment, with GO terms including “sequence-specific DNA binding,” “DNA binding in transcriptional regulatory regions,” and “response to abscisic acid and drought stress.” This pattern suggests that CMG possesses a superior capacity for initiating and precisely coordinating stress regulation compared with 9311.
In the KEGG pathway analysis of CMG, the enrichment of “cutin, suberin and wax biosynthesis” was identified. This pathway mediates the deposition of hydrophobic polymers in the cell wall and epidermis, forming a physical barrier that reduces water loss and restricts Na+ entry into tiller nodes. This is in sharp contrast with the response of 9311 to salt stress. In addition, the enrichment of the “benzoxazine biosynthesis” and “plant–pathogen interaction” pathways enhances the ability of CMG to synthesize specific antibacterial and antifeedant metabolites and improves its tolerance to multiple adverse conditions. The “phenylpropanoid biosynthesis” pathway was significantly enriched in both varieties, indicating its undeniable role in salt stress tolerance. This pathway generates a large number of compounds, including lignin (used for cell wall strengthening) and flavonoids (powerful antioxidants). In CMG, with the addition of the “lignin biosynthesis” pathway and apoplastic deposition, the phenylpropanoid pathway may help establish a complex and concealed barrier, which may be a hallmark of its salt tolerance strategy.
The identification of thousands of DAMs in the two comparison groups indicates that salt stress profoundly disturbs the metabolic homeostasis of rice tillers. Although both CMG and 9311 exhibited large-scale metabolic responses to stress, significant differences were observed in the specific patterns of metabolite accumulation between the two varieties. For instance, 358 compounds were upregulated in 9311 but downregulated in CMG, and 412 compounds were downregulated in 9311 but upregulated in CMG, strongly suggesting that the two varieties adopt different metabolic adaptation strategies. More metabolites were upregulated in CMG than in 9311, indicating stronger metabolic activity or synthetic capacity to cope with stress. Analysis of specific accumulated metabolites revealed variety-specific patterns. The high content of substances such as cyclic phosphate and gluconic acid in 9311 may be related to its attempt to maintain osmotic balance and eliminate reactive oxygen species. The relatively high content of 4-aminobenzoate, shiromodiol diacetate, and the key intermediate of energy metabolism α-D-glucose 1,6-bisphosphate in CMG implies that it may have advantages in energy supply, redox balance, and secondary metabolite synthesis, providing a metabolic basis for superior salt tolerance.
KEGG pathway enrichment analysis revealed the similarities and differences in response strategies between the two varieties. Both were enriched in amino acid metabolism (alanine, aspartate and glutamate metabolism; arginine biosynthesis), aminoacyl-tRNA biosynthesis, oxidative phosphorylation, and phenylpropanoid biosynthesis. This demonstrates that core processes—energy production, amino acid homeostasis, and defensive secondary metabolite synthesis—are conserved mechanisms in the rice salt stress response. However, variety-specific pathways characterize their uniqueness: the specific enrichment pathways of 9311 were relatively few, and its response was more concentrated on basic amino acid and energy metabolism. In contrast, CMG was uniquely enriched in “plant hormone signal transduction”. Notably, CMG can more effectively utilize hormone signals such as abscisic acid (ABA) and jasmonic acid (JA) to coordinate the expression and metabolic activities of downstream defense genes, enabling more precise and efficient adaptive adjustments. This may be a key regulatory factor underlying its superior salt tolerance compared with 9311. To further analyze the regulatory basis of metabolic changes, we constructed an association network between DEGs and DAMs. The O2PLS model successfully identified genes and metabolites that play important roles in the interaction network. In 9311, phenylpropanoid and hormone-related metabolites such as vanillin, N-jasmonoylisoleucine (JA-Ile), and stress response genes (e.g., the metallothionein gene OsMT3a) were identified as key nodes. The gene Os01g025650 was identified as an important regulator in both varieties, suggesting that it may be a core salt stress regulator worthy of further investigation. In CMG, metabolites such as withaperuvin C were prominent.
Notably, several recent studies have investigated the salt tolerance mechanisms of the CMG (HD961) variety. Yang et al. (2022) performed combined transcriptome and metabolome analysis on HD961 and 9311 under salt stress, identifying alpha-linolenic acid metabolism, plant hormone signal transduction, and glutathione metabolism as key pathways in HD961’s salinity resistance [29]. Fang et al. (2023) conducted comparative transcriptome analysis, revealing key DEGs distinguishing salt-tolerant and salt-sensitive rice genotypes [11]. Most recently, Chen et al. (2025) generated a chromosome-level genome assembly of HD961 and integrated Ribo-seq with RNA-seq, revealing that salt stress enhances translational efficiency in genes critical for ion homeostasis and antioxidant defense, with eIF2B as a key regulator of salt tolerance [45].
KEGG co-enrichment analysis identified core biological pathways co-regulated at both transcriptional and metabolic levels. The “phenylpropanoid biosynthesis” pathway was co-enriched in both varieties, underscoring its central role in salt stress responses. Lignin derived from this pathway can directly reinforce cell walls in tiller nodes and branches, enhancing mechanical strength through increased lignification and reducing salt ion penetration. Concurrently, the antioxidant activity of flavonoids alleviates ionic toxicity and supports adventitious root development at tiller nodes, providing physiological support for normal branch growth. Varietal differences emerged in other co-enrichment pathways. 9311 was uniquely enriched in “amino sugar and nucleotide sugar metabolism”, associated with cell wall remodeling to maintain structural stability in the main stem and early tillers. In contrast, CMG was specifically co-enriched in “glycerophospholipid metabolism” (membrane lipid remodeling) and “cutin, suberin and wax biosynthesis”. The latter pathway is particularly significant, as the deposition of cutin, suberin, and epicuticular wax in the epidermis reduces water loss and restricts Na+ entry into tiller nodes. These findings confirm that CMG constructs a stronger physical barrier through coordinated gene expression and metabolite synthesis, representing a key mechanism underlying its superior salt tolerance.
The moderate salt stress (0.3% NaCl) effectively induced salt tolerance responses in both varieties while avoiding rapid plant death, facilitating the observation of genotype-specific differences. Collectively, these results provide valuable insights for improving rice productivity in salt-affected lands [44]. We acknowledge that some of the functional inferences drawn from KEGG enrichment and co-expression networks require further experimental validation (e.g., gene knockout/overexpression, pharmacological inhibition, or targeted metabolite quantification). Our transcriptomic and metabolomic data provide a hypothesis-generating framework rather than definitive proof of all proposed mechanisms. Future studies are needed to functionally characterize the key candidate genes and pathways identified in this work.
4. Materials and Methods
4.1. Test Materials
Rice varieties (Oryza sativa L.) CMG (HD-961, salt-tolerant, local variety) and 9311 (conventional indica rice) were used as experimental materials. They were provided by the Germplasm Resource Bank of the College of Coastal Agriculture, Guangdong Ocean University.
4.2. Test Method
The experiment was conducted at the College of Coastal Agriculture, Guangdong Ocean University (21.2° N, 110.32° E), from May to September. Two rice varieties, 9311 (salt-sensitive) and CMG (HD96-1, salt-tolerant), were selected for this study. Rice seedlings were grown in a controlled growth chamber under the following conditions: a temperature of 28 °C during the light period and 22 °C during the dark period; a photoperiod of 13 h light/11 h dark; a light intensity of 370 μmol m−2 s−1 provided by fluorescent lamps; and relative humidity maintained at 70–80%. When the seedlings had grown to the three-leaf-and-one-heart stage, they were transplanted into plastic pots (19 cm top diameter × 15 cm bottom diameter × 18 cm height). Each pot contained 3 kg of laterite soil with the following physical and chemical properties: soil organic carbon at 32.4 g·kg−1; available phosphorus at 4.0 mg·kg−1; available potassium at 48.4 mg·kg−1; alkali-hydrolyzed nitrogen at 37.1 mg·kg−1; and a soil pH of 7.23. Each pot had four planting holes, with one seedling per hole at a transplanting depth of approximately 2 cm and a spacing of approximately 4 cm between plants. Rice was grown in a constant-temperature incubator. The tillering node part of the rice was determined. The fresh weight and dry weight were determined with an analytical balance. The stem base width was measured with a vernier caliper. Four replicates were taken for each treatment.
During the growth period of rice, we kept the water levels of each treatment in the growth container consistent. A total of two treatments were set up: (1) the control (distilled water + 0% NaCl) and (2) S (distilled water + 0.3% NaCl), with approximately 0.3% (about 51 mM) NaCl added in total. The salt content of the water layer was detected by using a handheld SKD1688-TR-6 EC meter (Shunkeda Technology Co., Ltd., Beijing, China) to ensure that the salt content remained relatively stable.
4.3. Determination of Physiological Indicators
The activities of superoxide dismutase (SOD), peroxidase (POD), catalase (CAT), and ascorbate peroxidase (APX) were determined spectrophotometrically. The tillering nodes of rice were selected, frozen in liquid nitrogen, and then ground. An amount of 0.50 g was accurately weighed and placed in 10 mL of 0.05 mol·L−1 pre-cooled phosphate buffer (pH 7.8), ground into a homogenate, and centrifuged at 12,000× g for 20 min at 4 °C. The supernatant obtained was used to determine the activity of antioxidant enzymes. SOD activity was assayed by monitoring the inhibition of photochemical reduction of nitroblue tetrazolium (NBT) [46,47]. The reaction mixture (3 mL) contained 50 mM phosphate buffer (pH 7.8), 13 mM methionine, 75 µM NBT, 2 µM riboflavin, 0.1 mM EDTA, and 50 µL of enzyme extract. The reaction was initiated by illuminating the mixture under fluorescent light (4000 lux) for 15 min at 25 °C, and the absorbance was read at 560 nm. One unit of SOD activity was defined as the amount of enzyme required to inhibit 50% of the NBT photoreduction. POD activity was determined using guaiacol as the substrate [31]. The reaction mixture (3 mL) consisted of 50 mM phosphate buffer (pH 7.0), 20 mM guaiacol, 40 mM H2O2, and 100 µL of enzyme extract. The increase in absorbance due to the oxidation of guaiacol was recorded at 470 nm for 3 min at 25 °C. One unit of POD activity was defined as the amount of enzyme causing a change of 0.01 in absorbance per minute. The activity of ascorbic acid peroxidase (APX) was measured by using the sulfenicylic acid method [48]. Catalase (CAT) activity was determined by spectrophotometry (Shanghai Yuanxi Instrument Co., Ltd., Shanghai, China) [49]. The soluble protein content in the extracts was determined by the Coomassie Brilliant Blue G-250 method [50] using bovine serum albumin as a standard, and all specific activities were calculated as units per milligram of protein.
Determination of hydrogen peroxide content [51]: An amount of 0.5 g of the plant samples was taken, 5 mL of 0.1% TCA was added, the mixture was ground under liquid nitrogen, and the resulting homogenate was centrifuged at 19,000× g for 20 min. An amount of 0.5 mL of the supernatant was taken, 0.5 mL of 10 mm PBS buffer was added, and then 1 mL of 1M KI solution was added and reacted at 28 °C in the dark for 1 h. After the reaction was completed, the absorbance value at 390 nm was measured with 0.1% TCA as the reference.
4.4. Total RNA Extraction and Transcriptome and Metabolome Analysis
9311 and CMG (HD96-1) were selected as the experimental rice varieties. On the 7th day of NaCl stress, RNA was extracted from the junction of rice roots and stems, and four biological replicates were set for each treatment. Transcriptome metabolic sequencing was completed by Suzhou Panomik Biomedical Technology Co., Ltd. In this experiment, RNA was extracted from rice roots via ethanol precipitation using CTAB.PBIOZOL reagent. Total RNA was qualitatively and quantitatively analyzed using the Drop and Agilent2100 Bioanalyzer (Agilent Technologies Inc., Santa Clara, CA, USA). SOAPnuke was used to obtain clean read segments [52]. Then, the clean read segments were compared with the reference gene sequence, and the comparison results were obtained using Bowtie2 [53]. Differentially expressed genes with Log2FC > 1 and p < 0.05 were screened by Phyper and analyzed by KEGG.
The same materials were used for metabolite analysis and transcriptomics. LC-MS/MS technology was employed for non-targeted metabolomics analysis. The raw mass spectrometry data (raw files) were collected using LC-MS/MS and imported into Compound Discoverer 3.1 (Thermo Fisher Scientific Inc., Waltham, MA, USA) for data processing. The metabolomics analysis process involved data preprocessing, statistical analysis, classification and annotation of metabolites, and functional annotation. Four biological replicates were analyzed for each treatment. Metabolite extraction was carried out in accordance with the scheme described by Beltran A et al. (2012), which provided detailed methods for sample preparation and metabolite extraction [54].
4.5. qRT-PCR Analysis
To verify the reliability of RNA sequencing data, real-time fluorescence quantitative polymerase chain reaction (RT-qPCR) was used to detect the expression of 10 randomly selected differentially expressed genes from the transcriptome. Two reference genes, UBO5 (ubiquitin 5) and Up18S rRNA (rice 18S ribosomal RNA), were selected as internal controls. UBO5 served as the primary reference gene for normalization of target gene expression using the 2−ΔΔCt method, while Up18S rRNA was used as a supplementary internal control to verify sample loading consistency and minimize technical variability. According to the manufacturer’s instructions, total RNA was reverse-transcribed into single-stranded cDNA using TransScript® All-in-One First-Strand cDNA Synthesis SuperMix for qPCR (one-step gDNA removal) [supplier: TransGen Biotech, China]. Quantitative real-time PCR was performed using the ABI QuantStudio 6 Flex thermal cycling apparatus (Thermo Fisher Scientific, USA) and the SYBR Green PCR kit (TransGen Biotech, China) [55]. To assess the relative expression, we used the 2-ΔΔCT method [55]. All reactions were conducted in triplicate technical replicates (Supplementary File S2 Table S8).
4.6. Statistical Analysis
The data were collated using Excel2010. One-way ANOVA, Duncan’s multiple comparisons, and Pearson’s bivariate correlation analyses were conducted using SPSS 24.0, and plots were drawn using Origin21. All physiological measurements were performed with four biological replicates per treatment and variety combination. The data are expressed as means ± standard deviation (SD). Before performing one-way analysis of variance (ANOVA), the normality of the data distribution was assessed using the Shapiro–Wilk test (α = 0.05), and the homogeneity of variances was verified using Levene’s test. Data that met both assumptions were analyzed by one-way ANOVA, followed by Duncan’s multiple-range test for post hoc comparisons. For transcriptome analysis, differentially expressed genes (DEGs) were identified with thresholds of |log2FC| > 1 and p < 0.05. For KEGG pathway and GO enrichment analyses, the false discovery rate (FDR) was controlled using the Benjamini–Hochberg (BH) procedure, with a cutoff of FDR < 0.05 for significantly enriched pathways and terms. For metabolome analysis, differential metabolites were identified using the Wilcoxon test with FDR correction. All statistical analyses were performed using R software (version 4.3.1; R Core Team, 2023).
5. Conclusions
This study systematically investigated the metabolic landscape and transcriptional regulatory networks of rice tillers under salt stress. Compared with 9311, the salt-tolerant variety CMG (HD96-1) exhibited higher antioxidant enzyme activities, lower MDA and H2O2 accumulation, and reduced oxidative damage. Mechanistically, CMG employs a multi-level collaborative response: more efficient signal perception and transduction, with enhanced phytohormone signaling (e.g., ABA) coordinating early defense responses; reinforced physical barrier construction through coordinated regulation of genes and metabolites involved in cutin, suberin and wax biosynthesis, effectively restricting Na+ influx and water loss; and a robust metabolic foundation sustaining energy metabolism and redox balance. In contrast, 9311 adopts a relatively passive strategy, relying more on osmotic adjustment and photosynthetic mobilization to cope with stress. Our integrated multi-omics analysis revealed the intrinsic molecular mechanisms by which CMG (HD96-1) achieves superior salt tolerance at the tillering stage. These findings provide valuable candidate genes and metabolite markers for genetic improvement of salt tolerance in rice, offering empirical guidance for breeding programs aimed at enhancing productivity in salt-stressed soils.
Supplementary Materials
The following supporting information can be downloaded at https://www.mdpi.com/article/10.3390/stresses6030057/s1, Supplementary File S1: Table S1. Comparison of tiller numbers between the two varieties; Table S2. Comparison of stem base width between the two varieties; Table S3. Comparison of fresh weight between the two varieties; Table S4. Comparison of cry weight between the two varieties; Table S5. Comparison of MDA between the two varieties. Supplementary File S2: Table S1: Primers used for qPCR in study; Table S2: Statistics of sequencing data for evaluating rice tillering node samples; Table S3: GO enrichment analysis of rice tillering node; Table S4: GO enrichment analysis of rice tillering node; Table S5: Significant KEGG analysis of DEGs in rice tillering node; Table S6: Significant KEGG analysis of DEGs in rice tillering node; Table S7: Identification of differentially expressed genes related to antioxidant enzymes in rice tillering under salt stress; Table S8: Statistics of number of differential metabolites. The transcriptome data (BioProject accession: PRJNA1300947) and the metabolomics data (BioProject accession: PRJNA1370692; provisional submission ID: SUB15812931) have been deposited in the NCBI Sequence Read Archive (SRA). Both datasets are under embargo and will be publicly released on November 10, 2029. After that date, they can be accessed via the respective links: https://www.ncbi.nlm.nih.gov/sra/PRJNA1300947 and https://www.ncbi.nlm.nih.gov/sra/PRJNA1370692. Prior to the release date, the data are restricted to the submitters and are not accessible to the public.
Author Contributions
J.T.: manuscript writing, investigation, data collation, and formal analysis. Y.X.: methodology and conceptualization. D.Z.: conceptualization, funding, and project supervision. Y.D.: Writing, censorship and editing. W.H.: Writing, censorship and editing. X.W.: Investigation. Y.L. and R.D.: Investigation. All authors have read and agreed to the published version of the manuscript.
Funding
This study was supported by the Guangdong Provincial Department of Education’s Key Areas Project for Colleges and Universities in Guangdong Province (No. 2021ZDZX4027). Guangdong Province University Innovation Team Project (No. 2021KCXTD011) and the Coastal Agricultural Engineering Technology Research Center provided by Guangdong Ocean University (No. 230421020) and Guangdong Ocean University Research Startup Project (No. R20046); Funded by (06030-20520-12).
Institutional Review Board Statement
Not applicable. All experimental studies on plants complied with relevant institutional, national, and international guidelines and legislation.
Informed Consent Statement
Not applicable.
Data Availability Statement
The data presented in this study are openly available in ncbi at https://www.ncbi.nlm.nih.gov/sra/PRJNA1300947, reference number PRJNA1370692.
Acknowledgments
The authors gratefully acknowledge the participants who volunteered to help with the present study and the researchers who provided guidance on the instruments and equipment for this experiment.
Conflicts of Interest
The authors declare no conflicts of interest.
Abbreviations
The following abbreviations are used in this manuscript:
| ROS | Reactive oxygen species |
| MDA | Malondialdehyde |
| DEGs | Differentially expressed genes |
| POD | Peroxidase |
| SOD | Superoxide dismutase |
| qRT-PCR | Quantitative real-time polymerase chain reaction |
| GO | Gene ontology |
| ABA | Abscisic acid |
| JA | Jasmonic acid |
| ASA | Ascorbic acid |
| GSH | Glutathione |
| APX | Ascorbate peroxidase |
| KEGG | Kyoto Encyclopedia of Genes and Genomes |
| DAMs | Differential metabolites |
References
- Liu, X.; Hu, Q.; Yan, J.; Sun, K.; Liang, Y.; Jia, M.; Meng, X.; Fang, S.; Wang, Y.; Jing, Y.; et al. Exogenous melatonin promotes the salt tolerance by removing active oxygen and maintaining ion balance in wheat (Triticum aestivum L.). Front. Plant Sci. 2021, 12, 787062. [Google Scholar] [CrossRef] [Scilit]
- Zhang, X.; Wei, L.; Wang, Z.; Wang, T. Physiological and molecular features of Puccinellia tenuiflora tolerating salt and alkaline-salt stress. J. Integr. Plant Biol. 2013, 55, 262–276. [Google Scholar] [CrossRef] [Scilit] [PubMed]
- Zhao, C.; Zhang, H.; Song, C.; Zhu, J.K.; Shabala, S. Mechanisms of plant responses and adaptation to soil salinity. Innovation 2020, 1, 100017. [Google Scholar] [CrossRef] [Scilit] [PubMed]
- Taratima, W.; Chomarsa, T.; Maneerattanarungroj, P. Salinity stress response of rice (Oryza sativa L. cv. Luem Pua) calli and seedlings. Scientifica 2022, 2022, 5616683. [Google Scholar] [CrossRef] [Scilit] [PubMed]
- Rajabi Dehnavi, A.; Zahedi, M.; Piernik, A. Understanding salinity stress responses in sorghum: Exploring genotype variability and salt tolerance mechanisms. Front. Plant Sci. 2023, 14, 1296286. [Google Scholar] [CrossRef] [Scilit] [PubMed]
- Wang, J.; Li, Y.; Wang, Y.; Du, F.; Zhang, Y.; Yin, M.; Zhao, X.; Xu, J.; Yang, Y.; Wang, W.; et al. Transcriptome and metabolome analyses reveal complex molecular mechanisms involved in the salt tolerance of rice induced by exogenous allantoin. Antioxidants 2022, 11, 2045. [Google Scholar] [CrossRef] [Scilit] [PubMed]
- Wang, J.; Lv, J.; Liu, Z.; Liu, Y.; Song, J.; Ma, Y.; Ou, L.; Zhang, X.; Liang, C.; Wang, F.; et al. Integration of transcriptomics and metabolomics for pepper (Capsicum annuum L.) in response to heat stress. Int. J. Mol. Sci. 2019, 20, 5042. [Google Scholar] [CrossRef] [Scilit] [PubMed]
- Zhang, Y.; Li, D.; Zhou, R.; Wang, X.; Dossa, K.; Wang, L.; Zhang, Y.; Yu, J.; Gong, H.; Zhang, X.; et al. Transcriptome and metabolome analyses of two contrasting sesame genotypes reveal the crucial biological pathways involved in rapid adaptive response to salt stress. BMC Plant Biol. 2019, 19, 66. [Google Scholar] [CrossRef] [Scilit] [PubMed]
- Yu, J.; Li, P.; Tu, S.; Feng, N.; Chang, L.; Niu, Q. Integrated analysis of the transcriptome and metabolome of Brassica rapa revealed regulatory mechanism under heat stress. Int. J. Mol. Sci. 2023, 24, 13993. [Google Scholar] [CrossRef] [Scilit] [PubMed]
- Han, C.; Chen, G.; Zheng, D.; Feng, N. Transcriptomic and metabolomic analyses reveal that ABA increases the salt tolerance of rice significantly correlated with jasmonic acid biosynthesis and flavonoid biosynthesis. Sci. Rep. 2023, 13, 20365. [Google Scholar] [CrossRef] [Scilit] [PubMed]
- Fang, X.; Mo, J.; Zhou, H.; Shen, X.; Xie, Y.; Xu, J.; Yang, S. Comparative transcriptome analysis of gene responses of salt-tolerant and salt-sensitive rice cultivars to salt stress. Sci. Rep. 2023, 13, 19065. [Google Scholar] [CrossRef] [Scilit] [PubMed]
- Ling, F.; Su, Q.; Jiang, H.; Cui, J.; He, X.; Wu, Z.; Zhang, Z.; Liu, J.; Zhao, Y. Effects of strigolactone on photosynthetic and physiological characteristics in salt-stressed rice seedlings. Sci. Rep. 2020, 10, 6183. [Google Scholar] [CrossRef] [Scilit] [PubMed]
- Zhang, R.; Wang, Y.; Hussain, S.; Yang, S.; Li, R.; Liu, S.; Chen, Y.; Wei, H.; Dai, Q.; Hou, H. Study on the effect of salt stress on yield and grain quality among different rice varieties. Front. Plant Sci. 2022, 13, 918460. [Google Scholar] [CrossRef] [Scilit] [PubMed]
- Zhao, S.; Jang, S.; Lee, Y.K.; Kim, D.G.; Jin, Z.; Koh, H.J. Genetic basis of tiller dynamics of rice revealed by genome-wide association studies. Plants 2020, 9, 1695. [Google Scholar] [CrossRef] [Scilit] [PubMed]
- Wang, Y.; Lu, J.; Ren, T.; Hussain, S.; Guo, C.; Wang, S.; Cong, R.; Li, X. Effects of nitrogen and tiller type on grain yield and physiological responses in rice. AoB Plants 2017, 9, plx012. [Google Scholar] [CrossRef] [Scilit] [PubMed]
- Wang, Y.; Li, J. Rice, rising. Nat. Genet. 2008, 40, 1273–1275. [Google Scholar] [CrossRef] [Scilit] [PubMed]
- Wang, Y.; Jiao, Y. Axillary meristem initiation—A way to branch out. Curr. Opin. Plant Biol. 2018, 41, 61–66. [Google Scholar] [CrossRef] [Scilit] [PubMed]
- Liu, X.; Hu, Q.; Yan, J.; Sun, K.; Liang, Y.; Jia, M.; Meng, X.; Fang, S.; Wang, Y.; Jing, Y.; et al. ζ-Carotene isomerase suppresses tillering in rice through the coordinated biosynthesis of strigolactone and abscisic acid. Mol. Plant 2020, 13, 1784–1801. [Google Scholar] [CrossRef] [Scilit] [PubMed]
- Razzaque, M.A.; Talukder, N.M.; Islam, M.S.; Bhadra, A.K.; Dutta, R.K. The effect of salinity on morphological characteristics of seven rice (Oryza sativa) genotypes differing in salt tolerance. Pak. J. Biol. Sci. 2009, 12, 406–412. [Google Scholar] [CrossRef] [Scilit] [PubMed]
- Ruan, Y.; Hu, Y.; Schmidhalter, U. Insights on the role of tillering in salt tolerance of spring wheat from detillering. Environ. Exp. Bot. 2008, 64, 33–42. [Google Scholar] [CrossRef] [Scilit]
- Yan, F.; Zhang, J.; Li, W.; Ding, Y.; Zhong, Q.; Xu, X.; Wei, H.; Li, G. Exogenous melatonin alleviates salt stress by improving leaf photosynthesis in rice seedlings. Plant Physiol. Biochem. 2021, 163, 367–375. [Google Scholar] [CrossRef] [Scilit] [PubMed]
- Yan, F.; Wei, H.; Ding, Y.; Li, W.; Liu, Z.; Chen, L.; Tang, S.; Ding, C.; Jiang, Y.; Li, G. Melatonin regulates antioxidant strategy in response to continuous salt stress in rice seedlings. Plant Physiol. Biochem. 2021, 165, 239–250. [Google Scholar] [CrossRef] [Scilit] [PubMed]
- Wu, H.; Shabala, L.; Zhou, M.; Su, N.; Wu, Q.; Ul-Haq, T.; Zhu, J.; Mancuso, S.; Azzarello, E.; Shabala, S. Root vacuolar Na+ sequestration but not exclusion from uptake correlates with barley salt tolerance. Plant J. 2019, 100, 55–67. [Google Scholar] [CrossRef] [Scilit] [PubMed]
- Fabian-Marwedel, T.; Umeda, M.; Sauter, M. The rice cyclin-dependent kinase-activating kinase R2 regulates S-phase progression. Plant Cell 2002, 14, 197–210. [Google Scholar] [CrossRef] [Scilit] [PubMed]
- Tavu, L.E.J.; Redillas, M.C.F.R. Oxidative Stress in Rice (Oryza sativa): Mechanisms, Impact, and Adaptive Strategies. Plants 2025, 14, 1463. [Google Scholar] [CrossRef] [Scilit] [PubMed]
- Amaris, R.N.; Li, M.; Liu, Y.; Chen, X.; Murage, H.; Yang, P. A proteomic analysis of salt stress response in seedlings of two African rice cultivars. Biochim. Biophys. Acta 2016, 1864, 1570–1578. [Google Scholar] [CrossRef] [Scilit] [PubMed]
- Shabala, S.; Pottosin, I. Regulation of potassium transport in plants under hostile conditions: Implications for abiotic and biotic stress tolerance. Physiol. Plant. 2014, 151, 257–279. [Google Scholar] [CrossRef] [Scilit] [PubMed]
- Lee, M.H.; Cho, E.J.; Wi, S.G.; Bae, H.; Kim, J.E.; Cho, J.Y.; Lee, S.; Kim, J.H.; Chung, B.Y. Divergences in morphological changes and antioxidant responses in salt-tolerant and salt-sensitive rice seedlings after salt stress. Plant Physiol. Biochem. 2013, 70, 325–335. [Google Scholar] [CrossRef] [Scilit] [PubMed]
- Yang, S.; Liu, M.; Chu, N.; Chen, G.; Wang, P.; Mo, J.; Guo, H.; Xu, J.; Zhou, H. Combined transcriptome and metabolome reveal glutathione metabolism plays a critical role in resistance to salinity in rice landraces HD961. Front. Plant Sci. 2022, 13, 952595. [Google Scholar] [CrossRef] [Scilit] [PubMed]
- Wang, Y.; Zhang, Y.; Li, Y.; Du, F.; Yin, M.; Zhao, X.; Xu, J.; Yang, Y.; Wang, W. Comparative transcriptome and metabolome profiling reveal molecular mechanisms underlying OsDRAP1-mediated salt tolerance in rice. Sci. Rep. 2021, 11, 5166. [Google Scholar] [CrossRef] [Scilit] [PubMed]
- Yang, S.; Tao, Y.; Liu, M.; Zhou, H.; Chen, G.; Xu, J.; Mo, J.; Zhang, H. Transcriptome and metabolome analysis demonstrate critical contribution of flavonoid biosynthesis and galactose metabolism to salt resistance of rice roots. Sci. Rep. 2026; in press. [CrossRef] [Scilit] [PubMed]
- Khan, Z.; Jan, R.; Asif, S.; Farooq, M.; Jang, Y.H.; Kim, E.G.; Kim, N.; Kim, K.M. Exogenous melatonin induces salt and drought stress tolerance in rice by promoting plant growth and defense system. Sci. Rep. 2024, 14, 1214. [Google Scholar] [CrossRef] [Scilit] [PubMed]
- Xu, Y.; Bu, W.; Xu, Y.; Fei, H.; Zhu, Y.; Ahmad, I.; Nimir, N.E.A.; Zhou, G.; Zhu, G. Effects of Salt Stress on Physiological and Agronomic Traits of Rice Genotypes with Contrasting Salt Tolerance. Plants 2024, 13, 1157. [Google Scholar] [CrossRef] [Scilit] [PubMed]
- Zhang, R.; Zheng, D.; Feng, N.; Linfeng, L.; Ma, J.; Yuan, X.; Huang, J.; Huang, L. Effect of salt stress on different tiller positions in rice and the regulatory effect of prohexadione calcium. PeerJ 2024, 12, e18357. [Google Scholar] [CrossRef] [Scilit] [PubMed]
- Zhao, S.; Zhang, Q.; Liu, M.; Zhou, H.; Ma, C.; Wang, P. Regulation of plant responses to salt stress. Int. J. Mol. Sci. 2021, 22, 4609. [Google Scholar] [CrossRef] [Scilit] [PubMed]
- Lanza, M.; Reis, A.R.D. Roles of selenium in mineral plant nutrition: ROS scavenging responses against abiotic stresses. Plant Physiol. Biochem. 2021, 164, 27–43. [Google Scholar] [CrossRef] [Scilit] [PubMed]
- Yang, Z.; Cao, Y.; Shi, Y.; Qin, F.; Jiang, C.; Yang, S. Genetic and molecular exploration of maize environmental stress resilience: Toward sustainable agriculture. Mol. Plant 2023, 16, 1496–1517. [Google Scholar] [CrossRef] [Scilit] [PubMed]
- Miller, G.; Suzuki, N.; Ciftci-Yilmaz, S.; Mittler, R. Reactive oxygen species homeostasis and signalling during drought and salinity stresses. Plant Cell Environ. 2010, 33, 453–467. [Google Scholar] [CrossRef] [Scilit] [PubMed]
- Zhang, M.; Smith, J.A.; Harberd, N.P.; Jiang, C. The regulatory roles of ethylene and reactive oxygen species (ROS) in plant salt stress responses. Plant Mol. Biol. 2016, 91, 651–659. [Google Scholar] [CrossRef] [Scilit] [PubMed]
- Gill, S.S.; Tuteja, N. Reactive oxygen species and antioxidant machinery in abiotic stress tolerance in crop plants. Plant Physiol. Biochem. 2010, 48, 909–930. [Google Scholar] [CrossRef] [Scilit] [PubMed]
- Xiao, S.; Song, W.; Xing, J.; Su, A.; Zhao, Y.; Li, C.; Shi, Z.; Li, Z.; Wang, S.; Zhang, R.; et al. ORF355 confers enhanced salinity stress adaptability to S-type cytoplasmic male sterility maize by modulating the mitochondrial metabolic homeostasis. J. Integr. Plant Biol. 2023, 65, 656–673. [Google Scholar]
- Huihui, Z.; Xin, L.; Zisong, X.; Yue, W.; Zhiyuan, T.; Meijun, A.; Yuehui, Z.; Wenxu, Z.; Nan, X.; Guangyu, S. Toxic effects of heavy metals Pb and Cd on mulberry (Morus alba L.) seedling leaves: Photosynthetic function and reactive oxygen species (ROS) metabolism responses. Ecotoxicol. Environ. Saf. 2020, 195, 110469. [Google Scholar] [CrossRef] [Scilit] [PubMed]
- Zhou, Y.B.; Liu, C.; Tang, D.Y.; Yan, L.; Wang, D.; Yang, Y.Z.; Gui, J.S.; Zhao, X.Y.; Li, L.G.; Tang, X.D.; et al. The receptor-like cytoplasmic kinase STRK1 phosphorylates and activates CatC, thereby regulating H2O2 homeostasis and improving salt tolerance in rice. Plant Cell 2018, 30, 1100–1118. [Google Scholar] [CrossRef] [Scilit] [PubMed]
- Munns, R.; Tester, M. Mechanisms of salinity tolerance. Annu. Rev. Plant Biol. 2008, 59, 651–681. [Google Scholar] [CrossRef] [Scilit] [PubMed]
- Chen, H.; Chen, M.; Yang, S.; Mo, J.; Xu, J.; Zhou, H.; Fang, X.; Shen, X.; Xie, Y.; Yang, S. Genomic and translational insights into eIF2B-mediated salt tolerance in sea rice HD961. BMC Biol. 2025, 23, 333. [Google Scholar] [CrossRef] [Scilit] [PubMed]
- Dey, S.; Sen Raychaudhuri, S. Methyl jasmonate improves selenium tolerance via regulating ROS signalling, hormonal crosstalk and phenylpropanoid pathway in Plantago ovata. Plant Physiol. Biochem. 2024, 209, 108533. [Google Scholar] [CrossRef] [Scilit] [PubMed]
- Rácz, A.; Hideg, É.; Czégény, G. Selective responses of class III plant peroxidase isoforms to environmentally relevant UV-B doses. J. Plant Physiol. 2018, 221, 101–106. [Google Scholar] [CrossRef] [Scilit] [PubMed]
- Wang, X.; Wu, Z.; Zhou, Q.; Wang, X.; Song, S.; Dong, S. Physiological response of soybean plants to water deficit. Front. Plant Sci. 2021, 12, 809692. [Google Scholar] [CrossRef] [Scilit] [PubMed]
- Srivastava, A.K.; Singh, D. Assessment of malathion toxicity on cytophysiological activity, DNA damage and antioxidant enzymes in root of Allium cepa model. Sci. Rep. 2020, 10, 886. [Google Scholar] [CrossRef] [Scilit] [PubMed]
- Bradford, M.M. A rapid and sensitive method for the quantitation of microgram quantities of protein utilizing the principle of protein-dye binding. Anal. Biochem. 1976, 72, 248–254. [Google Scholar] [CrossRef] [Scilit]
- Velikova, V.; Yordanov, I.; Edreva, A. Oxidative stress and some antioxidant systems in acid rain-treated bean plants: Protective role of exogenous polyamines. Plant Sci. 2020, 151, 59–66. [Google Scholar]
- Chen, S.; Zhou, Y.; Chen, Y.; Gu, P. Fastp: An ultra-fast all-in-one FASTQ preprocessor. Bioinformatics 2018, 34, i884–i890. [Google Scholar] [CrossRef] [Scilit] [PubMed]
- Langmead, B.; Salzberg, S.L. Fast gapped-read alignment with Bowtie 2. Nat. Methods 2012, 9, 357–359. [Google Scholar] [CrossRef] [Scilit] [PubMed]
- Beltran, A.; Suarez, M.; Rodríguez, M.A.; Vinaixa, M.; Samino, S.; Arola, L.; Correig, X.; Yanes, O. Assessment of compatibility between extraction methods for NMR-and LC/MS-based metabolomics. Anal. Chem. 2012, 84, 5838–5844. [Google Scholar] [CrossRef] [Scilit] [PubMed]
- Livak, K.J.; Schmittgen, T.D. Analysis of relative gene expression data using real-time quantitative PCR and the 2−ΔΔCT method. Methods 2001, 25, 402–408. [Google Scholar] [CrossRef] [Scilit] [PubMed]
Disclaimer/Publisher’s Note: The statements, opinions and data contained in all publications are solely those of the individual author(s) and contributor(s) and not of MDPI and/or the editor(s). MDPI and/or the editor(s) disclaim responsibility for any injury to people or property resulting from any ideas, methods, instructions or products referred to in the content. |
© 2026 by the authors. Licensee MDPI, Basel, Switzerland. This article is an open access article distributed under the terms and conditions of the Creative Commons Attribution (CC BY) license.