


Abstract
A genome-wide identification and expression analysis was performed to examine the response of the amino acid permease (AAP) gene family to drought stress in tomato (Solanum lycopersicum L.). Ten AAP genes were identified across seven of the twelve chromosomes and classified into four subfamilies (I–IV) based on phylogenetic relationships. Expansion of the SlAAP family appears to have been driven mainly by segmental and tandem duplication events. Members within the same subfamily displayed high similarity in exon–intron organization and conserved motif architecture. Promoter analysis revealed the presence of multiple cis-acting elements associated with stress and defence regulation. Under drought stress, all putative genes exhibited significant transcriptional induction, with SlAAP8, SlAAP9 and SlAAP10 showing the strongest upregulation, suggesting their potential involvement in drought adaptation. Drought treatment also led to a marked decline in nitrate (NO3−) and total nitrogen (N) contents, while simultaneously increasing the accumulation of total amino acids, ammonium (NH4+), and proline in both leaf and root tissues of tomato. The expression profiles of the ten putative SlAAP genes showed strong positive correlations with total amino acid levels in both organs, suggesting their involvement in amino acid redistribution under stress. Collectively, these results underscore the functional complexity of the SlAAP gene family and provide a robust foundation for future investigations into their molecular roles and potential applications in enhancing drought tolerance in tomato and other crop species.
1. Introduction
Amino acids, as precursors of proteins and other nitrogenous compounds such as nucleic acids, play diverse roles in plant growth and development [1]. Plants obtain nitrogen (N) either by assimilating inorganic sources such as nitrate (NO3−) and ammonium (NH4+) into amino acids or by directly absorbing amino acids from the soil [2]. Amino acid biosynthesis occurs predominantly in roots and mature leaves (source tissues), which subsequently distribute N to sink tissues including root tips, flowers, fruits, and seeds to support growth and the synthesis of key products such as starch, proteins, and fatty acids/oils [3]. As central mediators of N distribution and integral components of plant proteins, amino acid transporters (AATs) are indispensable for plant growth and development. They facilitate amino acid transport, regulate signal transduction, maintain osmotic homeostasis, and contribute to plant responses against both biotic and abiotic stressors [4]. Plant AATs are classified into two major groups based on sequence similarity and transport characteristics: the amino acid/auxin permease (AAAP) family and the amino acid–polyamine–choline (APC) family [4]. The AAAP family includes amino acid permeases (AAPs), lysine histidine transporters (LHTs), gamma aminobutyric acid transporters (GATs), proline transporters (ProTs), indole 3 acetic acid transporters (AUXs), aromatic and neutral amino acid transporters, and AAT like proteins. The APC family contains amino acid choline transporters (ACTs), cationic amino acid transporters (CATs), and polyamine H+ symporters (PHSs) [5]. In addition, a novel family of amino acid transporters, termed the Usually Multiple Amino Acid In And Out Transporters (UMAMITs), which belong to the drug/metabolite superfamily, has been identified [6]. Genome-wide studies across several plant species indicate that AATs are key regulators of amino acid uptake, intracellular and intercellular movement, long-distance transport, and N remobilization [7,8].
The amino acid permease (AAP) family is among the most extensively studied groups of AATs. First identified in Arabidopsis thaliana, AAPs function as broad-spectrum transporters that mediate H+-driven amino acid uptake and regulate essential physiological processes including root absorption, phloem loading, xylem-to-phloem transfer, seed filling, and grain yield [9,10,11]. AAPs are localized to the plasma membrane and display distinct spatial and temporal expression patterns, reflecting their specialized roles in plant metabolism [12]. Arabidopsis thaliana and rice (Oryza sativa) contain eight and nine AAP genes, respectively [13]. In Arabidopsis thaliana, AtAAP1 is strongly expressed in root epidermal cells and lateral roots, where it enhances amino acid uptake and contributes to seed productivity. AtAAP2 facilitates amino acid movement from the xylem to the phloem, and its loss disrupts carbon and nitrogen balance, reducing seed lipid content and yield [14].
AtAAP3 participates in amino acid uptake without major phenotypic effects, while AtAAP5 transports basic amino acids such as lysine and arginine [15]. AtAAP6 is expressed in tissues that import nitrogen from other organs and in xylem parenchyma, where it mediates neutral and acidic amino acid uptake. AtAAP8 plays a major role in delivering acidic amino acids to the endosperm and is important for seed development [14]. In rice, OsAAP5 regulates tiller formation by transporting basic and neutral amino acids, while OsAAP6 influences amino acid distribution and starch synthesis [16]. Studies in pea, Vicia faba, and poplar further demonstrate that AAPs influence amino acid levels, storage protein accumulation, and proline transport [17]. Collectively, these findings demonstrate that AAPs are integral to amino acid absorption in diverse tissues, long-distance transport and partitioning of amino acids, and the regulation of physiological metabolism, highlighting their essential roles in plant growth and development.
Tomato (Solanum lycopersicum L.) is a major vegetable crop cultivated worldwide. Although its genome is relatively small at approximately 900 Mb, many amino acid permease genes in tomato remain uncharacterized. Because AAPs are crucial for plant growth and nutrient allocation, identifying tomato AAP genes through genomic resources is an important research priority [18]. Drought stress causes substantial physiological and biochemical changes in tomato, especially during early growth stages, and often leads to reduced fruit quality and yield [19]. Indicators such as osmolyte accumulation and N metabolic compounds are widely used to assess drought responses in many crops [20,21], yet remain insufficiently studied in tomato. Several amino acids also act as precursors for metabolites involved in stress adaptation [22]. Although AAP expression patterns have been reported in various plant species under different environmental conditions [23,24,25,26,27,28,29], their roles in drought responses in tomato have not been investigated. This study therefore aimed to identify and characterize the AAP gene family (SlAAPs) in tomato using genome-wide and bioinformatic approaches. It also examined the transcriptional responses of SlAAPs to drought stress and explored the relationships between SlAAP expression and key physiological and biochemical drought indicators. A deeper understanding of amino acid transport and accumulation under stress will provide valuable insights for improving drought tolerance and guiding future research in plant stress physiology and crop improvement.
2. Results
2.1. Identification and Characterization of the AAPs in Tomato
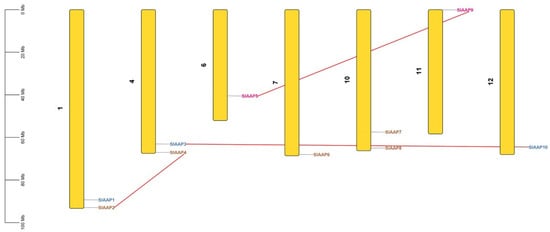
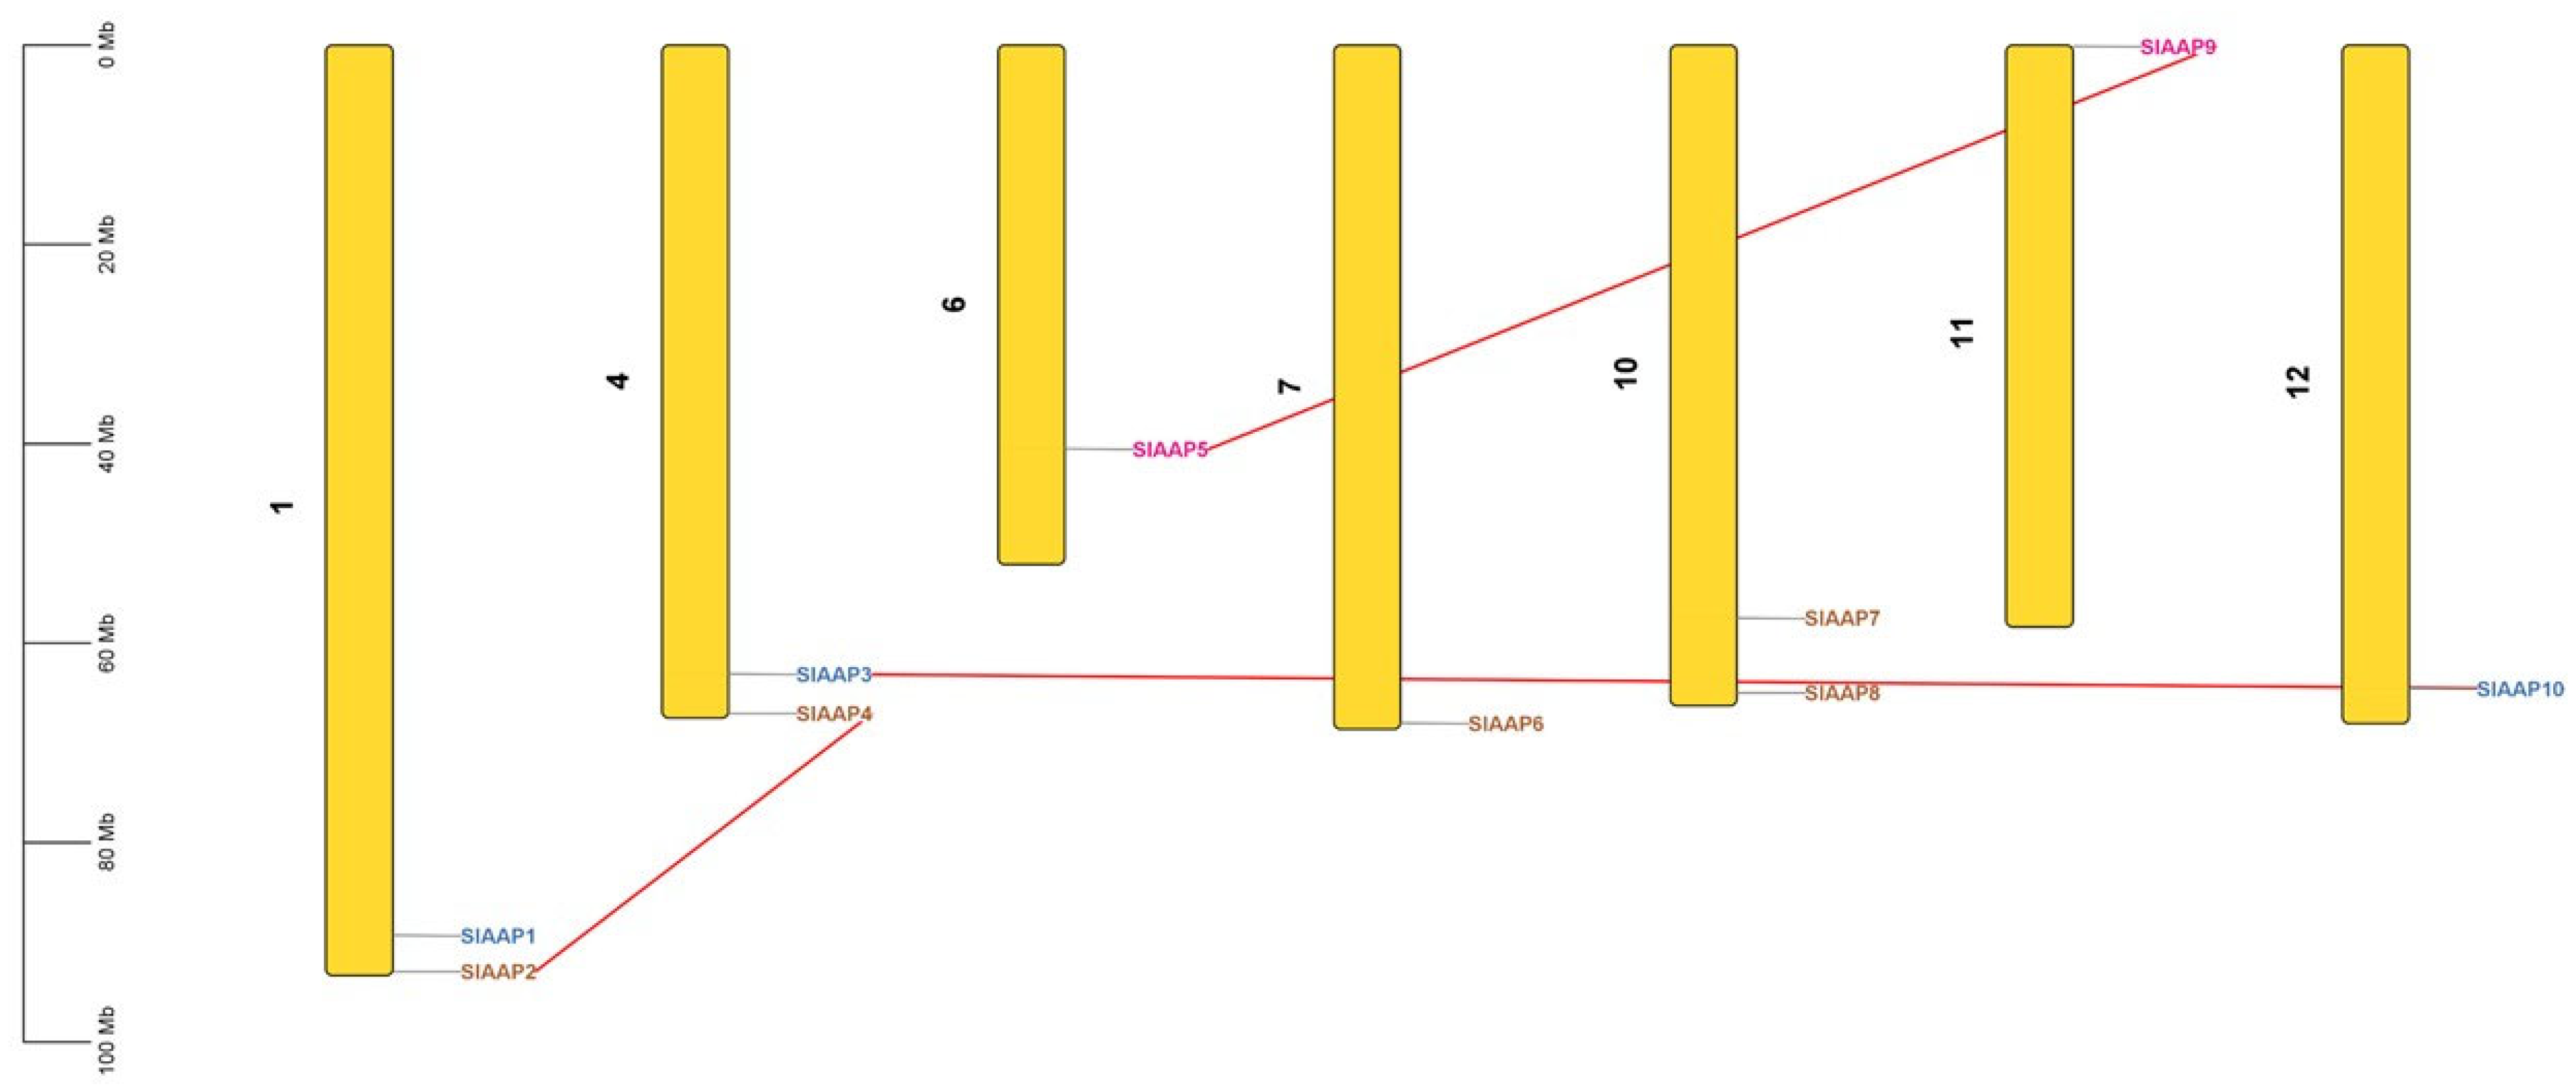
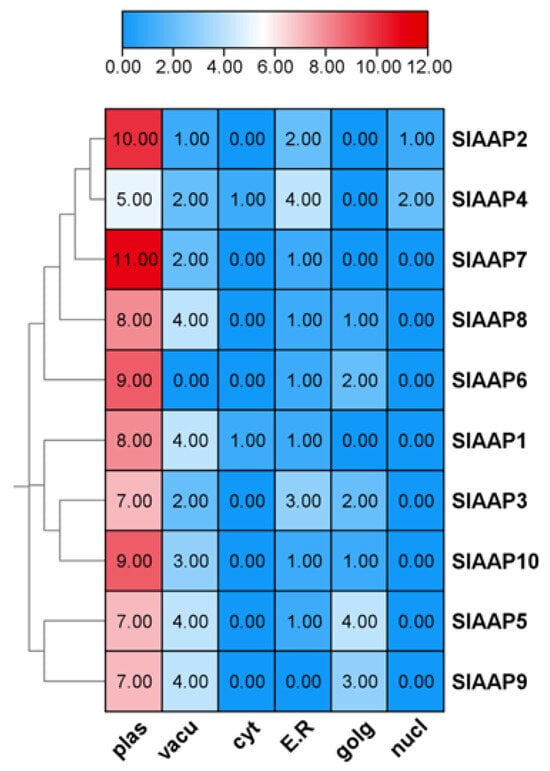
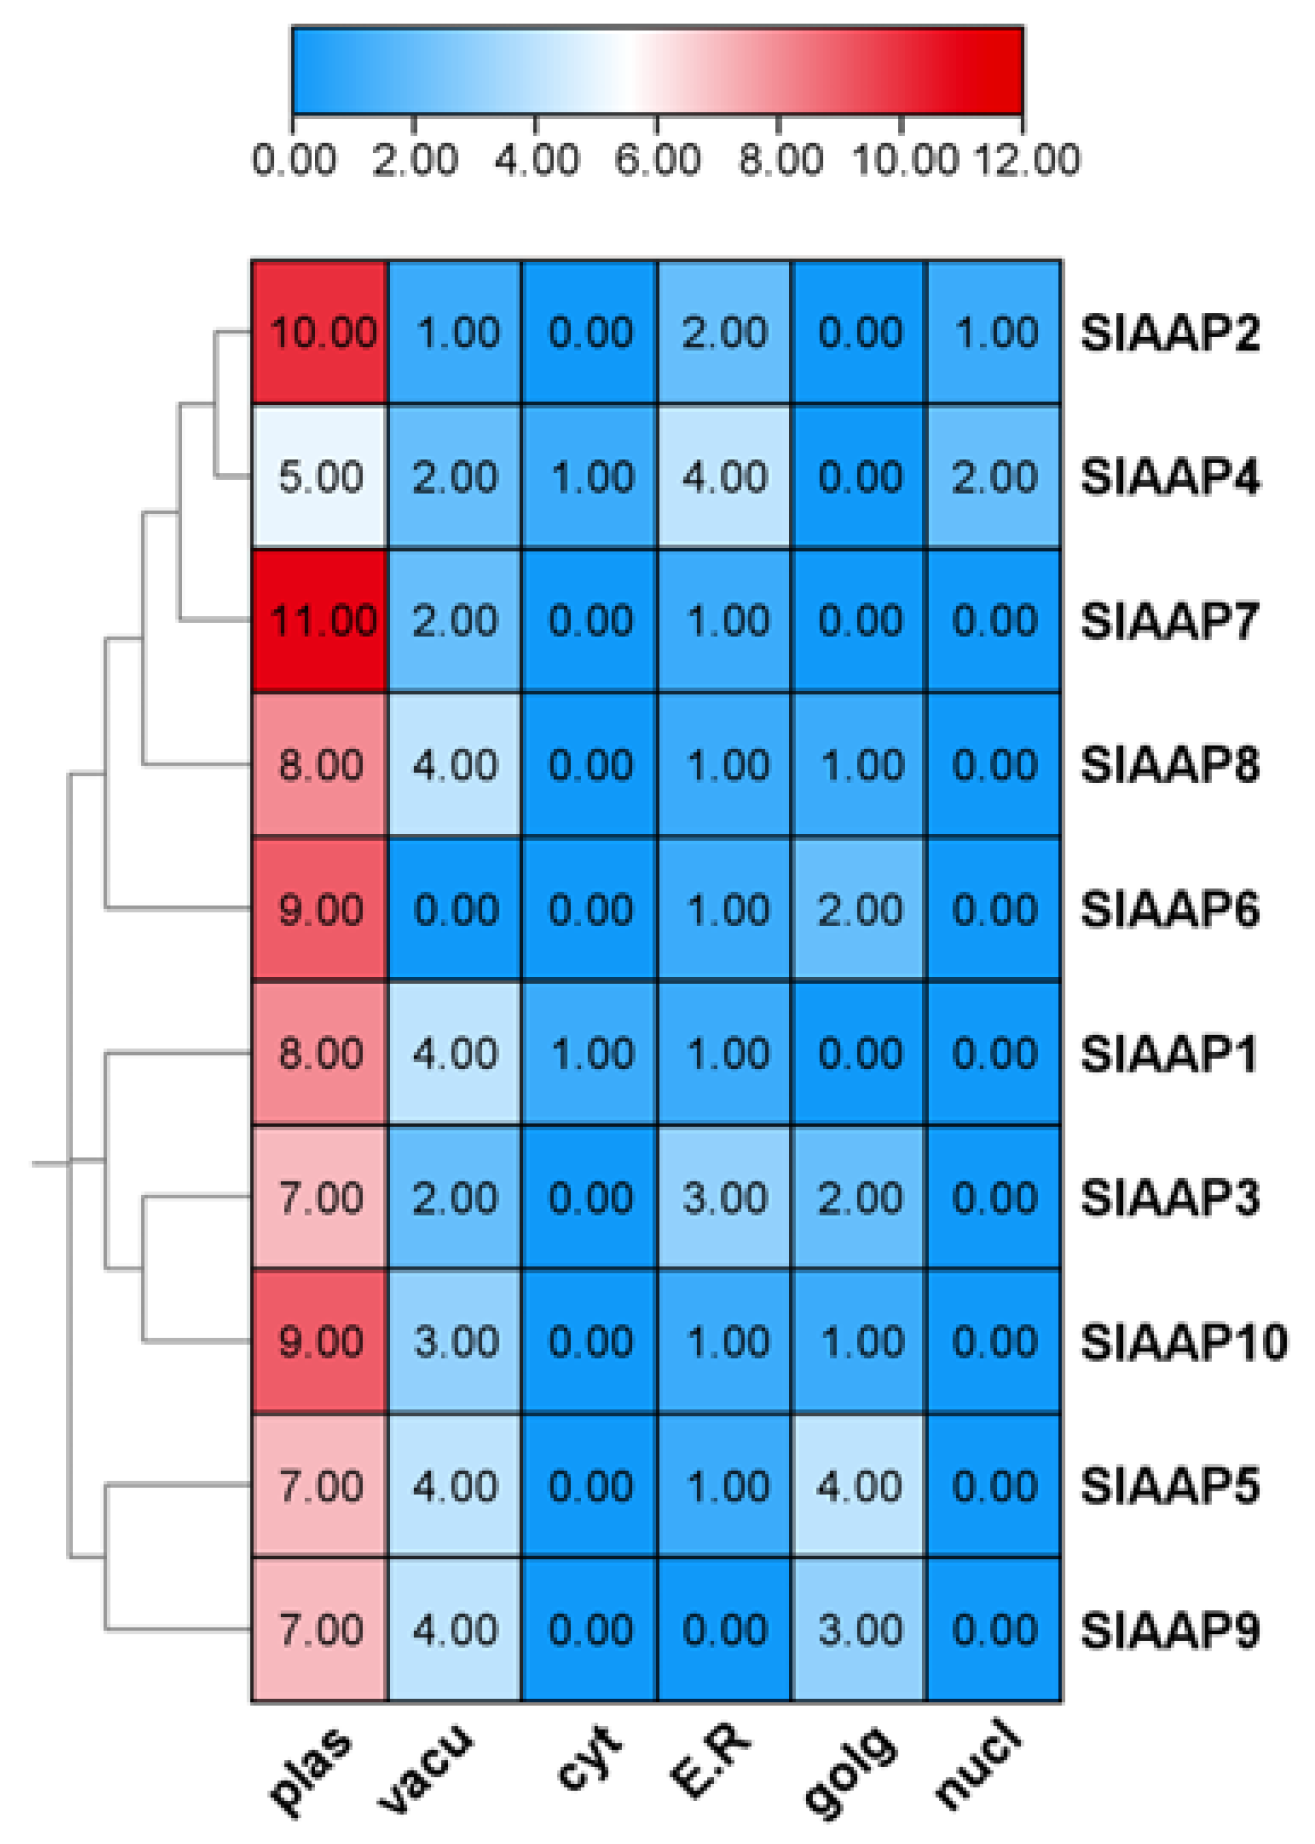
Ten SlAAPs were found and renamed as SlAAP1–SlAAP10 based on their chromosomal position. The SlAAPs were distributed on chromosomes 1, 4, 6, 7, 10 and 11 of the 12 out of the 12 S. lycopersicum chromosomes (Table S1 and Figure 1). Based on the physiochemical analysis, the protein length ranged from 467 (SlAAP1) to 915 (SlAAP7) amino acids, the molecular weights from 51.44 (SlAAP1) to 101.28 (SlAAP7) kDa, with instability index from 29.85 (SlAAP7) to 38.18 (SlAAP4). The aliphatic index ranged from 96.55 (SlAAP1) to 112.23 (SlAAP8), the theoretical isoelectric point from 5.05 (SlAAP8) to 9.33 (SlAAP2), and grand average of hydropathicity (GRAVY) values from 0.403 (SlAAP10) to 0.554 (SlAAP9). The SlAAPs were predominantly localized in the plasma membrane, based on the sub-cellular localization prediction (Table S1 and Figure 2).
Figure 1.
Chromosome mapping of SlAAP genes. SlAAPs are unevenly distributed across tomato chromosomes, with red lines marking duplicated gene pairs.
Figure 2.
Subcellular localization prediction of SlAAP proteins. Predicted localization sites include the plasma membrane (plas), vacuole (vacu), cytoplasm (cyt), endoplasmic reticulum (ER), Golgi apparatus (golg), and nucleus (nucl).
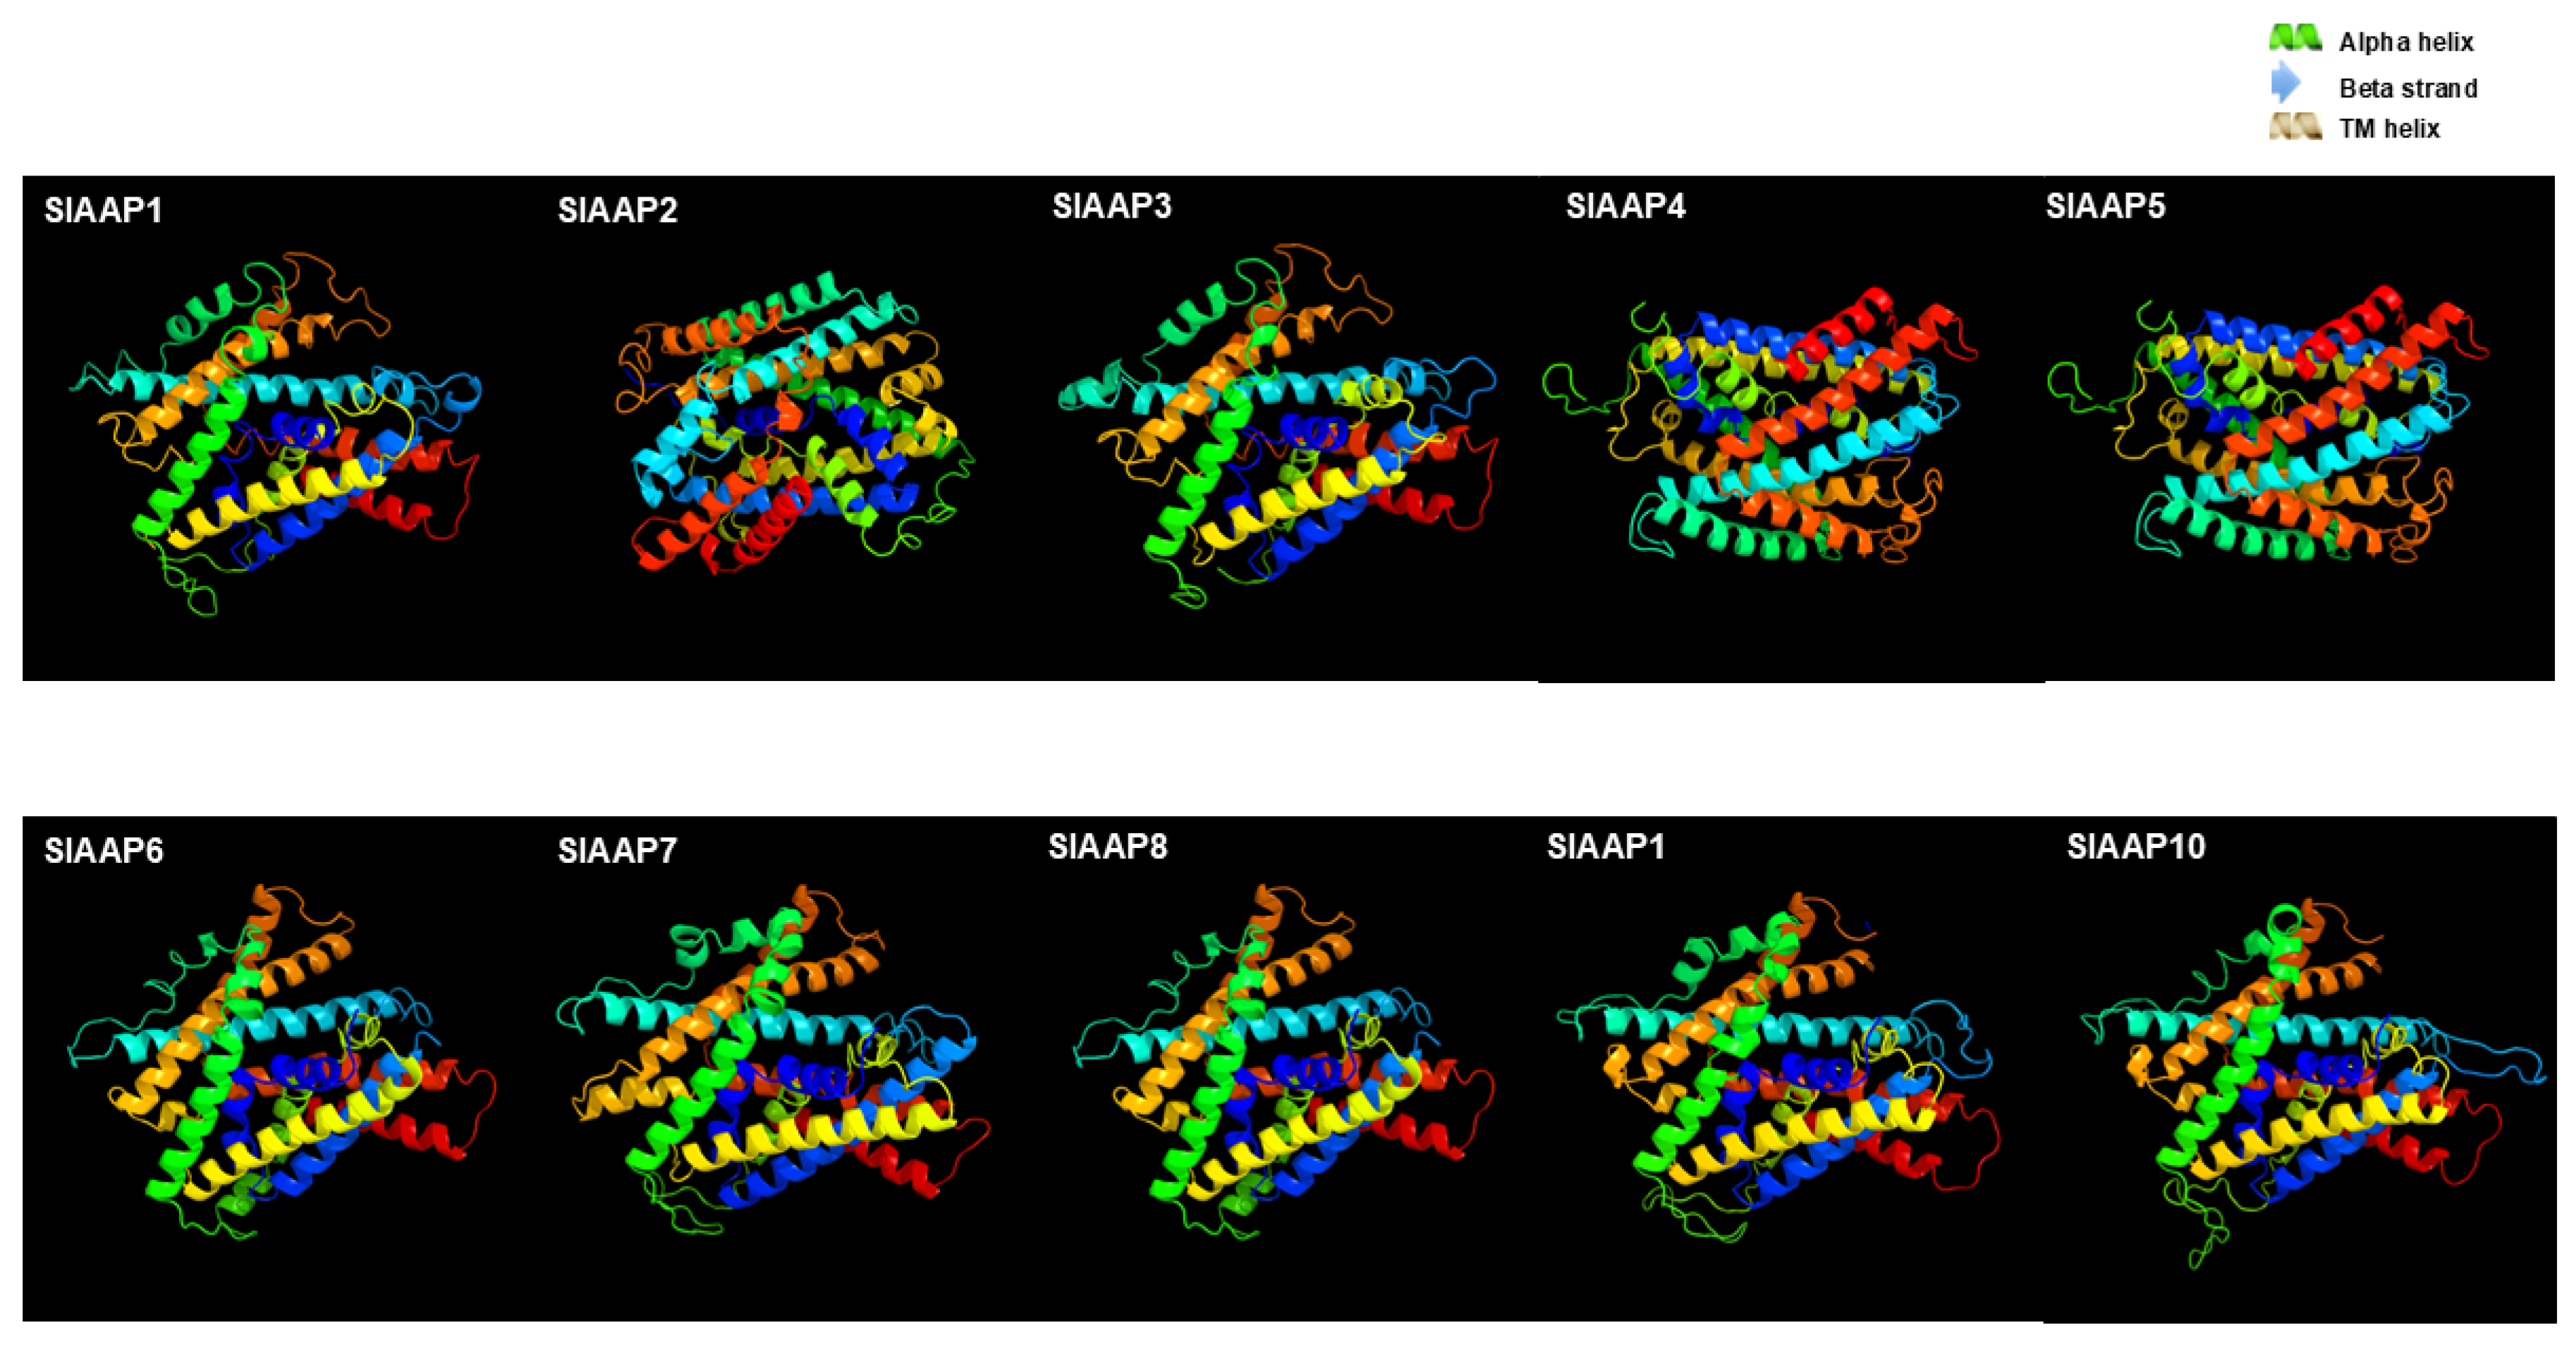
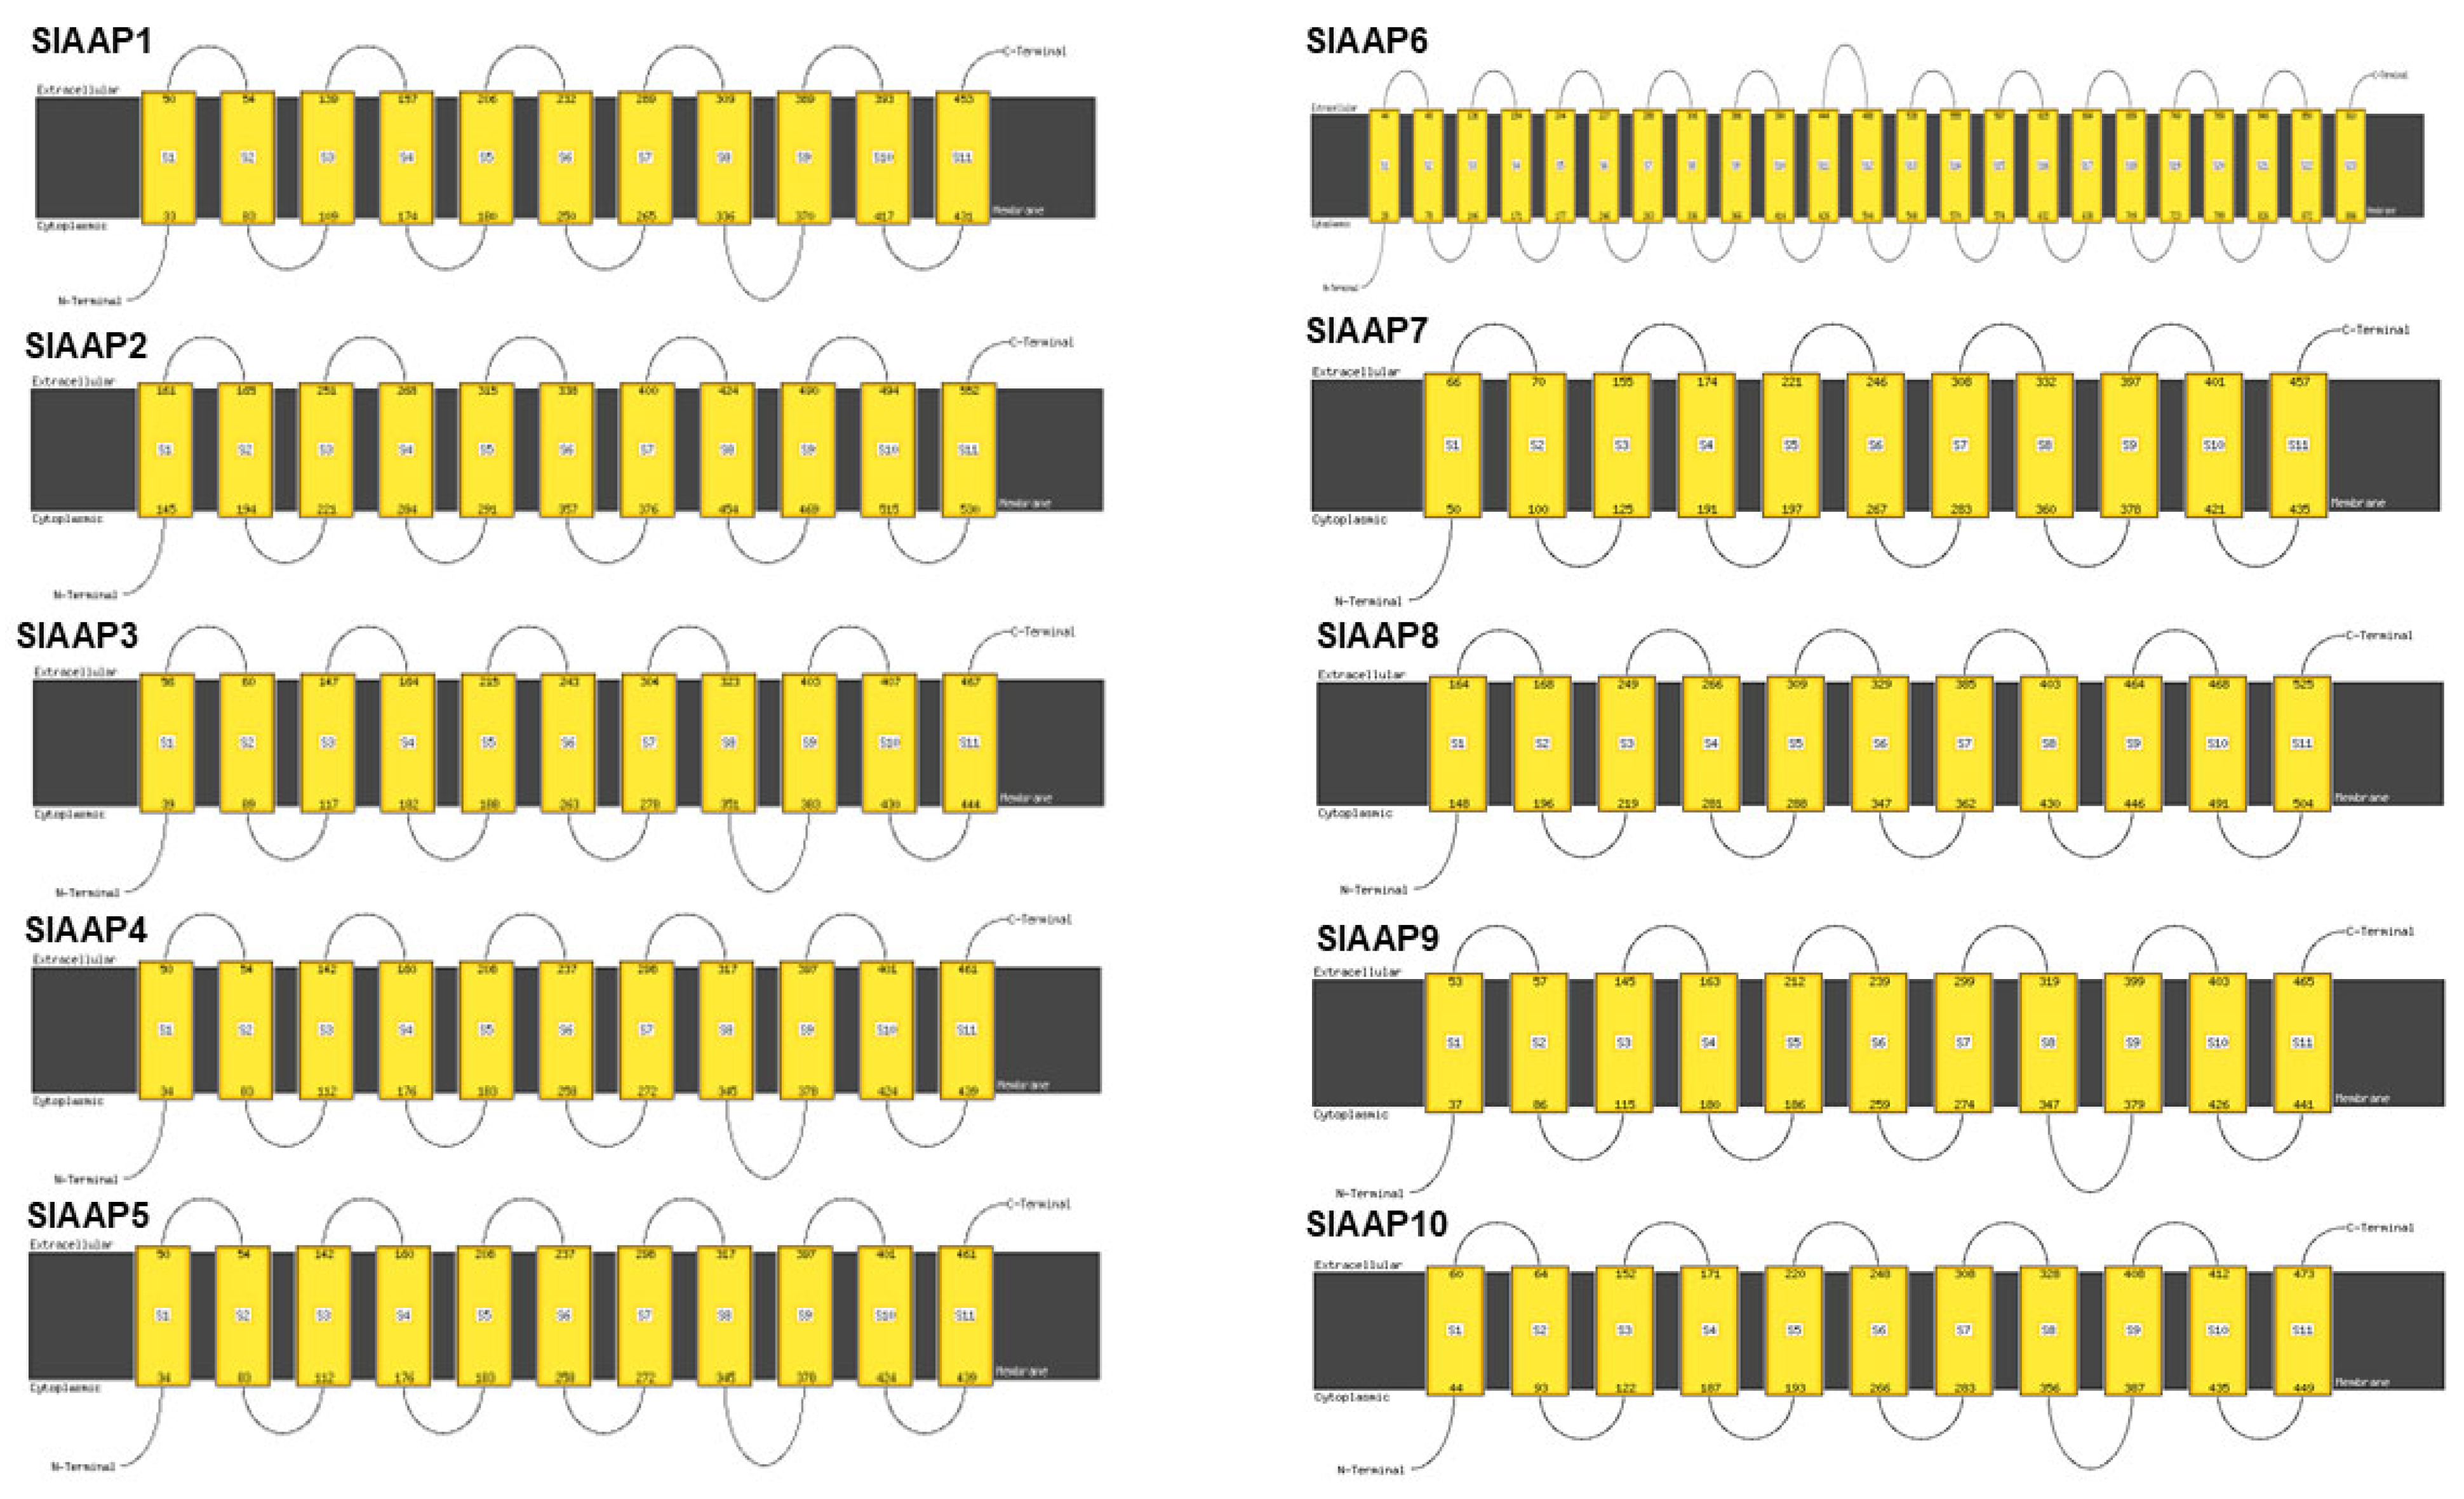
The secondary structure analysis of the SlAAPs revealed α-helix content of 56–69%, β-strand content of 0–2%, transmembrane helices of 46–60%, and disordered regions of 5–28%. The SlAAPs were predominantly modelled as c7kgvB_ based on the left template, with 100% confidence and sequence identity values ranging from 12 to 19% (Figure 3 and Figure 4, Table S2). All SlAAPs harboured the conserved GxxxD/E motif, a feature of amino acid permeases involved in proton-coupled transport. Conserved elements included glycine- and proline-rich regions that contribute to transmembrane helix flexibility, as well as conserved charged residues (R, K, E) essential for substrate recognition and gating (Figure S1). The presence of extensive hydrophobic stretches corresponding to 9–11 predicted transmembrane helices further supports the classification of SlAAPs within SLC5-6-like_sbd superfamily (Figures S2 and S3).
Figure 3.
Predicted three-dimensional structures of AAP proteins in tomato. Structural models of the AAP proteins were generated with confidence scores exceeding 90%, illustrating their predicted folding patterns and membrane topology.
Figure 4.
Predicted membrane topology of AAP proteins in tomato. Structural models of the AAP proteins were generated with confidence scores exceeding 90%, illustrating their predicted folding patterns and membrane topology.
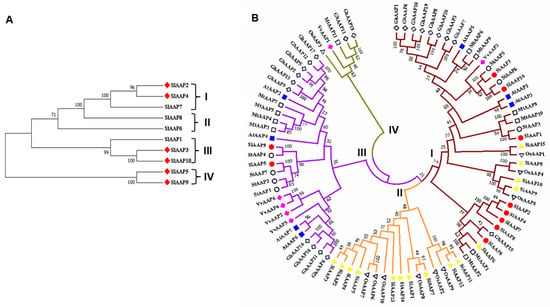
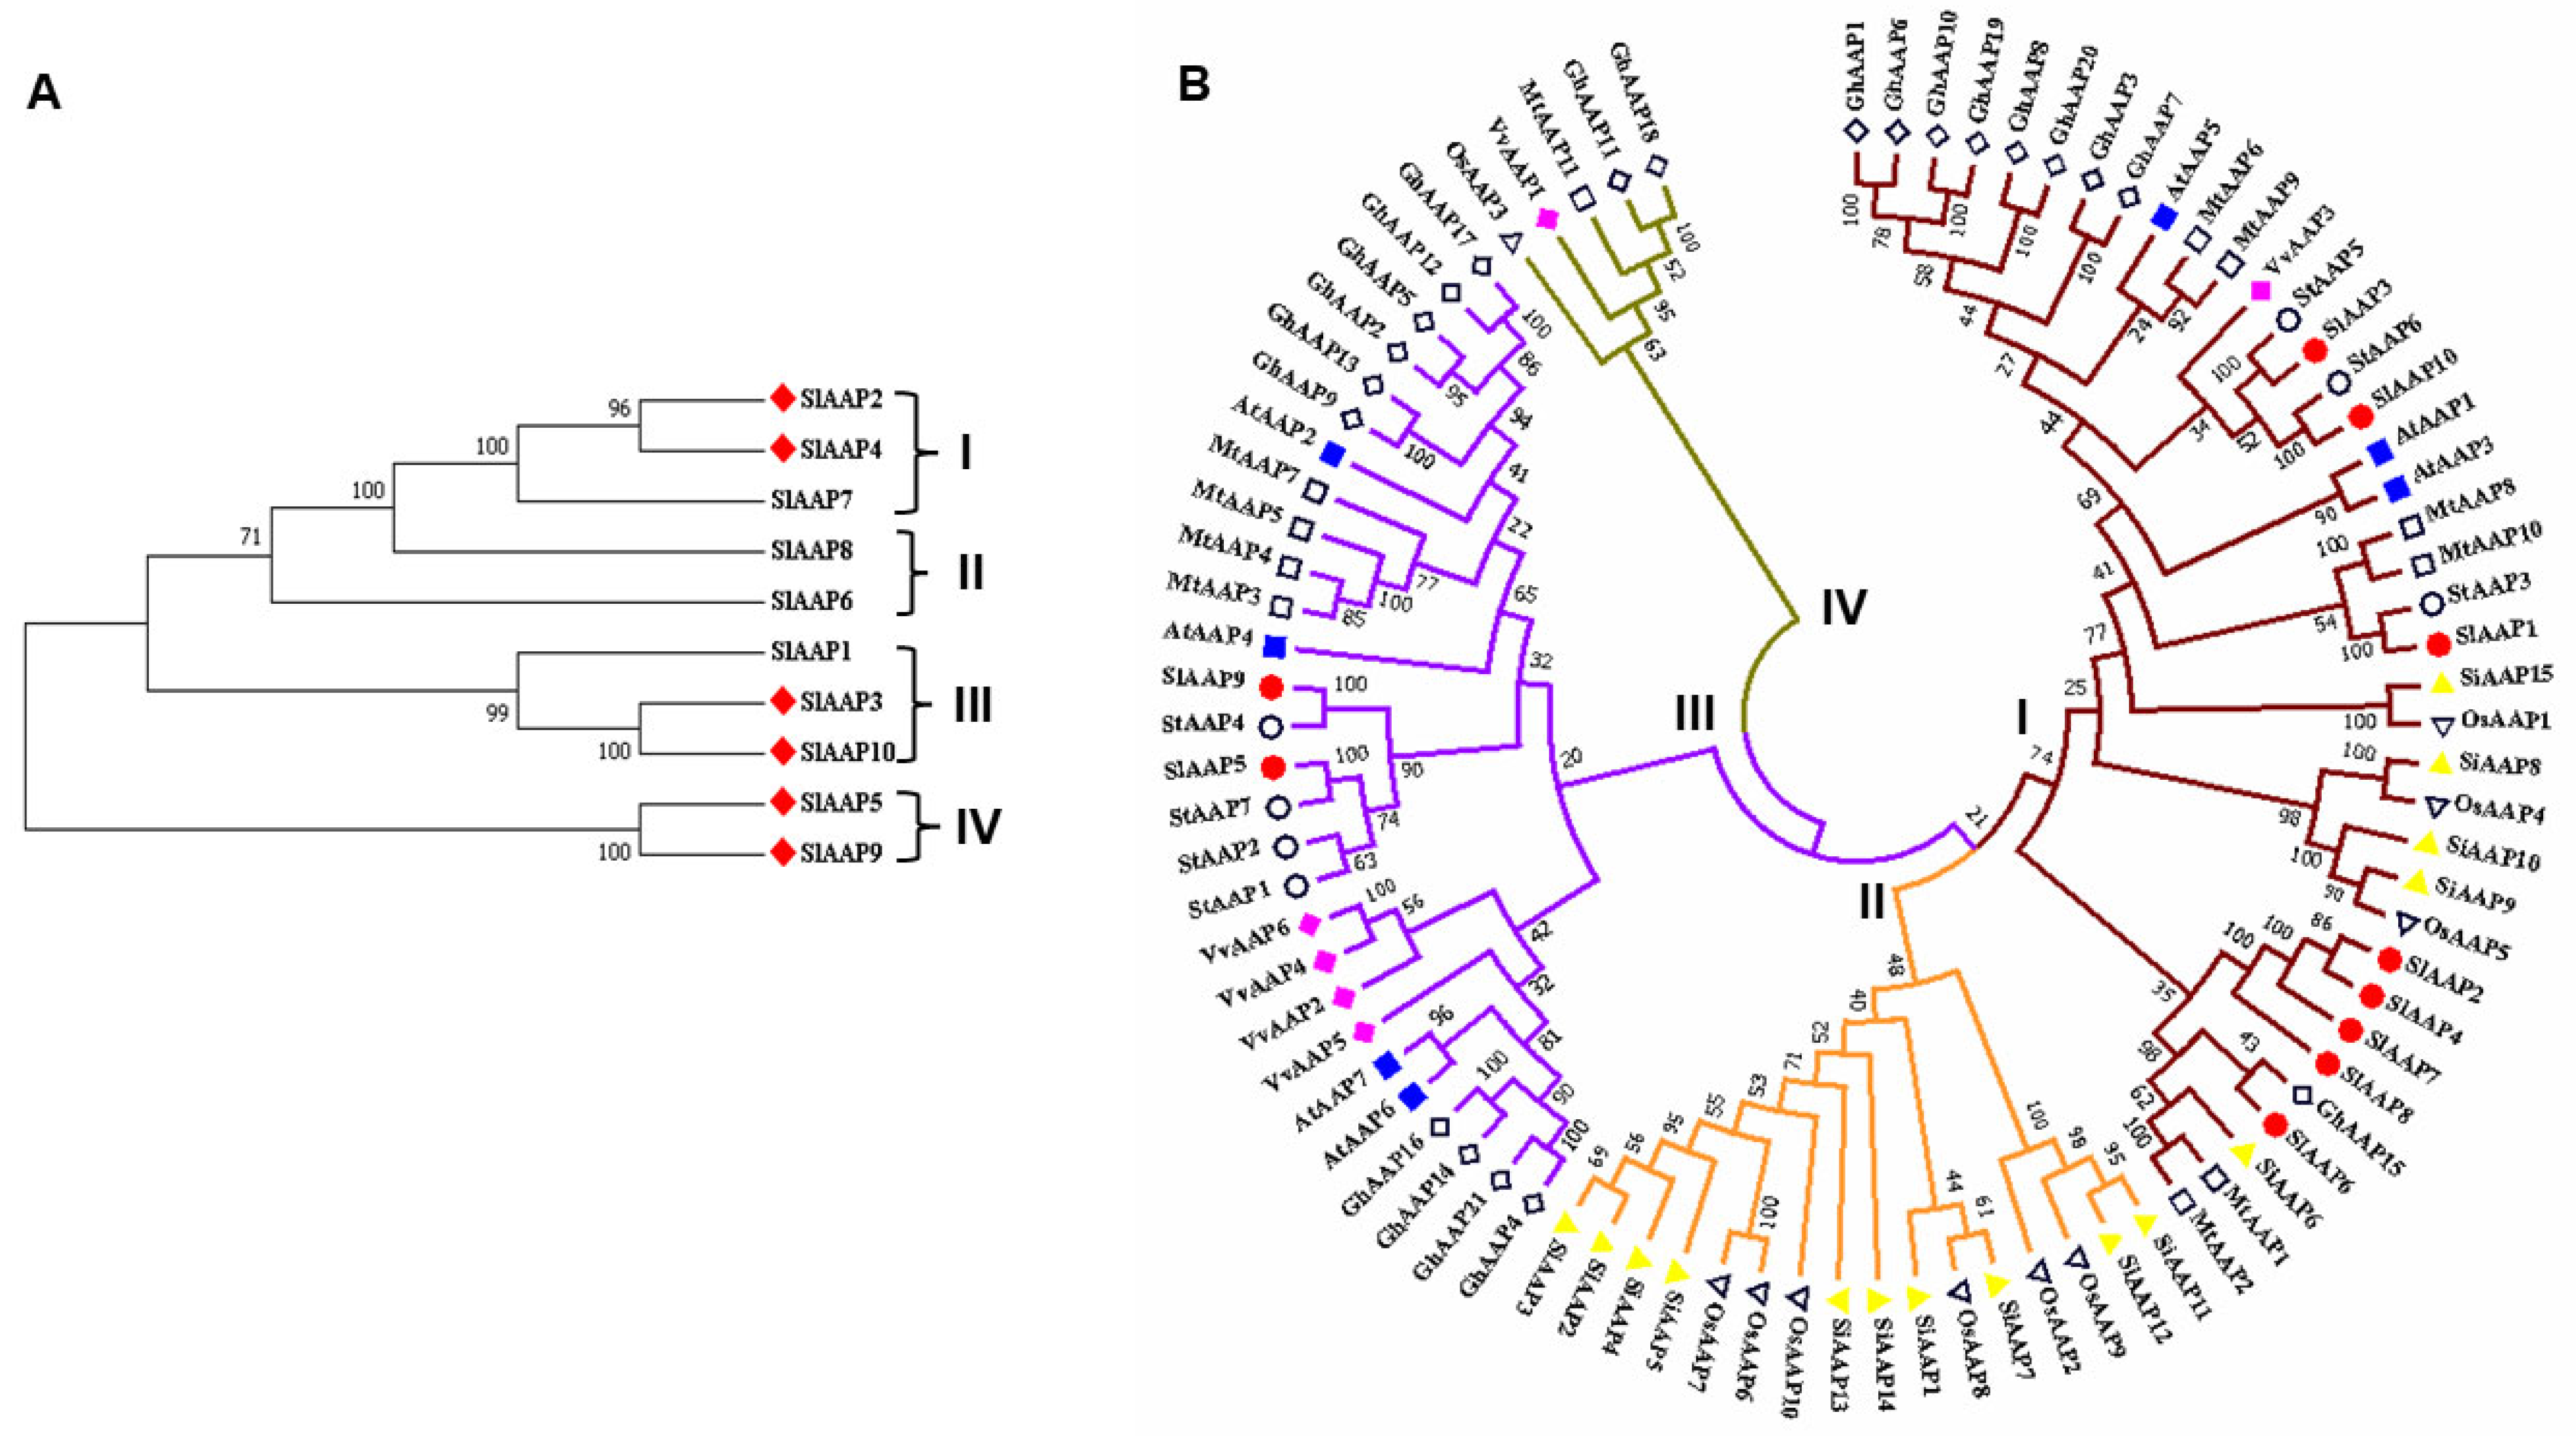
The phylogenetic analysis grouped the SlAAPs into four subfamilies, with subfamilies I-II, and III-IV containing 3, and 2 members, respectively. Furthermore, three gene pairs (SlAAP3–SlAAP10, SlAAP5–SlAAP9, and SlAAP2–SlAAP4) were identified (Figure 5A). The evolutionary relationship among the 10 putative SlAAPs, 7 AtAAPs from Arabidopsis thaliana, 11 MtAAPs from Medicago sativa, 15 SiAAPs from Setaria italica, 10 OsAAPs from Oryza sativa, 6 VvAAPs from Vitis vinifera, 21 GhAAPs from Gossypium hirsutum, and 7 StAAPs from Solanum tuberosum classified the SlAAPs together with these species into four subfamilies (I–IV). Subfamily II and IV contained no SlAAPs, indicating a reduced number of SlAAP members in tomato compared with other plant species, whereas subfamilies I, and III contained 8, and 2 SlAAPs, respectively (Figure 5A,B). Synteny analysis showed that three SlAAP genes are located within conserved genomic blocks, suggesting that they likely originated from ancestral segmental duplication events. Synteny analysis showed that three SlAAP genes are located within conserved genomic blocks, suggesting that they likely originated from ancestral segmental duplication events. This further indicates strong evolutionary conservation and highlights their potential functional importance within the AAP family (Figure S4).
Figure 5.
Phylogenetic relationships among putative AAP proteins in Solanum lycopersicum (A) and comparative evolutionary analysis of SlAAPs with AAPs from cotton (Gossypium hirsutum), millet (Setaria italica), Arabidopsis (Arabidopsis thaliana), Medicago (Medicago truncatula), potato (Solanum tuberosum), grape (Vitis vinifera), and rice (Oryza sativa). Red diamond symbols in panel A represent SlAAP gene pairs. Blue rectangle, red oval, unshaded rectangle, unshaded downward triangle, pink diamond, unshaded diamond, unshaded oval, yellow upward triangle symbols in panel (B) denote AAPs in Arabidopsis, tomato, medicago, rice, grape, cotton, potato, and millet, respectively.
2.2. Motif Features, Conserved Domains and Structure of SlAAPs
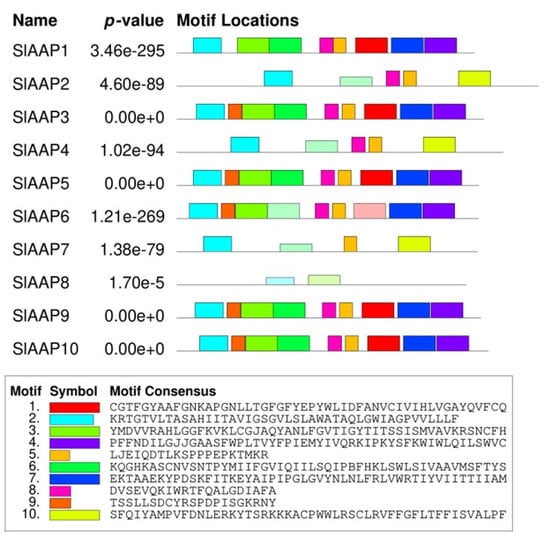
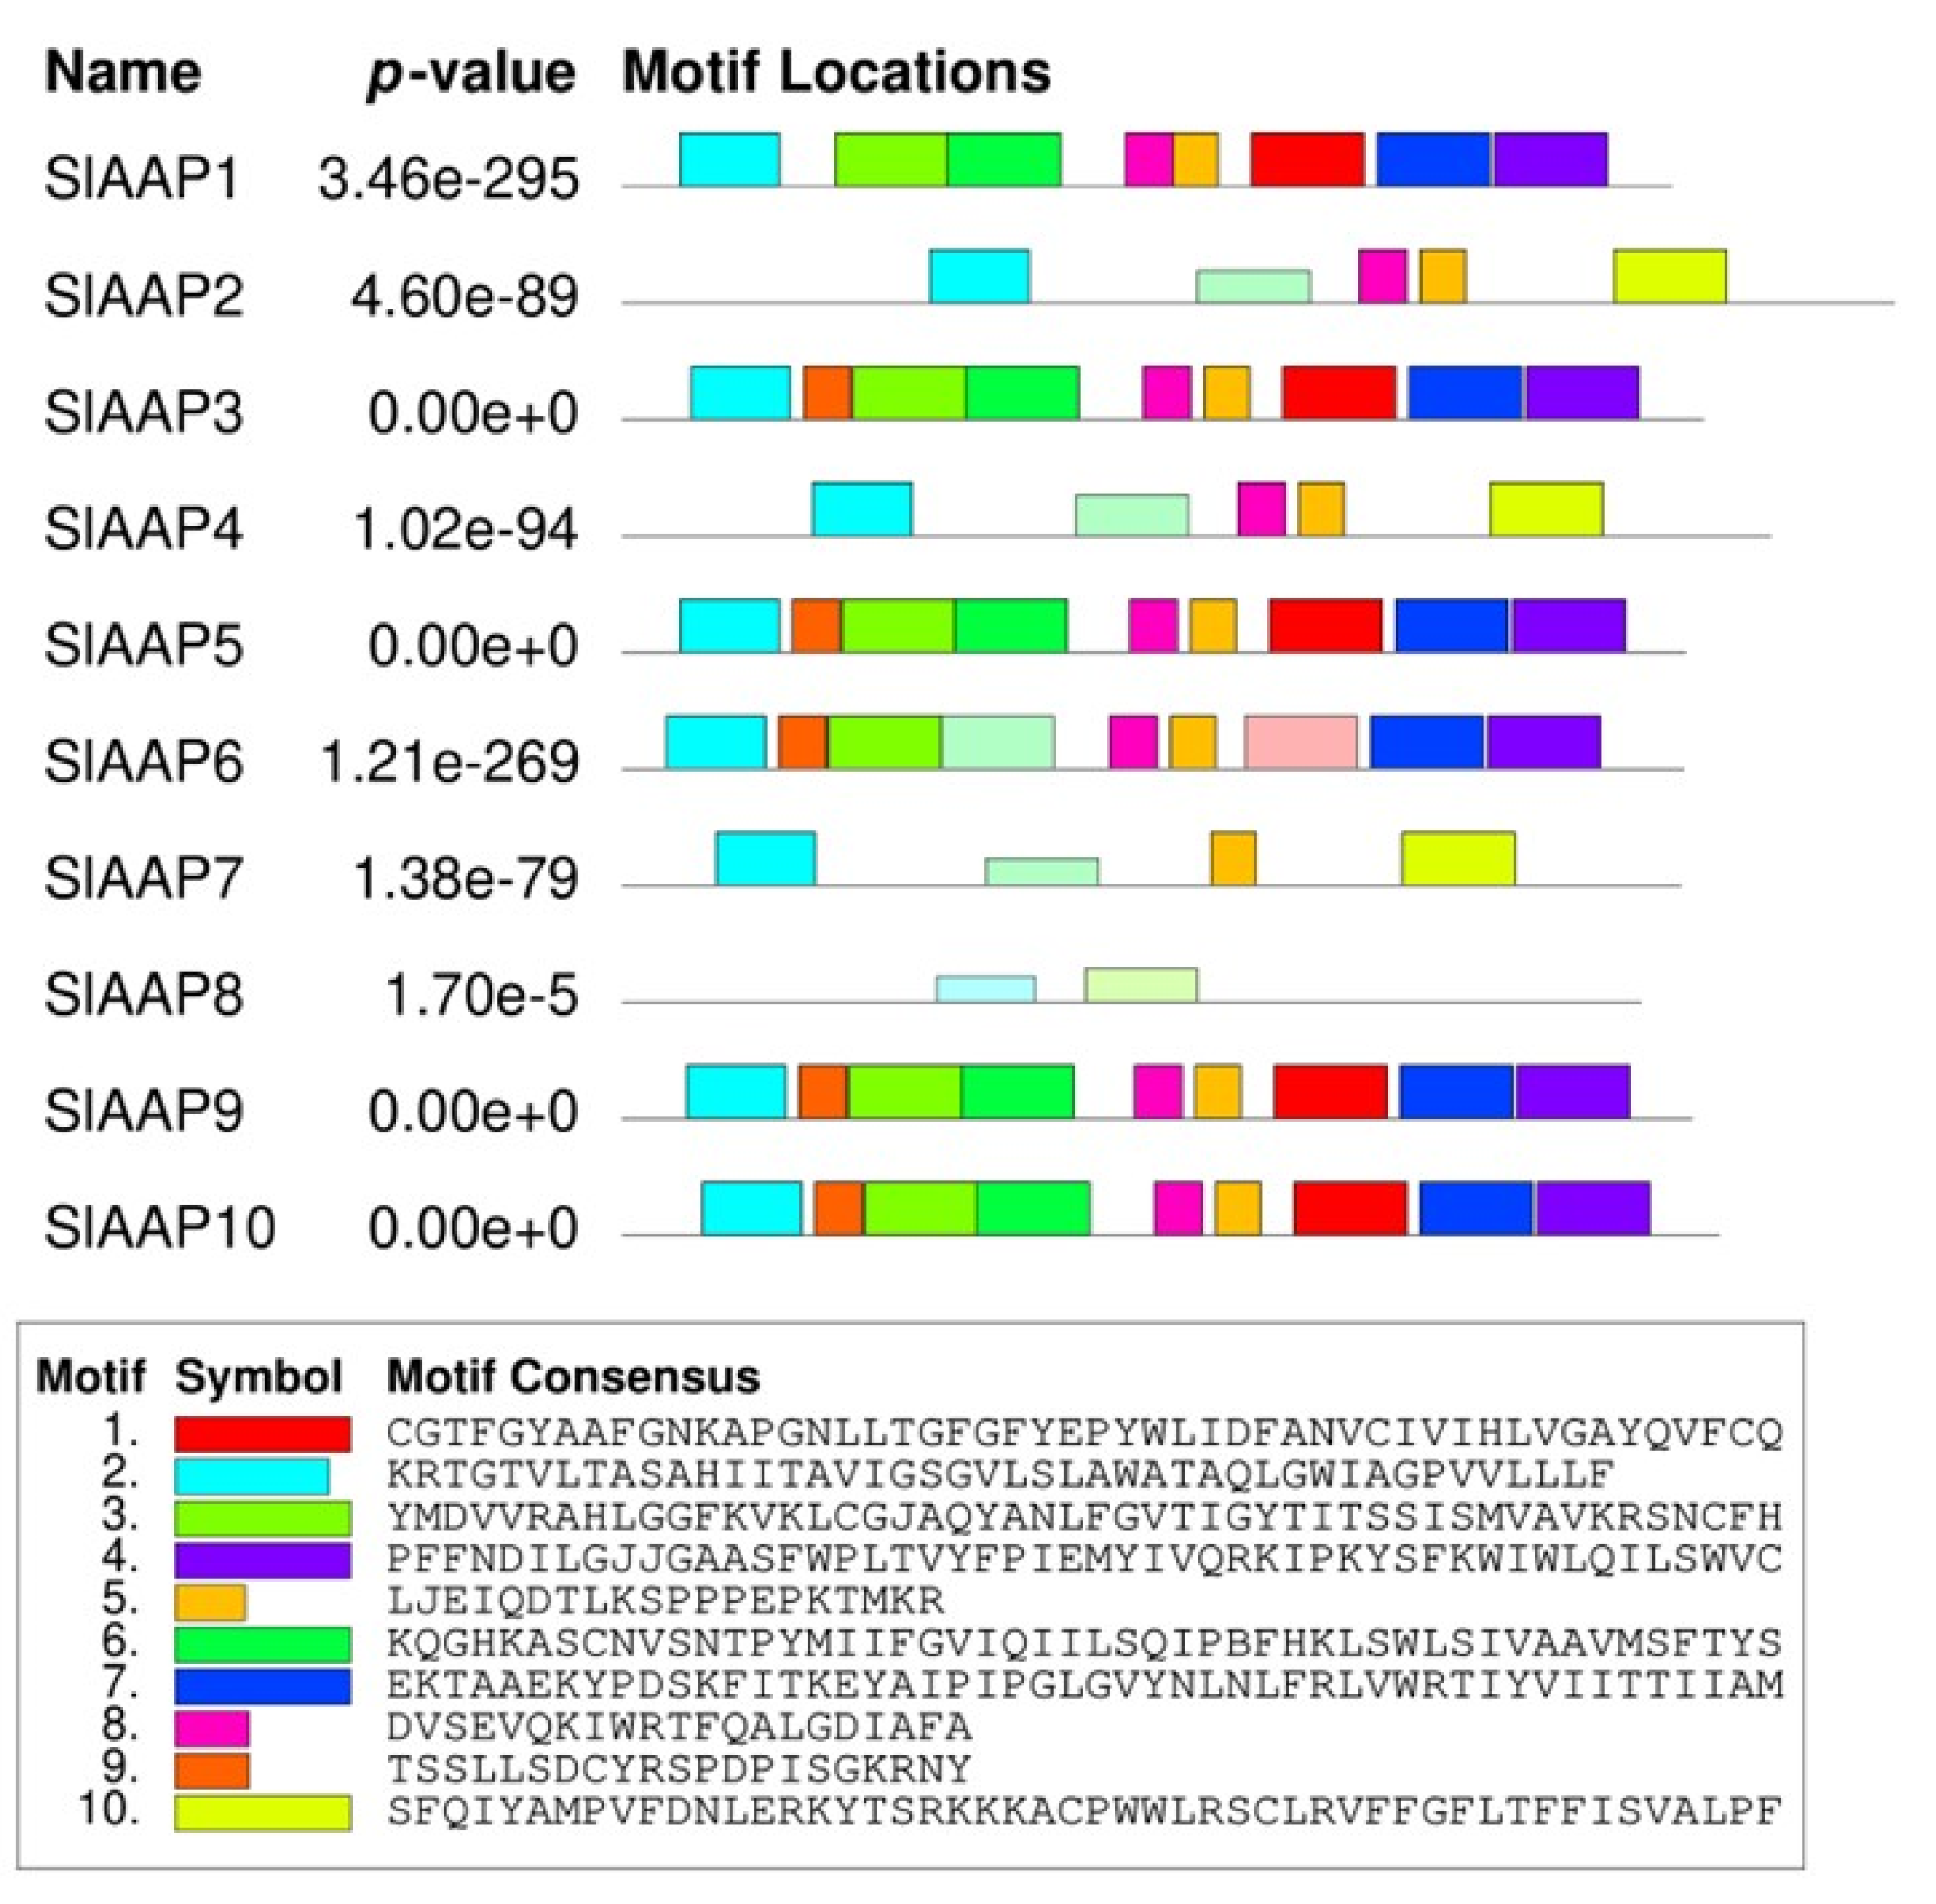
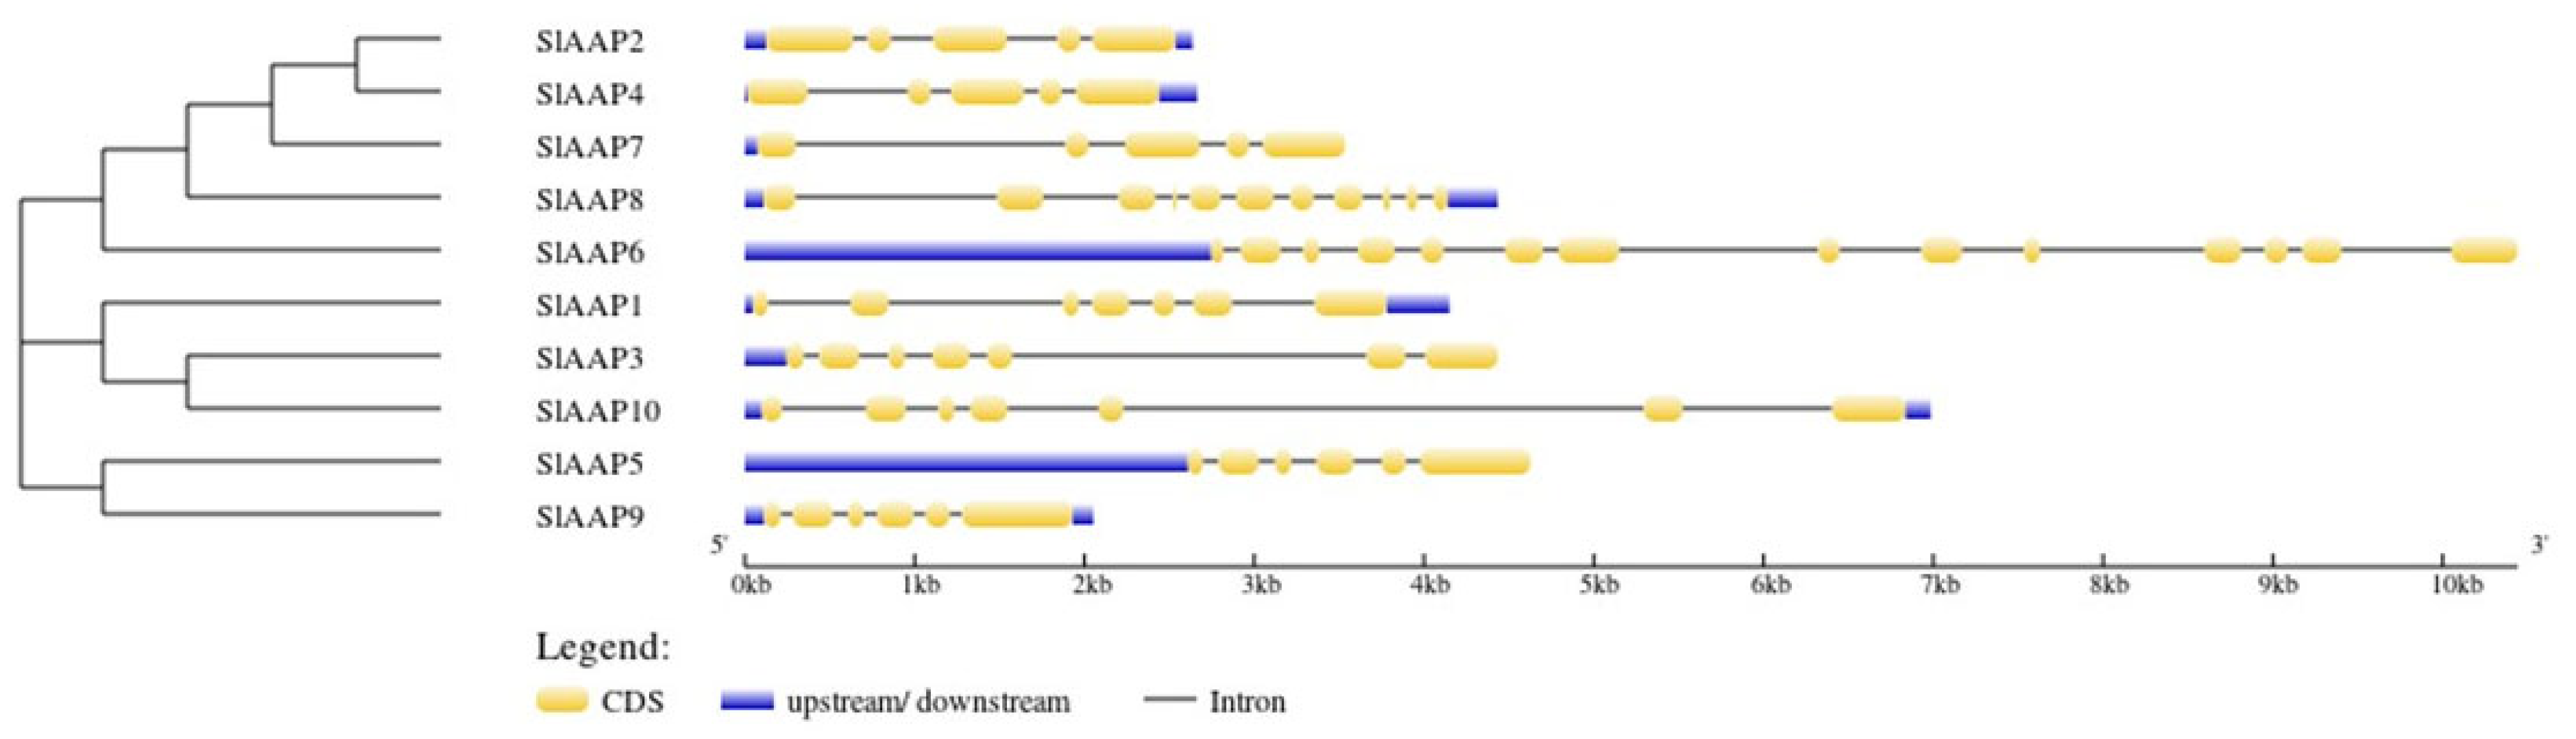
SlAAP contained between two and nine conserved motifs. Motif 2 was present in all members, whereas motifs 1, 3–6, and 8–9 appeared in most SlAAPs (Figure 6). The motifs displayed distinct sequence characteristics, and approximately half corresponded to features associated with transmembrane amino acid transporters (Table S4). SlAAPs belonging to the same phylogenetic subfamily generally shared similar motif profiles, reinforcing the subfamily classifications (Figure 5A). In contrast, clear differences in motif composition were observed among subfamilies, suggesting functional divergence within the SlAAP family (Figure 6; Table S4). Gene structure analysis further separated the SlAAPs into four groups (I–IV), consistent with the phylogenetic analysis. Group I (SlAAP2, SlAAP4, SlAAP7) contained five exons. In Group II, SlAAP8 had 11 exons, whereas SlAAP6 had 14 exons. Group III comprised three members (SlAAP1, SlAAP3, and SlAAP10), each harbouring seven exons, while the Group IV members, SlAAP5 and SlAAP10, had six exons each (Figure 7).
Figure 6.
Conserved motif architecture of tomato AAP proteins. Coloured boxes denote individual motifs, numbered at the bottom of the figure. The width of each box is proportional to the motif length within the corresponding protein sequence.
Figure 7.
Structural organization of SlAAP genes. Coding regions (exons) are shown as yellow boxes, upstream and downstream elements as blue boxes, and introns are represented by the connecting lines between exons.
2.3. Analysis of the Promoters of SlAAPs
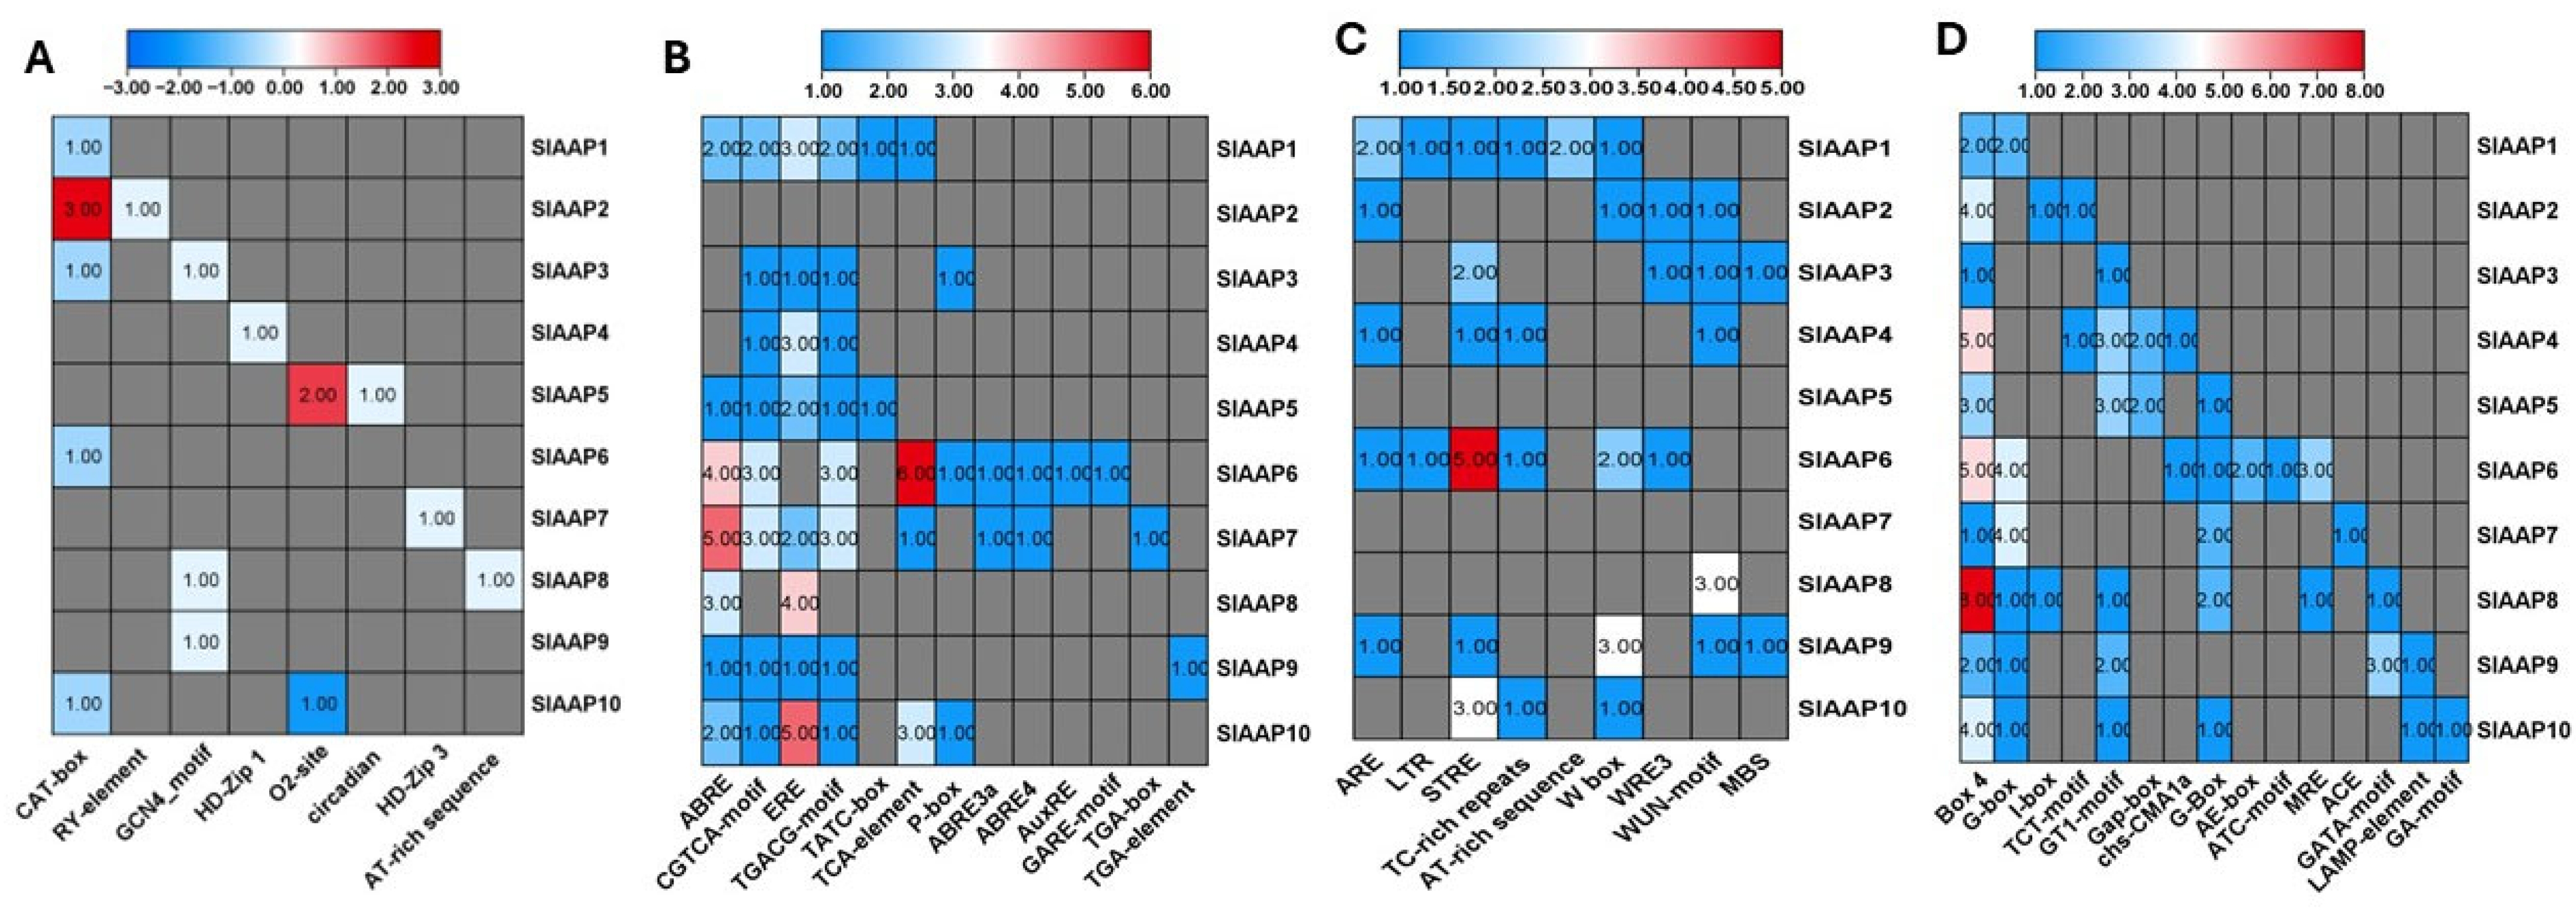
SlAAPs were classified into four distinct categories based on their responsiveness as growth Analysis of cis-acting regulatory elements (CAREs) showed that SlAAPs were associated with four major regulatory categories: growth and development (7%), phytohormone responsiveness (36%), stress responsiveness (19%), and light responsiveness (38%) (Figure 8A–D and Figure S5A). The overall abundance of CAREs varied among genes, ranging from 5% in SlAAP3 to 20% in SlAAP6 (Figure S5B). Growth-related elements were most enriched in SlAAP2, whereas SlAAP6 contained the highest number of phytohormone-, stress-, and light-responsive elements (Figure S5D–F). The identified CAREs included CAT-box and AT-rich sequences for growth and development; ABRE and TGA-element for phytohormone signalling; ARE and WUN-motif for stress responses; and Box 4 and ACE for light responsiveness (Figure 8A–D). Light- and phytohormone-related elements were the most abundant overall, suggesting that SlAAPs may participate in regulatory pathways integrating hormonal cues with environmental signals (Figure 8 and Figure S5).
Figure 8.
Analysis of cis-acting regulatory elements (CAREs) in the promoters of ten SlAAP genes. CAREs related to growth and developmental processes (A), phytohormone regulation (B), stress responsiveness (C), and light-mediated signalling (D) are illustrated.
2.4. Expression Pattern of Putative SlAAPs Under Drought Conditions
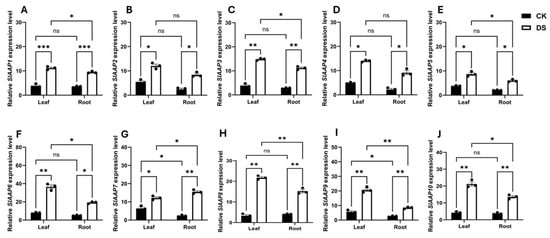
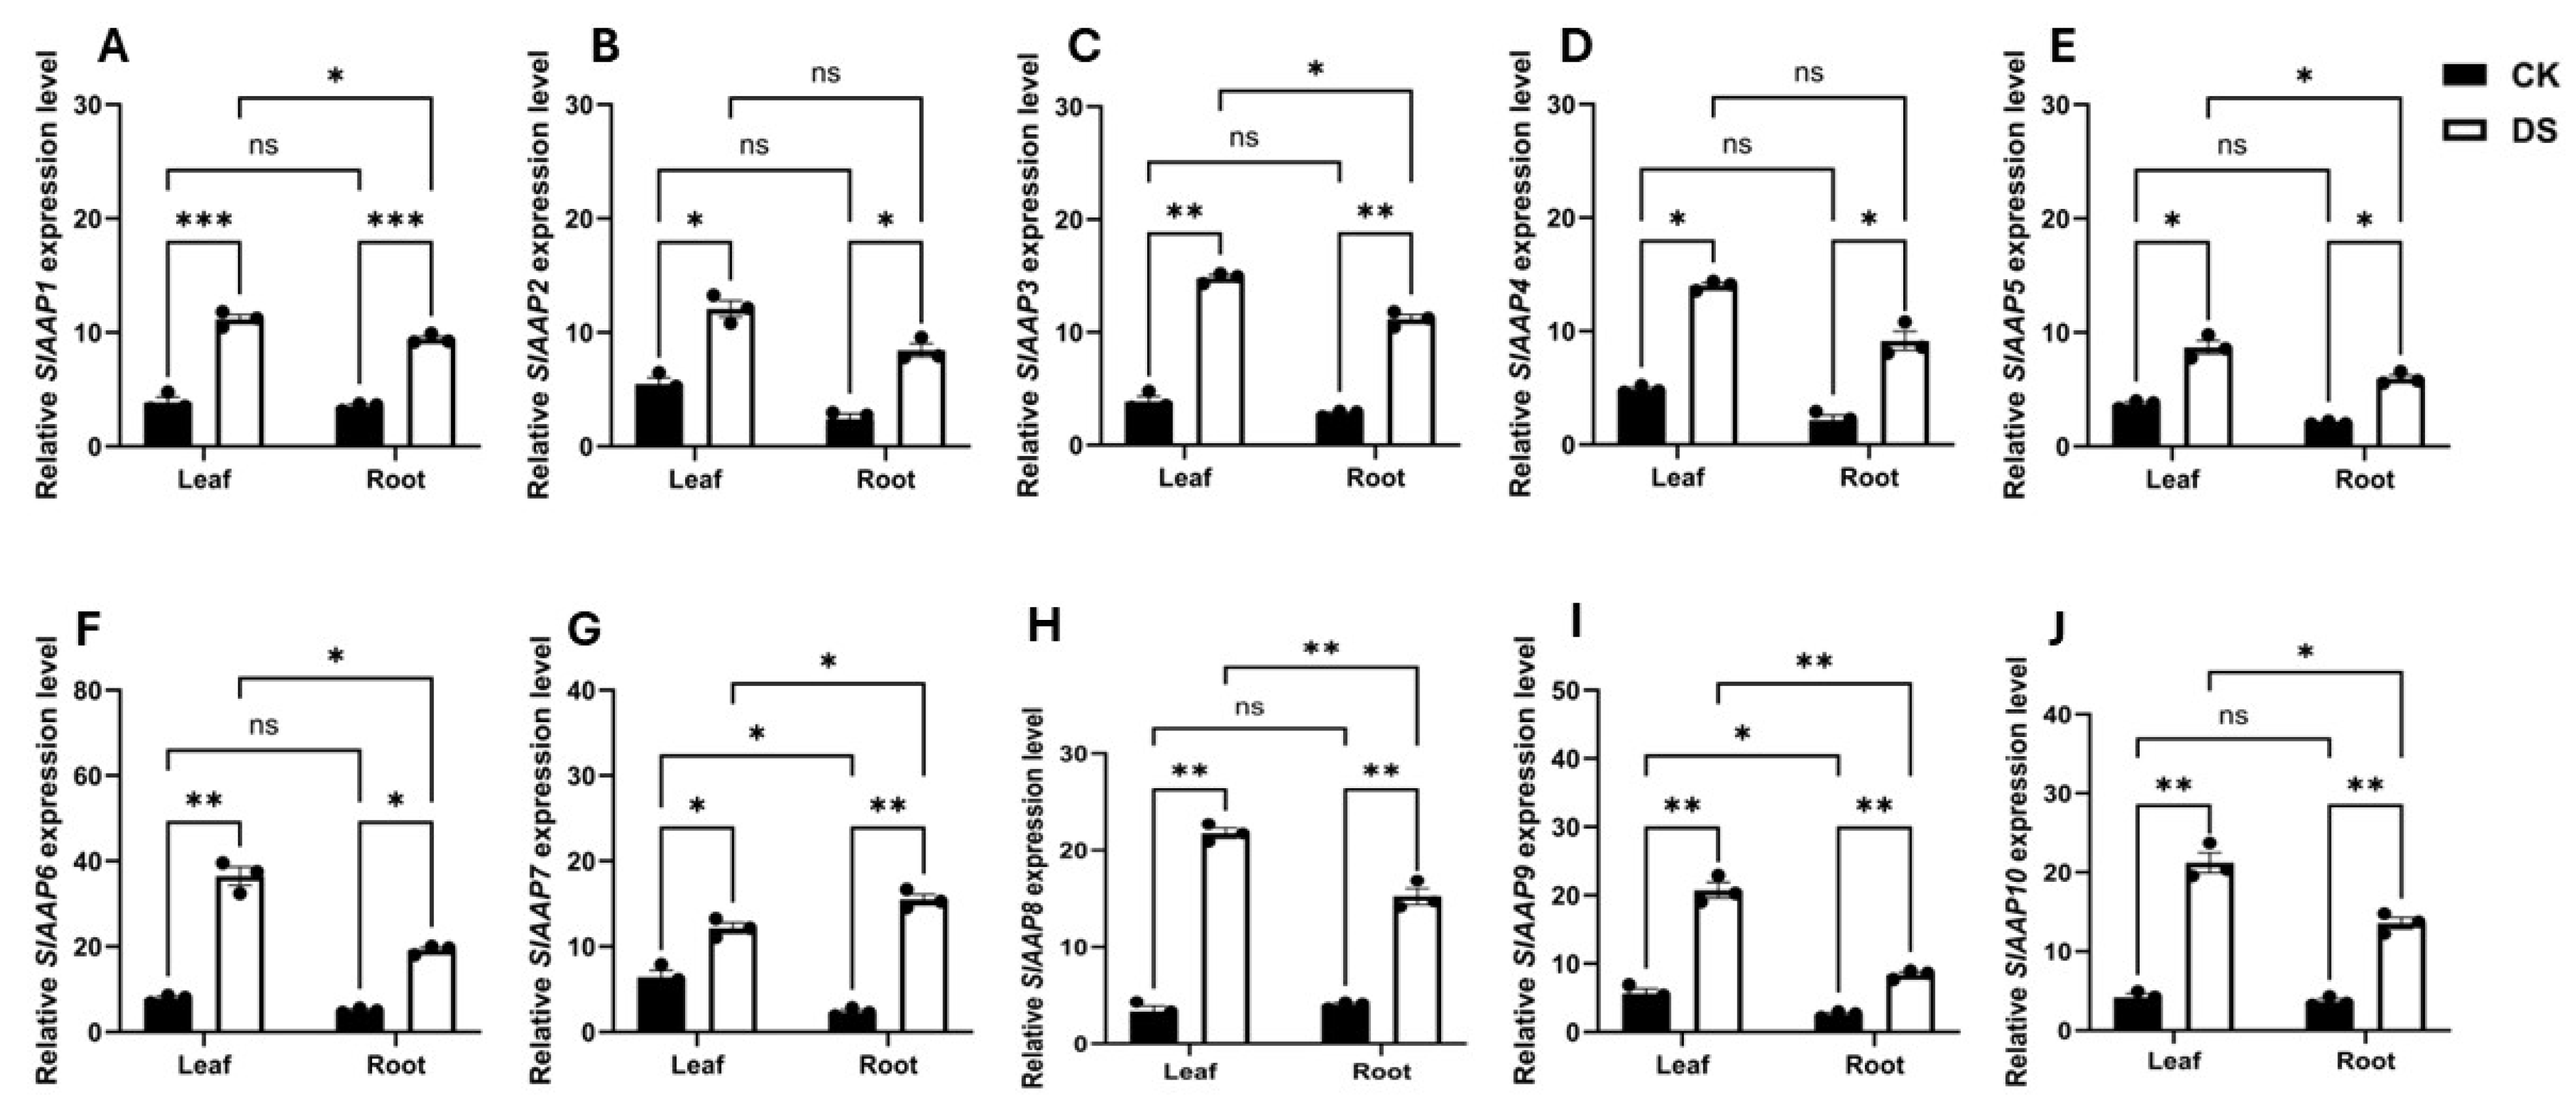
The expression profiles of the putative SlAAP genes were examined using quantitative PCR (qPCR). The results showed that SlAAPs responded differentially to 15 days of drought stress. Relative to the control plants, all genes were upregulated under drought conditions, with expression levels ranging from 1.8-fold (SlAAP7) to 8-fold (SlAAP8) in the leaves and from 2.6-fold (SlAAP1) to 6.8-fold (SlAAP7) in the roots (Figure 9A–J). Under drought stress, multiple SlAAP genes were upregulated in leaves (Figure 9). Among them, SlAAP8, SlAAP9, and SlAAP10 showed the highest induction levels, with transcript abundance increasing by approximately 20-fold relative to the control. In contrast, SlAAP7 exhibited a comparatively smaller change in expression, while several other SlAAP genes also displayed elevated expression levels under drought conditions. Collectively, the results indicate that drought-induced transcriptional responses in leaves vary among SlAAP family members, with SlAAP8, SlAAP9, and SlAAP10 showing the most pronounced increases.
Figure 9.
Expression profiles of ten putative SlAAP genes under drought stress. Panels (A–J) show the relative expression of SlAAP1–SlAAP10 in leaf and root tissues of tomato seedlings after 15 days of drought treatment. Data are presented as mean ± SD from three biological replicates. Statistical significance was assessed using two-way ANOVA followed by Tukey’s HSD test. Symbols (*, **, ***) and ns denote significance at p ≤ 0.05, 0.01, 0.001, and non-significant differences, respectively. CK and DS indicate control and drought stress treatments.
Drought stress significantly increased the accumulation of total amino acids, proline, and ammonium (NH4+) in both leaves and roots of drought-stressed (DS) plants, while total nitrogen and nitrate (NO3−) concentrations declined compared with control (CK) plants (Figure 10). Pearson’s correlation analysis revealed strong positive associations between total amino acid content and the expression of the putative SlAAPs in both tissues. In the leaves, correlation coefficients ranged from r = 0.85 for SlAAP9 to r = 0.98 for SlAAP6, whereas in the roots, correlations ranged from r = 0.91 for SlAAP4 to r = 0.96 for SlAAP3 (Table S4). These strong correlations suggest that SlAAP expression is closely linked to drought-induced amino acid accumulation and may contribute to nitrogen remobilization and stress adaptation in tomato.
Figure 10.
Effect of drought stress on the total amino acid (A), nitrogen (B), proline (C), ammonium (D) and nitrate (E) concentrations in the leaf and root of tomato seedlings after 15 days of drought treatment. Data are presented as mean ± SD from three biological replicates. Statistical significance was assessed using two-way ANOVA followed by Tukey’s HSD test. Symbols (*, **, ***, ****) and ns denote significance at p ≤ 0.05, 0.01, 0.001, 0.0001 and non-significant differences, respectively. CK and DS indicate control and drought stress treatments.
3. Discussion
3.1. Characterization of the SlAAP Family in S. lycopersicum
AAP family members have been identified and characterized in a range of plant species, including tea (Camellia sinensis), rapeseed (Brassica napus), maize (Zea mays), cotton (Gossypium hirsutum), soybean (Glycine max) and grape (Vitis vinifera), where they contribute to amino acid transport, nitrogen redistribution, and stress responses [5,23,24,30,31,32]. Despite this broad characterization, their functions in Solanum lycopersicum remain largely unelucidated. In this study, ten AAPs were identified in tomato, a number lower than that reported in many other plant genomes [5,23,24,30,31,32]. Similar reductions in gene family size have been attributed to lineage-specific gene loss or the elimination of redundant paralogs following whole-genome duplication events [33]. This pattern suggests that S. lycopersicum may have undergone selective retention of only those AAP transporters essential for its physiological and ecological requirements, while dispensable duplicates were removed through purifying selection. Such evolutionary contraction has been observed in other Solanaceae gene families and may reflect functional refinement of the remaining SlAAPs to support tomato-specific growth, developmental, and stress-responses [33,34].
The phylogenetic analysis reinforces this interpretation, as the SlAAPs clustered into subfamilies I, II, and III, with no members assigned to subfamily IV (Figure 5B). The absence of subfamily IV in tomato suggests that the regulatory or transport functions associated with this lineage may be dispensable in S. lycopersicum, potentially replaced by alternative mechanisms that have evolved within Solanaceae. Similar patterns of lineage-specific gene loss and contraction have been documented in other Solanaceae gene families [35,36], where genome fractionation and selective retention have produced smaller yet more functionally specialized repertoires. These evolutionary trends support the idea that the reduced SlAAPs complement reflects functional refinement of the retained transporters to meet tomato-specific requirements for growth, development, and stress adaptation. Consistent with this, the synteny analysis identified three SlAAP pairs (Figure S4), indicating that only limited duplication events contributed to the current family structure, with retained paralogs likely preserving essential roles while redundant copies were lost [34]. Structural analysis of the SlAAP genes revealed significant variation in exon–intron organization among family members (Figure 9). While several phylogenetic subfamilies displayed comparable exon–intron architectures, variation in exon number was also evident within certain groups. For instance, members of Group II differed in exon number despite clustering together phylogenetically. However, the overall conservation of gene structure features within subfamilies, such as exon arrangement and intron distribution, supports their shared evolutionary origin and suggests partial structural conservation during SlAAP gene family diversification [37]. Conversely, the structural divergence observed between subfamilies suggests potential functional specialization, supporting the hypothesis that different SlAAP groups have adapted to distinct physiological functions in tomato. This pattern aligns with broader evidence that exon–intron architecture contributes to regulatory complexity, expression divergence, and functional diversification in plant transporter families [38].
The promoter analysis revealed a diverse array of cis-acting regulatory elements (CAREs) associated with growth and development, phytohormone signalling, stress responses, and light regulation (Figure 8). The presence of these elements suggests that SlAAPs are embedded within broader regulatory networks and may participate in coordinating metabolic and stress-responsive pathways, particularly under drought conditions. Notably, the high abundance of STRE (stress-responsive elements) and TC-rich repeats, which are shown as regulators of defence and abiotic stress tolerance [39,40], indicates that several SlAAPs may be transcriptionally activated during environmental stress. This finding is consistent with the physiological data, where drought stress markedly increased total amino acids, proline, and ammonium in both leaves and roots, while total nitrogen and nitrate levels declined (Figure 10). Similar metabolic patterns have been widely reported in drought-stressed plants, where enhanced amino acid and proline accumulation serves as an osmoprotective strategy, stabilizing cellular structures and maintaining redox balance [41]. In parallel, reduced nitrate (NO3−) availability and increased ammonium (NH4+) often reflect impaired nitrate uptake and assimilation under water deficit, leading to shifts in nitrogen partitioning and enhanced remobilization from protein turnover [42]. AAPs are known to play key roles in reallocating nitrogenous compounds during stress, facilitating the movement of amino acids from source to sink tissues and supporting osmotic adjustment and metabolic resilience [42,43]. Thus, the presence of stress- and hormone-responsive CAREs in SlAAP promoters, together with the observed drought-induced changes in N metabolites, suggests that SlAAPs may participate in coordinating N redistribution and osmoprotectants accumulation during drought adaptation in tomato.
3.2. The Expression Patterns of SlAAPs Under Drought Stress
The expression patterns of the SlAAPs provide important insight into their physiological roles under drought stress. SlAAP6 was strongly induced in the leaves, whereas SlAAP7 showed marked upregulation in the roots of S. lycopersicum under drought stress (Figure 9). Similar drought-responsive induction of AAPs has been shown wheat and maize, where these transporters facilitate amino acid redistribution and cellular adjustment, thereby contributing to enhanced drought tolerance [9,31]. The positive correlation observed between amino acid accumulation and the expression of the putative SlAAPs further supports the hypothesis that these transporters participate in drought-induced osmoregulation (Table S4). Interestingly, drought stress led to substantial increases in total amino acids, proline, and ammonium in both leaves and roots, while total nitrogen and nitrate levels declined (Figure 10). These metabolic shifts are characteristic of drought-stressed plants, where amino acids, particularly proline, accumulate as osmoprotectants to stabilize proteins, maintain redox balance, and protect cellular structures [21]. Similarly, reduced nitrate and increased ammonium often reflect impaired nitrate uptake and assimilation under water deficit, leading to enhanced N remobilization from protein turnover [44]. Given the roles of AAPs in long-distance amino acid transport and N partitioning [15], the coordinated upregulation of SlAAP6 and SlAAP7 possibly reflects an adaptive mechanism that reallocates nitrogenous solutes to tissues where osmotic adjustment is most critical. Together, these findings suggest that specific SlAAPs members have evolved tissue-specialized functions that support metabolic resilience and nitrogen economy during drought stress in tomato.
4. Materials and Methods
4.1. Plant Materials and Drought Treatment
Seeds of the commercial tomato cultivar Minichal [45], were used in this study. Seeds were surface sterilized by immersion in 70% ethanol for 2 min, rinsed with distilled water, and then treated with 8% sodium hypochlorite for 5 min. Afterward, they were washed three times with deionized water. Ten sterilized seeds were sown per pot in 12-inch earthen pots filled with Sunshine Mix No. 2 (Sungro Horticulture, Agawam, MA, USA) and maintained under controlled growth conditions: a 16 h/8 h day/night cycle, day and night temperatures of 25 °C and 22 °C, relative humidity of 80%, and photosynthetically active radiation of 600 µmol m−2s−1. After 15 days (d), seedlings were thinned to three plants per pot. Plants were irrigated every alternate day with 100 mL of full-strength Hoagland nutrient solution with 2.5 mM NH4NO3. Two treatment groups were established. Control plants were maintained °C and watered daily with Hoagland solution. Drought stress was imposed by withholding water for 15 d. Leaf and root tissue samples were collected at 15 d after treatment (DAT). Independent biological replicates of plants under control and drought stress treatments were sampled for metabolite and transcriptional analysis. Samples were immediately frozen in liquid nitrogen (N2) and stored at 80 °C for subsequent experiments.
4.2. Assays for Physio-Biochemical Indicators, RNA Isolation and Gene Expression Analysis
Total amino acid content was determined as described by [44]. Briefly, frozen leaf and root tissues (100 mg) were homogenized in 10 mL of 3% (v/v) aqueous sulfosalicylic acid. After filtering the homogenate, 1 mL of filtrate was combined with 1 mL of glacial acetic acid and 1 mL of acidic ninhydrin. The resulting mixture was incubated at 100 °C for 1 h and then cooled on ice for 20 min before being extracted with 1 mL of toluene. The concentrations of amino acids were measured using a UV–Vis spectrophotometer (Shimadzu, Tokyo, Japan) at A580 nm. Leaf and root total protein content was estimated using the Bradford Protein Assay [46] following manufacturer’s protocol (Bio-Rad, South Granville, Australia).
Total nitrogen (N) content was determined using the Kjeldahl method as described by [47], with minor modifications. A 0.1 g sample of plant tissue was digested with 0.5 mL of concentrated H2SO4 and 0.5 mL of a catalyst mixture consisting of 10 g of K2SO4 and 1 g of CuSO4. The mixture was heated at 100 °C for 60 min on a heating block in a fume hood. After digestion, the samples were allowed to cool, and 0.5 mL of 40% NaOH solution was slowly added, followed by 0.5 mL of distilled water. Subsequently, 1 mL of the resulting mixture was combined with 1 mL of Nessler’s reagent and incubated for 10 min at room temperature. The absorbance was measured at 420 nm using a UV–Vis spectrophotometer (Shimadzu, Tokyo, Japan). Total N content was determined from a standard curve generated with (NH4)2SO4 standards.
Proline content was measured using the ninhydrin method described by [21]. Each 0.1 g tissue sample was homogenized in 1 mL of 3% sulfosalicylic acid. After centrifugation at 12,000× g for 10 min, 0.5 mL of the supernatant was added to a mixture of 0.5 mL of glacial acetic acid and 0.5 mL ninhydrin solution. The mixture was boiled at 100 °C for 30 min and quickly cooled on ice for 20 min, followed by the addition of 1 mL of toluene, extraction of the organic phase, and reading of the absorbance at 520 nm using a UV–Vis spectrometer (Shimadzu, Tokyo, Japan). The proline concentration was determined using a calibration curve and expressed as μmol g FW−1.
Nitrate (NO3−) and ammonium (NH4+) were extracted from 100 mg of dried plant material using 1 mL of water. NO3− content was quantified using a colorimetric method based on the reduction of NO3− to NO2− by Vanadium (III), as adapted from [48]. NH4+ levels were measured using the ‘Ammonium Assay Kit’ from Sigma-Aldrich (St. Louis, MO, USA, cat#AA0100), in accordance with the manufacturer’s instruction.
Total RNA was isolated from the leaves and root tissue using the TRIzol RNA Isolation Reagents (Invitrogen, Carlsbad, CA, USA) following the manufacturer’s protocol. RNA quantity and integrity were assessed by measuring the optical density at 260 nm and through 1.0% (w/v) agarose gel electrophoresis, respectively. Subsequently, 1 μg of total RNA was reverse-transcribed into single-stranded cDNA using the iScript™ RT Reagent Kit (Bio-Rad, Hercules, CA, USA) according to the manufacturer’s instructions. Quantitative real-time polymerase chain reaction (qPCR) was performed using the CFX 96 Real-Time System (Bio-Rad, Richmond, CA, USA) with SYBR Green fluorescence (Bio-Rad, Richmond, CA, USA). The ΔΔCT method was used for data analysis. Gene-specific primers (Table S5) were used to assess their expression patterns under drought stress condition. The thermal cycling conditions consisted of an initial denaturation step at 95 °C for 5 min, followed by 40 cycles of 95 °C for 15 s, 55 °C for 15 s, and 72 °C for 30 s. All experiments were conducted with three biological replicates, and relative transcript levels were normalized using SlActin and SlUBQ as internal controls.
4.3. Statistical Analysis
Data was analyzed using one way ANOVA in R version 4.4.2. Tukey multiple comparison tests were applied at a significance threshold of p ≤ 0.05. ****, ***, **, * denote significance at 0.0001, 0.001, 0.01 and 0.05 probability levels, while ns denotes no significance, respectively. Values are presented as mean ± standard deviation of three biological replicates. Graphs were generated using GraphPad Prism version 10.4, and Pearson correlation matrices were produced in R (v4.5.2).
4.4. Identification of SlAAP Genes in Tomato
Whole genome data for Solanum lycopersicum version 5.0 was downloaded from the Phytozome 13 database (https://phytozome-next.jgi.doe.gov/, accessed on 20 November 2025). The Pfam hidden Markov model for the AA permease domain (PF02458) was used to search the tomato protein database with an E value threshold of 1 × 10⁻⁵ (http://pfam.xfam.org/, accessed on 20 November 2025). Ten putative AAP proteins were identified. Protein sequences from Arabidopsis thaliana, Gossypium hirsutum, Seteria italica, Medicago sativa, Solanum tuberosum, Vitis Vinifera and Oryza sativa were used in BLAST searches to confirm orthology through the Phytozome 13 database (https://phytozome-next.jgi.doe.gov/, accessed on 20 November 2025). Genes were named SlAAP1 to SlAAP10 based on chromosomal position. Conserved domains were verified using the NCBI CDD database (https://www.ncbi.nlm.nih.gov/Structure/cdd/wrpsb.cgi, accessed on 20 November 2025). Physicochemical properties including molecular weight and isoelectric point were predicted using ProtParam (https://web.expasy.org/protparam/, accessed on 20 November 2025). Transmembrane domains were identified using TMHMM version 2 (https://services.healthtech.dtu.dk/services/TMHMM-2.0/, accessed on 20 November 2025), and subcellular localization was predicted using TargetP 2.0 (https://services.healthtech.dtu.dk/services/TargetP-2.0/, accessed on 20 November 2025).
4.5. Sequence Alignment, Gene Structure, Conserved Motifs and Phylogeny
Multiple sequence alignment and identity matrices were generated using BioEdit version 7.2.5 [49]. Gene structures were visualized using GSDS 2.0 (https://gsds.gao-lab.org/, accessed on 20 November 2025). Conserved motifs were identified using MEME version 5.5.9 (https://meme-suite.org/meme/tools/meme, accessed on 20 November 2025), with a maximum of ten motifs and a motif width of 6 to 200 amino acids. Chromosomal mapping and duplication analysis were performed using TBtools software (v1.09867) [50]. Phylogenetic analysis of AAP proteins from tomato and other species was conducted using MUSCLE 3.8 for alignment [51] and MEGA10 for maximum likelihood tree construction with 1000 bootstrap replicates [52].
4.6. Cis-Regulatory Elements and Protein Modelling
Promoter regions were defined as the 2000 base pair sequence upstream of each gene and extracted using SAM tools [53]. Cis-acting regulatory elements were identified using the Plant CARE database (http://bioinformatics.psb.ugent.be/webtools/plantcare/html/, accessed on 20 November 2025). Three-dimensional structures of representative AAP proteins were modelled using the Phyre2 server (https://www.sbg.bio.ic.ac.uk/phyre2/html/page.cgi?id=index, accessed on 20 November 2025).
5. Conclusions
Collectively, this study identified 10 SlAAPs in the tomato genome and grouped them into four distinct subfamilies. The expression profiles of eight representative SlAAPs were examined, together with their relationships to key physiological and biochemical indicators under drought stress. Transcript analysis revealed substantial shifts in the expression levels of these genes, with most showing strong and differential induction in response to drought. Among them, SlAAP8 (subfamily II), SlAAP9 (subfamily IV) and SlAAP10 (subfamily III) displayed the most pronounced upregulation under stress conditions. These results provide an important foundation for advancing our understanding of the molecular roles of SlAAP genes in drought response in tomato, a crop of major global significance.
Supplementary Materials
The following supporting information can be downloaded at: https://www.mdpi.com/article/10.3390/stresses6010007/s1, Figure S1: Multiple sequence alignment of SlAAP proteins. Alignment of AAP domain of 10 AAP proteins in Solanum lycopersicum, with conserved amino acids coloured differently; Figure S2: Transmembrane domain (TMDs) of amino acid permease (AAP) proteins identified in Solanum lycopsersicum; Figure S3: Domain pattern of amino acid permease (AAP) proteins identified in Solanum lycopsersicum; Figure S4: Synteny relationships among putative AAPs identified in the tomato genome. Coloured lines highlight the duplicated gene pairs detected across chromosomal regions; Figure S5: Cis acting regulatory element (CARE) profiling in the promoter regions of ten SlAAP genes. (A) Functional classification of identified CAREs. (B) Total CARE counts across SlAAP promoters. (C–F) CAREs involved in growth and developmental regulation (C), phytohormone responsiveness (D), stress related signalling (E), and light mediated pathways (F); Table S1: General information about putative AAPs in Solanum lycopresicum; Table S2: Secondary structure of AAPs identified in tomato; Table S3: Motif features in SlAAPs; Table S4: Pearson’s correlation analysis between total amino acid and putative SlAAPs expression; Table S5: List of genes studied.
Funding
This research received no external funding.
Institutional Review Board Statement
Not applicable.
Informed Consent Statement
Not applicable.
Data Availability Statement
The original contributions presented in this study are included in the article/Supplementary Materials. Further inquiries can be directed to the corresponding author.
Conflicts of Interest
The author reports no conflicts of interest for the study.
References
- Trovato, M.; Funck, D.; Forlani, G.; Okumoto, S.; Amir, R. Amino acids in plants: Regulation and functions in development and stress defense. Front. Plant Sci. 2021, 12, 772810. [Google Scholar] [CrossRef] [Scilit]
- Homyak, P.M.; Slessarev, E.W.; Hagerty, S.; Greene, A.C.; Marchus, K.; Dowdy, K.; Iverson, S.; Schimel, J.P. Amino acids dominate diffusive nitrogen fluxes across soil depths in acidic tussock tundra. New Phytol. 2021, 231, 2162–2173. [Google Scholar] [CrossRef] [Scilit]
- Tegeder, M.; Masclaux-Daubresse, C. Source and sink mechanisms of nitrogen transport and use. New Phytol. 2018, 217, 35–53. [Google Scholar] [CrossRef] [Scilit]
- Liu, L.; Yu, X.; Yan, Y.; He, C.; Wang, J.; Sun, M.; Li, Y. Amino acid transporters on amino acid absorption, transport and distribution in crops. Horticulturae 2024, 10, 999. [Google Scholar] [CrossRef] [Scilit]
- Guo, X.; He, N.; Huang, B.; Chen, C.; Zhang, Y.; Yang, X.; Li, J.; Dong, Z. Genome-Wide identification and expression analysis of amino acid/auxin permease (AAAP) genes in grapes (Vitis vinifera L.) under abiotic stress and during development. Plants 2025, 14, 128. [Google Scholar] [CrossRef] [Scilit]
- Zhao, C.; Pratelli, R.; Yu, S.; Shelley, B.; Collakova, E.; Pilot, G. Detailed characterization of the UMAMIT proteins provides insight into their evolution, amino acid transport properties, and role in the plant. J. Exp. Bot. 2021, 72, 6400–6417. [Google Scholar] [CrossRef] [Scilit]
- Yao, X.; Nie, J.; Bai, R.; Sui, X. Amino acid transporters in plants: Identification and function. Plants 2020, 9, 972. [Google Scholar] [CrossRef] [Scilit]
- Nayak, I.; Sahoo, B.; Pradhan, C.; Balasubramaniasai, C.; Prabhukarthikeyan, S.R.; Katara, J.L.; Meher, J.; Chung, S.-M.; Gaafar, A.-R.Z.; Hodhod, M.S. Genome-wide analysis of amino acid transporter gene family revealed that the allele unique to the aus variety is associated with amino acid permease 17 (OsAAP17) amplifies both the tiller count and yield in indica rice (Oryza sativa L.). Agronomy 2023, 13, 2629. [Google Scholar] [CrossRef] [Scilit]
- Tian, R.; Yang, Y.; Chen, M. Genome-wide survey of the amino acid transporter gene family in wheat (Triticum aestivum L.): Identification, expression analysis and response to abiotic stress. Int. J. Biol. Macromol. 2020, 162, 1372–1387. [Google Scholar] [CrossRef] [Scilit]
- Li, L.; Huang, J.; Zhang, Y.; Yang, X.; Gou, T.; Ren, A.; Ding, P.; Wu, X.; Sun, M.; Gao, Z. Functional Framework of Amino Acid Transporters in Quinoa: Genome-Wide Survey, Homology, and Stress Response. Agronomy 2024, 14, 1648. [Google Scholar] [CrossRef] [Scilit]
- Nanjareddy, K.; Guerrero-Carrillo, M.F.; Lara, M.; Arthikala, M.-K. Genome-wide identification and comparative analysis of the Amino Acid Transporter (AAT) gene family and their roles during Phaseolus vulgaris symbioses. Funct. Integr. Genom. 2024, 24, 47. [Google Scholar] [CrossRef] [Scilit]
- Wei, J.; Han, Y.; Xu, H.; Deng, L.; Li, L.; Zhang, S.; Jiang, T.; Feng, Y.; Ma, L. AAAP gene family evolution and transcriptional regulation in Eucalyptus grandis under nitrogen, phosphate and boron deficiencies. BMC Plant Biol. 2025, 25, 879. [Google Scholar] [CrossRef] [Scilit]
- Ma, H.; Cao, X.; Shi, S.; Li, S.; Gao, J.; Ma, Y.; Zhao, Q.; Chen, Q. Genome-wide survey and expression analysis of the amino acid transporter superfamily in potato (Solanum tuberosum L.). Plant Physiol. Biochem. 2016, 107, 164–177. [Google Scholar] [CrossRef] [Scilit]
- Zhang, G.-B.; Meng, S.; Gong, J.-M. The expected and unexpected roles of nitrate transporters in plant abiotic stress resistance and their regulation. Int. J. Mol. Sci. 2018, 19, 3535. [Google Scholar] [CrossRef] [Scilit]
- Yang, G.; Wei, Q.; Huang, H.; Xia, J. Amino acid transporters in plant cells: A brief review. Plants 2020, 9, 967. [Google Scholar] [CrossRef] [Scilit]
- Fang, Z.; Wu, B.; Ji, Y. The amino acid transporter OsAAP4 contributes to rice tillering and grain yield by regulating neutral amino acid allocation through two splicing variants. Rice 2021, 14, 2. [Google Scholar] [CrossRef] [Scilit]
- Rolletschek, H.; Hosein, F.; Miranda, M.; Heim, U.; Götz, K.-P.; Schlereth, A.; Borisjuk, L.; Saalbach, I.; Wobus, U.; Weber, H. Ectopic expression of an amino acid transporter (VfAAP1) in seeds of Vicia narbonensis and pea increases storage proteins. Plant Physiol. 2005, 137, 1236–1249. [Google Scholar] [CrossRef] [Scilit]
- Mathieu, A.-S.; Tinel, C.; Dailly, H.; Quinet, M.; Lutts, S. Impact of high temperature on sucrose translocation, sugar content and inulin yield in Cichorium intybus L. var. sativum. Plant Soil 2018, 432, 273–288. [Google Scholar] [CrossRef] [Scilit]
- Yadav, P.K.; Bhujel, P.; Bhandari, N.; Sharma, S.; Sharma, A. Screening tomato genotypes for early-stage drought tolerance using polyethylene glycol-induced osmotic stress. BMC Plant Biol. 2025, 25, 1476. [Google Scholar] [CrossRef] [Scilit]
- Khan, R.; Ma, X.; Zhang, J.; Wu, X.; Iqbal, A.; Wu, Y.; Zhou, L.; Wang, S. Circular drought-hardening confers drought tolerance via modulation of the antioxidant defense system, osmoregulation, and gene expression in tobacco. Physiol. Plant. 2021, 172, 1073–1088. [Google Scholar] [CrossRef] [Scilit]
- Amoah, J.N.; Seo, Y.W. Effect of progressive drought stress on physio-biochemical responses and gene expression patterns in wheat. 3 Biotech 2021, 11, 440. [Google Scholar] [CrossRef] [Scilit]
- Li, Z.-X.; Yang, W.-J.; Ahammed, G.J.; Shen, C.; Yan, P.; Li, X.; Han, W.-Y. Developmental changes in carbon and nitrogen metabolism affect tea quality in different leaf position. Plant Physiol. Biochem. 2016, 106, 327–335. [Google Scholar] [CrossRef] [Scilit]
- Zhou, T.; Yue, C.-P.; Huang, J.-Y.; Cui, J.-Q.; Liu, Y.; Wang, W.-M.; Tian, C.; Hua, Y.-P. Genome-wide identification of the amino acid permease genes and molecular characterization of their transcriptional responses to various nutrient stresses in allotetraploid rapeseed. BMC Plant Biol. 2020, 20, 151. [Google Scholar] [CrossRef] [Scilit]
- Duan, Y.; Zhu, X.; Shen, J.; Xing, H.; Zou, Z.; Ma, Y.; Wang, Y.; Fang, W. Genome-wide identification, characterization and expression analysis of the amino acid permease gene family in tea plants (Camellia sinensis). Genomics 2020, 112, 2866–2874. [Google Scholar] [CrossRef] [Scilit]
- Liu, H.; Wu, M.; Zhu, D.; Pan, F.; Wang, Y.; Wang, Y.; Xiang, Y. Genome-wide analysis of the AAAP gene family in moso bamboo (Phyllostachys edulis). BMC Plant Biol. 2017, 17, 29. [Google Scholar] [CrossRef] [Scilit]
- Wan, Y.; King, R.; Mitchell, R.A.C.; Hassani-Pak, K.; Hawkesford, M.J. Spatiotemporal expression patterns of wheat amino acid transporters reveal their putative roles in nitrogen transport and responses to abiotic stress. Sci. Rep. 2017, 7, 5461. [Google Scholar] [CrossRef] [Scilit]
- Wang, J.; Wu, B.; Lu, K.; Wei, Q.; Qian, J.; Chen, Y.; Fang, Z. The amino acid permease 5 (OsAAP5) regulates tiller number and grain yield in rice. Plant Physiol. 2019, 180, 1031–1045. [Google Scholar] [CrossRef] [Scilit]
- Schmidt, R.; Stransky, H.; Koch, W. The amino acid permease AAP8 is important for early seed development in Arabidopsis thaliana. Planta 2007, 226, 805–813. [Google Scholar] [CrossRef] [Scilit]
- Wang, T.; Chen, Y.; Zhang, M.; Chen, J.; Liu, J.; Han, H.; Hua, X. Arabidopsis AMINO ACID PERMEASE1 Contributes to Salt Stress-Induced Proline Uptake from Exogenous Sources. Front. Plant Sci. 2017, 8, 2182. [Google Scholar] [CrossRef] [Scilit]
- Zhang, Y.; Wang, L.; Song, B.-H.; Zhang, D.; Zhang, H. Genome-Wide Identification, Characterization, and Expression Analysis of the Amino Acid Permease Gene Family in Soybean. Agronomy 2023, 14, 52. [Google Scholar] [CrossRef] [Scilit]
- Islam, M.N.; Rabby, M.G.; Hossen, M.M.; Bonny, M.; Hasan, M.M. Genome-wide identification following functional analysis of amino acid permease and cationic amino acid transporter gene families in maize and their role in drought stress. S. Afr. J. Bot. 2024, 168, 360–371. [Google Scholar] [CrossRef] [Scilit]
- Wang, Y.; Li, Y.; Zhou, H.; Huang, T.; Wang, Y.; Fan, M.; Guo, L.; Fu, M.; Sun, L.; Hao, F. Comprehensive analysis of amino acid/auxin permease family genes reveal the positive role of GhAAAP128 in cotton tolerance to cold stress. Int. J. Biol. Macromol. 2025, 290, 138882. [Google Scholar] [CrossRef] [Scilit]
- Cheng, F.; Wu, J.; Cai, X.; Liang, J.; Freeling, M.; Wang, X. Gene retention, fractionation and subgenome differences in polyploid plants. Nat. Plants 2018, 4, 258–268. [Google Scholar] [CrossRef] [Scilit]
- Panchy, N.; Lehti-Shiu, M.; Shiu, S.-H. Evolution of gene duplication in plants. Plant Physiol. 2016, 171, 2294–2316. [Google Scholar] [CrossRef] [Scilit]
- Bashir, S.; Rehman, N.; Fakhar Zaman, F.; Naeem, M.K.; Jamal, A.; Tellier, A.; Ilyas, M.; Silva Arias, G.A.; Khan, M.R. Genome-wide characterization of the NLR gene family in tomato (Solanum lycopersicum) and their relatedness to disease resistance. Front. Genet. 2022, 13, 931580. [Google Scholar] [CrossRef] [Scilit]
- Zhou, F.; Pichersky, E. The complete functional characterisation of the terpene synthase family in tomato. New Phytol. 2020, 226, 1341–1360. [Google Scholar] [CrossRef] [Scilit]
- Zhu, L.; Zhang, Y.; Zhang, W.; Yang, S.; Chen, J.-Q.; Tian, D. Patterns of exon-intron architecture variation of genes in eukaryotic genomes. BMC Genom. 2009, 10, 47. [Google Scholar] [CrossRef] [Scilit]
- Koralewski, T.E.; Krutovsky, K.V. Evolution of exon-intron structure and alternative splicing. PLoS ONE 2011, 6, e18055. [Google Scholar] [CrossRef] [Scilit]
- Ebeed, H.T. Genome-wide analysis of polyamine biosynthesis genes in wheat reveals gene expression specificity and involvement of STRE and MYB-elements in regulating polyamines under drought. BMC Genom. 2022, 23, 734. [Google Scholar] [CrossRef] [Scilit]
- Amoah, J.N.; Adu-Gyamfi, M.O.; Kwarteng, A.O. Genome-Wide Identification, Bioinformatic Characterization, and Expression Profiling of Starch Synthase (SS) Genes in Foxtail Millet under Drought Condition. Stresses 2024, 4, 518–533. [Google Scholar] [CrossRef] [Scilit]
- Amoah, J.; Ko, C.; Yoon, J.; Weon, S. Effect of drought acclimation on oxidative stress and transcript expression in wheat (Triticum aestivum L.). J. Plant Interact. 2019, 14, 492–505. [Google Scholar] [CrossRef] [Scilit]
- Ru, C.; Hu, X.; Wang, W.; Yan, H. Impact of nitrogen on photosynthesis, remobilization, yield, and efficiency in winter wheat under heat and drought stress. Agric. Water Manag. 2024, 302, 109013. [Google Scholar] [CrossRef] [Scilit]
- Du, Y.; Zhao, Q.; Chen, L.; Yao, X.; Zhang, W.; Zhang, B.; Xie, F. Effect of drought stress on sugar metabolism in leaves and roots of soybean seedlings. Plant Physiol. Biochem. 2020, 146, 1–12. [Google Scholar] [CrossRef] [Scilit] [PubMed]
- Amoah, J.N.; Keitel, C.; Kaiser, B.N. Supplemental nitrogen induces robust physiological and molecular adaptations by enhancing carbon metabolism in maize. Protoplasma 2025. Correction in Protoplasma 2025. https://doi.org/10.1007/s00709-025-02121-6. [Google Scholar] [CrossRef] [Scilit]
- Rajametov, S.N.; Yang, E.Y.; Jeong, H.B.; Cho, M.C.; Chae, S.Y.; Paudel, N. Heat treatment in two tomato cultivars: A study of the effect on physiological and growth recovery. Horticulturae 2021, 7, 119. [Google Scholar] [CrossRef] [Scilit]
- Bradford, M.M. A rapid and sensitive method for the quantitation of microgram quantities of protein utilizing the principle of protein-dye binding. Anal. Biochem. 1976, 72, 248–254. [Google Scholar] [CrossRef]
- Rizvi, N.B.; Aleem, S.; Khan, M.R.; Ashraf, S.; Busquets, R. Quantitative Estimation of Protein in Sprouts of Vigna radiate (Mung Beans), Lens culinaris (Lentils), and Cicer arietinum (Chickpeas) by Kjeldahl and Lowry Methods. Molecules 2022, 27, 814. [Google Scholar] [CrossRef] [Scilit]
- Miranda, K.M.; Espey, M.G.; Wink, D.A. A rapid, simple spectrophotometric method for simultaneous detection of nitrate and nitrite. Nitric Oxide 2001, 5, 62–71. [Google Scholar] [CrossRef] [Scilit]
- Hall, T.A. BioEdit: A user-friendly biological sequence alignment editor and analysis program for Windows 95/98/NT. In Nucleic Acids Symposium Series; Information Retrieval Ltd.: London, UK, 1999; pp. 95–98. [Google Scholar]
- Chen, C.; Chen, H.; He, Y.; Xia, R. TBtools, a toolkit for biologists integrating various biological data handling tools with a user-friendly interface. bioRxiv 2018. [Google Scholar] [CrossRef] [Scilit]
- Edgar, R.C. MUSCLE: A multiple sequence alignment method with reduced time and space complexity. BMC Bioinform. 2004, 5, 113. [Google Scholar] [CrossRef] [Scilit]
- Kumar, S.; Stecher, G.; Tamura, K. MEGA7: Molecular evolutionary genetics analysis version 7.0 for bigger datasets. Mol. Biol. Evol. 2016, 33, 1870–1874. [Google Scholar] [CrossRef] [Scilit]
- Li, H. A statistical framework for SNP calling, mutation discovery, association mapping and population genetical parameter estimation from sequencing data. Bioinformatics 2011, 27, 2987–2993. [Google Scholar] [CrossRef] [Scilit] [PubMed]


Disclaimer/Publisher’s Note: The statements, opinions and data contained in all publications are solely those of the individual author(s) and contributor(s) and not of MDPI and/or the editor(s). MDPI and/or the editor(s) disclaim responsibility for any injury to people or property resulting from any ideas, methods, instructions or products referred to in the content. |
© 2026 by the author. Licensee MDPI, Basel, Switzerland. This article is an open access article distributed under the terms and conditions of the Creative Commons Attribution (CC BY) license.