


Abstract
Anchors constructed in water-rich sandy-pebble strata require grout systems that can maintain material continuity and transfer tensile force effectively before groundwater-related disturbance weakens the borehole interface. This study investigated a sulphoaluminate cement-based rapid-setting grout (SAC) for PSB high-strength threaded anchors, using an ordinary Portland cement-based grout (OPC) as a reference material. Laboratory central pull-out tests were first conducted on grout cube specimens with different steel-bar diameters and bonded lengths to evaluate the steel–grout bond response. Full-scale field pull-out tests were then performed to examine the anchor–grout–ground response under water-rich ground conditions. LS-DYNA finite element models were calibrated against the laboratory and field results to interpret the governing load-transfer mechanism and to assess the influence of representative stratum resistance. The laboratory tests showed that the steel–grout bond response depended on both interfacial degradation and mortar splitting, indicating that peak bond strength should be interpreted together with failure mode and slip development. In the field tests, all anchors failed by pull-out, and the steel bar and grout body were pulled out together, showing that the full-scale response was governed mainly by the grout–ground interface rather than by steel–grout debonding. The calibrated numerical models reproduced the main load–displacement trends and supported a scale-dependent transition from steel–grout bond control at material scale to grout–ground interface control at field scale. The results provide a basis for evaluating rapid-setting grouts for high-strength anchors in water-rich sandy-pebble ground.
1. Introduction
In recent underground construction, high-strength threaded anchors have been increasingly used in anti-floating systems, deep excavations, and underground retaining structures where large tensile resistance must be developed within limited construction space [1]. In Chengdu pebble strata, PSB high-strength threaded bars have been adopted in anti-floating anchor systems because of their high tensile capacity and convenient mechanical anchorage [2]. However, the tensile capacity of the steel bar cannot be directly converted into anchor pull-out capacity. The applied tensile force must be transferred from the bar to the grout and then from the grout to the surrounding ground [3]. Therefore, the performance of high-strength grouted anchors depends on both the steel–grout bond and the grout–ground interface [4].
Field pull-out tests have shown that anchor resistance is mobilised progressively along the bonded length rather than uniformly from the beginning of loading [5]. Full-scale rock-anchor tests further indicate that different failure modes may occur at the anchor–grout interface, the grout–ground interface, within the grout body or in the surrounding ground [6]. Park et al. reported that grout quality and grouting method can significantly affect the pull-out resistance of steel anchors [7]. Analytical studies also show that interface debonding can initiate locally and then propagate along the fixed anchor length, producing nonlinear load–displacement behaviour before complete pull-out [8]. These findings indicate that field anchor performance is governed by a coupled load-transfer process rather than by a single material strength parameter. At the material scale, laboratory pull-out tests are widely used to evaluate bond strength, bond-slip response and failure modes of bars embedded in cementitious grout [9]. The pull-out resistance of grouted anchors is affected by bar geometry, bonded length, grout strength, and confinement [10]. Earlier studies on grouted cable bolts and fully grouted rock bolts demonstrated that bond stress is not uniformly distributed along the anchorage length [11]. Li and Stillborg proposed analytical models to describe the load-transfer mechanism of rock bolts and cable bolts [10]. Moosavi et al. further showed that the bond between cement grout and steel bars is strongly affected by the interaction between mechanical interlock and grout confinement [12]. For deformed steel bars in early-age cementitious grout, the bond position function changes with age, cover thickness and bar diameter [13]. Recent studies on high-strength grout also confirm that the bond-slip response controls the pull-out behaviour of deformed steel bars [14].
Similar conclusions have been obtained from studies on other reinforcement-grout systems. Bond-slip models for grouted tendons show that interface degradation must be considered when reproducing post-peak response [15]. Local bond-slip models for reinforced concrete also demonstrate that the measured slip is sensitive to the assumed bond law and boundary condition [16]. Pull-out tests of GFRP bars embedded in mortar indicate that failure may change from pull-out to splitting when the confinement becomes insufficient [17]. Reviews of FRP–concrete bond behaviour also emphasise that specimen geometry and surface condition can strongly affect the measured bond strength [18]. These studies provide useful reference for interpreting laboratory steel–grout pull-out tests, but they cannot directly represent field anchor behaviour in heterogeneous ground.
Water-rich sandy gravel and pebble strata introduce additional uncertainty into anchor construction. Engineering applications in Chengdu pebble strata have reported that the effective side resistance of anti-floating anchors is closely related to stratum compactness and construction quality [2]. In such ground, groundwater may influence borehole stability, grout retention, and the effective contact between the grout body and the surrounding stratum [19]. Grout washout under flowing water can be spatially heterogeneous, and the residual grout pattern depends on fracture or pore geometry [20]. Filtration of cement grout may also change the local water-to-binder ratio and reduce the continuity of the hardened grout body [21].
Ordinary Portland cement grout is widely used because of its availability, low cost, and mature engineering experience. However, in water-bearing ground, conventional cement grout may not develop sufficient early resistance before dilution, washout, or local loss occurs [22]. Anti-washout admixtures can improve underwater stability by increasing viscosity and yield stress [23]. Underwater composite cement grouts have also been developed to improve washout resistance and mechanical performance [24]. Nevertheless, improving washout resistance by viscosity modification may affect pumpability and filling ability, especially in permeable sandy-pebble strata [25]. Therefore, a grout used for anchor construction in moving or abundant groundwater should satisfy both fresh-state stability and early mechanical performance. Sulphoaluminate cement-based materials provide a potential route for rapid-setting anchor grouts because of their rapid hydration and early strength development [26,27,28,29,30]. In this paper, the expected advantage of SAC is related primarily to rapid setting and construction suitability under water-rich conditions, with comparable long-term ultimate pull-out capacity when compared to OPC.
For high-strength threaded anchors, the key scientific issue is not only whether a rapid-setting grout can harden quickly, but whether it can transfer tensile force effectively from the steel bar to the grout and then to the surrounding ground. Existing studies have separately examined steel–grout bond behaviour [31], grout–rock interface resistance [32], anchor load-transfer mechanisms [33] and cementitious grout performance in water-rich ground [34]. Laboratory pull-out testing provides a direct method for identifying steel–grout bond response [35], while full-scale field pull-out testing is necessary to evaluate the mobilised resistance of the anchor–grout–ground system [36]. However, the controlling interface at these two scales may be different. At the laboratory scale, the measured pull-out response is mainly governed by steel–grout bond degradation or splitting of the hardened grout specimen. At the field scale, anchor pull-out may be governed by steel–grout debonding, grout–ground interface degradation, or their relative mobilisation, depending on the interface strength and surrounding stratum. Therefore, the possible dual-interface failure involving both the steel–grout interface and the grout–ground interface should be considered when evaluating rapid-setting grouts for anchors in water-rich sandy-pebble strata.
This study investigates a sulphoaluminate cement-based rapid-setting grout for PSB high-strength threaded anchors, with an ordinary Portland cement-based grout used as the reference material. Laboratory pull-out tests were conducted to characterise the steel–grout bond response under different bar diameters and bonded lengths. Full-scale field pull-out tests were then performed in water-rich sandy-pebble strata to evaluate the anchor–grout–ground response under practical ground conditions. Since field pull-out failure may occur either through steel–grout debonding or through grout–ground interface degradation, the field observations and numerical models were used together to identify the governing load-transfer interface. LS-DYNA finite element models were calibrated against the laboratory and field responses to interpret the scale transition from steel–grout bond behaviour to grout–ground interface control. The same modelling framework was further used to examine representative strata, providing a combined check of steel–grout bond adequacy and grout–ground interface resistance under different ground-resistance levels. The objective is to establish an experimental–numerical basis for evaluating rapid-setting grouts used in high-strength anchor systems under water-rich ground conditions.
2. Materials and Methods
2.1. Materials
Two cementitious grouts were used in both the laboratory pull-out tests and the field anchor pull-out tests: a sulphoaluminate cement-based rapid-setting grout (SAC) and an ordinary Portland cement-based reference grout (OPC) (supplied by Jiahua Cement, Leshan, China). High-strength threaded steel bars were used as the reinforcement. In the field tests, the anchor bar was PSB1080 steel (supplied by Yuanzhijiu Co., Ltd., Chengdu, China) with a nominal yield strength of 1080 MPa and a nominal diameter of 40 mm.
The SAC was prepared from SAC42.5 sulphoaluminate cement (supplied by Jiahua Cement, Leshan, China), fly ash, ground granulated blast-furnace slag (supplied by Hongyuan Co., Ltd., Leshan, China), water, hydroxyethyl cellulose (Guanxiang Co., Ltd., Shijiazhuang, China) and a polycarboxylate superplasticiser (supplied by Wanrong Co., Ltd., YunCheng, China). Using the mass of sulphoaluminate cement as 1.00, the relative proportions of sulphoaluminate cement, fly ash, ground granulated blast-furnace slag, water, hydroxyethyl cellulose, and polycarboxylate superplasticiser were 1.00:0.333:0.333:0.833:0.007:0.010. The corresponding water-to-binder ratio was 0.50. The OPC reference grout consisted solely of P.O 42.5 ordinary Portland cement and water, with a cement-to-water mass ratio of 1:0.5. The dry powder components were first mixed until visually uniform. The mixing water, in which hydroxyethyl cellulose and the polycarboxylate superplasticiser had been dispersed, was then added, and the mixture was stirred until a homogeneous grout was obtained. Companion strength specimens were cast from the same grout batch and cured under standard conditions. For the laboratory tests, both grouts were prepared using low-speed mixing for 60 s, followed by high-speed mixing for 30 s, a 90 s pause to scrape the blade and bowl, and a final 60 s of high-speed mixing. For the field tests, the grouts were prepared on site using a horizontal-shaft mortar mixer operating at 60 r/min. The dry constituents of the SAC were mixed for 2 mins, followed by 5 mins of mixing after addition of the prescribed water quantity. The OPC was mixed for 5 mins after water addition.
Initial and final setting times were measured using a Vicat apparatus, following the penetration criteria specified in GB/T 1346-2024 [37], with water addition taken as time zero. Three independently prepared samples were tested for each mixture. The SAC had an initial setting time of 16 min and a final setting time of 31 min. Companion strength specimens were cast from the same grout batch in 40 mm × 40 mm × 160 mm moulds and vibrated for 120 ± 5 s. The specimens were demoulded after 24 h and subsequently cured at 20 ± 1 °C and a relative humidity of at least 90% until testing. At each tested age, three prisms per grout provided six half-prisms for compression testing over a 40 mm × 40 mm loaded area, using the compression-testing procedure specified in GB/T 17671-2021 [38]. Its compressive strengths at 1 d, 3 d, 7 d and 28 d were 20.4, 27.1, 30.7 and 40.2 MPa, respectively. The OPC was prepared using P.O 42.5 ordinary Portland cement as the main binder and followed the same mixing, casting, and curing procedure. Its measured 28-day compressive strength was 45.0 MPa.
2.2. Laboratory Pull-Out Tests
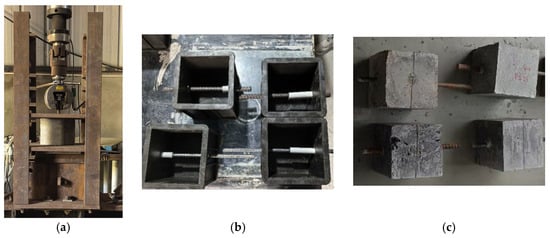
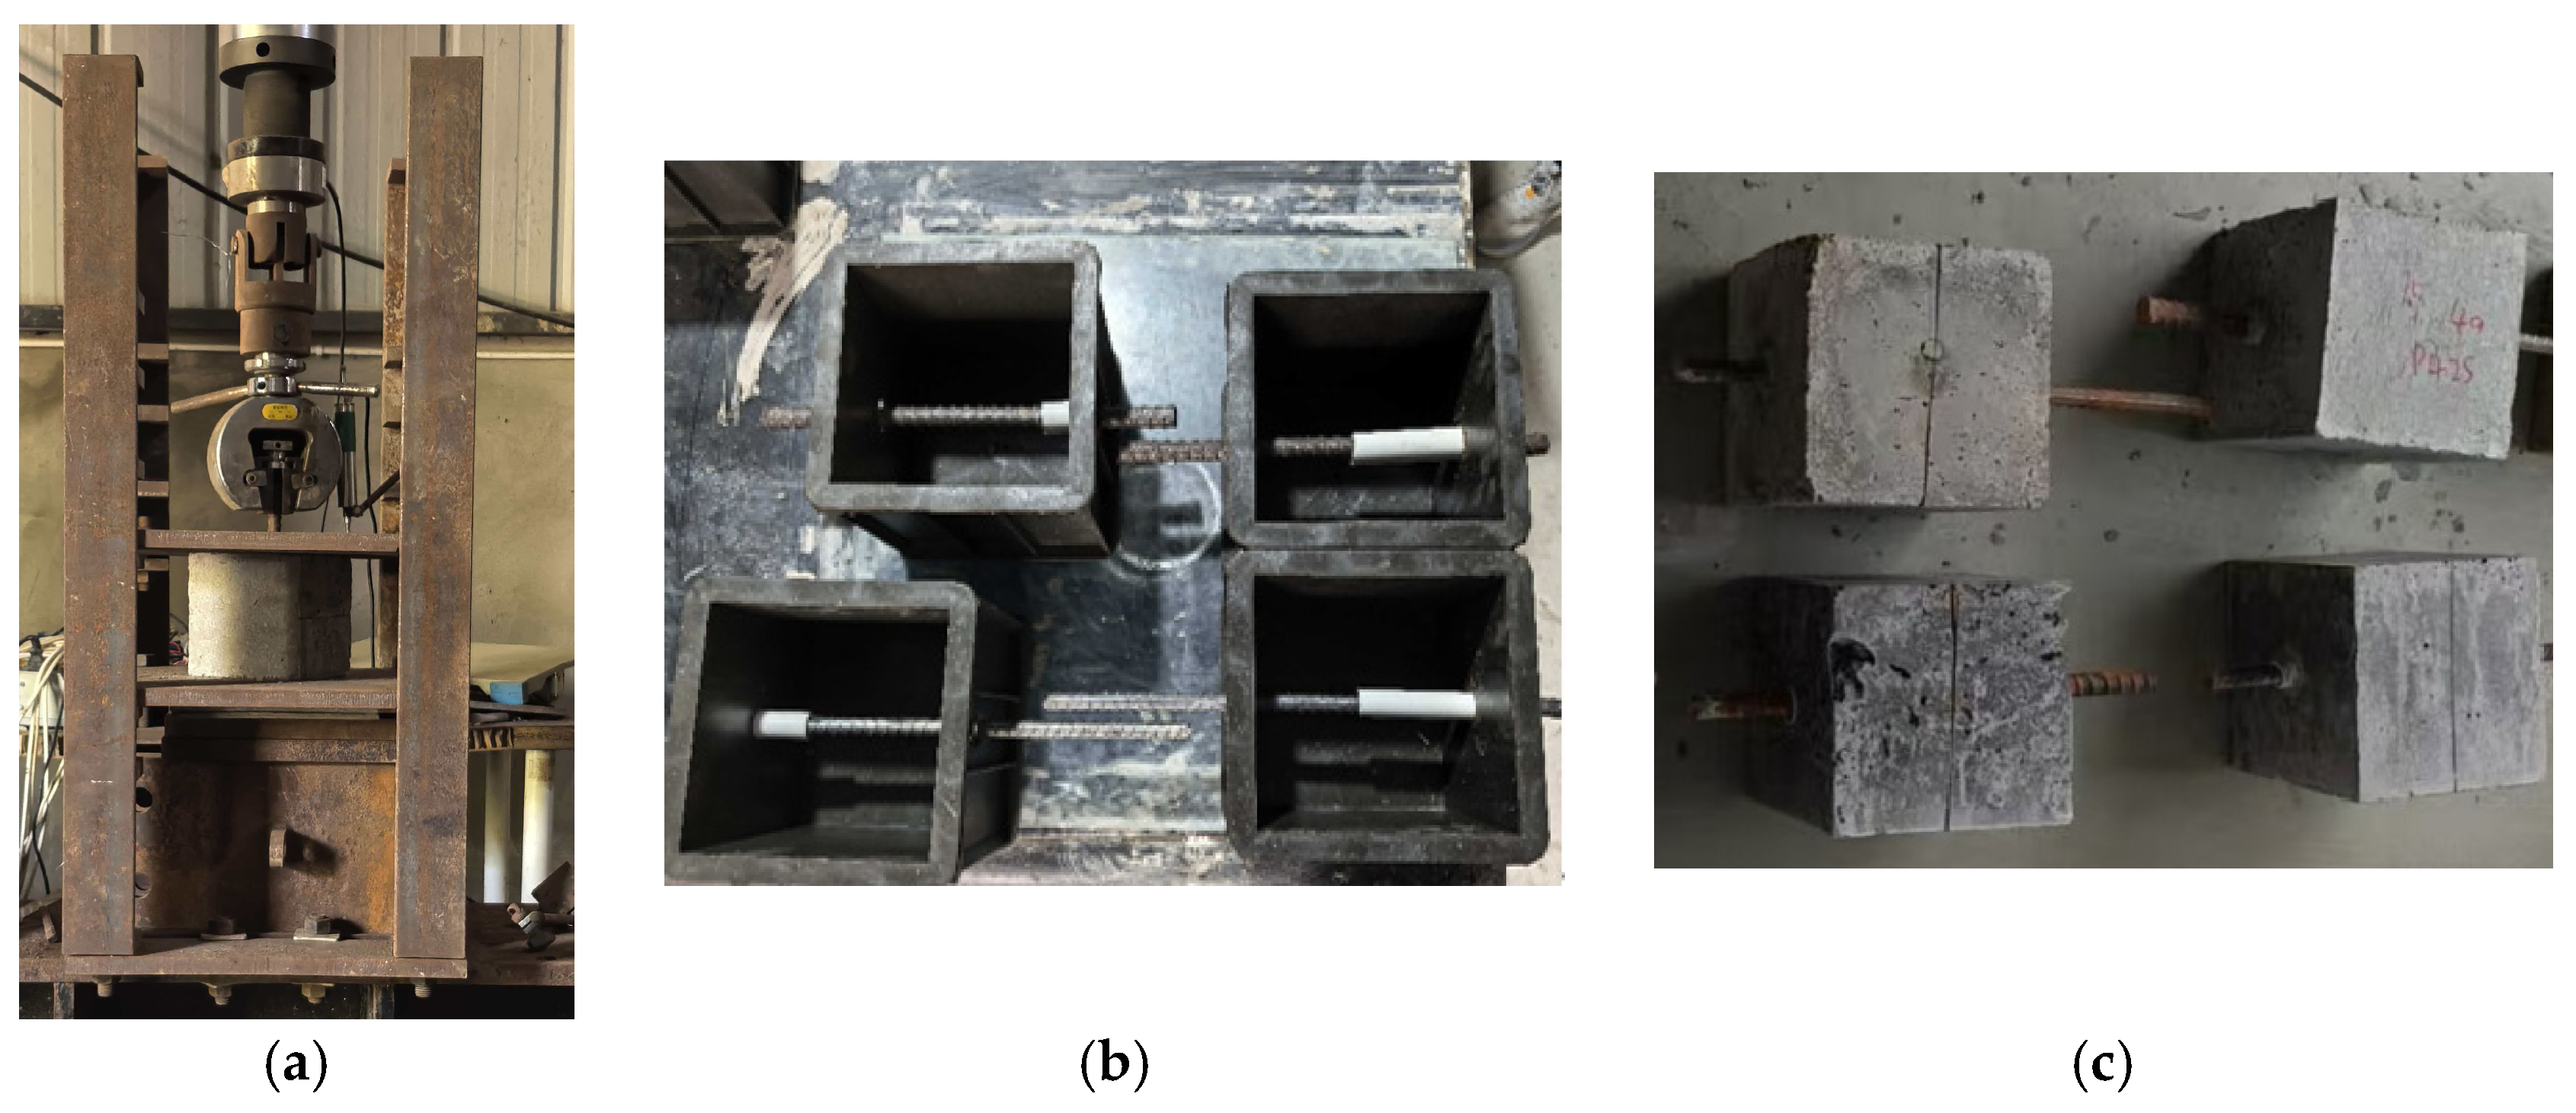
Figure 1 shows the test setup and sample specimens. The laboratory pull-out tests were conducted using 150 mm × 150 mm × 150 mm hardened grout cube specimens with a threaded steel bar embedded at the centre. PVC sleeves were placed at both ends of the bar to isolate the unbonded regions and to control the designed bonded length. The specimens were cast from the corresponding SAC or OPC mixture. The freshly mixed grout was cast into the moulds in three layers, with each layer approximately 50 mm thick. Each layer was compacted by vibration after casting. After the final layer was placed, the specimen surface was levelled and covered with plastic film to reduce moisture loss. The specimens were demoulded after 24 h and then cured under standard conditions for 28 d before testing. Thus, the laboratory pull-out tests were designed to evaluate the steel–grout bond response under controlled curing conditions, rather than to reproduce groundwater flow, grout dilution, or washout during field anchor construction.
Figure 1.
Laboratory central pull-out specimen and loading arrangement: (a) Test setup. (b) Moulds. (c) Test specimen.
However, the pull-out tests were conducted after curing; therefore, the pull-out results should be interpreted as 28-day bond and anchorage performance, not as direct early-age pull-out evidence. In addition, the laboratory specimens were not exposed to flowing groundwater. In water-rich sandy-pebble strata, groundwater may influence grout retention, local dilution, washout, and interface formation around both the steel bar and the borehole wall. These effects were represented only through the full-scale field tests, and not through the standard-cured laboratory specimens.
Three variables were considered: grout type, steel-bar diameter, and bonded length. Two grout types, SAC and OPC, were used. The steel-bar diameters were 12 and 16 mm, and the bonded lengths were 75 and 112.5 mm, corresponding to 0.5 and 0.75 times the specimen length, respectively. This test matrix produced eight pull-out specimens in total (Table 1). All laboratory pull-out specimens were tested under force-controlled loading at 1.0 kN/s. Loading was continued until bar pull-out, bar fracture, or obvious crushing/splitting of the hardened grout specimen occurred. During testing, the pull-out force, loaded-end slip, and free-end slip were recorded. The loaded-end slip was measured at the loading side of the steel bar relative to the loading support, while the free-end slip was measured at the opposite exposed end of the steel bar relative to the specimen surface. Because the two slips were recorded using different reference points, they include different contributions from local bond slip, specimen deformation, support compliance, and gauge seating. The average ultimate bond strength was calculated from the peak pull-out load as:
where τu is the average ultimate bond strength, is the peak pull-out load, is the nominal steel-bar diameter, and is the bonded length.
Table 1.
Laboratory pull-out test matrix.
2.3. Field Anchor Pull-Out Tests
Field anchor pull-out tests were conducted at the Chengdu Third People’s Hospital project in Chengdu, China. The test site was located in a water-rich sandy-pebble stratum. The ground profile consisted mainly of fill, silty clay, silt, fine sand, pebble layers and underlying mudstone. The pebble layer was the principal water-bearing stratum and had high permeability, with a reported permeability coefficient of approximately 25 m/d. The stable groundwater level during the investigation was approximately −5.2 to −7.6 m. These hydrogeological conditions provided a representative field environment for evaluating the applicability of rapid-setting grouts in permeable water-rich strata.
Four field anchors were used in this manuscript: two anchors grouted with SAC and two anchors grouted with OPC. All anchors were equal-diameter, fully bonded anchors with a bonded length of 7.0 m. Each anchor used one PSB1080 threaded steel bar with a nominal diameter of 40 mm. The nominal anchor diameter was 0.15 m. The bonded section was embedded below the ground surface, and an exposed upper length was reserved for pull-out loading. The anchors were installed in the water-rich sandy-pebble stratum described above; the pebble layer was the main water-bearing layer, and the stable groundwater level during investigation was approximately −5.2 to −7.6 m. The field pull-out results used in this manuscript are summarised in Table 2.
Table 2.
Field anchor pull-out results used in this manuscript.
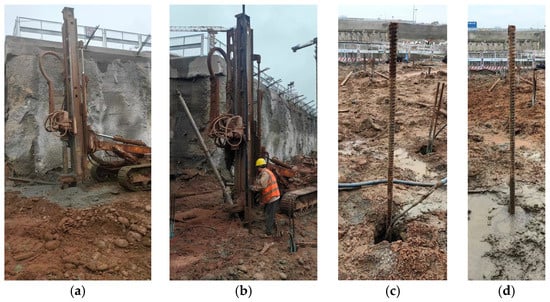
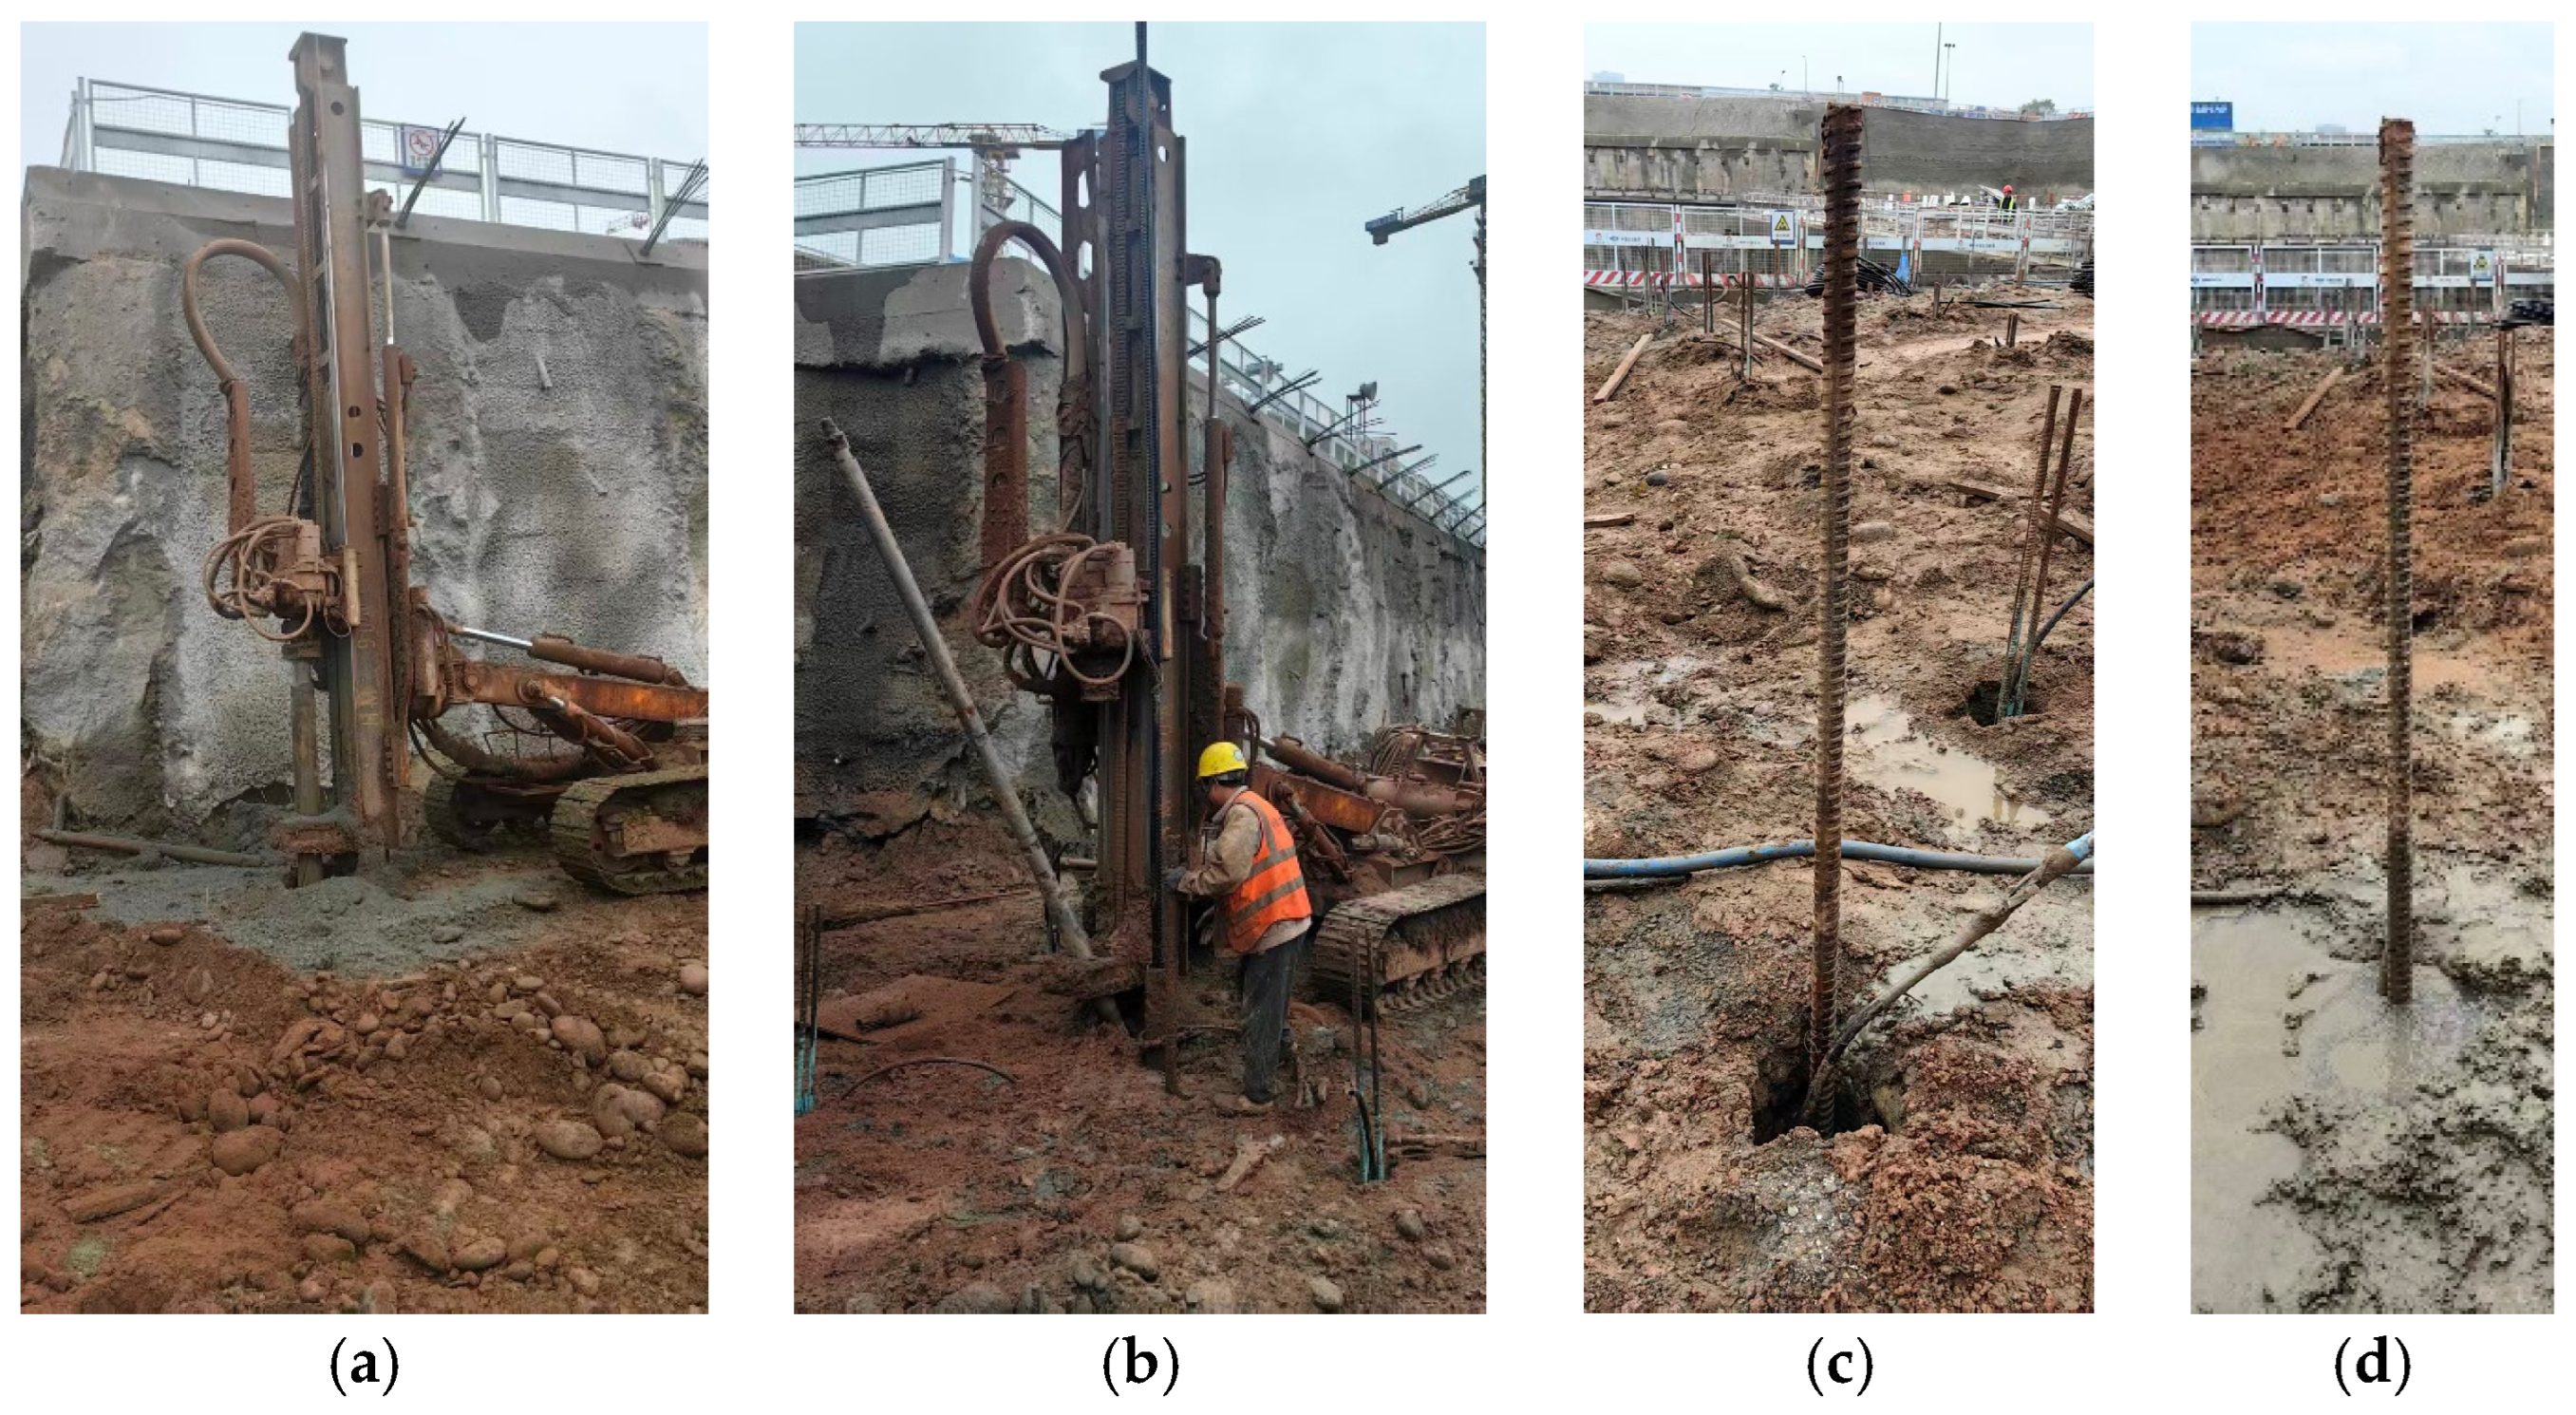
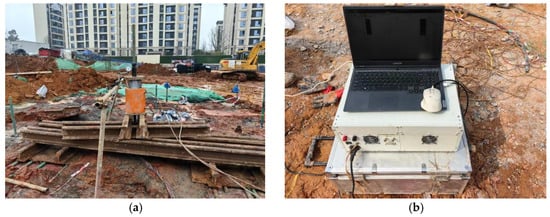
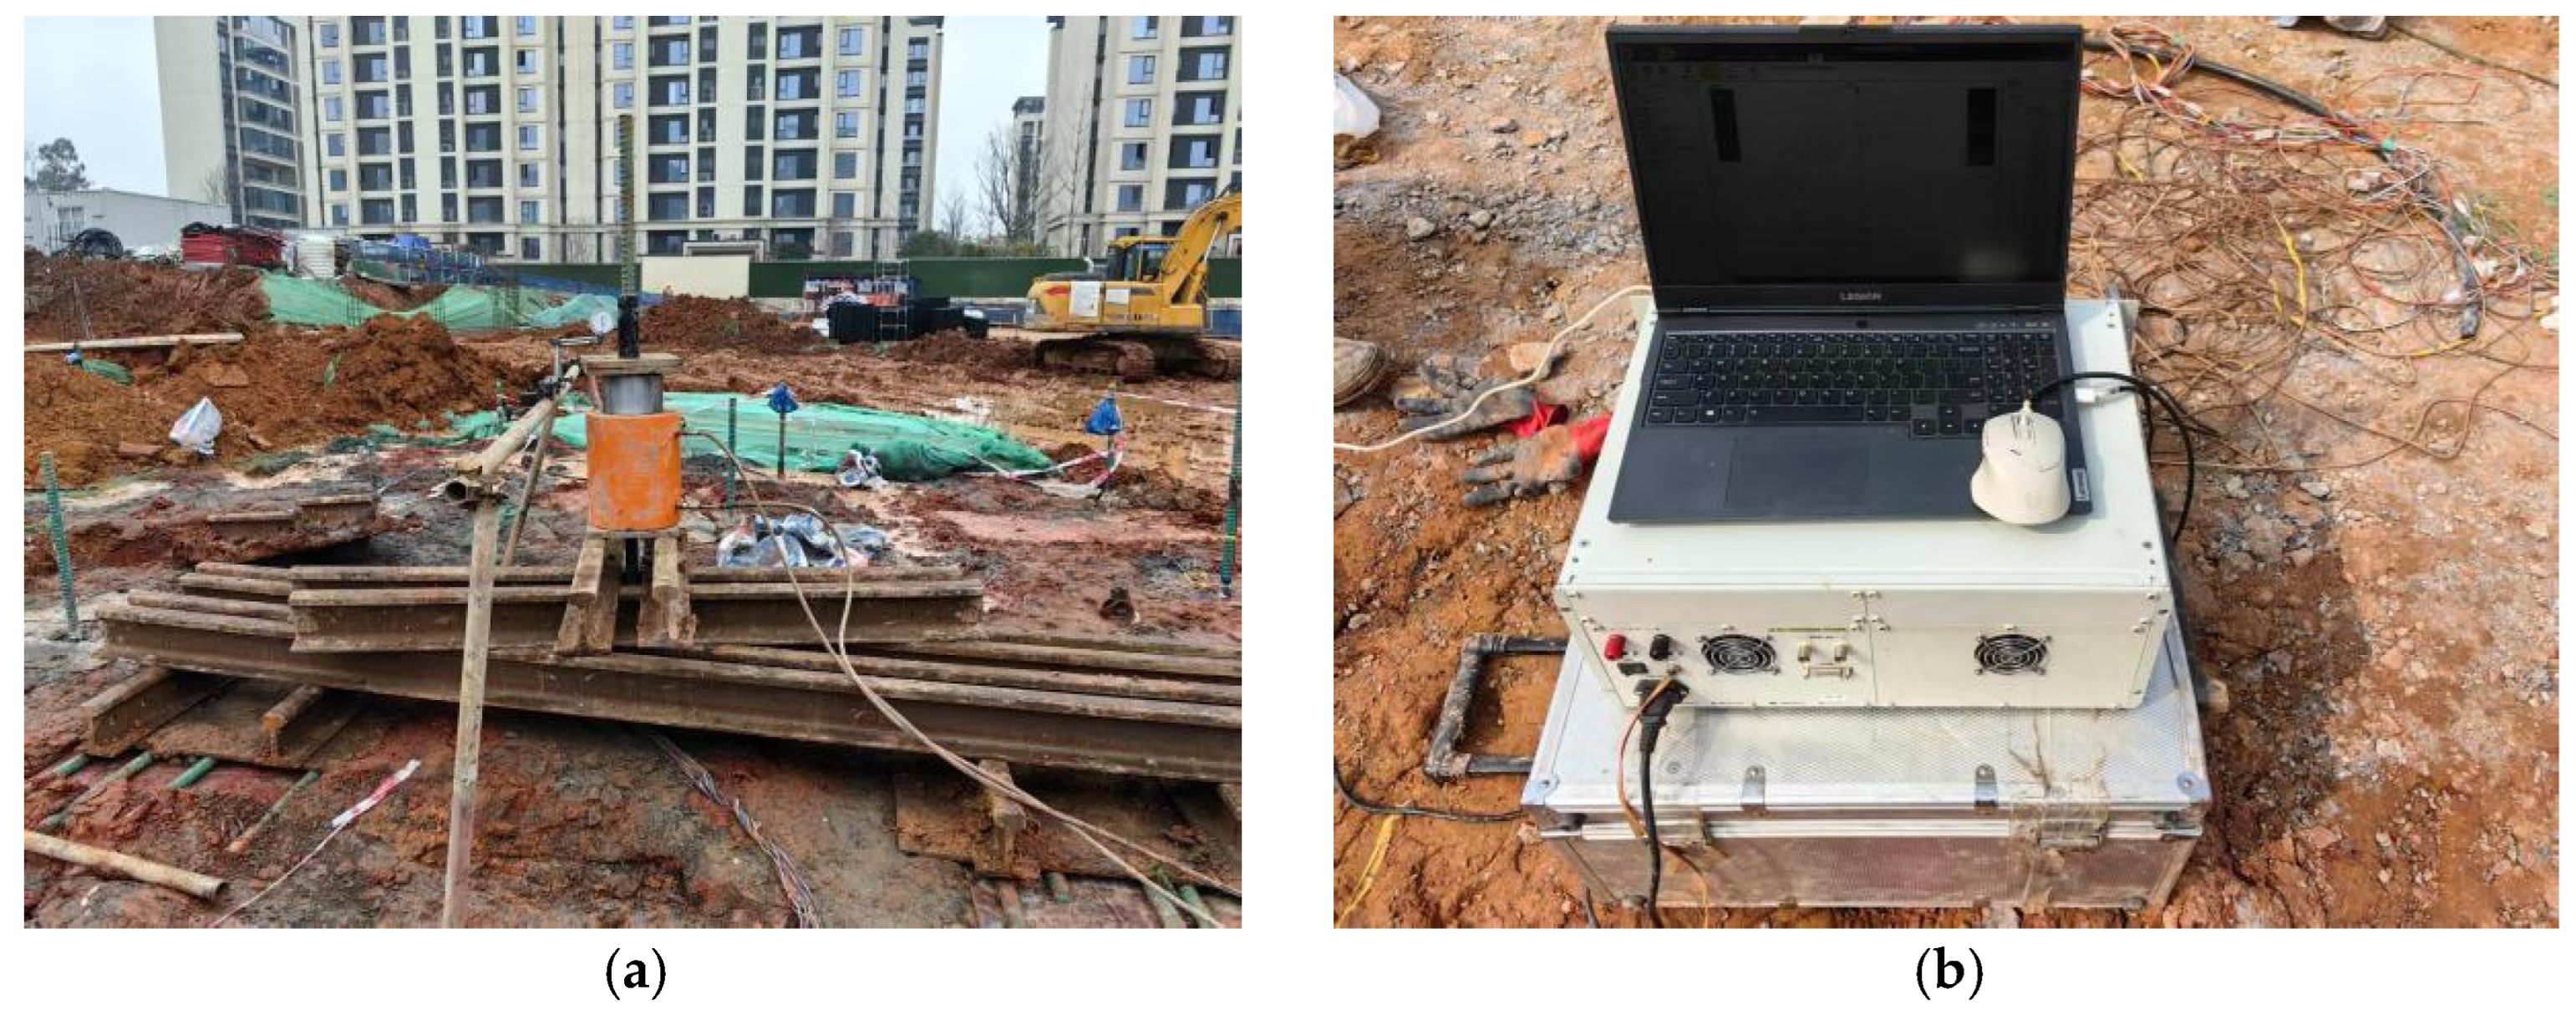
The field construction process included drilling, anchor installation, grouting, and completion of the constructed anchor (Figure 2). Spiral drilling was first used to form the borehole. The steel anchor was then installed into the borehole, after which grout was injected through a grout pipe until the borehole was filled. Pull-out testing was performed after grout curing. The load was applied using a hydraulic jack and reaction frame, and the anchor-head displacement was measured using dial gauges. A data acquisition system was used to collect the test response during loading (Figure 3). The measured load–displacement response was used to evaluate the field pull-out behaviour of SAC and OPC grouted anchors.
Figure 2.
Field anchor configuration and pull-out test setup: (a) Drilling. (b) Anchor installation. (c) Grouting. (d) Completed construction.
Figure 3.
Field anchor pull-out test setup: (a) Loading device. (b) Data acquisition system.
3. Laboratory Pull-Out Test Results
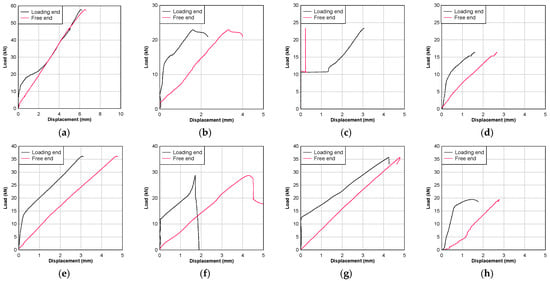
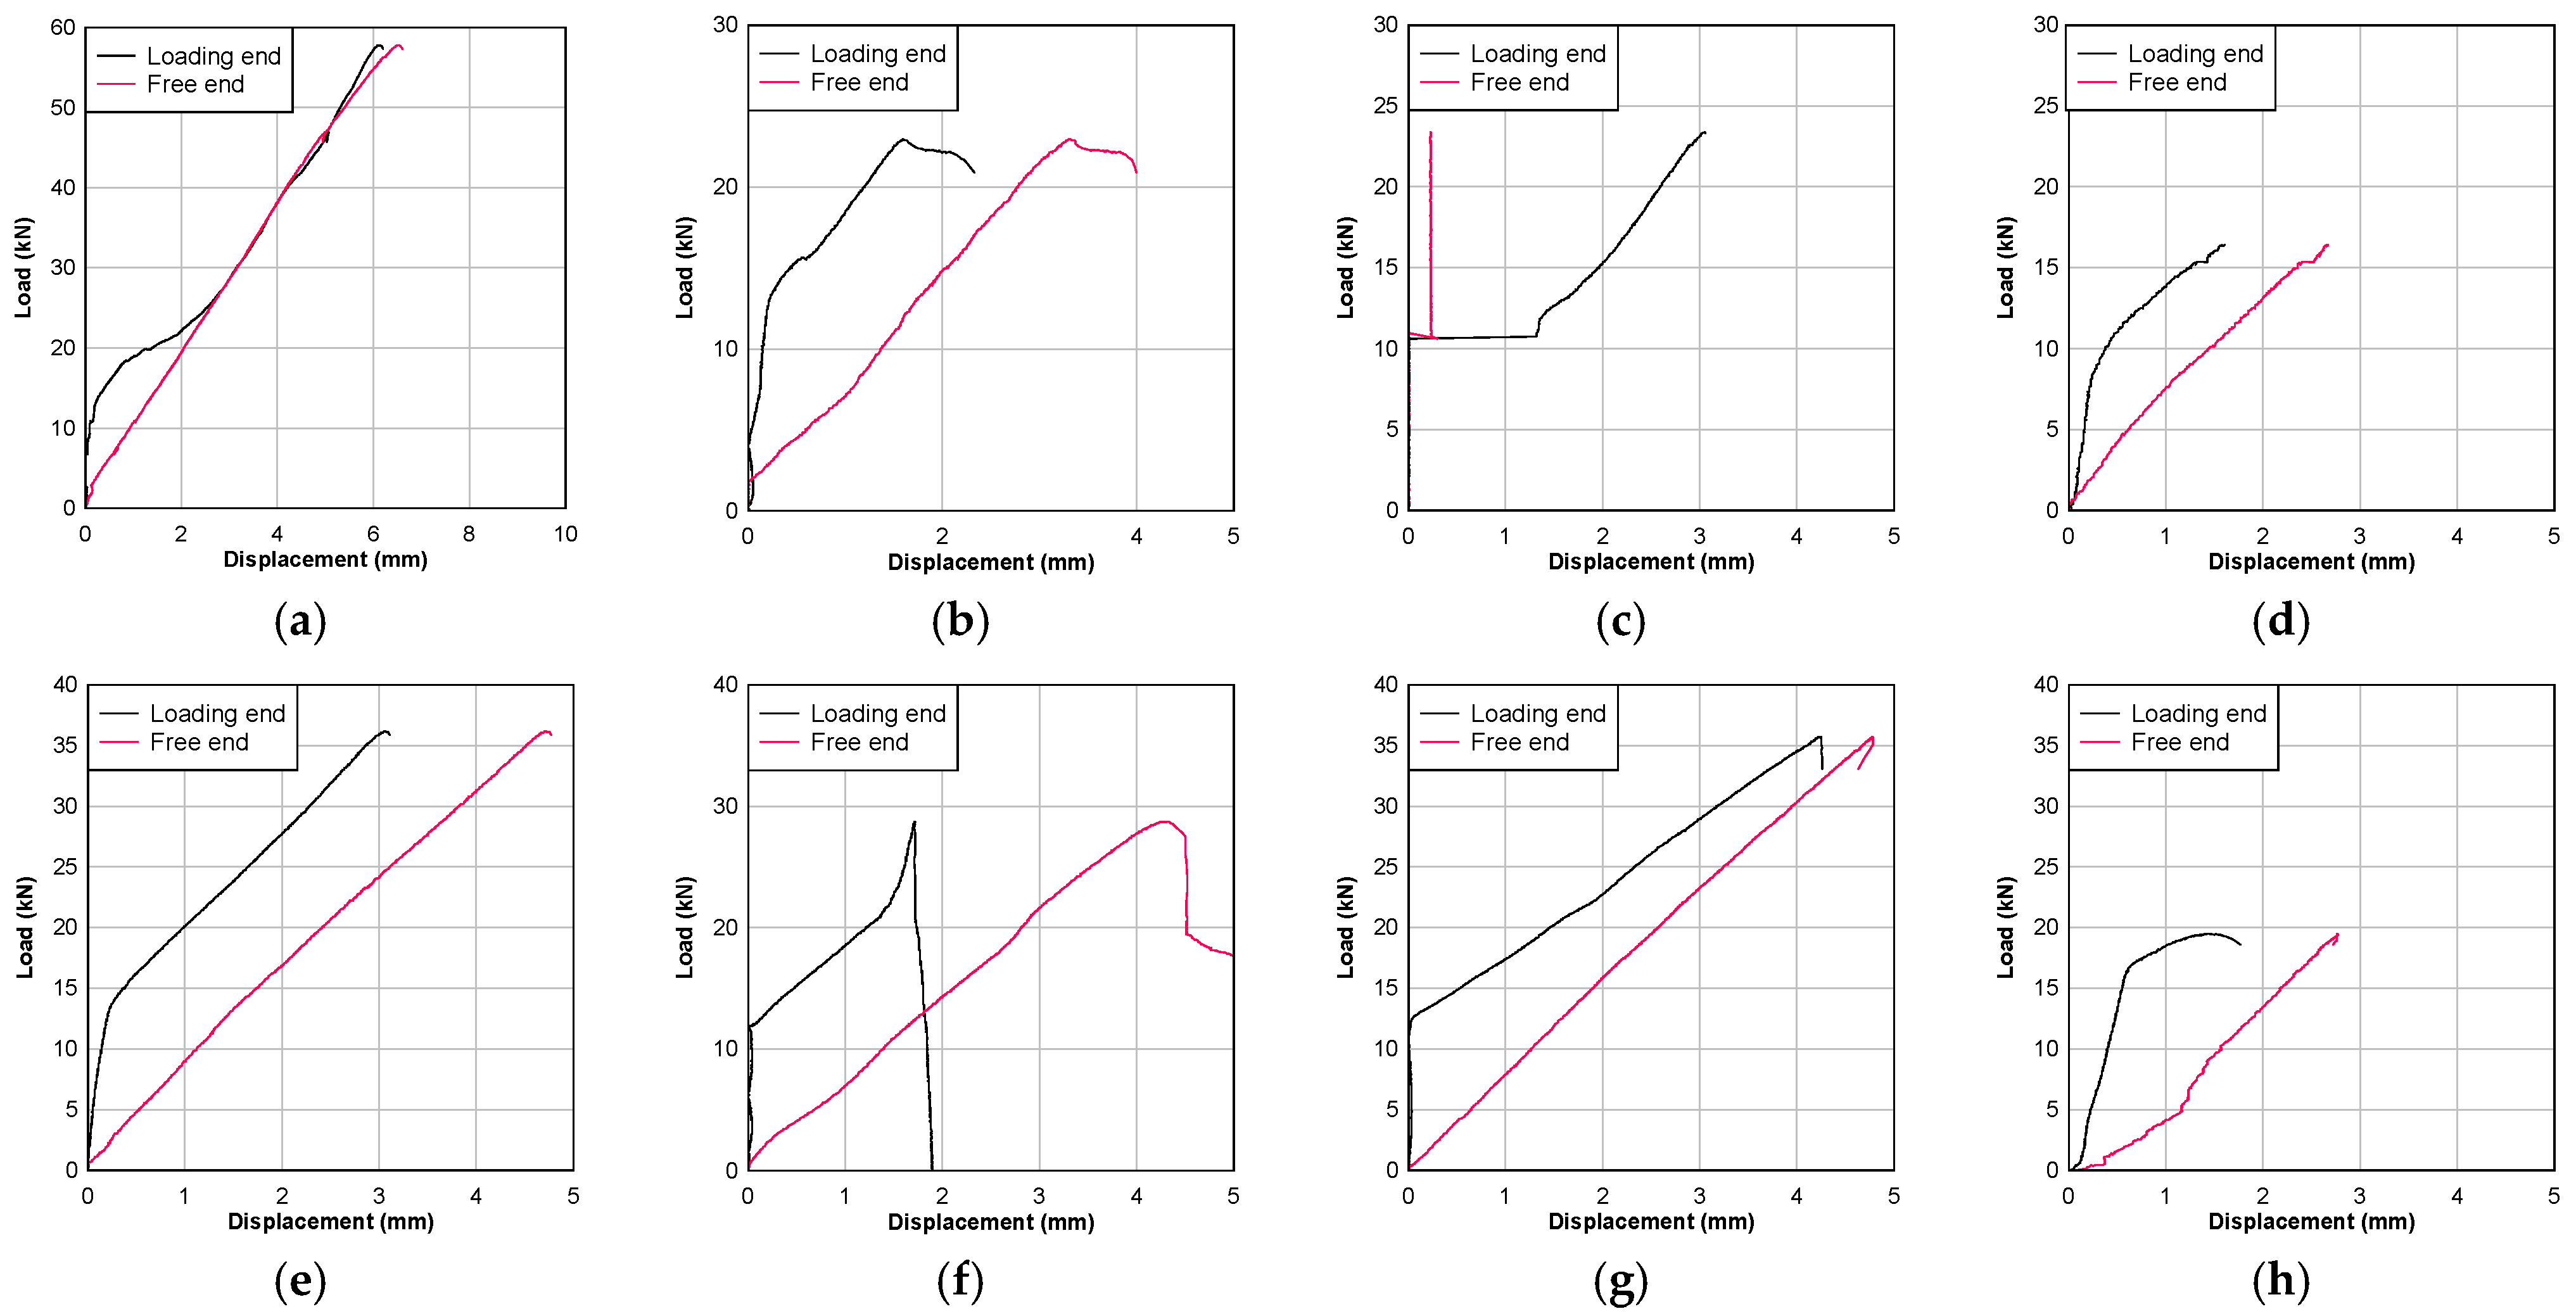
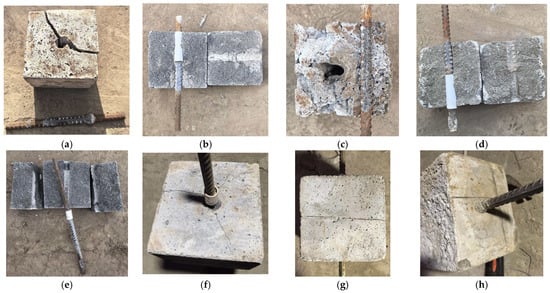
The laboratory pull-out tests showed that the steel–grout bond response was governed not only by the peak bond strength (see Figure 4), but also by the failure mode and the relative slips at the loaded and free ends (see Figure 5). Two distinct failure modes were observed: bar pull-out and mortar splitting. These modes should be interpreted separately. Pull-out failure represents progressive degradation of the ribbed steel–grout interface, in which the mechanical interlock between the ribs and surrounding grout is gradually mobilised and then lost. By contrast, splitting failure reflects radial cracking of the mortar block caused by the transverse wedging action of the ribbed bar. Once splitting occurs, the post-peak response is controlled by fracture of the surrounding mortar rather than by stable interfacial sliding. Therefore, the ascending branch of the load-slip curve is more meaningful for splitting specimens than the post-peak branch.
Figure 4.
Load–displacement curves of laboratory pull-out specimens: (a) SP1. (b) SP2. (c) SP3. (d) SP4. (e) SP5. (f) SP6. (g) SP7. (h) SP8.
Figure 5.
Failure modes of laboratory pull-out specimens: (a) SP1. (b) SP2. (c) SP3. (d) SP4. (e) SP5. (f) SP6. (g) SP7. (h) SP8.
This distinction is consistent with previous pull-out studies on bar-mortar systems [18]. In the GFRP bar-mortar pull-out study, the authors showed that bond strength was affected by both bar diameter and mortar strength, and that splitting failure occurred when the surrounding mortar could not provide sufficient radial confinement. Although the reinforcement material in the present study was threaded steel rather than GFRP, the same mechanical principle applies: the measured average bond strength is an apparent bond parameter controlled by the interaction among bar geometry, grout strength, bonded length, and specimen confinement. Therefore, the average bond strength in Table 3 should not be interpreted as a pure material constant of the grout. It is a specimen-scale bond index for comparing different grout–bar configurations.
Table 3.
Laboratory pull-out results.
The peak pull-out load ranged from 16.42 kN in SP4 to 57.82 kN in SP1, and the corresponding average ultimate bond strength ranged from 5.51 to 10.23 MPa (Table 3). The highest individual value was obtained by SP1, the SAC specimen with a 16 mm bar and a bonded length of 112.5 mm. This result indicates that SAC can develop strong local bond resistance when the bar diameter and bonded length provide sufficient mechanical engagement and when splitting is avoided. However, the overall ranking was not governed by grout type alone. Across all four configurations for each grout, the mean bond strength of OPC was slightly higher than that of SAC, approximately 7.33 MPa compared with 6.91 MPa. Therefore, the laboratory results show that SAC developed steel–grout bond resistance comparable to OPC at 28 d, but they do not demonstrate a general bond-strength advantage of SAC over OPC. The absence of repeated specimens for each grout-diameter-bonded length configuration limits the quantification of experimental variability.
The load–displacement curves further support this interpretation (Figure 4). Specimens with pull-out failure generally showed a more continuous load increase and measurable slip development at both the loaded and free ends, indicating progressive bond mobilisation along the bonded length. Specimens with splitting failure showed more brittle responses, with limited free-end slip in some cases before sudden loss of resistance. In several specimens, the recorded free-end slip was larger than the loaded-end slip at peak load. This difference is attributed to the use of different displacement reference points and to the combined effects of specimen deformation, support compliance, and gauge seating. Therefore, the loaded-end and free-end slip values are used here as measured displacement indicators of the pull-out process, rather than as direct local bond-slip values at the steel–grout interface. This distinction is consistent with previous pull-out studies on bar-mortar systems [17]. In the GFRP bar-mortar pull-out study, the authors showed that bond strength was affected by both bar diameter and mortar strength, and that splitting failure occurred when the surrounding mortar could not provide sufficient radial confinement.
The effect of bar diameter was also configuration-dependent. For SAC, increasing the bar diameter from 12 to 16 mm increased the bond strength for both bonded lengths, especially at the longer bonded length. For OPC, the 16 mm bar increased the bond strength at the shorter bonded length but reduced it at the longer bonded length. This non-monotonic behaviour agrees with the general observation from the pull-out literature that a larger bar diameter does not necessarily produce a higher average bond strength. A larger diameter increases the contact area and rib-bearing capacity, but it also increases radial splitting demand and stress non-uniformity along the bonded length. As a result, the apparent bond strength depends on whether the specimen response is governed by interfacial pull-out or by splitting of the surrounding grout.
4. Field Anchor Pull-Out Test Results
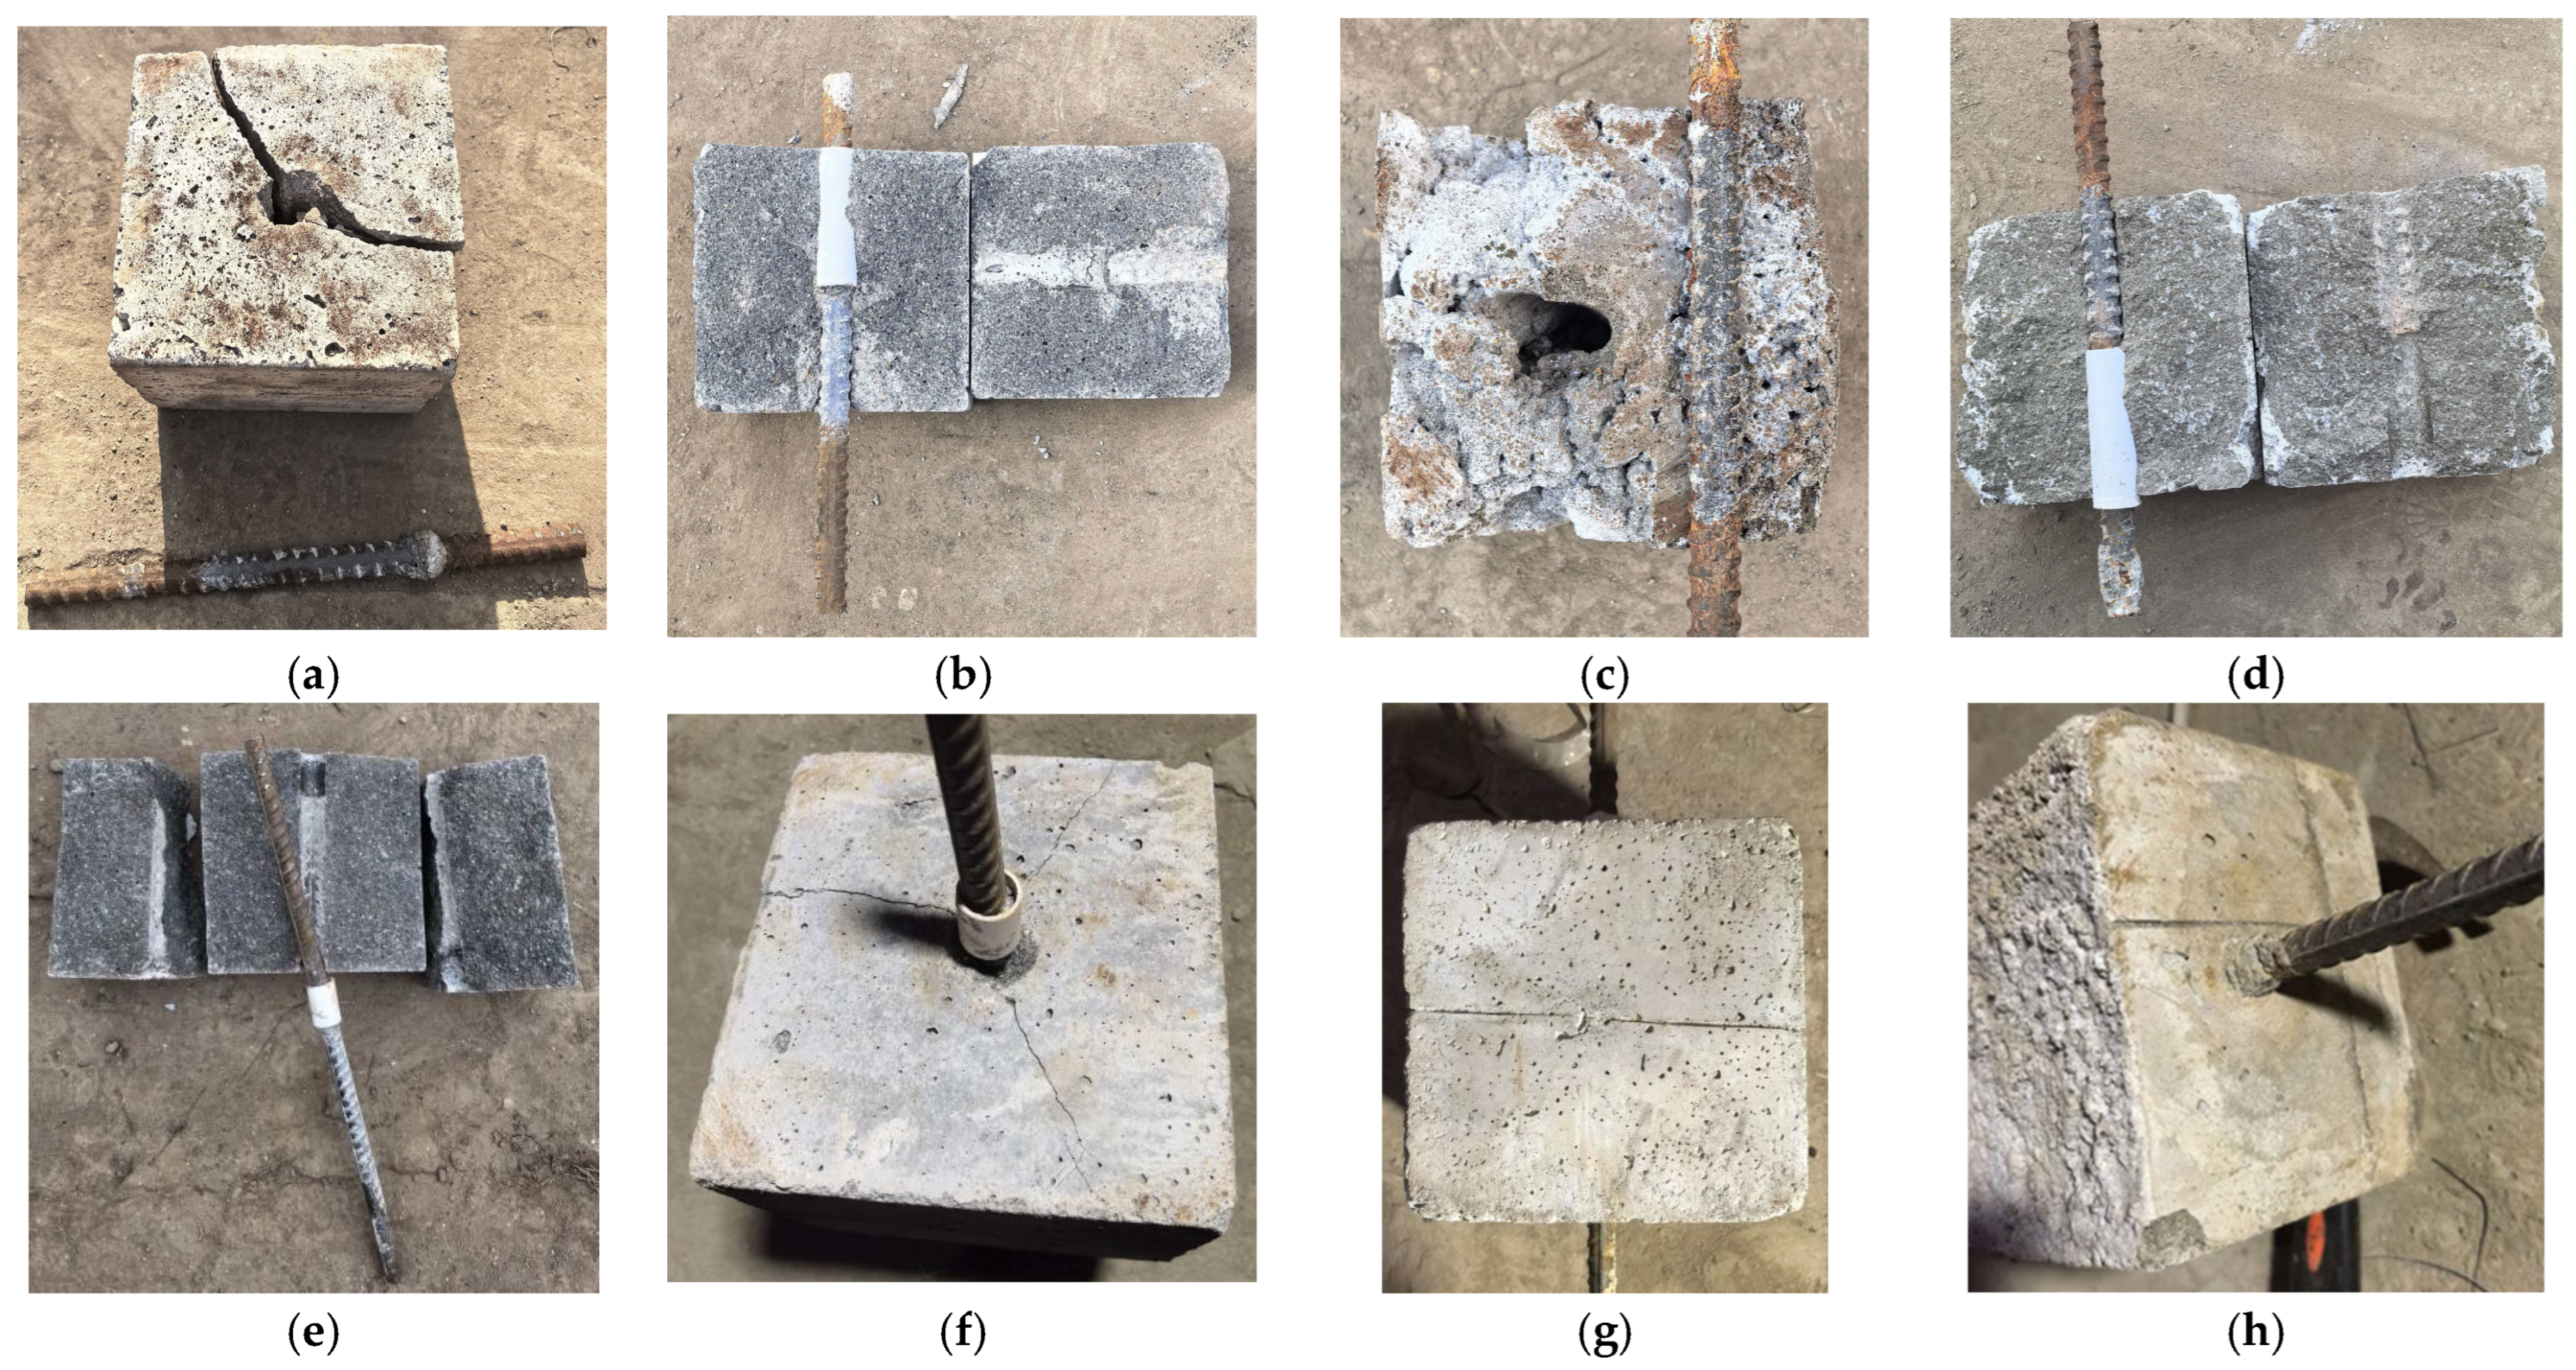
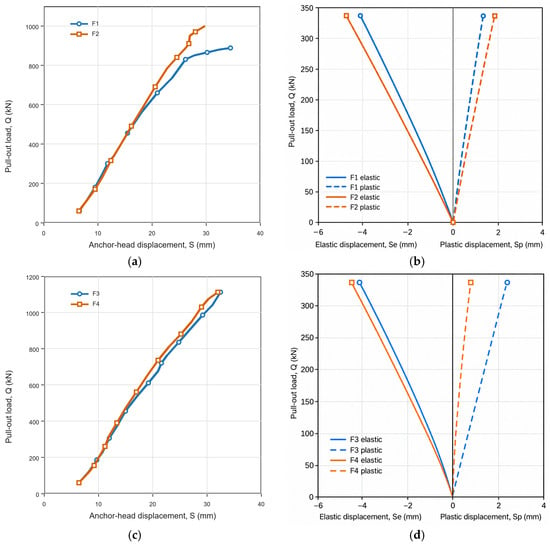
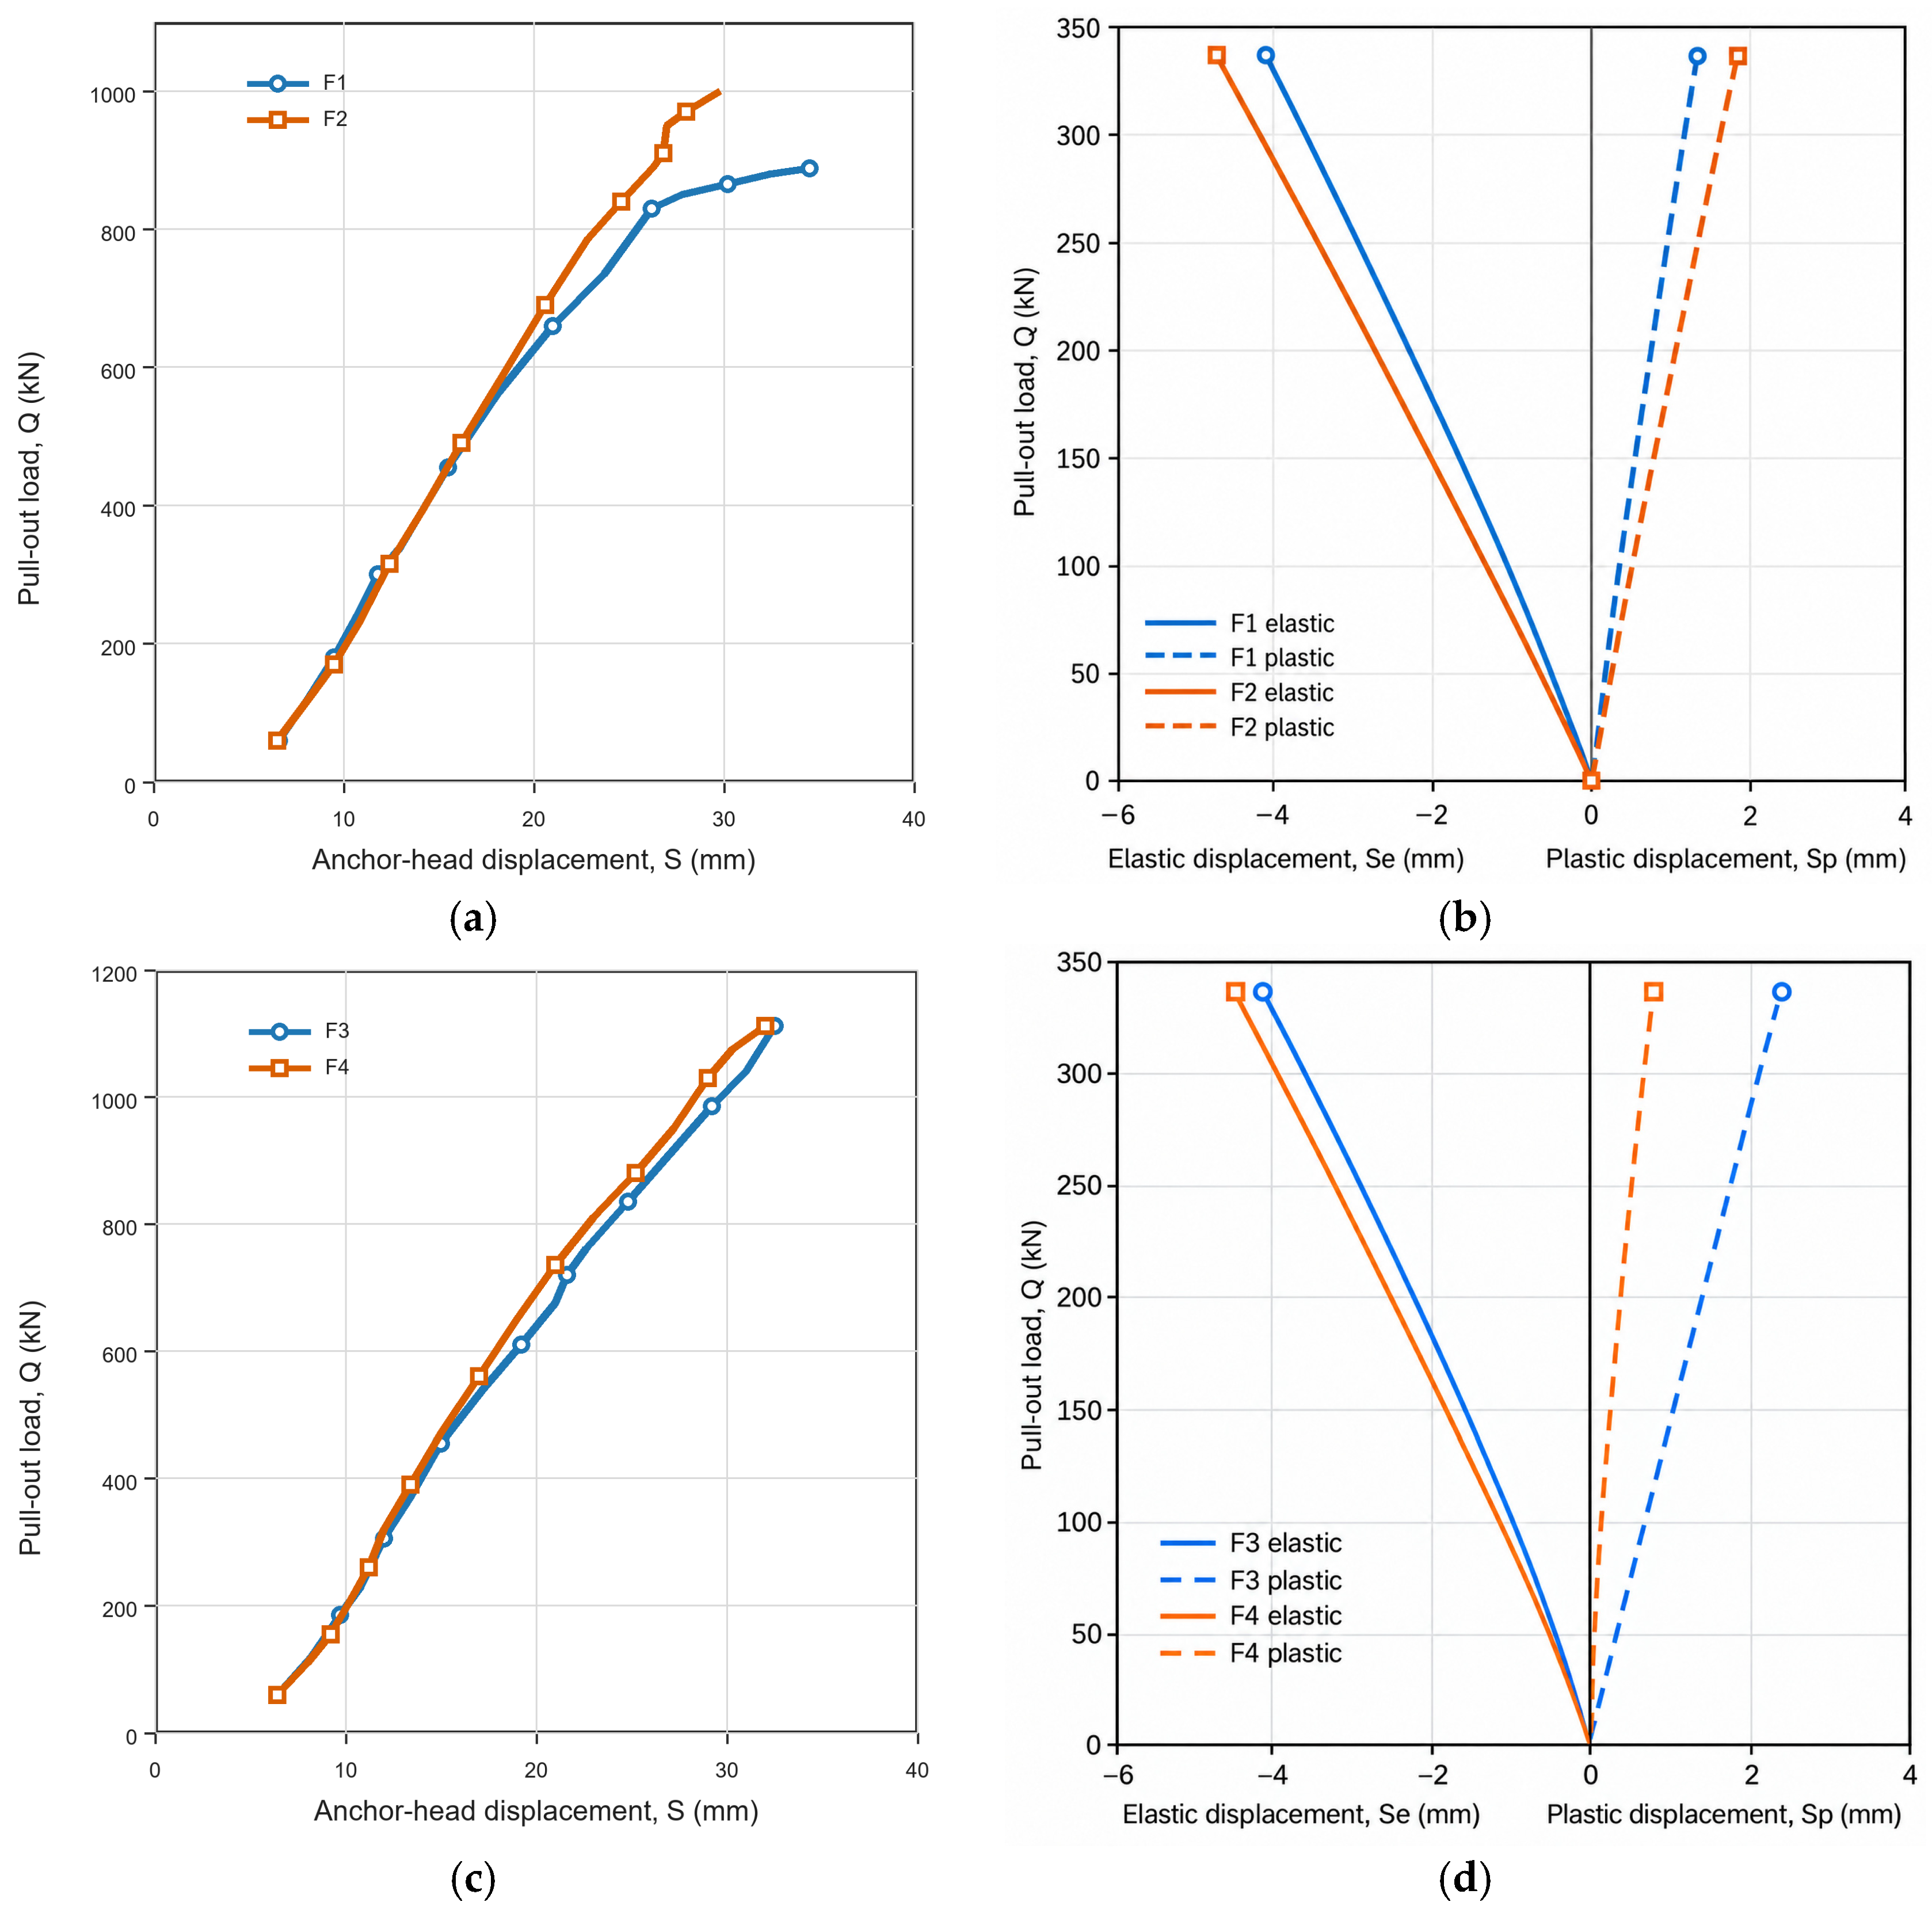
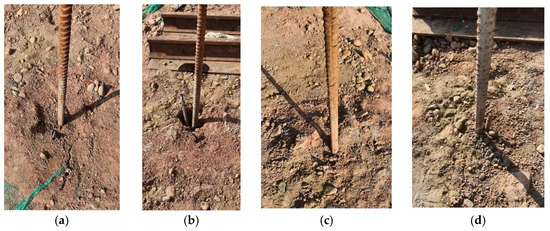
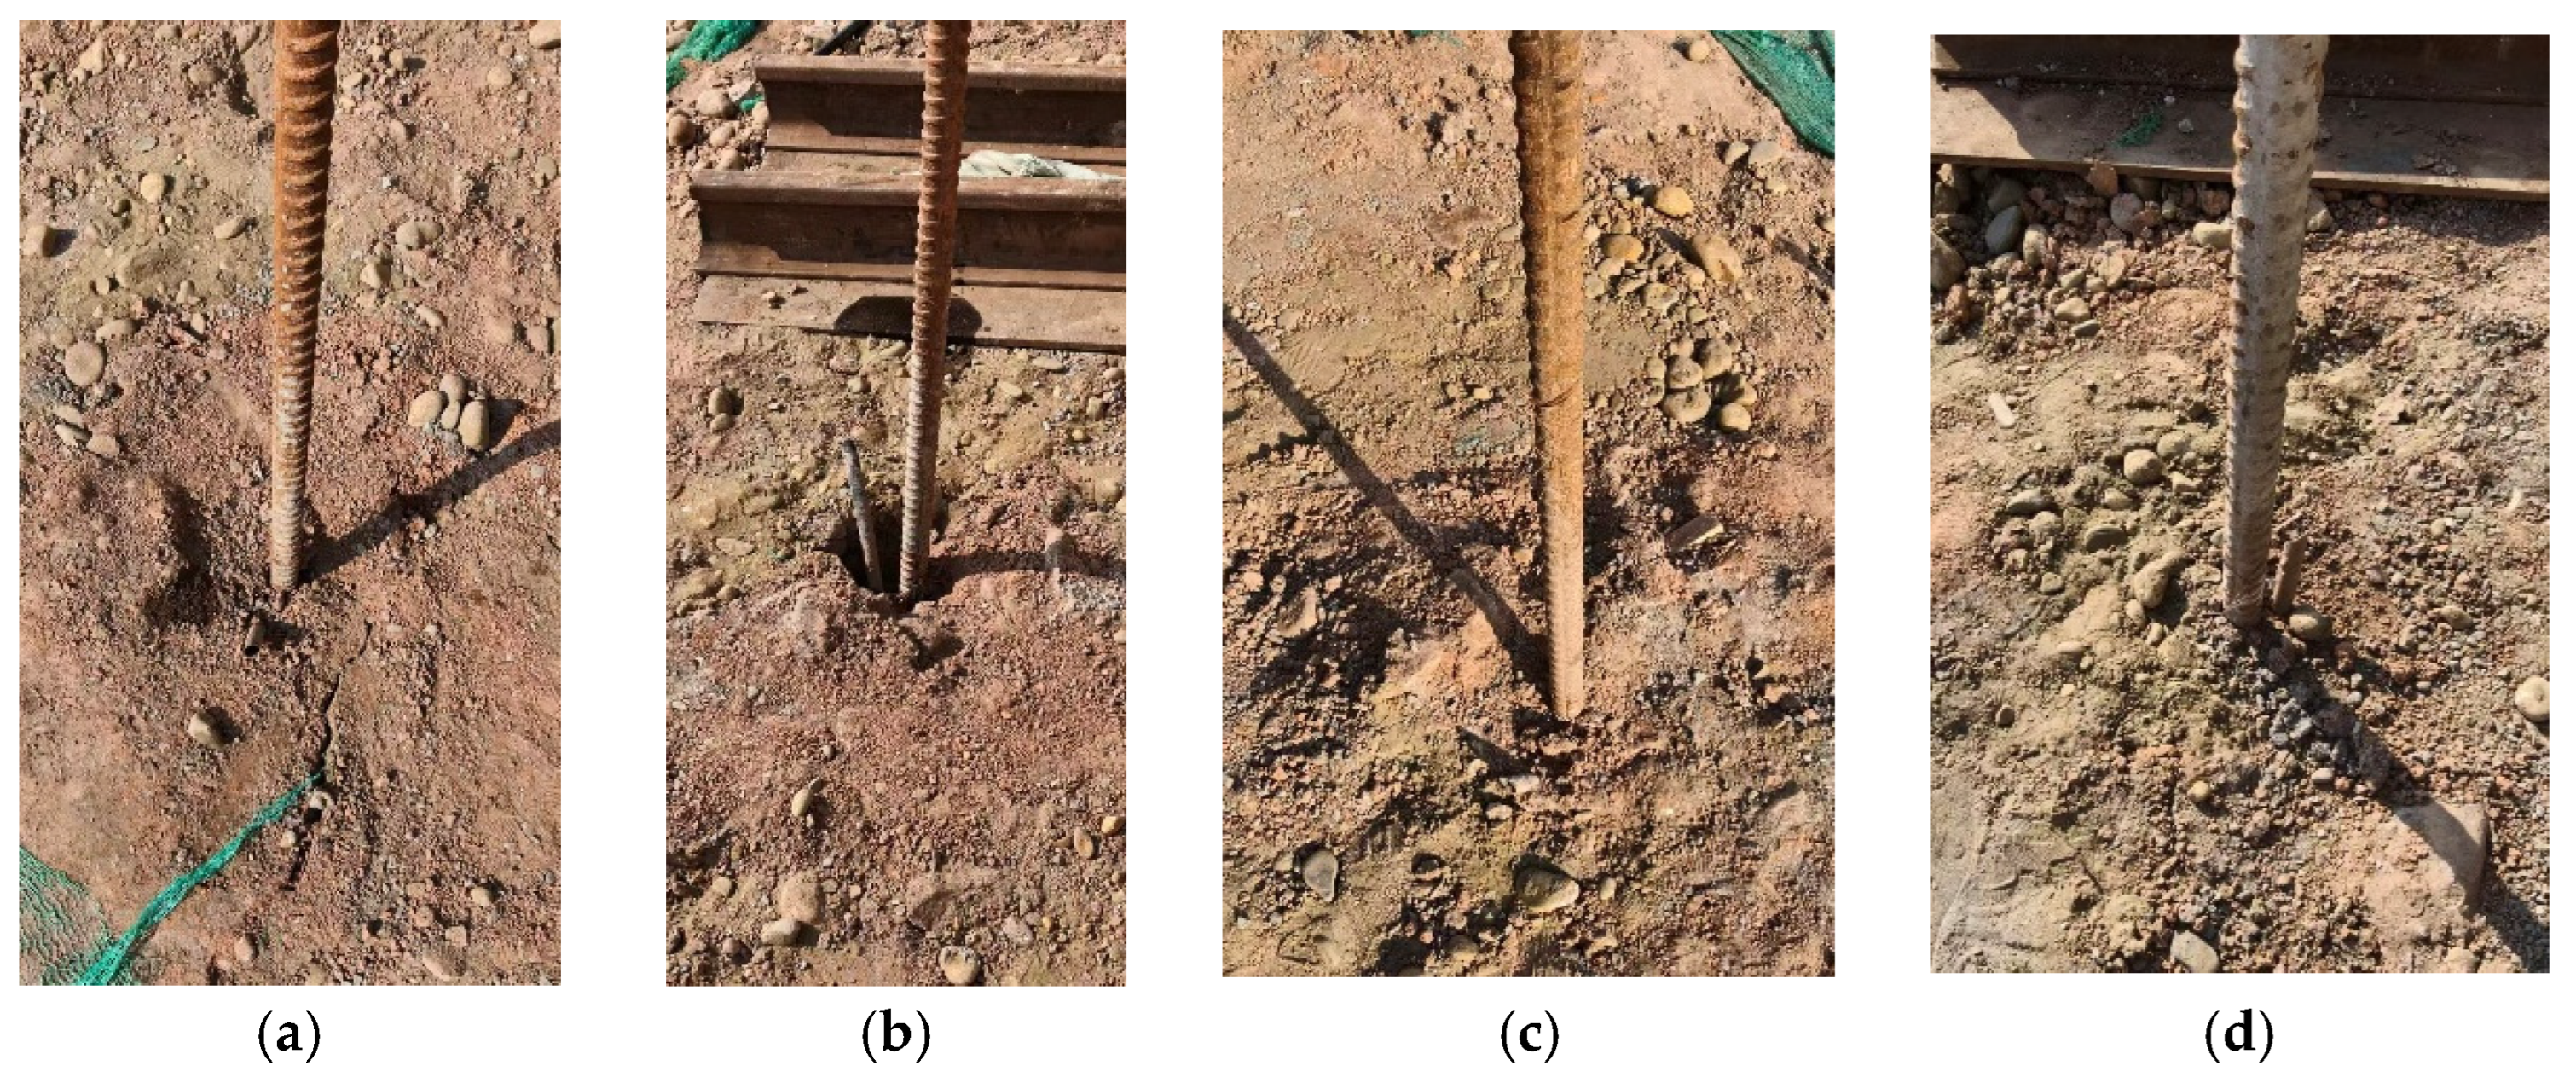
The field pull-out tests showed a clear difference between the two grout systems (Figure 6). The two SAC anchors reached ultimate pull-out loads of 888 and 1000 kN, with an average value of 944 kN. In comparison, the two OPC anchors both reached 1112 kN. Thus, the present field tests do not indicate a higher ultimate pull-out capacity for SAC than for OPC. Instead, they show that the SAC could provide a field pull-out resistance of the same order as the OPC reference grout under water-rich sandy-pebble ground conditions. The identical 1112 kN values recorded for the two OPC anchors correspond to measured pull-out failure loads, not to a maximum load limit imposed by the test protocol. All four anchors failed by pull-out rather than tensile rupture of the steel bar, indicating that the ultimate resistance of the field anchors was governed by interfacial resistance around the grouted body rather than by the tensile capacity of the PSB1080 steel bar (Figure 7).
Figure 6.
Field pull-out state of the anchor–grout system: (a) Load–displacement curve of SAC. (b) Anchor load-elastic/plastic displacement curve of SAC. (c) Load–displacement curve of OPC. (d) Anchor load-elastic/plastic displacement curve of OPC.
Figure 7.
Failure mode of field anchor pull-out test: (a) F1. (b) F2. (c) F3. (d) F4.
The load–displacement curves further indicate different deformation characteristics between SAC and OPC anchors. For the SAC anchors, the pull-out response was approximately linear at the initial loading stage, followed by a gradual increase in displacement increment as the load approached the upper range. This suggests progressive mobilisation and degradation of the grout–ground interface under increasing pull-out load. In contrast, the OPC anchors showed a more nearly linear load–displacement response over most of the loading process, and the displacement increment between load steps was relatively uniform. Because only two anchors were tested for each grout system, this difference is interpreted as descriptive field evidence rather than as a statistically verified material effect. The observed difference may reflect the combined influence of grout type, local ground variability, and construction-dependent formation of the grout–ground interface. The original field report did not provide grouting pressure, grout consumption, exact anchor spacing, or specimen-specific grain-size distributions along each bonded length; these missing construction records are considered when interpreting the field-test scatter.
The anchor load-elastic/plastic displacement curves provide further insight into the damage process at the grout–ground interface (Figure 6b,d). In these curves, the elastic displacement represents the recoverable deformation of the anchor system during unloading, whereas the plastic displacement represents the residual displacement after unloading. Since the anchors were pulled out as an integrated steel-bar–grout body and no separation between the steel bar and grout was observed, the accumulated plastic displacement should mainly be attributed to irreversible slip and damage at the grout–ground interface rather than to steel–grout debonding. For the SAC anchors, the plastic displacement increased with load and became more evident at higher load levels, indicating gradual degradation of the interface resistance in the surrounding ground. The OPC anchors showed smaller and more stable plastic displacement development under comparable load levels, suggesting a more stable grout–ground interaction before final pull-out. Therefore, the elastic/plastic displacement decomposition supports the interpretation that the field pull-out response was controlled by damage evolution at the grout–ground interface.
5. Finite Element Analysis
5.1. FEM Model
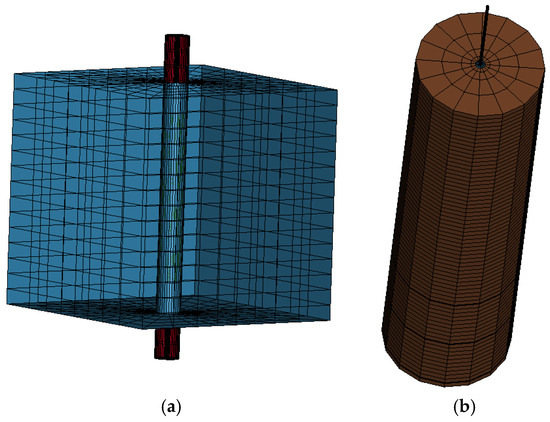
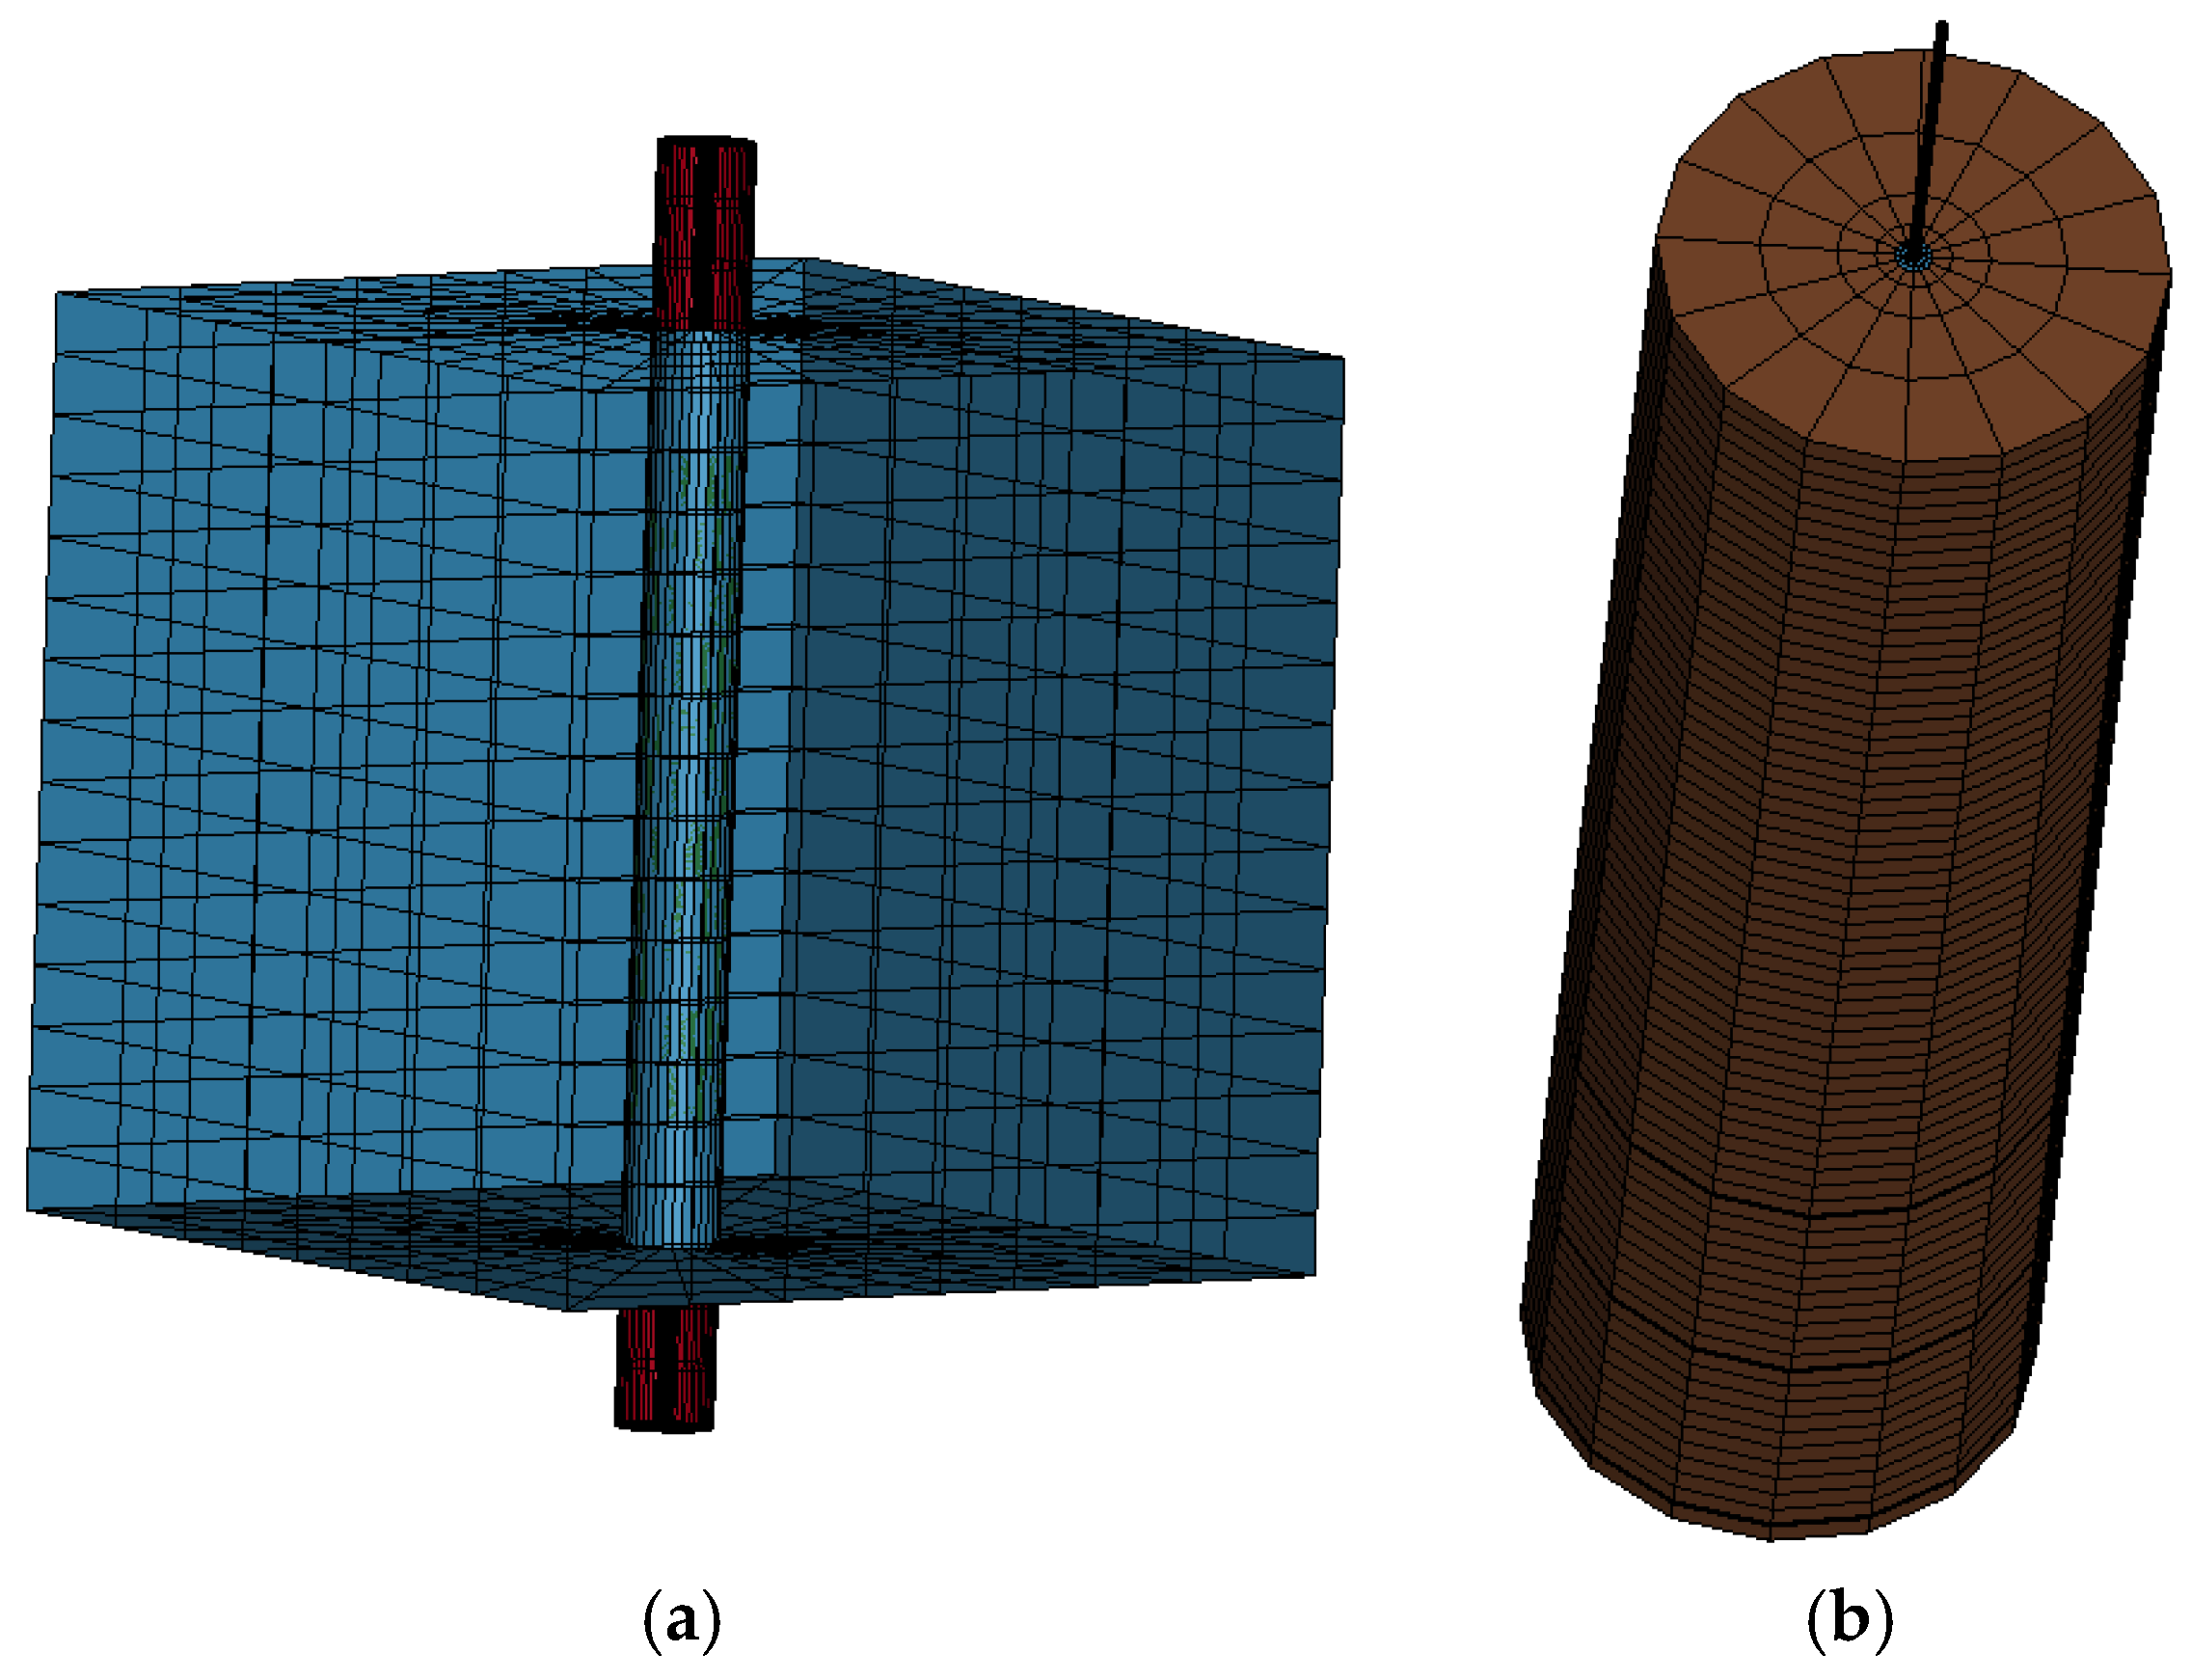
The pull-out behaviour was simulated using the explicit nonlinear finite element code LS-DYNA. Two numerical models were established to represent the two experimental scales in this study: the laboratory steel–grout pull-out model and the field anchor–grout–ground pull-out model (Figure 8). The laboratory model was developed to reproduce the steel–grout bond response measured in the central pull-out specimens, whereas the field model was developed to reproduce the anchor–grout–ground response measured in the full-scale anchor tests. In this modelling strategy, the interface parameters were selected by matching the measured load–displacement response and the observed failure mode at the corresponding scale.
Figure 8.
FE models: (a) Laboratory pull-out FEM model. (b) Field anchor pull-out FEM model.
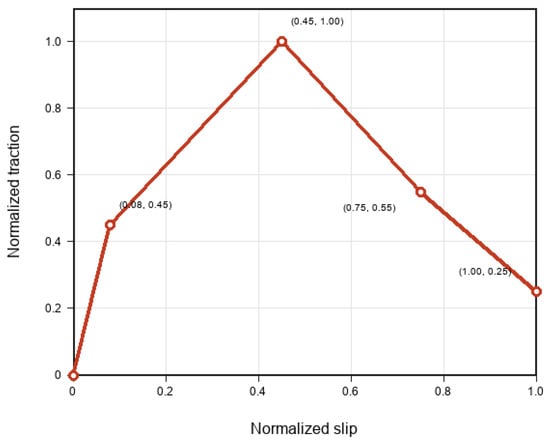
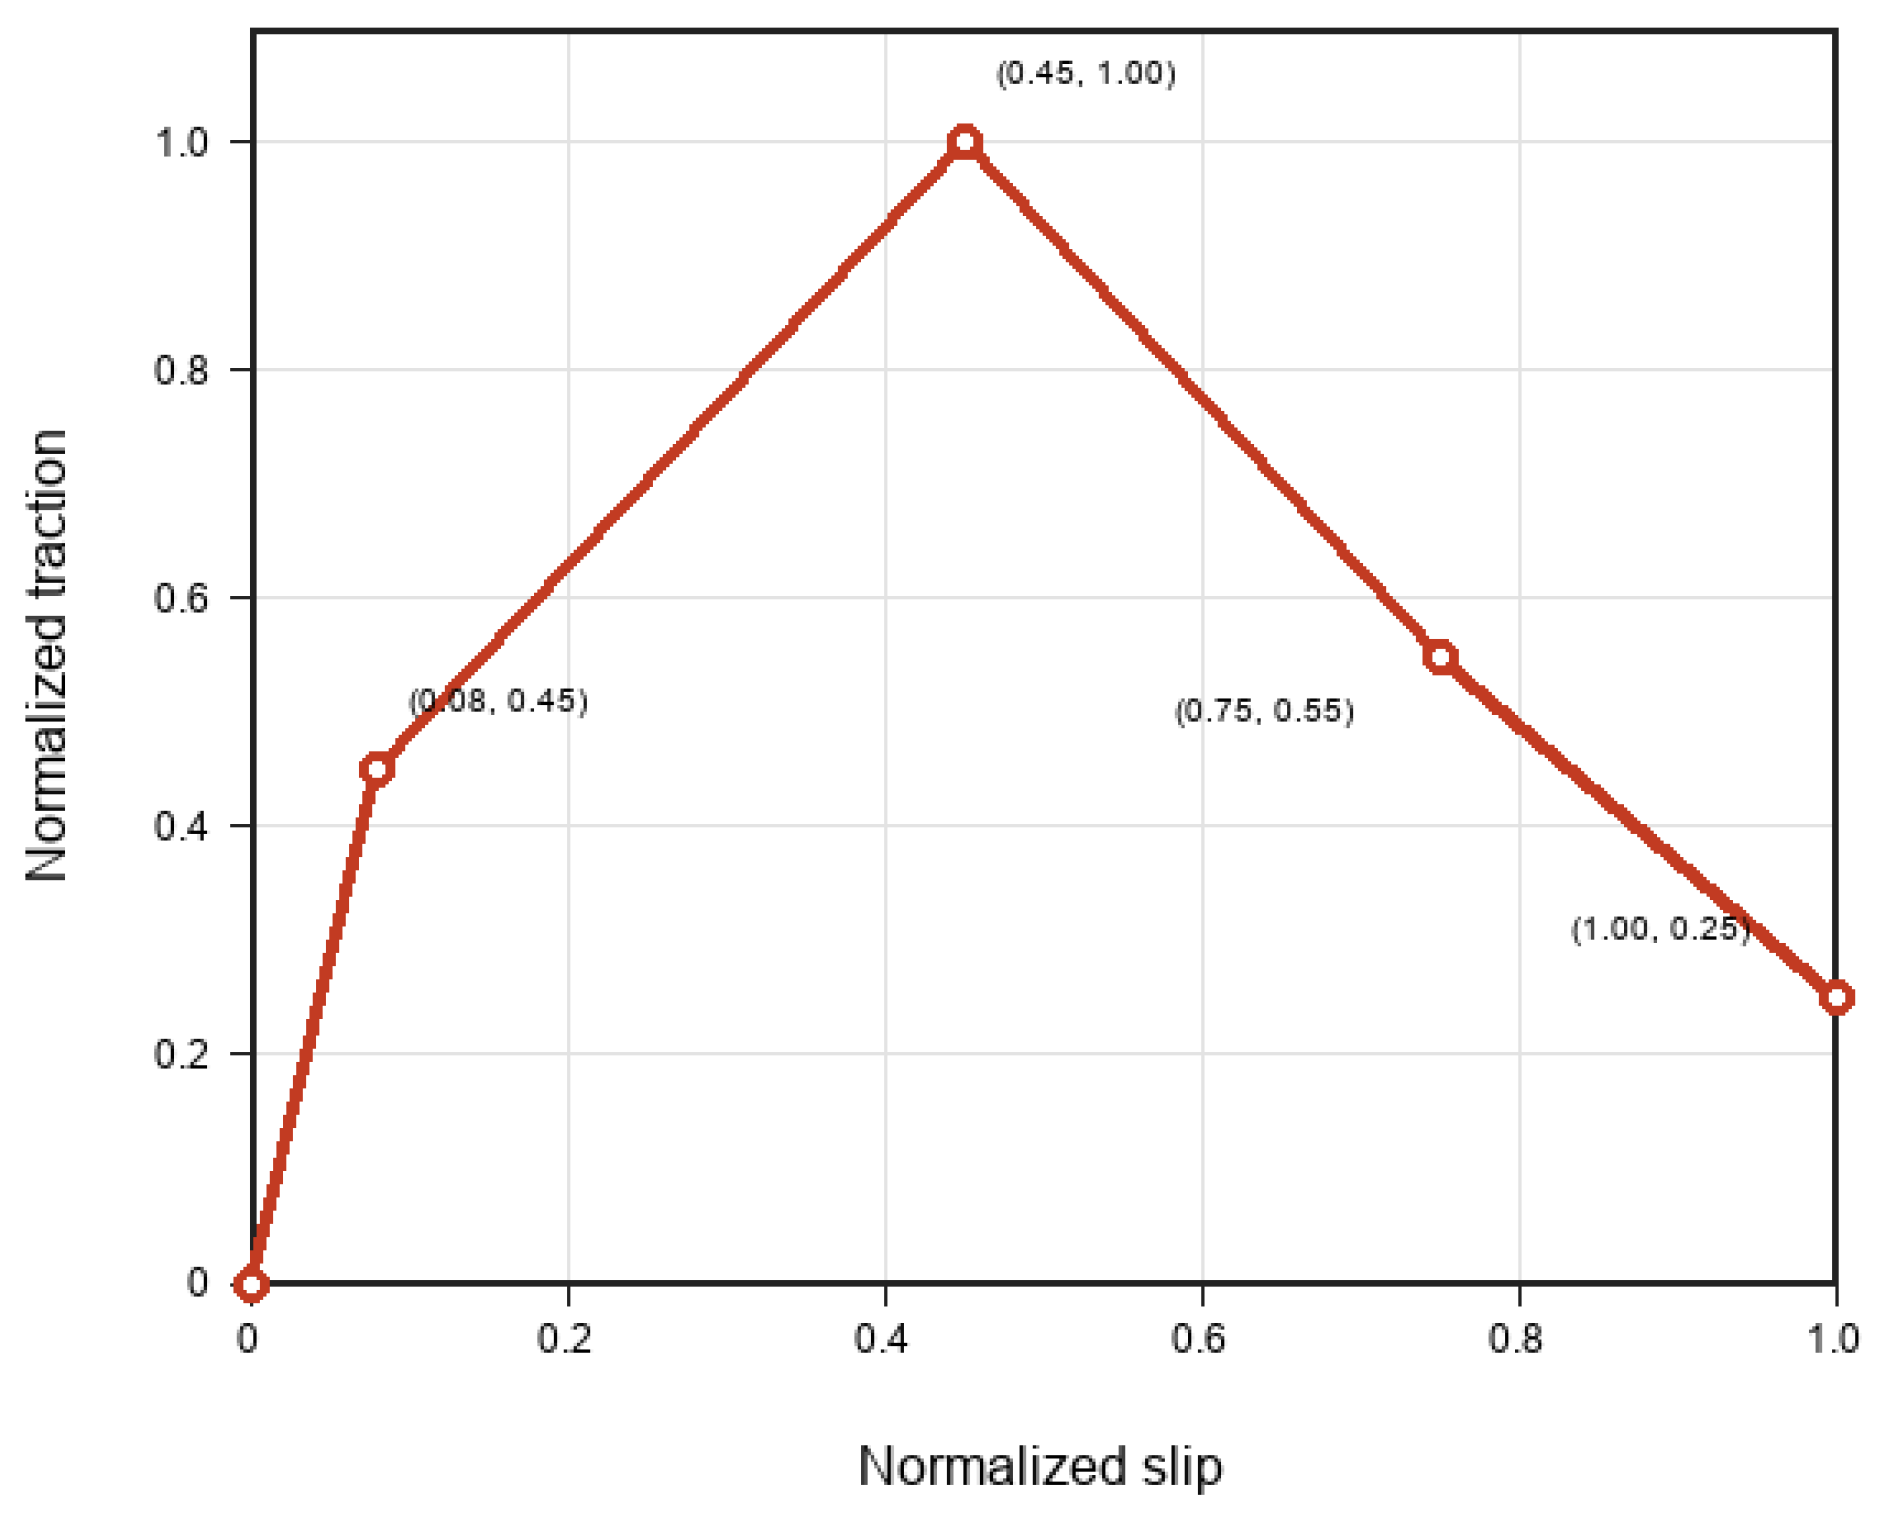
For the laboratory model, the computational domain included the 150 mm hardened grout cube and the exposed steel-bar segments. A representative laboratory model contained 5184 nodes and 4096 solid elements. The steel bar was modelled using *MAT_ELASTIC, with a density of 7850 kg/m3, an elastic modulus of 206,000 MPa, and a Poisson’s ratio of 0.30. The hardened grout was modelled using *MAT_CSCM_CONCRETE, with a density of 2400 kg/m3, an elastic modulus of 20,000 MPa, a Poisson’s ratio of 0.30, and a compressive strength corresponding to the measured 28-day strength. The steel–grout bond zone was represented using *MAT_COHESIVE_GENERAL. The normalised traction-slip softening curve was defined by the points (0, 0), (0.08, 0.45), (0.45, 1.00), (0.75, 0.55) and (1.00, 0.25) (Figure 9), and the peak shear strength of each specimen was calibrated according to the measured peak pull-out response. Axial displacement was prescribed at the loading end.
Figure 9.
Normalised traction-slip softening curve used for the cohesive steel–grout interface.
For the field model, the computational domain was approximately 1.85 m × 1.85 m × 8.41 m and included the PSB1080 steel bar, grout body, bearing bodies, and surrounding ground. A representative field model contained 9588 nodes and 8704 solid elements. The steel bar was modelled using *MAT_PLASTIC_KINEMATIC, with a density of 7850 kg/m3, an elastic modulus of 206,000 MPa, a Poisson’s ratio of 0.30 and a yield strength of 1080 MPa. The grout body was modelled using *MAT_CSCM_CONCRETE, with a density of 2400 kg/m3, an elastic modulus of 20,000 MPa, a Poisson’s ratio of 0.30, and a compressive strength corresponding to the measured 28-day strength. The surrounding ground was modelled using *MAT_ELASTIC, with an elastic modulus of 100 MPa and a Poisson’s ratio of 0.30. The bearing bodies were treated as rigid components using *MAT_RIGID. Two *CONTACT_AUTOMATIC_SURFACE_TO_SURFACE_TIEBREAK_MORTAR_ID interfaces were defined. The steel–grout contact used fs = 0.45 and fd = 0.35, while the representative OPC–ground contact used the calibrated parameters fs = 0.84 and fd = 0.68. Here, fs and fd are dimensionless static and dynamic friction parameters in the LS-DYNA contact definition. Axial displacement was prescribed at the loading end of the field anchor. The reaction force, nodal displacement, contact force, material energy, and global energy response were recorded through *DATABASE_RCFORC, *DATABASE_NODOUT, *DATABASE_RWFORC, *DATABASE_MATSUM, and *DATABASE_GLSTAT.
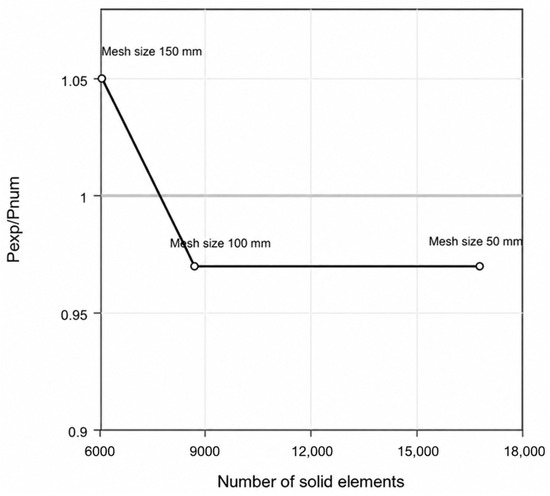
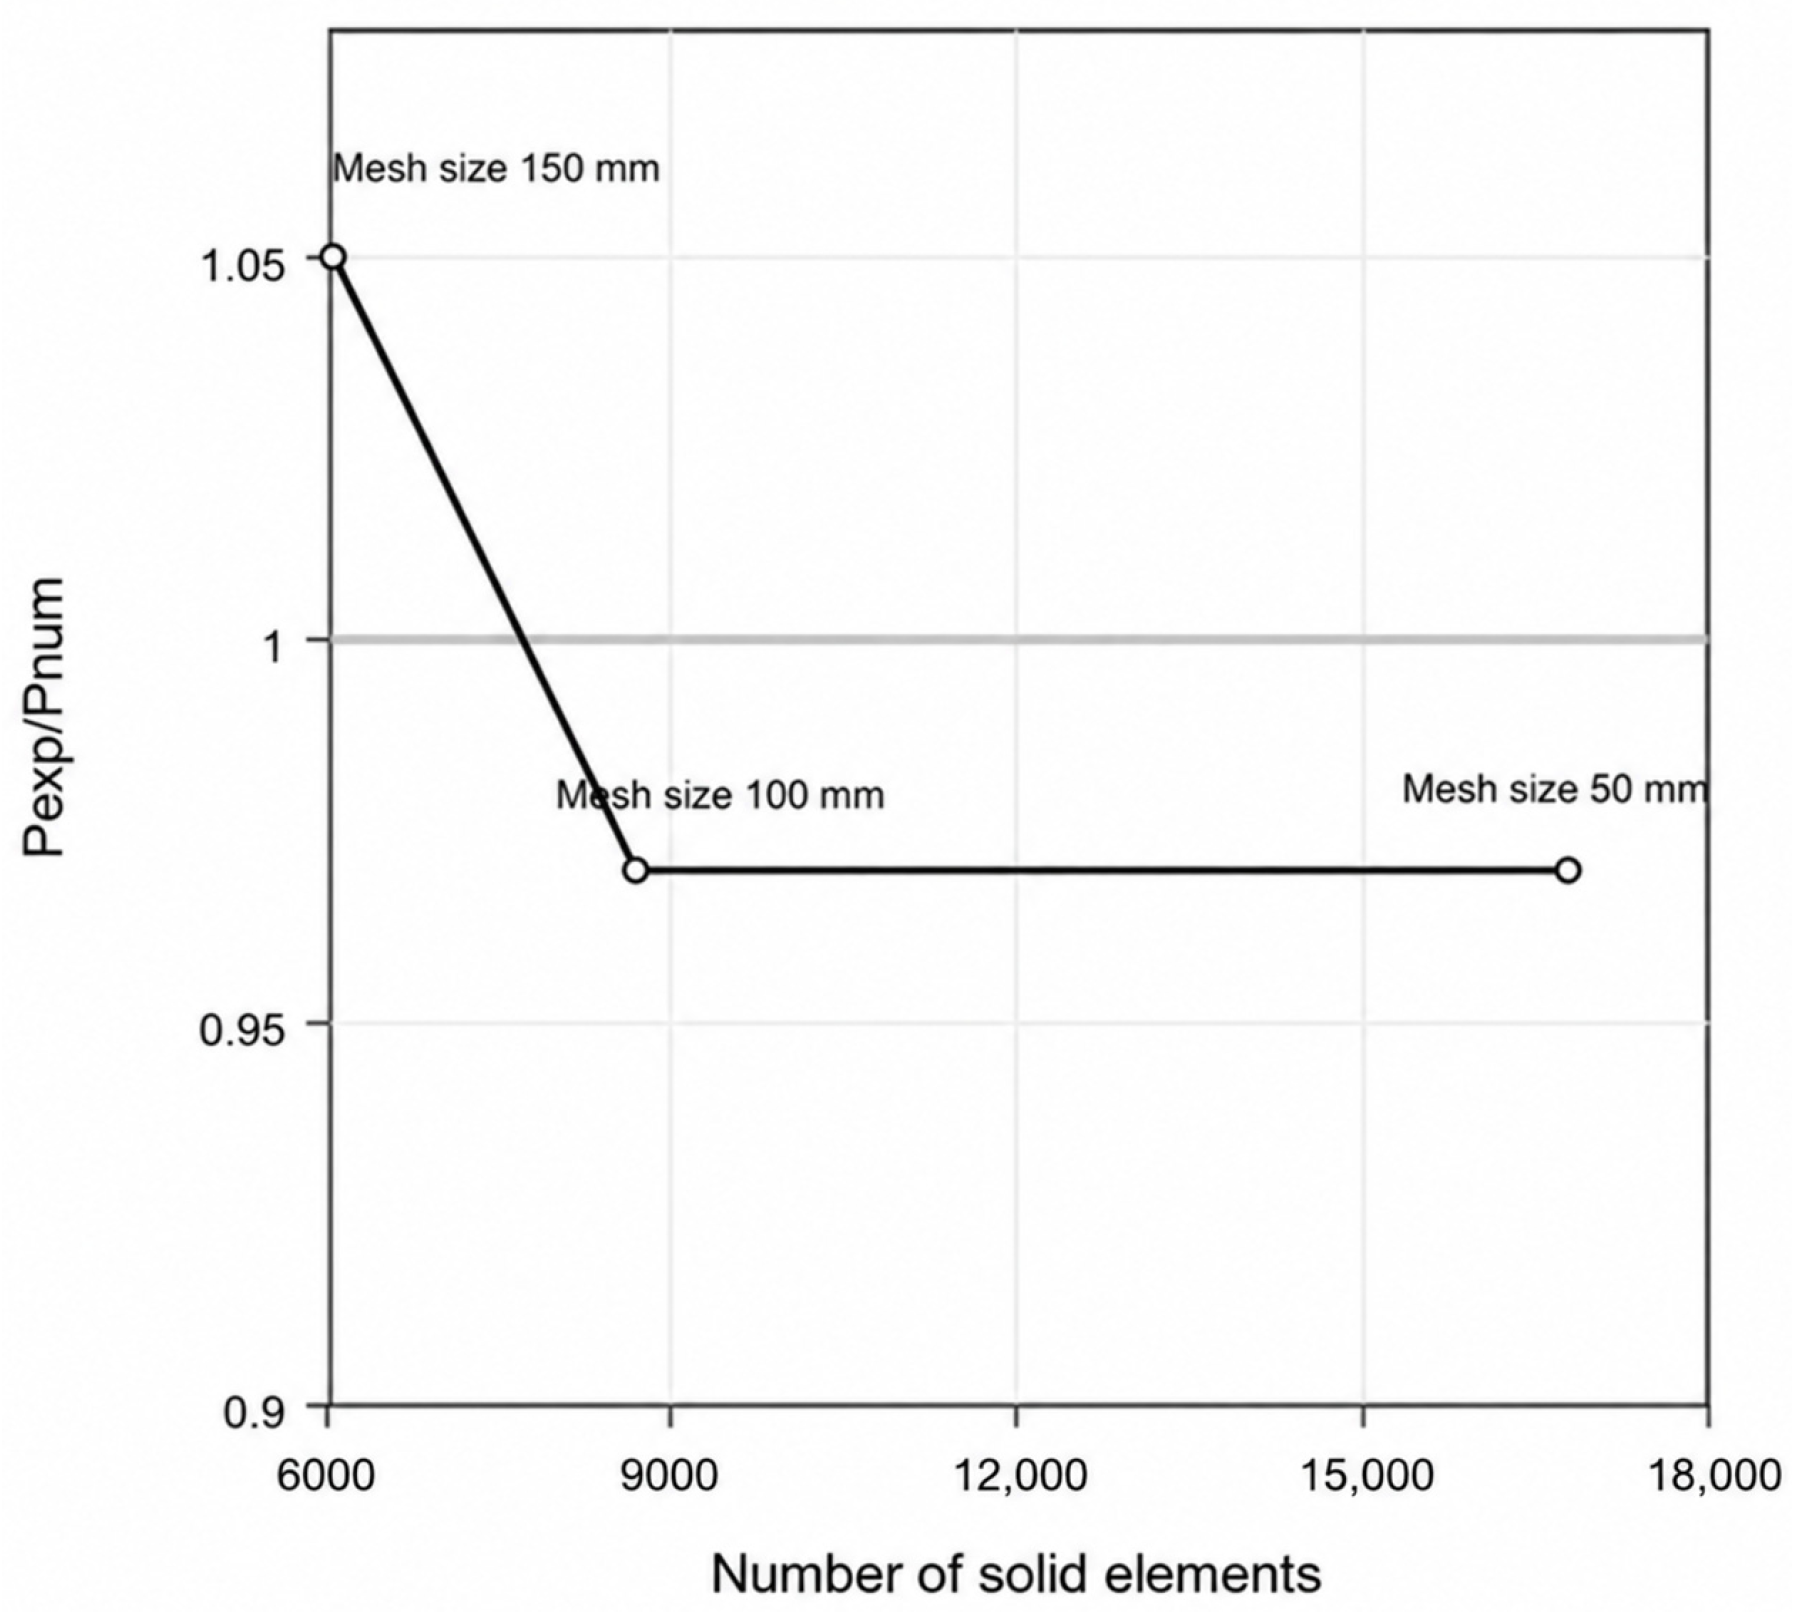
A mesh sensitivity analysis was conducted using the field OPC anchor model. Three nominal mesh sizes in the axial direction, 50, 100, and 150 mm, were examined while keeping the material parameters, contact definitions, boundary conditions, and loading history unchanged. The corresponding models contained 16,784, 8704 and 6080 solid elements, respectively. The predicted peak pull-out loads were 1140.7, 1141.5, and 1058.9 kN, compared with the experimental peak load of 1112 kN. The corresponding load ratios were 0.97, 0.97, and 1.05, indicating that the 100 mm mesh provided a reasonable balance between peak-load accuracy and computational cost. Therefore, the 100 mm mesh was adopted in the subsequent field-scale simulations (Figure 10).
Figure 10.
Mesh sensitivity analysis of the field OPC anchor model.
5.2. Laboratory Pull-Out Test
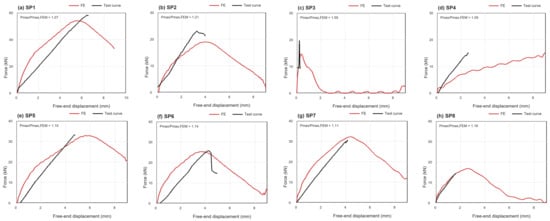
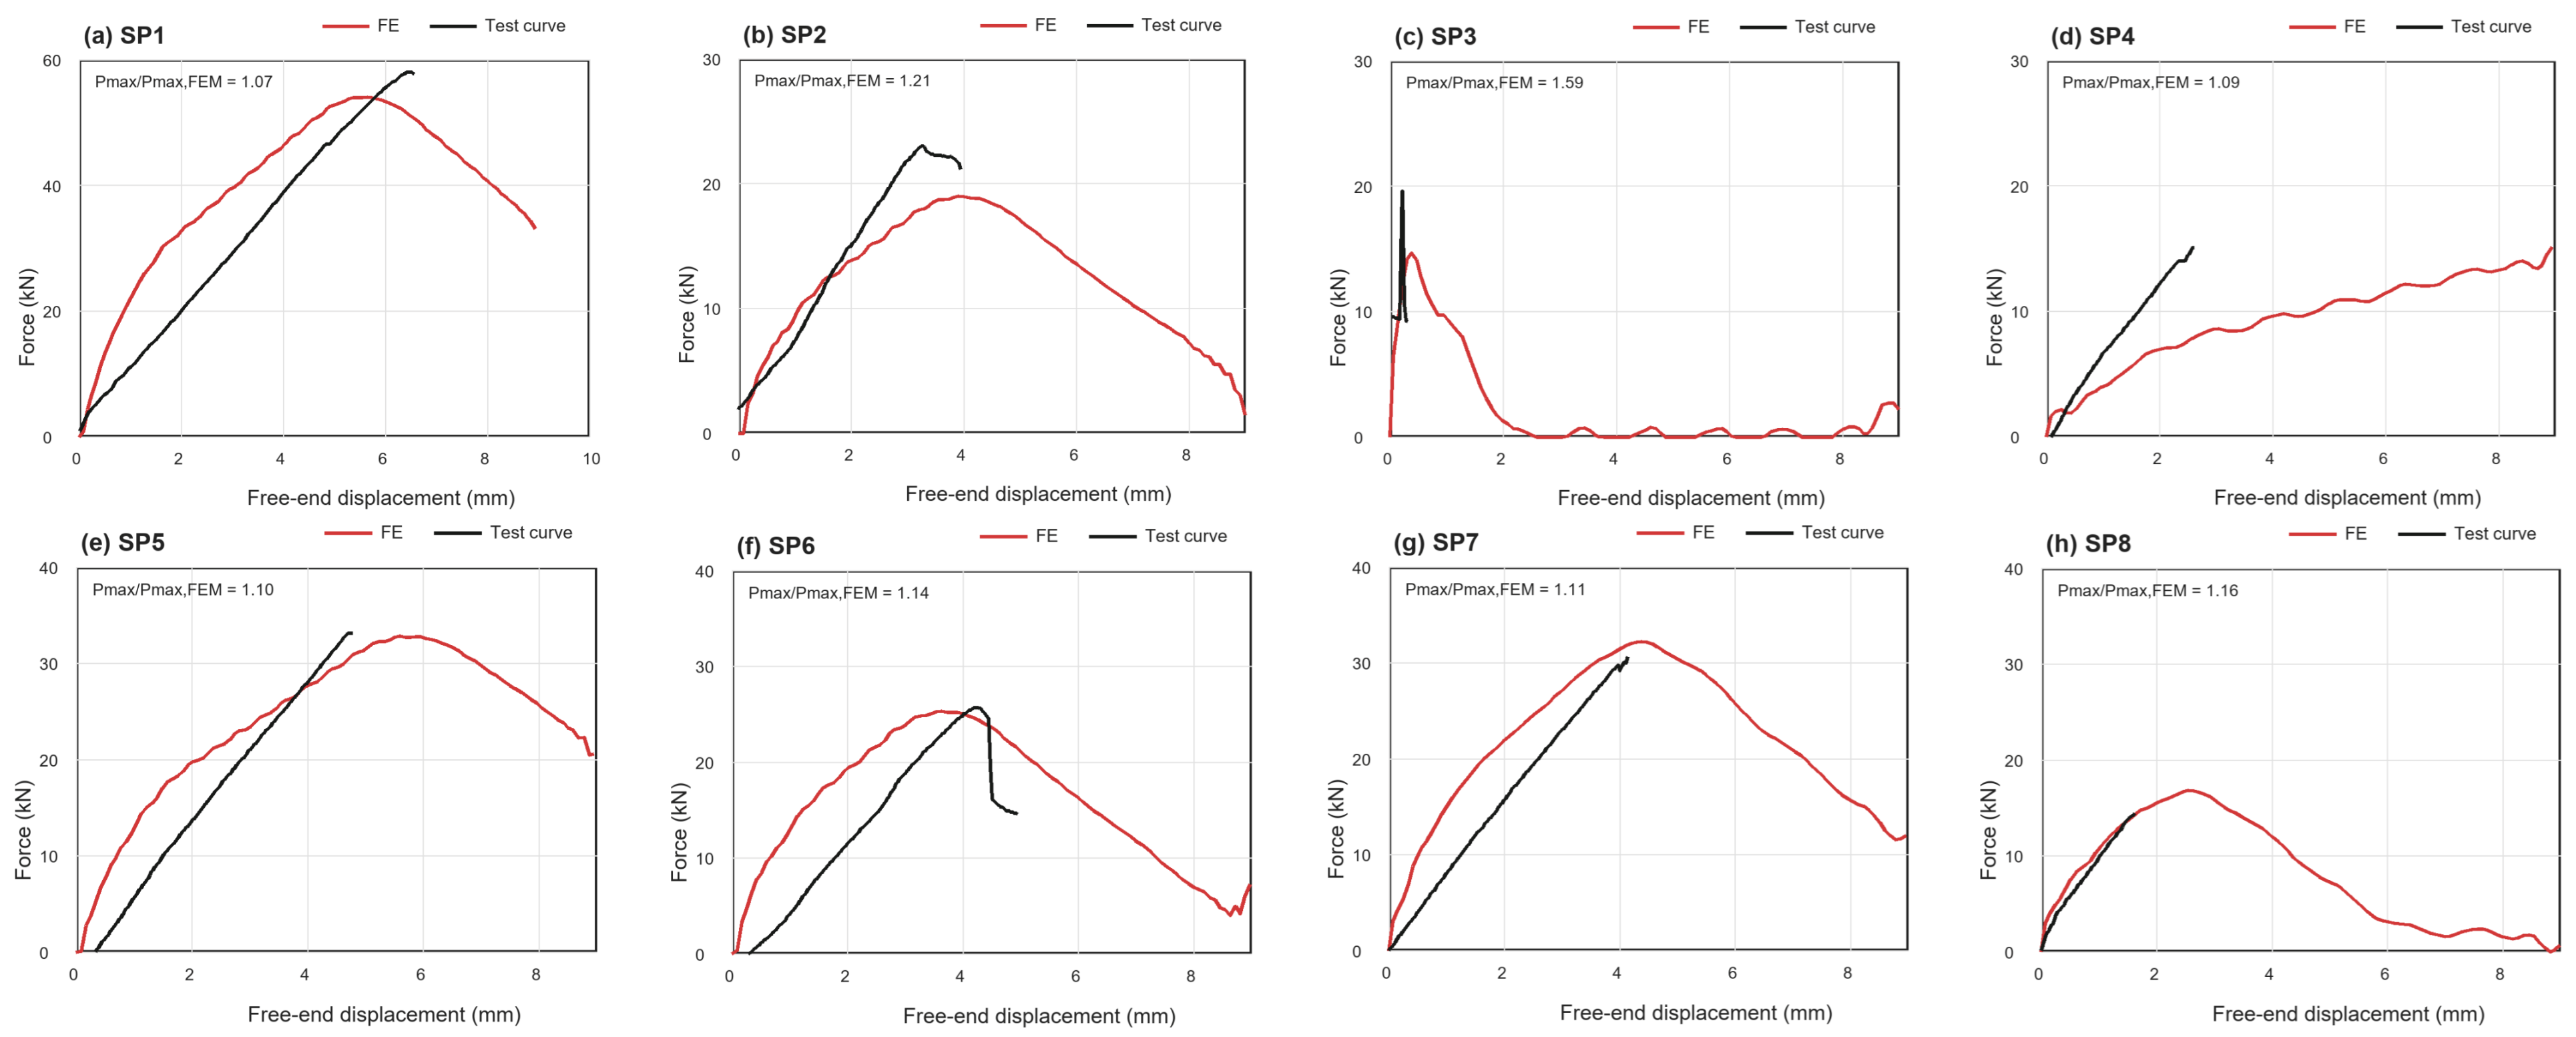
The comparison between the laboratory pull-out tests and the FE simulations is shown in Figure 11. Overall, the FE models reproduced the main characteristics of the measured free-end load–displacement response, including the initial stiffness, the progressive increase in pull-out load and the relative ranking of peak resistance among the eight specimens.
Figure 11.
Comparison between FE-predicted and experimentally measured free-end load–displacement curves for laboratory pull-out specimens.
The peak-load agreement was evaluated using Pmax/Pmax,FEM, where Pmax is the experimental peak load and Pmax,FEM is the FE-predicted peak load. For all eight specimens, the mean Pmax/Pmax,FEM ratio was 1.18, with a coefficient of variation (COV) of 14.5%. This indicates that the FE model slightly underestimated the experimental peak load on average, but reproduced the overall peak-resistance level. The scatter in the peak-load ratio was mainly caused by SP3. This specimen had a very small measured free-end slip and failed by abrupt splitting; therefore, a small absolute difference in slip or peak-force extraction was amplified in the curve comparison. The laboratory FE models should therefore be interpreted as calibrated models for steel–grout load transfer and peak-resistance ranking, rather than as exact reproductions of every local fluctuation in the experimental curves.
5.3. Field Pull-Out Test
As described in Section 5.1, two tiebreak contacts were defined in the field FE model: the steel–grout interface and the grout–ground interface. Field observations showed that the steel bar and grout body were pulled out together, with no obvious relative slip between them. Therefore, the steel–grout interface was assigned a sufficiently strong contact definition, and the calibrated field response was mainly governed by the grout–ground interface.
The grout–ground contact parameters were calibrated against the measured field load–displacement curves. To constrain the calibration physically, the field-equivalent grout–ground resistance was back-calculated from the field pull-out load as:
where Q is the field pull-out load, D is the grout body diameter, and L is the bonded length. The parameter feq represents a back-calculated average resistance over the nominal grout–ground contact area of the tested anchor. Since the axial load transfer along a grouted anchor is non-uniform, feq was used only as a field-equivalent index for comparing anchor cases and constraining the overall level of the grout–ground tiebreak contact parameters. In this study, D = 0.15 m and L = 7 m were used. For the SAC anchors, the two measured field loads were 888 kN and 1000 kN, corresponding to feq values of 269 kPa and 303 kPa, respectively. The representative SAC model was selected according to the mean field response, with Q = 944 kN and feq = 286 kPa. The grout–ground interface parameters in this model were fs = 0.77, fd = 0.615, nfls = 0.06, and sfls = 0.60. For the OPC anchors, both field specimens reached 1112 kN, giving a back-calculated feq of 337 kPa. The representative OPC model used fs = 0.84, fd = 0.68, nfls = 0.06, and sfls = 0.60. It should be noted that feq was not a direct LS-DYNA input parameter; rather, it was used as a field-scale reference value to constrain the selection of the tiebreak contact parameters.
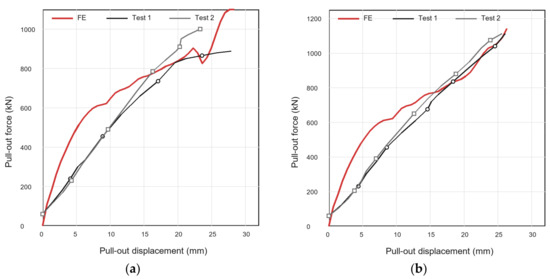
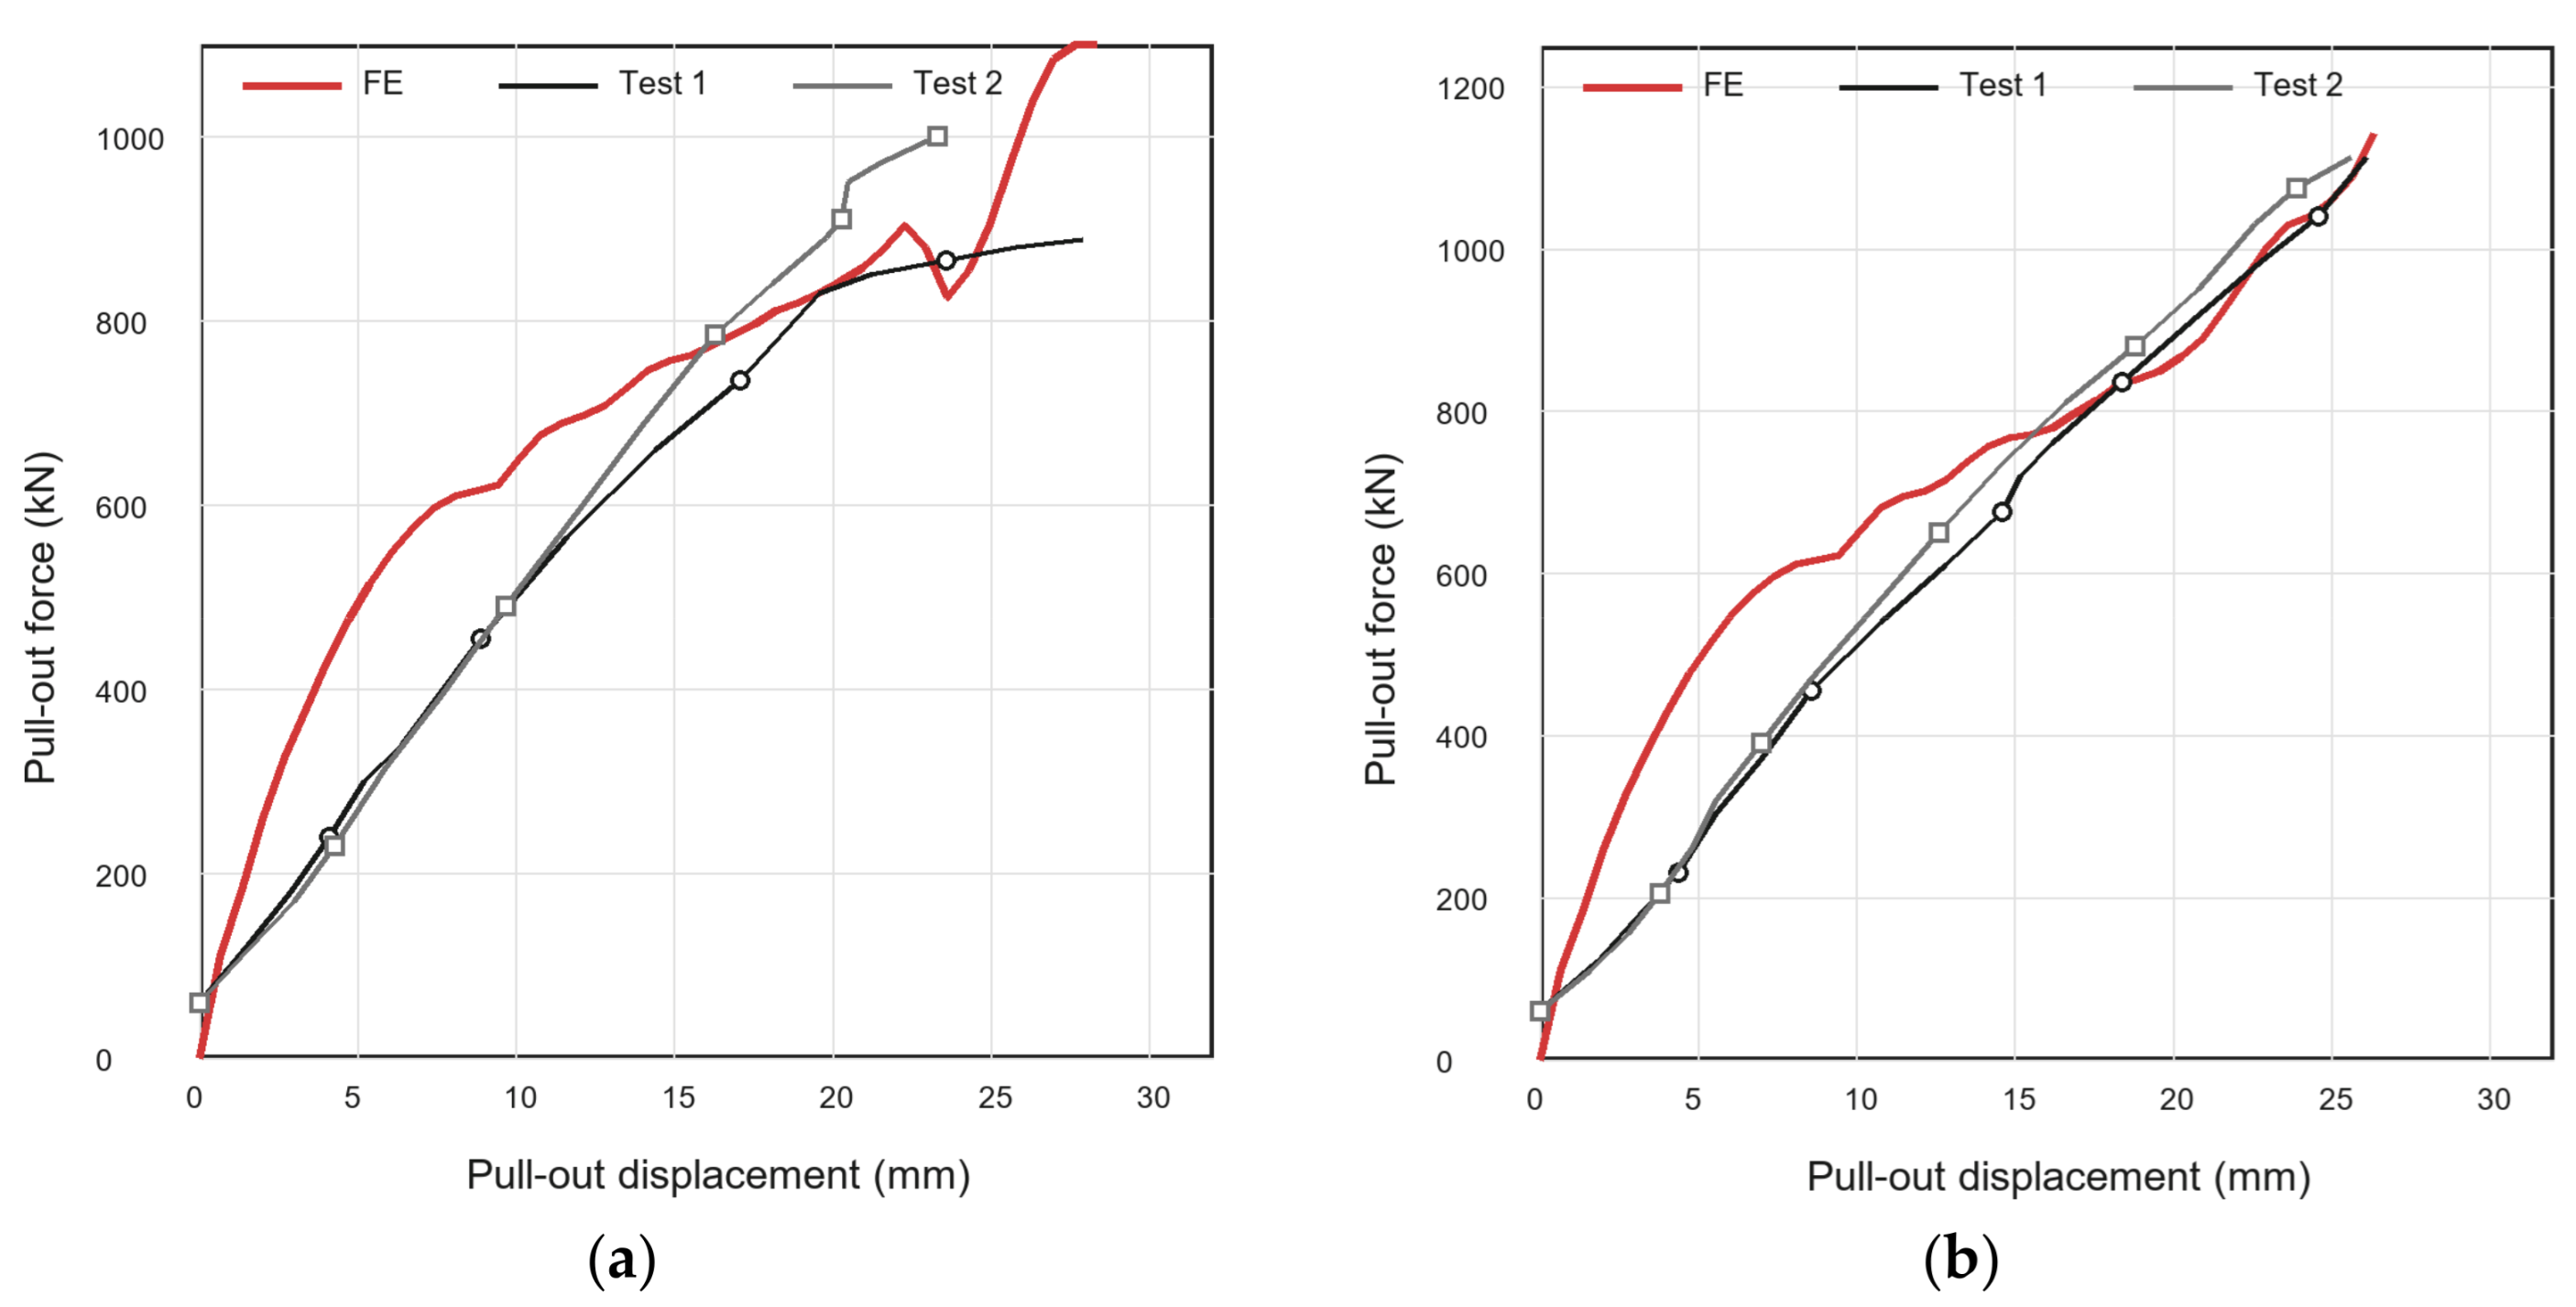
The comparison between the measured field curves and calibrated FE results is shown in Figure 12. For the SAC anchors, the FE curve reproduced the main features of the field response, including the rapid increase in pull-out resistance at the initial loading stage, the subsequent nonlinear development, and the large-displacement load level within the measured response range. The representative SAC model approached the upper part of the measured capacity range at large displacement. Although a local reduction in resistance appeared before the final increase in the FE curve, the overall trend was consistent with the nonlinear response observed in the SAC field anchors.
Figure 12.
FE prediction of full-scale field anchor load–displacement behaviour: (a) SAC. (b) OPC.
For the OPC anchors, the FE prediction showed closer agreement with the two measured field curves. Both OPC anchors reached the same final load level, and the FE curve reached a comparable resistance. After the initial loading stage, the calculated response followed the approximately linear load–displacement trend observed in the field tests. Compared with SAC, the OPC model showed a more stable increase in pull-out resistance with displacement, consistent with the smaller scatter between the two OPC field anchors.
Overall, the calibrated field FE model could capture the main differences between the two grout systems. The SAC anchor response was more nonlinear and showed greater field scatter, whereas the OPC anchor response was more stable and reached a higher equivalent grout–ground resistance. Since the field observations showed that the steel bar and grout body were pulled out together, the steel–grout interface was assigned a relatively strong contact definition in the field model, and the calibrated response was mainly governed by the grout–ground interface. Therefore, the FE results should be regarded as an experimental–numerical interpretation consistent with the observed pull-out mode, rather than as an independent proof of interface control. The model does not fully reproduce local grout splitting in the laboratory specimens or possible plastic deformation of the surrounding ground in the field anchors, and these aspects require further investigation with more detailed damage and ground constitutive models.
5.4. Parametric Analysis
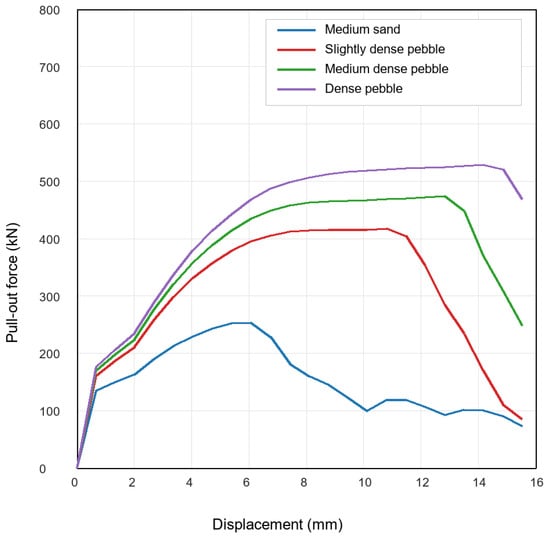
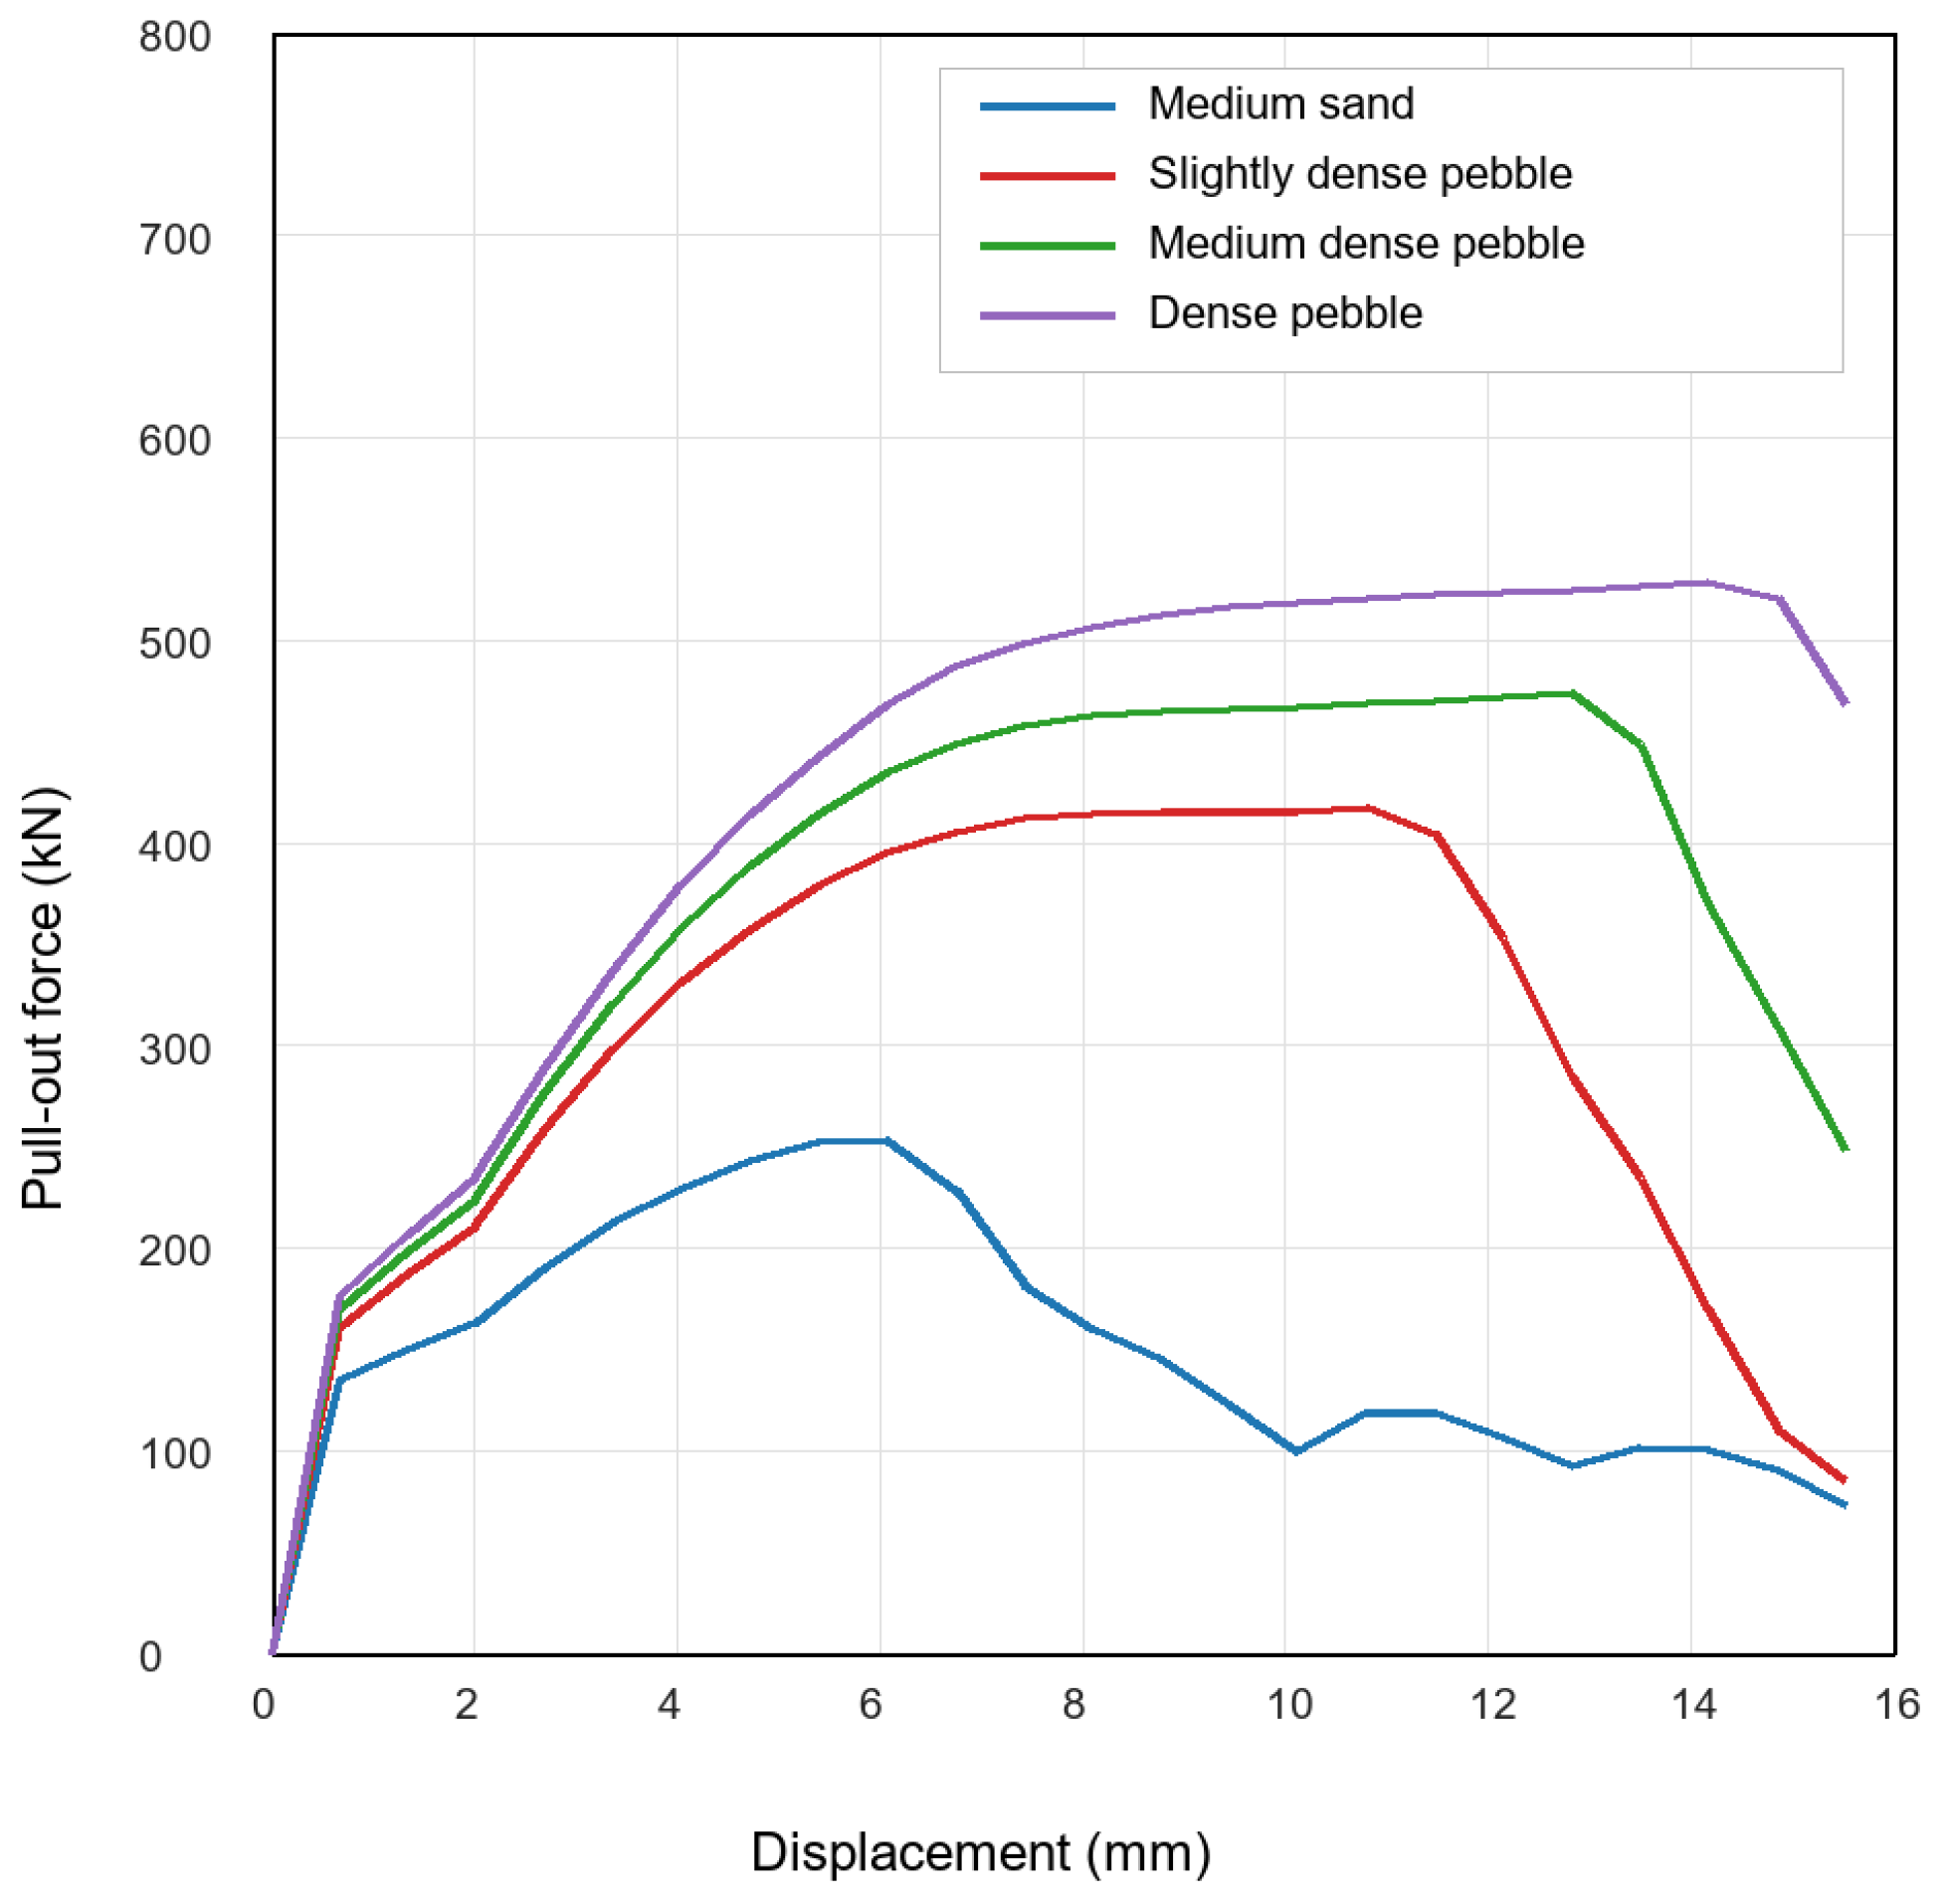
A parametric analysis was performed to evaluate the influence of stratum type on the field-scale pull-out response. Four representative ground conditions were considered: medium sand, slightly dense pebble, medium dense pebble, and dense pebble. The adopted contact parameters, reference pull-out loads and FE-predicted peak responses for the four strata are summarized in Table 4.The corresponding field-equivalent side resistances were taken as 55, 150, 190, and 230 kPa, respectively, according to reported ultimate bond-strength values between anchor grout and Chengdu pebble strata [2]. For a nominal grout diameter of 0.15 m and a bonded length of 7 m, the corresponding reference pull-out loads were estimated as:
Table 4.
Tiebreak contact parameters and FE-predicted peak pull-out forces for different strata.
This calculation gave reference loads of 181.4, 494.8, 626.7, and 758.7 kN for the four strata, respectively. These values were used to define relative interface-resistance levels for the numerical sensitivity study, rather than as direct design predictions.
In the FE models, the steel–grout interface was kept unchanged, while the grout–ground tiebreak contact parameters were adjusted according to the assumed stratum-resistance level. The adopted values of fs, fd, nfls, and sfls increased with the prescribed field-equivalent resistance, so that the four cases represented progressively stronger grout–ground interfaces from medium sand to dense pebble. The calibrated interface framework was then applied to representative strata by varying the grout–ground contact level while keeping the steel–grout interface unchanged. This allowed the influence of stratum-dependent grout–ground resistance on the mobilised pull-out response to be examined under a consistent steel–grout bond condition. All four simulations reached normal termination. The parametric analysis was used to compare the relative influence of grout–ground interface resistance under the same calibrated modelling framework. The response after the onset of pronounced post-peak oscillation was not used for quantitative interpretation. Therefore, the comparison focuses on the pre-disturbance response trend and the relative ranking of peak pull-out resistance rather than the full post-peak displacement history.
The calculated load–displacement curves are shown in Figure 13. Within the stable displacement range, the peak pull-out force increased from 253.2 kN for medium sand to 417.7 kN for slightly dense pebble, 474.5 kN for medium dense pebble, and 529.4 kN for dense pebble. The displacement corresponding to the peak force also increased from 6.1 mm to 14.2 mm as the stratum changed from medium sand to dense pebble. This trend indicates that a stronger grout–ground interface increased the mobilised pull-out resistance and delayed major interface degradation.
Figure 13.
FE-predicted load–displacement curves for anchors embedded in different strata.
The reference pull-out loads derived from the assumed ground resistances were based on an equivalent uniform resistance over the nominal grout–ground contact area. These values were used to define comparable resistance levels for different strata. Therefore, the parametric results should be interpreted as a sensitivity analysis of stratum-controlled interface resistance rather than as direct design predictions for each soil layer. The lower FE peak loads in the stronger-stratum cases indicate that the pull-out capacity was limited by progressive interface degradation and non-uniform stress transfer, rather than by full mobilisation of the prescribed equivalent resistance along the entire bonded length. Conversely, the higher FE peak load in the medium-sand case suggests that the bearing bodies and local confinement can provide additional resistance even when the prescribed equivalent interface level is low. These differences show that the field-scale pull-out response depends on the mobilisation process of the grout–ground interface, not only on the average resistance assigned to the stratum.
However, it is noted that rheological properties, bleeding, and washout resistance were not measured in the present programme, so the resistance of SAC to flowing-water disturbance requires further testing under controlled water-rich or flowing-water conditions. Future work may further examine ground-improvement strategies around the anchor, such as pre-grouting or jet grouting, to enhance the grout–ground interface resistance before high-strength threaded anchors are installed.
6. Conclusions
This study investigated the pull-out performance and load-transfer mechanism of a sulphoaluminate cement-based rapid-setting grout for PSB high-strength threaded anchors in water-rich sandy-pebble strata. Laboratory pull-out tests, full-scale field anchor pull-out tests, and LS-DYNA finite element modelling were combined to clarify the relationship between material-scale steel–grout bond behaviour and field-scale anchor–grout–ground response. The following conclusions can be drawn:
- The laboratory pull-out tests showed that the steel–grout bond response was controlled by both bond strength and failure mode. Pull-out failure reflected progressive degradation of the ribbed steel–grout interface, whereas splitting failure reflected insufficient radial confinement of the hardened grout cube specimen.
- One SAC configuration produced the highest individual laboratory bond strength among the tested specimens. However, across all tested configurations, OPC showed a slightly higher mean laboratory bond strength, and the field tests did not demonstrate a higher ultimate pull-out capacity for SAC than for OPC. Therefore, the present results indicate comparable 28-day bond and anchorage performance of SAC.
- In the present field pull-out tests, the SAC anchors showed lower and more scattered pull-out resistance than the OPC anchors. All field anchors failed by pull-out, and the steel bar and grout body were pulled out together. This indicates that the field-scale response was mainly governed by the grout–ground interface rather than by steel–grout debonding. Since only two field anchors were tested for each grout type, this comparison should be regarded as a descriptive field observation. The measured difference cannot be attributed solely to grout type, as ground variability and construction-dependent interface formation may also have contributed.
- The calibrated FE models reproduced the main features of the laboratory and field load–displacement responses. The numerical results are consistent with the observed scale-dependent response: laboratory specimens mainly reflected steel–grout bond behaviour, while full-scale field anchors were primarily controlled by grout–ground interface degradation. The simulations should therefore be interpreted as experimental–numerical support for the observed pull-out mode rather than as independent proof of interface control.
- The parametric analysis showed that increasing the representative stratum resistance enhanced the mobilised pull-out capacity and delayed major interface degradation. This indicates that stratum-dependent grout–ground resistance is a key factor in evaluating high-strength anchors in water-rich sandy-pebble strata.
Author Contributions
Conceptualisation, T.P. and Y.L.; methodology, T.P.; software, D.R. and B.L.; investigation, D.R.; data curation, T.P.; writing—original draft preparation, T.P. and D.R.; writing—review and editing, B.L., P.X., H.H. and Y.L. All authors have read and agreed to the published version of the manuscript.
Funding
This research was funded by China MCC5 Group Key Research and Development Special Program (WY2024B001).
Data Availability Statement
Data are available on reasonable request.
Conflicts of Interest
Authors T.P., B.L. and H.H. were employed by the company China MCC5 Group Corp. Ltd. and Chengdu Surveying Geotechnical Research Institute Co., Ltd. of MCC. Authors D.R. and P.X. were employed by the company China MCC5 Group Corp. Ltd. The remaining author declare that the research was conducted in the absence of any commercial or financial relationships that could be construed as a potential conflict of interest.
Nomenclature
| Symbol/Term | Definition | Unit |
| SAC | Sulphoaluminate cement grout | - |
| OPC | Ordinary Portland cement grout | - |
| Peak pull-out load in laboratory specimens | kN | |
| Average ultimate steel–grout bond strength | MPa | |
| Steel-bar diameter in laboratory pull-out specimens | mm | |
| Bonded length in laboratory pull-out specimens | mm | |
| Field pull-out load or maximum sustained test load | kN | |
| Nominal field anchor/grout diameter | m | |
| Field bonded length | m | |
| Back-calculated field-equivalent grout–ground resistance | kPa | |
| , | Static and dynamic friction parameters in the calibrated LS-DYNA grout–ground contact | - |
References
- Peng, T.; Ren, D.X.; Yang, Z.Y.; Liao, H.Y.; Zhao, X.Y.; Xue, P.; Peng, J.C. Fine partitioned anti-floating and force analysis of high-strength anchors based on PSB reinforcement. Geol. Explor. 2024, 60, 377–387. (In Chinese) [Google Scholar]
- Ren, D.; Peng, T.; Yang, Z.; Xue, P.; Fu, W.; Zhao, X.; Li, J.; Peng, J. Application of finished rolled threaded steel bar enlarged-head anti-floating anchors in Chengdu pebble strata. Build. Struct. 2025, 55, 131–138. (In Chinese) [Google Scholar] [CrossRef]
- Cheng, Z.; Wang, Y.; Zhang, K.; Wei, D. Calculation and analysis of load transfer characteristics of tensile anchors for geotechnical anchoring systems. Appl. Sci. 2024, 14, 472. [Google Scholar] [CrossRef] [Scilit]
- Aghchai, M.H.; Maarefvand, P.; Rad, H.S. Analytically determining bond shear strength of fully grouted rock bolt based on pullout test results. Period. Polytech. Civ. Eng. 2020, 64, 212–222. [Google Scholar] [CrossRef] [Scilit]
- Al-Baghdadi, N.H.; Ahmed, B.A. Field tests of grouted ground anchors in the sandy soil of Najaf, Iraq. Open Eng. 2022, 12, 905–917. [Google Scholar] [CrossRef] [Scilit]
- Grindheim, B.; Li, C.C.; Høien, A.H. Full-scale pullout tests of rock anchors in a limestone quarry focusing on bond failure at the anchor-grout and grout-rock interfaces. J. Rock Mech. Geotech. Eng. 2023, 15, 2264–2279. [Google Scholar] [CrossRef] [Scilit]
- Park, J.; Qiu, T.; Kim, Y. Field and laboratory investigation of pullout resistance of steel anchors in rock. J. Geotech. Geoenviron. Eng. 2013, 139, 2219–2224. [Google Scholar] [CrossRef] [Scilit]
- Akisanya, A.R.; Ivanović, A. Debonding along the fixed anchor length of a ground anchorage. Eng. Struct. 2014, 74, 23–31. [Google Scholar] [CrossRef] [Scilit]
- Wu, Z.; Yang, S.; Hu, X.; Zheng, J. Analytical method for pullout of anchor from anchor-mortar-concrete anchorage system due to shear failure of mortar. J. Eng. Mech. 2007, 133, 1352–1369. [Google Scholar] [CrossRef] [Scilit]
- Li, C.; Stillborg, B. Analytical models for rock bolts. Int. J. Rock Mech. Min. Sci. 1999, 36, 1013–1029. [Google Scholar] [CrossRef] [Scilit]
- Hyett, A.J.; Bawden, W.F.; Reichert, R.D. The effect of rock mass confinement on the bond strength of fully grouted cable bolts. Int. J. Rock Mech. Min. Sci. Geomech. Abstr. 1992, 29, 503–524. [Google Scholar] [CrossRef] [Scilit]
- Moosavi, M.; Jafari, A.; Khosravi, A. Bond of cement grouted reinforcing bars under constant radial pressure. Cem. Concr. Compos. 2005, 27, 103–109. [Google Scholar] [CrossRef] [Scilit]
- Peng, G.; Niu, D.; Hu, X.; Wu, X.; Zhang, Y. Bond position function between deformed steel bars and early-age cementitious grout. Adv. Struct. Eng. 2021, 24, 2966–2980. [Google Scholar] [CrossRef] [Scilit]
- Huang, Y.; Han, B. Experimental study on bond behavior between high-strength grout and deformed steel bars. Constr. Build. Mater. 2021, 301, 124059. [Google Scholar] [CrossRef] [Scilit]
- Han, J.; Liu, D.; Guan, Y.; Chen, Y.; Li, T.; Jia, D.; Yan, F.; Jia, P.; Zhao, Y. Study on shear behavior and damage constitutive model of tendon-grout interface. Constr. Build. Mater. 2022, 320, 126223. [Google Scholar] [CrossRef] [Scilit]
- Murcia-Delso, J.; Stavridis, A.; Shing, P.B. Bond-slip model for detailed finite-element analysis of reinforced concrete structures. J. Struct. Eng. 2015, 141, 04014125. [Google Scholar] [CrossRef] [Scilit]
- Zhang, X.; Li, H.Y.; Zhang, Z.Q.; Deng, L. Study on bond performance parameters of GFRP bars based on pull-out test. J. Sichuan Univ. (Nat. Sci. Ed.) 2021, 58, 131–136. (In Chinese) [Google Scholar] [CrossRef]
- Yan, F.; Lin, Z.; Yang, M. Bond mechanism and bond strength of GFRP bars to concrete: A review. Compos. Part B Eng. 2016, 98, 56–69. [Google Scholar] [CrossRef] [Scilit]
- Gao, J.; Peng, S.; Chen, G.; Fan, H. An extended discontinuous deformation analysis for simulation of grouting reinforcement in a water-rich fractured rock tunnel. J. Rock Mech. Geotech. Eng. 2025, 17, 168–186. [Google Scholar] [CrossRef] [Scilit]
- Wang, Y.H.; Yang, P.; Li, Z.T.; Wu, S.J.; Zhao, Z.X. Experimental-numerical investigation on grout diffusion and washout in rough rock fractures under flowing water. Comput. Geotech. 2020, 126, 103717. [Google Scholar] [CrossRef] [Scilit]
- Eriksson, M.; Stille, H.; Andersson, J. Numerical calculations for prediction of grout spread with account for filtration and varying aperture. Tunn. Undergr. Space Technol. 2000, 15, 353–364. [Google Scholar] [CrossRef] [Scilit]
- Sha, F.; Lin, C.; Li, Z.; Liu, R. Reinforcement simulation of water-rich and broken rock with Portland cement-based grout. Constr. Build. Mater. 2019, 221, 292–300. [Google Scholar] [CrossRef] [Scilit]
- Khayat, K.H.; Yahia, A.; Sayed, M. Experiment design to evaluate interaction of high-range water-reducer and antiwashout admixture in high-performance cement grout. Cem. Concr. Res. 2001, 31, 749–757. [Google Scholar] [CrossRef] [Scilit]
- Sonebi, M. Factorial design modelling of mix proportion parameters of underwater composite cement grouts. Cem. Concr. Res. 2001, 31, 1553–1560. [Google Scholar] [CrossRef] [Scilit]
- Cui, W.; Huang, J.; Song, H.; Xiao, M. Development of two new anti-washout grouting materials using multi-way ANOVA in conjunction with grey relational analysis. Constr. Build. Mater. 2017, 156, 184–198. [Google Scholar] [CrossRef] [Scilit]
- Gartner, E.; Sui, T. Alternative cement clinkers. Cem. Concr. Res. 2018, 114, 27–39. [Google Scholar] [CrossRef] [Scilit]
- Zhang, J.; Guan, X.; Wang, X.; Ma, X.; Li, Z.; Xu, Z.; Jin, B. Microstructure and properties of sulfoaluminate cement-based grouting materials: Effect of calcium sulfate variety. Adv. Mater. Sci. Eng. 2020, 2020, 7564108. [Google Scholar] [CrossRef] [Scilit]
- Sha, F.; Fan, R.; Gu, S.; Xi, M. Strengthening effect of sulphoaluminate cementitious grouting material for water-bearing broken rocky stratum. Constr. Build. Mater. 2023, 368, 130390. [Google Scholar] [CrossRef] [Scilit]
- Qiu, X.; Chen, W.; Yuan, J.; Shu, X.; Tan, X.; Wu, G.; Tian, H.; Cai, L. Study on early hydration and mechanical properties of ferrite-rich calcium sulfoaluminate cement-based grouting materials. Constr. Build. Mater. 2024, 411, 134324. [Google Scholar] [CrossRef] [Scilit]
- Wang, J.; Wang, Y.; Yu, J.; Xu, L.; Li, M.; Cheng, J.; Li, Z. Effects of sodium sulfate and potassium sulfate on the properties of calcium sulfoaluminate (CSA) cement based grouting materials. Constr. Build. Mater. 2022, 353, 129045. [Google Scholar] [CrossRef] [Scilit]
- Yu, S.; Yang, H.; Chen, J.; Wang, Y.; Lu, S. Study on the load transfer behaviour and bond-slip model of fully grouted rockbolt. Shock Vib. 2023, 2023, 8871828. [Google Scholar] [CrossRef] [Scilit]
- Haberfield, C.M.; Baycan, S. Field performance of the grout/rock interface in anchors. In Ground Anchorages and Anchored Structures; Thomas Telford Publishing: London, UK, 1997. [Google Scholar] [CrossRef] [Scilit]
- Wang, Y.J.; Wu, Z.M.; Zheng, J.J.; Zhou, X.M. 3D analytical investigation on the overall pullout behavior of grouted anchorages in presence of shear failure of grout. Eng. Fail. Anal. 2020, 109, 104249. [Google Scholar] [CrossRef] [Scilit]
- Yuan, J.; Chen, W.; Tan, X.; Yang, D.; Zhang, Q. New method to evaluate antiwashout performance of grout for preventing water-inrush disasters. Int. J. Geomech. 2020, 20, 06019021. [Google Scholar] [CrossRef] [Scilit]
- Cheema, T.S.; Klingner, R.E. Tensile anchorage behavior of deformed reinforcement in grouted concrete masonry. ACI J. Proc. 1985, 82, 372–380. [Google Scholar] [CrossRef] [Scilit] [PubMed]
- Liu, X.; Wang, J.; Huang, J.; Jiang, H. Full-scale pullout tests and analyses of ground anchors in rocks under ultimate load conditions. Eng. Geol. 2017, 228, 1–10. [Google Scholar] [CrossRef] [Scilit]
- GB/T 1346-2024; Test Methods for Water Requirement of Standard Consistency, Setting Time and Soundness of the Portland Cement. Standards Press of China: Beijing, China, 2024. (In Chinese)
- GB/T 17671-2021; Test Method of Cement Mortar Strength (ISO Method). Standards Press of China: Beijing, China, 2021. (In Chinese)

Disclaimer/Publisher’s Note: The statements, opinions and data contained in all publications are solely those of the individual author(s) and contributor(s) and not of MDPI and/or the editor(s). MDPI and/or the editor(s) disclaim responsibility for any injury to people or property resulting from any ideas, methods, instructions or products referred to in the content. |
© 2026 by the authors. Licensee MDPI, Basel, Switzerland. This article is an open access article distributed under the terms and conditions of the Creative Commons Attribution (CC BY) license.