


Abstract
Geosynthetic reinforcement is widely used to improve slope stability; however, its association with soil–water characteristic curve (SWCC) behavior under natural climatic exposure remains insufficiently understood. This study compared two geometrically identical outdoor reduced-scale compacted-clay slope models: one containing three geogrid-integrated geotextile layers and one unreinforced control. Sensors at a depth of 0.46 m recorded volumetric water content (VWC) and matric suction at 15-min intervals. Drying-path van Genuchten curves were evaluated over the common reliable suction domain of 5.0–51.1 kPa using a trailing 24-h classification and 2000 paired calendar-day bootstrap resamples. The reinforced curve remained above the control curve throughout this domain. The median reinforced-minus-control VWC difference decreased from 0.0454 m3/m3 at 5 kPa (95% conditional interval: 0.0351–0.0590) to 0.0126 m3/m3 at 51.1 kPa (0.0074–0.0180). This difference persisted across 182 sensitivity configurations, although individual model parameters were weakly identifiable. Across 21 rainfall events of at least 5 mm, the reinforced model exhibited smaller median VWC increases and suction decreases. These results provide quantitative benchmarks for interpreting and modeling hydraulic responses in reinforced clay systems. Because only one model represented each configuration and mechanical performance was not measured, the findings are conditional and do not establish a replicated reinforcement effect or improved slope stability.
1. Introduction
Unsaturated compacted clay slopes and embankments constitute important components of transportation, flood-protection, and energy infrastructure [1]. Their long-term performance is strongly influenced by the hydraulic condition of the compacted soil because matric suction contributes to the shear strength of unsaturated soil and can increase resistance along potential failure surfaces [2]. Under humid temperate and subtropical climates, precipitation and evapotranspiration produce repeated fluctuations in water content and matric suction. Long-term monitoring of instrumented embankments has shown that these climatic cycles can contribute to progressive deformation and deterioration over extended periods [1,3]. Projected increases in rainfall variability, drought intensity, and temperature extremes may further increase the hydro-mechanical demands imposed on compacted earth structures [4].
The response of compacted high-plasticity clay to climatic loading is commonly interpreted using unsaturated soil mechanics. In this framework, net normal stress and matric suction may be treated as independent stress-state variables or incorporated through generalized effective-stress formulations that extend conventional saturated soil concepts [5]. The soil–water characteristic curve (SWCC) describes the relationship between soil–water content and matric suction, which provides a fundamental basis for interpreting the hydraulic and mechanical behavior of unsaturated soils. When combined with an appropriate pore-connectivity model, the SWCC may also be used to estimate the unsaturated hydraulic-conductivity function required for seepage and coupled hydro-mechanical analyses. The closed-form relationship proposed by van Genuchten [6] is among the most widely used models for representing soil water retention behavior and estimating hydraulic properties from fitted parameters.
For compacted clay fills, molding water content relative to the optimum moisture content strongly influences soil fabric, pore size distribution, air-entry behavior, and fitted water retention parameters. However, soil composition, plasticity, dry density, compaction effort, and stress history also contribute to the resulting hydraulic response [7,8]. Consequently, an SWCC obtained from a small laboratory specimen may not fully represent the hydraulic behavior of a larger environmentally exposed compacted-soil system, even when the soil classification and nominal compaction conditions are similar. Differences in placement moisture, compaction uniformity, field heterogeneity, and environmental exposure may produce retention behavior that differs from that measured under controlled laboratory conditions.
Repeated precipitation and evaporation cycles can generate irreversible changes in the soil fabric, volume, cracking condition, and hydraulic response of compacted clay. Field observations have shown that water content and matric suction do not always return completely to their antecedent states following successive wetting and drying periods [1,3,9]. Atmospheric forcing may also initiate and propagate desiccation cracks, creating a secondary macrostructure that increases near-surface permeability and promotes preferential infiltration. Field investigations and physical slope models have documented the initiation, opening, contraction, and partial closure of cracks extending several tens of centimeters into high-plasticity fine-grained soils [10,11,12]. These changes can affect the shallow soil zone in which rainfall-induced failures and progressive embankment deformation frequently develop [3,13]. Understanding the coupled evolution of water content and matric suction is therefore important for assessing the long-term performance of compacted clay slopes under natural climatic exposure.
Geosynthetics are widely used to improve the mechanical performance of slopes, embankments, retaining walls, and other earth structures. Geogrids provide tensile resistance and confinement, whereas geotextiles integrated into geocomposites may perform separation, filtration, drainage, and reinforcement functions, depending on their material properties and configuration. Instrumented geogrid- and geotextile-reinforced soil walls have demonstrated that reinforcement tensile loads redistribute in response to changes in pore-water pressure and matric suction within the reinforced mass [14,15]. Reinforced slope tests constructed at different compaction moisture contents have also shown that soil-reinforcement interface strength can decrease when the moisture content of the fill exceeds its optimum value, motivating the use of moisture-dependent reduction factors in design [16,17]. In addition, rainfall tests conducted on reinforced walls indicated that nonwoven geotextiles may contribute to internal drainage and reduce wall-facing deformation under certain soil, reinforcement, and boundary conditions [18]. These findings demonstrate that the performance of a reinforced soil system can depend on both mechanical interaction and the evolution of hydraulic conditions within the reinforced zone. Accordingly, the response of reinforced slopes under natural climatic exposure is increasingly viewed as a coupled hydro-mechanical problem rather than a purely mechanical reinforcement problem [4,19]. Reinforcement performance can be affected by rainfall, suction reduction, changes in soil-reinforcement interface strength, and redistribution of water within the reinforced mass. Conversely, composite geosynthetic inclusions may alter local water storage, drainage, and hydraulic connectivity. These interactions are particularly relevant in compacted high-plasticity clay, in which small changes in moisture can produce substantial changes in matric suction, volume, stiffness, and shear strength.
Beyond their intended mechanical role, composite geosynthetic inclusions can interact hydraulically with the surrounding unsaturated soil. Capillary-barrier behavior may develop when a fine-grained soil is placed in contact with a coarser or more freely draining geosynthetic layer. Under unsaturated conditions, differences in pore-size distribution and water-retention behavior across the interface can temporarily restrict downward flow and promote water accumulation above the interface until hydraulic breakthrough occurs [20]. Laboratory and field studies have shown that such interface effects may influence water content over measurable distances from the geosynthetic layer [21]. The magnitude and spatial extent of these hydraulic interactions depend on the retention and transport properties of the soil and geosynthetic, antecedent moisture conditions, interface contact, hydraulic gradient, and wetting history [20,21].
Specially designed wicking and enhanced-lateral-drainage geotextiles can transport gravitational and capillary water away from unsaturated pavement materials, thereby reducing moisture accumulation near the reinforcement under suitable hydraulic conditions [22,23,24,25]. However, these findings should not be generalized to all geotextiles because hydraulic performance depends on polymer composition, pore-size distribution, wettability, permittivity, in-plane transmissivity, manufacturing configuration, and soil–geotextile contact [20,22,23,24,25,26]. The geogrid-integrated geotextile used in a reinforced slope may therefore produce hydraulic effects that differ from those of a geotextile specifically engineered for capillary wicking or enhanced lateral drainage.
Soil-geosynthetic interaction is also influenced by suction. Experimental studies have shown that apparent adhesion or interface shear resistance can increase with suction, although the magnitude of this increase depends on the soil type, geosynthetic surface, stress state, and testing procedure [26]. Atmosphere-coupled simulations of nonwoven-geotextile-reinforced walls have further indicated that geotextile layers can influence moisture redistribution and the internal loss of matric suction during rainfall infiltration [27]. Collectively, these studies demonstrate that composite geosynthetic inclusions may affect the hydraulic response of the surrounding soil. Nevertheless, whether these interface-scale processes produce measurable changes in the effective retention response of adjacent compacted clay within an environmentally exposed physical slope model remains insufficiently established. Existing evidence primarily documents localized interface behavior, isolated material performance, or hydraulic response in pavement and retaining wall systems rather than direct SWCC changes in field-scale reinforced clay slopes [19,28].
The SWCC provides an appropriate framework for investigating these interactions because it characterizes the water retention response of unsaturated soil and supports the estimation of suction-dependent shear strength and hydraulic conductivity. Laboratory SWCC determination commonly employs pressure-plate extractors, axis-translation devices, chilled-mirror dewpoint psychrometers, filter-paper methods, and humidity-controlled techniques [8,29]. Although these methods provide controlled measurements over selected suction ranges, they may require equilibration periods ranging from days to weeks. Individual methods also have practical measurement limits, requiring multiple techniques to characterize a broad suction range. Additional limitations include sample disturbance, small specimen size, idealized boundary conditions, and difficulty reproducing the climatic and hydraulic history of an in-service earth structure [30,31,32].
Field-derived SWCCs constructed from collocated measurements of volumetric water content and matric suction provide a complementary approach. Moisture sensors, tensiometers, and other water-potential sensors can capture simultaneous moisture–suction responses while preserving prototype-scale heterogeneity, compaction variability, preferential-flow features, and climatic history [30,33,34]. Field-derived and laboratory-derived curves should not be expected to coincide because they represent different spatial scales, boundary conditions, stress histories, and wetting–drying trajectories. Field observations also commonly form a retention envelope rather than a unique curve because wetting and drying paths occupy different portions of the water content–suction space. This hydraulic hysteresis can produce different fitted parameters for wetting and drying branches and demonstrates that field-scale retention behavior depends on antecedent hydraulic conditions [31,35]. Within this context, the vG model provides a practical and widely used method for summarizing field-derived retention behavior, provided that its fitted parameters are interpreted as effective descriptors of the observed hydraulic range rather than universal intrinsic properties of the soil [36].
Despite increasing recognition of these coupled processes, a coherent understanding of how geosynthetic reinforcement affects the effective SWCC and climate-driven moisture–suction response of compacted high-plasticity clay slopes has not yet emerged. Most reinforced-slope and reinforced-wall investigations have focused on tensile-load distribution, deformation, interface strength, global stability, and other mechanical responses rather than simultaneous matric suction and moisture dynamics within the reinforced soil mass [15,16,17,19]. Conversely, studies of geotextile hydraulic behavior have primarily used isolated material tests, laboratory soil columns, pavement systems, or numerical simulations that may not reproduce the compaction fabric, plasticity, slope geometry, and natural wetting–drying history of a compacted clay embankment [23,24,25,26]. Consequently, curve-level retention differences, parameter identifiability, rainfall-event responses, and temporal hydraulic variability in environmentally exposed reduced-scale reinforced-clay slope models remain insufficiently quantified.
The present study addresses this gap through paired outdoor monitoring of two side-by-side reduced-scale physical slope models constructed with the same nominal geometry, soil obtained from the same borrow source, and common compaction specifications. One model incorporated three geogrid-integrated geotextile layers, whereas the adjacent model remained unreinforced and served as the control. Collocated moisture and water-potential sensors were installed at corresponding nominal locations, allowing section-level responses to be compared under common climatic forcing.
The study develops and compares observation-derived drying-path SWCCs over a common instrument-reliable suction domain and evaluates the robustness and practical identifiability of the resulting curve and parameter differences. Long-term moisture–suction behavior and paired rainfall-event responses are also examined to determine whether the monitored sections exhibited systematic differences in water retention, wetting response, post-event drying, and temporal variability. Potential soil-geosynthetic hydraulic mechanisms are presented as plausible interpretations rather than demonstrated causal processes. The fitted parameters are treated as effective descriptors of the monitored sections and observed suction range rather than intrinsic soil properties.
Because only one reinforced and one control physical model were monitored, reinforcement condition, test box, local construction and soil variability, and sensor-specific response cannot be separated statistically. The comparison is therefore unreplicated and should be interpreted as a conditional, hypothesis-generating assessment. The paired geometry and common climatic forcing improve within-site comparability but do not establish a causal reinforcement effect. The practical contribution is the development of observation-based hydraulic benchmarks for interpreting sensor responses, calibrating infiltration models, and designing future replicated and multi-depth investigations. The study does not directly demonstrate increased shear strength, reduced deformation, or improved slope stability.
2. Materials and Methods
2.1. Experimental Program and Reduced-Scale Test-Section Design
The experimental program comprised laboratory construction of two reduced-scale physical slope models followed by relocation to an outdoor research site for monitoring under natural environmental conditions. Two wooden test boxes were fabricated to provide structural support during soil placement, compaction, relocation, and subsequent exposure to rainfall, temperature fluctuations, wind, and other atmospheric forcing. Following construction, the completed models were relocated to an outdoor research site at Prairie View A&M University, Texas, USA. The models were developed for controlled comparative hydraulic monitoring and were not intended to represent full-scale geotechnical structures.
Each physical model measured approximately 1.83 m in length, 1.07 m in width, and 1.22 m in depth. The compacted soil was shaped to produce a nominal 1H:1V slope corresponding to an inclination of 45°. This inclination provided a common steep geometry that could be accommodated within the available box dimensions while allowing for installation of the reinforcement layers and monitoring sensors and observation of rainfall-induced infiltration and downslope moisture redistribution. The inclination was not selected to represent the maximum stable slope angle achievable using geosynthetic reinforcement or to compare the mechanical stability of different slope inclinations. Both models had the same nominal external dimensions and slope geometry, were constructed using soil obtained from the same borrow source and common compaction specifications and were exposed side by side to the same general climatic conditions. These common design specifications supported a paired section-level comparison but did not ensure identical as-built soil conditions.
One model incorporated three horizontal layers of geogrid-integrated geotextile, whereas the second model contained no reinforcement and served as the control. The models were positioned adjacent to one another so that they experienced comparable climatic stressors. Because only one physical model represented each configuration, reinforcement conditions could not be separated statistically from model-specific soil placement, compaction variability, boundary effects, or sensor-specific response. Accordingly, the two models were not treated as independent replicated treatment populations, and all statistical comparisons were interpreted as conditional differences between the monitored physical models. Although sensors were installed at multiple depths, the present study focuses on corresponding volumetric water content and matric-suction measurements obtained at the nominal 0.46 m (1.5 ft) monitoring depth. This intermediate monitoring level was selected because paired measurements were available in both models and provided a consistent basis for evaluating between-section hydraulic differences under common climatic forcing.
2.2. Soil Properties and Characterization
Sufficient volume of high-plasticity clayey soil was collected from a borrow pit. The material was recovered from approximately 5 ft (1.5 m) below the ground surface within an approximately 0.5-acre (0.20-ha) borrow area. Soil samples from the collected bags were selected for laboratory characterization to evaluate the variability of the borrow material. Before construction, the collected soil was thoroughly mixed and homogenized and was subsequently divided between the control and geosynthetic-reinforced physical models. This procedure was used to minimize differences in the source material used in the two models.
Laboratory characterization included wet-sieve testing, Atterberg-limit testing in accordance with ASTM D4318 [37], soil classification in accordance with ASTM D2487 [38], and Standard Proctor compaction testing in accordance with ASTM D698 [39]. Particle-size characterization was limited to wet-sieve separation using the No. 200 (0.075 mm) sieve. Consequently, the reported result represents the percentages retained on and passing the No. 200 sieve. The wet-sieve results indicated that approximately 85–94% of the soil passed the No. 200 sieve. The measured liquid limit ranged from 68% to 74%, while the plasticity index ranged from 48% to 51%. Based on these results and the Unified Soil Classification System, the soil was classified as Fat Clay (CH). Standard Proctor testing produced optimum moisture contents ranging from approximately 24% to 27% and maximum dry unit weights ranging from approximately 15.0 to 17.3 kN/m3. These ranges represent the observed variability among the tested borrow-soil samples. The Standard Proctor results, rather than Modified Proctor results, were used as the compaction reference for construction of physical models.
The predominance of fines and the high plasticity of the soil provided a representative fine-grained embankment material for evaluating the monitored hydro-mechanical behavior of the models. The use of soil from a common borrow source, followed by mixing and homogenization, was intended to reduce material-related differences between the control and reinforced models.
2.3. Construction and Reinforcement Configuration
The reinforced and control embankments were constructed as reduced-scale physical models within the wooden test boxes. Construction was completed in the laboratory before the models were relocated to the outdoor monitoring site. The principal construction stages, including soil collection, test-box fabrication, soil placement, reinforcement installation, compaction, and sensor installation, are shown in Figure 1. The compacted soil profile in each model was constructed in three successive lifts of approximately equal thickness. Based on the nominal model depth of 1.22 m, the nominal compacted thickness of each lift was approximately 0.41 m. Because of the 1H:1V slope geometry, the required soil volume for each lift was calculated from the corresponding model geometry. The soil mass required for each lift was then determined from the calculated compacted volume and the target dry unit weight. Before placement, the soil assigned to each lift was mixed and moisture-conditioned near the Standard Proctor optimum moisture-content range of approximately 24–27%. Each lift was compacted using a manual compactor until the calculated soil volume and designated lift elevation were achieved. The soil mass and compacted volume were controlled to produce a dry unit weight corresponding to 95% of the applicable Standard Proctor maximum dry unit weight.
Figure 1.
Construction sequence for the reduced-scale physical models: (a) collection and transportation of the borrow soil; (b) fabrication of the wooden boxes; (c) soil placement, manual compaction, and installation of the horizontal geogrid-integrated geotextile layers; and (d) installation of the TEROS 11 volumetric-water-content sensors and TEROS 21 matric-potential sensors (METER Group, Inc., Washington, DC, USA) and their connection to the automated data-logging system.
A prescribed number of compactor passes or a directly measured compaction energy was not used as the construction-control criterion. Instead, manual compaction was continued until the calculated soil mass occupied the specified compacted lift volume. Because no independent in-place density tests were performed after compaction, the reported 95% degree of compaction represents a mass-volume-based construction value rather than an independently measured field-density result. The same soil source, homogenization procedure, lift configuration, soil placement, moisture-conditioning procedure for each lift, manual compaction method, and nominal compaction target were used for the reinforced and control models.
The reinforced model incorporated three horizontal layers of MIRAGRID PEC geogrid-integrated geotextile. The reinforcement component consisted of high-modulus polyester fibers factory-bonded to a continuous-filament nonwoven geotextile backing. The composite combined the tensile reinforcement function of the polyester grid with the separation, filtration, and in-plane drainage functions of the nonwoven geotextile. The minimum mass per unit area of the geotextile component was 200 g/m2. Its apparent opening size was 0.212 mm, corresponding approximately to a U.S. No. 70 sieve, as determined using ASTM D4751 [40]. The reported permittivity was 0.4 s−1 based on ASTM D4491 [41], and the minimum in-plane flow capacity was approximately (1.5 × 10⁻³ L/(m·s)). The polyester reinforcement component had a minimum average roll value for ultimate tensile strength of 35 kN/m. Tensile characterization was based on the applicable geogrid tensile-testing procedure in ASTM D6637 [42]. Product-specific tensile-strength values at 2% and 5% strain were not available and were therefore not estimated from the ultimate tensile strength.
The upper reinforcement layer was positioned approximately 0.305 m below the designated upper reference level. The second and third reinforcement layers were located approximately 0.610 and 0.914 m below the same reference level, respectively. Thus, the nominal vertical spacing between successive reinforcement layers was approximately 0.305 m. Each layer was installed horizontally and extended across the full 1.07 m width of the model. In the longitudinal direction, the reinforcement extended from the rear portion of the compacted soil mass toward the constructed slope face, with its length governed by the soil geometry available within the approximately 1.83 m-long test box. At the slope face, the reinforcement layers terminated at the exposed face and were not configured using a wrapped-face or mechanical block-connection system. At the rear or tail end, the reinforcement extended into the compacted soil toward the rear boundary of the wooden box. The layers were embedded by the overlying compacted soil without externally applied prestressing or a separate mechanical anchorage system. No dedicated drainage outlet was connected to the ends of the geotextile layers.
Sensor access openings were prepared through the rear wall of each test box after the soil had been placed and compacted to the corresponding monitoring elevation. The sensors were subsequently inserted horizontally into the compacted soil at their designated locations, as described in Section 2.4. This procedure avoided direct compaction over the sensor bodies while allowing the sensors to be positioned at corresponding nominal locations in the two models.
The control model was constructed using the same three-lift placement sequence and nominal construction specifications but without geogrid or geotextile layers. Post-construction settlement was not measured using displacement instrumentation or a formal elevation survey. A small qualitative difference was visually observed during environmental exposure, with the control model exhibiting slightly greater settlement than the reinforced model. Because this settlement was not quantified, it was not used as a response variable or interpreted as a measured reinforcement benefit.
Although the geotextile introduced continuous horizontal interfaces that could influence local water storage, filtration, and lateral moisture redistribution, neither in-plane discharge nor soil–geotextile interface flow was measured directly. So, the results discussed in this study represent interpretations of the observed moisture–suction responses of the two monitored reduced-scale models rather than direct measurements of drainage through the geotextile. The comparisons are also conditional on these two individual models and should not be interpreted as a statistically replicated reinforcement effect.
2.4. Field Instrumentation and Climatic Monitoring
Each reduced-scale physical model was instrumented at four nominal monitoring depths using paired volumetric water content (VWC) sensors and a matric potential sensor. VWC and soil temperature were measured using TEROS 11 sensors (METER Group, Inc., Washington, DC, USA), while matric suction was measured using TEROS 21 Gen 2 solid-matrix sensors (METER Group, Inc., Pullman, WA, USA). The instrumentation records identified TEROS 11 firmware version 2.00, with the Mineral Soil calibration selected, and TEROS 21 Gen 2 firmware version 6.00. The TEROS 11 has a manufacturer-specified VWC range of 0.00–0.70 m3/m3 for mineral soil, a resolution of 0.001 m3/m3, and a typical accuracy of ±0.03 m3/m3 when the generic Mineral Soil calibration is used. Its approximate measurement volume is 1010 mL. The sensor also measures temperature over a range of −40 to 60 °C with a resolution of 0.1 °C and an accuracy of ±1.0 °C between −40 and 0 °C and ±0.5 °C between 0 and 60 °C [37]. The TEROS 21 Gen 2 has a manufacturer-specified matric-potential range from approximately 0 to −100,000 kPa and a resolution of 0.1 kPa. Its specified accuracy is ± (10% of the reading + 2 kPa) over the principal calibrated interval from −5 to −100 kPa. The sensor also measures temperature from −40 to 60 °C with a resolution of 0.1 °C and an accuracy of ±1.0 °C [38]. The instruments report matric potential as a negative pressure; for consistency with conventional SWCC presentation, the measurements were subsequently expressed as positive suction magnitudes.
The sensors were installed at nominal depths of approximately 0.15, 0.46, 0.76, and 1.07 m (0.5, 1.5, 2.5, and 3.5 ft) below the upper soil surface. The upper monitoring level was approximately 155 mm below the surface, and successive monitoring levels were separated vertically by approximately 305 mm. The lowest monitoring level was located near the base of the compacted soil profile. At each level, the TEROS 11 and TEROS 21 sensors were installed at the same nominal depth and in close lateral proximity, although they did not occupy an identical measurement volume. In this study, the term “collocated” therefore denotes sensors installed within the same local monitoring zone rather than at an identical physical point.
Although sensors were installed at all four depths, the analysis presented in this paper used the paired VWC and matric-suction observations obtained at the nominal 0.46 m (1.5 ft) depth. This depth was selected because synchronized measurements from both sensor types were available in the reinforced and control models. In the reinforced model, the analyzed sensor pair was positioned approximately midway between adjacent reinforcement layers and was approximately 0.15 m from the nearest geosynthetic interface. The nominal relationships among the soil boundaries, monitoring levels, and reinforcement layers are presented in Figure 2. Exact horizontal insertion distances and the separation between the individual sensor bodies were not independently surveyed; therefore, the schematic represents the documented nominal installation geometry.
Figure 2.
Cross-sectional instrumentation layout for the reinforced and control reduced-scale physical models. The red squares represent TEROS 11 VWC sensors, the green circles represent TEROS 21 matric-potential sensors, and the blue lines represent the geogrid-integrated geotextile layers. Monitoring depths are referenced to the upper soil surface, and dimensions indicate the nominal vertical relationships among the sensors, soil boundaries, and reinforcement layers.
Sensor access openings were prepared through the rear wall of each wooden box after placement and compaction of the soil at the corresponding monitoring elevations. The sensor bodies were inserted horizontally from the rear wall to provide measurements over discrete depth intervals. The TEROS 11 needles were inserted directly into the compacted clay, and care was taken to minimize air gaps around the needles. The TEROS 21 ceramic surfaces were placed in direct contact with the surrounding soil to promote hydraulic equilibration. Disturbed soil around the access openings was repacked carefully, and the cables were routed through the rear wall and secured before connection to the data-logging system. Representative photographs of the sensors and their installation are provided in Figure 1d.
The TEROS 11 sensors were operated using the manufacturer-provided Mineral Soil calibration. A laboratory verification was additionally conducted using one representative specimen of the homogenized borrow soil evaluated at seven moisture states over an approximate reference VWC range of 0.10–0.41 m3/m3. The comparison between the sensor-reported and experimentally established reference VWC values produced θsensor = 0.9576 × θreference + 0.0357 with R2 = 0.992 (Figure 3). Because this evaluation involved only one soil specimen and did not include independent specimen replication, it was treated as a limited verification of sensor response rather than as a universally applicable soil-specific calibration. The relationship was not used to transform the field observations, and the manufacturer-calibrated VWC outputs were retained for analysis. The verification was not used to claim individual calibration of every TEROS 11 sensor installed. Consequently, possible sensor-specific bias remains part of the uncertainty associated with the comparison between the two monitored models.
Figure 3.
Single-specimen laboratory verification of the TEROS 11 Mineral Soil calibration using seven reference moisture states. The solid line represents the fitted linear relationship. VWC denotes volumetric water content.
Following installation, the sensors were allowed approximately 10 days to establish contact and equilibrate with the surrounding compacted soil before the monitoring observations were used for analysis. The TEROS 21 requires hydraulic equilibration between its porous ceramic discs and the adjacent soil; therefore, rapid wetting or drying may produce a temporary lag between the soil response and sensor response. The equilibration period reduced installation-related transients but does not eliminate the possibility of short-term response lag during individual rainfall events.
The sensor and climatic measurements were recorded using automated data loggers at nominal 15-min intervals. VWC and matric-potential observations were paired only when they had identical timestamps within the same model. No temporal interpolation was used to create moisture–suction pairs. The model and firmware identifiers of the data loggers were not retained in the archived project records.
An automated weather station was installed adjacent to the two models and recorded precipitation, air temperature, vapor pressure, atmospheric pressure, and wind speed. Each precipitation value represented rainfall accumulated during the corresponding 15-min interval. Because the reinforced and control models were positioned side by side, the same precipitation record was assigned to both models. The complete test setups of the reduced-scale physical models are shown in Figure 4.
Figure 4.
Outdoor setup of the slope models under natural conditions.
The manufacturer’s quantified TEROS 21 accuracy applies primarily over a matric-suction magnitude of approximately 5–100 kPa. Observations outside this interval remained within the broader measurement capability of the instrument but were interpreted with greater caution. Very wet measurements below approximately 5 kPa may be influenced by the wet-end response and hydraulic equilibration of the ceramic discs, while measurements exceeding approximately 100 kPa have greater manufacturer-reported uncertainty. Temperature effects may also become more important as suction approaches approximately 500 kPa. Accordingly, the full observed dataset was retained to describe the monitored hydraulic range, while a common-domain sensitivity analysis restricted to 5–100 kPa was used to evaluate whether the principal comparison depended on observations outside the manufacturer’s specified accuracy interval.
For the analyzed period, the initial hydraulic state was defined using the median observations from the first complete monitoring day, 1 June 2025. At the 0.46 m depth, the reinforced model had an initial median VWC of approximately 0.317 m3/m3 and a median suction magnitude of approximately 2.8 kPa. The corresponding control-model values were approximately 0.261 m3/m3 and 60.6 kPa. The two models therefore did not begin the period analyzed from identical hydraulic states. These initial differences were retained as observed and were considered when interpreting the subsequent section-level differences; they were not attributed solely to the presence or absence of reinforcement.
2.5. Data Preparation and Quality Control
Measurements obtained at the nominal depth of 0.46 m (1.5 ft) were analyzed from 1 June 2025 to 1 March 2026. Each processed record contained an identical timestamp, 15-min precipitation, and paired VWC and matric suction measurements for the reinforced and control sections. The complete 15-min time grid contained 26,210 expected timestamps, of which 25,999 contained complete paired observations, corresponding to an overall data completeness of 99.2%.
The records were ordered chronologically and screened for duplicate timestamps, missing values, incomplete VWC–suction pairs, non-numeric entries, and nonpositive suction values. No duplicate timestamps, incomplete recorded pairs, or non-positive suction measurements were identified. Matric suction was expressed as a positive magnitude, with increasing suction representing progressively drier hydraulic conditions.
Range checks were performed using the manufacturer-reported sensor specifications [43,44]. The observed VWC ranged from 0.268 to 0.359 m3/m3 in the reinforced section and from 0.222 to 0.340 m3/m3 in the control section. All measurements were within the stated TEROS 11 mineral-soil measurement range. The corresponding suction ranges were 0.6–51.1 kPa and 0.2–509.3 kPa, respectively. Although these observations were within the overall measurement range of the TEROS 21 Gen 2 sensor, not all values were within its principal stated accuracy interval of 5–100 kPa. Consequently, the primary SWCC fitting and direct curve comparison were restricted to the common reliability-supported domain of 5.0–51.1 kPa. Measurements outside this interval were retained in the observational record and descriptive time-series and summaries but were interpreted cautiously.
For rolling-window calculations, the observations were reindexed to the complete 15-min time grid. A hydraulic-path classification was assigned only when the required rolling windows contained complete observations; calculations were not permitted to bridge the identified gaps. Only the 268 calendar days containing all 96 expected measurements were eligible for the paired calendar-day bootstrap, and the same sampled days were used for both sections. No measurements were manually removed or adjusted based on their agreement with the fitted models. Because the records represent repeated temporal measurements from one reinforced and one control section rather than independent physical replicates, all uncertainty estimates and comparisons were interpreted as conditional on these two monitored test sections.
2.6. Development of Field-Derived SWCCs
Field-derived SWCCs were constructed from simultaneous VWC, (θ), and positive matric-suction, (ψ), measurements obtained at the nominal depth of 0.46 m. The complete observations were initially plotted with matric suction on a logarithmic axis. Because the monitoring record included wetting, drying, drainage, and relatively stable periods, the observations formed a field-retention envelope rather than a unique monotonic curve. The resulting dispersion was interpreted as history-dependent non-uniqueness associated with antecedent hydraulic conditions, wetting–drying transitions, field heterogeneity, measurement uncertainty, and possible hydraulic nonequilibrium. It was not considered conclusive evidence of classical hydraulic hysteresis.
The principal SWCC analysis was based on observations classified as drying. A causal trailing 24-h median was calculated for the suction record using only measurements available at or before each timestamp. The hydraulic-state change was calculated as the difference between the current trailing 24-h median and the corresponding median 24 h earlier. An observation was classified as drying when this difference exceeded (+0.5) kPa, as wetting when it was less than (−0.5) kPa, and as approximately stable when it remained between these thresholds. Two complete consecutive 24-h windows, each containing 96 observations, were required for classification. Consequently, no classification was assigned near the beginning of the record or where either window intersected a missing-data gap, and rolling calculations were not permitted to bridge the identified gaps.
Suction was used as the primary classification variable because it represents the hydraulic-energy state and avoids conditioning directly on VWC, which was the response variable used in SWCC fitting. The 0.5-kPa threshold was five times the TEROS 21 resolution of 0.1 kPa but remained smaller than the manufacturer-reported absolute accuracy interval; it was therefore treated as an operational threshold applied to smooth temporal changes rather than as an instrument-accuracy criterion. Robustness was evaluated using trailing windows of 12, 24, and 48 h; suction change thresholds of 0.5, 1.0, 2.5, and 5.0 kPa; and an alternative joint criterion requiring increasing suction and decreasing VWC for drying. Continuous drying segments and monotonic multiday changes in daily median suction and VWC were also examined. The primary causal classification identified 3703 reinforced-section and 9880 control-section drying observations, distributed across 54 and 129 calendar days and 30 and 42 contiguous drying segments, respectively.
For the primary model comparison, the drying observations were restricted to the common reliability-supported suction domain of 5.0–51.1 kPa. This restriction retained 3162 reinforced-section and 6011 control-section observations. The suction domain was divided into 20 logarithmically spaced bins to prevent densely sampled suction ranges from disproportionately influencing model fitting. Median suction and VWC were calculated within each bin, together with the 25th and 75th percentiles of VWC. Only bins containing at least 30 observations were retained, resulting in 14 reinforced-section and 20 control-section bins. Each retained bin median was assigned equal weight during model fitting. Sensitivity analyses considered 15, 20, 25, and 30 bins; minimum bin populations of 15, 30, and 60 observations; and lower suction limits of 5 and 9 kPa. The complete dataset was used to display the field-retention envelope, whereas the reliability-restricted drying subset was used for the principal van Genuchten parameter estimation.
Relative observation-density fields were generated solely to visualize the distribution of the complete field observations in logarithmic suction–VWC space. A two-dimensional histogram comprising 70 suction intervals and 58 VWC intervals was used to provide sufficient visual resolution while limiting pixel-scale sparsity. Cell frequencies were transformed using (ln(1 + c)), where ‘c’ is the number of observations within a cell, and were smoothed using a Gaussian filter with a standard deviation of 1.05 grid cells. The resulting field was normalized by the maximum value within each test section. These settings were applied identically to both sections and did not influence the logarithmic binning, model fitting, parameter estimates, or statistical comparisons. Accordingly, the density scale represents relative concentration within each panel and should not be used to compare absolute observation frequencies between sections.
2.7. van Genuchten Modeling and Statistical Evaluation
The reliability-restricted drying relationships developed in Section 2.6 were represented using the van Genuchten (vG) water-retention model [6] as shown in Equation (1):
where θ(ψ) is the predicted VWC at matric suction ψ; θr and θs are the lower- and upper-asymptotic volumetric water contents, respectively; α is an inverse-suction scaling parameter expressed in kPa−1; and n and m describe the shape and curvature of the retention relationship. For the primary analysis, m was constrained using the commonly adopted relationship (Equation (2)):
The primary models were fitted separately to the reinforced and control drying datasets over the common suction domain of 5.0–51.1 kPa. To avoid embedding the difference between the section-specific minimum VWC values directly into the fitted models, a common value of θr = 0.222 m3/m3 was imposed for both sections. This value represents the minimum VWC observed across the paired monitoring record and was used as a shared field-based lower constraint rather than as a laboratory-determined residual water content. Therefore, θs, α, and n were estimated during model fitting, while m was calculated using Equation (2).
The monitoring record did not extend to independently verified saturated or residual conditions. Accordingly, θs was interpreted as an effective upper-asymptotic VWC rather than as a direct measurement of saturated water content, and θr was treated as a modeling constraint rather than as an intrinsic residual water content. Similarly, α, n, and m were considered effective descriptors of the monitored drying relationship within the evaluated suction domain. The characteristic suction, denoted by ψc, was calculated as the inverse of α as presented in Equation (3):
where ψc is expressed in kPa. Because the fitted van Genuchten relationship does not define a discrete air-entry point and independently verified saturated conditions were not available, ψc was not interpreted as a laboratory-measured air-entry suction.
Nonlinear parameter estimation was performed using the SciPy curve_fit nonlinear least-squares routine with the trust-region reflective algorithm. The initial value of θs was specified as the 90th percentile of the retained binned VWC values, while the initial values of α and n were 0.05 kPa−1 and 2.0, respectively. The parameter bounds were θr < θs ≤ 0.60 m3/m3, 10−6 ≤ α ≤ 10 kPa−1, and 1.001 ≤ n ≤ 20. The maximum number of function evaluations was 100,000, and the function, parameter, and gradient convergence tolerances were each set to 10−12. The primary reinforced and control models were fitted using 14 and 20 retained logarithmic-bin medians, respectively.
Model performance was evaluated using the coefficient of determination, R2; root-mean-square error, RMSE; mean absolute error, MAE; and index of agreement, d. These statistics were calculated using Equations (4)–(7):
where θi is the observed binned median water content, is the fitted value, is the mean of the observed binned medians, and N is the number of retained bins. These statistics quantify the in-sample agreement between the fitted model and the binned median observations. In particular, R2 was not interpreted as the proportion of variability in the complete 15-min field record explained by the model.
Practical parameter identifiability was evaluated using the fitted covariance matrix, pairwise parameter-correlation coefficients, and the covariance-matrix condition number. Profile sum-of-squared-error analyses were also performed by fixing θs, α, or n sequentially across a predefined range and reoptimizing the remaining parameters. An 80-point linear grid was used for θs, while 100-point logarithmic and linear grids were used for α and n, respectively. Flat or asymmetric profile-error curves, large covariance condition numbers, strong parameter correlations, and contact with an optimization bound were interpreted as evidence of weak practical identifiability.
Sensitivity to the assumed model structure was evaluated using several alternative parameter constraints. The analysis was repeated using common fixed θr values of 0.05, 0.10, 0.15, 0.20, and 0.222 m3 m−3. Additional models allowed θr to be estimated separately for each section between zero and the minimum retained binned VWC, estimated a single common θr jointly for both sections, or estimated m independently within the range 0.02 ≤ m ≤ 0.99 instead of imposing Equation (2). These alternative models were evaluated over common suction domains of 5.0–51.1 and 9.0–51.1 kPa.
Parameter uncertainty was evaluated using 2000 paired calendar-day bootstrap resamples. A total of 268 calendar days contained all 96 expected 15-min observations and were eligible for resampling. During each bootstrap iteration, 268 complete days were selected with replacement, and the same selected dates were used for the reinforced and control sections to preserve their paired climatic exposure. Hydraulic-path classifications were established from the original chronological record before resampling so that joining nonconsecutive sampled days did not create artificial drying or wetting transitions. Logarithmic binning and van Genuchten model fitting were then repeated for both sections within every bootstrap sample.
A bootstrap iteration was classified as unsuccessful if either section contained fewer than five retained bins or if nonlinear optimization failed to converge. All 2000 primary bootstrap iterations converged. Parameter-bound contacts were recorded rather than silently removed, and an additional interior-only sensitivity summary was produced after excluding iterations in which either section reached a parameter bound. Bootstrap convergence was evaluated by comparing the percentile intervals obtained after 500, 1000, and 2000 iterations. A fixed random seed of 4,546,173 was used to ensure computational reproducibility. For each bootstrap iteration, the difference in a fitted parameter was calculated directly as (Equation (8)):
where b identifies the bootstrap iteration and p represents θs, α, n, m, or ψc. The difference between the predicted retention curves was similarly calculated as (Equation (9)):
The 95% uncertainty intervals were obtained from the 2.5th and 97.5th percentiles of the paired bootstrap distributions. Conclusions regarding section-level differences were based on these direct paired distributions and predicted curve differences rather than on overlap or non-overlap between separate within-section confidence intervals. Because the experiment contained only one reinforced and one control test section, all bootstrap intervals were interpreted as uncertainty conditional on these two monitored sections. They were not interpreted as population-level confidence intervals for a general reinforcement treatment effect. Data preparation, model fitting, statistical evaluation, and figure generation were performed using Python 3.12.13. Data processing and numerical operations used pandas 2.2.3 and NumPy 2.3.5; nonlinear optimization and statistical calculations used SciPy 1.17.0; figures were generated using Matplotlib 3.10.8; and the Excel-formatted source data were accessed using openpyxl 3.1.5. The data and analysis scripts that support the findings of this study are available from the corresponding author upon reasonable request.
2.8. Hydraulic Response Analyses
Hydraulic responses at the selected monitoring depth were evaluated using SWCC-derived moisture sensitivity, observed water-content variability, and rainfall-event responses. The fitted drying curves were compared over the common measured suction range of 5.0–51.1 kPa. Moisture sensitivity was calculated as (Equation (10)):
where θ is the fitted VWC (m3/m3), ψ is matric suction (kPa), and Sθ(ψ) represents the magnitude of water-content change per tenfold change in suction. The mean and maximum sensitivity, suction corresponding to maximum sensitivity, and total fitted water-content change across the common suction range were determined. Observed water-content variability was separately described using the mean, standard deviation, coefficient of variation, and range.
Rainfall events were identified by grouping nonzero precipitation records separated by no more than 24 h. Events were retained when cumulative rainfall was at least 5 mm and paired sensor data were available from 24 h before the event through 72 h after its final rainfall record. These criteria retained 21 of the 53 identified rainfall clusters. Antecedent volumetric water content, θant, and antecedent suction, ψant, were calculated as the median values during the preceding 24 h. The maximum event-associated increase in volumetric water content was calculated using the equation (Equation (11)) shown below.
where θmax is the maximum volumetric water content recorded from rainfall initiation through 72 h after the event ended. The absolute decrease in suction was calculated following the equation (Equation (12)) as shown below.
Δθevent = θmax − θant
Δψevent = ψant − ψmin
The relative suction decrease was calculated per Equation (13) shown below.
where ψmin is the minimum suction recorded within the event-response window. The elapsed times from rainfall initiation to θmax and ψmin were also determined. Because rainfall timestamps represented precipitation accumulated during the preceding 15-min interval, 0.25 h was added to the calculated response times.
Event responses were summarized using medians and interquartile ranges and compared using two-sided paired Wilcoxon signed-rank tests. Because repeated observations were obtained from only one reinforced and one control section, the statistics were interpreted as descriptive, site-specific comparisons rather than population-level treatment effects. These analyses quantify water retention and rainfall response but do not directly establish changes in deformation, shear strength, factor of safety, or overall slope stability.
3. Results
3.1. Hydroclimatic Conditions and Temporal Moisture–Suction Response
Figure 5 presents the precipitation record and corresponding volumetric water content (VWC) and matric suction measured at a depth of 0.46 m (1.5 ft) from 1 June 2025 to 1 March 2026. Panel (a) shows the 15-min precipitation increments, while panels (b) and (c) present the VWC and matric suction responses, respectively. Both physical models were exposed to the same recorded precipitation sequence, but their hydraulic states remained distinctly different during much of the monitoring period.
Figure 5.
Temporal hydroclimatic and hydraulic responses measured at a depth of 0.46 m (1.5 ft) from 1 June 2025 to 1 March 2026: (a) precipitation in 15-min increments, represented by downward black bars; (b) volumetric water content; and (c) matric suction. The red and blue curves represent the reinforced and control physical models, respectively. Each temporal series contains 25,999 synchronized observations.
Based on 25,999 synchronized observations, the reinforced section had a mean VWC of 0.3155 m3/m3, compared with 0.2653 m3/m3 in the control section. The corresponding median values were 0.318 and 0.263 m3/m3, respectively. Thus, the reinforced section remained wetter at the investigated depth. Water content varied from 0.268 to 0.359 m3/m3 in the reinforced section, producing a range of 0.091 m3/m3. In comparison, the control VWC varied from 0.222 to 0.340 m3/m3, with a range of 0.118 m3/m3. The coefficients of variation were 0.060 and 0.075 for the reinforced and control sections, respectively, indicating lower relative temporal variability in the reinforced section.
Substantial differences were also observed in matric suction. The reinforced section had a median suction of 1.3 kPa, a mean of 7.69 kPa, and a maximum of 51.1 kPa. In comparison, the control section had a median suction of 7.0 kPa, a mean of 47.21 kPa, and a maximum of 509.3 kPa. The difference was most pronounced during the extended drying period from October through November 2025. During this period, suction in the control section increased progressively to almost 500 kPa, whereas the increase in the reinforced section remained below approximately 51 kPa. Subsequent wetting near the end of November produced a sharp reduction in suction and an increase in VWC in both sections.
Precipitation events generally increased VWC and decreased matric suction, although the magnitude and timing of the responses varied with event characteristics and antecedent hydraulic conditions. Not every small precipitation event produced a clearly distinguishable response. From an engineering perspective, the narrower VWC range and smaller suction excursions observed in the reinforced section indicate a more buffered moisture regime at the monitored depth, which is relevant to assessing wetting–drying cycles and potential volume change in high-plasticity clay. However, these hydraulic observations do not independently demonstrate improved mechanical stability because deformation, reinforcement strain, discharge, shear strength, and factor of safety were not measured. Furthermore, because only one physical model represented each configuration, the differences should be interpreted as section-level observations rather than replicated causal effects of the reinforcement.
3.2. Field-Observed SWCCs and Water-Retention Envelopes
Figure 6 presents the joint observation density, binned VWC distributions, and fitted water-retention relationships for the reinforced and control sections at the investigated depth. Each section contained 25,999 synchronized VWC–suction observations. Rather than collapsing onto a unique moisture–suction curve, the observations formed broad retention envelopes with several high-density clusters. These clusters identify hydraulic states recorded frequently during the monitoring period. The surrounding dispersion likely reflects the combined influence of antecedent moisture conditions, climatic forcing, wetting and drying history, and measurement variability. Although this history-dependent non-uniqueness is potentially consistent with hydraulic hysteresis, it does not independently demonstrate classical hysteresis because controlled wetting and drying paths were not isolated.
Figure 6.
Field-derived soil water retention behavior at the nominal 0.46 m monitoring depth for (a) the reinforced section and (b) the unreinforced control section. Discrete yellow to green cells represent the frequency density of simultaneous field observations, with darker cells indicating more frequently observed hydraulic states. Open circles and capped error bars indicate binned median volumetric water contents and corresponding interquartile ranges, respectively, while the solid curves represent the descriptive van Genuchten fits obtained using the complete field datasets.
VWC was negatively associated with log10-based transformed suction in both sections. The descriptive Pearson correlation coefficients were −0.703 for the reinforced section and −0.609 for the control section. The more negative coefficient for the reinforced section indicates a closer overall monotonic association within that time series, although substantial field scatter remained. These correlations should not be interpreted as an inferential comparison between treatments because the observations were temporally autocorrelated and only one physical model represented each configuration. The reinforced observations were concentrated within a suction range of 0.6 to 51.1 kPa, whereas the control observations extended from 0.2 to 509.3 kPa. Therefore, direct comparison of the two envelopes was restricted to their common observed suction domain of 0.6–51.1 kPa. Within this domain, the reinforced envelope was generally positioned above the control envelope, and the binned median VWC was typically higher in the reinforced section.
The widths of the interquartile bands varied among suction bins, demonstrating that moisture variability was not uniform across the hydraulic range. Greater within-bin dispersion occurred in several low- and intermediate-suction regions, where observations associated with wetting, drying, and relatively stable periods overlapped. Toward the higher portions of the observed suction ranges, median VWC generally declined more systematically. When the complete field datasets were fitted without separating hydraulic paths, the van Genuchten model produced descriptive in-sample R2 values of 0.758 and 0.643 for the reinforced and control sections, respectively. The corresponding RMSEs were 0.0071 and 0.0107 m3/m3. The reinforced fit also had a lower MAE and a higher index of agreement, indicating that the fitted curve described the reinforced observations more closely. These metrics characterize goodness of fit for the two monitored sections and should not be interpreted as replicated evidence of treatment superiority.
The remaining dispersion indicates that the field response is more appropriately represented as a water-retention envelope than as a single deterministic SWCC. From an engineering perspective, this finding demonstrates that using one fitted retention curve may not fully represent the range of hydraulic states experienced by compacted high-plasticity clay under natural climatic forcing. SWCC-based interpretations of water storage, hydraulic response, and suction-dependent behavior should therefore consider the observed suction domain, antecedent conditions, and hydraulic history. The common-domain and parameter-sensitivity analyses presented subsequently provide a more controlled basis for comparing the two sections.
3.3. Drying-Path van Genuchten Parameters and Model Performance
The primary drying-path analysis was restricted to the common suction domain of 5.0–51.1 kPa to avoid extrapolation beyond the reliable measurement range and to provide the same comparison interval for both sections. For the primary analysis, a drying observation was identified when matric suction increased by more than 0.5 kPa relative to the preceding 24-h reference value. The classification was based on suction change alone; a more restrictive criterion requiring both increasing suction and decreasing VWC was evaluated separately as a sensitivity analysis. This procedure retained 3162 observations from the reinforced section and 6011 observations from the control section. After imposing a minimum of 30 observations per logarithmic suction bin, 14 reinforced-section bins and 20 control-section bins were retained for fitting. Figure 7a compares the binned median water contents and fitted drying relationships, while Table 1 summarizes the model parameters and goodness-of-fit statistics.
Figure 7.
Direct comparison of the drying-path water-retention relationships over the common measured suction domain of 5.0–51.1 kPa: (a) fitted van Genuchten relationships and binned median volumetric water contents with interquartile ranges for the reinforced and control sections; and (b) median reinforced-minus-control predicted water-content difference, Δθ, with the percentile-based 95% confidence interval obtained from 2000 paired calendar-day block-bootstrap resamples.
Table 1.
van Genuchten parameters, model-performance statistics, and fit diagnostics.
To prevent the section-specific minimum water contents from being embedded directly in the model comparison, the residual water-content parameter, θr, was fixed at a common value of 0.222 m3/m3 for both sections. This value represents a modeling constraint based on the lower field-observed water-content range and should not be interpreted as a laboratory-determined residual water content. The reinforced section had a fitted upper-asymptotic water content, θs, of 0.325 m3/m3, compared with 0.276 m3/m3 for the control section. Because complete saturation was not observed under field conditions, these values represent effective upper asymptotes within the modeled domain rather than direct measurements of saturated water content.
The fitted α values were 0.041 kPa−1 for the reinforced section and 0.027 kPa−1 for the control section. The corresponding characteristic suction values, calculated as 1/α, were 24.19 and 37.63 kPa, respectively. The fitted curve-shape parameter, n, was 1.91 for the reinforced section and 1.83 for the control section. Because m was constrained by m = 1 − 1/n, the resulting m values were 0.477 and 0.454, respectively. These point estimates indicate that the principal distinction between the fitted curves was their water-content level rather than a clearly separated characteristic suction or curve shape. Accordingly, α, 1/α, n, and m should be regarded as effective field-fitting parameters and not as direct measurements of intrinsic air-entry or pore-structure properties.
Parameter uncertainty was evaluated using 2000 paired calendar-day block-bootstrap resamples. Figure 8 compares the full-data van Genuchten parameter estimates and their percentile-based 95% intervals. Reinforced and control observations from the same sampled days were resampled together to preserve their paired climatic forcing. All 2000 resamples produced fitted curve predictions, although 222 resamples placed at least one parameter at its specified bound. The 95% bootstrap intervals for θs were 0.313–0.337 m3/m3 for the reinforced section and 0.266–0.339 m3/m3 for the control section. The corresponding intervals for α were 0.028–0.064 kPa−1 and 0.016–10 kPa−1, respectively. The control interval reached the imposed upper parameter bound, demonstrating weak identification of α in some bootstrap samples. The intervals for n were 1.65–2.43 for the reinforced section and 1.13–4.28 for the control section, while the characteristic-suction intervals were 15.62–35.80 kPa and 0.10–64.71 kPa, respectively.
Figure 8.
Full-data van Genuchten parameter estimates and percentile-based 95% intervals obtained from 2000 paired calendar-day block-bootstrap resamples for the reinforced and control sections: (a) effective upper-asymptotic volumetric water content, θs; (b) suction-scaling parameter, α; (c) curve-shape parameter, n; and (d) characteristic suction, 1/α. Red circles and blue squares represent the reinforced and control sections, respectively. The α axis is logarithmic. The upper limit of the control α interval reached the imposed parameter bound, indicating weak parameter identification. All intervals are conditional on the two monitored physical-model sections.
The paired 95% intervals for the differences in θs, α, n, and 1/α all included zero. Therefore, the fitted parameter estimates do not provide statistically conclusive evidence that the two physical models had different intrinsic van Genuchten parameters. Parameter-correlation diagnostics also indicated substantial dependence among θs, α, and n, with absolute correlation coefficients ranging approximately from 0.80 to 0.97. The covariance-condition number was approximately 6.6 × 10⁴ for the reinforced fit and 3.6 × 10⁵ for the control fit, further indicating weaker parameter identifiability for the control section. These results explain why predictions within the observed suction domain were more stable than the individual asymptotic parameter estimates.
A paired curve-level comparison was therefore used as the primary measure of the difference between the fitted drying relationships. At each suction value, the predicted water-content difference was calculated as:
where ∆θ(ψ) is the predicted VWC difference at matric suction ψ, and θreiforced and θcontrol are the fitted water contents for the reinforced and control sections, respectively. Positive values indicate higher predicted water content in the reinforced section.
Δθ(ψ) = θreinforced(ψ) − θcontrol(ψ)
As shown in Figure 7b, the median paired-bootstrap difference remained positive throughout the 5.0–51.1 kPa common domain. At 5.0 kPa, the predicted difference was approximately 0.0454 m3/m3, with a 95% interval of 0.035–0.059 m3/m3. The difference decreased progressively with suction and reached approximately 0.0126 m3/m3 at 51.1 kPa, with a corresponding interval of 0.0074–0.0180 m3/m3. The pointwise lower confidence bound remained above zero at every evaluated suction. Thus, the curve-level comparison provides stronger evidence than the individual parameter contrasts that the reinforced section maintained higher predicted VWC across the drying range.
The reinforced fit produced a descriptive in-sample R2 of 0.979, an RMSE of 0.0021 m3/m3, an MAE of 0.0018 m3/m3, and an index of agreement of 0.995. The corresponding control values were 0.567, 0.0048 m3/m3, 0.0028 m3/m3, and 0.855, respectively. These statistics were calculated from 14 reinforced-section and 20 control-section binned medians. They indicate that the van Genuchten relationship represented the reinforced binned observations more closely. However, R2 should not be interpreted as the percentage of independent field variation explained because the statistics are in-sample measures based on temporally derived binned observations. Likewise, stronger goodness of fit does not demonstrate more favorable engineering performance. Within the monitored physical models, the reinforced section maintained approximately 0.013–0.045 m3/m3 higher predicted VWC over the reliable common suction range. This difference identifies a distinct hydraulic response at the investigated depth but does not, by itself, establish improved mechanical stability or a causal reinforcement effect.
3.4. Moisture Sensitivity to Matric-Suction Variation
Figure 9 compares the derivative-based moisture sensitivities of the revised drying-path van Genuchten relationships, calculated using Equation (10) over the common measured suction domain of 5.0–51.1 kPa. The corresponding common-domain sensitivity measures are summarized in Table 2. The sensitivity of the reinforced relationship increased with suction, reached a maximum of 0.085 m3/m3 per logarithmic suction unit at approximately 35.65 kPa, and then decreased slightly. The control relationship increased more gradually and reached its highest evaluated sensitivity of 0.042 m3/m3 per logarithmic suction unit at the upper boundary of the common domain, 51.1 kPa. The theoretical control-curve maximum occurs at approximately 57.94 kPa; because this value lies outside the common measured domain, it was not included in the primary comparison. The point-estimate sensitivity of the reinforced relationship remained higher than that of the control throughout the evaluated domain.
Figure 9.
Absolute moisture sensitivity of the reinforced and control drying-path van Genuchten relationships, expressed as |dθ/dlog10ψ| and evaluated over the common measured suction domain of 5.0–51.1 kPa. Open circles identify the first and last evaluated points. The curves were calculated from the revised point-estimate model parameters.
Table 2.
Moisture-sensitivity measures for the reinforced and control drying-path van Genuchten relationships over the common suction domain of 5.0–51.1 kPa.
The mean absolute sensitivity over the common domain was 0.053 for the reinforced section and 0.019 for the control section. The corresponding fitted decreases in VWC between 5.0 and 51.1 kPa were 0.053 and 0.019 m3/m3, respectively. These results indicate that the reinforced fitted relationship exhibited a larger and more concentrated change in water content with logarithmic suction. This behavior reflects the combined effects of the fitted upper-asymptotic water content, α, and n parameters and should not be attributed to any individual parameter alone. Although the reinforced fitted relationship had greater derivative-based sensitivity, its monitored water-content record had a lower coefficient of variation and a narrower overall range than the control. These findings are not contradictory: derivative-based sensitivity represents the local slope of the fitted drying relationship, whereas temporal variability represents the range of hydraulic states experienced under climatic loading.
3.5. Rainfall-Event-Scale Hydraulic Response
Twenty-one rainfall events satisfied the minimum rainfall and data-coverage criteria. Figure 10 presents paired event-specific comparisons of the maximum post-event change in volumetric water content (VWC) and the relative decrease in matric suction. The median maximum VWC change was 0.014 m3/m3 in the reinforced section and 0.020 m3/m3 in the control section. The corresponding interquartile ranges were 0.002–0.023 and 0.004–0.041 m3/m3, respectively. Thus, the control section exhibited both a larger median wetting response and greater event-to-event dispersion. The paired Wilcoxon signed-rank test produced a p-value of 0.0249. This value is treated as descriptive because the rainfall events represent repeated observations from the same two physical test sections rather than independent experimental replicates.
Figure 10.
Paired rainfall-event responses of the reinforced and control sections for the 21 qualifying rainfall events: (a) maximum post-event change in volumetric water content and (b) relative post-event decrease in matric suction. Red circles and blue squares represent event-specific responses in the reinforced and control sections, respectively, while gray connecting lines link responses associated with the same rainfall event. Values below zero indicate an opposite-direction response during the specified post-event monitoring period.
The median absolute decrease in matric suction was 0.30 kPa in the reinforced section and 3.00 kPa in the control section, with interquartile ranges of 0.10–1.40 and 0.00–8.40 kPa, respectively. The median relative suction decreases were 22.22% for the reinforced section and 53.14% for the control section. Their corresponding interquartile ranges were 1.55–55.00% and 0.00–87.87%. The descriptive paired p-values were 0.0298 for the absolute suction decrease and 0.0401 for the relative suction decrease. These results show that the control section generally experienced larger event-induced suction changes, although substantial variability occurred among individual rainfall events. Signed response values were retained in the analysis; values at or below zero indicate negligible or opposite-direction responses during the specified post-event period.
The median lag to peak VWC was 20.75 h in the reinforced section and 18.50 h in the control section. The corresponding interquartile ranges were 9.75–56.50 and 5.50–55.00 h, and the descriptive paired p-value was 0.1114. The median lag to minimum matric suction was 22.75 h in the reinforced section and 48.50 h in the control section, with interquartile ranges of 0.25–37.00 and 2.75–81.75 h, respectively. The corresponding descriptive p-value was 0.0936. These results indicate that section-level differences were more consistently expressed through response magnitude than through response timing. Lag calculations used the interval-ending convention for the 15-min precipitation timestamps.
From an applied perspective, the smaller typical VWC and suction changes observed in the reinforced section indicate a more moderated event-scale hydraulic response at the investigated depth. Such moderation could reduce repeated moisture-driven changes in soil volume and stiffness. However, the reinforced section also generally maintained higher water content and lower suction; therefore, the observed hydraulic response should not be interpreted directly as improved shear strength or slope stability. Because only one model represented each condition and no deformation, reinforcement strain, drainage discharge, shear strength, or factor of safety was measured, the results should be interpreted as section-specific, hypothesis-generating evidence requiring replicated and coupled hydro-mechanical validation.
4. Discussion
4.1. Observed Section-Level Differences in Water Retention
The combined monitoring record demonstrates a persistent hydraulic difference between the reinforced and control sections at the nominal 0.46 m monitoring depth. The reinforced section had a higher mean VWC than the control section (0.316 vs. 0.265 m3/m3), a lower median matric suction (1.3 vs. 7.0 kPa), and a narrower temporal VWC range. The observation-density distributions and binned field-retention data similarly showed that the reinforced section generally occupied wetter hydraulic states. These findings establish a consistent difference between the two monitored outdoor model sections, although they do not independently identify reinforcement as the sole cause.
The revised drying-path comparison provides stronger support at the curve level than at the individual-parameter level. Over the common reliable suction domain of 5.0–51.1 kPa, the reinforced-minus-control predicted VWC difference remained positive throughout the domain. Based on 2000 paired calendar-day bootstrap resamples, the median difference was 0.045 m3/m3 at 5.0 kPa, with a conditional 95% interval of 0.035–0.059 m3/m3. The difference decreased to 0.013 m3/m3 at 51.1 kPa, with a corresponding interval of 0.007–0.018 m3/m3. The positive curve difference also persisted across the viable combinations of filtering window, drying threshold, suction domain, bin number, minimum bin count, and shared residual-water-content constraint examined in the sensitivity analyses. Therefore, the most robust result is that the reinforced section retained more water than the control section at comparable suction within the evaluated domain.
The fitted upper-asymptotic parameters, θs, were 0.325 and 0.276 m3/m3 for the reinforced and control sections, respectively. These values should not be interpreted as laboratory-measured saturated water contents because complete saturation was not observed. Moreover, the paired-bootstrap interval for the difference in θs included zero when all converged resamples were retained. The fitted θs values are consequently best regarded as effective upper-asymptotic parameters that describe the monitored drying data rather than independently established material properties.
Several factors could have contributed to the observed section-level contrast. These include local water storage or redistribution near the geotextile interfaces, differences in soil fabric or compaction around the reinforcement, sensor–soil contact, and the location of the sensor relative to the reinforcement layers and model boundaries. Because only one reinforced and one control section were monitored, reinforcement, model-specific conditions, local compaction, and sensor response cannot be separated statistically. The results therefore demonstrate a reproducible contrast between these two sections rather than a replicated causal treatment effect.
4.2. Desaturation Behavior and Moisture Sensitivity
Under the common-domain model, the fitted α values were 0.041 and 0.027 kPa−1 for the reinforced and control sections, respectively, while the corresponding characteristic-suction values, 1/α, were 24.19 and 37.63 kPa. The fitted n values were 1.91 and 1.83, respectively. However, the paired-bootstrap intervals for the between-section differences in α, 1/α, and n included zero. In addition, the control parameters were comparatively weakly identified, and the control fit reached a parameter bound in 11.1% of the bootstrap resamples. The control observations were also less closely represented by a single domain van Genuchten curve than the reinforced observations. These findings prevent the individual parameters from supporting a definitive claim that reinforcement altered intrinsic air-entry suction or produced a statistically distinct desaturation-shape parameter.
The curve-derived sensitivity analysis nevertheless identified an important difference within the measured domain. The reinforced relationship reached a maximum sensitivity of 0.085 m3/m3 per logarithmic suction unit at approximately 35.65 kPa. Its mean absolute sensitivity over 5.0–51.1 kPa was 0.053, and its total predicted VWC change across this interval was 0.053 m3/m3. The maximum evaluated control sensitivity was 0.042 at 51.1 kPa, while its mean sensitivity and total predicted VWC change were 0.019 and 0.019 m3/m3, respectively. The theoretical control peak occurred beyond the evaluated domain; therefore, its reported maximum represents the upper boundary of the common measured range rather than a fully observed sensitivity peak.
The higher model-derived sensitivity of the reinforced relationship does not conflict with its lower observed temporal variability. The temporal coefficient of variation was 0.060 for the reinforced section and 0.075 for the control, and the corresponding VWC ranges were 0.091 and 0.118 m3/m3. These statistics describe the hydraulic states encountered over time, whereas the derivative-based sensitivity describes the local slope of the fitted drying relationship at a specified suction. The reinforced section occupied a narrower and generally wetter range during monitoring, but its fitted VWC changed more rapidly with logarithmic suction over part of the common drying domain.
Accordingly, the term “hydraulic buffering” should not be used to imply uniformly lower moisture sensitivity. The observations support attenuation of temporal and rainfall-event response amplitudes at the monitored location. They do not show that the reinforced section was less sensitive at every suction or that reinforcement created an intrinsically more stable hydraulic material.
4.3. Rainfall-Driven Hydraulic Response and Response Attenuation
The analysis of 21 qualifying rainfall events provides event-scale support for the long-term section-level contrast. The median maximum post-event VWC increase was 0.014 m3/m3 in the reinforced section and 0.020 m3/m3 in the control. Median absolute suction decreases were 0.30 and 3.00 kPa, while median relative suction decreases were 22.22% and 53.14%, respectively. Thus, rainfall generally produced smaller moisture and suction excursions at the monitored location in the reinforced section. The paired Wilcoxon results characterize consistent differences within this series of events, but they remain descriptive because the events are repeated observations of the same two physical sections rather than independent experimental replicates.
The smaller reinforced response is consistent with its wetter antecedent condition and lower suction. A section beginning an event at higher water content may have less available storage at the sensor location and may consequently exhibit a smaller incremental VWC increase. Because antecedent suction was frequently low in the reinforced section, the relative suction-change percentages should also be considered together with the absolute suction decreases rather than interpreted alone. Redistribution near the reinforcement interfaces and differences in unsaturated hydraulic conductivity may additionally have affected the local response, but neither process was measured directly.
Response timing showed less consistent separation. Median lags to peak VWC were 20.75 h for the reinforced section and 18.50 h for the control, whereas median lags to minimum suction were 22.75 and 48.50 h, respectively. The paired timing comparisons were more unstable than the magnitude comparisons and did not demonstrate a uniform reinforcement-related delay. Rainfall duration and intensity, antecedent hydraulic state, and the within-event temporal distribution of precipitation likely contributed to this variability.
From an applied perspective, the results show that corresponding locations in the two sections did not experience equal hydraulic excursions under the same rainfall events. This difference is relevant to transient seepage and suction assessment, but it should not be interpreted as evidence of enhanced drainage or improved stability because drainage discharge, deformation, reinforcement strain, and shear resistance were not measured.
4.4. Potential Soil–Geosynthetic Hydraulic Mechanisms
The observed differences may arise from interactions among the compacted clay, the continuous geotextile component, and the geogrid–soil interfaces. Contrasts in pore-size distribution and water-retention behavior across a soil–geosynthetic interface can temporarily impede cross-plane flow, promote localized water accumulation, or alter the direction of moisture redistribution [20,21,26]. Under suitable hydraulic gradients, the geotextile plane may also provide a pathway for lateral redistribution [27]. These processes could contribute to a wetter region near the reinforcement while reducing the short-term response recorded at an individual sensor.
The reinforcement layers may also modify soil fabric and pore continuity locally. Compaction around the geogrid apertures and continuous geotextile backing may produce conditions different from those in the surrounding compacted clay. Such differences could affect capillary continuity, preferential flow, and unsaturated hydraulic conductivity. The geogrid primarily provides tensile reinforcement and confinement and is not expected to store appreciable water; any direct storage or redistribution would be more closely associated with the geotextile and adjacent soil.
4.5. Practical Implications for Hydraulic and Hydro-Mechanical Assessment
The principal practical contribution of the study is the demonstration that corresponding locations in nominally similar reinforced and unreinforced compacted-clay physical models may not exhibit hydraulically equivalent behavior. Assigning one retention relationship to both zones could therefore obscure potentially important differences in predicted water content, suction, and transient hydraulic response. For geometrically and materially comparable systems, the reinforced and control relationships may be used as observation-based sensitivity cases over the measured 5.0–51.1 kPa domain. The paired curve-difference intervals provide a more defensible uncertainty range for this purpose than direct transfer of individual fitted parameters.
In transient seepage analysis, the alternative retention relationships would produce different initial water contents at a specified suction and different water-content changes during drying. Because an unsaturated hydraulic-conductivity function is commonly derived partly from the retention relationship, these differences could also influence predicted infiltration, moisture redistribution, and suction recovery [6]. However, conductivity was not measured in the present study, and any conductivity function inferred from the fitted SWCCs would require independent calibration before being used for design.
The hydraulic observations also have competing mechanical implications. Greater water retention and lower suction may reduce the suction-dependent contribution to soil shear strength [2,5]. In contrast, smaller event-scale fluctuations could reduce the magnitude of rapid hydraulic changes at the monitored location. The geogrid provides a separate mechanical contribution through tensile resistance and soil confinement. Whether these mechanisms produce a net improvement in slope performance cannot be determined without measurements or analyses of deformation, reinforcement strain, interface strength, pore-water pressure distribution, and factor of safety.
4.6. Study Limitations and Generalizability
The experiment consisted of one reinforced and one control outdoor reduced-scale physical model. Although the 15-min measurements and 21 qualifying rainfall events provide substantial temporal information, they do not provide independent physical replication. The reinforcement condition is consequently confounded with model-specific construction conditions, local soil fabric, sensor response, and boundary effects. Bootstrap resampling accounts for temporal dependence and quantifies uncertainty conditional on these two sections, but it cannot create independent treatment replication or establish a population-level reinforcement effect.
Construction procedures were maintained consistently as practicable, and the borrow soil was homogenized before placement in both models. The lifts were proportioned to target 95% of the Standard Proctor maximum dry density using controlled soil mass and lift volume. Nevertheless, independent measurements of the achieved dry unit weight and placement water content for every lift were not available, and post-construction settlement was not quantified. Therefore, density, fabric, and initial-condition differences cannot be completely excluded as contributors to the observed hydraulic contrast.
The analysis was limited to the nominal 0.46 m monitoring depth. Conditions at this location may depend on its distance from the slope surface, reinforcement layers, and wooden boundaries. Although sensors were installed at other depths, those records were outside the scope of the present paper. Multi-depth analysis is required to determine whether the observed difference persists vertically and whether hydraulic behavior varies with proximity to individual reinforcement layers.
The primary drying-path fit was restricted to the common reliable suction domain of 5.0–51.1 kPa and used a shared θr value of 0.222 m3/m3. The monitored range did not independently define either complete saturation or the residual-water-content asymptote. Accordingly, θs and θr are fitting constraints rather than direct measurements of saturated and residual water content. Parameter movement under alternative constraints, strong parameter correlations, and the boundary behavior of some control bootstrap fits further demonstrate that α, n, and 1/α are not uniquely identifiable from the available range. The persistent positive curve-level difference is better supported than interpretations based on any individual van Genuchten parameter.
Finally, the broad field-retention envelopes demonstrate history-dependent non-uniqueness, but the available overlapping drying and wetting observations were insufficient to establish stable classical hysteresis branches. Climatic variability, sensor uncertainty, soil heterogeneity, and possible non-equilibrium response also contributed to the observed scatter. Because lateral flow, drainage discharge, deformation, reinforcement strain, shear strength, and factor of safety were not measured, the study should be interpreted as a hypothesis-generating hydraulic comparison between two monitored physical-model sections. Replicated models, multi-depth instrumentation, detailed as-built measurements, interface-flow monitoring, and coupled hydro-mechanical testing are required before the results can be generalized to reinforced slopes in engineering practice.
5. Conclusions
This study compared the hydraulic behavior of one geogrid–geotextile-reinforced and one unreinforced compacted high-plasticity clay physical model exposed to the same natural climatic conditions. Simultaneous volumetric water content and matric suction measurements at nominal 0.46 m depth were used to examine long-term hydraulic states, drying-path retention relationships, moisture sensitivity, and responses to individual rainfall events. The principal conclusions are as follows:
- The primary van Genuchten analysis was restricted to the common reliable suction domain of 5.0–51.1 kPa and used a shared residual-water-content parameter, θr = 0.222 m3/m3. The reinforced fit used 3162 drying observations and 14 retained logarithmic suction bins, while the control fit used 6011 observations and 20 bins. The reinforced fit produced R2 = 0.979, RMSE = 0.0021 m3/m3, MAE = 0.0018 m3/m3, and an index of agreement of 0.995. The corresponding control values were 0.567, 0.0048 m3/m3, 0.0028 m3/m3, and 0.855. Thus, a single van Genuchten relationship represented the reinforced binned observations more closely than the control observations within the common domain.
- The most robust result was obtained from direct comparison of the fitted retention curves rather than from individual van Genuchten parameters. The reinforced-minus-control predicted VWC difference remained positive throughout 5.0–51.1 kPa. Based on 2000 paired calendar-day bootstrap resamples, the median difference was 0.045 m3/m3 at 5.0 kPa, with a conditional 95% interval of 0.035–0.059 m3/m3, and 0.013 m3/m3 at 51.1 kPa, with an interval of 0.007–0.018 m3/m3. The positive curve difference also persisted across the viable combinations of filtering, drying classification, binning, fitting-domain, and residual-water-content assumptions examined in the sensitivity analyses.
- The fitted point estimates were θs = 0.325 m3/m3, α = 0.041 kPa−1, and n = 1.91 for the reinforced section and θs = 0.276 m3/m3, α = 0.027 kPa−1, and n = 1.83 for the control. However, the paired-bootstrap intervals for the between-section differences in the individual parameters included zero, and the control parameters were comparatively weakly identified. Accordingly, these parameter estimates should not be interpreted as statistically definitive changes in intrinsic saturated water content, air-entry suction, or pore-size distribution.
- The reinforced relationship exhibited greater model-derived sensitivity within the common suction domain. Its maximum sensitivity was 0.085 m3/m3 per logarithmic suction unit at approximately 35.65 kPa, compared with a maximum evaluated value of 0.042 for the control at the upper domain boundary of 51.1 kPa. The corresponding mean sensitivities were 0.053 and 0.019, and the total predicted VWC changes across the domain were 0.053 and 0.019 m3/m3.
- The reinforced section experienced lower observed temporal variability and smaller rainfall-event response amplitudes. Its VWC coefficient of variation and observed range were 0.060 and 0.091 m3/m3, respectively, compared with 0.075 and 0.118 m3/m3 for the control. Across the 21 qualifying rainfall events, median post-event VWC increases were 0.014 and 0.020 m3/m3 for the reinforced and control sections, median absolute suction decreases were 0.30 and 3.00 kPa, and median relative suction decreases were 22.22% and 53.14%, respectively. Response timing was more variable and did not demonstrate a consistent delay associated with the reinforced section.
- From an applied perspective, the results demonstrate that corresponding locations in nominally similar reinforced and unreinforced compacted-clay models may not behave as hydraulically equivalent systems. Using identical hydraulic relationships for reinforced and unreinforced zones could therefore overlook meaningful differences in predicted water content and transient suction. However, greater retained water and lower suction do not necessarily indicate improved slope stability because lower suction can reduce the suction-dependent contribution to shear strength. Conversely, smaller rainfall-driven fluctuations may moderate rapid hydraulic changes.
Overall, the study identifies a persistent section-level hydraulic difference between the two monitored physical models, with the reinforced section remaining wetter and exhibiting smaller temporal and rainfall-driven fluctuations at the investigated depth. The curve-level difference was considerably more robust than the contrasts among individual van Genuchten parameters. These findings should therefore be interpreted as hypothesis-generating evidence of possible hydraulic non-equivalence associated with the reinforced configuration, rather than as proof of a general causal reinforcement effect or improved slope stability. Future studies should include independently replicated reinforced and control physical models, analyze all instrumented depths, and quantify the achieved placement water content, dry density, and settlement of each lift. Direct measurements of soil–geotextile interface flow, drainage discharge, unsaturated hydraulic conductivity, reinforcement strain, deformation, shear strength, and stability response are also required to identify the governing mechanisms and determine their engineering significance.
Author Contributions
Conceptualization, M.J.B.A., R.S.M., F.N.R. and N.R.; methodology, M.J.B.A., R.S.M. and F.N.R.; software, M.J.B.A., R.S.M. and F.N.R.; validation, M.J.B.A., R.S.M., F.N.R. and N.R.; formal analysis, M.J.B.A., R.S.M. and F.N.R.; investigation, M.J.B.A., R.S.M. and F.N.R.; resources, M.J.B.A.; data curation, M.J.B.A. and R.S.M.; writing—original draft preparation, M.J.B.A., R.S.M., F.N.R. and N.R.; writing—review and editing, M.J.B.A., R.S.M., F.N.R. and N.R.; visualization, M.J.B.A. and R.S.M.; supervision, M.J.B.A.; project administration, M.J.B.A. All authors have read and agreed to the published version of the manuscript.
Funding
This work is supported by the National Center for Infrastructure Transformation (NCIT), contract No. 69A3552344813. The authors gratefully acknowledge partial financial support provided by the National Science Foundation (NSF) under Grant No. 2101081.
Institutional Review Board Statement
Not applicable.
Informed Consent Statement
Not applicable.
Data Availability Statement
The raw data supporting the conclusions of this article will be made available by the authors on request.
Conflicts of Interest
Author Naima Rahman was employed by the company SCS Engineers. The remaining authors declare that the research was conducted in the absence of any commercial or financial relationships that could be construed as a potential conflict of interest.
References
- Glendinning, S.G.; Hughes, P.; Helm, P.; Chambers, J.; Mendes, J.; Gunn, D.; Wilkinson, P.; Uhlemann, S. Construction, management and maintenance of embankments used for road and rail infrastructure: Implications of weather induced pore water pressures. Acta Geotech. 2014, 9, 799–816. [Google Scholar] [CrossRef] [Scilit]
- Vanapalli, S.K.; Fredlund, D.G.; Pufahl, D.E.; Clifton, A.W. Model for the prediction of shear strength with respect to soil suction. Can. Geotech. J. 1996, 33, 379–392. [Google Scholar] [CrossRef] [Scilit]
- Stirling, R.; Toll, D.G.; Glendinning, S.G.; Helm, P.; Yıldiz, A.; Hughes, P.; Asquith, J.D. Weather-driven deterioration processes affecting the performance of embankment slopes. Géotechnique 2020, 71, 957–969. [Google Scholar] [CrossRef] [Scilit]
- Pham, T.A. Climate change impacts on geotechnical infrastructure: Role of unsaturated soil mechanics for adaptation. Front. Built Environ. 2025, 11, 1666334. [Google Scholar] [CrossRef] [Scilit]
- Nuth, M.; Laloui, L. Effective stress concept in unsaturated soils: Clarification and validation of a unified framework. Int. J. Numer. Anal. Methods Geomech. 2007, 32, 771–801. [Google Scholar] [CrossRef] [Scilit]
- van Genuchten, M.T. A Closed-form Equation for Predicting the Hydraulic Conductivity of Unsaturated Soils. Soil Sci. Soc. Am. J. 1980, 44, 892–898. [Google Scholar] [CrossRef] [Scilit]
- Miller, C.J.; Yeşiller, N.; Yaldo, K.; Merayyan, S. Impact of Soil Type and Compaction Conditions on Soil Water Characteristic. J. Geotech. Geoenviron. Eng. 2002, 128, 733–742. [Google Scholar] [CrossRef] [Scilit]
- Tinjum, J.M.; Benson, C.H.; Blotz, L.R. Soil-Water Characteristic Curves for Compacted Clays. J. Geotech. Geoenviron. Eng. 1997, 123, 1060–1069. [Google Scholar] [CrossRef] [Scilit]
- Morsy, A.M.; Helm, P.; El-Hamalawi, A.; Smith, A.; Hughes, P.; Stirling, R.; Dijkstra, T.; Dixon, N.; Glendinning, S.G. Development of a Multiphase Numerical Modeling Approach for Hydromechanical Behavior of Clay Embankments Subject to Weather-Driven Deterioration. J. Geotech. Geoenviron. Eng. 2023, 149, 04023062. [Google Scholar] [CrossRef] [Scilit]
- Amenuvor, A.C.; Li, G.; Wu, J.; Hou, Y.; Chen, W.; Charkley, F.N. Crack development in a physical model of undisturbed expansive soil slope and core sample under wet-dry cycles. Eur. J. Environ. Civ. Eng. 2023, 28, 822–843. [Google Scholar] [CrossRef] [Scilit]
- Tang, C.; Cui, Y.-J.; Tang, A.M.; Shi, B. Experiment evidence on the temperature dependence of desiccation cracking behavior of clayey soils. Eng. Geol. 2010, 114, 261–266. [Google Scholar] [CrossRef] [Scilit]
- Yu, Z.; Eminue, O.; Stirling, R.; Davie, C.T.; Glendinning, S.G. Desiccation cracking at field scale on a vegetated infrastructure embankment. Géotech. Lett. 2021, 11, 88–95. [Google Scholar] [CrossRef] [Scilit]
- Bordoni, M.; Meisina, C.; Valentino, R.; Lu, N.; Bittelli, M.; Chersich, S. Hydrological factors affecting rainfall-induced shallow landslides: From the field monitoring to a simplified slope stability analysis. Eng. Geol. 2015, 193, 19–37. [Google Scholar] [CrossRef] [Scilit]
- Benjamim, C.V.S.; Bueno, B.S.; Zornberg, J.G. Field monitoring evaluation of geotextile-reinforced soil-retaining walls. Geosynth. Int. 2007, 14, 100–118. [Google Scholar] [CrossRef] [Scilit]
- Portelinha, F.H.M.; Zornberg, J.G.; Pimentel, V. Field performance of retaining walls reinforced with woven and nonwoven geotextiles. Geosynth. Int. 2014, 21, 270–284. [Google Scholar] [CrossRef] [Scilit]
- Hatami, K.; Esmaili, D.; Chan, E.C.; Miller, G.A. Laboratory performance of reduced-scale reinforced embankments at different moisture contents. Int. J. Geotech. Eng. 2014, 8, 260–276. [Google Scholar] [CrossRef] [Scilit]
- Hatami, K.; Esmaili, D.; Chan, E.C.; Miller, G.A. Moisture Reduction Factors for Shear Strength of Unsaturated Reinforced Embankments. Int. J. Geomech. 2016, 16, D4016001. [Google Scholar] [CrossRef] [Scilit]
- Yoo, C.-S.; Tabish, A.; Yang, J.; Abbas, Q.; Song, J. Effect of internal drainage on deformation behavior of GRS wall during rainfall. Geosynth. Int. 2021, 29, 137–150. [Google Scholar] [CrossRef] [Scilit]
- Mozumder, R.S.; Yadav, S.; Alam Md, J.B. Composite Geosynthetics for Climate-Resilient Slope Stability: A Comprehensive Review. Appl. Sci. 2026, 16, 2276. [Google Scholar] [CrossRef] [Scilit]
- Zornberg, J.G.; Bouazza, A.; McCartney, J.S. Geosynthetic capillary barriers: Current state of knowledge. Geosynth. Int. 2010, 17, 273–300. [Google Scholar] [CrossRef] [Scilit]
- McCartney, J.S.; Zornberg, J.G. Effects of infiltration and evaporation on geosynthetic capillary barrier performance. Can. Geotech. J. 2010, 47, 1201–1213. [Google Scholar] [CrossRef] [Scilit]
- Hachem, E. Moisture Drainage Under Unsaturated Soil Conditions with the Aid of Enhanced Lateral Drainage (ELD) Geotextiles. Master’s Thesis, The University of Texas at Austin, Austin, TX, USA, 2018. [Google Scholar] [CrossRef]
- Lin, C.; Xiong, Z.; Han, J. Comprehensive Material Characterizations of Pavement Structure Installed with Wicking Fabrics. J. Mater. Civ. Eng. 2019, 31, 04018372. [Google Scholar] [CrossRef] [Scilit]
- Lin, C.; Zhang, X. Laboratory Drainage Performance of a New Geotextile with Wicking Fabric. J. Mater. Civ. Eng. 2018, 30, 04018293. [Google Scholar] [CrossRef] [Scilit]
- Mohammed, S.A.; Zornberg, J.G. Assessing the Influence Zone and Drainage Efficiency of Geotextiles with Enhanced Lateral Drainage Abilities in Unsaturated Soil Systems. Geosciences 2026, 16, 22. [Google Scholar] [CrossRef] [Scilit]
- Bouazza, A.; Zornberg, J.G.; McCartney, J.S.; Singh, R.M. Unsaturated geotechnics applied to geoenvironmental engineering problems involving geosynthetics. Eng. Geol. 2013, 165, 143–153. [Google Scholar] [CrossRef] [Scilit]
- Albino, U.R.; Portelinha, F.H.M.; Futai, M.M. Numerical simulation of a geotextile soil wall considering soil-atmosphere interaction. Geosynth. Int. 2020, 27, 394–413. [Google Scholar] [CrossRef] [Scilit]
- Guzmán-Martínez, J.C.; García, E.F.; Vega-Posada, C.A. Effects of hydro-mechanical material parameters on the capillary barrier of reinforced embankments. Soils Found. 2021, 62, 101090. [Google Scholar] [CrossRef] [Scilit]
- Haverkamp, R.; Leij, F.J.; Fuentes, C.; Sciortino, A.; Ross, P.J. Soil Water Retention. Soil Sci. Soc. Am. J. 2005, 69, 1881–1890. [Google Scholar] [CrossRef] [Scilit]
- Widanagamage, N.; Patrignani, A. Comparison of Laboratory- and field-determined soil water retention curves in a well-aggregated tallgrass prairie soil. Soil Sci. Soc. Am. J. 2026, 90, e70174. [Google Scholar] [CrossRef] [Scilit]
- Likos, W.J.; Lu, N.; Godt, J.W. Hysteresis and Uncertainty in Soil Water-Retention Curve Parameters. J. Geotech. Geoenviron. Eng. 2014, 140, 04013050. [Google Scholar] [CrossRef] [Scilit]
- D’Onza, F.; Oliviero, V.; Gallipoli, D.; Mancuso, C.; Wheeler, S.J. Effect of in situ and laboratory compaction on the retention behaviour of a clayey soil. E3S Web. Conf. 2016, 9, 11003. [Google Scholar] [CrossRef] [Scilit]
- Hedayati, M.; Ahmed, A.; Hossain, M.S.; Hossain, J.; Sapkota, A. Evaluation and comparison of in-situ soil water characteristics curve with laboratory SWCC curve. Transp. Geotech. 2020, 23, 100351. [Google Scholar] [CrossRef] [Scilit]
- Ishimwe, E.; Blanchard, J.D.; Coffman, R.A. Field-Obtained Soil Water Characteristic Curves and Hydraulic Conductivity Functions. J. Irrig. Drain. Eng. 2018, 144, 04017056. [Google Scholar] [CrossRef] [Scilit]
- Yuan, K.; Ni, W.; Vecchia, G.D.; Lü, X.; Wang, H.; Nie, Y. Influence of dry density and wetting–drying cycles on the soil–water retention curve of compacted loess: Experimental data and modeling. Acta Geotech. 2024, 19, 8111–8128. [Google Scholar] [CrossRef] [Scilit]
- Mozumder, R.S.; Rahman, F.N.; Alam Md, J.B.; Rahman, N. Data-Driven Parameterization and Comparison of SWCC Models. In Proceedings of the Geo-Congress 2026, Salt Lake City, UT, USA, 9–12 March 2026; pp. 477–487. [Google Scholar] [CrossRef] [Scilit]
- ASTM D4318-26; Standard Test Methods for Liquid Limit, Plastic Limit, and Plasticity Index of Soils. ASTM International: West Conshohocken, PA, USA, 2026.
- ASTM (2017) D2487-17; Standard practice for classification of soils for engineering purposes (Unified Soil Classification System). ASTM International: West Conshohocken, PA, USA.
- ASTM D698-12(2021); Standard Test Methods for Laboratory Compaction Characteristics of Soil Using Standard Effort (12,400 ft-lbf/ft3 (600 kN-m/m3)). ASTM International: West Conshohocken, PA, USA, 2021.
- ASTM D4751-21a; Standard Test Methods for Determining Apparent Opening Size of a Geotextile. ASTM International: West Conshohocken, PA, USA, 2021.
- ASTM D4491/D4491M-22; Standard Test Methods for Water Permeability of Geotextiles by Permittivity. ASTM International: West Conshohocken, PA, USA, 2022.
- ASTM D6637/D6637M-15(2023); Standard Test Method for Determining Tensile Properties of Geogrids by the Single or Multi-Rib Tensile Method. ASTM International: West Conshohocken, PA, USA, 2023.
- METER Group, Inc. TEROS 11/12 User Manual; METER Group, Inc.: Pullman, WA, USA, 2025; Available online: https://publications.metergroup.com/Manuals/20587_TEROS11-12_Manual_Web.pdf (accessed on 7 September 2026).
- METER Group, Inc. TEROS 21 Gen 2 User Manual; METER Group, Inc.: Pullman, WA, USA, 2026; Available online: https://library.metergroup.com/Manuals/20854_TEROS21_Gen2_Manual_Web.pdf (accessed on 7 September 2026).
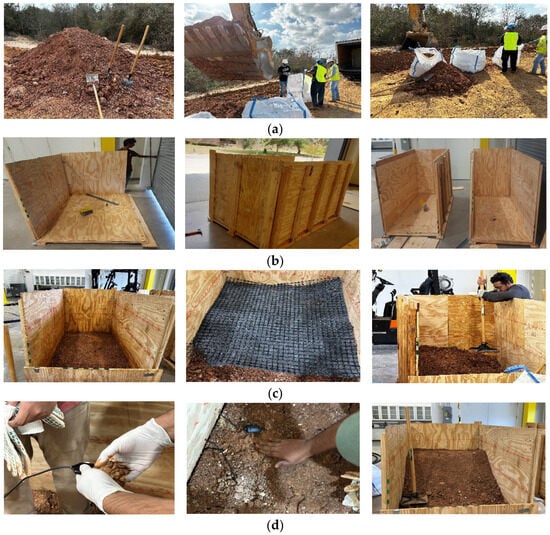
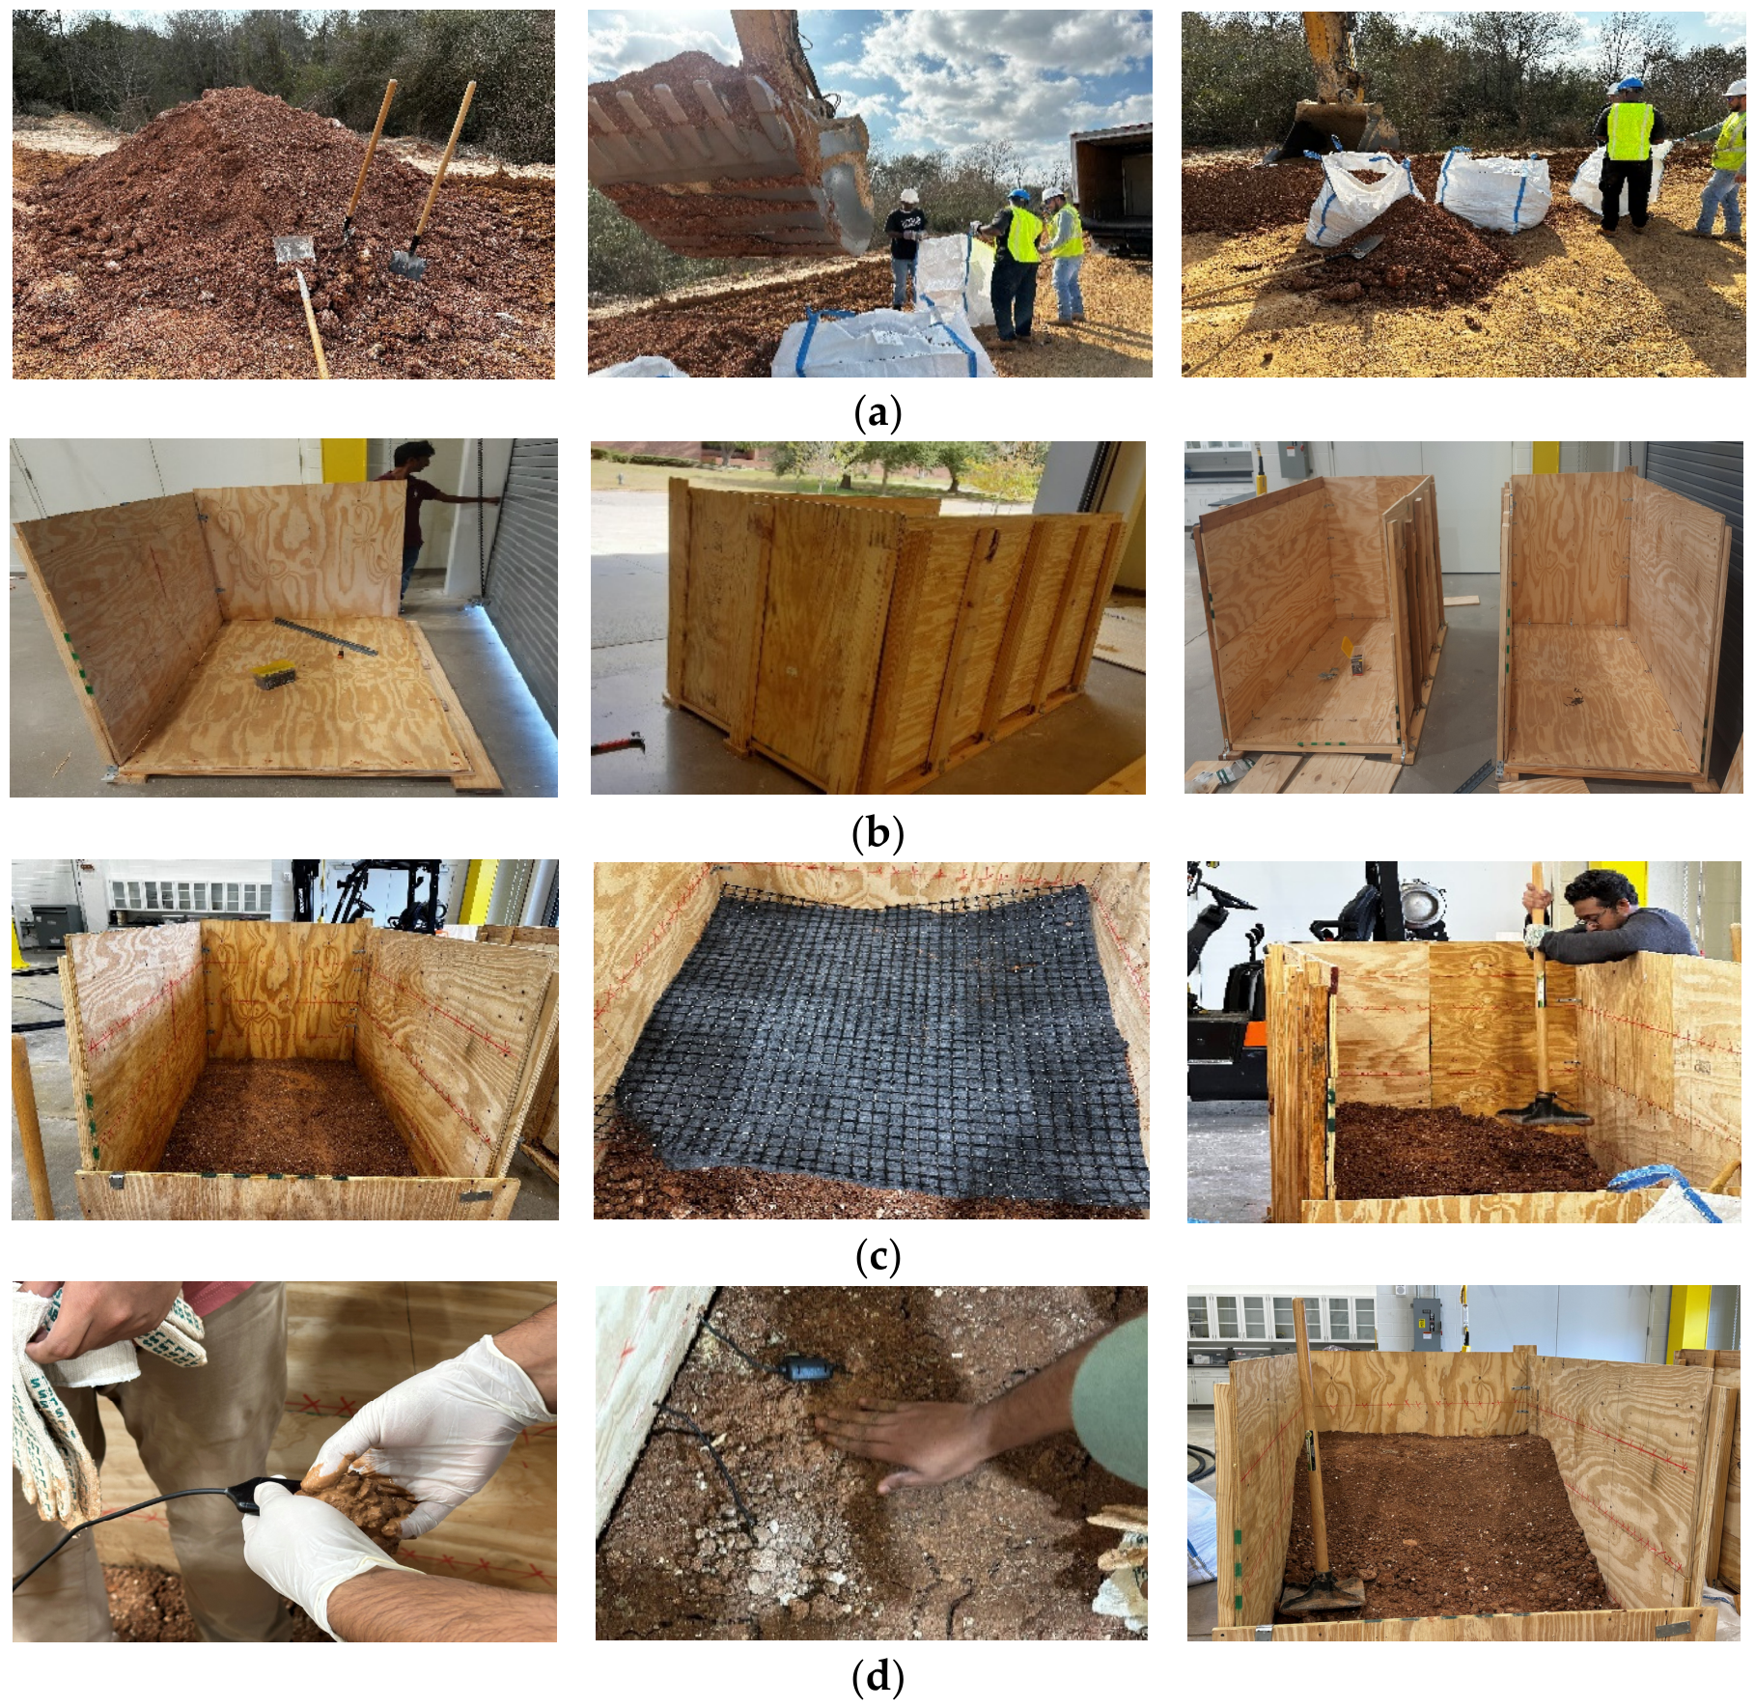
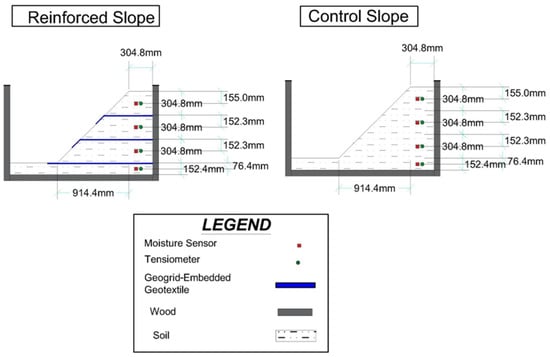
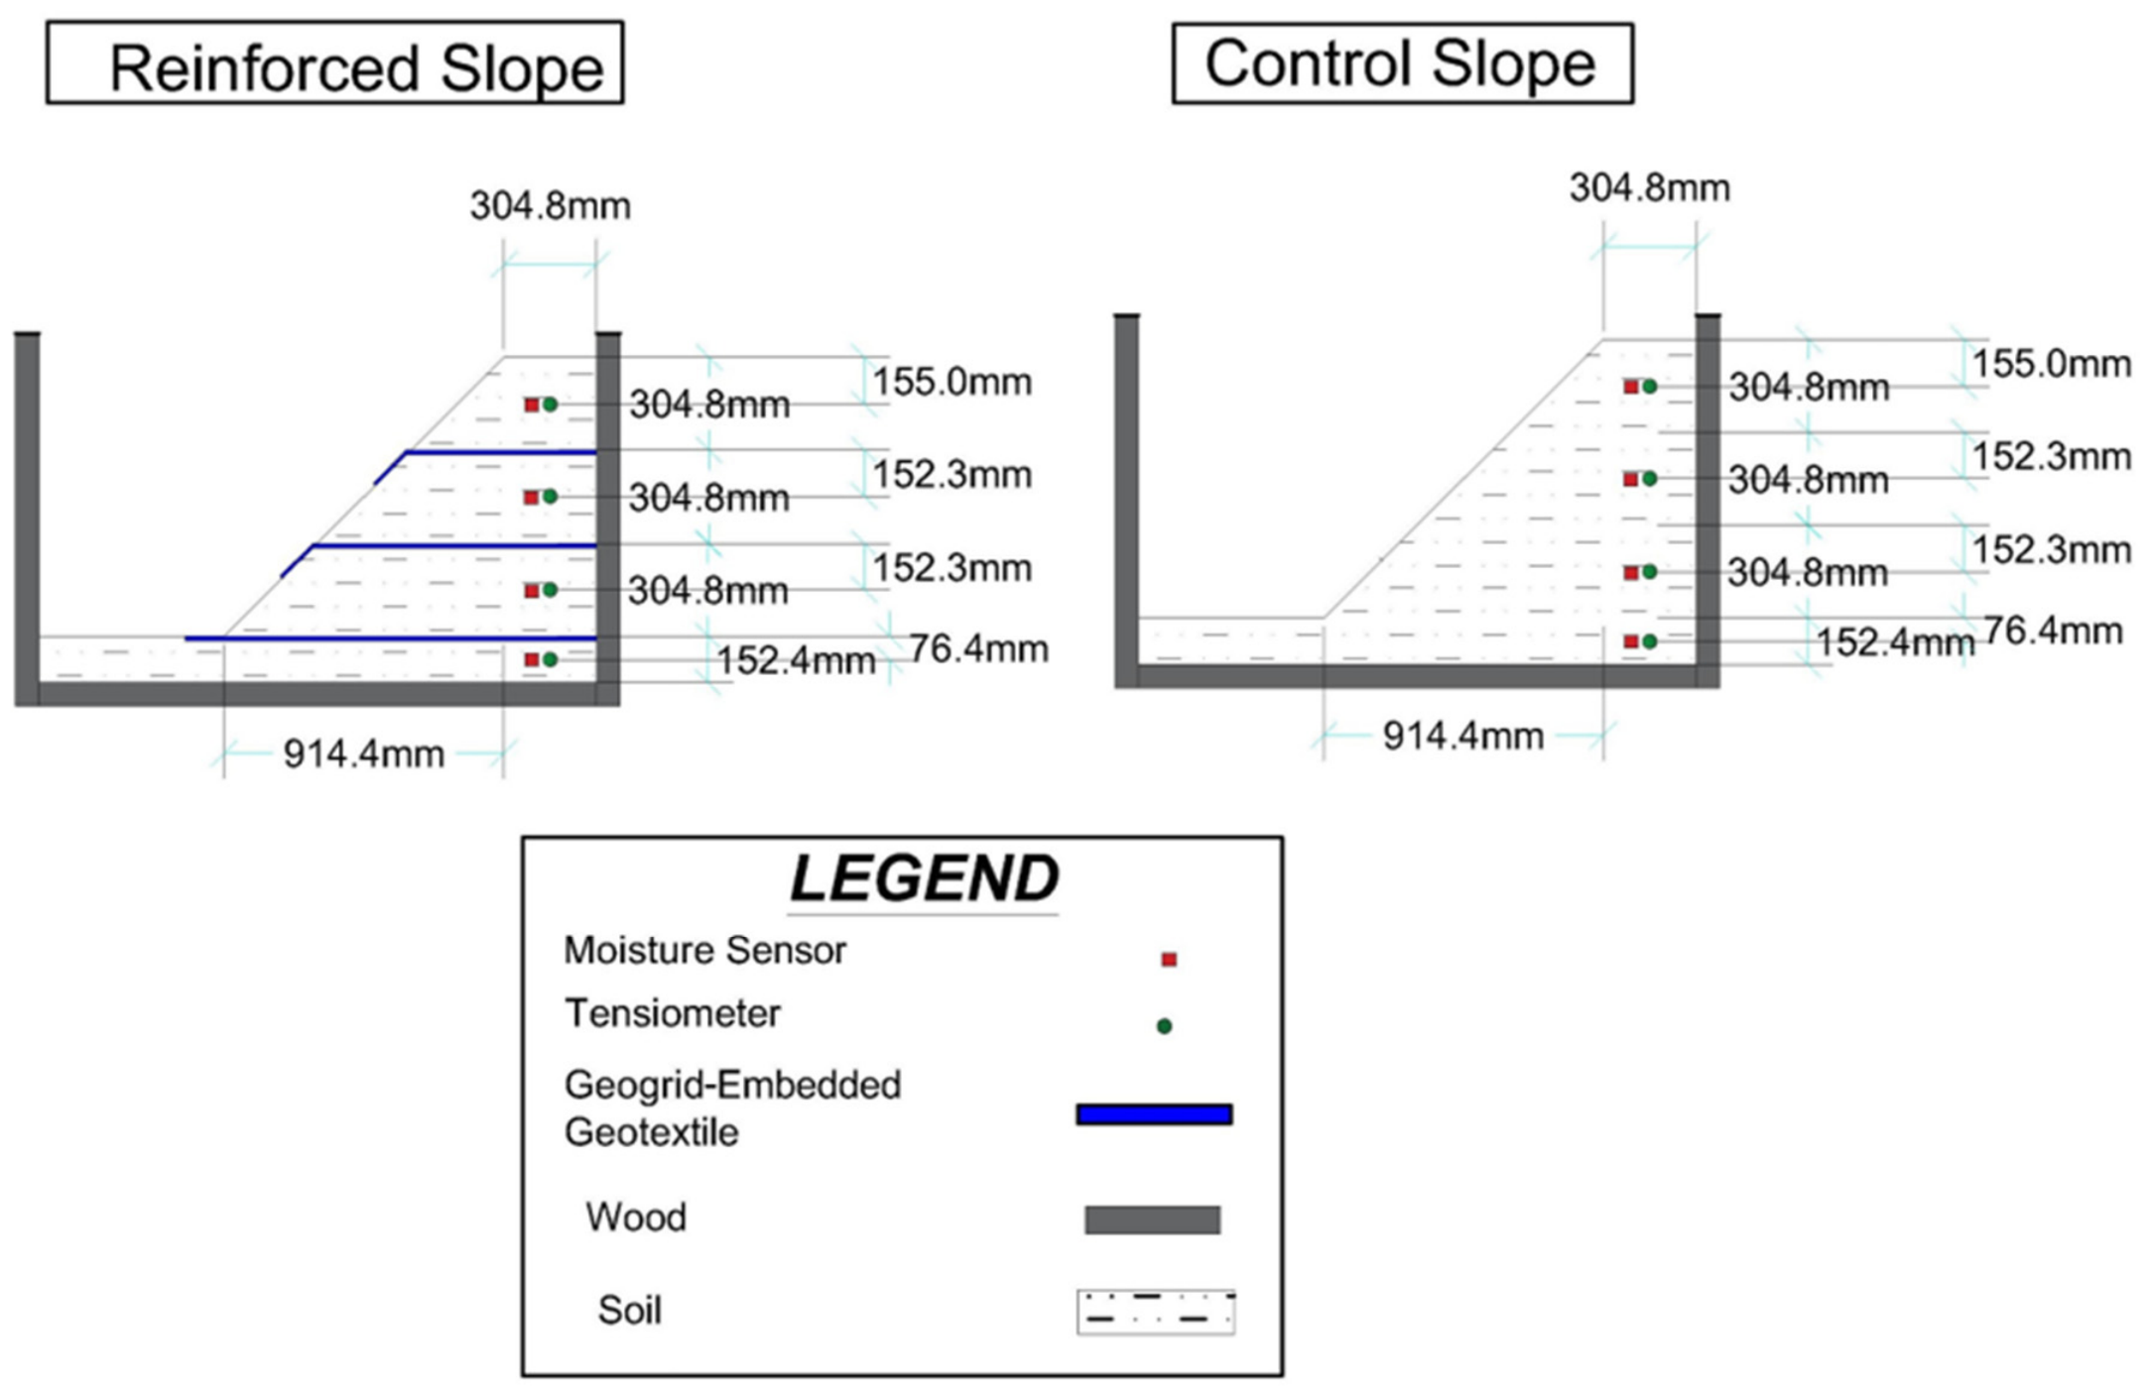
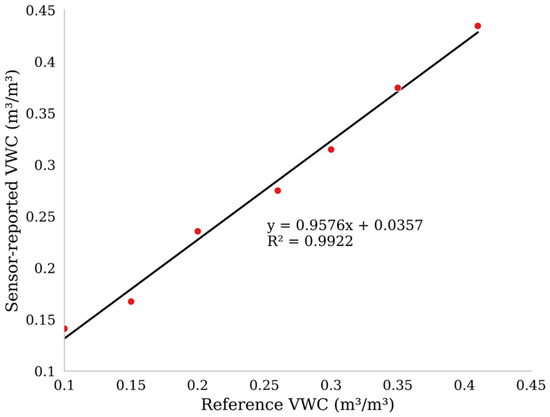
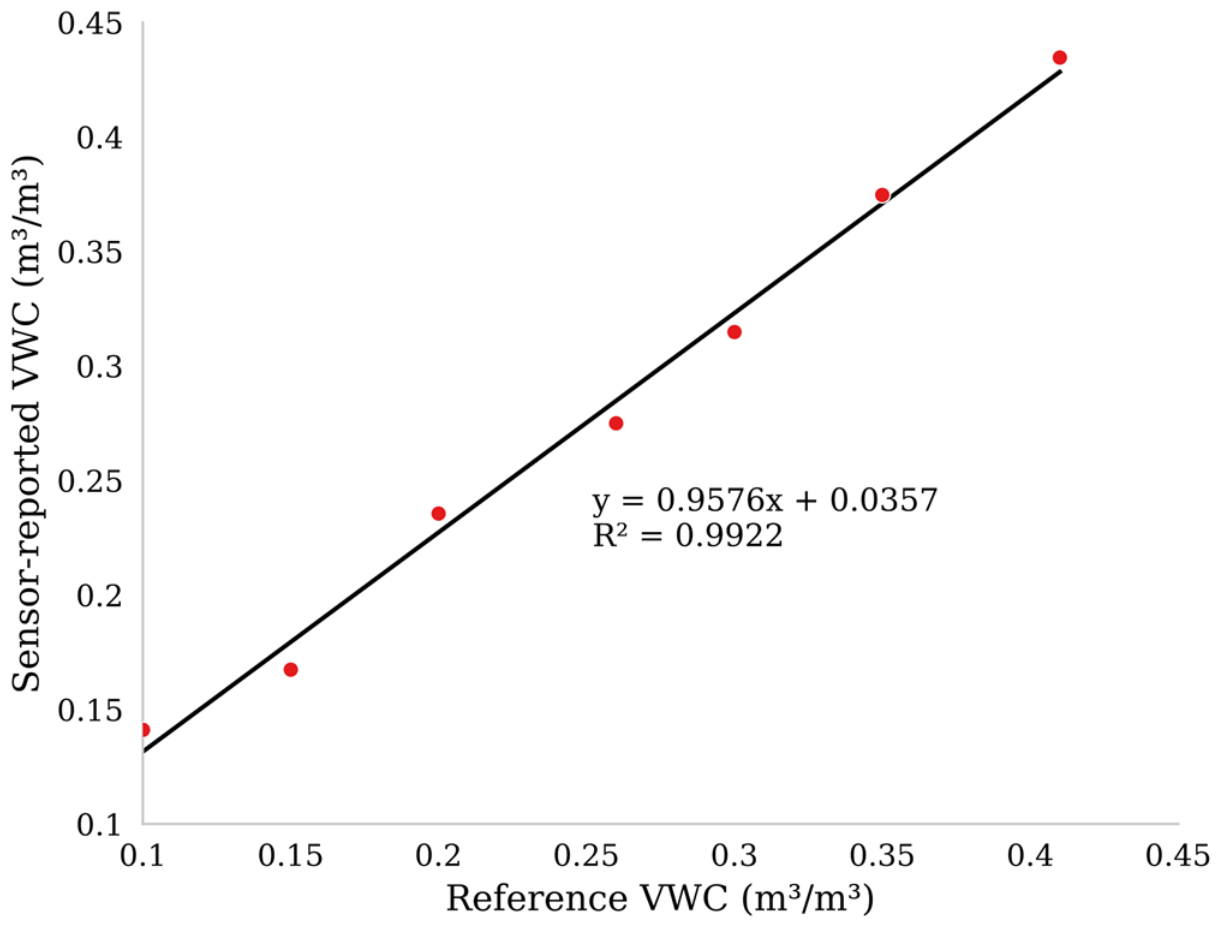
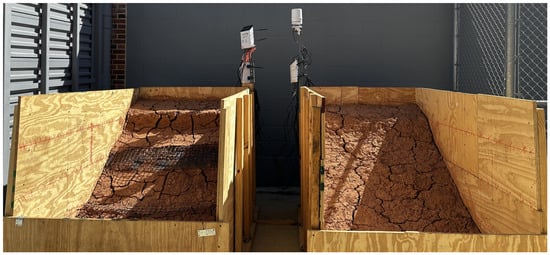
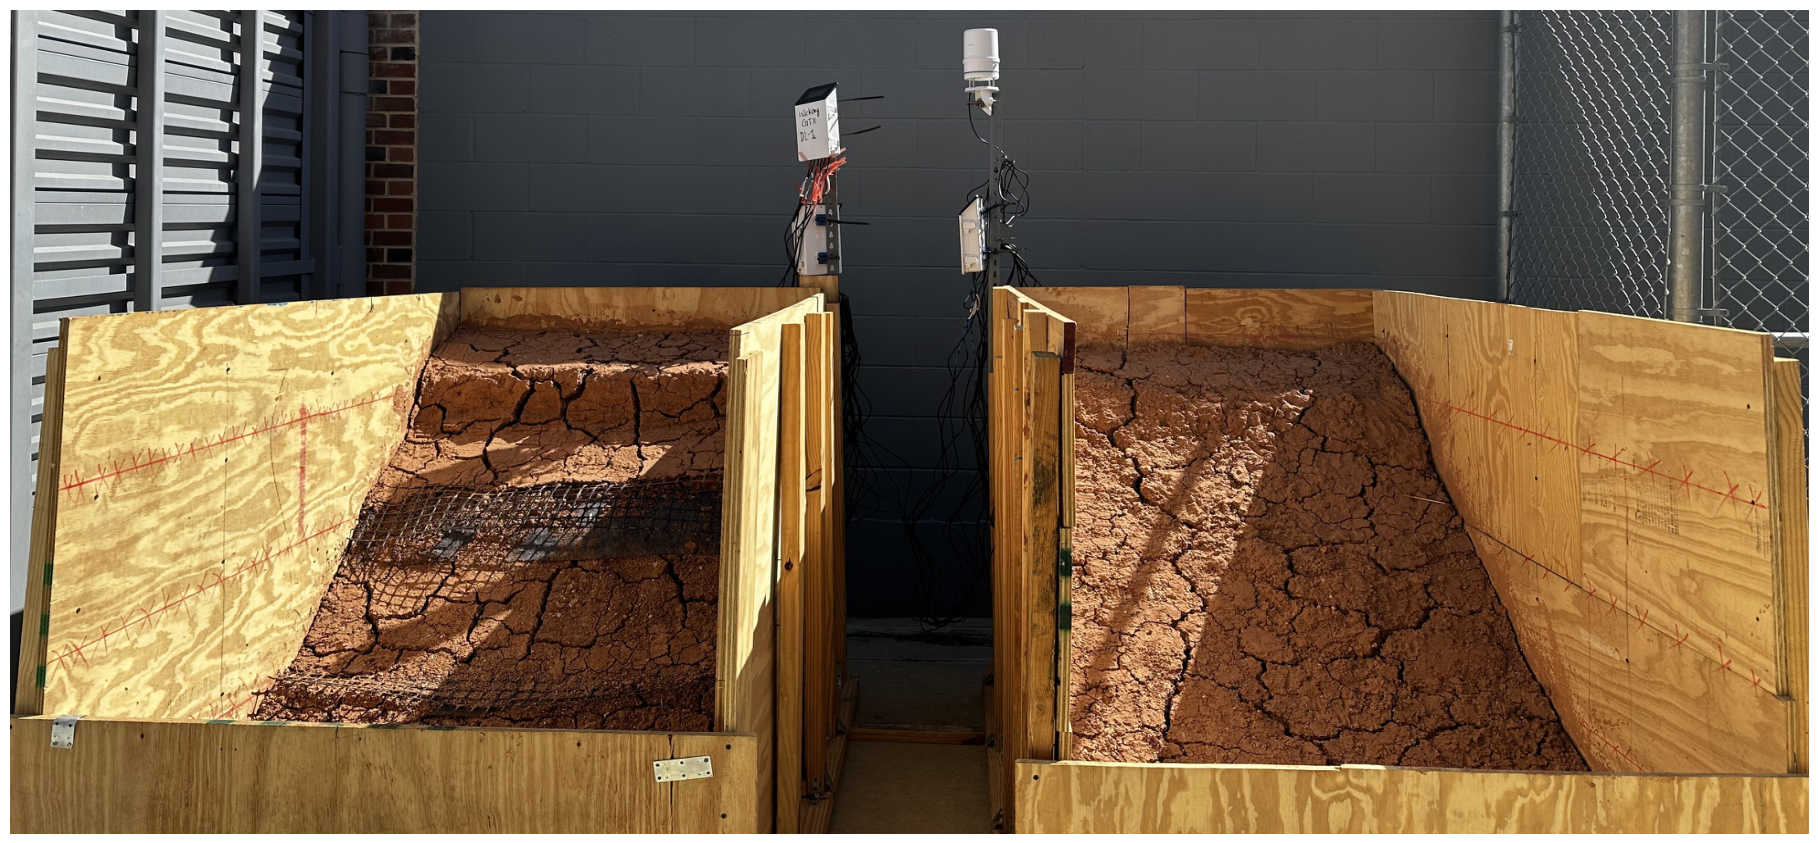
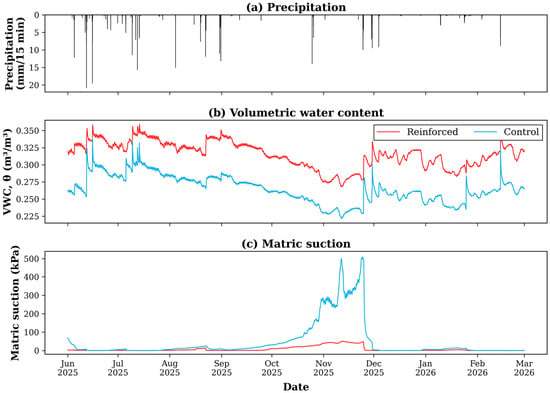
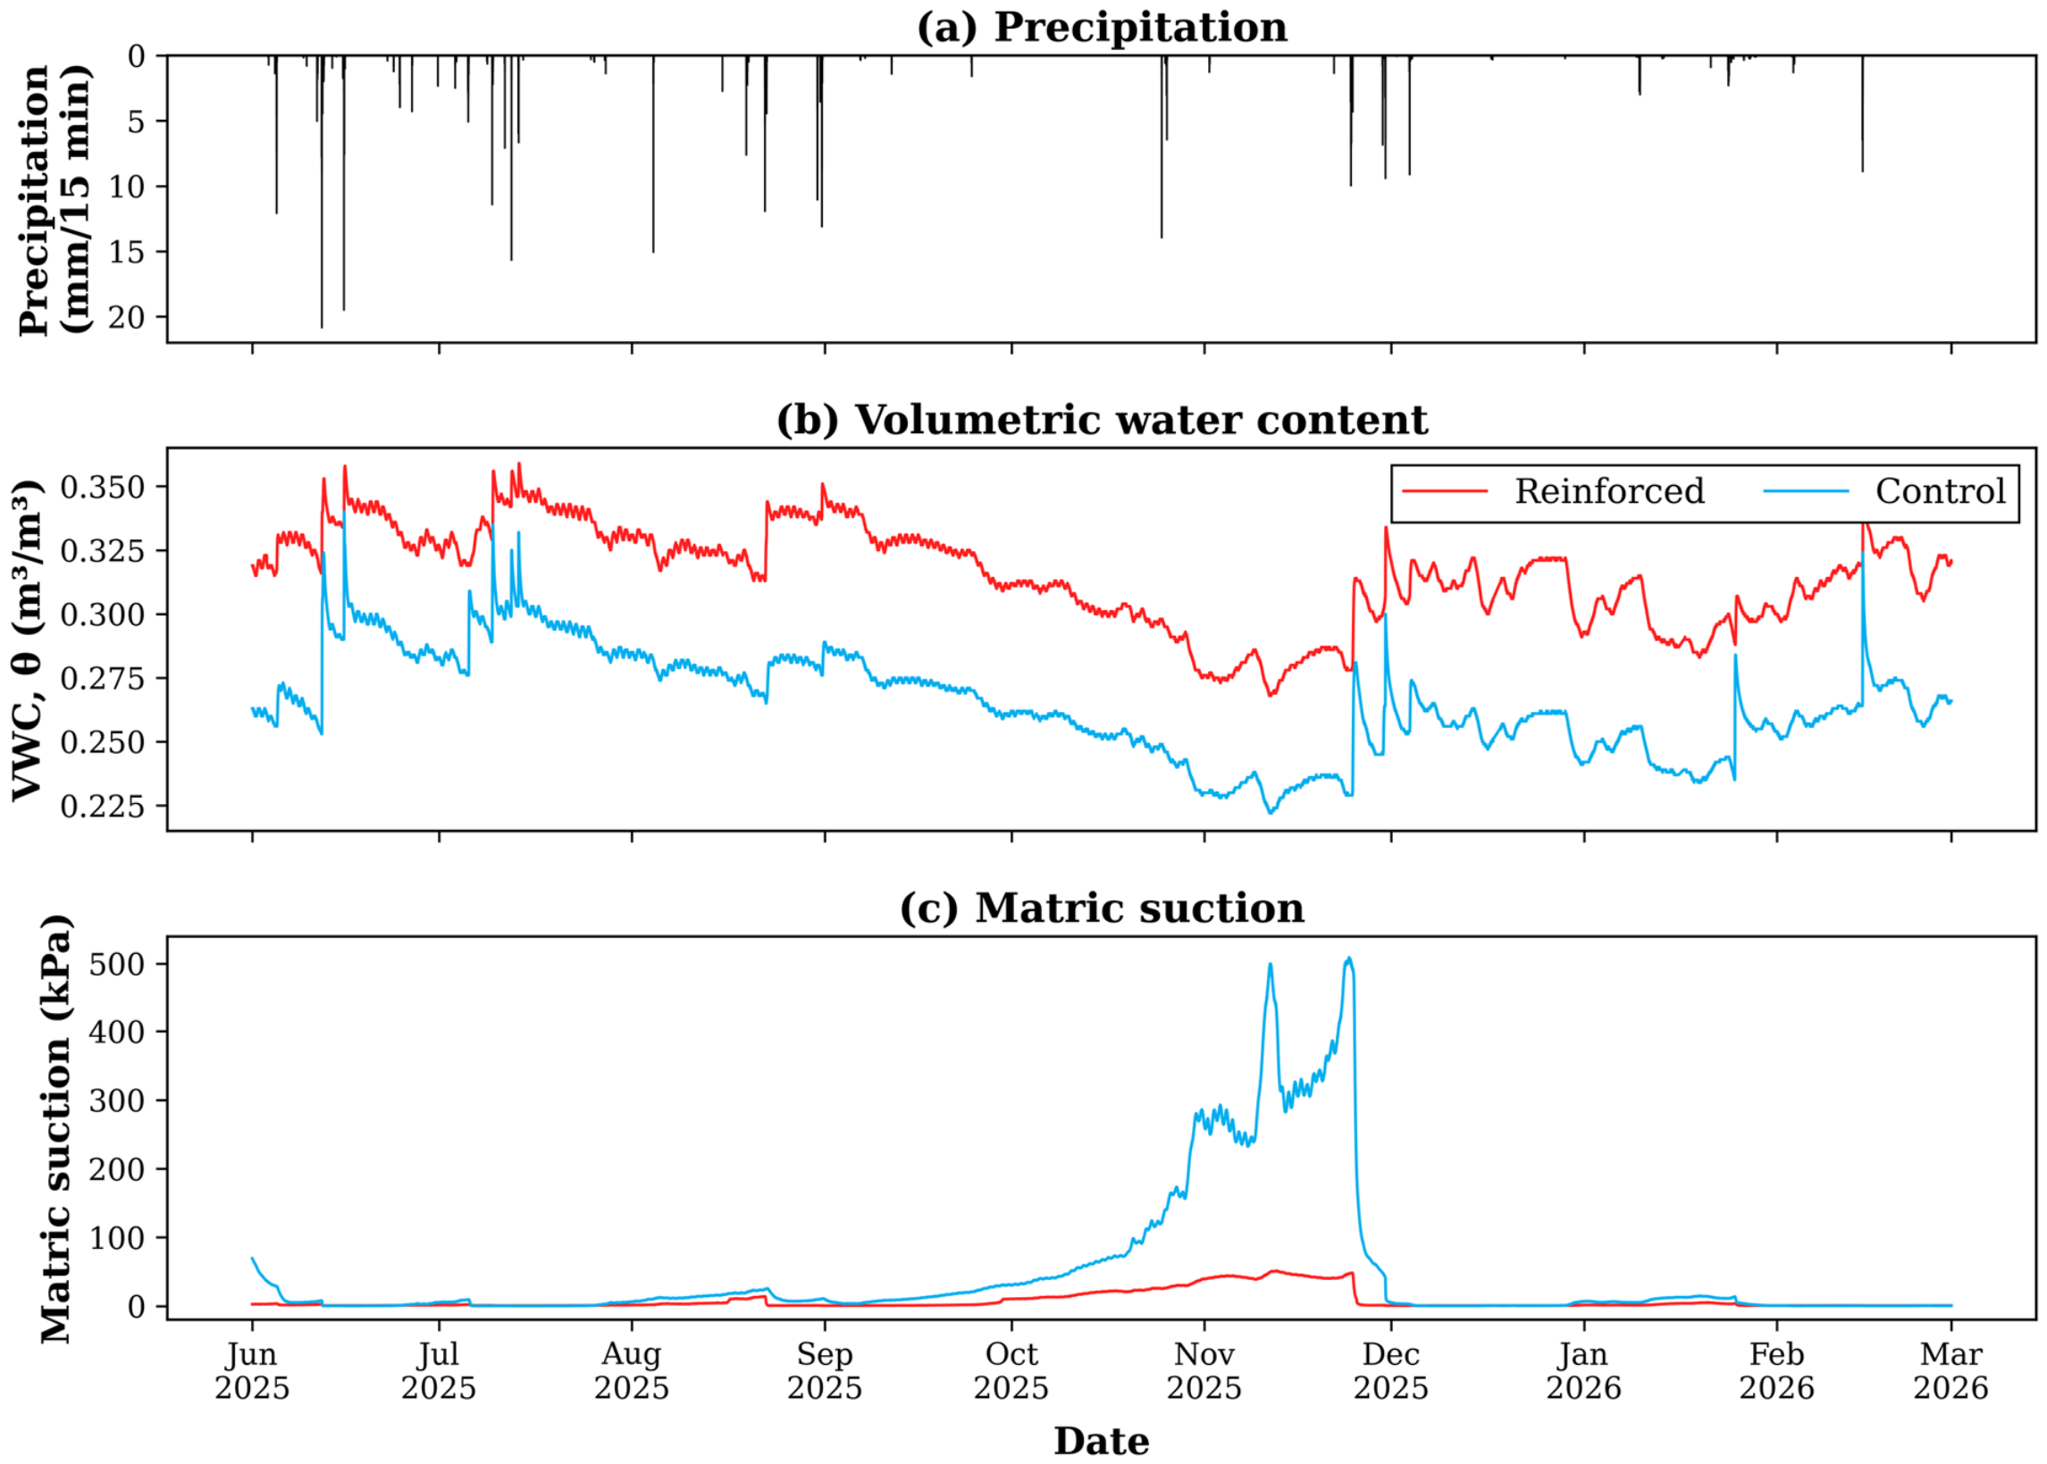
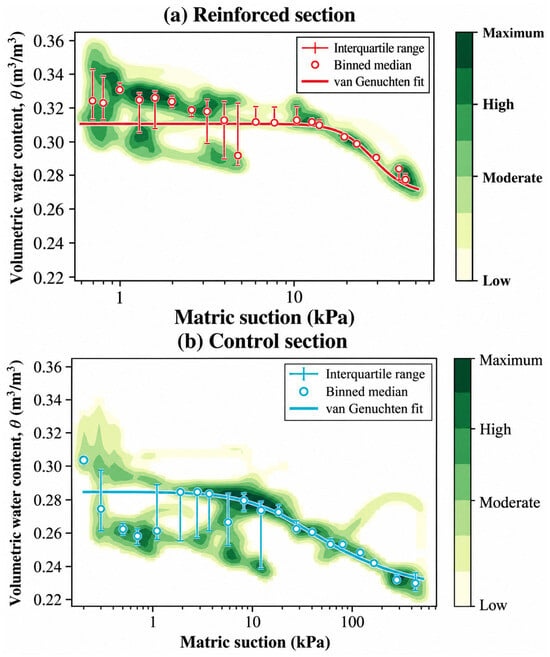
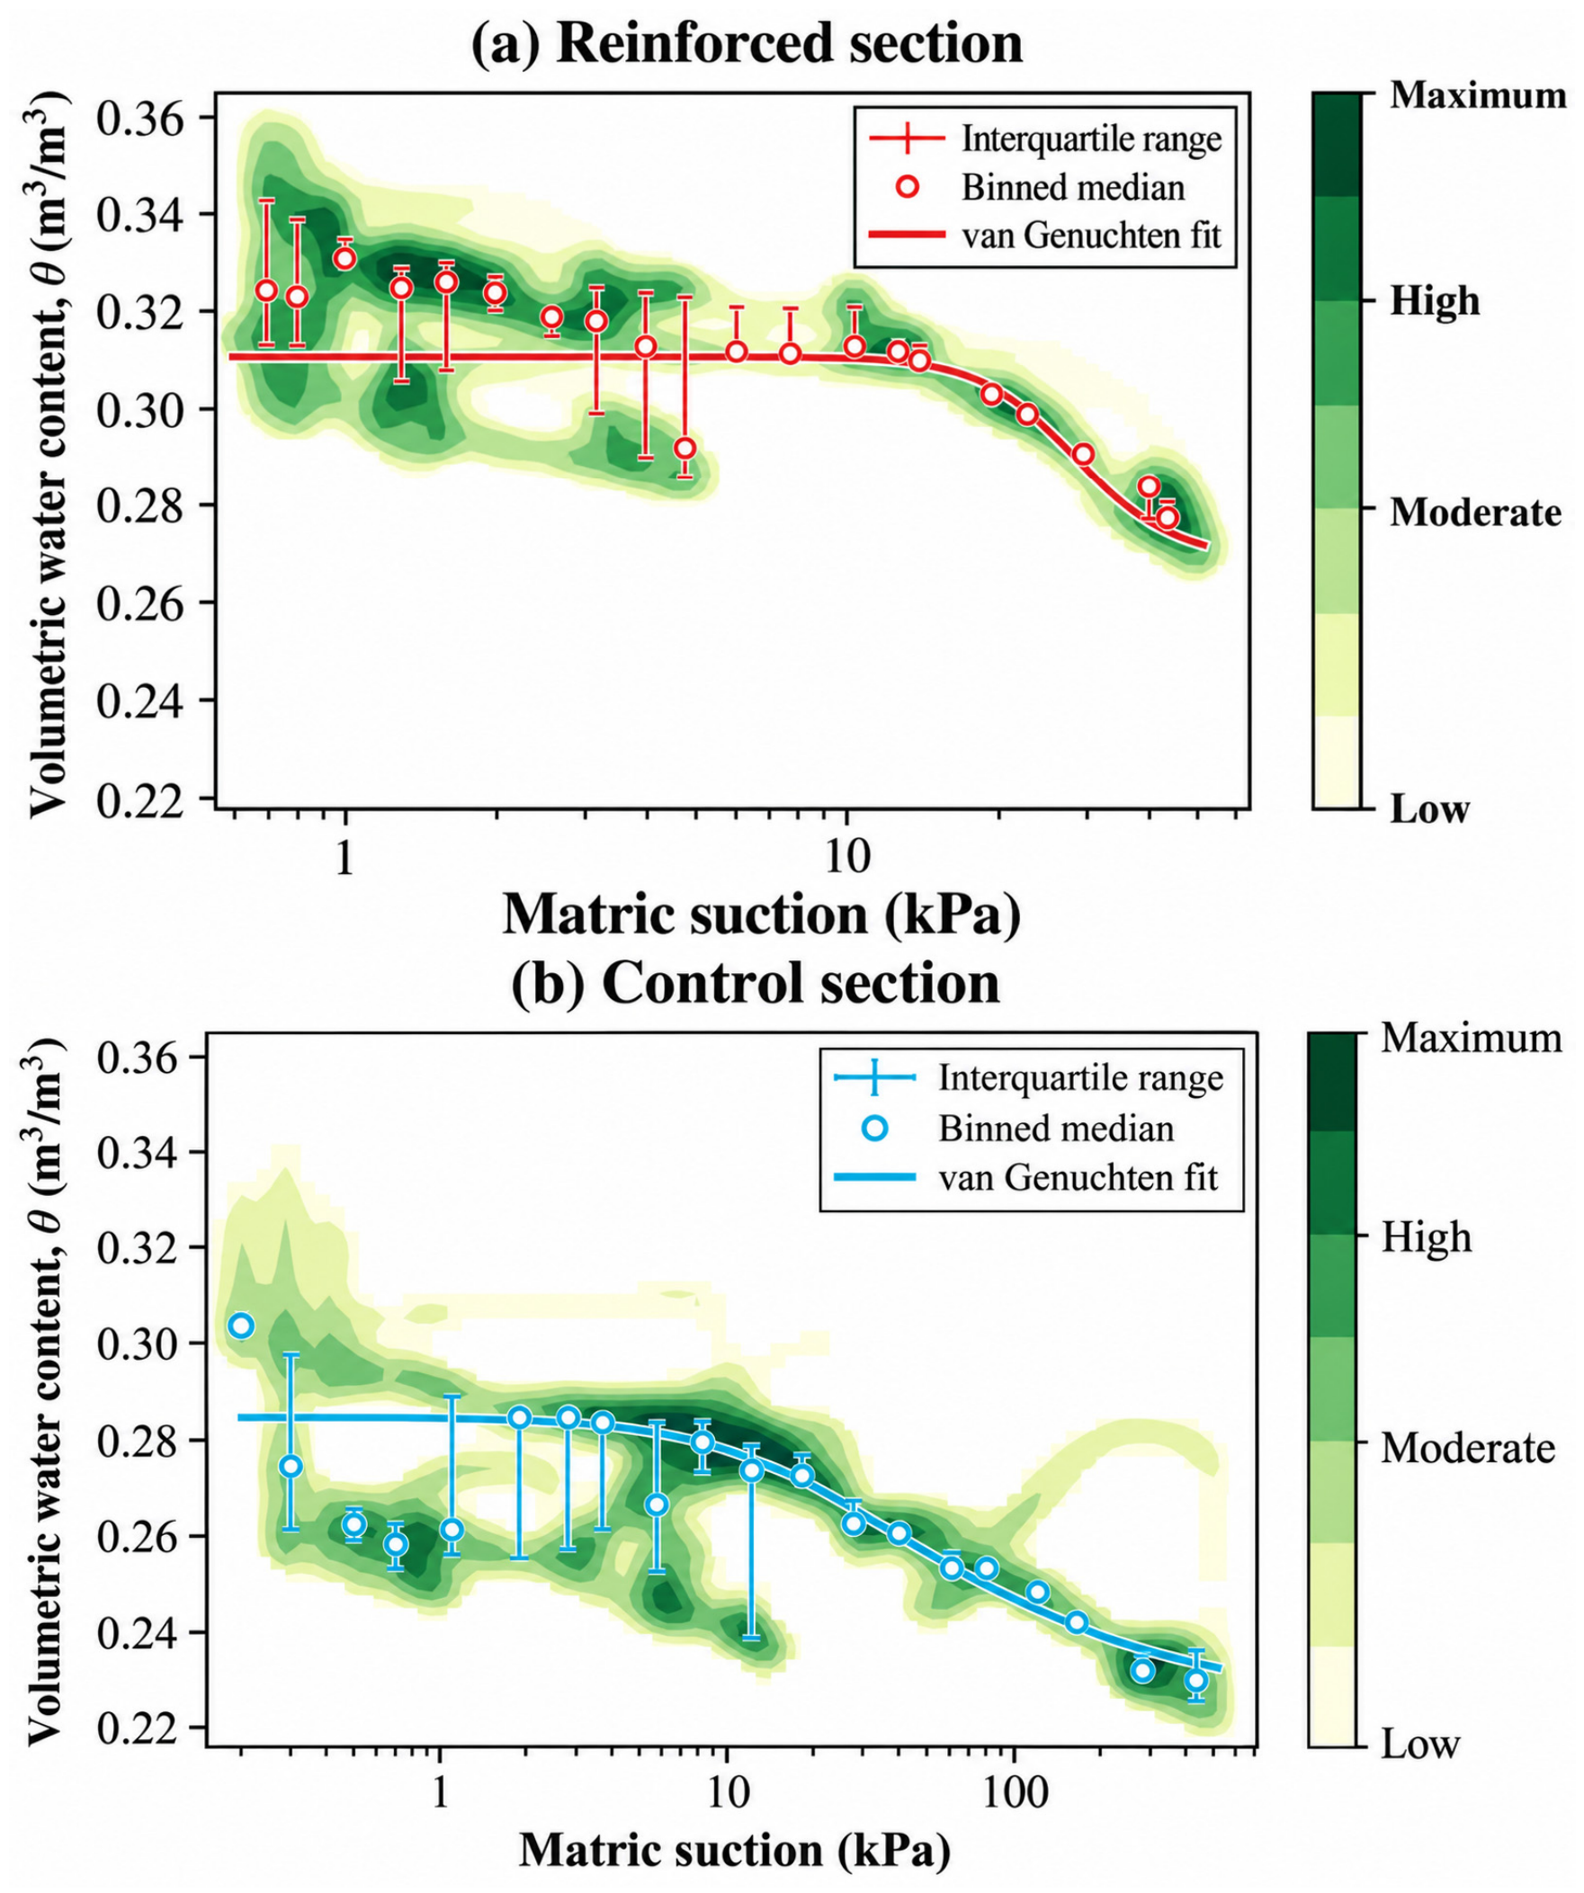
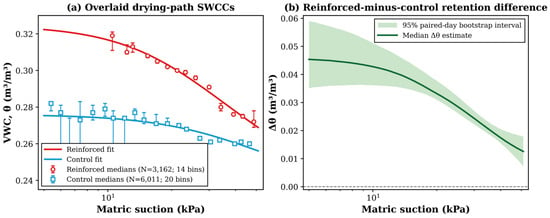
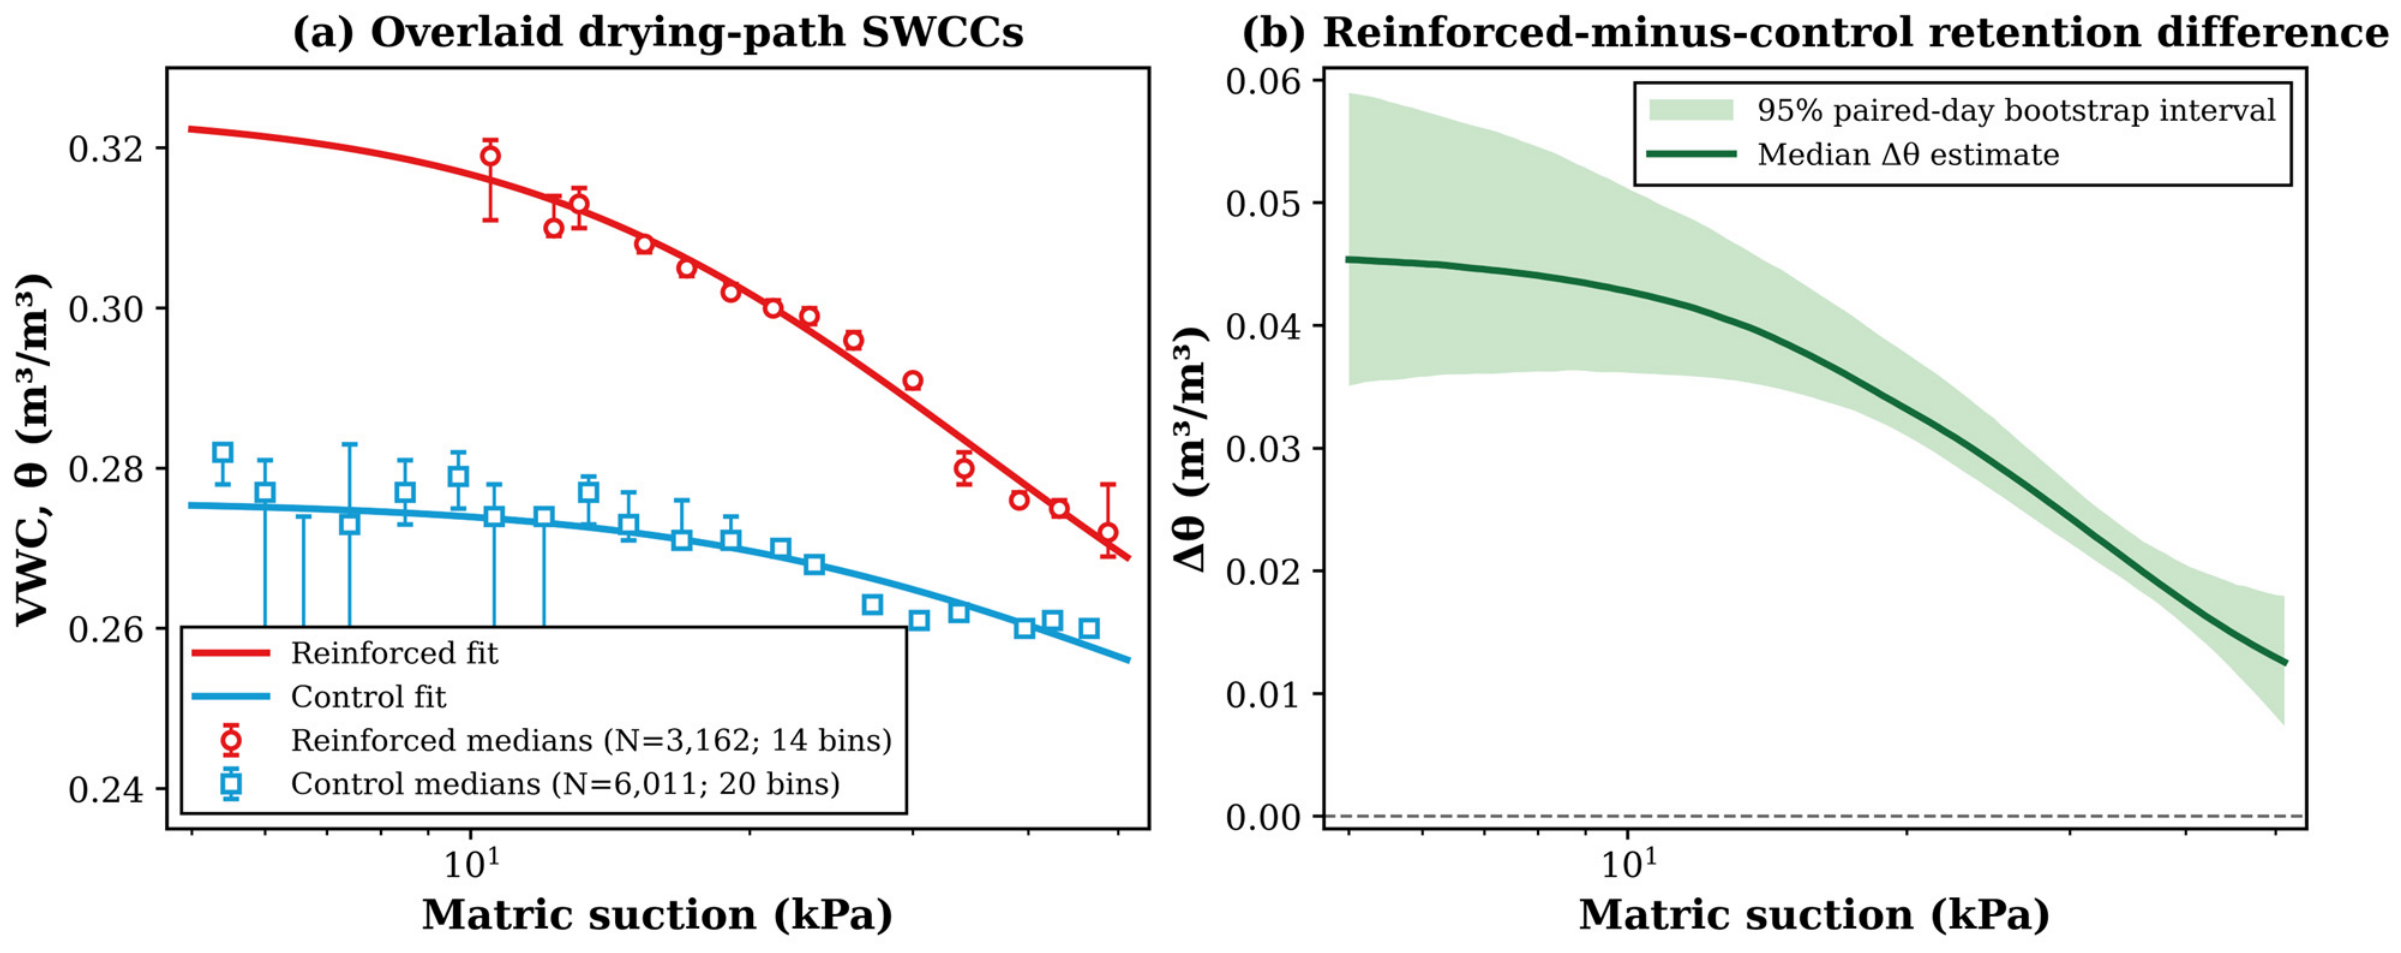
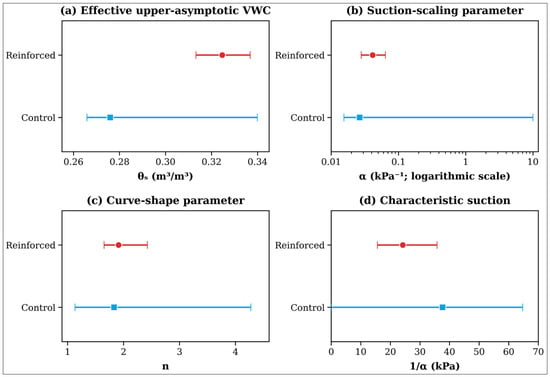
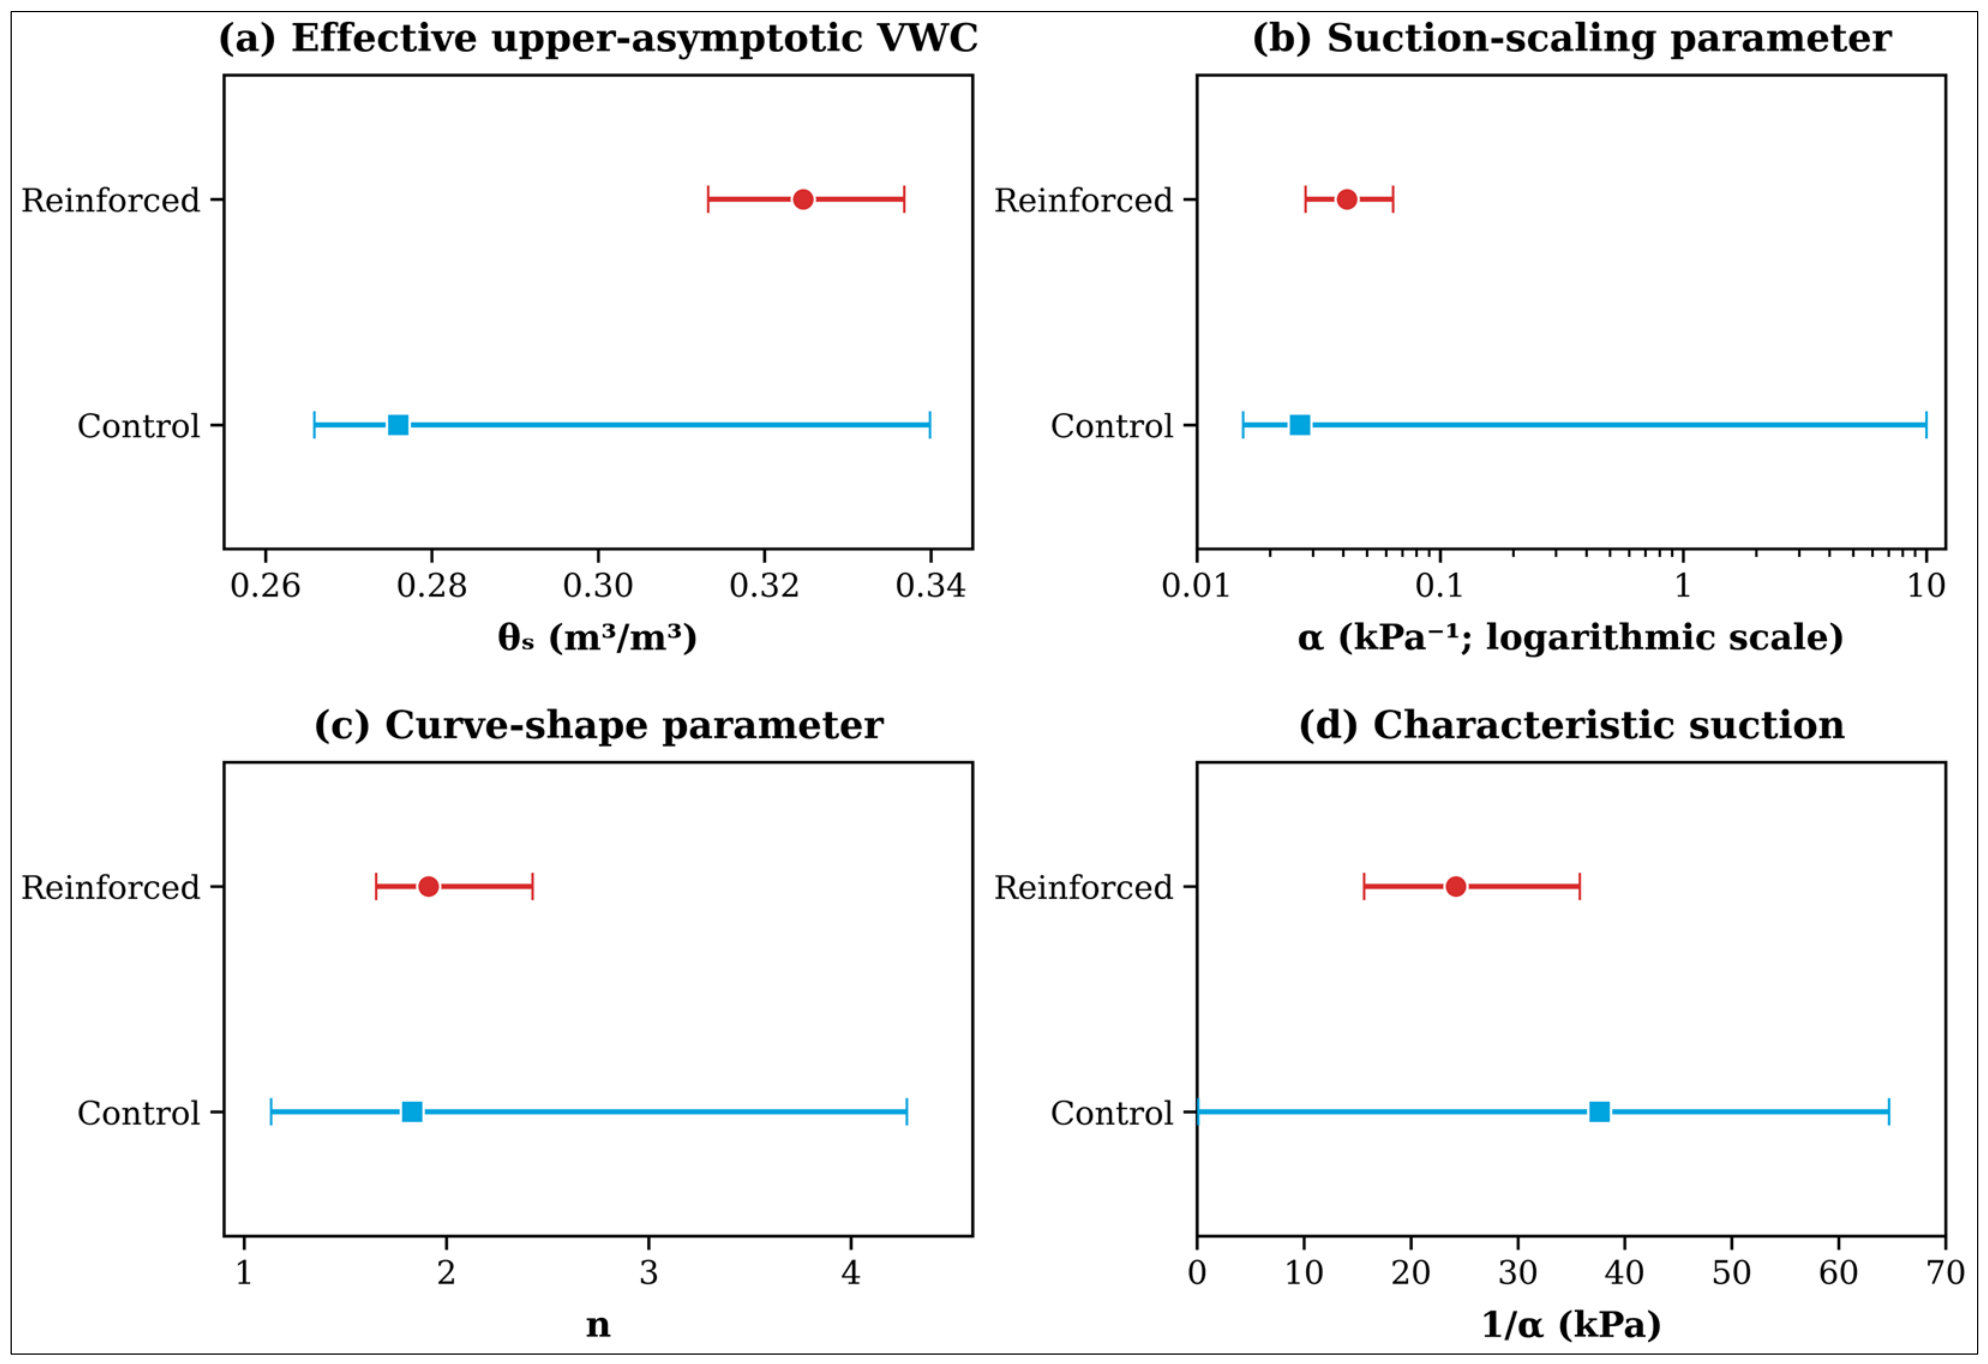
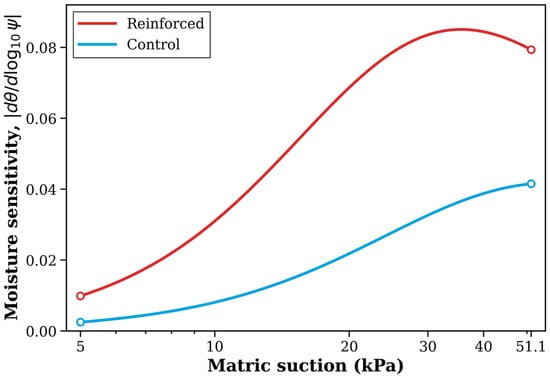
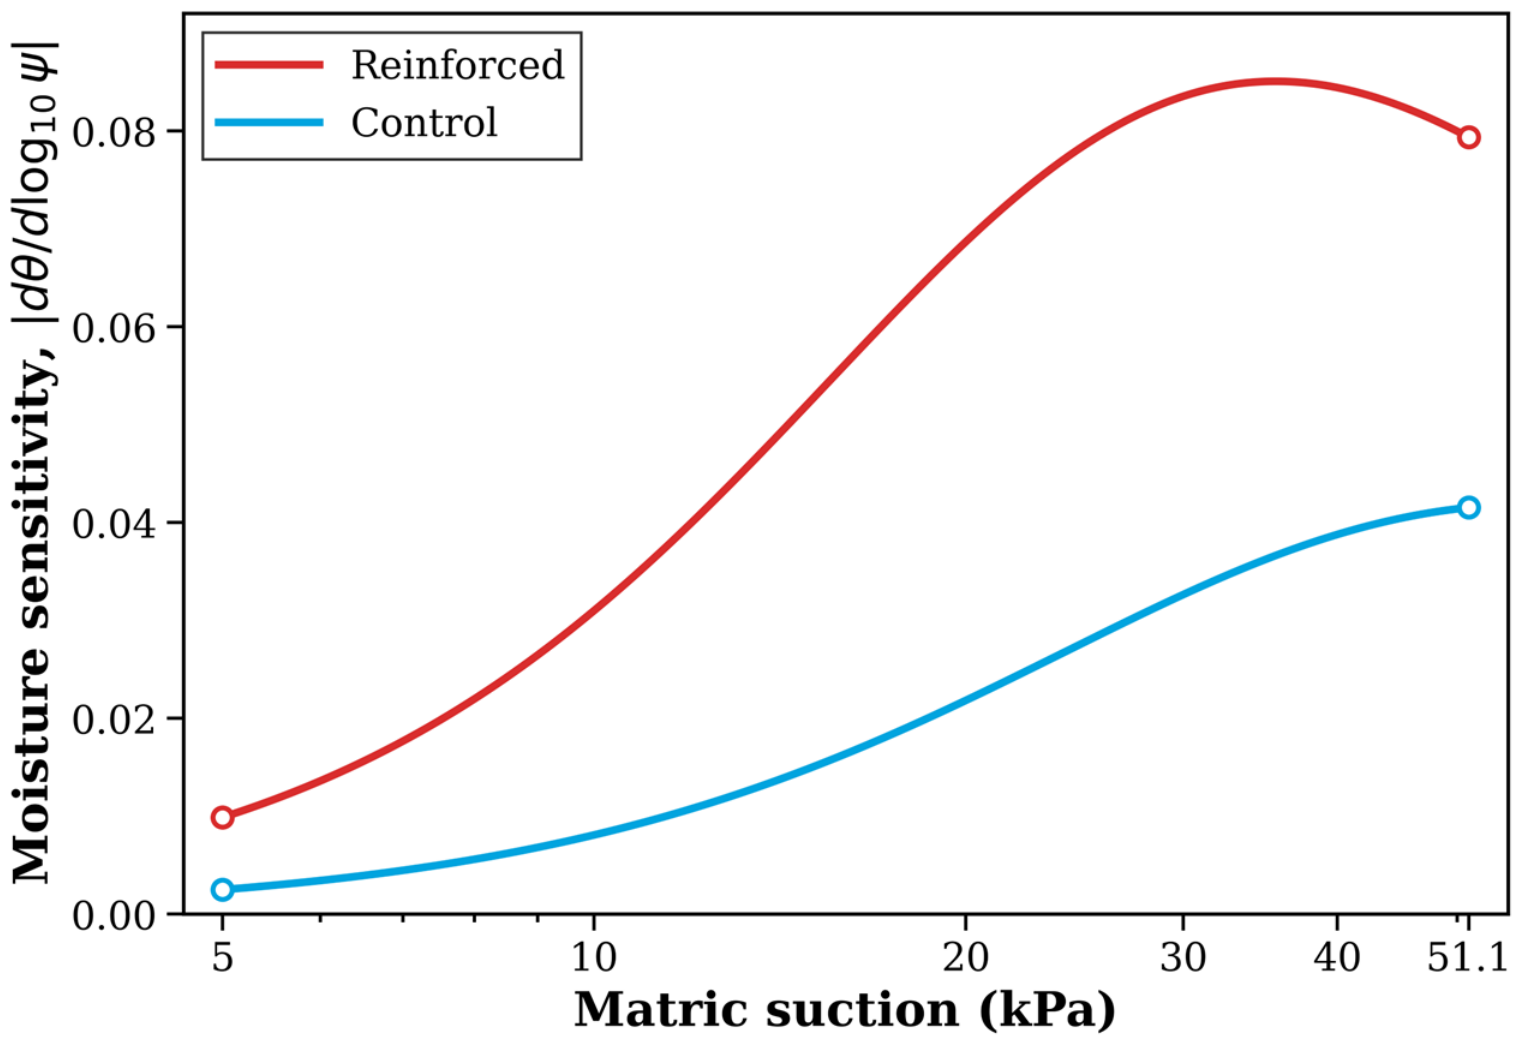
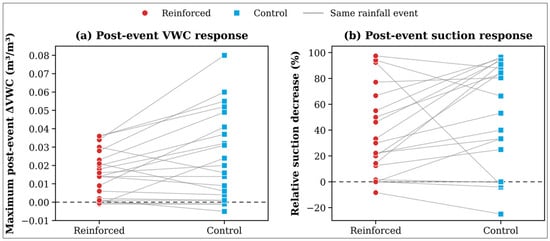
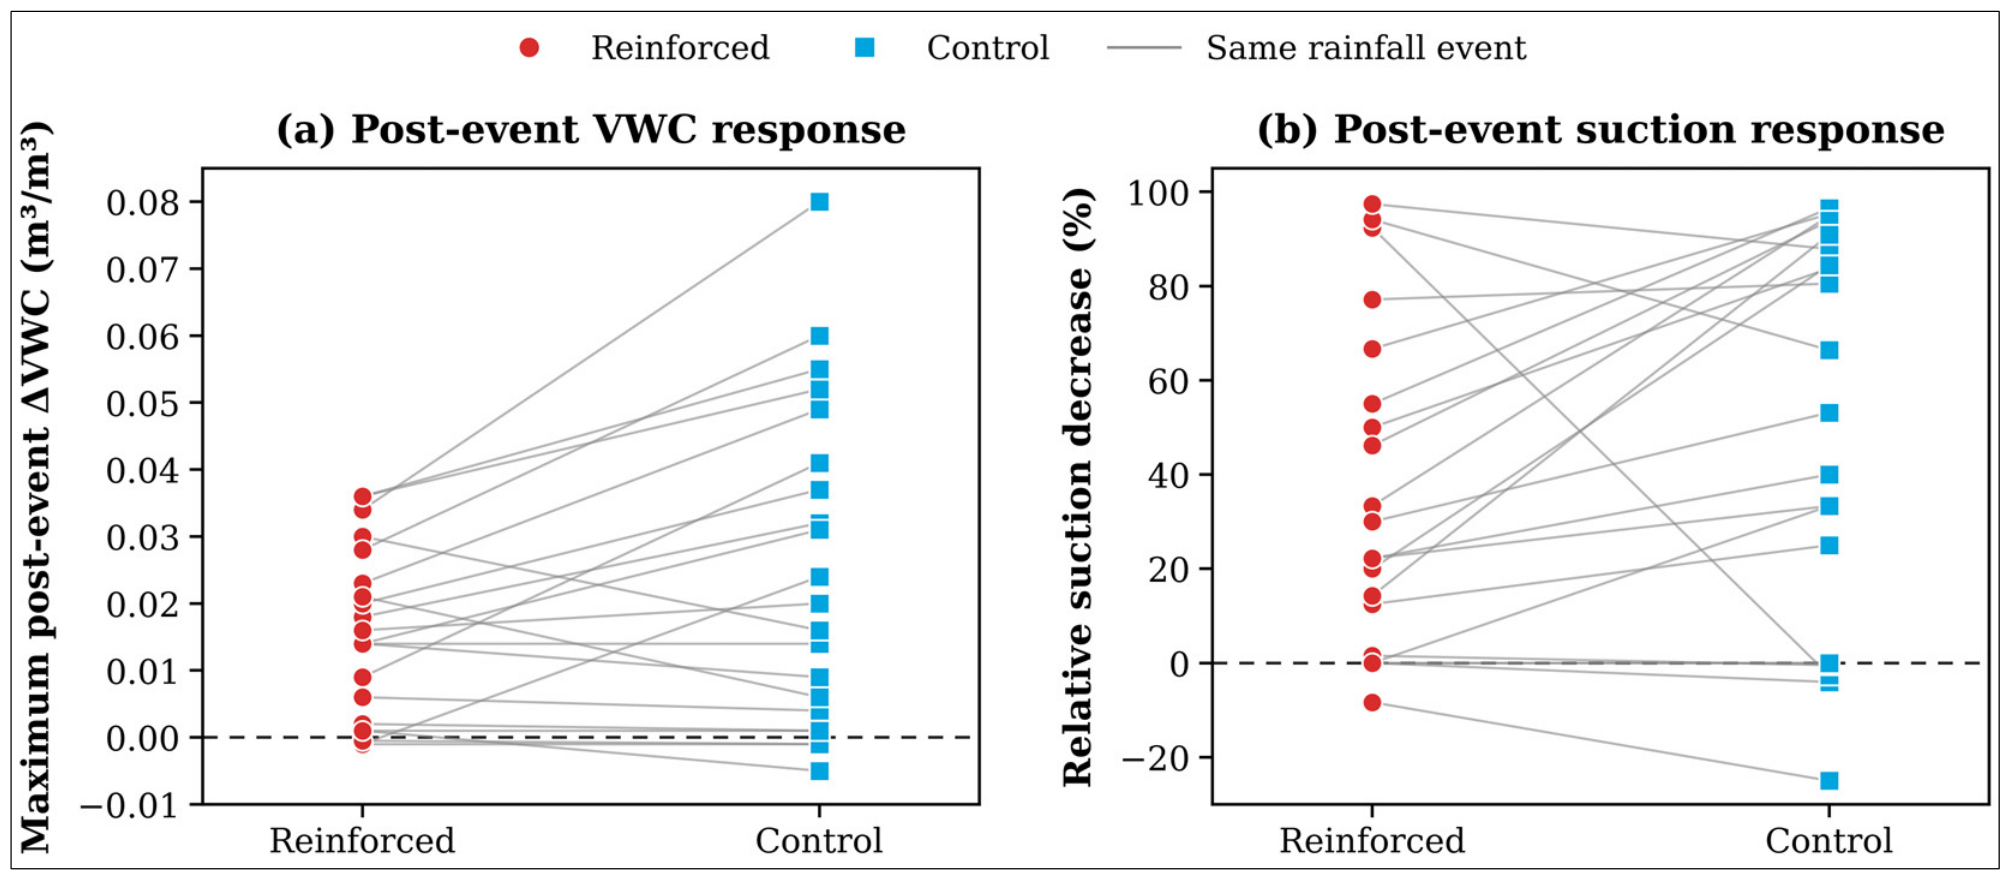

Disclaimer/Publisher’s Note: The statements, opinions and data contained in all publications are solely those of the individual author(s) and contributor(s) and not of MDPI and/or the editor(s). MDPI and/or the editor(s) disclaim responsibility for any injury to people or property resulting from any ideas, methods, instructions or products referred to in the content. |
© 2026 by the authors. Licensee MDPI, Basel, Switzerland. This article is an open access article distributed under the terms and conditions of the Creative Commons Attribution (CC BY) license.