


Abstract
Municipal solid waste (MSW) exhibits substantial variability in composition, density, degradation state, and mechanical properties, introducing uncertainty into landfill slope stability assessment. This study investigates the influence of waste heterogeneity and slope geometry on the probabilistic stability of MSW landfill slopes. Five slope configurations, from 1V:4H to 1V:1H, were evaluated using four finite element representations of MSW properties: a homogeneous model (C1) and heterogeneous models comprising 4, 13, and 40 waste layers (C2–C4). Analyses used PLAXIS 2D with the shear strength reduction method in an automated Python–PLAXIS framework, where C4 properties were resampled from a compiled literature database over 1000 Monte Carlo realizations per slope configuration. The steepest configuration (1V:1H) increased storage capacity by 54.3% and reduced required footprint by 31.2% relative to 1V:4H, highlighting the capacity-stability trade-off. As slope steepness increased, mean factor of safety decreased from 1.459 to 0.439, while simulated probability of failure increased from 15.4% to 98.1%, with the largest increase between 1V:3H and 1V:2H. The stochastic model produced mean factors of safety up to approximately 72% lower than the homogeneous representation; decomposition using an additional diagnostic configuration (C1b, homogeneous at the C4 database mean) indicates that this reduction is dominated by the spatial representation of heterogeneity (73–79% of the total difference across configurations), with the property database accounting for the remainder (21–27%). Results should be interpreted as comparative responses conditional on the adopted database and spatial representation.
1. Introduction
Global municipal solid waste (MSW) generation continues to increase with urbanization, industrialization, and changing consumption patterns, placing increasing pressure on waste management systems. According to the World Bank, global MSW generation is projected to increase from 2.01 billion tons in 2016 to 3.40 billion tons by 2050 [1]. This trend increases the demand for high-capacity landfilling solutions, particularly in regions where land availability is constrained by urban development, environmental regulations, and competing land uses [2,3,4]. Failures of waste slopes can have severe environmental, economic, and social consequences—as demonstrated by the 2005 Bandung dumpsite collapse, which resulted in over 140 fatalities [5] and by the large-scale 1.2 million m3 landfill slope failure documented and back-analyzed by Eid et al. and Stark et al. [6,7], with a broader review of documented MSW dump and landfill failures provided by [8]—underscoring the importance of reliable stability assessment in landfill design.
Increasing landfill height and slope inclination can improve storage efficiency and reduce the land footprint required for a given waste volume. However, steeper slopes generally reduce the available margin of stability, particularly under conditions of variable compaction, elevated pore pressures, and heterogeneous waste composition [9,10,11]. Unlike naturally deposited soils, MSW is composed of materials with highly different origins, compositions, ages, and degradation states; its unit weight and shear strength parameters may therefore vary substantially within a landfill due to differences in composition, placement history, compaction, moisture conditions, and degradation [12,13,14,15,16]. Adjacent portions of a landfill may exhibit markedly different mechanical properties even over short distances, a heterogeneity that is particularly important for steep slopes, where localized weak zones may influence the resulting failure mechanism.
Conventional deterministic slope stability analyses generally represent the waste mass using a single set of equivalent geotechnical properties or a prescribed set of depth-dependent properties. Although useful for preliminary design, such representations do not explicitly quantify the uncertainty associated with the highly variable mechanical properties of MSW. Monte Carlo simulation (MCS) coupled with finite element (FE) analysis provides a means of propagating this uncertainty into the predicted factor of safety (FoS) and probability of failure (Pf) by permitting direct sampling of uncertain material properties and estimation of the resulting distribution of stability responses [17,18]. The shear strength reduction (SSR) method further enables the factor of safety to be obtained without prescribing a failure surface, while naturally capturing stress redistribution and progressive failure [19,20].
The representation of spatial variability, however, remains a particular challenge for MSW. In conventional geotechnical reliability analyses, spatial variability is often represented using spatially correlated random fields or smooth depth-dependent property profiles, approaches well established for natural geomaterials, where geological deposition provides a basis for assuming some degree of spatial continuity. Their direct application to MSW requires greater caution because waste is placed sequentially and consists of mixtures of materials with different mechanical behavior, ages, densities, and degradation states; the resulting property distribution may contain abrupt local changes rather than a consistently smooth spatial trend. In the absence of sufficient site-specific spatial characterization data to establish a defensible correlation structure for MSW, an alternative representation is to assign randomly selected properties to discrete waste zones. This approach should be regarded as a modeling assumption representing local heterogeneity rather than a universal description of MSW spatial structure.
Previous landfill stability studies have considered heterogeneous MSW properties and probabilistic approaches [21,22,23,24], but the influence of how MSW material heterogeneity is spatially represented, particularly through different levels of material zoning, remains insufficiently quantified. In particular, there is a need to examine how stability predictions change when a homogeneous mean-property representation is compared with increasingly refined deterministic and stochastic representations of waste heterogeneity. This comparison is important because differences between homogeneous and stochastic predictions may arise not only from spatial heterogeneity but also from the broader uncertainty range represented by the stochastic model; explicitly recognizing these two effects is therefore necessary for a meaningful interpretation of probabilistic landfill stability predictions.
Accordingly, this study investigates the combined influence of landfill slope geometry and the representation of MSW geotechnical heterogeneity on probabilistic slope stability. Five slope configurations, ranging from 1V:4H to 1V:1H, are evaluated in terms of storage capacity, required land footprint, and stability. Four representations with progressively finer material discretization are considered: a homogeneous mean-property model (C1) and heterogeneous models comprising 4, 13, and 40 horizontal waste layers (C2–C4). An additional diagnostic configuration, C1b—homogeneous like C1 but evaluated at the mean of the C4 database—is subsequently introduced to decompose the difference between the homogeneous and stochastic representations into its constituent parameter-set and spatial-representation components. The representative properties used in C1 are those reported by [18] based on their literature compilation. In C4, unit weight, cohesion, and friction angle for each waste layer were randomly selected from a compiled database of literature-reported values. This approach does not impose a prescribed probability distribution, spatial correlation structure, or systematic depth-dependent trend. The resulting stochastic analyses are performed through an automated Python–PLAXIS 2D framework with 1000 Monte Carlo realizations per slope configuration (5000 total). The study therefore evaluates how the predicted stability response changes with alternative representations of MSW property heterogeneity and quantifies the trade-off between landfill capacity, required footprint, and probabilistic stability across the investigated slope configurations. The geometric capacity and footprint calculations are not presented as a standalone contribution but serve as the quantitative basis for the integrated stability–capacity framework developed in Section 3.2.5, which links these geometric efficiency gains directly to the probabilistic—rather than solely deterministic—instability risk associated with each slope configuration.
2. Methodology
The methodology comprises two complementary components: (i) a geometric analysis of landfill storage capacity and required land footprint for five slope configurations, and (ii) a finite element (FE) stability analysis using alternative representations of MSW material heterogeneity. The stability analyses were performed in PLAXIS 2D using the shear strength reduction (SSR) method. Four alternative representations of MSW material properties (C1–C4) were considered, ranging from a homogeneous mean-property representation to deterministic and stochastic layer-wise representations. A fifth, diagnostic configuration (C1b) is introduced in Section 2.9 to isolate the contribution of the property database from that of the spatial representation to the differences observed between C1 and C4. The stochastic analyses were automated through a Python–PLAXIS 2D interface (Python 3.7.8), enabling repeated assignment of MSW properties and execution of Monte Carlo simulations.
2.1. Landfill Geometry
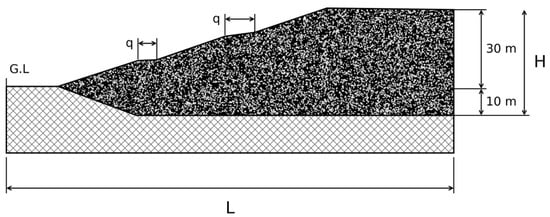
The landfill geometry adopted in this study is shown in Figure 1. A two-dimensional cross-sectional representation under plane-strain conditions was considered. The modeled MSW body had a total vertical thickness of 40 m, comprising 30 m of waste above the original ground surface and 10 m of waste below the original ground surface. The underlying foundation was modeled separately from the MSW body. Horizontal berms with a width of 6 m were introduced at vertical intervals of 10 m. These geometric characteristics were kept constant for all slope configurations so that the influence of slope inclination could be evaluated independently.
Figure 1.
Landfill cross-sectional geometry adopted in this study, showing the 40 m MSW body, underlying foundation, and 6 m berms at 10 m vertical intervals.
Five slope configurations were investigated: 1V:4H, 1V:3H, 1V:2H, 2V:3H, and 1V:1H. The selected range covers relatively gentle to very steep configurations and allows the trade-off between landfill capacity and slope stability to be examined. The 1V:1H configuration represents an intentionally steep upper-bound scenario used to evaluate the consequences of maximizing storage efficiency and is not proposed as a general design recommendation.
The adopted geometry provides a common reference configuration for all subsequent analyses. Therefore, differences in calculated capacity, required footprint, and stability response are primarily associated with changes in slope inclination and MSW material representation.
2.2. Landfill Capacity and Required Footprint
The storage capacity of each slope configuration was calculated geometrically by dividing the landfill body into successive sections bounded by the horizontal berms. The volume of each section was calculated from its corresponding cross-sectional dimensions, and the total landfill capacity was obtained by summing the volumes of the individual sections.
Two complementary geometric assessments were performed. First, the landfill base area was kept constant while the slope inclination was varied to quantify the corresponding change in storage capacity. This represents a land-constrained condition in which slope geometry is modified to increase the amount of waste accommodated within a fixed footprint. Second, the waste volume was kept constant and the required base area was calculated for each slope configuration, providing a direct measure of the land footprint required to accommodate the same disposal volume.
The geometric calculations were performed independently of the FE stability analyses. Foundation variability, local material heterogeneity, daily cover, and operational factors were not incorporated into the capacity calculations because the objective was to isolate the effect of slope inclination on storage efficiency and required land area. The geometric formulation and reference volume used for the footprint analysis are consistent across all slope configurations.
2.3. MSW Geotechnical Properties and Material Representations
The mechanical behavior of MSW was represented using three primary geotechnical parameters: unit weight (γ), cohesion (c), and friction angle (φ). These parameters can vary substantially within a landfill because of differences in waste composition, density, moisture condition, placement history, compaction, and degradation state. To investigate the influence of how this heterogeneity is represented, four material configurations, designated C1–C4 (Table 1), were developed, together with a fifth diagnostic configuration, C1b, described in Section 2.9.
Importantly, C1–C4 represent alternative spatial representations of MSW material properties. The purpose is to examine how predicted stability changes from a homogeneous mean-property representation to deterministic layered representations and finally to a layer-wise stochastic representation. Because the parameter values used in C1–C4 are derived from different literature sources and databases, the comparison does not isolate material discretization alone; rather, it evaluates the combined influence of material representation, property variability, and the parameter ranges associated with each representation.
The first configuration (C1) represents the conventional homogeneous approach in which the entire MSW body is assigned one representative set of geotechnical properties. The adopted values are: unit weight, γ = 11.13 kN/m3; cohesion, c = 18.24 kPa; and friction angle, φ = 32.27°. These values were reported by [21] based on their compilation and assessment of MSW geotechnical properties reported in the literature [25]. They are therefore used in the present study as literature-derived representative mean properties and do not correspond to measurements from a single landfill site. C1 provides the homogeneous reference representation against which the effects of alternative material representations are evaluated.
A diagnostic variant of C1, denoted C1b, was additionally evaluated. C1b retains the homogeneous, single-zone representation of C1 but adopts the mean of the compiled literature database used for C4 — γ = 10.52 kN/m3, c = 17.03 kPa, φ = 25.45°—in place of the point-estimate properties of [21]. C1b is introduced solely to decompose the difference between C1 and C4 into a parameter-set component and a spatial-representation component (Section 2.9) and is not intended as an additional deterministic representation for comparison with C2 and C3.
The second configuration (C2) represents a coarse deterministic material zoning in which the 40 m thick MSW body is divided into four horizontal zones, each 10 m thick. The geotechnical properties assigned to these zones follow the depth-dependent values reported by [26]. The four-zone representation is used as a literature-based deterministic model of vertical property variation and is not intended to reproduce individual waste placement or construction stages. Thus, the interfaces between zones represent changes in assigned material properties rather than physical construction boundaries. C2 represents material-property discretization rather than FE mesh refinement.
The third configuration (C3) represents a finer deterministic material discretization in which the 40 m thick MSW body is divided into thirteen horizontal material zones based on the layer-wise representation reported by [27], incorporating the reported variation in waste properties with depth, overburden stress, and degradation. C3 was introduced to provide a substantially finer material zoning than C2 and to investigate whether increasing the spatial detail used to represent MSW heterogeneity affects the calculated stability.
Finally, C4 represents the finest material zoning investigated in this study and divides the 40 m thick MSW body into 40 horizontal zones, each 1 m thick. Unlike C2 and C3, which use deterministic literature-derived profiles, the properties assigned to the C4 zones are randomly selected from the compiled MSW database for each Monte Carlo realization. The 1 m zone thickness was selected as a modeling resolution sufficiently fine to represent local layer-to-layer heterogeneity while remaining computationally tractable for repeated FE analyses. It is not interpreted as a measured characteristic scale of MSW heterogeneity or as a physically unique layer thickness. Consequently, C4 should be regarded as a stochastic material-zoning model rather than a validated representation of the actual spatial structure of a particular landfill.
Table 1.
Geotechnical properties assigned to the four waste characterization models (C1–C4) and the diagnostic configuration C1b.
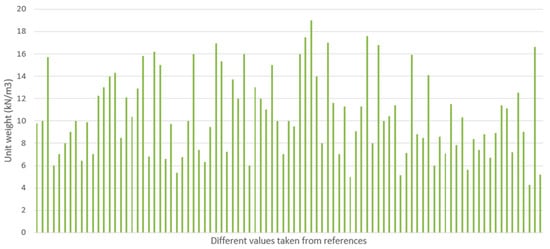
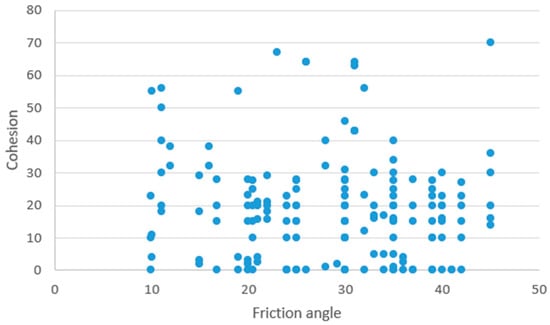
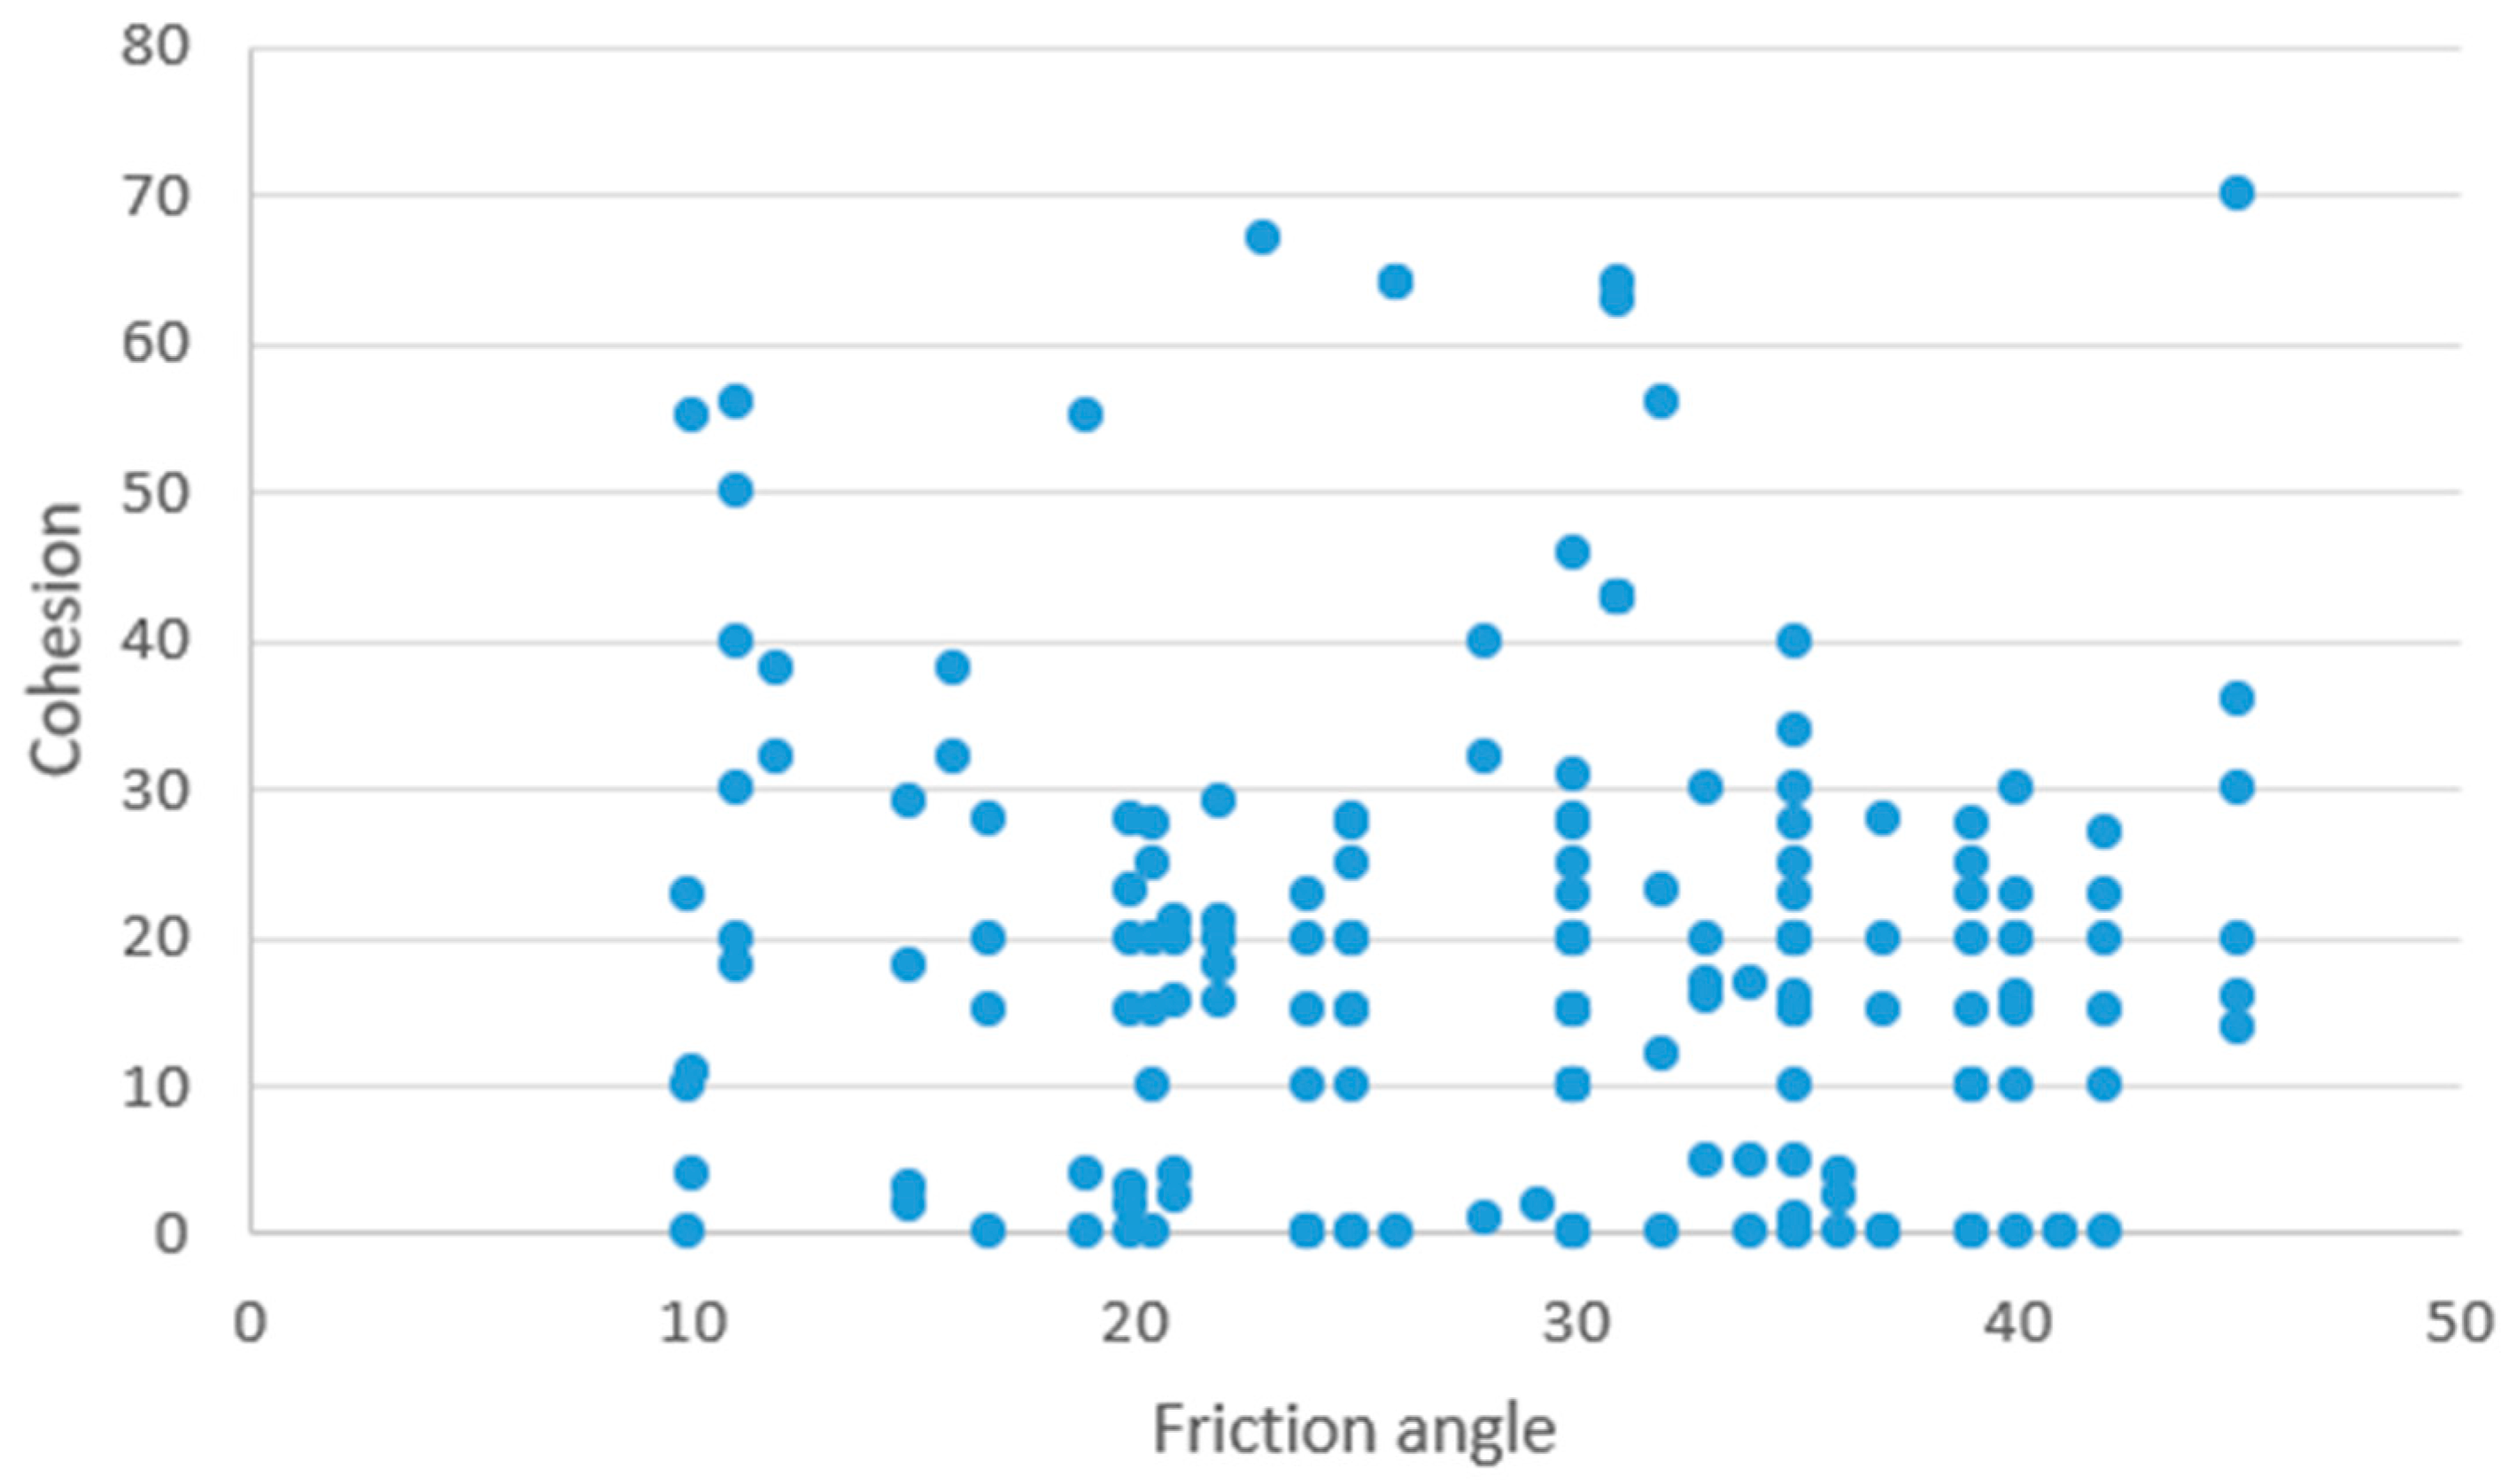
A database of published MSW geotechnical properties was compiled from the literature. The database contains reported values of unit weight, cohesion, and friction angle obtained under different waste compositions, densities, degradation conditions, and testing programs. The compiled data are summarized in Figure 2 and Figure 3. The compiled database contains 120 reported cohesion values, 120 friction angle values, and 110 unit weight values collected from the cited literature sources. The adopted ranges cover unit weights from 5.0 to 19.0 kN/m3, cohesion values from 0 to 67 kPa, and friction angles from 10° to 43°.
Figure 2.
Compiled distribution of MSW cohesion and friction angle values from the literature database (n = 120 paired values).
Figure 3.
Compiled distribution of MSW unit weight values from the literature database (n = 110 values).
The stochastic assignment procedure does not assume or fit a conventional parametric probability distribution to the compiled data. In particular, normal, lognormal, or uniform distributions are not imposed. Instead, the available reported observations are used directly as an empirical database. For each Monte Carlo realization, geotechnical properties were randomly selected from the compiled database and assigned to the individual waste layers, following the sampling procedure detailed in Section 2.4. No conventional parametric probability distribution was assumed or fitted to the compiled data. Consequently, the stochastic variability arises directly from the range of reported MSW properties contained in the database.
2.4. Spatial Representation of MSW Property Heterogeneity
The spatial representation adopted in C4 differs from conventional spatially correlated random field approaches commonly used in geotechnical reliability analyses. In natural geomaterials, spatial correlation is commonly used to represent the continuity of properties associated with geological deposition [18,28,29,30,31]. For MSW, direct adoption of such a correlation structure requires caution because waste consists of mixtures with different compositions, densities, ages, and degradation states, which may produce substantial local variations in mechanical properties.
Because the compiled literature database does not provide sufficient spatial information to establish a defensible correlation length for the modeled waste mass, no prescribed spatial correlation structure was imposed in C4. Instead, properties were randomly resampled from the compiled database and assigned to the individual 1 m thick waste layers. Thus, vertical variations within each realization result from the selected literature observations rather than from an assumed depth-dependent trend.
It should be noted that the horizontal continuity of properties within each layer represents an implicit assumption of infinite horizontal correlation length. Because each realization applies a single sampled property set across the full horizontal extent of a given layer, the failure surface cannot be locally deflected around isolated weak zones by lateral variation in properties, as it could under a laterally varying (2D) spatial representation. This is the most severity-maximizing assumption available within the layer-wise resampling framework and is expected to bias the resulting probability of failure toward higher values relative to a representation incorporating finite horizontal correlation. No sensitivity analysis on layer thickness or spatial correlation length was performed in the present study: the compiled literature database does not provide the paired spatial-location metadata required to define a defensible correlation length or an alternative block size on anything other than an arbitrary basis, and imposing an unconstrained parametric sweep was judged less defensible than transparently reporting the single, explicitly stated worst-case assumption adopted here. This limitation is addressed directly in Section 3.3 and identified as a priority direction for future work.
For each Monte Carlo realization, cohesion and friction angle were sampled jointly as a paired set of values corresponding to the same tested waste sample from the compiled database, thereby preserving the reported shear strength relationship between these two parameters. Unit weight was sampled independently from the compiled unit weight dataset, as paired unit weight–shear strength data were not consistently reported across all cited sources. This distinction reflects the structure of the available literature data rather than an assumed statistical independence between unit weight and shear strength parameters. Consequently, unit weight variability in C4 is treated as independent of the sampled shear-strength pair (c, φ), which may not fully capture any physical correlation between waste density and shear strength. This is considered an acceptable simplification given the absence of consistently paired unit weight–strength data in the compiled sources, and is noted as a limitation of the adopted stochastic representation.
2.5. Finite Element Model and Shear Strength Reduction Analysis
The stability analyses were performed using PLAXIS 2D under plane-strain conditions [32]. The Mohr–Coulomb constitutive model was adopted to represent the mechanical behavior of the MSW and underlying foundation material. The shear strength reduction (SSR) method was employed to calculate the factor of safety (FoS). The corresponding reduction factor at failure is taken as the FoS.
The 40 m MSW mass was modeled over an underlying foundation layer representing the original ground. The foundation material was kept identical for all slope configurations and material representations so that its influence remained constant throughout the comparative analyses.
The SSR method was selected because it does not require a predefined failure surface and allows stress redistribution and progressive development of the failure mechanism to be captured within the FE analysis [19,20,33].
A fine global FE mesh was adopted for the analyses using 15-node triangular elements. The FE mesh was used as the numerical discretization required to solve the mechanical problem and was not treated as an independent research variable. In particular, the C1–C4 configurations do not represent successive FE mesh refinements.
Consequently, the number of FEs may differ between C1–C4 because different numbers of material zones and interfaces are represented. The resulting numbers of 15-node triangular FEs per realization were 369 for C1, 390 for C2, 1099 for C3, and 8705 for C4. C1b, being homogeneous and single-zone like C1, used an identical mesh and element count to C1 (369 elements). These differences reflect the geometry and material-zone configuration of each model.
The objective of the C1–C4 comparison is therefore to investigate the influence of material-property discretization and heterogeneity representation, while the fine FE mesh provides the numerical framework for performing the stability calculations.
2.6. Monte Carlo Simulation Framework
The stochastic analyses were performed for C4 using 1000 Monte Carlo realizations for each of the five slope configurations, resulting in 5000 stochastic FE analyses in total.
In C4, the complete procedure for each realization was automated through Python coupled with the PLAXIS 2D Application Programming Interface (API). The workflow consisted of: (1) randomly selecting reported MSW geotechnical observations from the compiled literature database; (2) assigning the selected properties to the 40 horizontal waste material zones; (3) generating the corresponding material configuration in PLAXIS 2D; (4) generating the FE model using the adopted fine-mesh strategy; (5) performing the SSR analysis; (6) extracting the calculated factor of safety; and (7) storing the resulting FoS for subsequent statistical analysis.
The automated Python–PLAXIS framework ensured that the same computational procedure was applied to all realizations and slope configurations.
2.7. Probabilistic Stability Indicators
The distribution of FoS obtained from the 1000 Monte Carlo realizations was used to quantify the probabilistic stability of each slope configuration.
The probability of failure, Pf, was defined as the proportion of realizations for which the calculated factor of safety was below unity:
where N(FoS < 1.0) is the number of realizations with FoS < 1, and N is the total number of Monte Carlo realizations.
Pf = N(FoS < 1.0)/N
The reliability index, β, was calculated from the probability of failure as:
where Φ−1 denotes the inverse standard normal cumulative distribution function, consistent with standard geotechnical reliability practice [34].
β = −Φ−1(Pf)
For each slope configuration, the mean FoS, standard deviation, coefficient of variation, probability of failure, and reliability index were calculated from the resulting Monte Carlo sample.
2.8. Monte Carlo Convergence and Computational Reproducibility
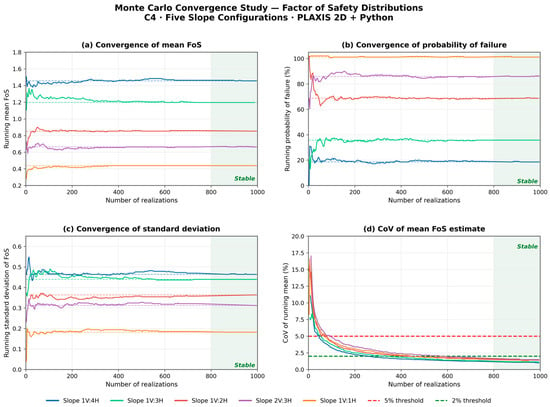
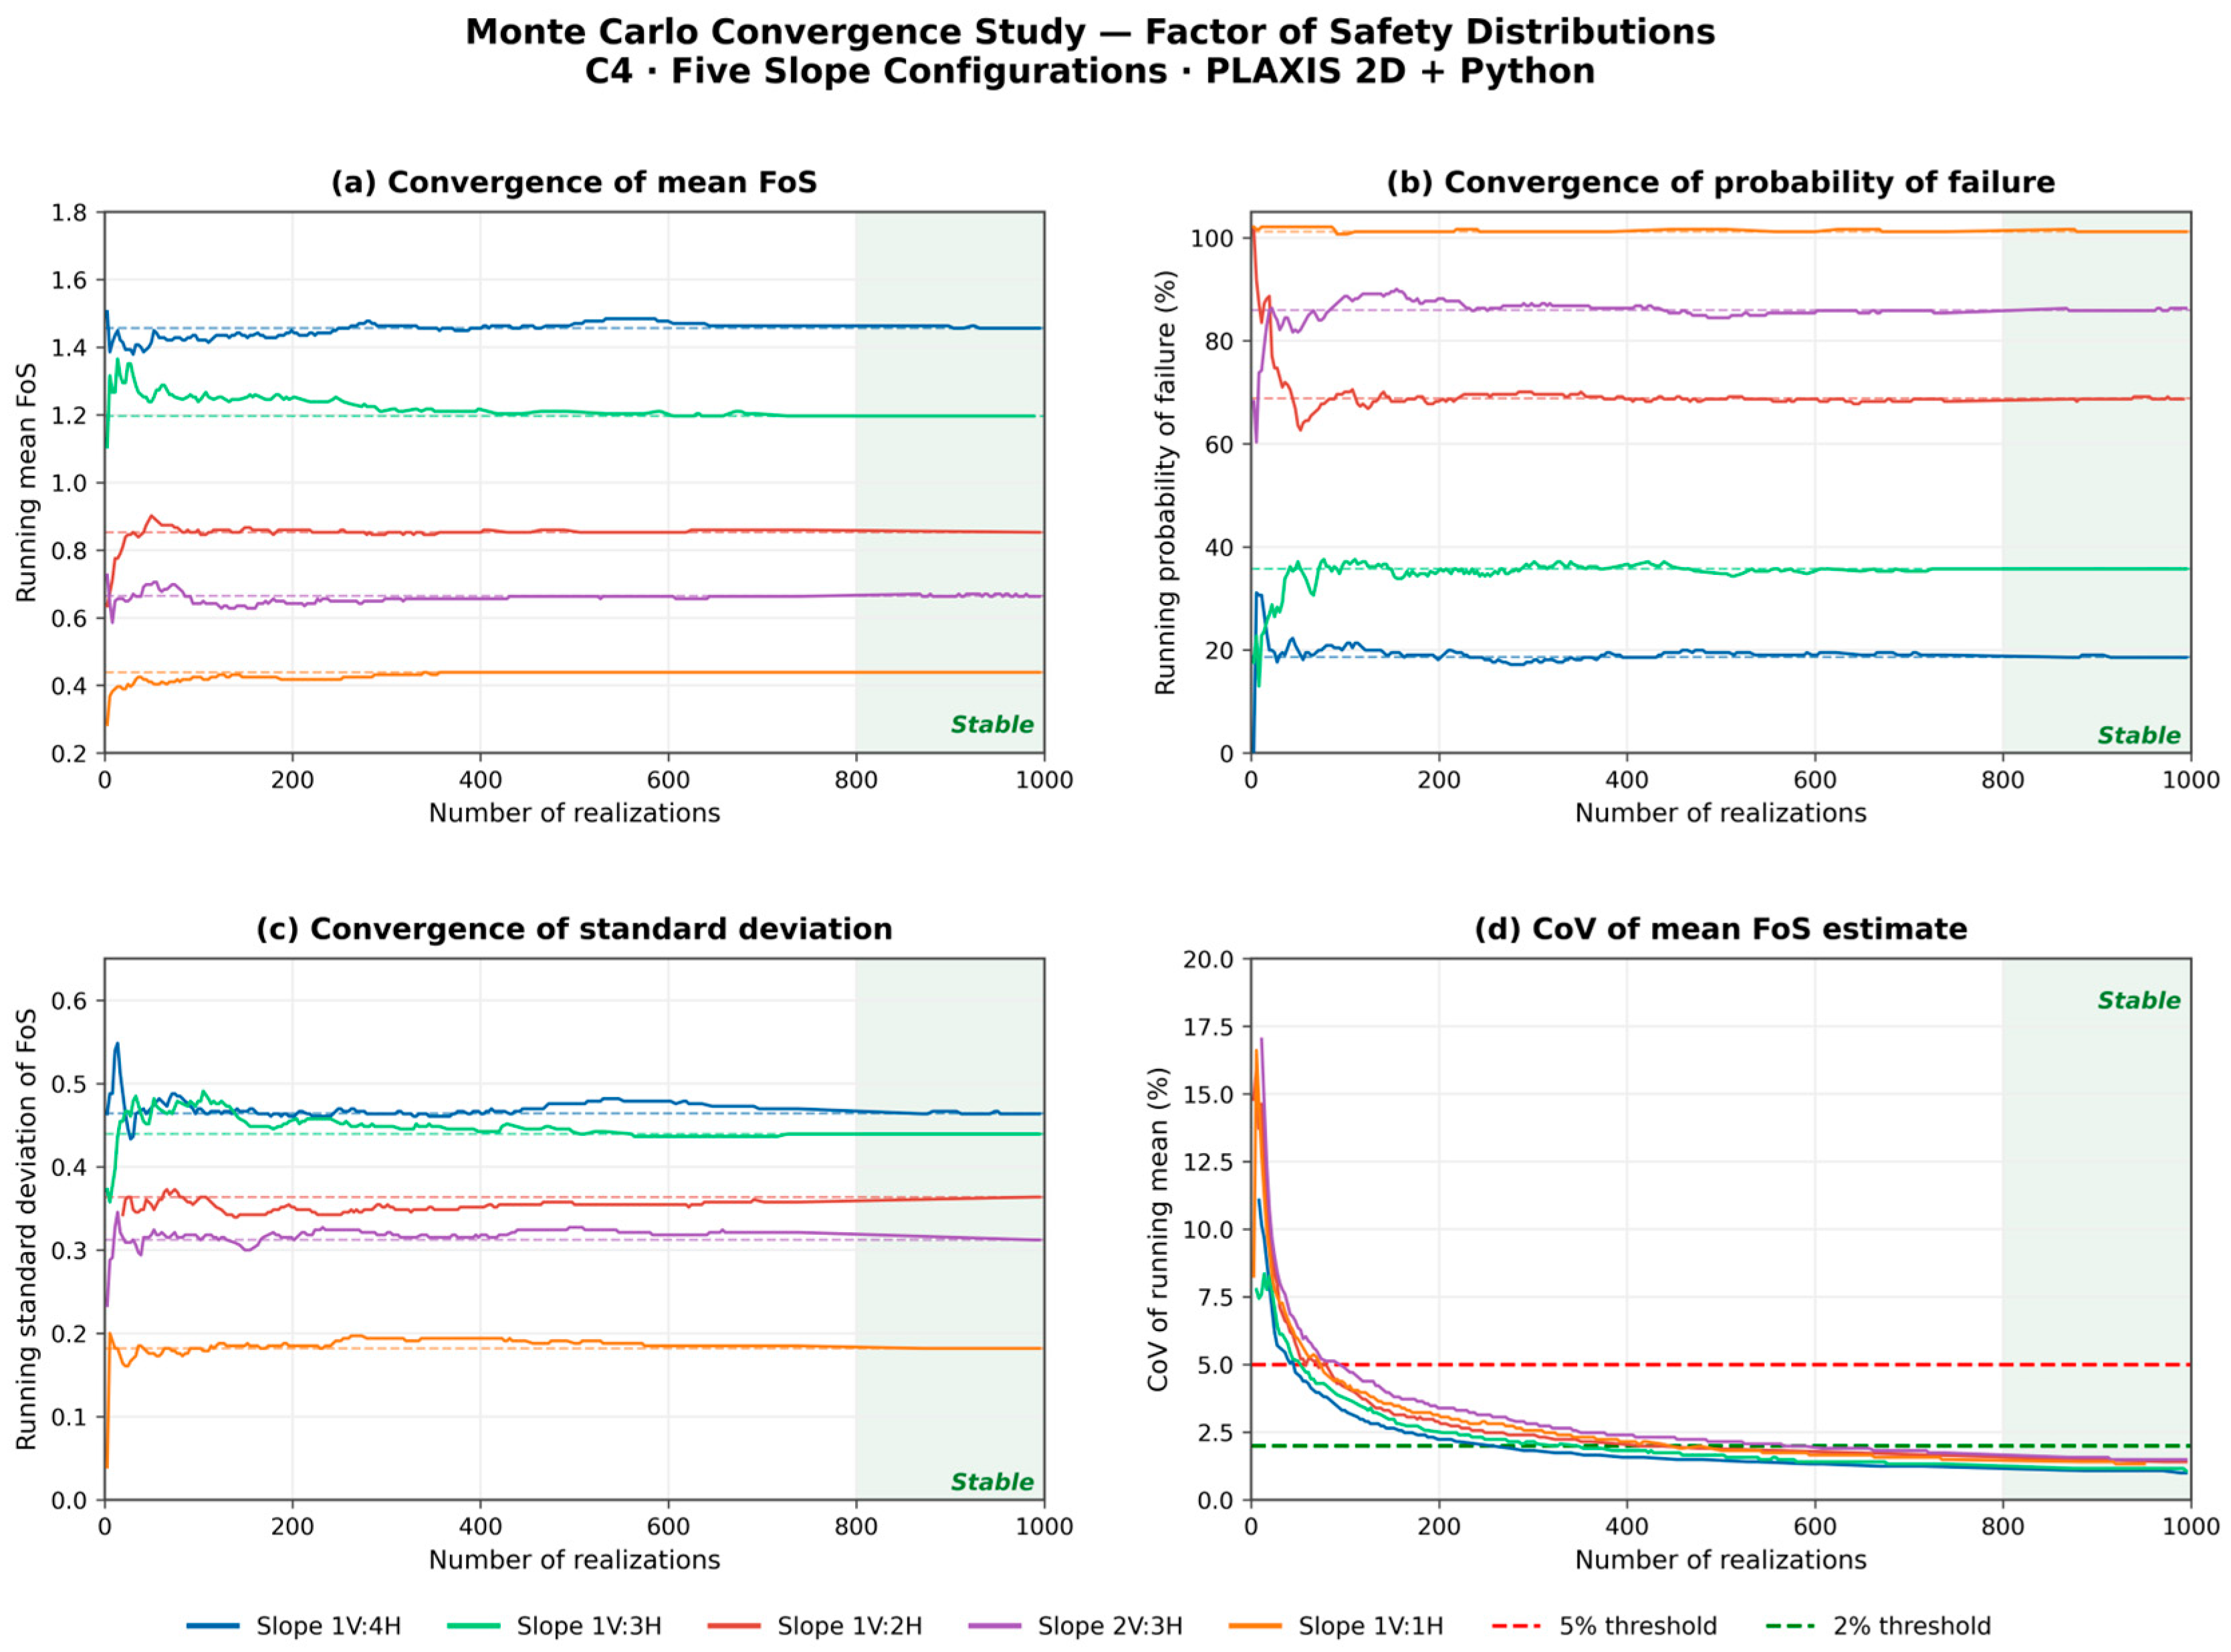
The adequacy of the adopted 1000 Monte Carlo realizations was evaluated using a convergence analysis. The running mean factor of safety (FoS), probability of failure (Pf), standard deviation of FoS, and coefficient of variation (CoV) of the running mean estimate were monitored as the number of realizations increased. The convergence behavior of these indicators is presented in Figure 4. The final sample size of 1000 realizations per slope configuration was selected after monitoring the stabilization of the running mean FoS, running probability of failure, running standard deviation, and coefficient of variation. The convergence assessment was considered separately for each slope configuration because the number of failure realizations varies with slope inclination. The same sample size of 1000 realizations was retained for all configurations to provide a consistent statistical basis for comparison.
Figure 4.
Monte Carlo convergence assessment for C4 based on 1000 realizations per slope configuration: (a) running mean FoS; (b) running probability of failure; (c) running standard deviation of FoS; (d) coefficient of variation in the running mean estimate. The plots illustrate the stabilization of the monitored statistical indicators with increasing numbers of realizations.
The complete computational workflow—including parameter selection, material assignment to the 40 MSW layers, PLAXIS 2D model generation, FE analysis, and FoS extraction—was implemented through the Python–PLAXIS 2D API. For each realization, the selected literature-derived MSW properties were assigned to the corresponding material layers before the SSR analysis was performed. This automation ensured that the same computational procedure was applied consistently across all five slope configurations.
The automated framework provided a reproducible procedure for evaluating the influence of MSW heterogeneity and slope geometry on the resulting probabilistic stability indicators.
2.9. Decomposition of the Parameter-Set and Spatial-Representation Effects (C1b)
To decompose the influence of the property database from that of the spatial representation on the differences observed between C1 and C4, an additional diagnostic configuration, C1b, was introduced. C1b applies the same homogeneous, single-zone representation used in C1, but adopts the mean of the compiled literature database used for C4 (Section 2.3)—i.e., the mean unit weight and the mean of the jointly sampled cohesion–friction angle pairs—rather than the point-estimate properties reported by [21]. Because C1b is homogeneous, it was evaluated deterministically, with one SSR analysis performed per slope configuration, using the same mesh strategy, convergence settings, and foundation properties as C1.
An analogous diagnostic case was not constructed for C2 or C3, as both configurations represent specific, literature-reported depth-dependent property profiles rather than a single point-value amenable to substitution by a common database mean without altering the depth-dependency the two models are specifically intended to represent.
3. Results and Discussion
3.1. Geometric Optimization of Landfill Capacity and Footprint
This section establishes the geometric capacity and footprint implications of each slope configuration, which are subsequently combined with the probabilistic stability results in Section 3.2.5 to form the integrated stability–capacity design framework; the geometric analysis itself is not intended as a novel contribution but as the necessary quantitative input to that framework.
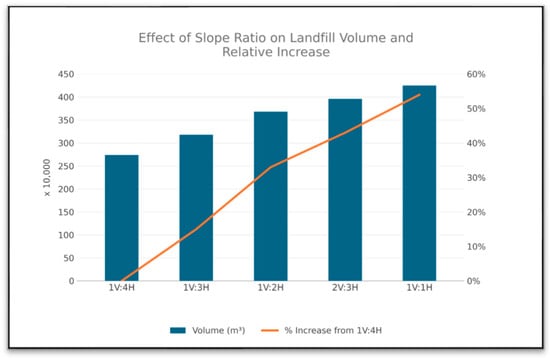
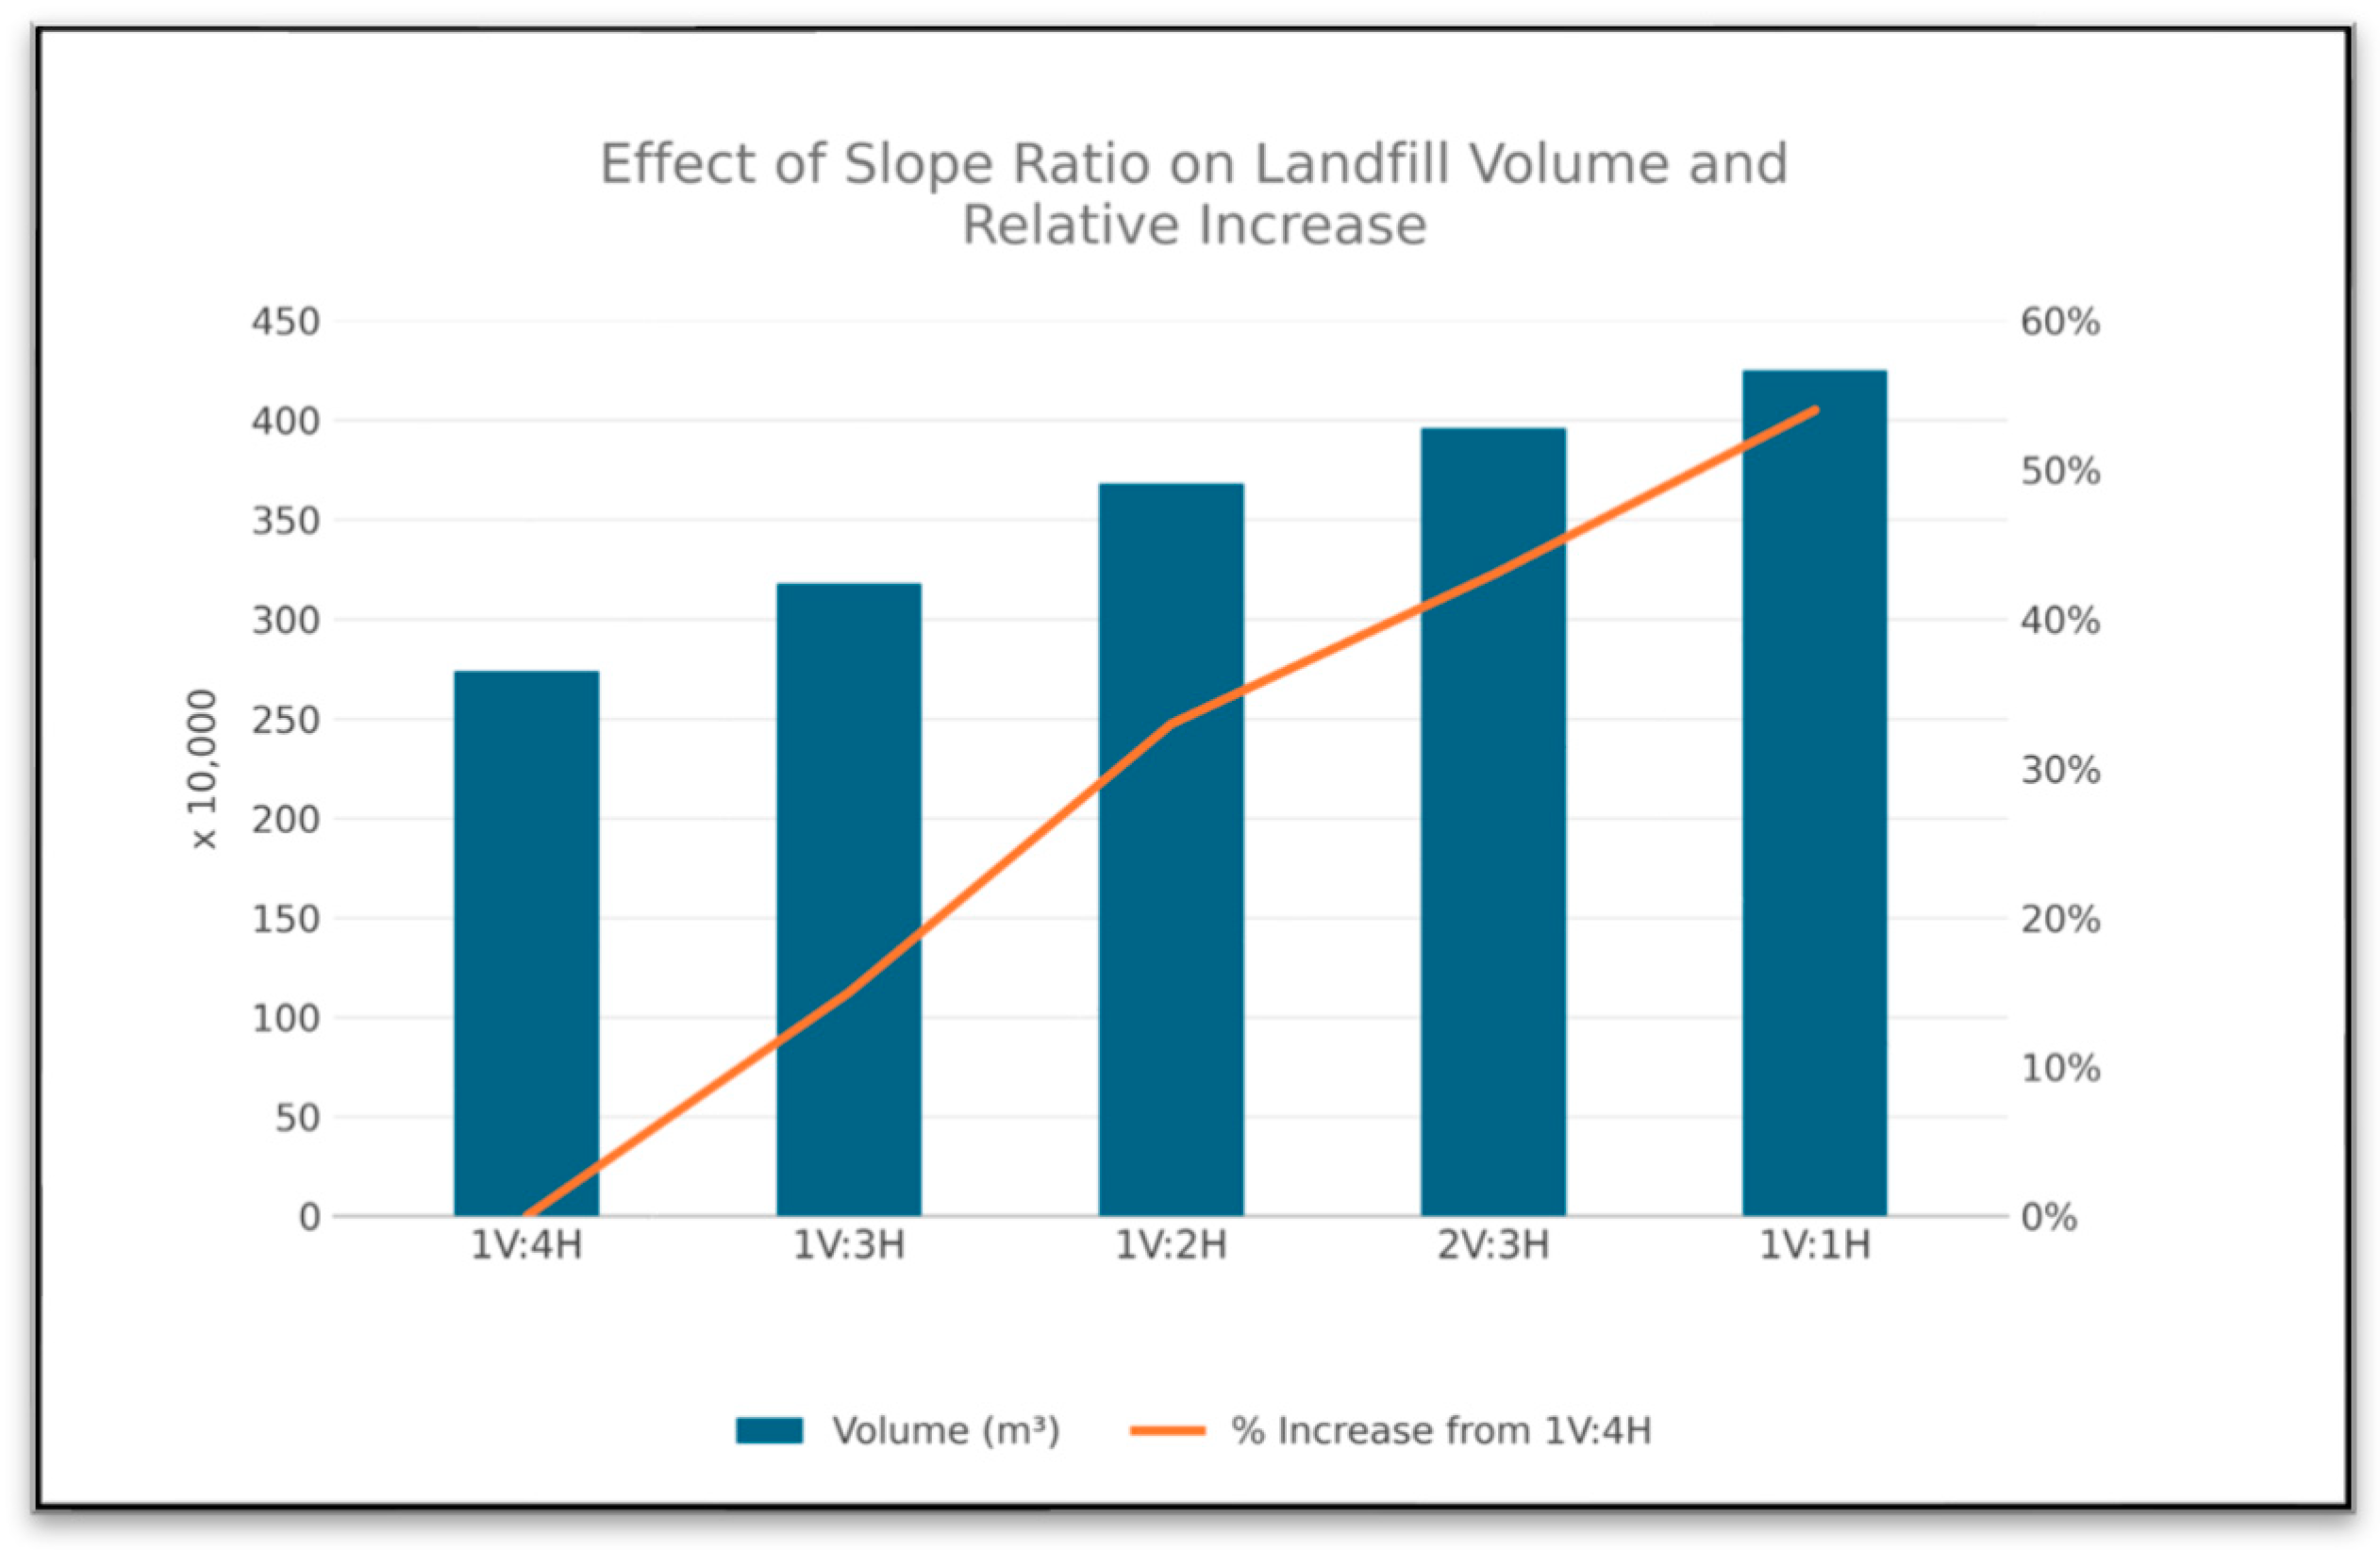
As shown in Figure 5 and Table 2, landfill storage capacity increases progressively with slope steepness for the fixed height of 40 m considered in this study, rising from 2.77 × 10⁶ m3 for the 1V:4H configuration to 4.28 × 10⁶ m3 for 1V:1H—an overall increase of 54.3%. Relative to the reference 1V:3H configuration, the steepest slope provides approximately 34% additional disposal capacity. This represents a substantial operational advantage, particularly in land-constrained settings, where opportunities for lateral expansion are severely limited.
Figure 5.
Landfill storage capacity as a function of slope ratio for a fixed landfill height of 40 m.
Table 2.
Landfill volume for different slope configurations.
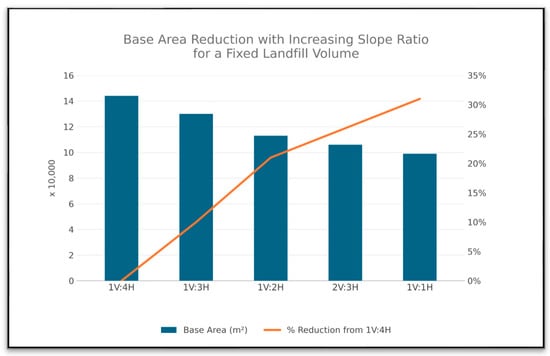
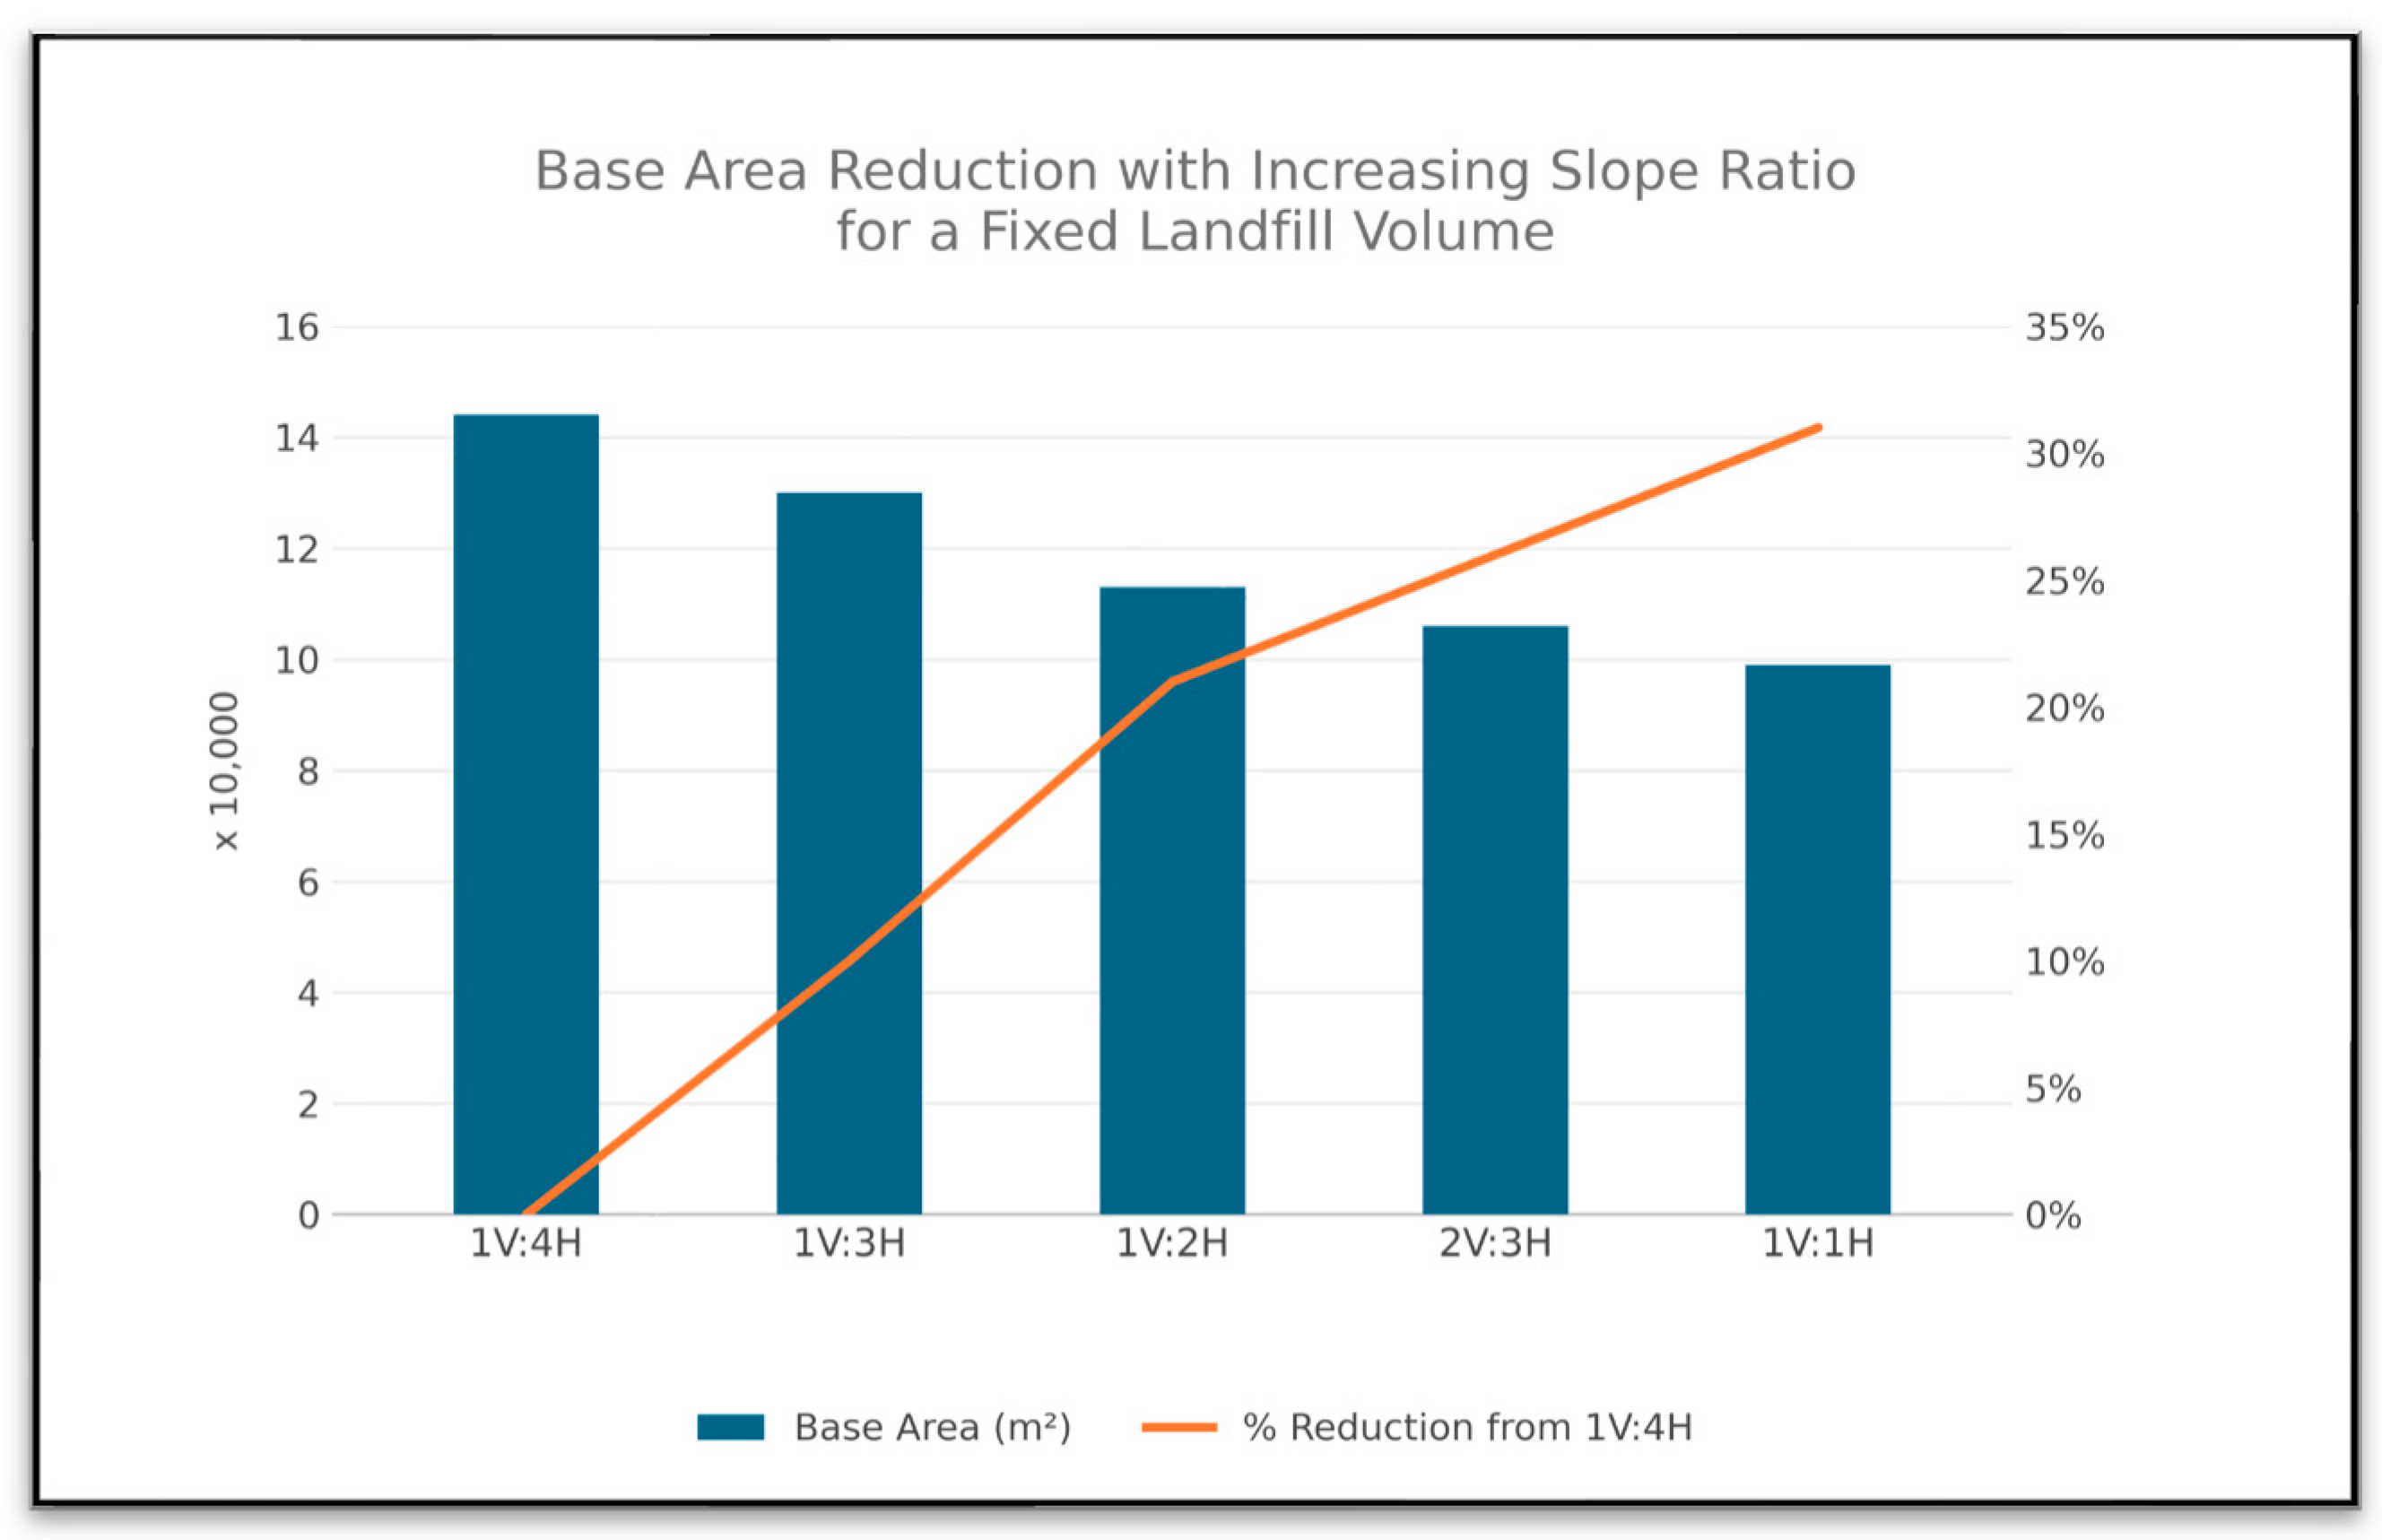
To evaluate land-use efficiency, the required base area was calculated for a fixed disposal volume of 3,201,600 m3 corresponding to the reference 1V:3H configuration. As shown in Figure 6 and Table 3, the required footprint decreases from 144,746 m2 for 1V:4H to 99,608 m2 for 1V:1H, a reduction of 31.2%. These results demonstrate that steeper slopes increase storage capacity while reducing the required land footprint, highlighting the geometric advantage of steeper configurations in land-constrained settings.
Figure 6.
Required landfill base area as a function of slope ratio for a fixed disposal volume of 3,201,600 m3.
Table 3.
Required landfill base area for a fixed storage capacity of 3,201,600 m3.
However, these geometric advantages must be weighed against the geotechnical consequences of increased slope inclination, which are evaluated in the following sections.
3.2. Stability Analysis
3.2.1. Overview
The stability of the five landfill slope configurations was evaluated using the four material characterization approaches (C1–C4) described in Section 2.3, together with the diagnostic configuration C1b introduced in Section 2.9. The deterministic models (C1–C3) provide a comparison of alternative literature-derived representations of MSW properties, whereas the probabilistic model (C4) represents property heterogeneity through layer-wise stochastic resampling. The resulting factors of safety are summarized in Table 4.
Table 4.
Factors of safety obtained for the investigated slope configurations.
3.2.2. Deterministic Stability Analysis (C1–C3)
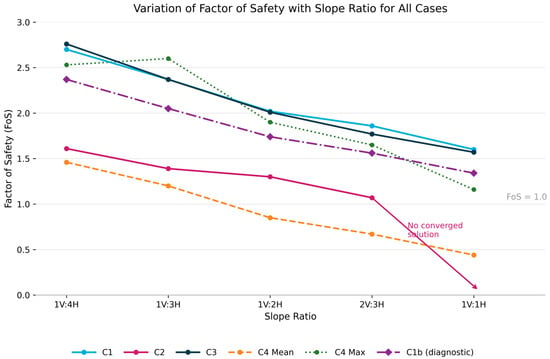
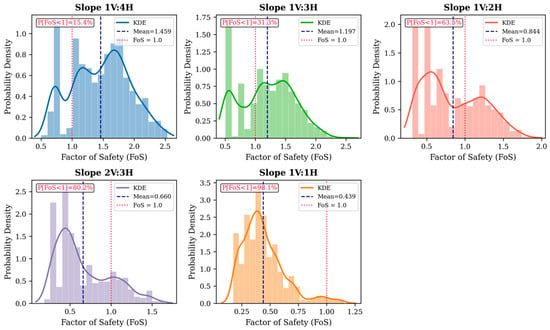
A monotonic reduction in FoS with increasing slope steepness is observed across all deterministic models, showing that slope geometry has a strong and consistent influence on the calculated landfill stability. As shown in Figure 7, for C1, FoS decreases from 2.703 at 1V:4H to 1.576 at 1V:1H, corresponding to a reduction of approximately 42%. Despite representing the landfill using thirteen layers with varying properties, C3 produces FoS values closely aligned with C1, with a maximum difference of less than 6%. This indicates that, for the adopted C3 property profile, the finer deterministic zoning produces a global stability response similar to that of the homogeneous C1 representation.
Figure 7.
Variation in factor of safety with slope ratio for all cases (C1, C1b, C2, C3, and the C4 mean and maximum).
In contrast, C2 consistently yields lower FoS values than both C1 and C3, attributable to the degradation-dependent property profile adopted in this model, which assigns lower shear-strength parameters to the upper waste zones. These results demonstrate that deterministic stability predictions can be strongly affected by the assumed depth-dependent property distribution, in addition to the spatial representation adopted for the waste mass. Because C1–C3 use different literature-derived property profiles, the comparison should therefore be interpreted as an assessment of alternative deterministic MSW representations rather than as a controlled discretization-only sensitivity analysis.
A related decomposition, performed for the C1-versus-C4 comparison using the diagnostic configuration C1b (Section 2.9), indicates that spatial representation—rather than the choice of property database—is the dominant contributor to that specific difference (73–79% of the total). While this decomposition was not performed for C2 or C3, since both represent specific literature-reported depth-dependent property profiles rather than a single substitutable mean value, it provides corroborating context that spatial-representation effects are not necessarily secondary to database-selection effects within this modeling framework.
No converged solution was obtained for C2 at 1V:1H. Using the adopted PLAXIS convergence settings, with a tolerance of 0.01 for the relative change in global displacement increments and a maximum of 60 iterations per load step, the combination of extreme slope steepness and the weak degradation-dependent upper-layer properties prevented numerical convergence at the initiation of the strength reduction procedure.
3.2.3. Probabilistic Stability Analysis (C4)—FoS Distributions
Introducing layer-wise stochastic heterogeneity through C4 substantially alters the predicted stability response relative to the deterministic representations. The complete statistical characterization of the Monte Carlo-derived FoS distributions is presented in Table 5 and Figure 8, Figure 9 and Figure 10.
Table 5.
Statistical characteristics of FoS distributions obtained from Monte Carlo simulations.
Figure 8.
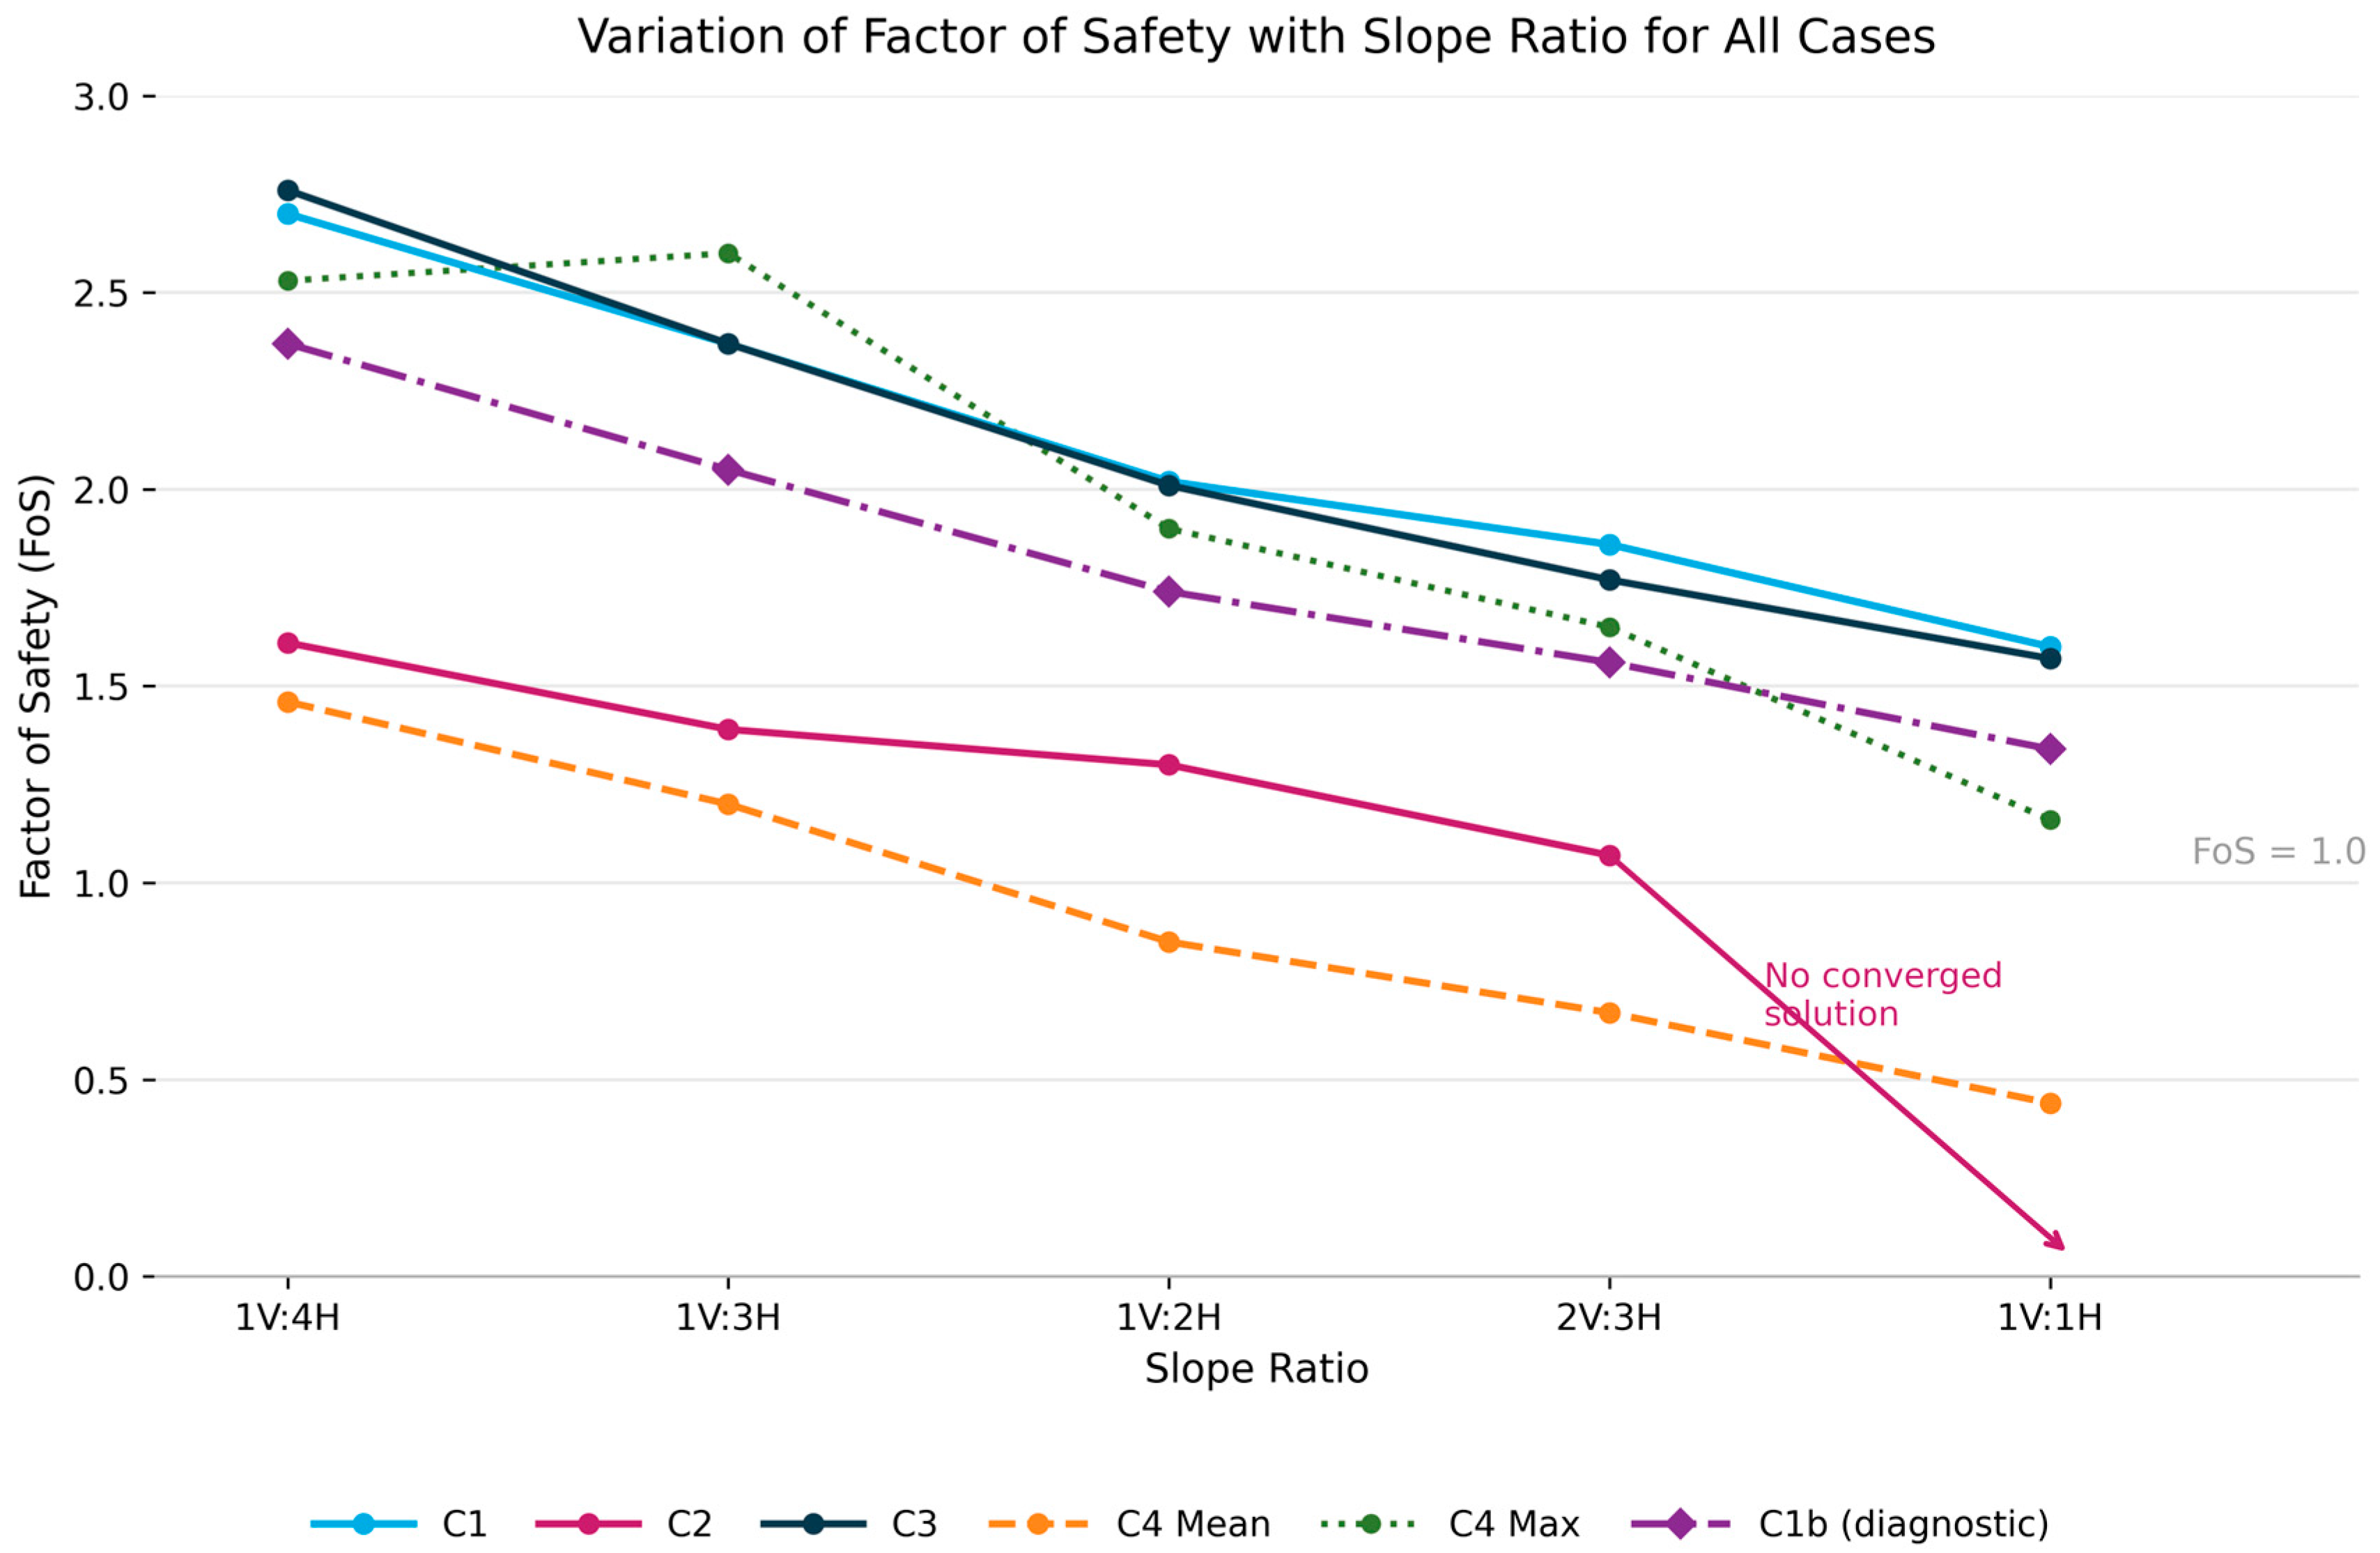
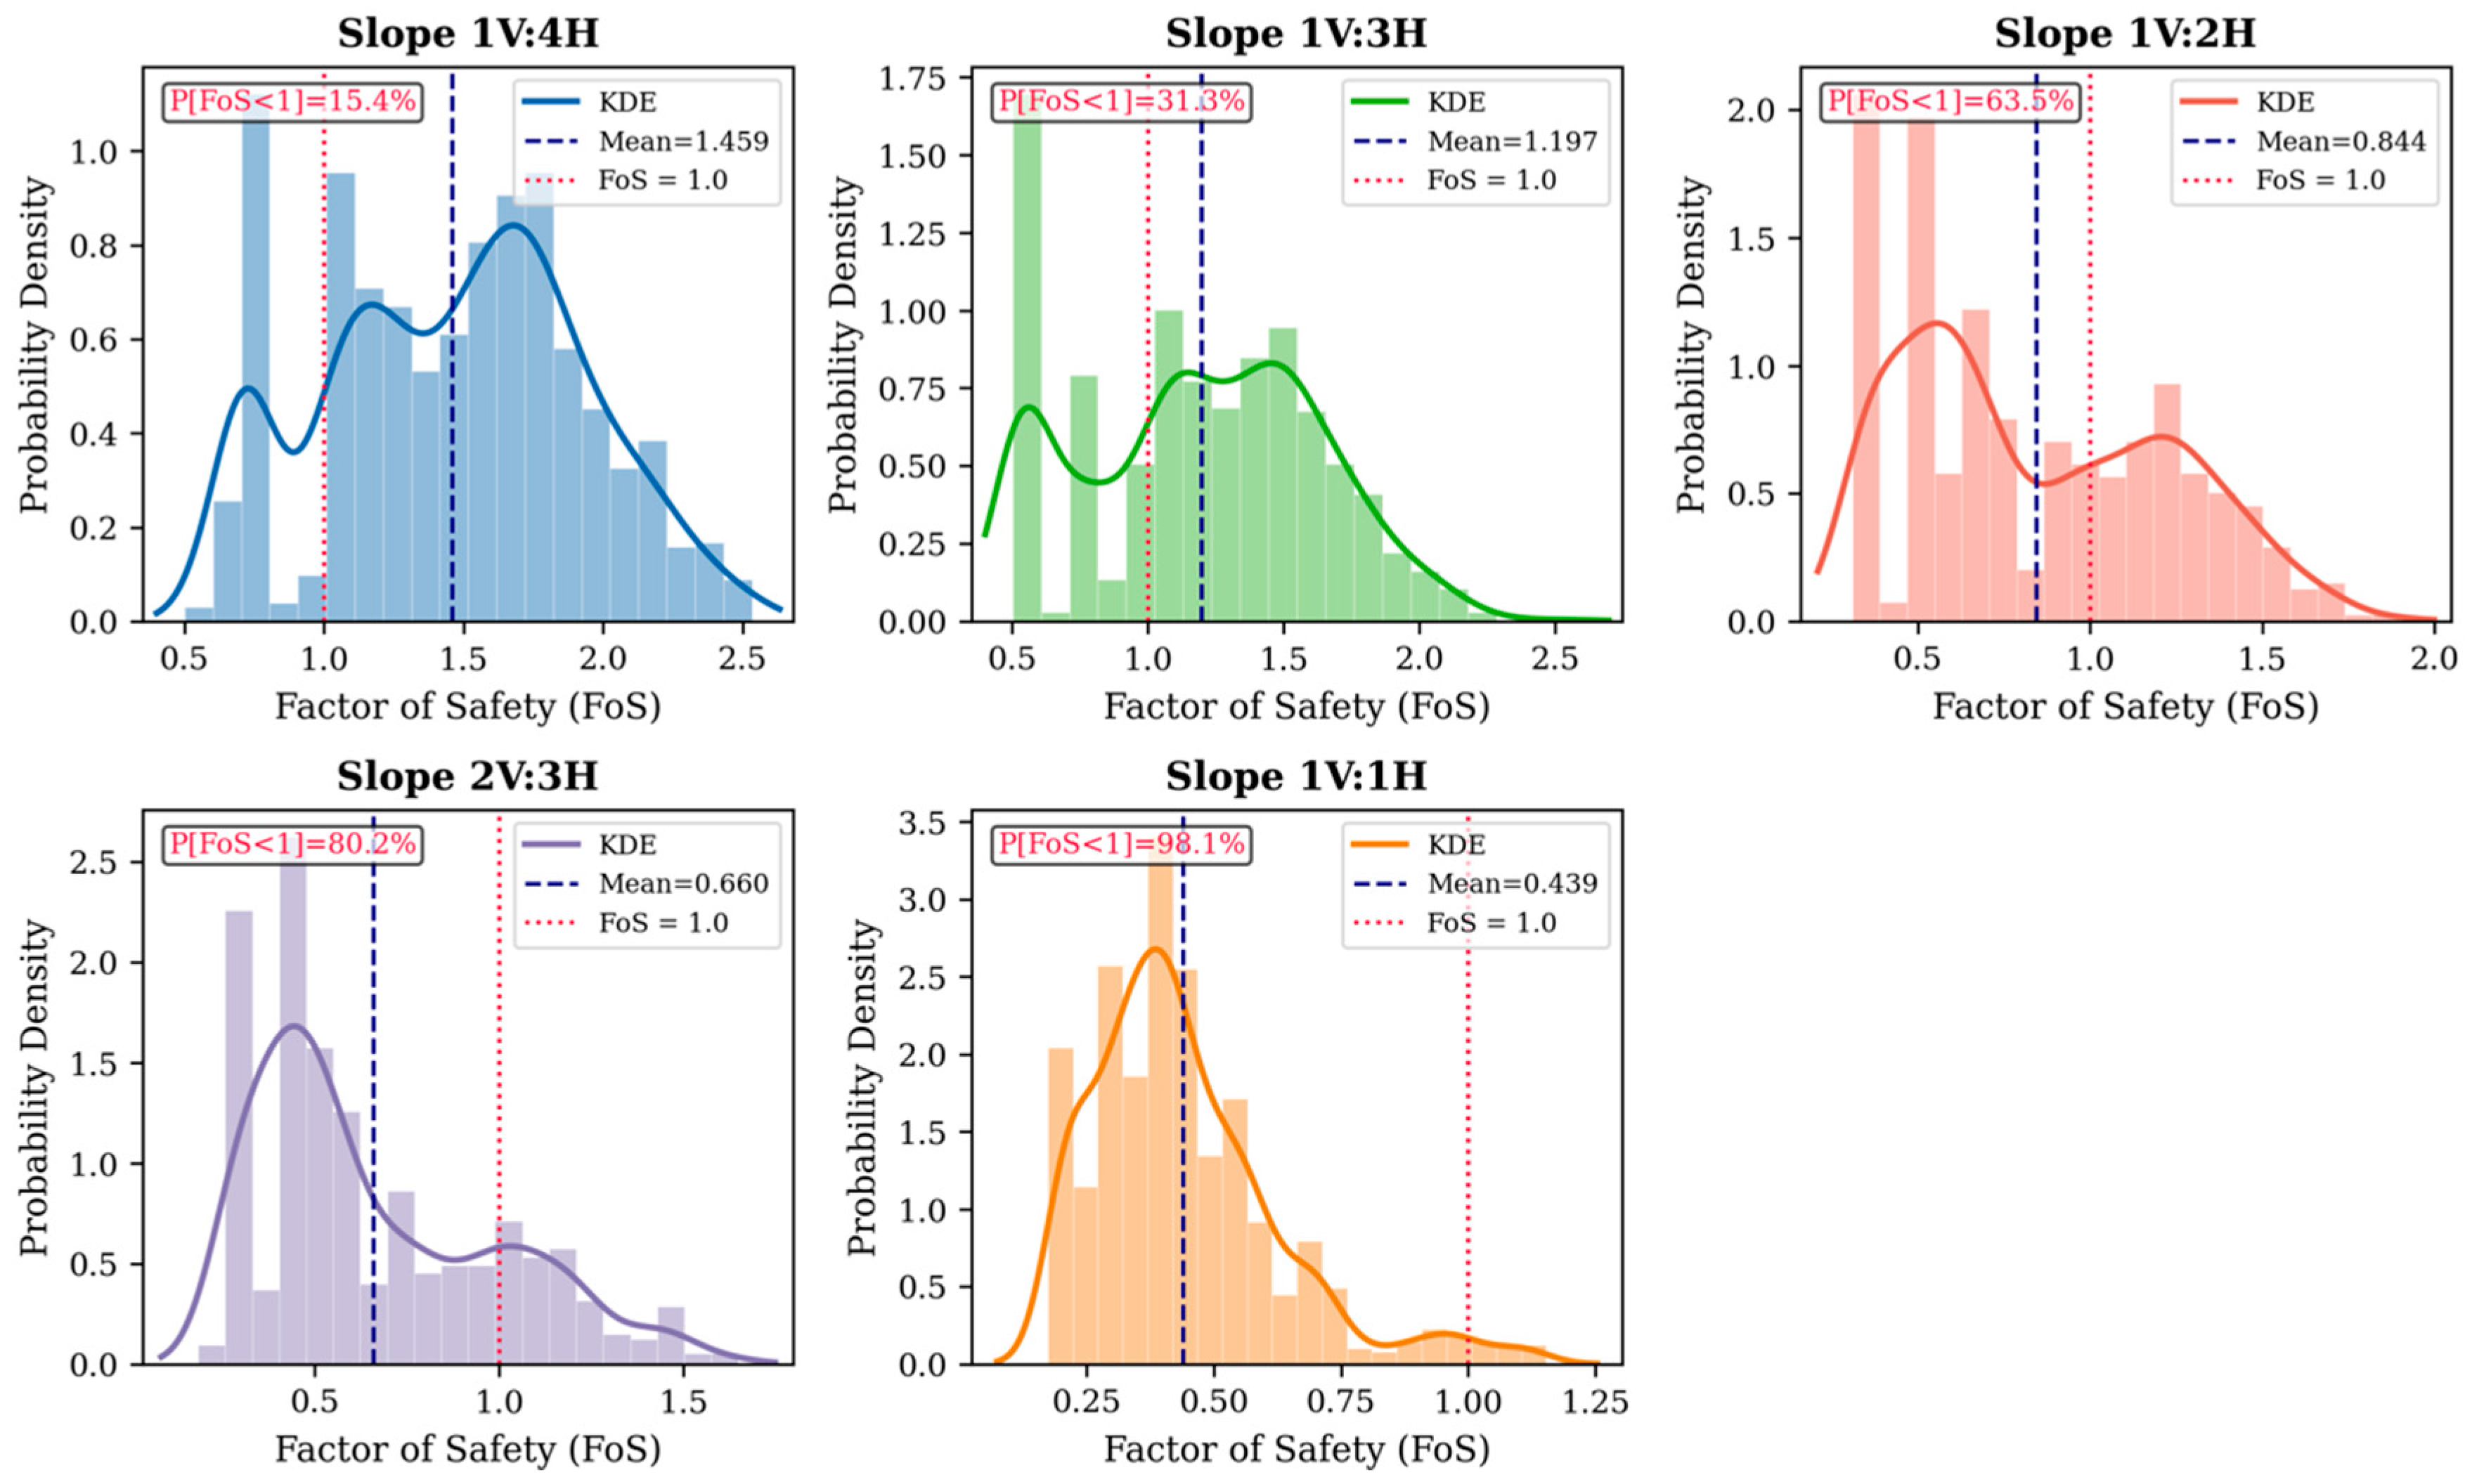
FOS histograms with KDE curves for five landfill slope configurations (1000 Monte Carlo PLAXIS 2D simulations per configuration).
Figure 9.
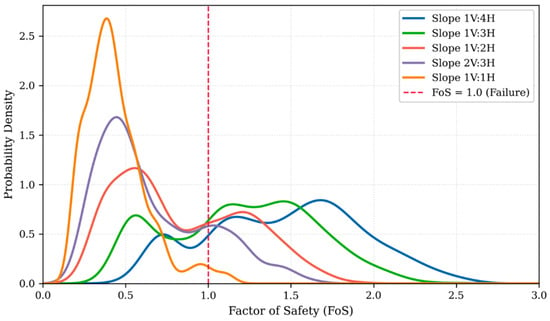
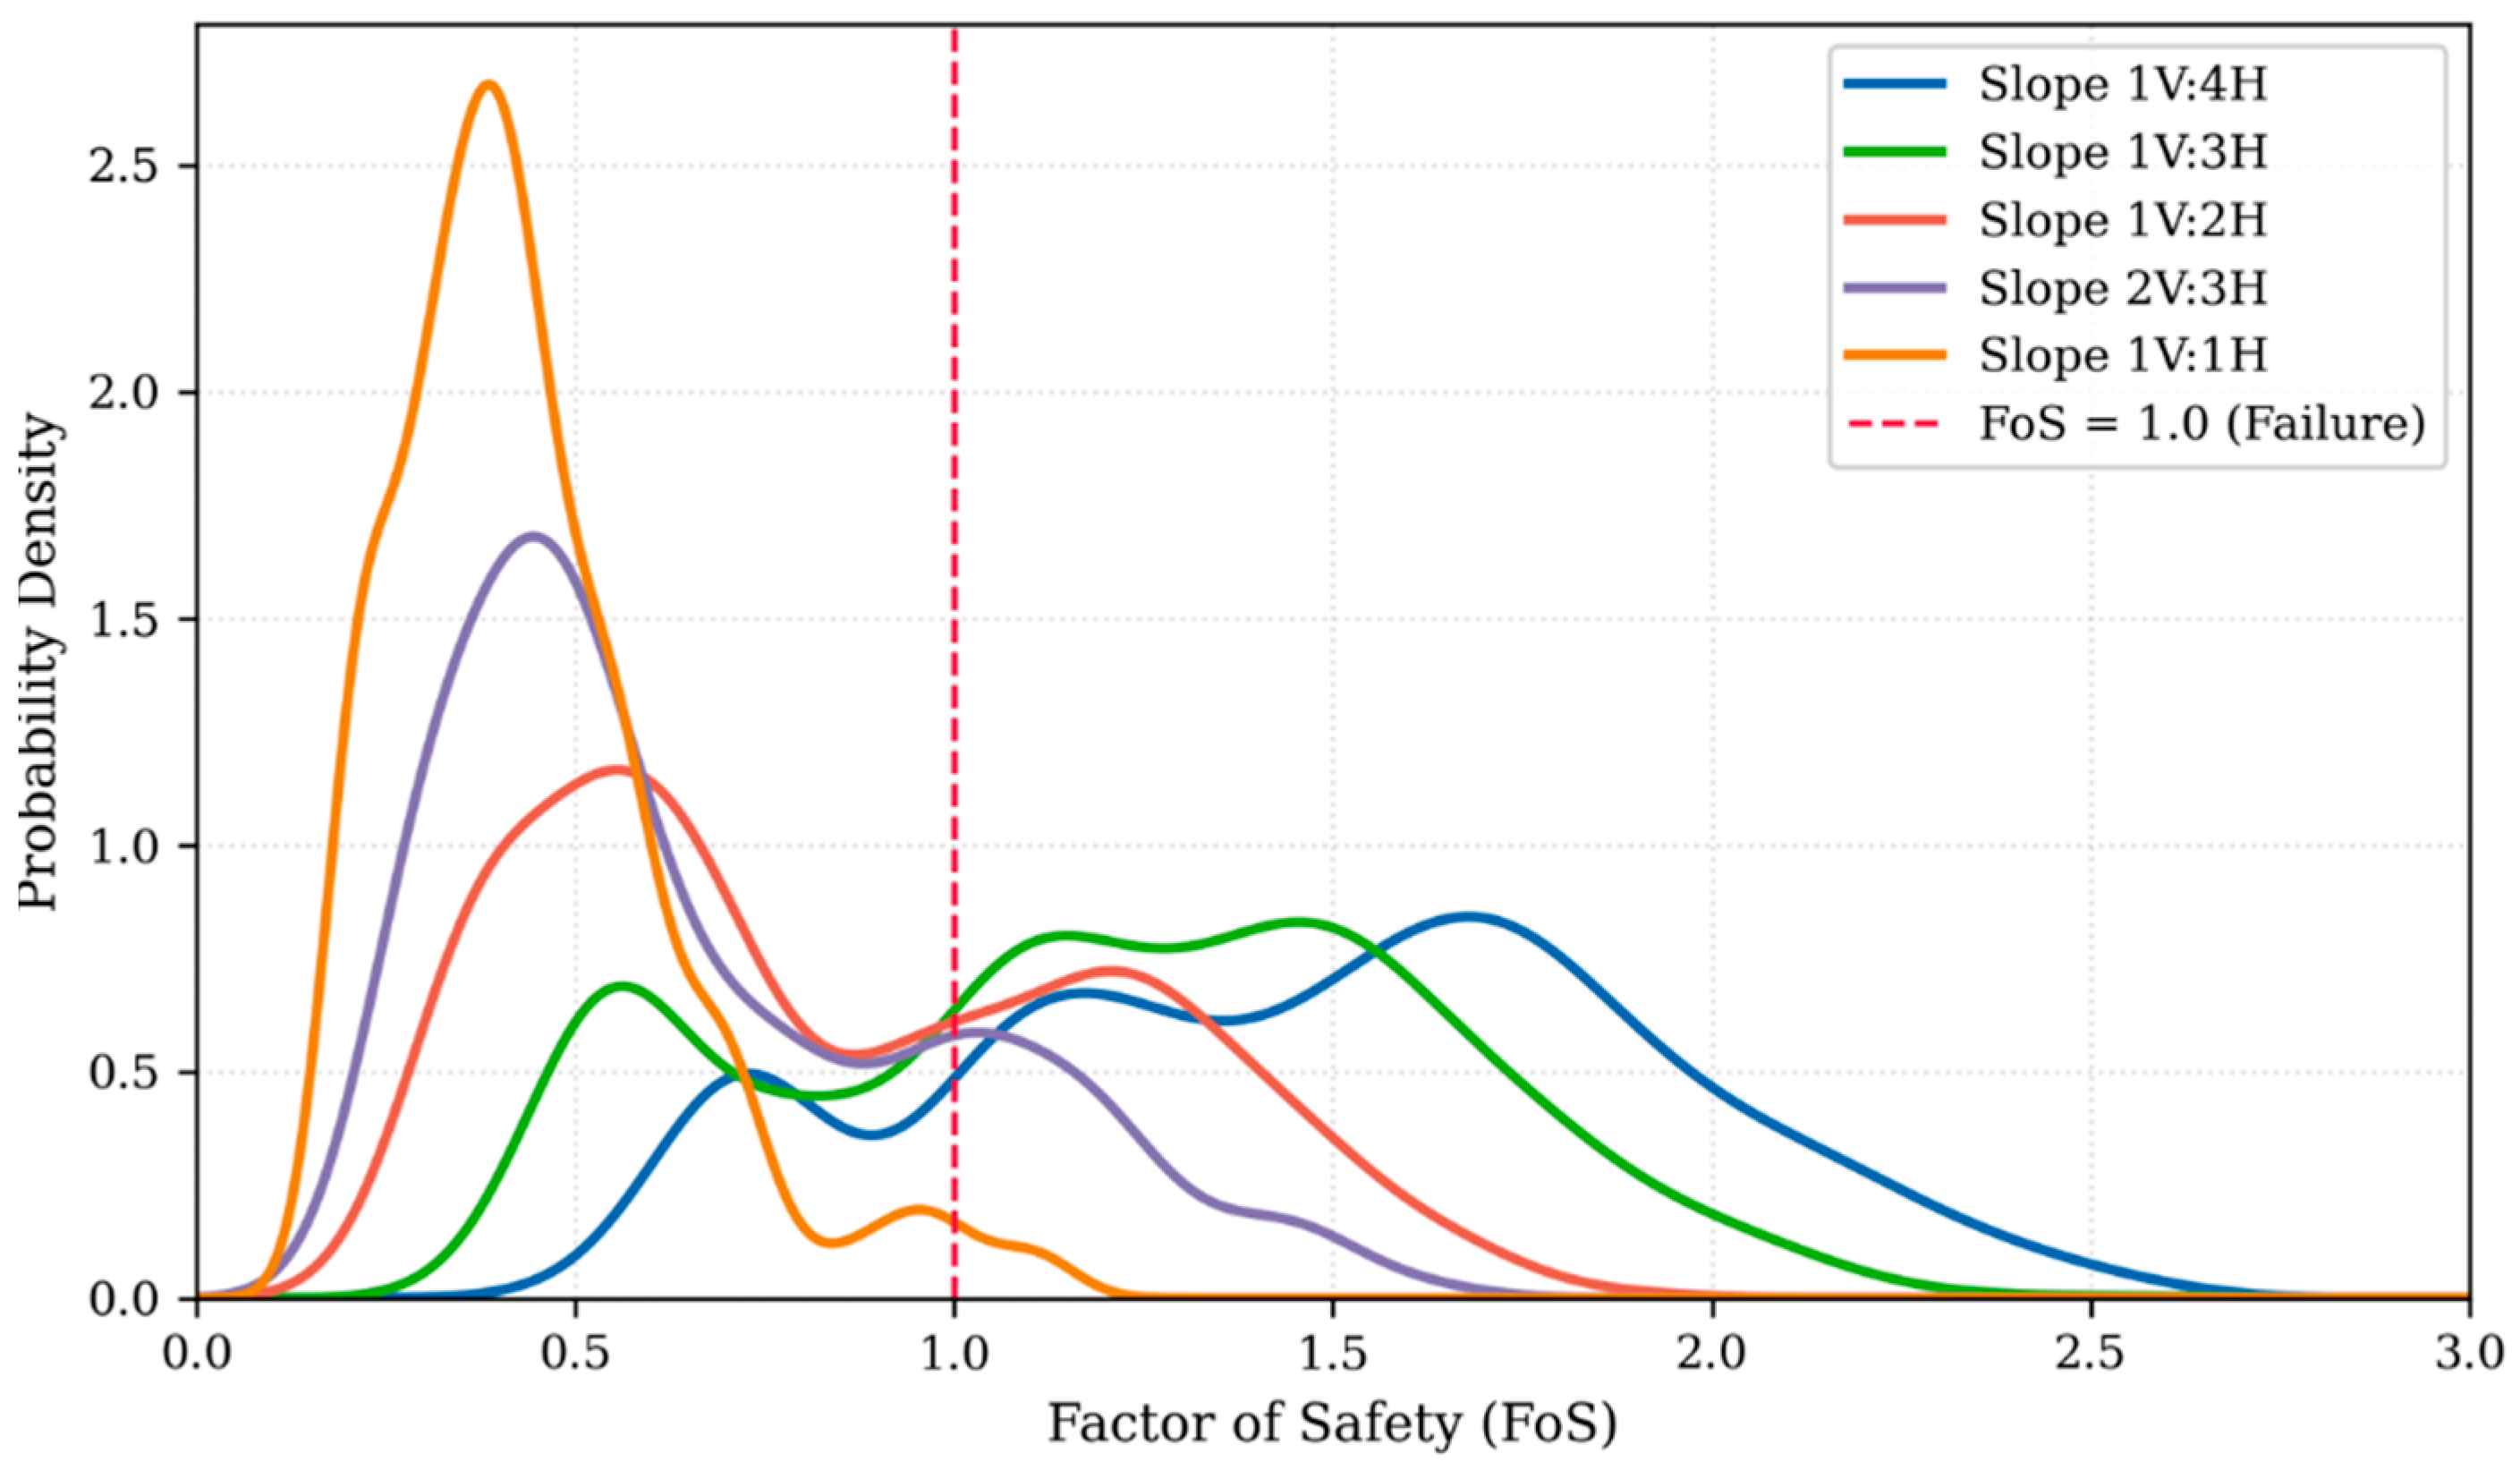
Comparison of FOS probability density functions for all slope configurations.
Figure 10.
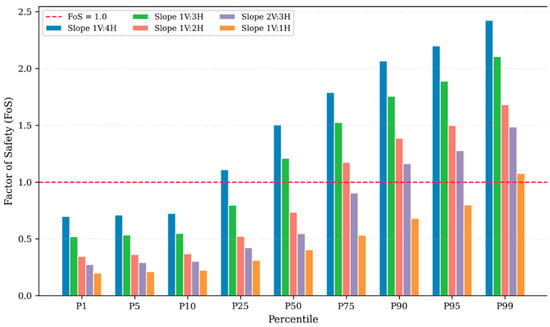
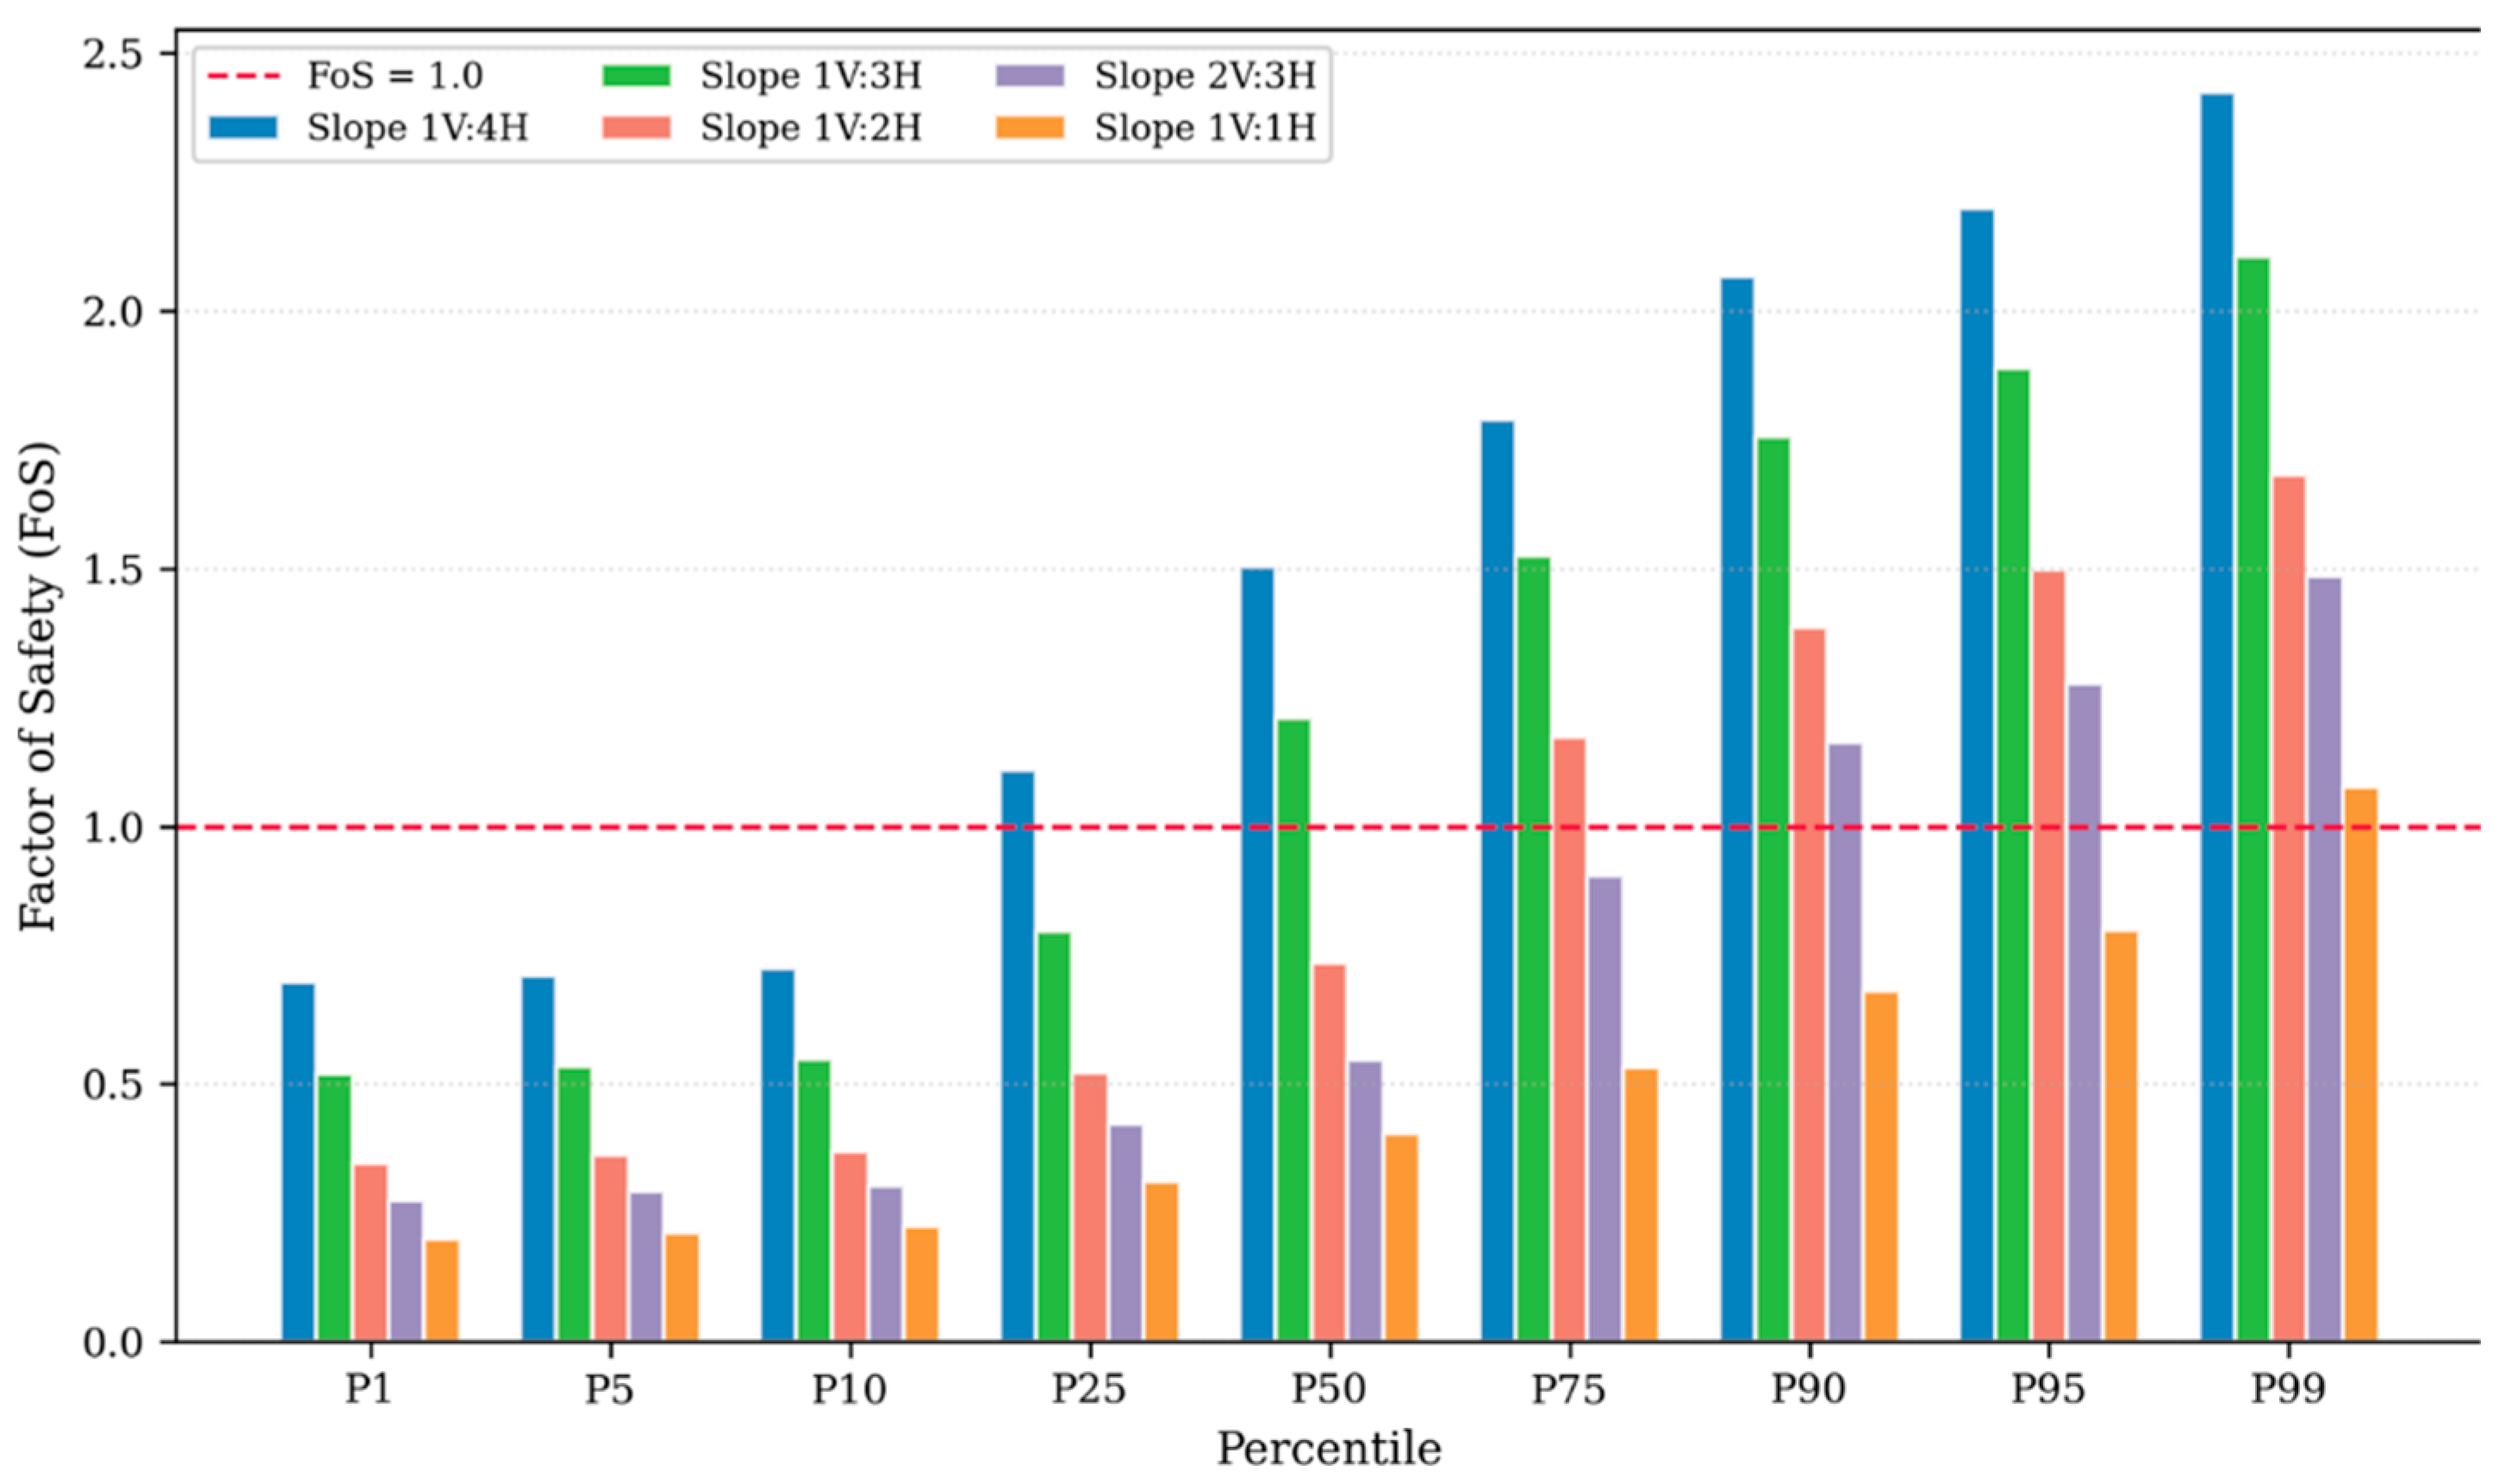
Percentile bands (P1–P99) of the simulated FoS distributions across the investigated slope configurations.
Figure 8 shows a progressive leftward shift in the FoS distributions as slope inclination increases. The 1V:4H and 1V:3H configurations have mean and median FoS values above unity, although their lower tails extend into the failure domain, whereas the 1V:2H, 2V:3H, and 1V:1H configurations have median FoS values below unity. In addition to the reduction in mean FoS, the distributions become increasingly asymmetric with slope steepness, while the proportion of realizations with FoS below unity increases markedly.
The FoS distributions in Figure 8 and Figure 9 also exhibit a multimodal structure, particularly for the 1V:4H configuration. This indicates that the stochastic realizations may produce distinct response regimes rather than a single unimodal population. A plausible explanation is that different spatial arrangements of the sampled MSW properties interact differently with the developing critical failure zone, such that relatively weak material occurring within or near the controlling shear zone may lead to substantially lower FoS values than similarly weak material located outside it. However, the original Monte Carlo output did not retain sufficient per-realization information on the critical slip-surface geometry to establish whether the observed multimodality corresponds to distinct failure mechanisms. Therefore, the present study does not interpret the multiple modes as definitive evidence of competing failure mechanisms, but identifies this feature as an important characteristic of the stochastic response and a direction for further investigation.
The mean FoS decreases monotonically from 1.459 for 1V:4H to 0.439 for 1V:1H, with three of the five configurations—1V:2H, 2V:3H, and 1V:1H—exhibiting mean values below unity. The mean FoS values obtained from C4 are substantially lower than those from C1 for all slope configurations, with the total reduction ranging from 46.0% (1V:4H) to 72.1% (1V:1H) relative to the corresponding deterministic C1 value. To determine whether this difference reflects the spatial representation of heterogeneity, the property database, or both, the total difference was decomposed using the diagnostic C1b configuration (Section 2.9; Table 6). Across all five slope configurations, the parameter-set component (attributable to adopting the C4 database mean rather than the point-estimate properties of [21]) consistently accounts for 21–27% of the total difference, while the spatial-representation component (attributable to layer-wise stochastic heterogeneity, holding the database fixed) accounts for the remaining 73–79%. This indicates that, under the modeling assumptions adopted in this study, the explicit representation of spatial heterogeneity is the dominant driver of the reduced stability estimates obtained from C4, with the choice of property database contributing a smaller, but non-negligible, secondary effect. The relative contribution of the spatial-representation component increases modestly with slope steepness, from 72.9% at 1V:4H to 79.0% at 1V:1H, suggesting that the influence of heterogeneity representation becomes proportionally more significant as the slope configuration approaches marginal stability.
Table 6.
Decomposition of the C1–C4 factor of safety difference into parameter-set and spatial-representation components.
Sole reliance on mean FoS values is insufficient to characterize the probabilistic stability response. The CoV ranges from 31.7% for 1V:4H to a maximum of 49.6% for 2V:3H, indicating substantial variability in the calculated FoS associated with the layer-wise stochastic property assignments. The increasing difference between the mean and median FoS for the steeper configurations is consistent with the increasing positive skewness reported in Table 5. For example, at 1V:2H, the mean FoS is 0.844 compared with a median of 0.734, indicating that a relatively extended upper tail of higher-FoS realizations shifts the mean above the median.
The shape of the FoS distributions undergoes a marked transition with increasing slope steepness. The 1V:4H and 1V:3H distributions exhibit near-zero skewness (−0.017 and +0.027, respectively), indicating approximately symmetric distributions around their means. Beyond 1V:3H, the distributions become progressively positively skewed, with skewness increasing from +0.426 at 1V:2H to +0.850 at 2V:3H and +1.278 at 1V:1H. This indicates that the distributions become increasingly asymmetric, with a greater concentration of realizations toward the lower-FoS range and a progressively longer upper tail of higher-FoS realizations. These results indicate an increasing departure from symmetry as slope steepness increases. Because the Monte Carlo analysis uses the empirical literature database directly without imposing a parametric distribution on the sampled MSW properties, the resulting FoS distribution is obtained directly from the simulated realizations rather than from a prescribed analytical form.
The percentile analysis presented in Table 7 and Figure 10 provides a complementary characterization of the lower tail of the FoS distributions. The P5 FoS values fall below unity for all five configurations, including the 1V:4H slope (P5 = 0.711), indicating that the lower tail of the simulated stability response extends into the failure domain even for the gentlest configuration investigated. For the 1V:3H configuration, the P25 value is 0.797, meaning that approximately 25% of the simulated realizations have FoS values below 0.797, while the directly estimated probability of failure is 31.3%. These results demonstrate that the mean FoS alone does not adequately characterize the lower-tail behavior of the probabilistic stability response.
Table 7.
Percentile statistics of the simulated FoS distributions.
3.2.4. Probability of Failure and Reliability Assessment
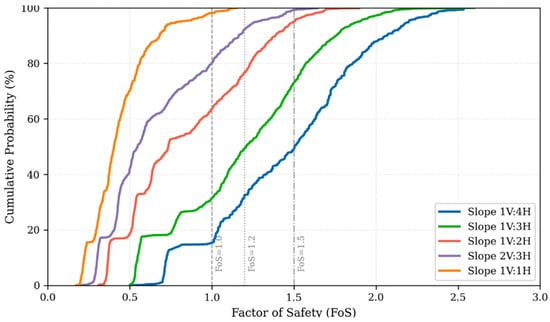
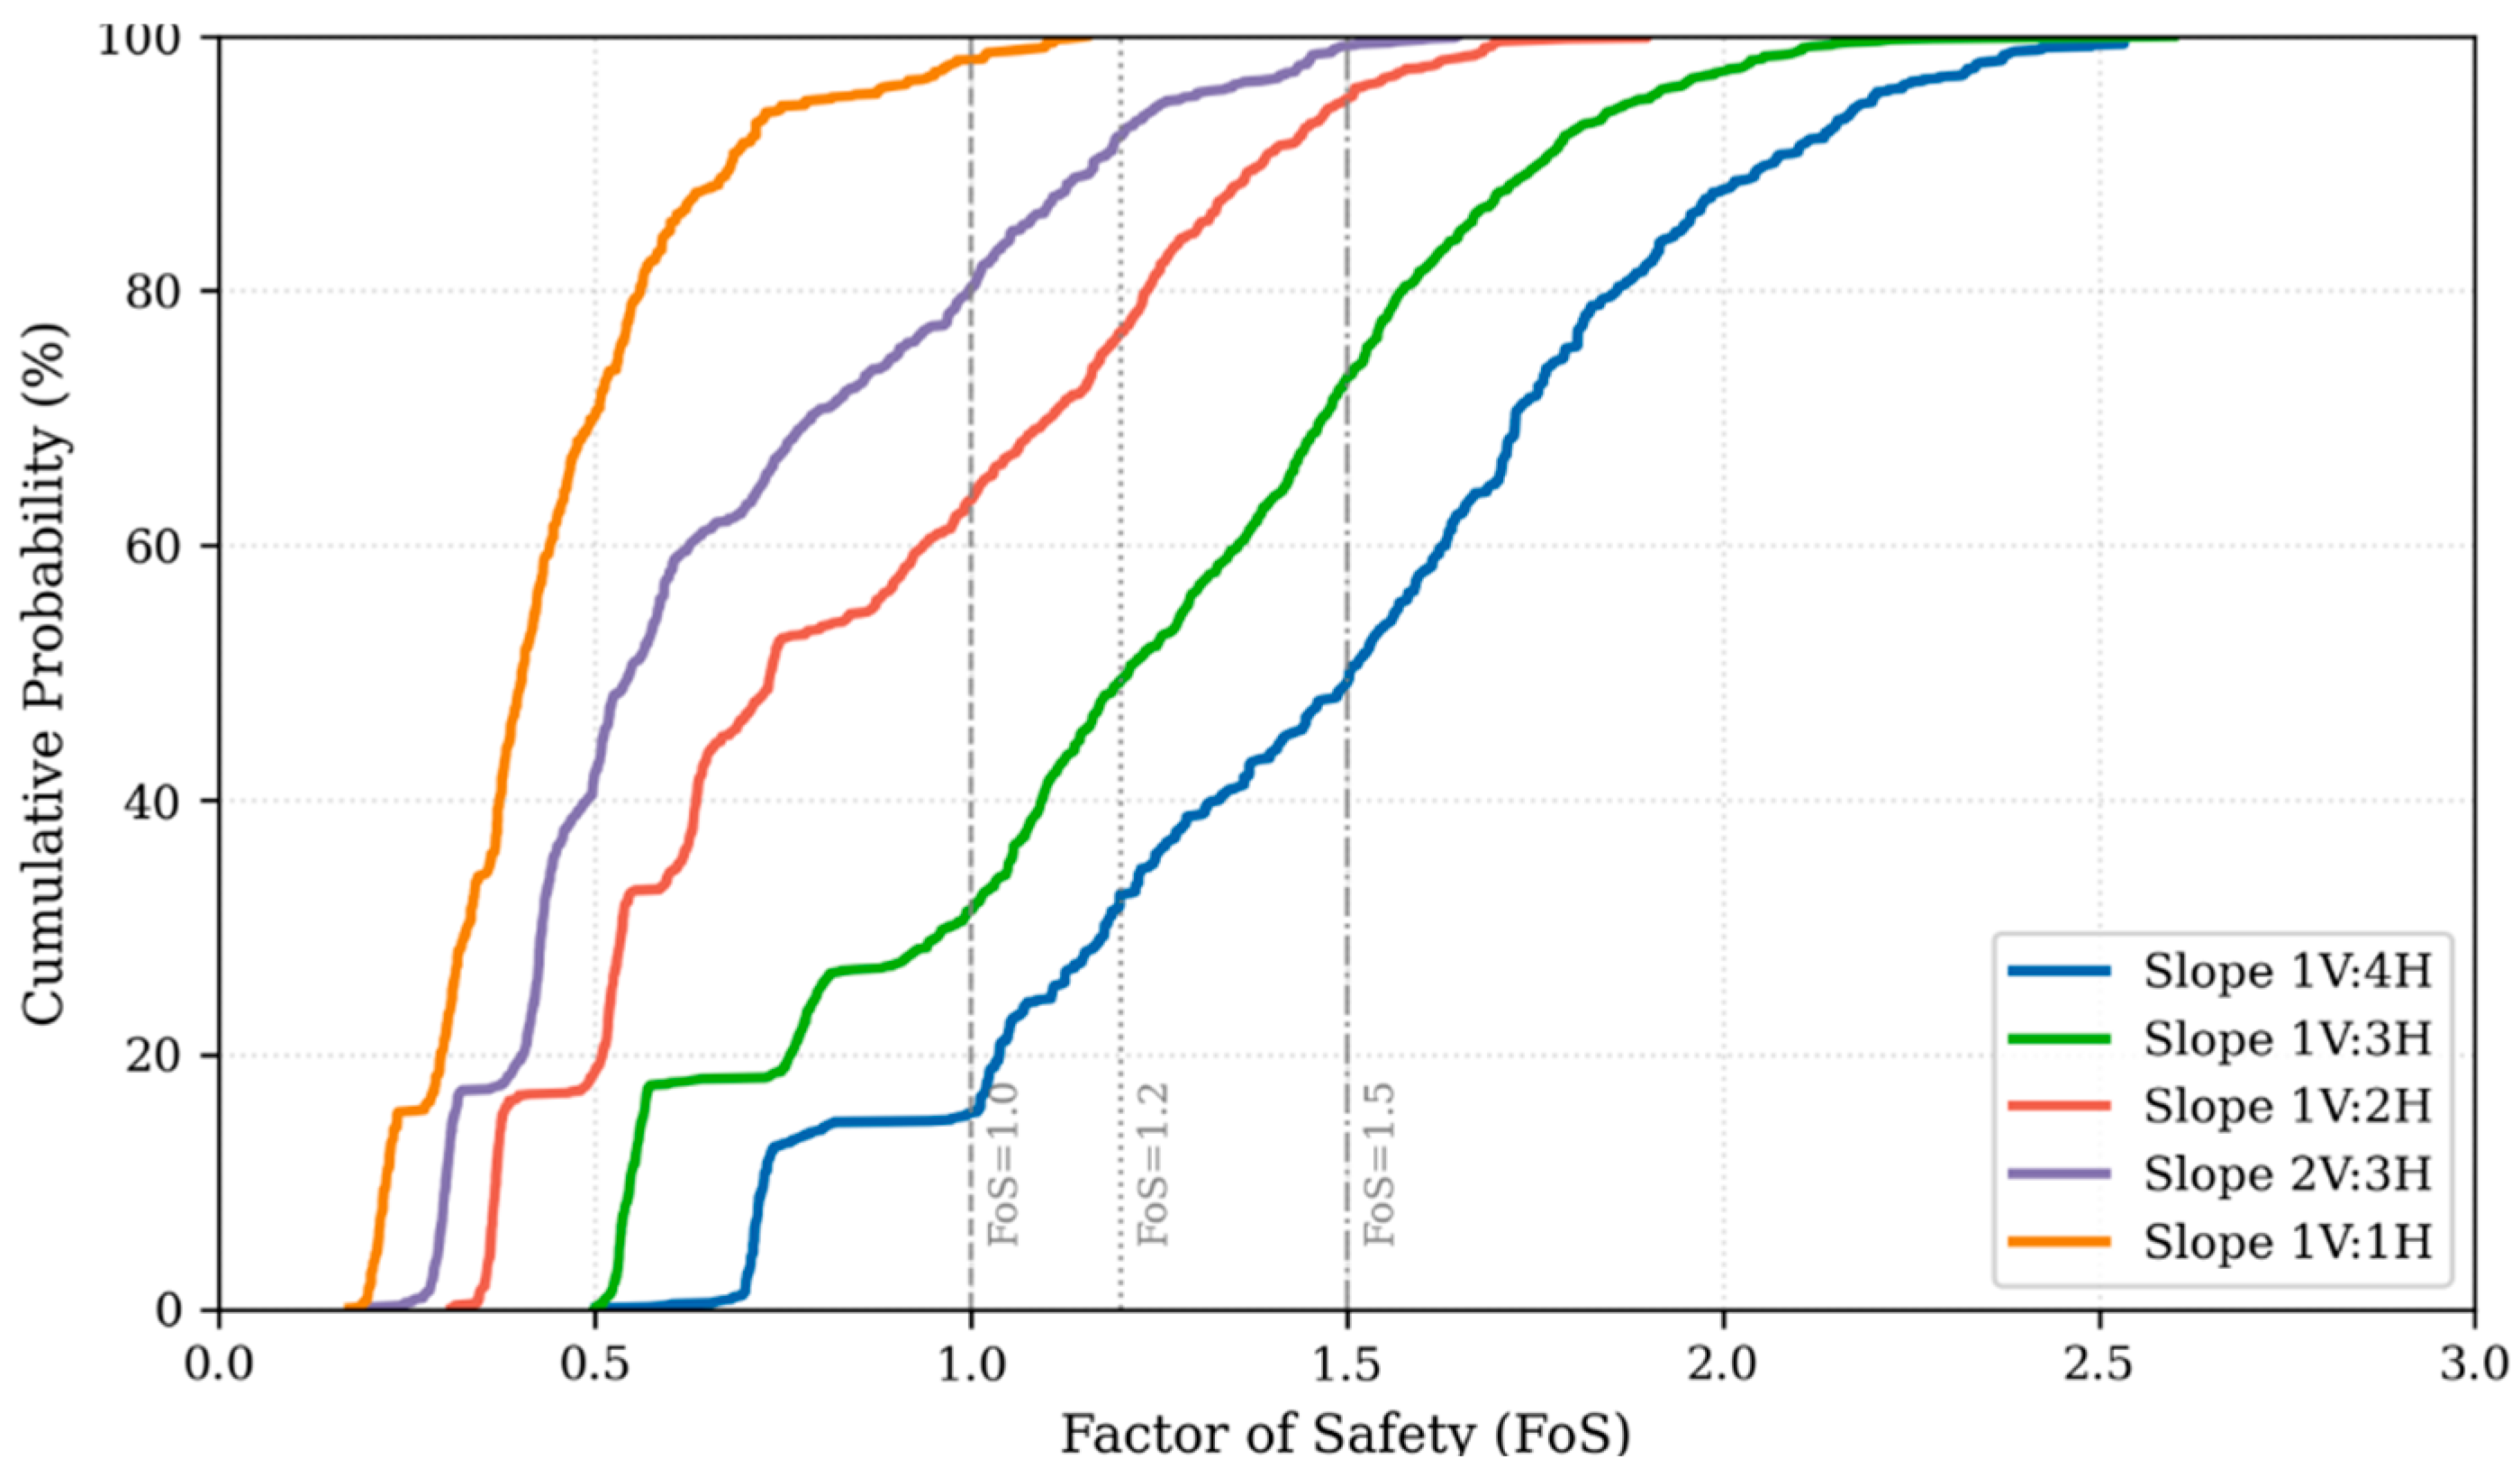
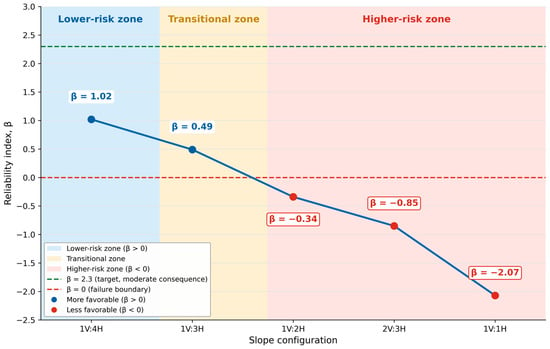
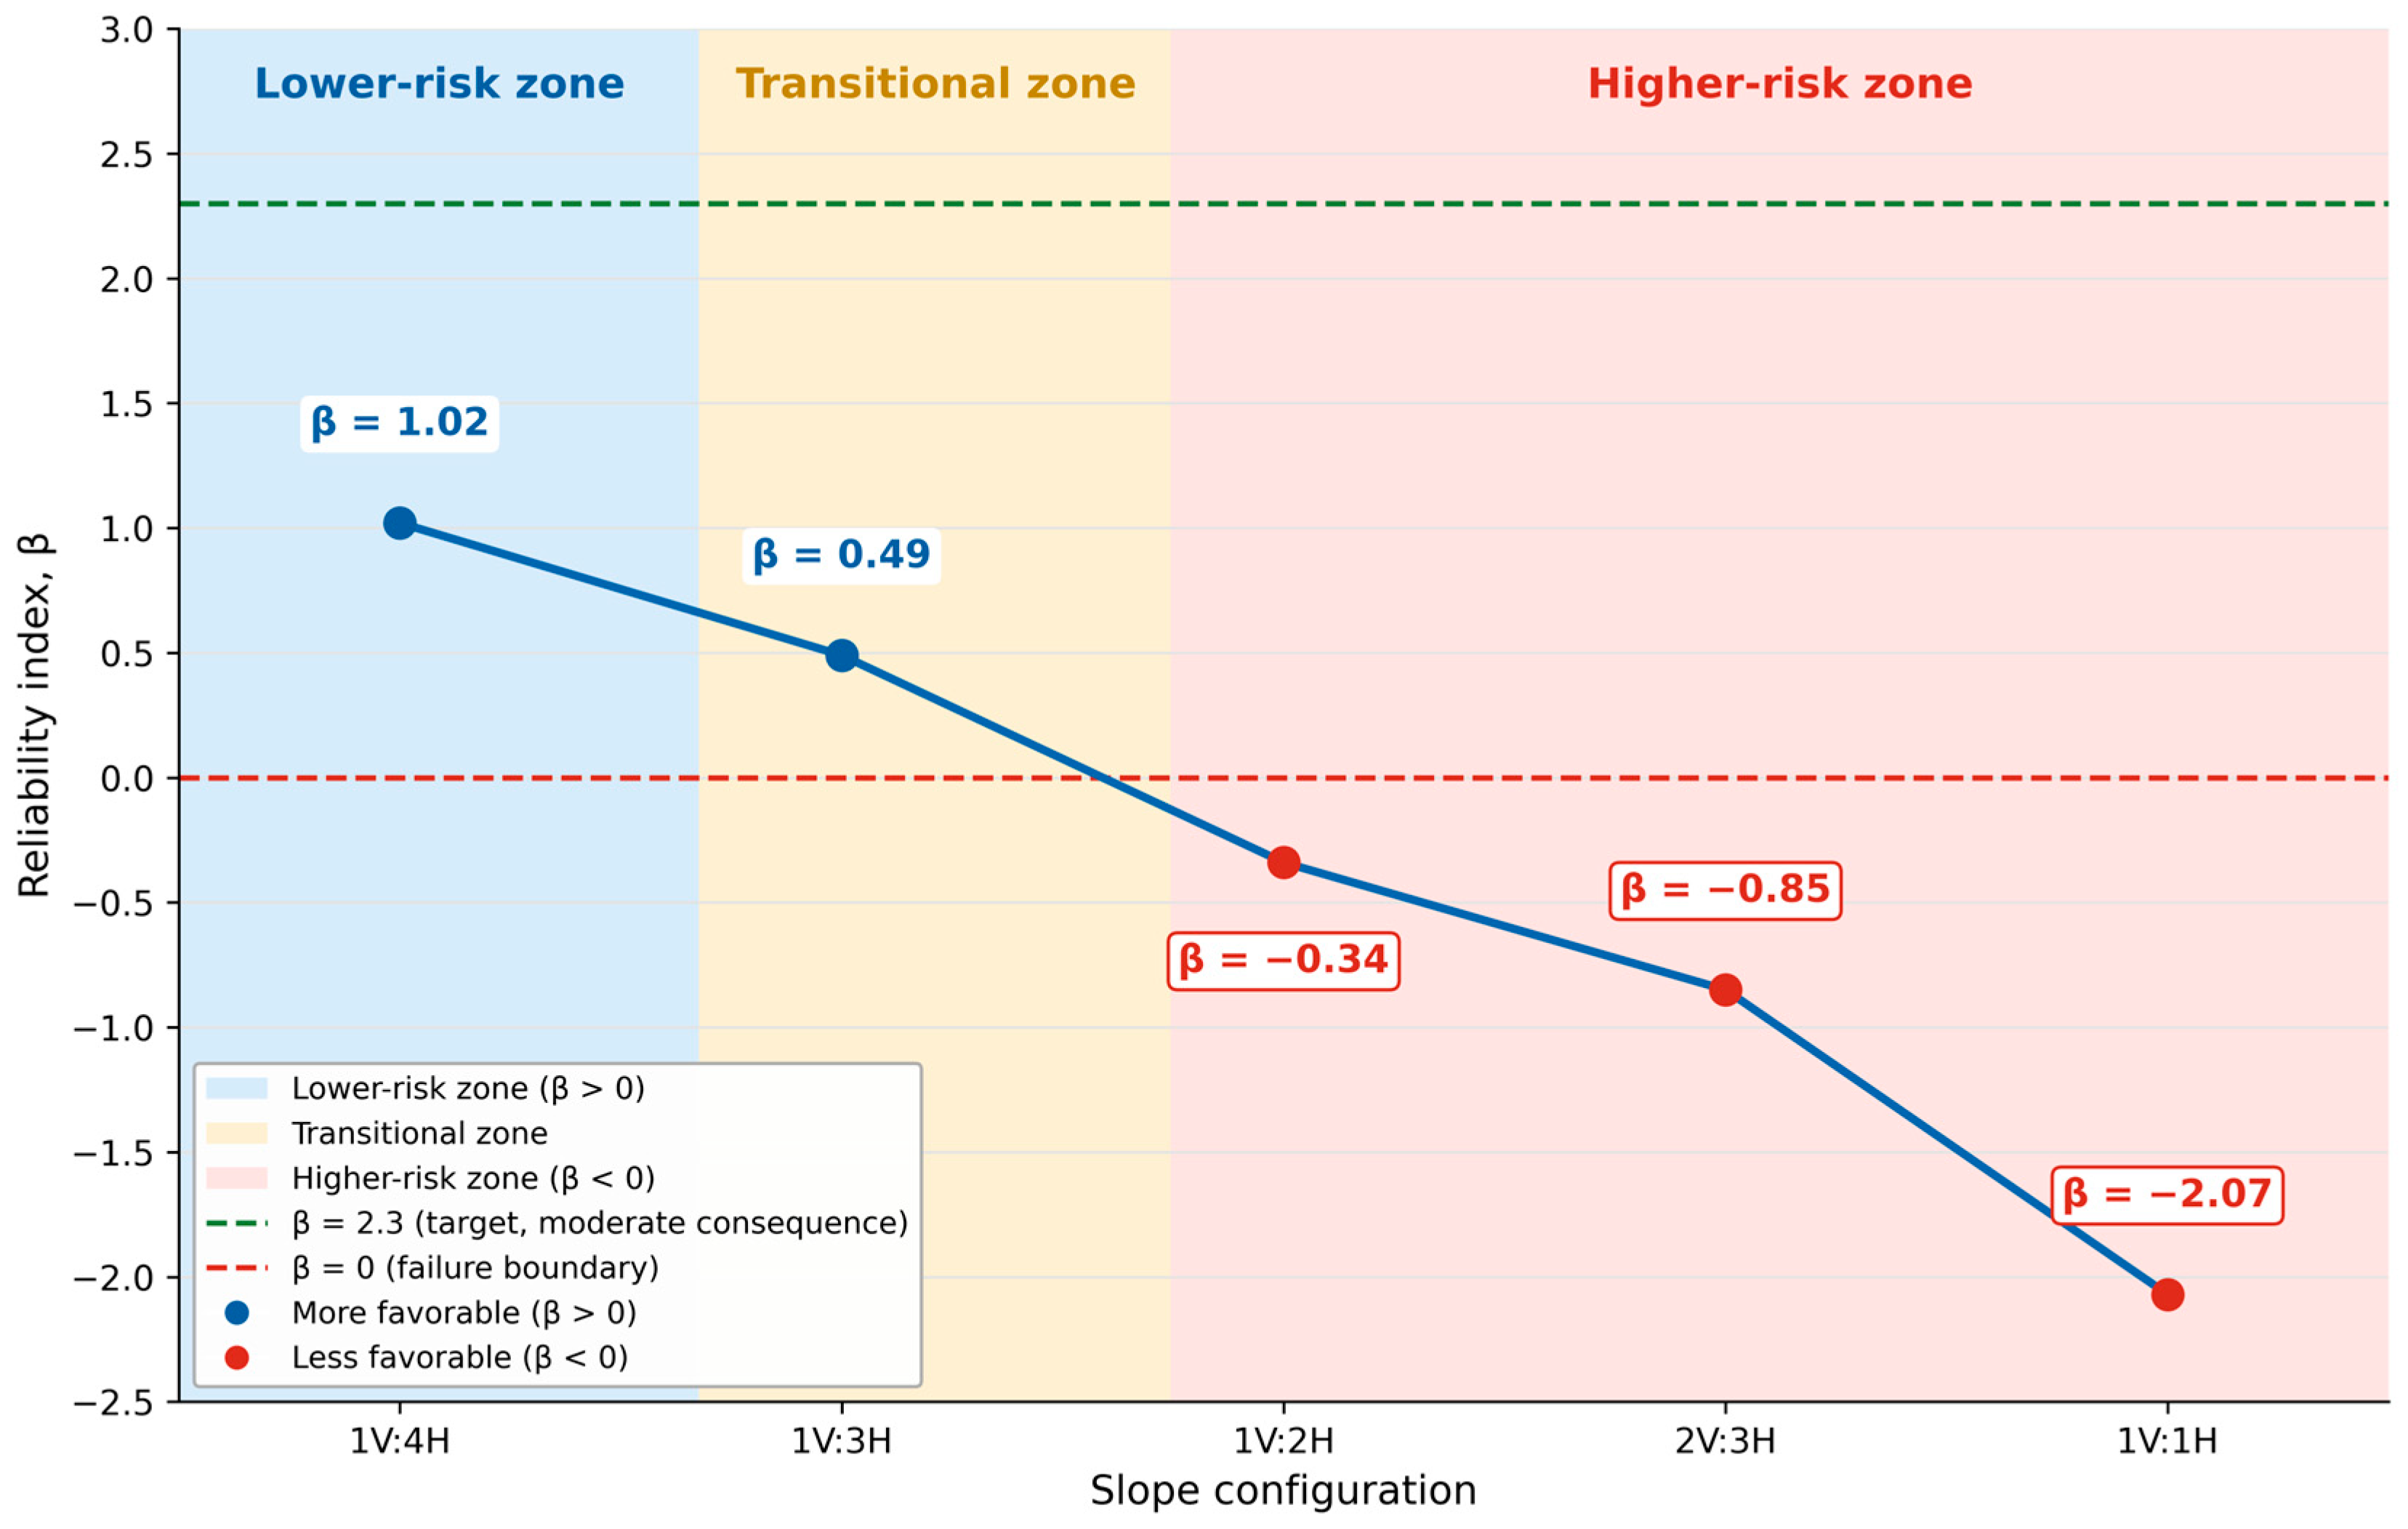
The probability of failure (Pf) and reliability index (β) computed from the Monte Carlo simulations are summarized in Table 8 and illustrated in Figure 11 and Figure 12.
Table 8.
Probabilistic stability results obtained from Monte Carlo simulations (C4).
Figure 11.
Cumulative distribution function of FOS for all slope configurations.
Figure 12.
Reliability index (β) as a function of slope ratio, together with the three proposed comparative, study-specific performance zones.
The reliability index was obtained from the estimated probability of failure using the conventional transformation β = −Φ−1(Pf). Because Pf is calculated directly from the proportion of Monte Carlo realizations with FoS < 1.0, this transformation does not require fitting a probability distribution to the simulated FoS values. The resulting β therefore provides a standardized representation of the estimated failure probability. However, β should be interpreted primarily as a transformed reliability measure in the present study, particularly for the steeper configurations where the FoS distributions exhibit pronounced positive skewness. Accordingly, Pf remains the primary probabilistic stability indicator, while β is used as a complementary measure to facilitate comparison of reliability levels among the investigated slope configurations.
The probabilistic results reveal a strongly nonlinear escalation in failure risk with increasing slope steepness. The 1V:4H configuration yields Pf = 15.4% and β = 1.02. Although all five configurations satisfy FoS ≥ 1.5 under the deterministic C1 representation, the probabilistic results reveal substantially different stability behavior [33]. For 1V:4H, the estimated failure probability is still 15.4%, indicating that satisfaction of the deterministic FoS criterion does not imply a negligible probability of failure when MSW property variability is explicitly represented. Furthermore, Table 9 reveals that 49.1% of all 1V:4H realizations produce FoS values below 1.5—the minimum recommended for MSW landfill slopes—indicating that approximately half of the probabilistic realizations fall below this reference stability level, despite the deterministic C1 factor of safety being 2.703.
Table 9.
Probability of FoS falling below key thresholds (%)—Monte Carlo results.
The 1V:3H configuration—the most widely adopted slope in landfill practice—exhibits Pf = 31.3% despite a deterministic FoS of 2.365 from C1. The relatively high failure probability obtained in the present framework may partly reflect the independent layer-wise resampling adopted in C4, which permits pronounced local contrasts in assigned MSW properties compared with approaches based on predefined depth-dependent profiles or spatially correlated random fields. This is consistent with [21,23,35], who reported similarly elevated failure probabilities when MSW spatial variability was explicitly incorporated, and with [24], who analyzed five internationally documented MSW landfill slope failures and reported that pre-failure reliability indices consistently fell below Eurocode-recommended target values despite deterministic factors of safety that appeared acceptable at the time of design.
It is important to distinguish two aspects of physical realism in the stochastic representation. At the parameter level, every sampled value used in each Monte Carlo realization is drawn directly from the compiled empirical database of literature-reported MSW properties (Section 2.3), and cohesion–friction angle pairs are sampled jointly from the same tested specimen, preserving their reported strength relationship (Section 2.4). Consequently, no individual layer in any realization is assigned a property value outside the reported literature range, nor a c–φ combination inconsistent with an actually observed waste sample; the sampled material configurations are therefore physically realistic at the level of individual properties by construction. The elevated Pf values instead arise predominantly from the spatial representation of heterogeneity—specifically, the assumption of independent layer-to-layer resampling with infinite horizontal correlation—which is explicitly identified in Section 2.4 and Section 3.3 as the most severity-maximizing assumption available within this framework and is expected to bias the resulting probability of failure upward relative to a spatially correlated representation.
A critical instability threshold is identified between 1V:3H and 1V:2H, where Pf increases by approximately 32 percentage points—the largest single-step escalation across the dataset. At 1V:2H, the mean FoS falls below unity, while Pf reaches 63.5% and β becomes negative (−0.34), indicating that more than half of the simulated realizations fall within the defined failure domain (FoS < 1.0). This transition identifies a marked change in the probabilistic stability regime between 1V:3H and 1V:2H under the heterogeneity conditions represented in C4. For configurations steeper than 1V:2H, stability deteriorates rapidly: 2V:3H yields Pf = 80.2% and β = −0.85, while 1V:1H produces Pf = 98.1% and β = −2.07, with no realization achieving a FoS exceeding 1.154.
Figure 12 further illustrates the progressive deterioration of reliability by plotting β as a function of slope configuration together with the three comparative performance zones proposed in this study. The figure clearly demonstrates that none of the investigated configurations achieves the target reliability index of β = 2.3 recommended for geotechnical structures of moderate consequence [36], highlighting the potentially substantial difference between deterministic mean-property assessments and probabilistic stability predictions when MSW property variability is explicitly represented. The crossing of the failure boundary at β = 0 between the 1V:3H and 1V:2H configurations is visually apparent, confirming the critical instability threshold identified in the probabilistic analysis. The rapid downward trajectory of β beyond this threshold—from −0.34 at 1V:2H to −2.07 at 1V:1H—highlights the highly nonlinear nature of reliability deterioration with slope steepness and reinforces the poor probabilistic stability performance of configurations steeper than 1V:3H under the MSW variability conditions modeled in this study.
The probabilistic results should therefore be interpreted within the scope of the adopted modeling assumptions, discussed in full in Section 3.3.
3.2.5. Stability–Capacity Design Framework
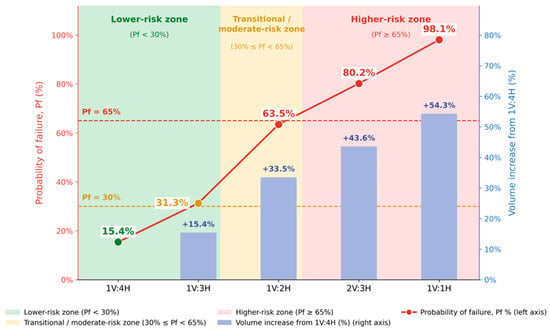
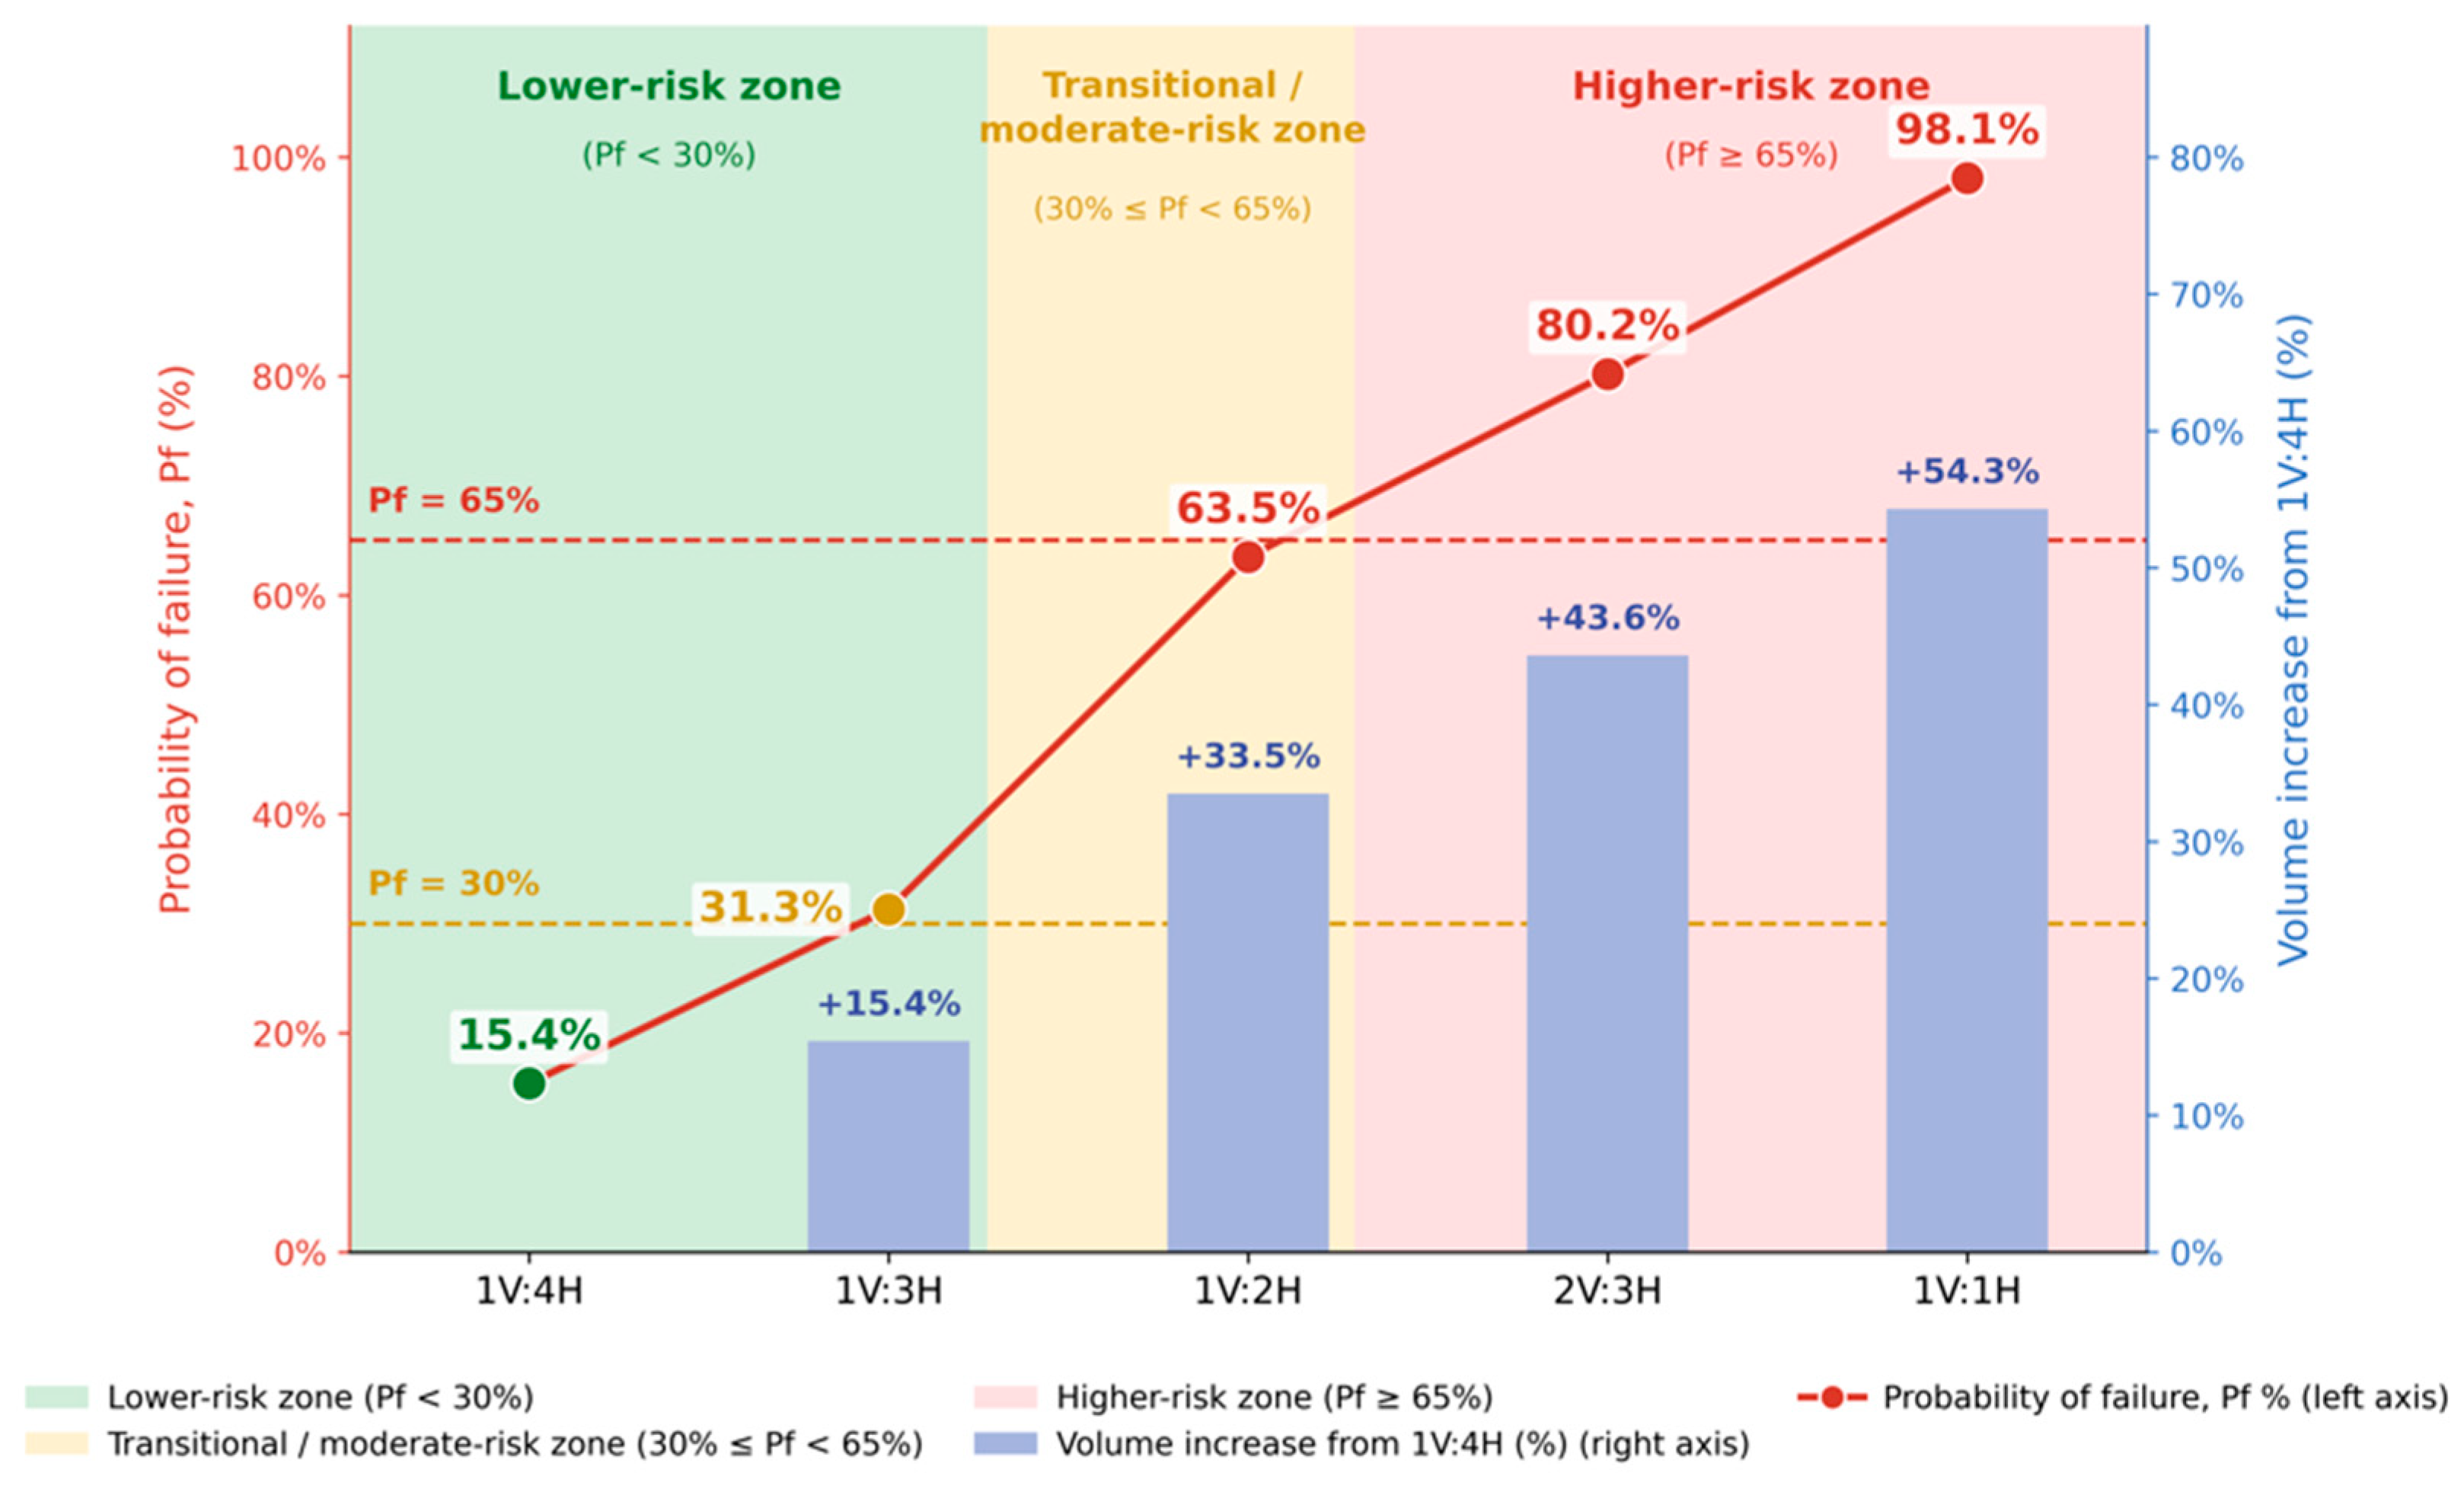
The geometric capacity and footprint results established in Section 3.1 are integrated with the probabilistic stability results from Section 3.2.4 in the stability–capacity design framework presented in Figure 13.
Figure 13.
Integrated stability–capacity design framework, mapping each slope configuration onto its probabilistic comparative, study-specific performance zones.
The framework therefore captures the fundamental design trade-off identified in this study: increasing slope steepness improves landfill storage capacity and land-use efficiency, but simultaneously increases the probability of instability under the modeled MSW variability.
Based on the probabilistic results obtained for the investigated landfill geometry and MSW variability conditions, three comparative performance zones are proposed to facilitate interpretation of the analyzed slope configurations, broadly consistent with the semi-empirical relationship between factor of safety and probability of failure proposed for general slope reliability assessment by [37]. The comparatively lower-risk zone includes the 1V:4H configuration, the transitional zone includes the 1V:3H configuration, and the comparatively higher-risk zone includes the remaining steeper configurations. These zones are intended as study-specific decision-support categories rather than universal reliability acceptance criteria. The transition is represented by the 1V:2H configuration, which exhibits Pf = 63.5%, a mean FoS below unity, and a failure probability exceeding 50%. The proposed classification therefore applies specifically to the landfill geometry, height, and MSW variability conditions investigated in this study; application to other sites requires site-specific probabilistic assessment because variations in landfill geometry, waste composition, and operational conditions may shift the observed stability transitions.
As illustrated in Figure 13, the framework directly maps each slope configuration onto its probabilistic performance zone, enabling designers to evaluate the trade-off between storage capacity, land-use efficiency, and geotechnical reliability within a unified decision-support methodology. Unlike conventional deterministic design charts based solely on a single FoS value, the proposed framework incorporates the complete probabilistic response of the landfill, thereby providing a more robust basis for risk-informed slope optimization under uncertain MSW properties.
3.3. Scope and Limitations of the Probabilistic Framework
The probabilistic results presented in this study should be interpreted within the scope of the adopted modeling assumptions. First, while real landfills are inherently heterogeneous due to variations in waste type, age, and degradation state, the specific magnitude and spatial pattern of this heterogeneity is unique to each site’s waste composition and operational history. The compiled database used in this study reflects variability across multiple different landfills and testing programs rather than the internal heterogeneity of any single site, consistent with the established distinction in the geotechnical reliability literature between generic (pooled, multi-site) property databases and site-specific characterization [38]; the resulting probability of failure is therefore conditional on this generic, multi-source database and should not be interpreted as a site-specific estimate for any individual landfill. Second, properties are assigned uniformly across the full horizontal extent of each 1 m layer, equivalent to an infinite horizontal correlation length; this precludes lateral avoidance of weak zones by the failure surface and is expected to bias the reported probability of failure toward higher values relative to a spatially correlated representation with a finite horizontal scale of fluctuation [22,24]. This limitation will be addressed in future work through the implementation of a two-dimensional (horizontal-and-vertical) zoning scheme, compared directly against the horizontal-only representation adopted here. Third, the framework does not explicitly represent operational mitigation measures such as systematic compaction, intermediate cover placement, or leachate management, which may influence in-situ MSW strength and slope stability in practice. These assumptions collectively mean that the probabilistic indicators reported in Section 3.2 should be interpreted as comparative, upper-bound estimates conditional on the adopted database and spatial representation, rather than as absolute, site-specific reliability predictions.
4. Conclusions
This study investigated the combined influence of landfill slope geometry and municipal solid waste (MSW) material heterogeneity on storage capacity and slope stability, integrating deterministic and probabilistic finite element analyses within a unified design framework. The following principal conclusions are drawn.
Geometric analyses demonstrate that steeper slope configurations offer substantial operational advantages. Increasing slope inclination from 1V:4H to 1V:1H yields a 54.3% increase in storage capacity for a fixed landfill height of 40 m, while reducing the required base area by 31.2% for a fixed disposal volume. These results confirm that slope geometry is a critical lever for capacity optimization in land-constrained landfill developments.
Among the deterministic waste characterization approaches, the coarsely layered degradation-dependent model (C2) consistently yields lower factors of safety than both the homogeneous model (C1) and the finely discretized model (C3), highlighting the sensitivity of stability predictions to the assumed depth-dependent property distribution. The close agreement between C1 and C3, with a maximum difference of less than 6%, indicates that increasing spatial resolution alone does not produce more conservative stability estimates when properties follow a systematic depth trend. Within the deterministic representations investigated, the assumed property profile appears to exert a stronger influence on the calculated FoS than the degree of discretization. This is consistent with the C1b decomposition (Section 3.2.3), which found spatial representation to be the dominant driver of the difference between the homogeneous and stochastic representations, although the C2/C3 comparison itself remains an assessment of alternative literature-derived profiles rather than a controlled isolation of discretization from property-database selection.
The probabilistic analysis (C4) produces substantially lower stability estimates than the homogeneous deterministic representation (C1), with the total reduction ranging from 46.0% (1V:4H) to 72.1% (1V:1H). Decomposition of this difference using a diagnostic homogeneous configuration evaluated at the C4 database mean (C1b) shows that the spatial representation of heterogeneity, rather than the choice of property database, is the dominant contributor across all five slope configurations (73–79% of the total difference), with the property database accounting for the remaining 21–27%. This indicates that, under the parameter database and spatial representation adopted in this study, the homogeneous mean-property representation substantially overestimates stability relative to the stochastic representation primarily because it omits the explicit representation of localized weak zones, rather than because of the specific database adopted. A critical instability transition occurs between the 1V:3H and 1V:2H configurations, where the probability of failure increases by approximately 32 percentage points, from 31.3% to 63.5%, representing the largest single-step escalation across the investigated configurations.
The statistical characterization of the Monte Carlo-derived FoS distributions provides additional insights into probabilistic stability. The coefficient of variation reaches a maximum of 49.6% for the 2V:3H configuration, identifying this slope as the most variable in the dataset. The P5 FoS values fall below unity for all five configurations, including the 1V:4H slope, demonstrating that deterministic factors of safety alone do not characterize the lower-tail behavior of the simulated stability response. Furthermore, the FoS distributions transition from approximately symmetric distributions at gentle slopes to increasingly positively skewed distributions at steeper slopes, indicating that a simple symmetric or Gaussian representation of the FoS distribution may provide an inadequate description of the simulated stability response for the steeper configurations.
A key methodological contribution of this work is the development of an automated stochastic finite element framework integrating PLAXIS 2D with Python scripting, enabling 1000 Monte Carlo simulations per slope configuration and 5000 finite element analyses in total. The framework resamples MSW properties directly from a compiled empirical literature database rather than from an assumed parametric distribution, avoiding reliance on an unsupported distributional form. Cohesion and friction angle are sampled jointly as paired values from the same tested waste sample to preserve their reported shear-strength relationship, while unit weight is sampled independently, consistent with the sampling procedure described in Section 2.4. The resulting approach provides an alternative to probabilistic formulations based on predefined smooth spatial trends and explicitly represents abrupt layer-to-layer contrasts in MSW properties. In addition, the diagnostic decomposition introduced through configuration C1b (Section 2.9) provides a transferable method for separating the influence of the adopted property database from that of the spatial representation itself, addressing a confound that is common to comparative studies of this kind and is rarely isolated in the existing literature.
The integrated stability–capacity design framework provides a decision-support approach for comparing storage capacity and probabilistic slope stability. The proposed performance zones are specific to the landfill geometry, waste characteristics, and modeling assumptions considered in this study and are intended to support comparative design decisions rather than define universal reliability acceptance criteria. Among the configurations investigated, 1V:3H represents the steepest configuration with a failure probability below 50%, providing a comparatively favorable balance between storage capacity and probabilistic stability. The steeper configurations investigated exhibit Pf > 50% under the adopted MSW variability conditions and therefore show substantially poorer probabilistic stability performance despite their greater storage capacity.
The relatively high Pf values obtained in this study should be interpreted in the context of the adopted stochastic assumptions. The framework does not explicitly represent operational mitigation measures such as systematic compaction, intermediate cover placement, and leachate management, which may influence MSW strength and slope stability in practice. Future work should investigate spatially correlated random-field formulations as additional field data become available, allowing the influence of spatial correlation length on FoS distributions and failure probabilities to be assessed. Three-dimensional modeling and seismic loading conditions also represent important directions for extending the applicability of the proposed framework.
Author Contributions
Conceptualization, R.J. and M.S.; methodology, R.J. and M.S.; software, R.J.; validation, R.J., M.E.R. and M.S.; formal analysis, R.J.; investigation, R.J.; data curation, R.J.; writing—original draft preparation, R.J.; writing—review and editing, M.E.R. and M.S.; visualization, R.J.; supervision, M.E.R. and M.S. All authors have read and agreed to the published version of the manuscript.
Funding
This research received no external funding.
Institutional Review Board Statement
Not applicable.
Informed Consent Statement
Not applicable.
Data Availability Statement
The data supporting the findings of this study, including the compiled MSW geotechnical property database and Monte Carlo simulation outputs, are available from the corresponding author upon reasonable request.
Acknowledgments
The authors acknowledge ESIB, Saint Joseph University of Beirut, and EDST, Lebanese University, for their institutional support.
Conflicts of Interest
The authors declare no conflicts of interest.
References
- Kaza, S.; Yao, L.; Bhada-Tata, P.; Van Woerden, F. What a Waste 2.0: A Global Snapshot of Solid Waste Management to 2050; World Bank Publications: Washington, DC, USA, 2018. [Google Scholar]
- Meidiana, C. Scenarios for sustainable final waste treatment in developing countries. In Waste Management—An Integrated Vision; InTech: Rijeka, Croatia, 2012; pp. 1–20. [Google Scholar]
- Gao, W.; Bian, X.C.; Xu, W.J.; Chen, Y.M. Storage capacity and slope stability analysis of municipal solid waste landfills. J. Perform. Constr. Facil. 2018, 32, 04018036. [Google Scholar] [CrossRef] [Scilit]
- Al-Taie, L.; Al-Ansari, N.; Knutsson, S. Stability of MSW landfill slopes reinforced with geogrids. Appl. Sci. 2022, 12, 11866. [Google Scholar] [CrossRef] [Scilit]
- Koelsch, F.; Fricke, K.; Mahler, C.; Damanhuri, E. Stability of landfills—The Bandung dumpsite disaster. In Proceedings of the Sardinia 2005, 10th International Waste Management and Landfill Symposium, Cagliari, Italy, 3–7 October 2005. [Google Scholar]
- Eid, H.T.; Stark, T.D.; Evans, W.B.; Sherry, P.E. Municipal Solid Waste Slope Failure. I: Waste and Foundation Soil Properties. J. Geotech. Geoenviron. Eng. 2000, 126, 397–407. [Google Scholar] [CrossRef] [Scilit]
- Stark, T.D.; Eid, H.T.; Evans, W.D.; Sherry, P.E. Municipal Solid Waste Slope Failure. II: Stability Analyses. J. Geotech. Geoenviron. Eng. 2000, 126, 408–419. [Google Scholar] [CrossRef] [Scilit]
- Blight, G.E. Slope failures in municipal solid waste dumps and landfills: A review. Waste Manag. Res. 2008, 26, 448–463. [Google Scholar] [CrossRef] [Scilit] [PubMed]
- Koerner, R.M.; Soong, T.Y. Stability assessment of ten large landfill failures. In Advances in Transportation and Geoenvironmental Systems Using Geosynthetics; ASCE: Reston, VA, USA, 2000; pp. 1–38. [Google Scholar] [CrossRef] [Scilit]
- Zhan, T.L.; Chen, Y.M.; Ling, W.A. Shear strength characterization of municipal solid waste at the Suzhou landfill, China. Eng. Geol. 2008, 97, 97–111. [Google Scholar] [CrossRef] [Scilit]
- Jahanfar, A.; Amirmojahedi, M.; Gharabaghi, B.; Dubey, B.; McBean, E.; Kumar, D. A novel risk assessment method for landfill slope failure: Case study application for Bhalswa Dumpsite, India. Waste Manag. Res. 2017, 35, 220–227. [Google Scholar] [CrossRef] [Scilit] [PubMed]
- Dixon, N.; Jones, D.R.V. Engineering properties of municipal solid waste. Geotext. Geomembr. 2005, 23, 205–233. [Google Scholar] [CrossRef] [Scilit]
- Bray, J.D.; Zekkos, D.; Kavazanjian, E.; Athanasopoulos, G.A.; Riemer, M.F. Shear strength of municipal solid waste. J. Geotech. Geoenviron. Eng. 2009, 135, 709–722. [Google Scholar] [CrossRef] [Scilit]
- Reddy, K.R.; Hettiarachchi, H.; Gangathulasi, J.; Bogner, J.E. Geotechnical properties of municipal solid waste at different phases of biodegradation. Waste Manag. 2011, 31, 2275–2286. [Google Scholar] [CrossRef] [Scilit] [PubMed]
- Bareither, C.A.; Benson, C.H.; Edil, T.B. Effects of waste composition and decomposition on the shear strength of municipal solid waste. J. Geotech. Geoenviron. Eng. 2012, 138, 1161–1174. [Google Scholar] [CrossRef] [Scilit]
- Feng, S.J.; Chen, Z.W.; Chen, H.X.; Zheng, Q.T.; Liu, R. Slope stability of landfills considering leachate recirculation using vertical wells. Eng. Geol. 2018, 241, 76–85. [Google Scholar] [CrossRef] [Scilit]
- Christian, J.T.; Ladd, C.C.; Baecher, G.B. Reliability applied to slope stability analysis. J. Geotech. Eng. 1994, 120, 2180–2207. [Google Scholar] [CrossRef] [Scilit]
- Fenton, G.A.; Griffiths, D.V. Risk Assessment in Geotechnical Engineering; John Wiley & Sons: New York, NY, USA, 2008. [Google Scholar] [CrossRef] [Scilit]
- Griffiths, D.V.; Lane, P.A. Slope stability analysis by finite elements. Géotechnique 1999, 49, 387–403. [Google Scholar] [CrossRef] [Scilit]
- Duncan, J.M. Factors of safety and reliability in geotechnical engineering. J. Geotech. Geoenviron. Eng. 2000, 126, 307–316. [Google Scholar] [CrossRef] [Scilit]
- Babu, G.L.S.; Reddy, K.R.; Srivastava, A. Influence of spatially variable geotechnical properties of MSW on stability of landfill slopes. J. Hazard. Toxic. Radioact. Waste 2014, 18, 27–37. [Google Scholar] [CrossRef] [Scilit]
- Mehdizadeh, M.J.; Shariatmadari, N.; Karimpour-Fard, M. Effects of anisotropy in correlation structure on reliability-based slope stability analysis of a landfill. Waste Manag. Res. 2020, 39, 300–309. [Google Scholar] [CrossRef] [Scilit] [PubMed]
- Ghasemian, A.; Karimpour-Fard, M.; Nadi, B. Reliability analysis and risk assessment of a landfill slope failure in spatially variable municipal solid waste. Int. J. Environ. Sci. Technol. 2024, 21, 7585–7602. [Google Scholar] [CrossRef] [Scilit]
- Dodigović, F.; Ivandić, K.; Bek, A.; Jug, J. Analyzing MSW landfill failures: Stability and reliability evaluations from five international case studies. Geotechnics 2024, 4, 824–842. [Google Scholar] [CrossRef] [Scilit]
- Zekkos, D.; Bray, J.D.; Athanasopoulos, G.A.; Riemer, M.F.; Kavazanjian, E.; Founta, P.; Grizi, A. Framework for the estimation of MSW unit weight profile. In Proceedings of the Sardinia 2005, 10th International Waste Management and Landfill Symposium, Cagliari, Italy, 3–7 October 2005; pp. 3–7. [Google Scholar]
- Hossain, M.S.; Haque, M.A. Stability analyses of municipal solid waste landfills with decomposition. Geotech. Geol. Eng. 2009, 27, 659–666. [Google Scholar] [CrossRef] [Scilit]
- Shariatmadari, N.; Sadeghpour, A.H.; Mokhtari, M.J. Aging effect on physical properties of municipal solid waste at the Kahrizak Landfill, Iran. Int. J. Civ. Eng. 2015, 13, 126–136. [Google Scholar] [CrossRef] [Scilit]
- Griffiths, D.V.; Fenton, G.A. Probabilistic slope stability analysis by finite elements. J. Geotech. Geoenviron. Eng. 2004, 130, 507–518. [Google Scholar] [CrossRef] [Scilit]
- Ji, J.; Liao, H.J.; Low, B.K. Modeling 2-D spatial variation in slope reliability analysis using interpolated autocorrelations. Comput. Geotech. 2012, 40, 135–146. [Google Scholar] [CrossRef] [Scilit]
- Xia, Y.X.; Cheng, P.; Liu, M.M.; Hu, J. Numerical modeling of 3D slopes with weak zones by random field and finite elements. Appl. Sci. 2021, 11, 9852. [Google Scholar] [CrossRef] [Scilit]
- Agbaje, S.; Zhang, X.; Patelli, E.; Ward, D.; Dhimitri, L. Random field failure and post-failure analyses of vertical slopes in soft clays. Comput. Geotech. 2024, 166, 106037. [Google Scholar] [CrossRef] [Scilit]
- Bentley Systems. PLAXIS 2D Reference Manual; Bentley Systems International: Exton, PA, USA, 2022. [Google Scholar]
- Zhang, X.; Agbaje, S.; Patelli, E. Finite element slope stability analysis with strength reduction method. Comput. Geotech. 2023, 155, 105208. [Google Scholar] [CrossRef] [Scilit]
- Phoon, K.K.; Kulhawy, F.H. Characterization of geotechnical variability. Can. Geotech. J. 1999, 36, 612–624. [Google Scholar] [CrossRef] [Scilit]
- Karimpour-Fard, M.; Ghasemian, A.; Nadi, B. Probabilistic slope stability analysis in Kahrizak landfill: Effect of spatial variation of MSW’s geotechnical properties. Bull. Eng. Geol. Environ. 2020, 79, 2679–2695. [Google Scholar] [CrossRef] [Scilit]
- U.S. Army Corps of Engineers. Introduction to Probability and Reliability Methods for Use in Geotechnical Engineering; Engineering Technical Letter No. 1110-2-547; Department of the Army: Washington, DC, USA, 1997. [Google Scholar]
- Silva, F.; Lambe, T.W.; Marr, W.A. Probability and risk of slope failure. J. Geotech. Geoenviron. Eng. 2008, 134, 1691–1699. [Google Scholar] [CrossRef] [Scilit]
- Ching, J.; Wu, S.; Phoon, K.K. Constructing quasi-site-specific multivariate probability distribution using hierarchical Bayesian model. J. Eng. Mech. 2021, 147, 04021075. [Google Scholar] [CrossRef] [Scilit]

Disclaimer/Publisher’s Note: The statements, opinions and data contained in all publications are solely those of the individual author(s) and contributor(s) and not of MDPI and/or the editor(s). MDPI and/or the editor(s) disclaim responsibility for any injury to people or property resulting from any ideas, methods, instructions or products referred to in the content. |
© 2026 by the authors. Licensee MDPI, Basel, Switzerland. This article is an open access article distributed under the terms and conditions of the Creative Commons Attribution (CC BY) license.