


Abstract
Identifying suitable local materials for civil engineering is a key challenge for geotechnical engineers. This study characterises the physico-mechanical properties of Taza marl-limestone (Morocco), focusing on the correlation between uniaxial compressive strength (UCS) and non-destructive tests. Twenty-eight samples from various sites underwent physical, mineralogical and mechanical tests. UCS showed a strong positive correlation with P-wave velocity, Vp (R2 = 0.95; internal leave-one-out cross-validated Q2 = 0.94, RMSE = 2.8 MPa) and a moderate correlation with Schmidt rebound hardness (R2 = 0.79; Q2 = 0.75, RMSE = 5.6 MPa). Eleven published UCS–Vp equations gave much larger errors on the same specimens (RMSE ≥ 11 MPa), partly because the Taza data lie outside their calibration ranges; they therefore cannot be transferred to this material without recalibration. The average CaCO3 content is 75.07%. Degradability and fragmentability tests classified the samples, informing long-term behaviour under mechanical and hydric stress. Within the calibrated ranges, these site-specific correlations enable a preliminary non-destructive evaluation of intact Taza marl-limestone and may support local-material use and field-investigation optimisation. However, predictive performance was only internally cross-validated, and the specimens could not be traced to individual outcrops; independent validation (new specimens, other locations, field and moisture conditions) is therefore required before wider use.
1. Introduction
Marl-limestone, a sedimentary rock formed from the accumulation of calcium carbonate shells and marine organism remains, is a composite material consisting of clay minerals and calcium carbonate. Marl, defined by the American Geological Institute as a fine-grained, unconsolidated sedimentary rock that is often rich in water, is frequently associated with limestone, which is primarily composed of calcium carbonate in the form of calcite or aragonite [1,2]. These rocks typically form in shallow marine environments and are valued for their durability, versatility and widespread availability, which makes them a key resource for construction and building materials [3,4,5,6].
The use of this rock extends beyond traditional construction: studies have highlighted its potential for cement production and for the heavy clay industry, for which favourable results have been reported for 83% of the materials tested [4,5,7]. Its use as a fill material, particularly in road base construction, has also been widely documented, although its sensitivity to thermal cycling must still be taken into account [8,9,10].
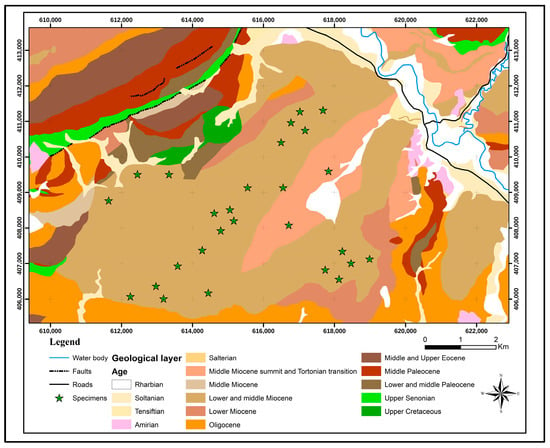
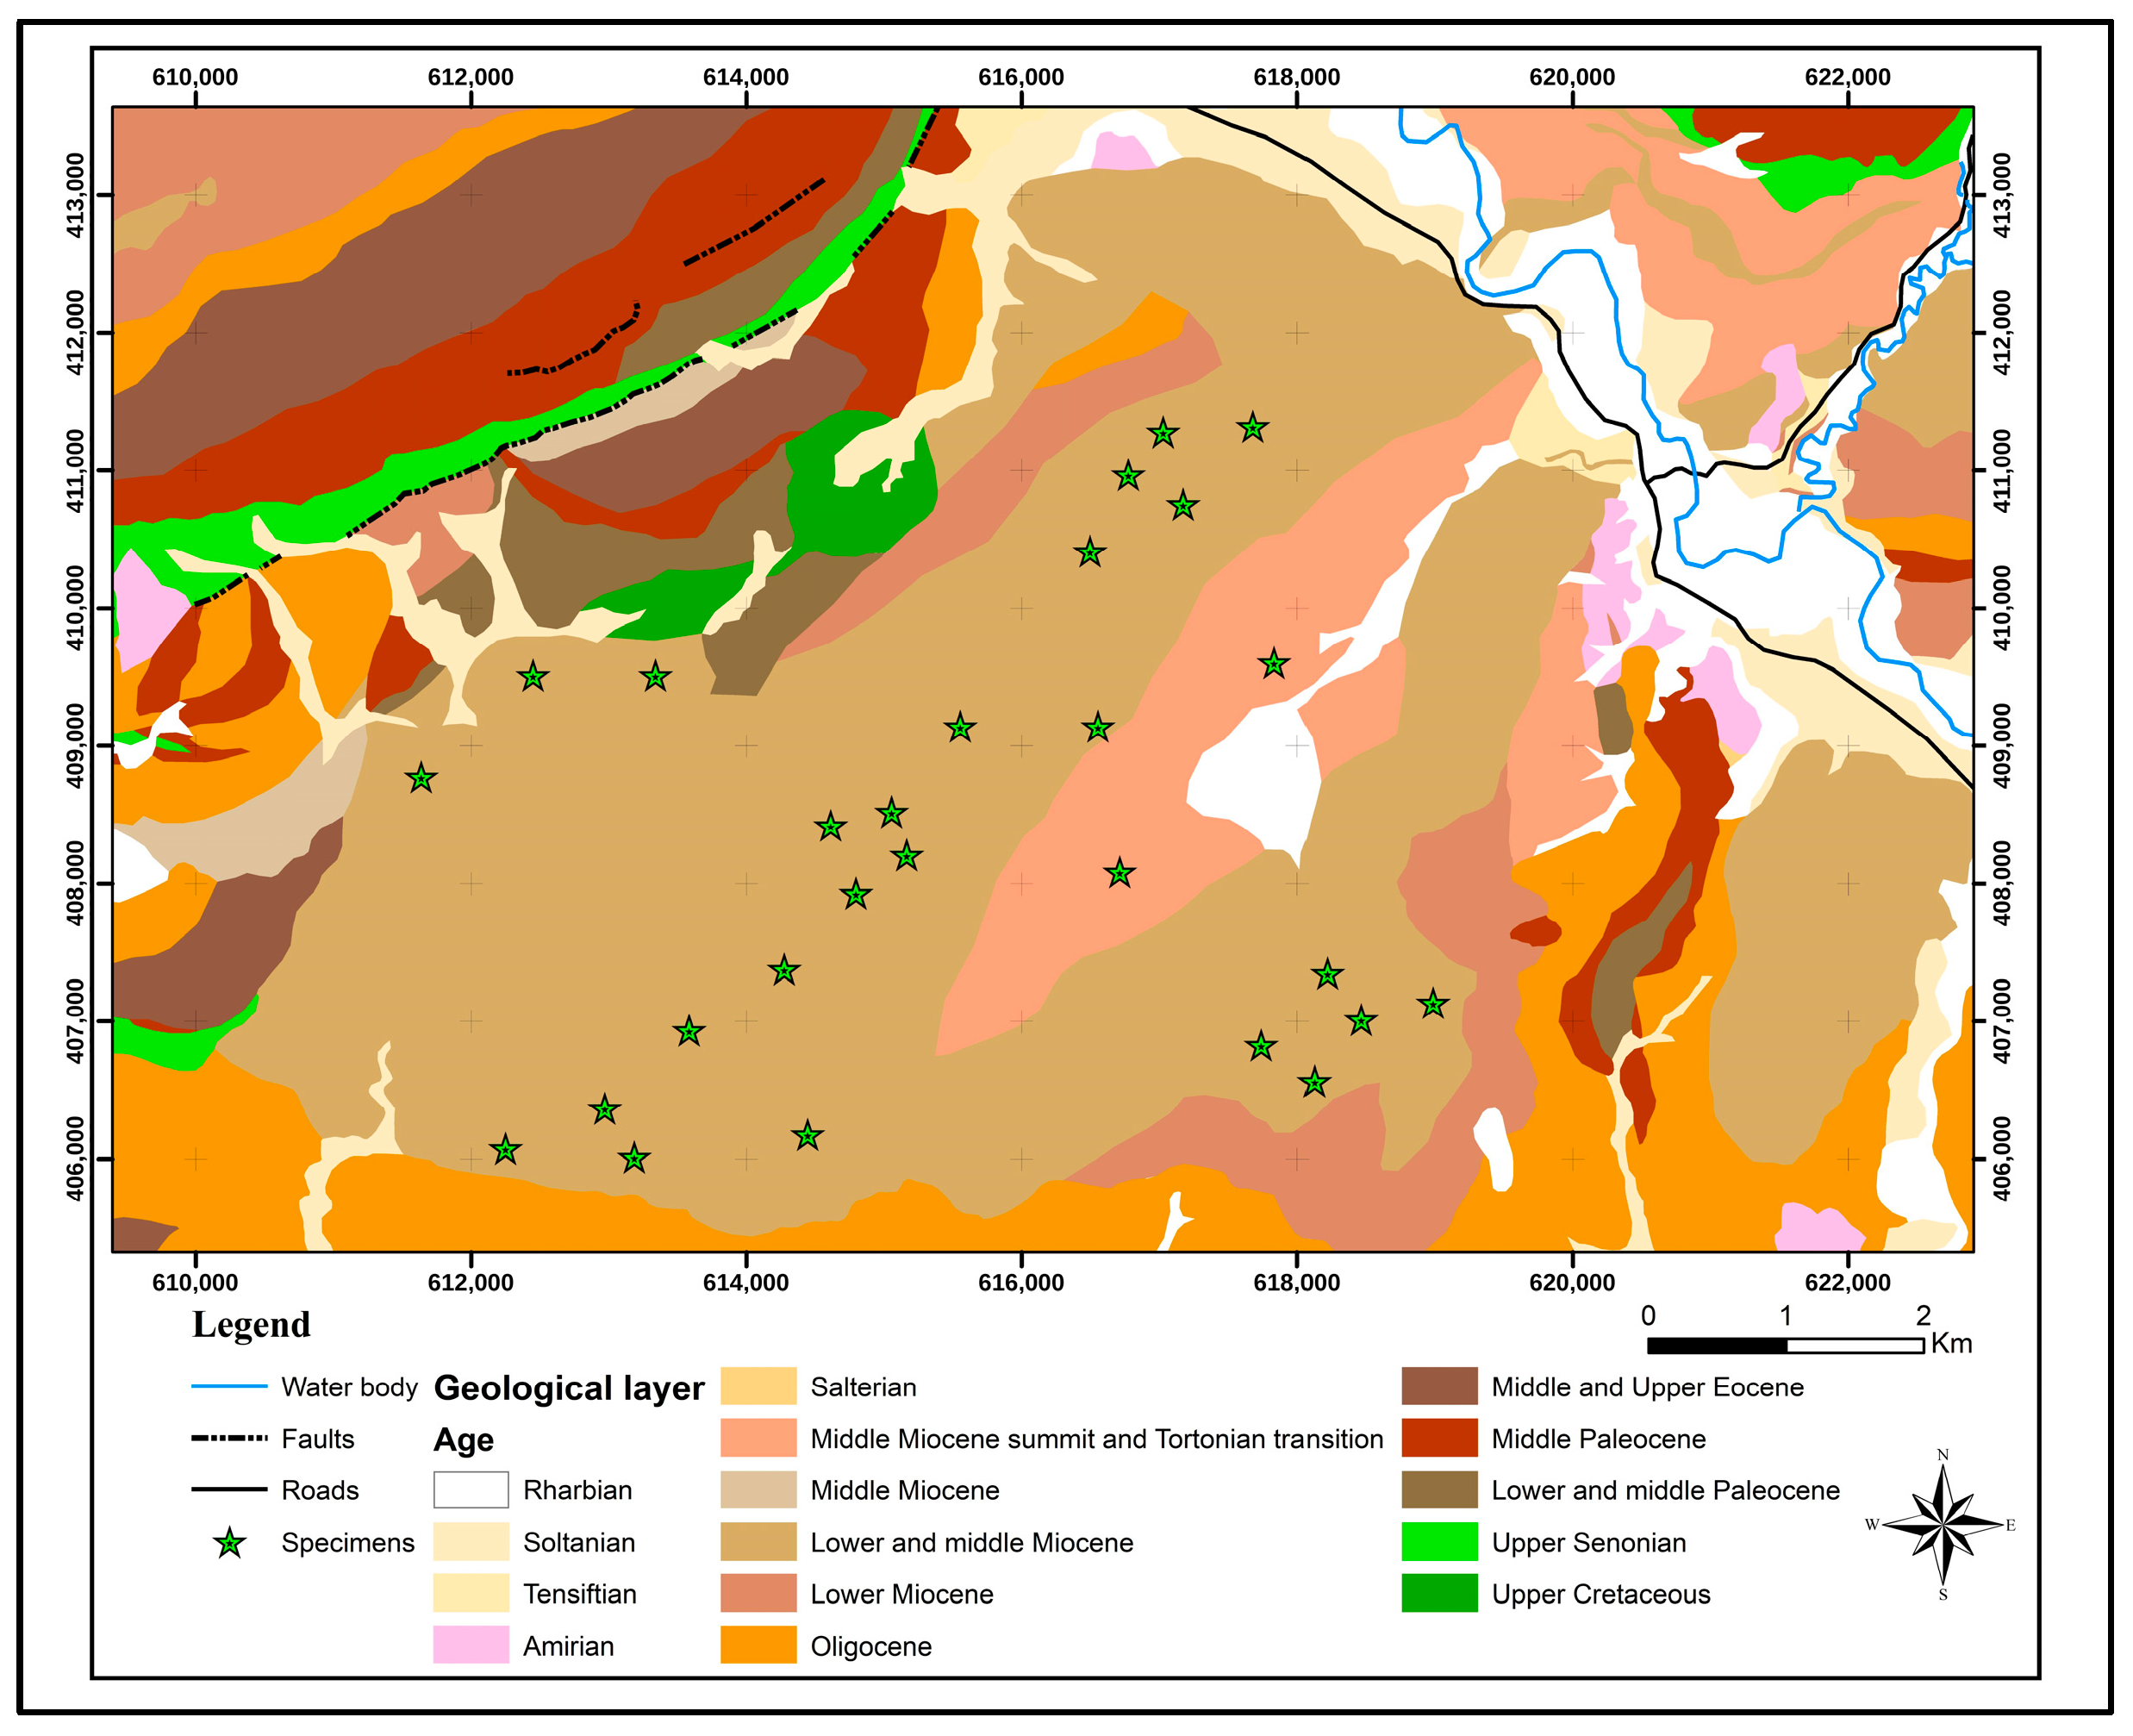
Marl-limestone is abundant in the Taza region of Morocco, as shown in the geological map of the study area (Figure 1). Despite its widespread presence and relevance in civil engineering projects, the mechanical and chemical properties of this rock in the region have not been systematically characterised, leaving a critical gap in the understanding of this locally available material. Recently, the potential use of these materials has attracted considerable interest owing to their prevalence and importance in civil engineering projects [9,11].
Figure 1.
Geological map of the study area and specimen locations.
Unlike previous correlation studies, which almost exclusively address pure limestones, the present work targets a clay-bearing marl-limestone. The presence of clay minerals (muscovite and vermiculite) and the resulting sensitivity to water may alter its physico-mechanical behaviour, so that correlations established for purer carbonates may not be directly transferable. To the best of the authors’ knowledge, no UCS–NDT correlation has previously been calibrated for the Taza marl-limestone. The present study addresses this gap and tests quantitatively (Section 4.9) whether published equations, mostly calibrated on purer limestones, can be transferred to this material while distinguishing poor transferability from errors caused by extrapolation outside their original calibration ranges.
Mechanical characterisation nevertheless remains an essential step in determining the physical characteristics of this rock. Abd El Aal et al. [12] showed that emergence cycles result in the deposition of clastic sediments, whereas submergence cycles lead to carbonate deposition, which affects porosity and strength. The empirical equations derived from their analysis help to predict rock properties and support reservoir modelling in similar geological settings.
Non-destructive methods, such as P-wave velocity and the Schmidt hammer tests, are used because they are easy and quick to perform. Several authors have used these methods to study the relationship between mechanical properties and non-destructive test results, and the resulting empirical equations have different coefficients of determination. Jamshidi et al. [13] examined the correlations of P-wave velocity and Schmidt hardness with the mechanical properties of marl-limestone and showed that P-wave velocity provides more reliable estimates than Schmidt hardness. Azarafza et al. [14] showed a consistent correlation between geological classes and the Schmidt hammer rebound index, which enabled an empirical rock mass classification of the South Pars marls (SPM). Arman [15] confirmed strong correlations between Vp and the physical and mechanical properties of limestone; comparison with previous studies confirmed the accuracy of these equations and showed that Vp can effectively predict various limestone properties, offering a quick, easy, economical and non-destructive test method. Such tests allow correlations with mechanical test results, in line with the recommendation of the International Society for Rock Mechanics (ISRM) to include non-destructive methods in its suggested methods [16,17].
A large body of the literature has proposed single-variable regressions between UCS and Vp or Schmidt rebound hardness for carbonate and other rocks [13,15,18,19,20,21,22,23,24,25,26,27,28,29,30]. These simple methods remain attractive in practice, although multiple-regression and soft-computing approaches generally give better estimates when larger datasets are available [31]. The coefficients of the published equations differ widely because they depend on lithology, porosity, clay content, weathering degree and moisture condition, as well as on the testing configuration (e.g., L- or N-type hammer, specimen size) [31,32]. Consequently, an empirical equation is only valid within the domain of the data from which it was derived, and its transfer to another material should be verified against independent measurements using prediction-error metrics (RMSE, MAE, bias) and cross-validation, rather than by comparing original R2 values [31]. Recent studies on limestones and carbonate rocks have confirmed these trends while placing more emphasis on predictive validation [15,33,34,35]: Jamshidi et al. [33] showed for Asmari limestones that combining Vp and Schmidt hardness in a multiple regression improves the prediction of UCS and tested their equations against data from other studies using RMSE; Khemis et al. [34] developed a multivariate UCS–Vp–Schmidt model for limestones from Annaba (Algeria), assessed with RMSE, MAE and residual analysis; and Fereidooni et al. [35] predicted the UCS of carbonate rocks from non-destructive tests with stacking ensemble machine-learning models tuned by k-fold cross-validation. By contrast, equations established specifically on marls remain scarce [36,37], and their transferability to clay-bearing marl-limestones has not been examined.
In this study, 28 core and block samples were analysed through a series of laboratory tests, namely X-ray diffraction (XRD), scanning electron microscopy (SEM), degradability tests [38], fragmentability tests [39], identification tests [40,41] and uniaxial compressive strength (UCS) tests [16], together with non-destructive ultrasonic P-wave velocity [16] and the Schmidt hammer rebound tests [16,32,42]. Both P-wave velocity and Schmidt rebound hardness showed a strong positive correlation with UCS: in general, higher P-wave velocities and rebound values indicate a higher UCS of the Taza marl-limestone.
The findings improve the understanding of the behaviour of Taza marl-limestone under mechanical stress and provide site-specific empirical correlations that may help to streamline preliminary site reconnaissance. Within their calibration range, these results can support the preliminary assessment of this locally sourced material for civil engineering applications. The study thus contributes to more sustainable and cost-effective construction practices in Morocco and provides a basis for future research on regional materials.
2. Provenance of Materials and Context of the Study Area
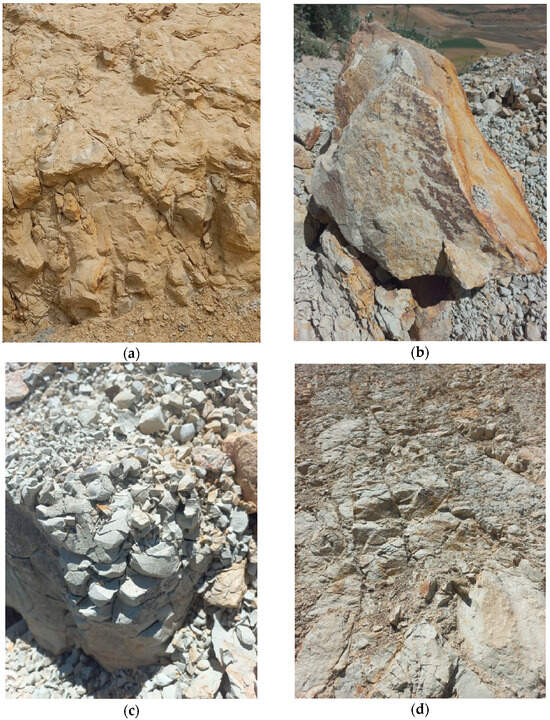
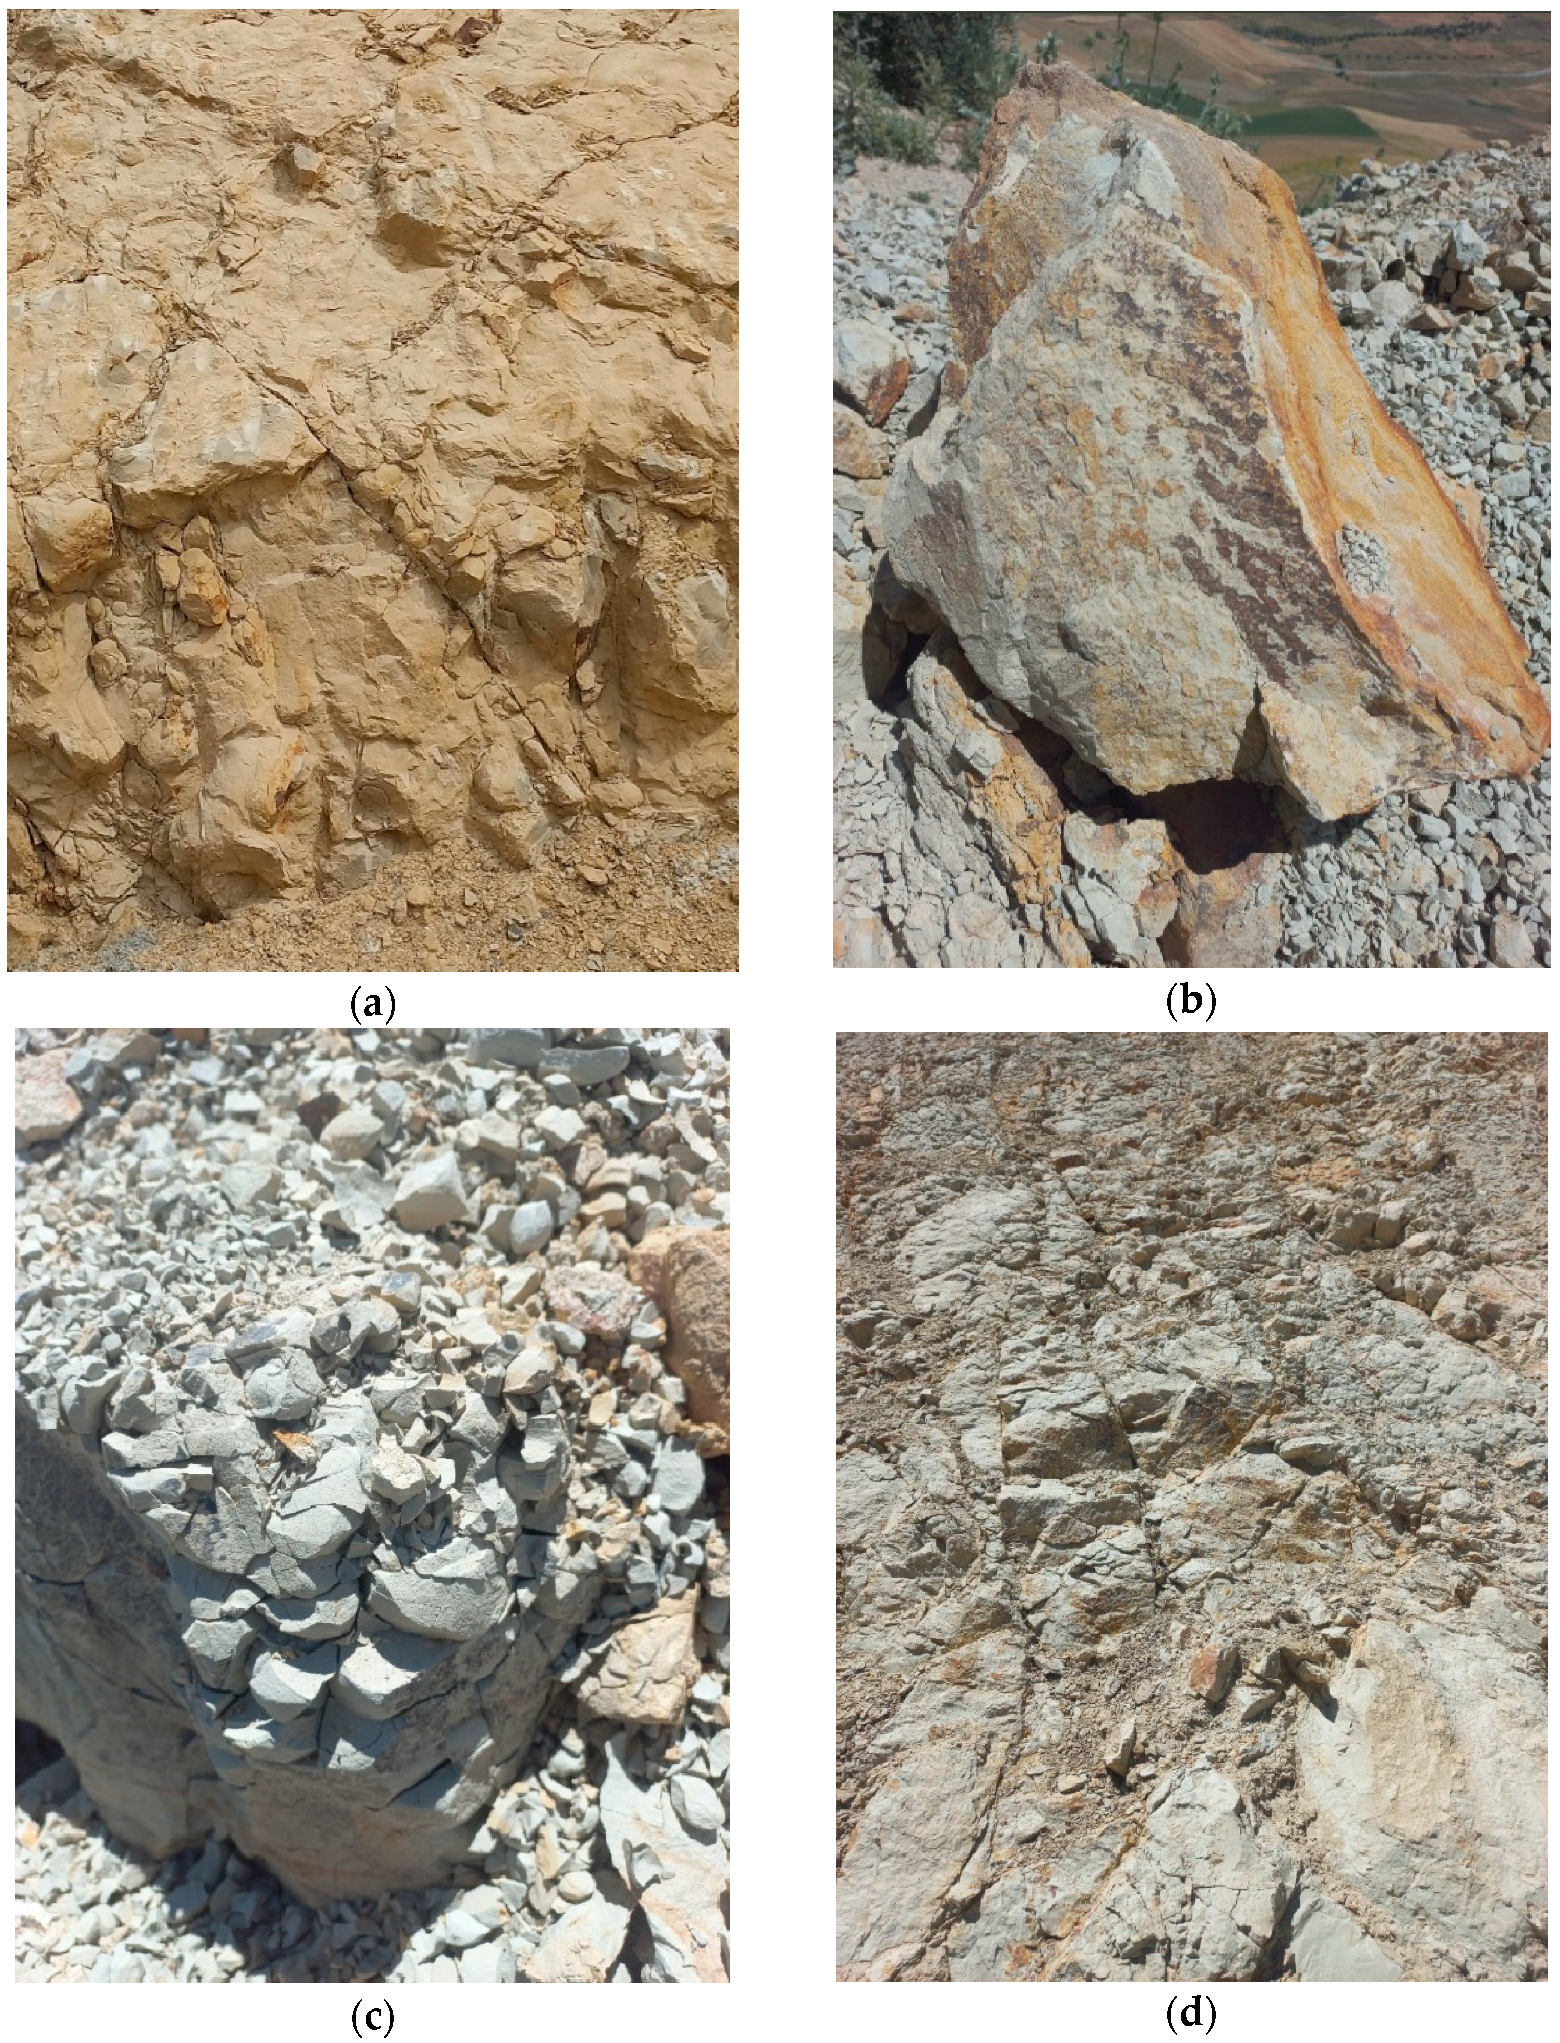
This study investigates marl-limestone materials from the Taza region, located in north-eastern Morocco. The samples were collected from the Taza corridor, a narrow east–west trough bordered by the Middle Atlas and the Tazekka Massif to the south and by the Prerifan Complex to the north [9]. The corridor narrows at the Touaher Pass, 20 km west of Taza, marking a natural boundary between eastern and western Morocco [7,17]. Geologically, the area forms the interface between the Atlas Domain in the south and the Rif Domain in the north. The region contains marl and molasse formations typical of the Sud Rifain trench [7]. Figure 1 shows the geological map of the study area, and Figure 2 illustrates the diversity of outcrops observed in the field: sloping marl-limestone facies, hard facies unaffected by weathering, weathered surfaces, and sloping facies affected by rainfall and surface runoff.
Figure 2.
Field photographs of marl-limestone outcrops in the Taza region. (a) Sloping marl-limestone facies. (b) Hard site marl-limestone facies unaffected by weathering. (c) Marl-limestone surface rock affected by weathering. (d) Sloping marl-limestone facies affected by rainfall and surface runoff.
3. Materials and Methods
3.1. Experimental Programme
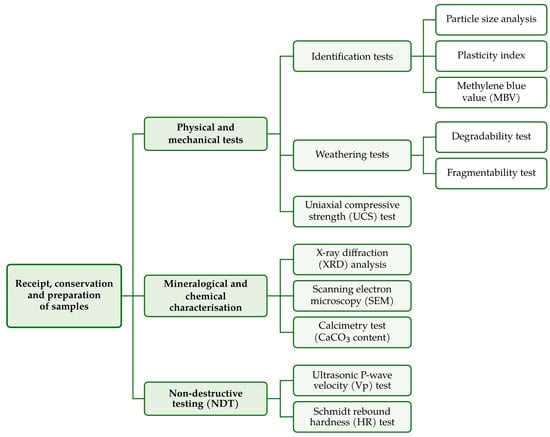
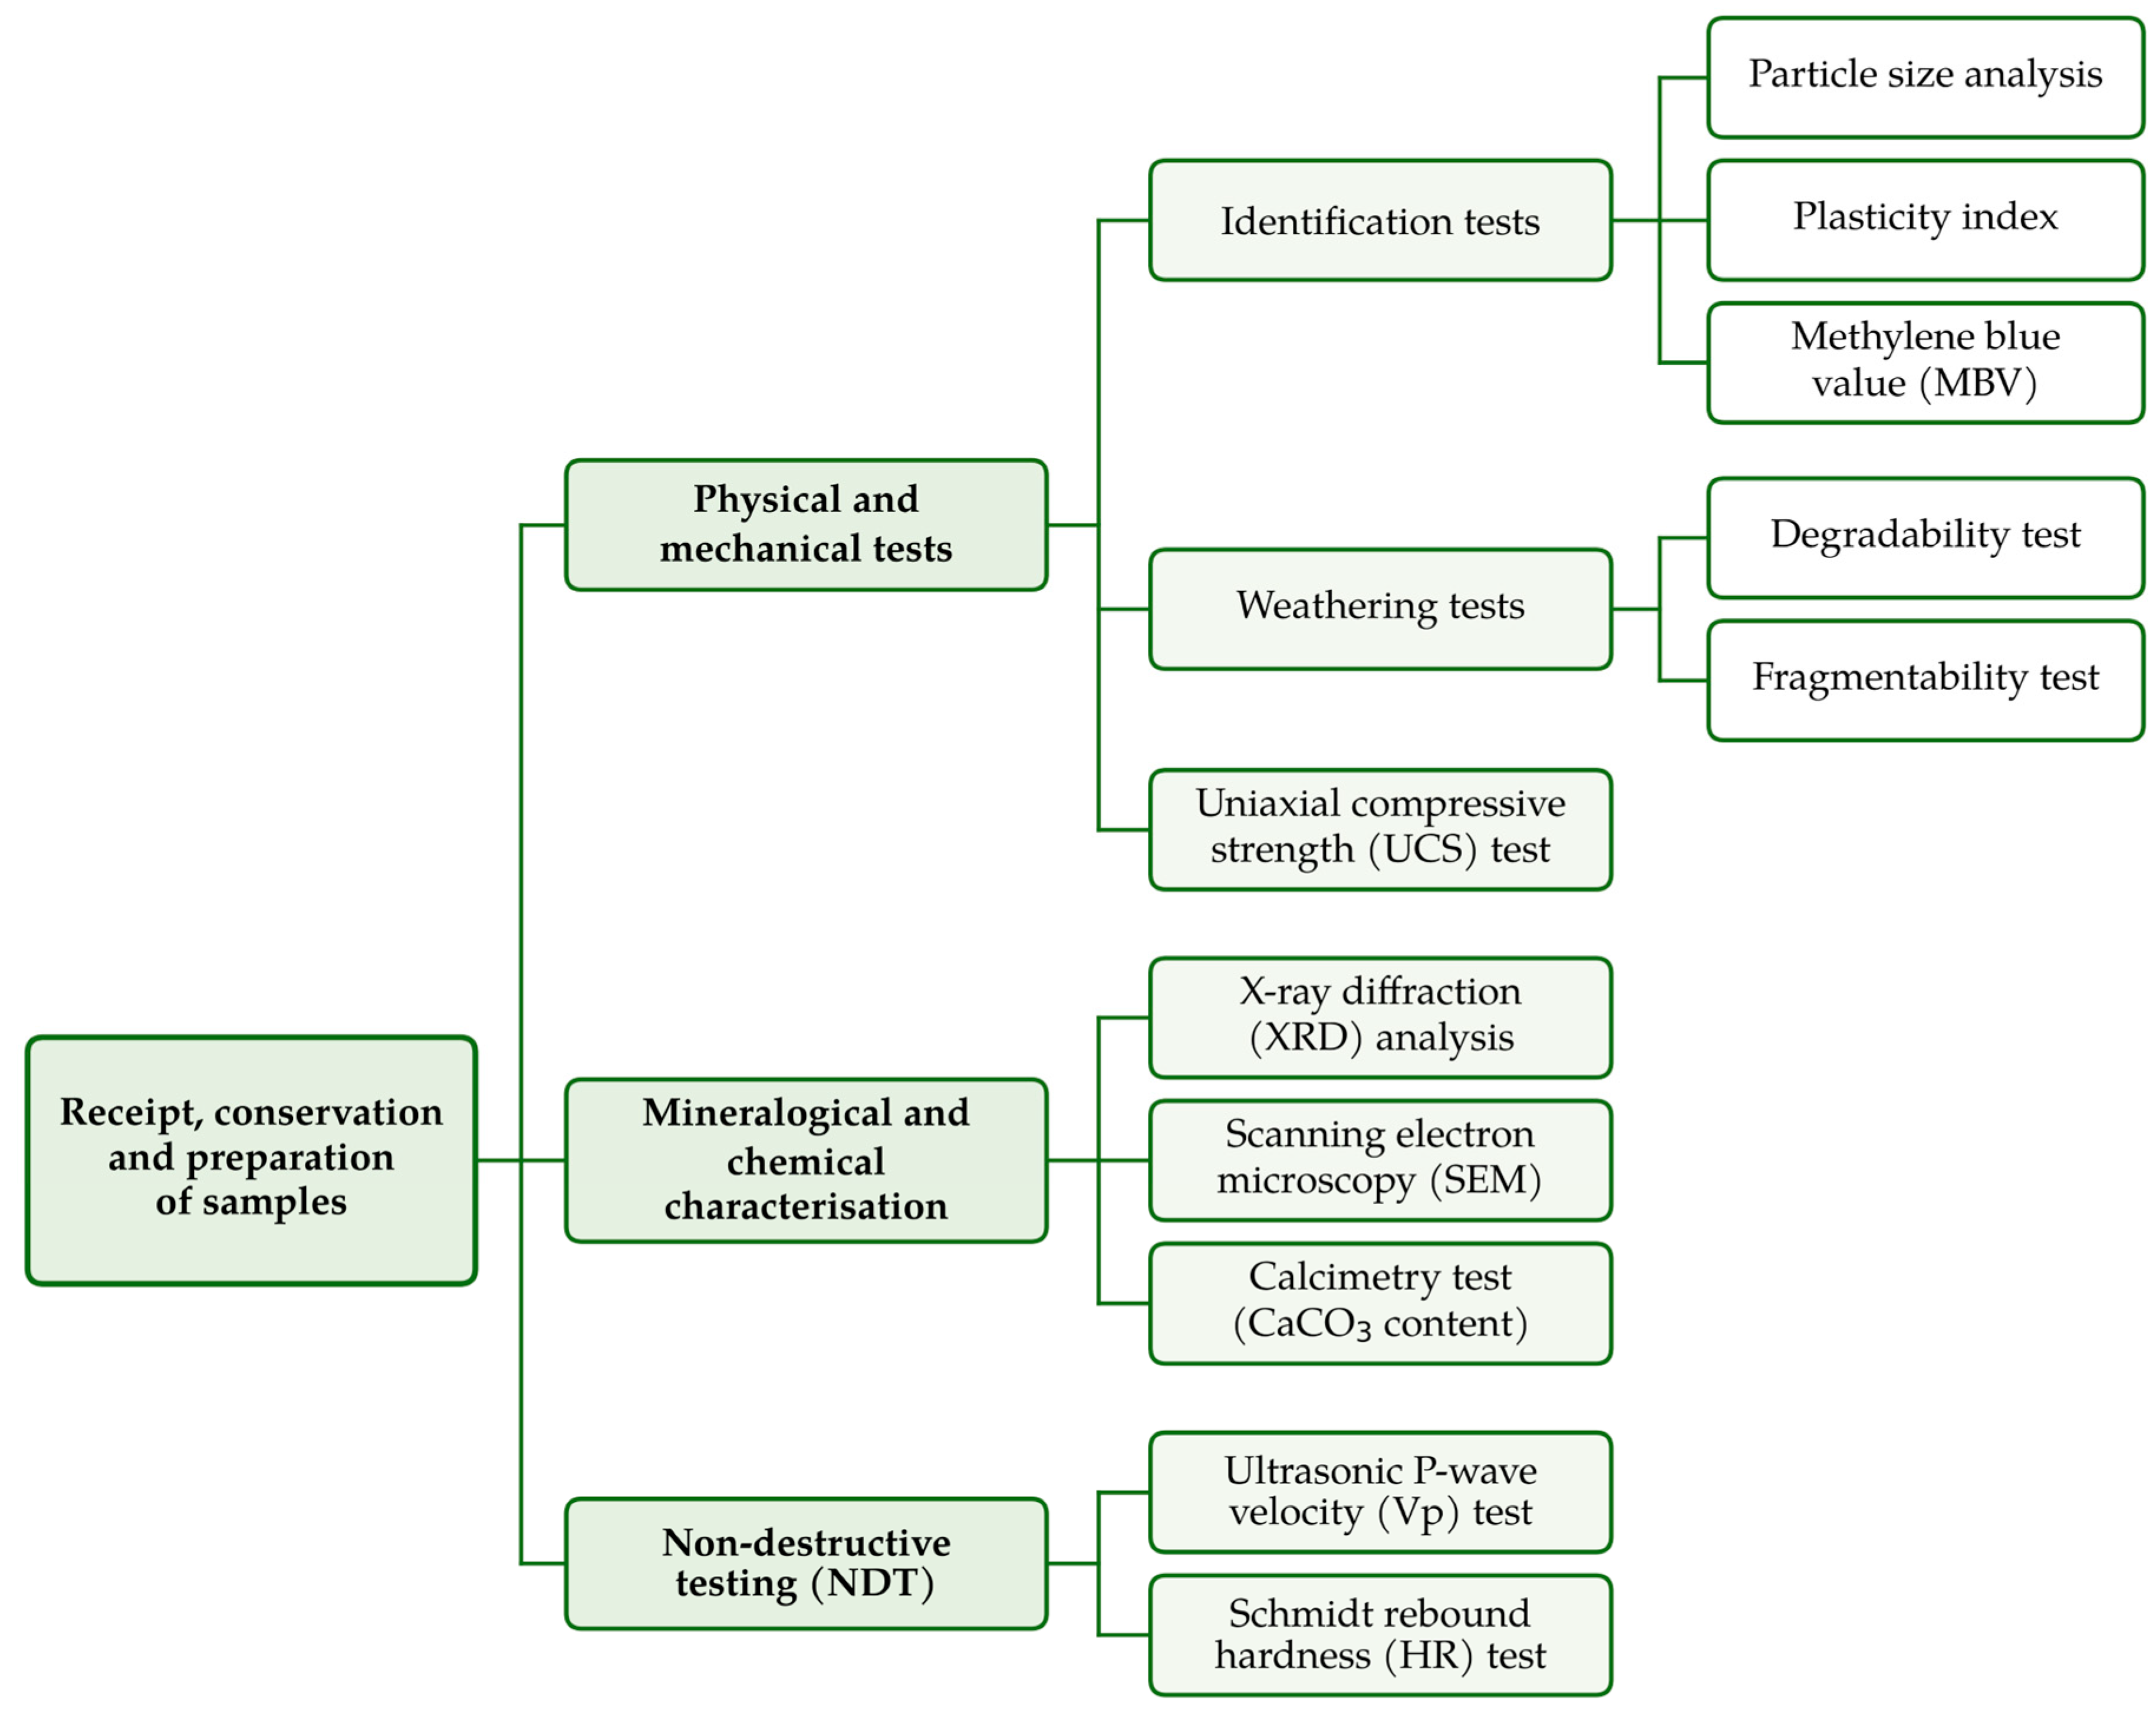
The flowchart in Figure 3 outlines the experimental programme. It begins with the receipt, storage and preparation of the samples in the laboratory, followed by physical and mechanical testing: identification tests (particle size analysis, plasticity index and methylene blue value, MBV), degradability and fragmentability tests, and uniaxial compressive strength (UCS) tests to assess the mechanical properties. Mineralogical and chemical characterisation was then carried out by X-ray diffraction (XRD), scanning electron microscopy (SEM) and calcimetry, the latter to measure the calcium carbonate (CaCO3) content. Finally, non-destructive tests (ultrasonic P-wave velocity and Schmidt rebound hardness) were used to evaluate the hardness and internal structure of the material.
Figure 3.
Experimental programme of the study.
Regression analyses were carried out on the full set of n = 28 specimens. For each relationship, linear, power and exponential models were compared on the basis of both calibration and cross-validated prediction errors; the statistical procedure is detailed in Section 3.11.
3.2. Sampling, Specimen Preparation and Moisture Condition
The 28 specimens (P1–P28) were collected from four outcrops, labelled Sites F1, F2, F3 and F4, of the Taza corridor (Figure 1), both as field cores and as block samples cored in the laboratory. The correspondence of each specimen with its outcrop and with its origin (core or block) was not recorded during sampling; it is therefore reported as not determined in Supplementary Table S1, and this is acknowledged as a limitation in Section 4.11. Ultrasonic velocity, Schmidt rebound and UCS were measured on all 28 core specimens used in the regression analyses. The identification tests (particle size, plasticity and MBV) were performed on 28 crushed samples taken from the same outcrops, but not systematically from the same blocks as the core specimens of the same number, so that identification and mechanical results cannot be paired specimen by specimen; degradability and fragmentability were determined on 21 specimens, the material remaining from the other 7 being insufficient for these tests.
Cylindrical specimens with a diameter of 53 mm and a length of 106–130 mm (L/D = 2.00–2.45) were prepared by coring perpendicular to the bedding, and their end surfaces were sawn and then ground flat, parallel and perpendicular to the specimen axis, following NF P94-420 [43]. Each specimen was tested successively by ultrasonic velocity, Schmidt rebound and finally UCS, so that the three measurements refer to the same specimen.
Moisture condition. After sampling, the specimens were stored in sealed plastic bags at about 20 °C until testing in order to preserve their moisture content and were tested without prior saturation or oven-drying. This condition is referred to throughout the paper as the “as-sampled moisture condition”. The water content at the time of testing, determined on trimmings of each specimen by oven-drying at 105 °C (NF P94-050 [44]), ranged from 1.8 to 3.2% (mean of 2.71 ± 0.32%; Supplementary Table S1).
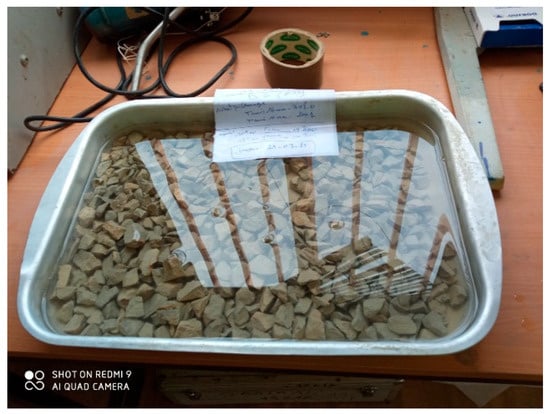
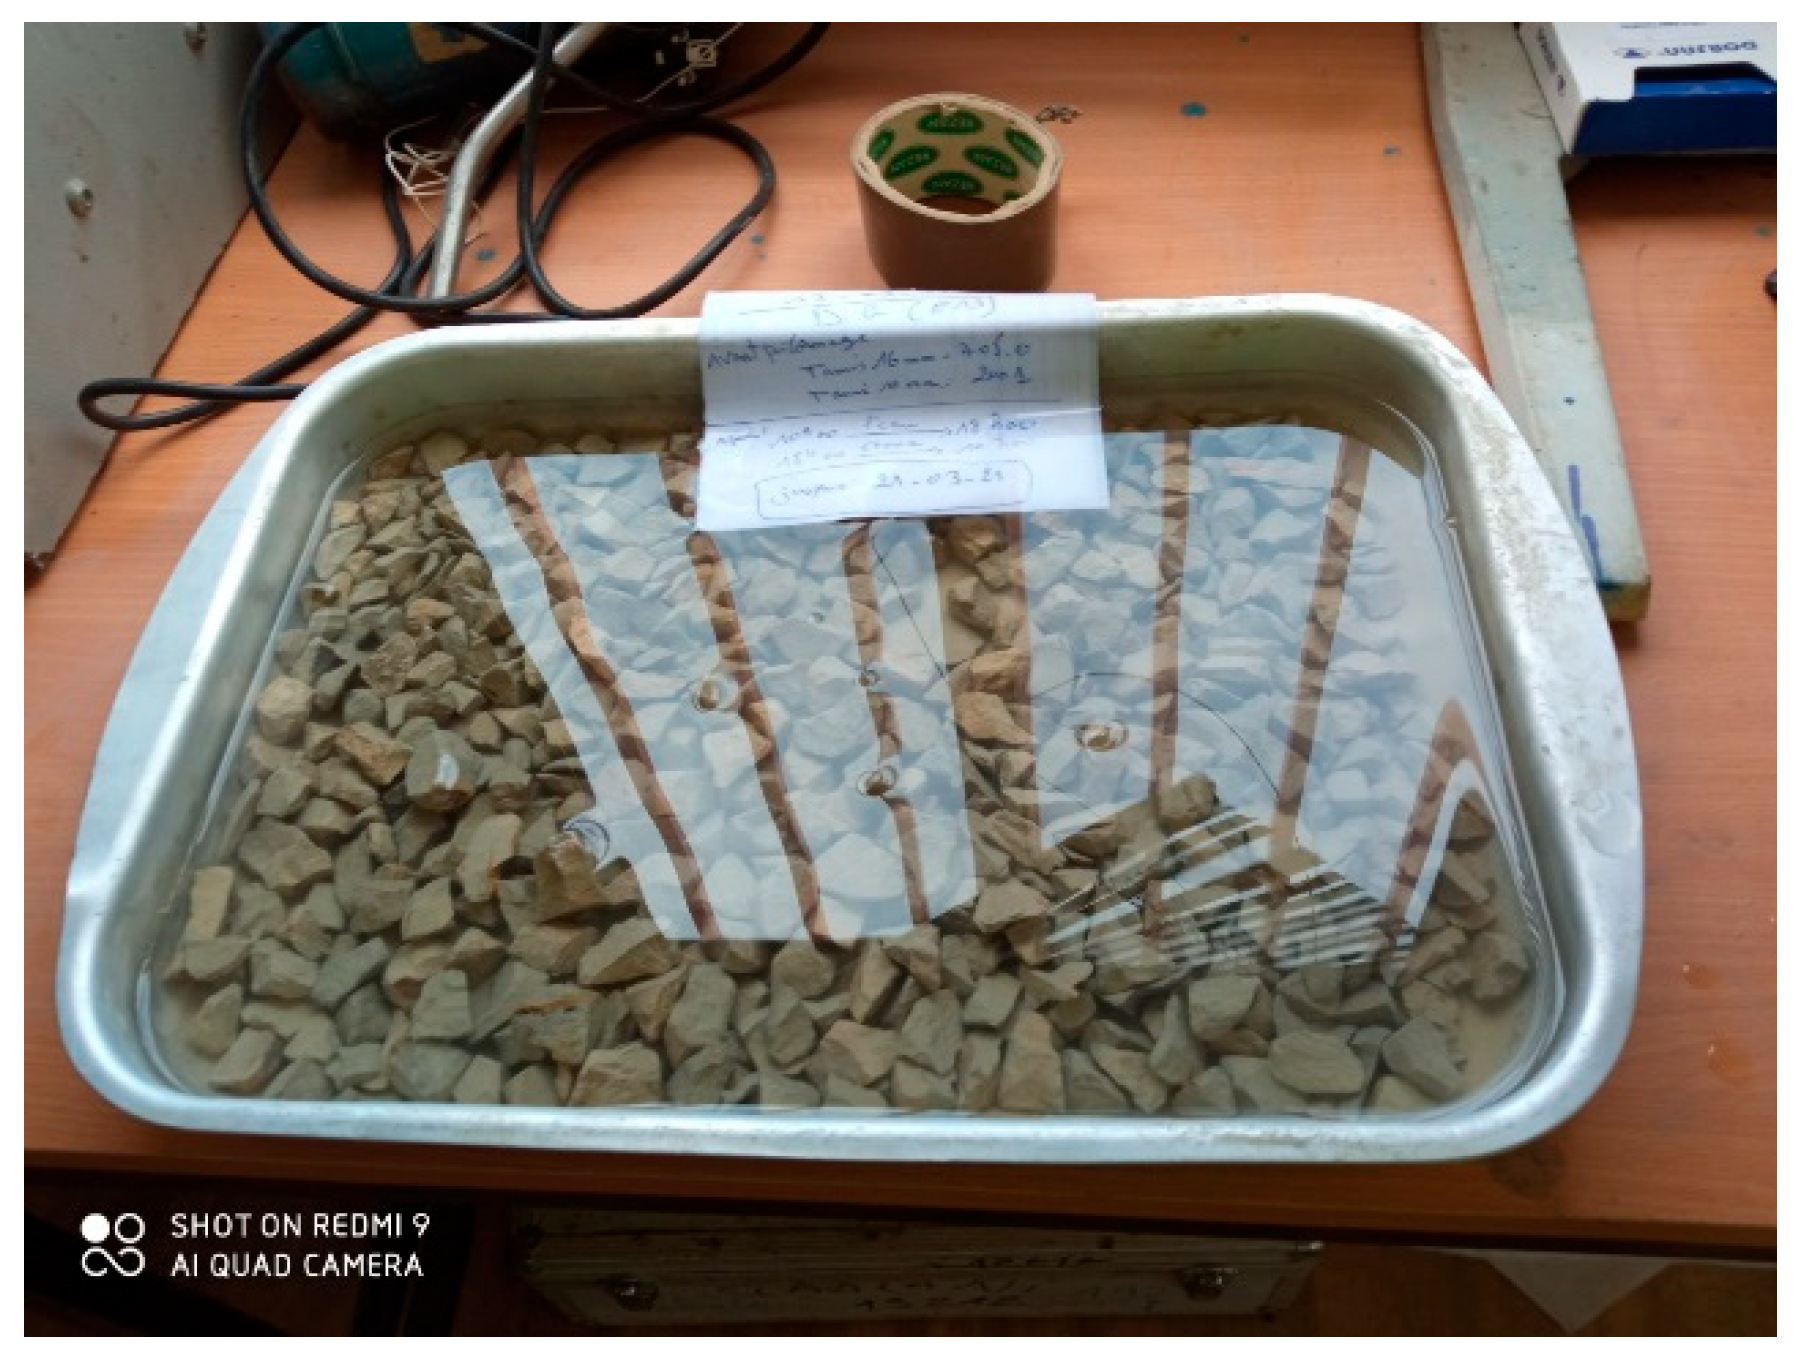
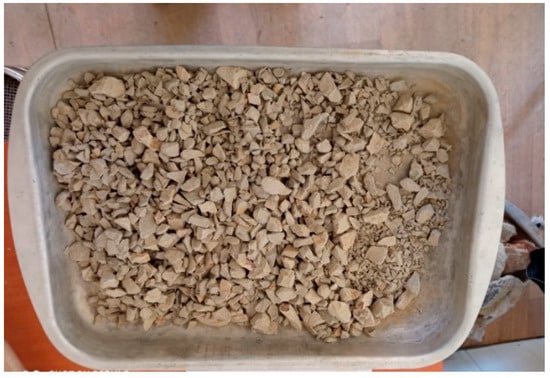
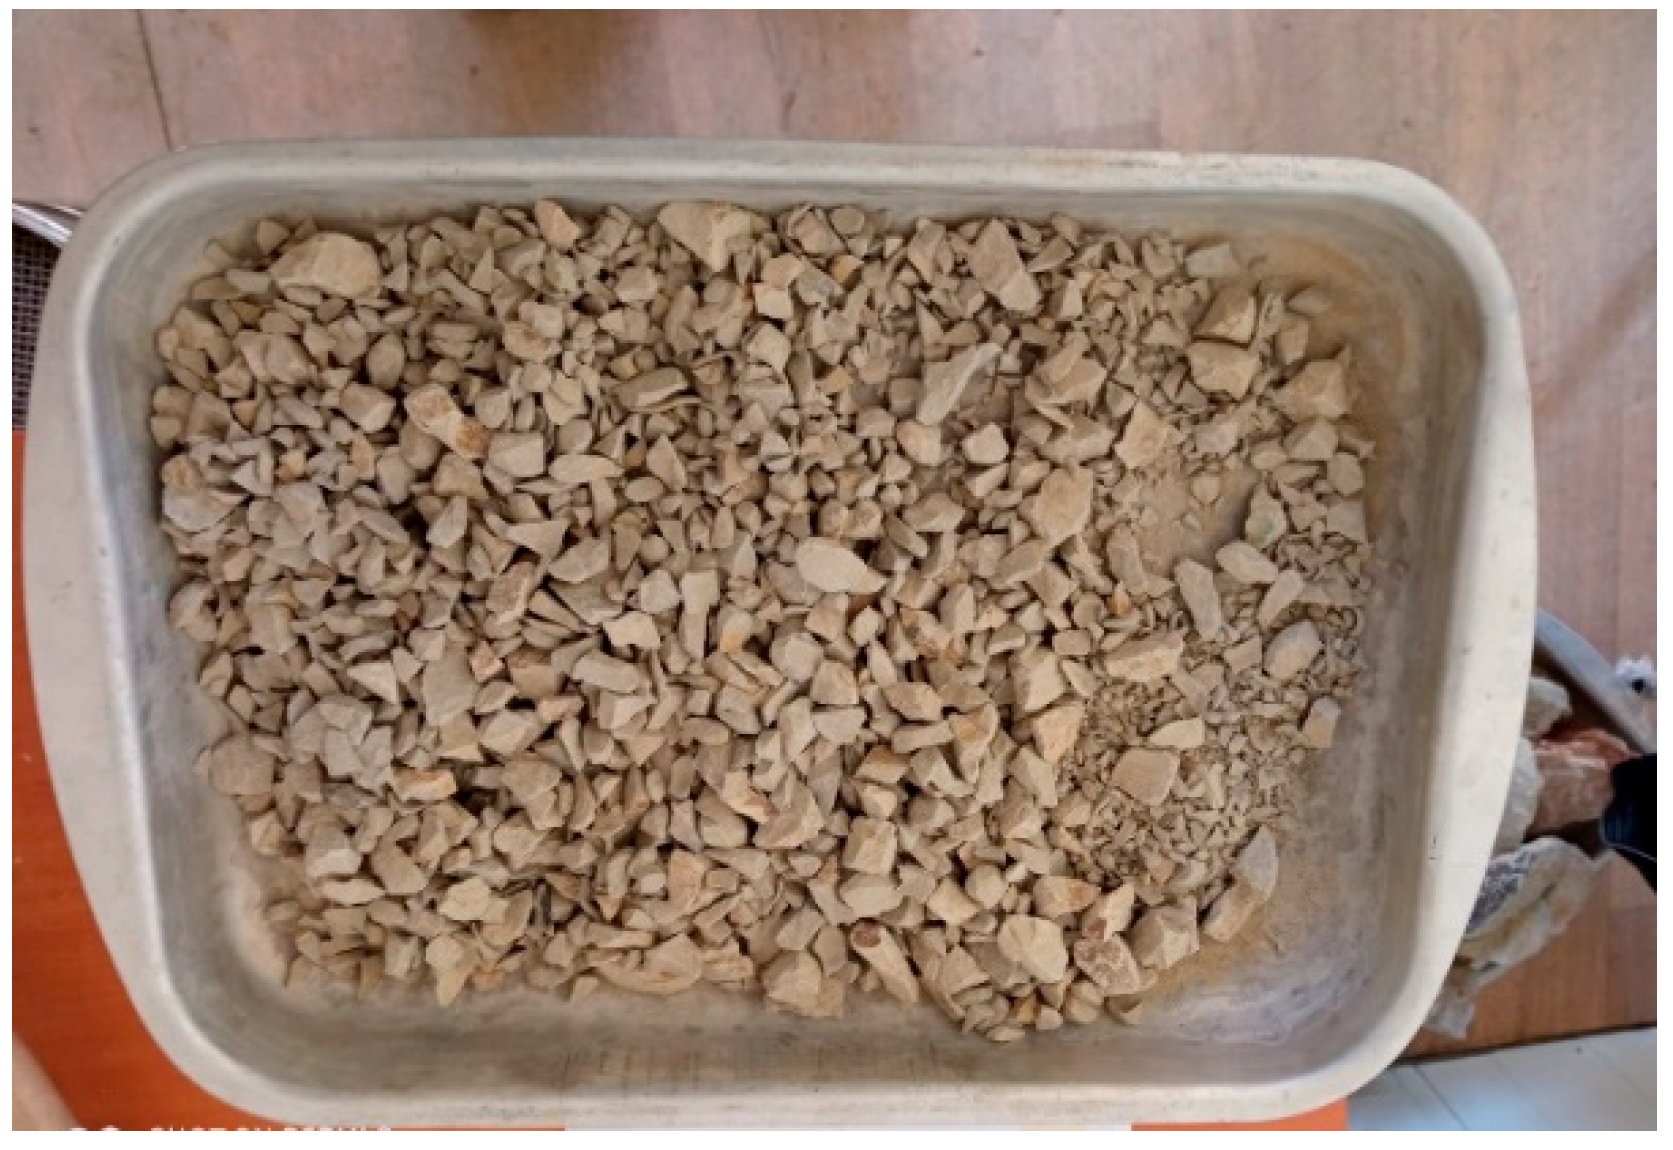
3.3. The Degradability Test
According to standard NM 13-01-038 [38], the degradability coefficient is a representative parameter of certain rock materials that characterises the progressive change in their geotechnical properties (e.g., grading, clay content, plasticity) relative to their state immediately after extraction. This change reflects the sensitivity of the rock material to hydric and mechanical stresses and, therefore, the risk of long-term changes.
Representative marl-limestone samples were collected on site.
Figure 4 shows a test sample; the results are presented in Section 4.4.
Figure 4.
Degradability test sample.
3.4. The Fragmentability Test
According to standard NM 13.01.037 [39], the fragmentability coefficient is a representative parameter of the behaviour of certain rock materials whose grading changes progressively from extraction to the end of their service life. This change results from the insufficient structural strength of the rock with respect to the mechanical stresses applied during placement.
Figure 5 shows a test sample; the results are presented in Section 4.4.
Figure 5.
Fragmentability test sample.
3.5. The Uniaxial Compressive Strength Test
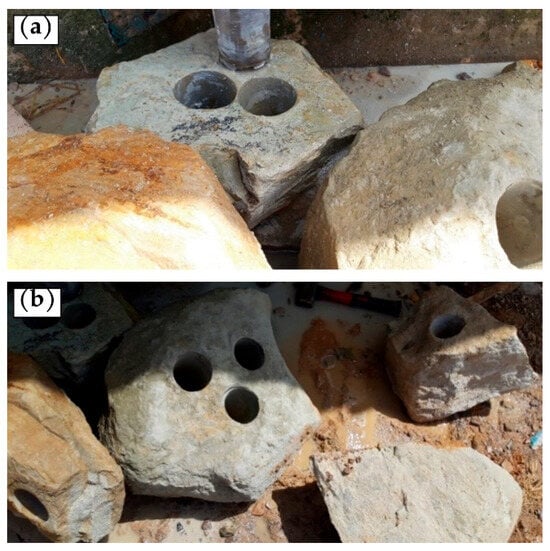
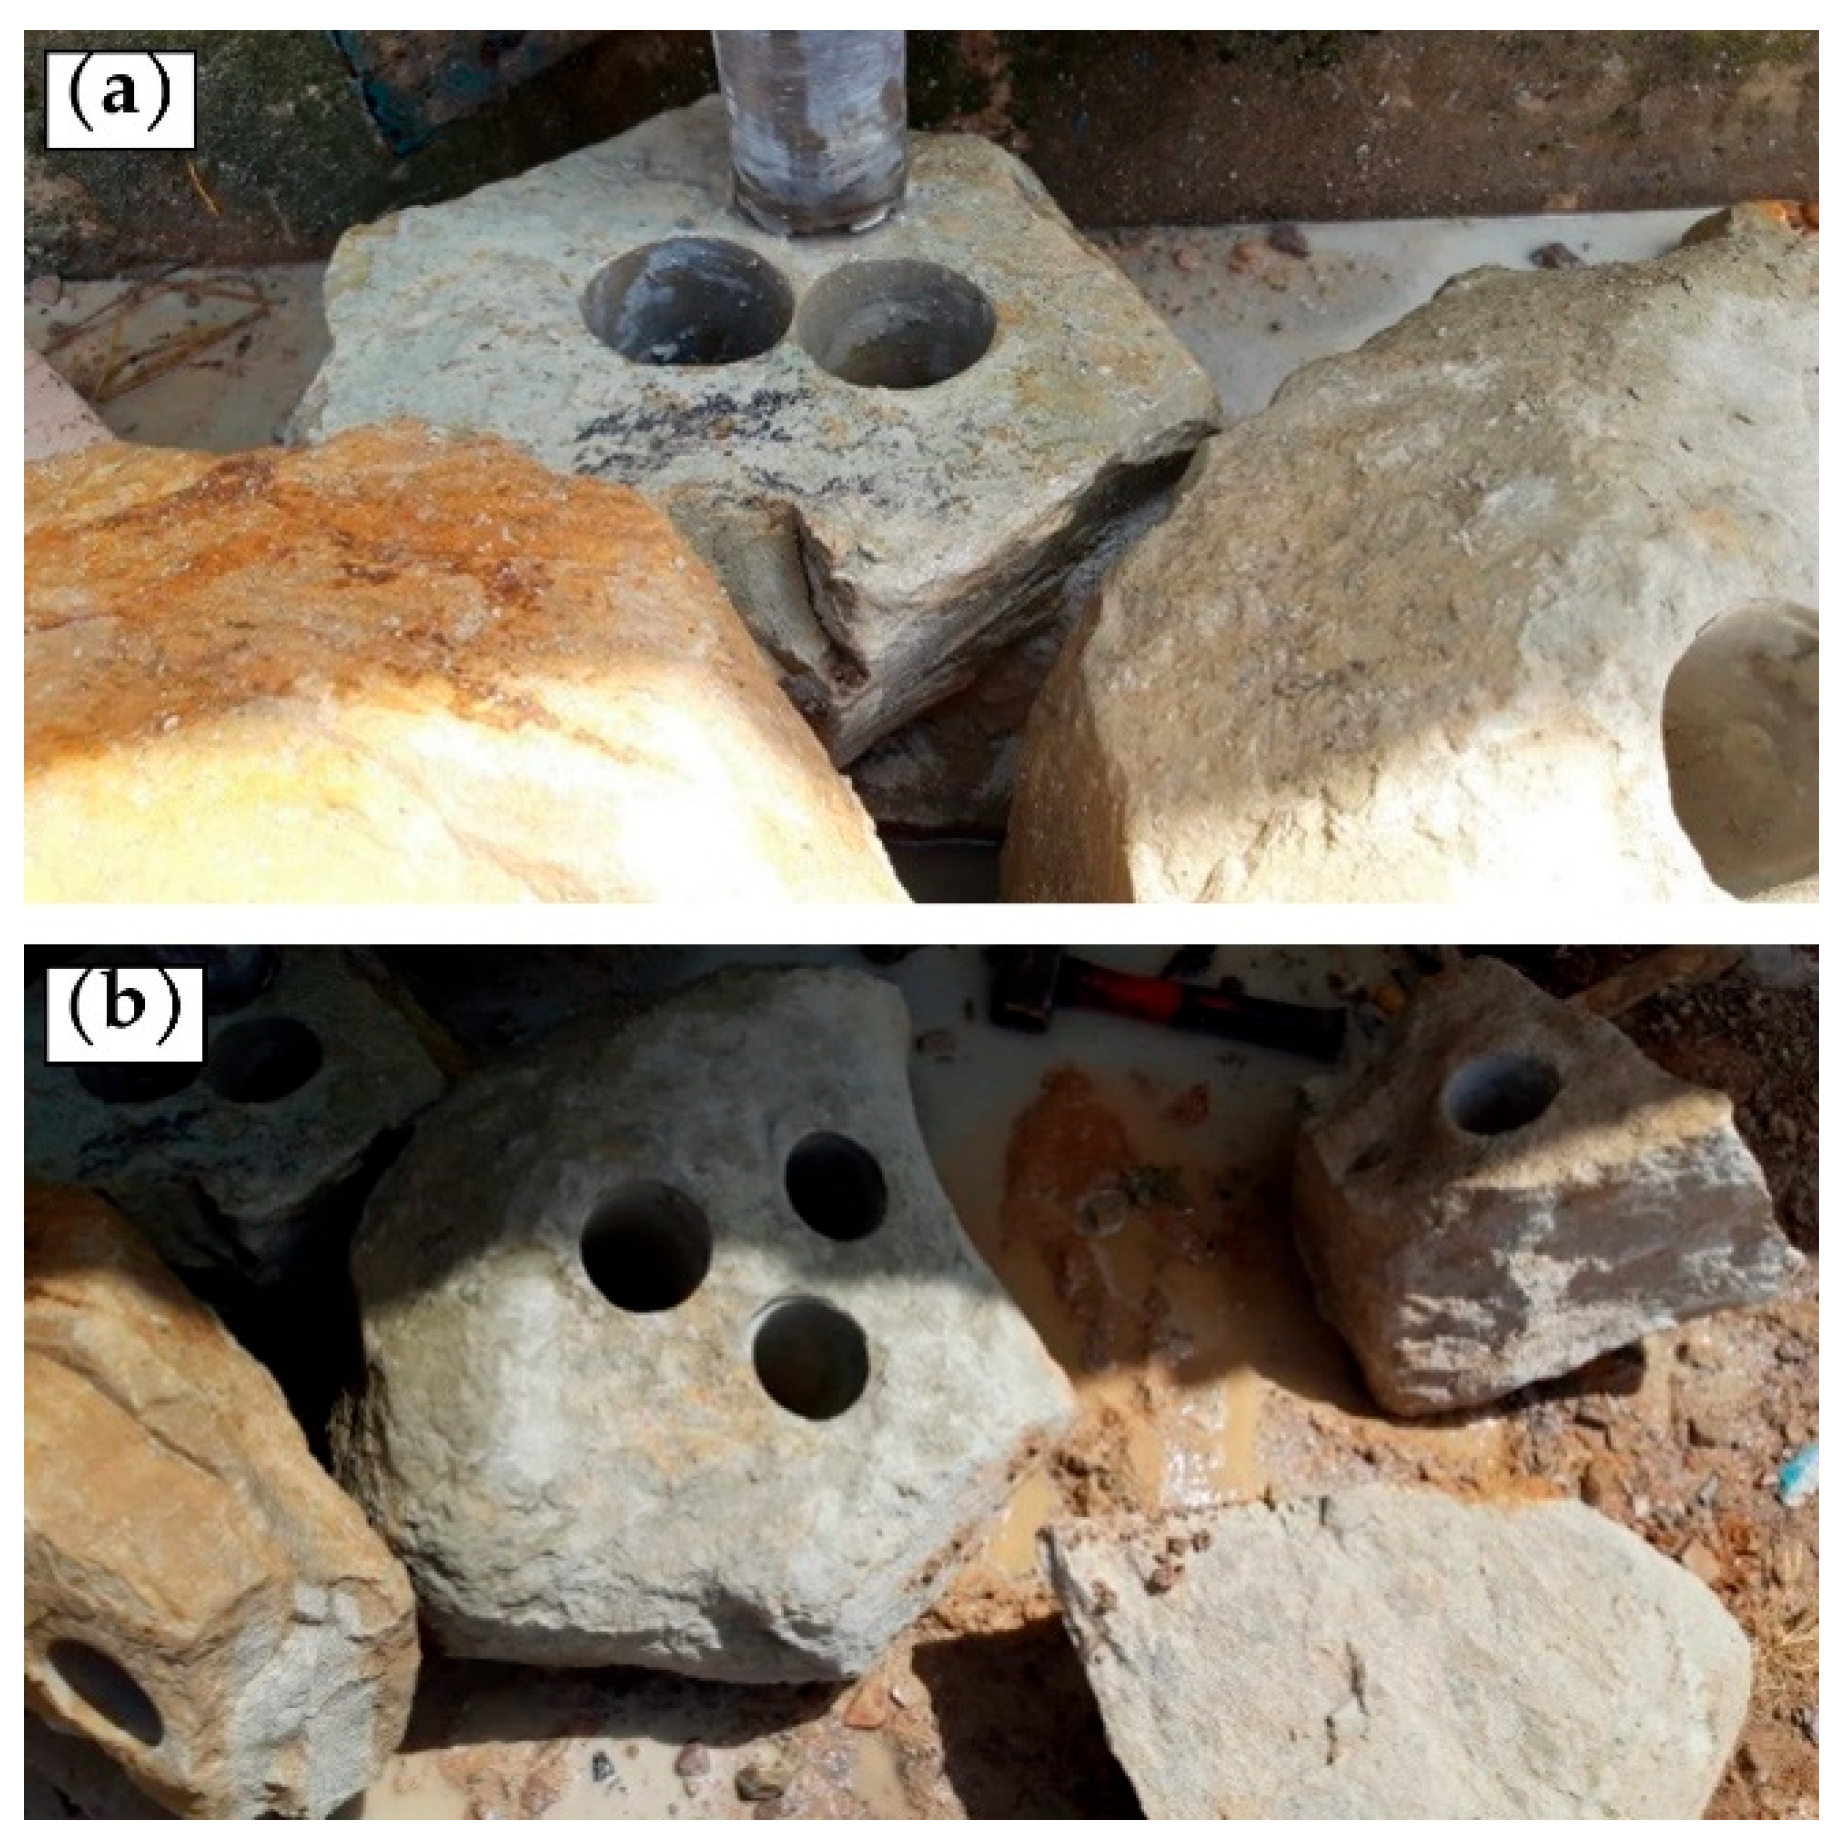
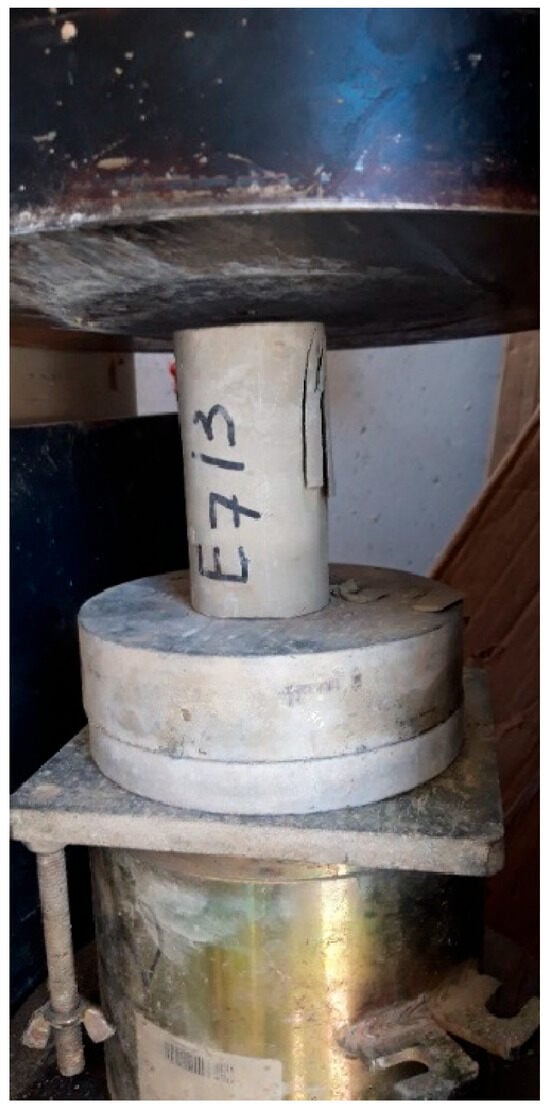
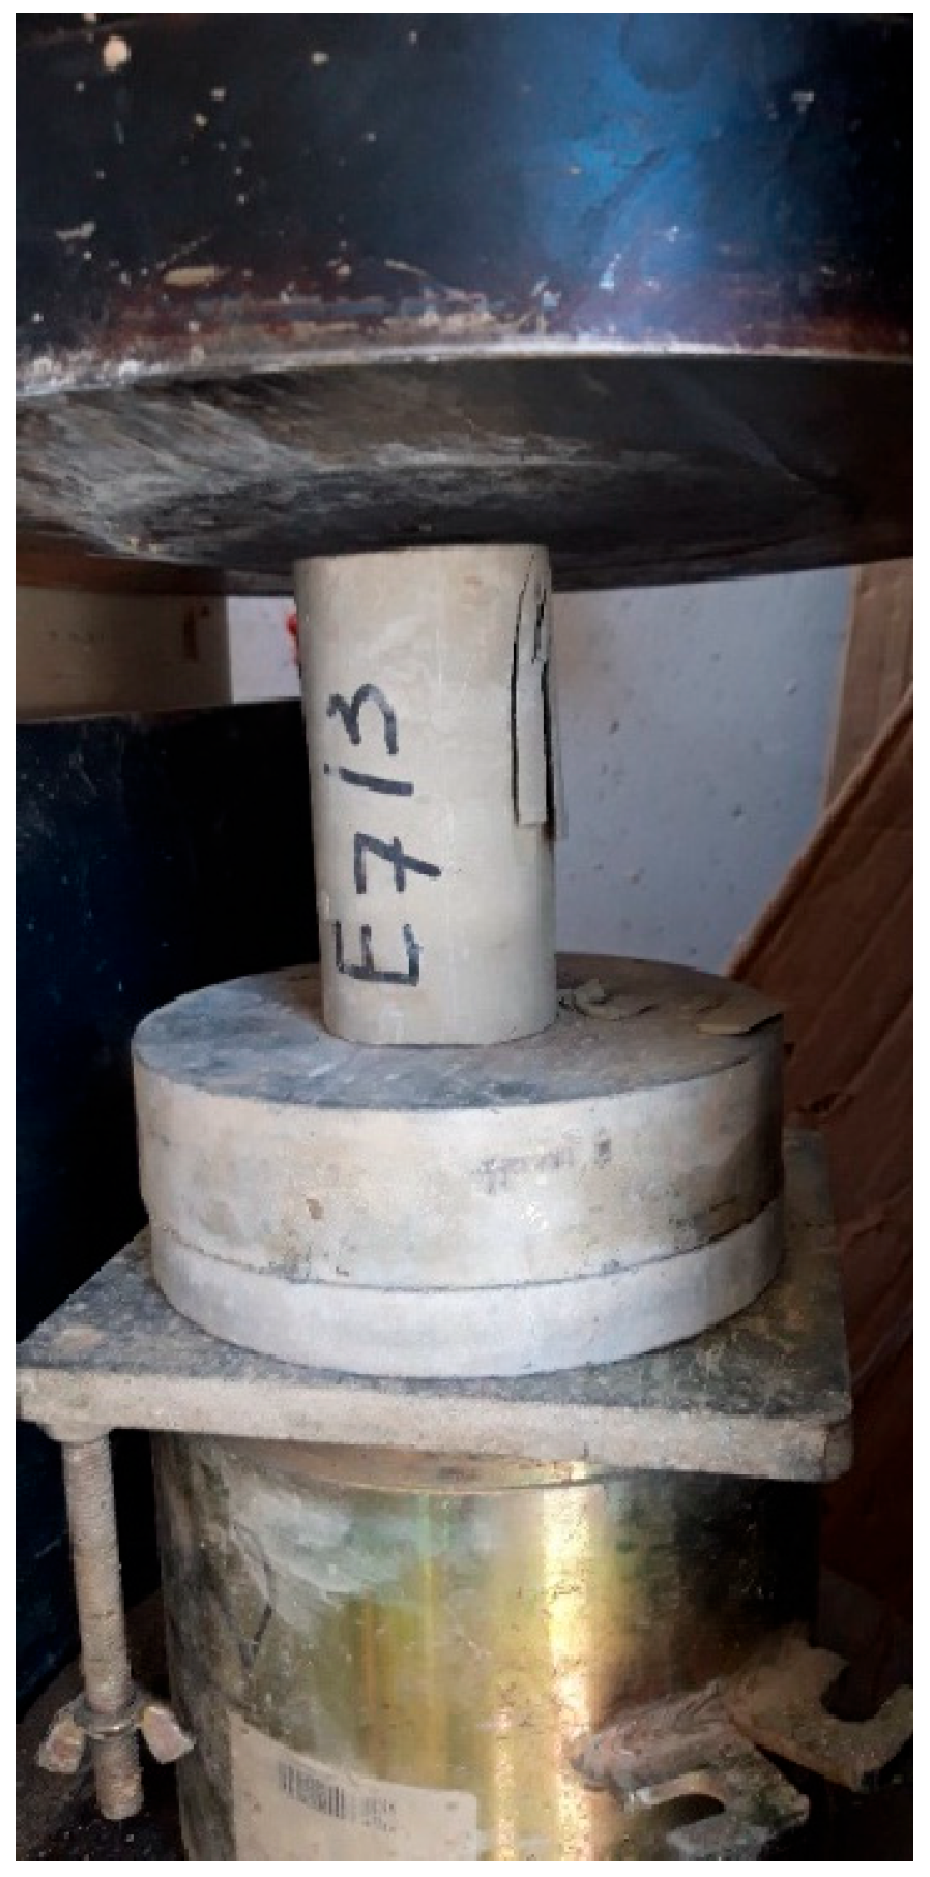
According to standard NF P94-420 [43], following coring and trimming of the rock samples collected in the field, cylindrical specimens (D = 53 mm, L/D = 2.00–2.45) were prepared as described in Section 3.2 (Figure 6). All uniaxial compression tests were performed on specimens in the as-sampled moisture condition defined in Section 3.2. The axial load was applied continuously with a UTEST compression press (Figure 7) at a constant loading rate of 1.1–2.2 kN/s, corresponding to a stress rate of 0.5–1.0 MPa/s for the 53 mm specimens, in accordance with the ISRM suggested method [16], until failure. UCS was calculated as the failure load divided by the initial cross-sectional area. Since all specimens satisfied 2.0 ≤ L/D ≤ 2.5, no shape correction was applied. Results are expressed in MPa.
Figure 6.
Coring of the specimens from marl-limestone blocks: (a) core drilling in a block; (b) blocks after extraction of the core specimens.
Figure 7.
UCS test.
The results are presented in Supplementary Table S1.
3.6. Scanning Electron Microscopy (SEM)
The morphology and microstructure of the marl-limestone sample were examined by scanning electron microscopy (SEM) using a JSM-IT500HR microscope (JEOL Ltd., Tokyo, Japan) operated at 16 kV at the Innovation Center of Sidi Mohamed Ben Abdellah University.
The results are presented in Section 4.1.
3.7. X-Ray Diffraction Analysis
The mineral composition of the samples was determined with a PANalytical X’Pert PRO diffractometer, Malvern Panalytical, Almelo, The Netherlands, (Cu-Kα radiation). The X-ray tube was operated at 40 kV and 30 mA, and all samples were scanned from 5° to 80° 2θ with a step size of 0.02° 2θ.
The results are presented in Section 4.2.
3.8. Calcimetry Test
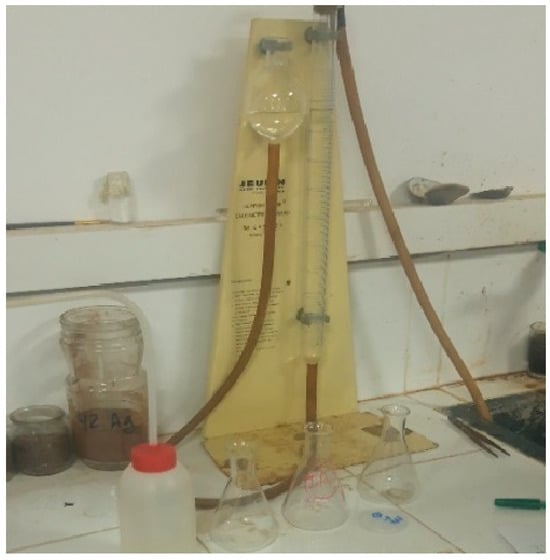
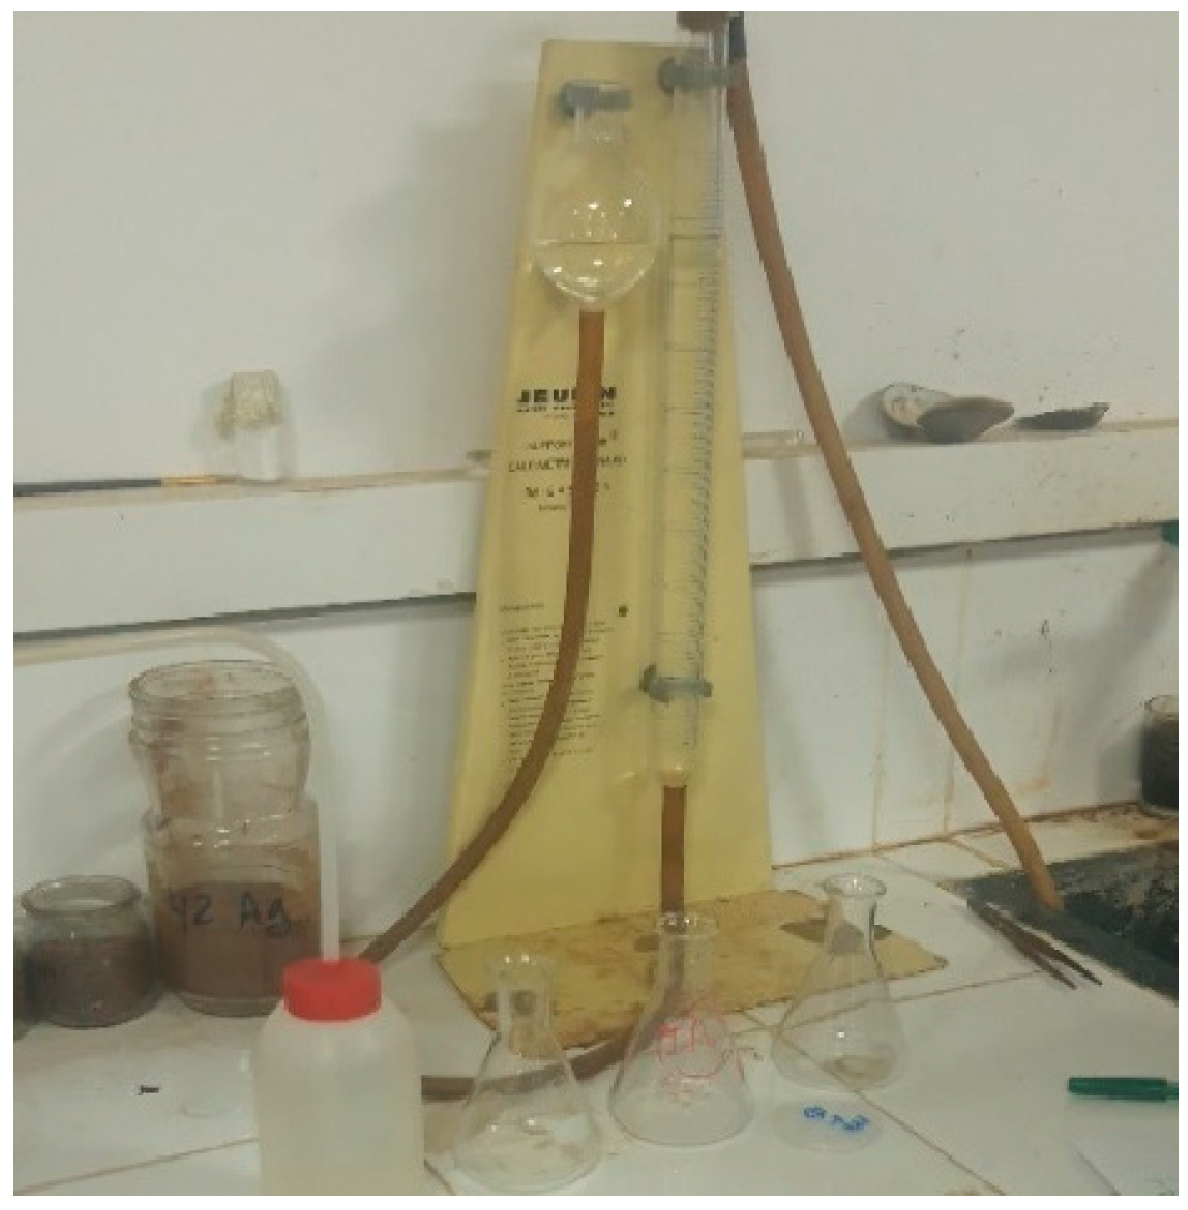
The carbonate content was determined with a Bernard calcimeter (Figure 8), a simple and efficient device for determining carbonate in marl-limestone. According to standard NM 13-1-029 [45], dilute hydrochloric acid is reacted with powdered samples collected on site and prepared in the laboratory; the volume of CO2 released by the following reaction is measured with a calibrated burette and used to calculate the CaCO3 content of the Taza marl-limestone:
CaCO3 + 2 HCl → CaCl2 + H2O + CO2
Figure 8.
Calcimetry test (Bernard calcimeter).
The carbonate content is expressed as a percentage.
The results are presented in Section 4.5.
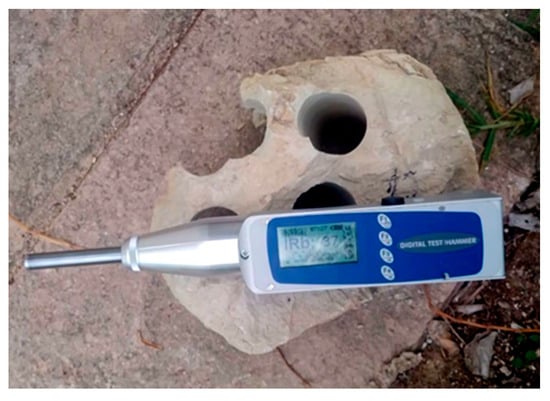
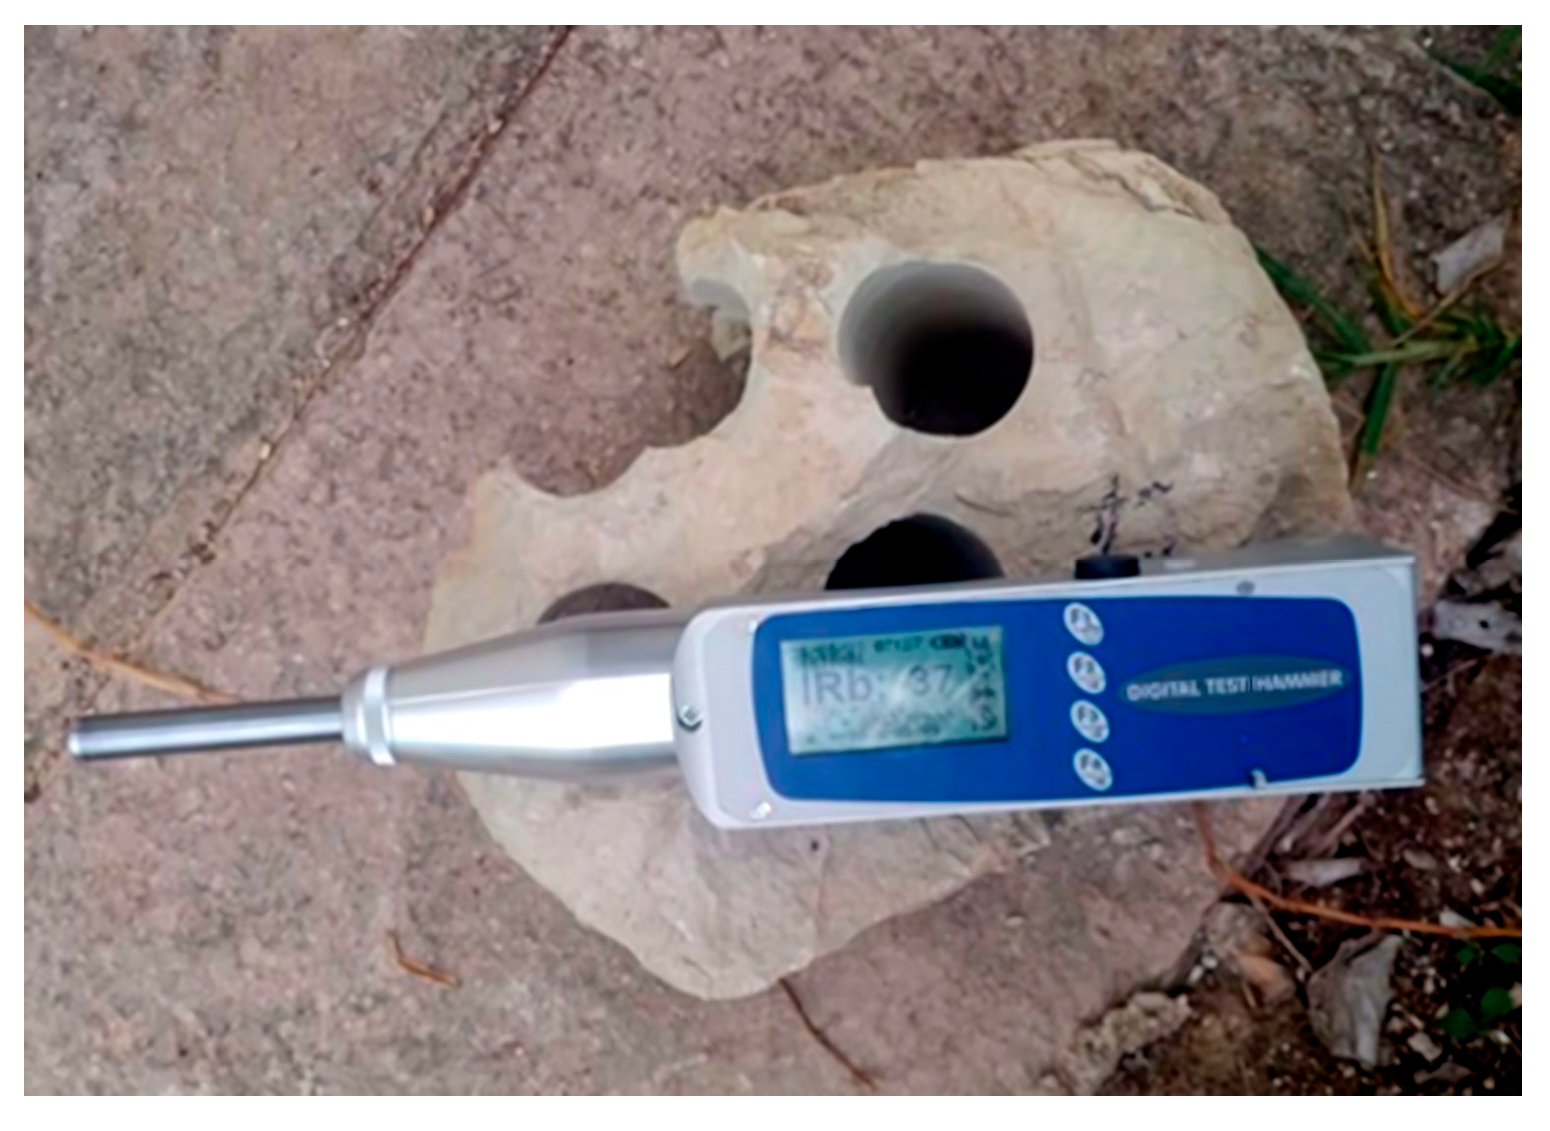
3.9. Schmidt Rebound Hardness
The Schmidt rebound hardness test (Figure 9), described in the ISRM Suggested Methods [16], provides a dimensionless rebound number (HR) related to the surface hardness of the rock. A spring-loaded mass impacts a steel plunger held perpendicular to the specimen surface, and the rebound distance of the mass is read as HR on a 0–100 scale; HR therefore has no stress unit. Tests followed the revised ISRM suggested method [32] using an L-type rock Schmidt rebound test hammer (impact energy 0.735 N·m). Twenty single impacts were made on each specimen. During the test, each core was held in a steel cradle (V-block) so that it could neither move nor vibrate under the impacts. Rebound readings obtained with a non-horizontal impact direction were corrected to the horizontal reference direction using the angle-correction curves supplied by the hammer manufacturer, so that all values are comparable regardless of the impact orientation. For each specimen, the mean, median, range and standard deviation of the 20 corrected readings were computed, and the mean value was taken as the specimen HR used in the regressions, the median being used to check the consistency of the readings. Because the Schmidt test preceded the UCS test on the same specimens, care was taken to ensure that the impacts did not damage them: the L-type hammer has a low impact energy (0.735 N·m) and is the type recommended for core specimens [32], the impacts leave only superficial marks on the lateral surface, and no specimen showed cracking, chipping or spalling after the 20 impacts, so that the UCS tests were performed on intact specimens. Tests were carried out in the as-sampled moisture condition defined in Section 3.2.
Figure 9.
Schmidt rebound hardness test.
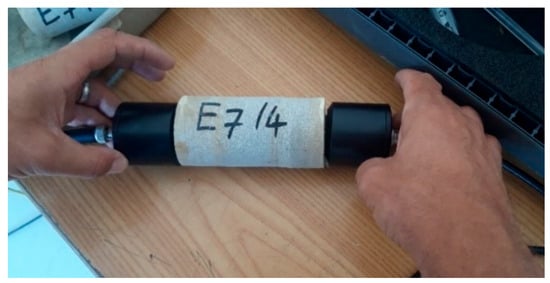
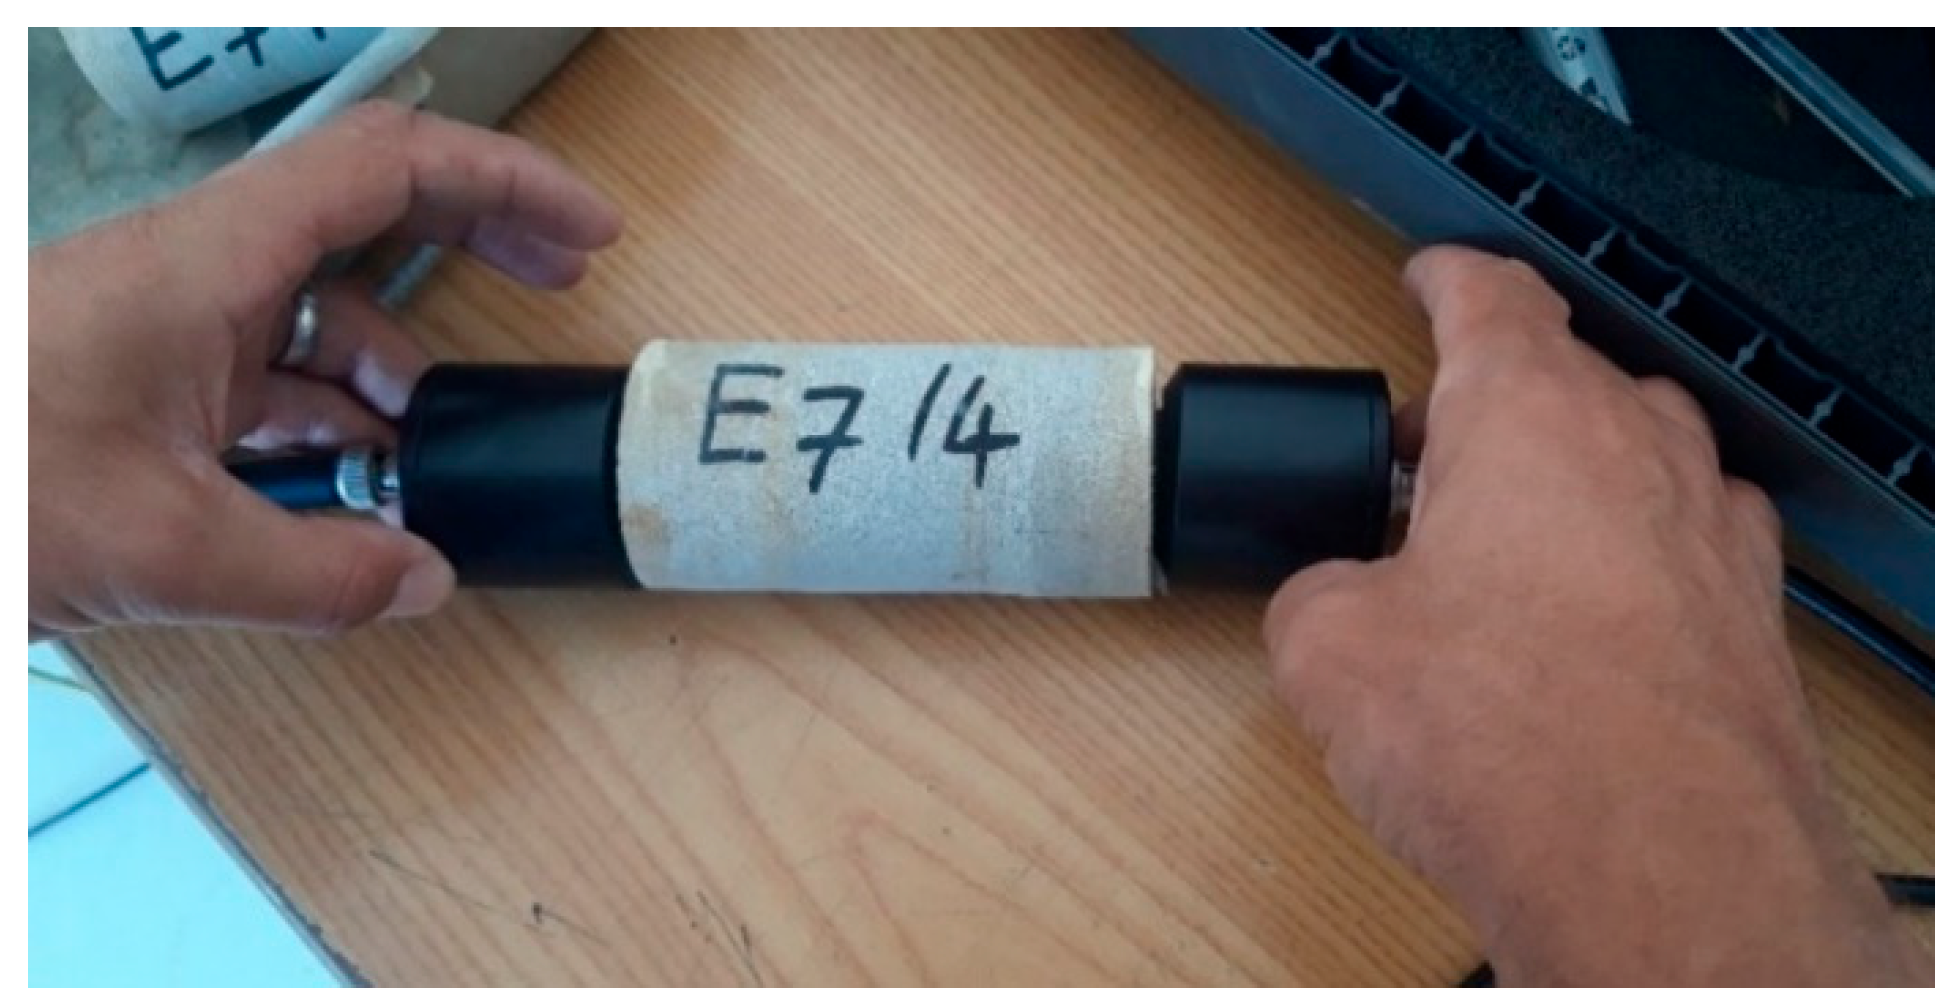
3.10. Ultrasonic Wave Velocity Tests
The test is based on the generation of longitudinal waves by an electro-acoustic transducer placed in direct contact with the surface of the core (Figure 10). After travelling along the core, the pulse is converted into an electrical signal by a second transducer, and an electronic timer measures its travel time.
Figure 10.
Ultrasonic wave velocity test.
The procedure followed the ISRM Suggested Methods [16]. The equipment comprised an electrical pulse generator, a pair of transducers, an amplifier and an electronic timer measuring the time between the emission of the pulse by the transmitting transducer and its arrival at the receiving transducer. Measurements were made by direct transmission along the specimen axis using 500 kHz P-wave transducers, coupled to the flat end faces with a thin, uniform film of petroleum jelly (Vaseline) chosen so as not to alter the moisture condition of the specimens; the travel length was the specimen length L. For each core, the transit time was measured in both directions, i.e., with the transmitter and the receiver successively placed on each end face, and Vp = L/t was computed from the mean transit time of the two directions; this mean value was used in the regressions. For the measured velocities (2.12–4.65 km/s), the wavelength is 4–9 mm, so that the specimen diameter (53 mm) exceeds five wavelengths. All specimens were tested in the as-sampled moisture condition defined in Section 3.2.
3.11. Statistical Analysis and Model Validation
Linear (UCS = a + bX), power (UCS = aXb) and exponential (UCS = a·ebX) models were fitted with X = Vp or HR. The power and exponential models were fitted by least squares on ln(UCS), as in spreadsheet trend-line fitting, and all goodness-of-fit statistics were then computed on the original UCS scale (MPa): coefficient of determination (R2), root-mean-square error (RMSE), mean absolute error (MAE) and bias (mean of predicted minus measured UCS). The significance of each regression was assessed by an F-test on the log-linear fit.
Because the same 28 specimens cannot both calibrate and validate a model, predictive performance was estimated by leave-one-out cross-validation (LOOCV): each specimen was predicted by a model refitted on the remaining 27 specimens, and the cross-validated coefficient of determination (Q2), RMSECV, MAECV and biasCV were computed from these out-of-sample predictions. The LOOCV results were checked by 200 repetitions of 5-fold cross-validation. Both procedures are internal validations: in each fold, the predicted specimens belong to the same sample population as the calibration specimens (four outcrops of the Taza corridor, tested in the same laboratory and in the same moisture condition). They estimate the expected error for new specimens drawn from this population, but they are not an independent external validation and do not establish the predictive accuracy of the equations for other geological locations or for field conditions. Residuals were examined for normality (Shapiro–Wilk test), heteroscedasticity (Breusch–Pagan test) and influential observations (Cook’s distance with a threshold of 4/n, and studentized residuals > 2 in absolute value). The 95% confidence bands and 95% prediction intervals were computed in log space and back-transformed.
Finally, the published UCS–Vp and UCS–HR equations listed in Section 4.6 and Section 4.7 were applied to the present dataset, after conversion of Vp to the unit required by each equation (km/s or m/s) and evaluated with the same error metrics. Where they could be traced, the original calibration ranges of these equations (ranges of the predictor and of UCS in the source datasets) are reported in Section 4.6 and Section 4.7, and the error metrics were also computed for the subset of Taza specimens whose predictor value lies within the original range. These metrics quantify the transferability of each published equation to the Taza material; they do not measure its performance within its own calibration domain. All calculations were performed in Python 3.13.18; the specimen-level data are provided in Supplementary Table S1.
4. Results and Discussion
4.1. Scanning Electron Microscopy (SEM)
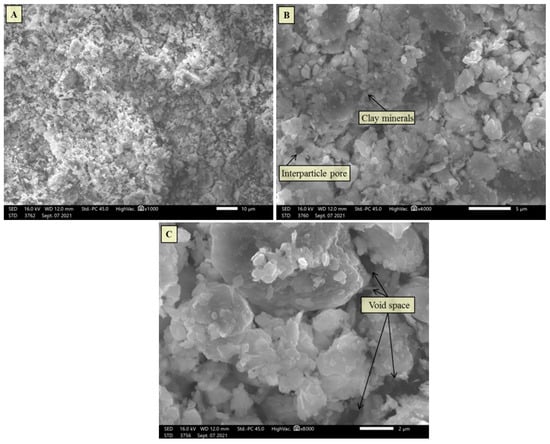
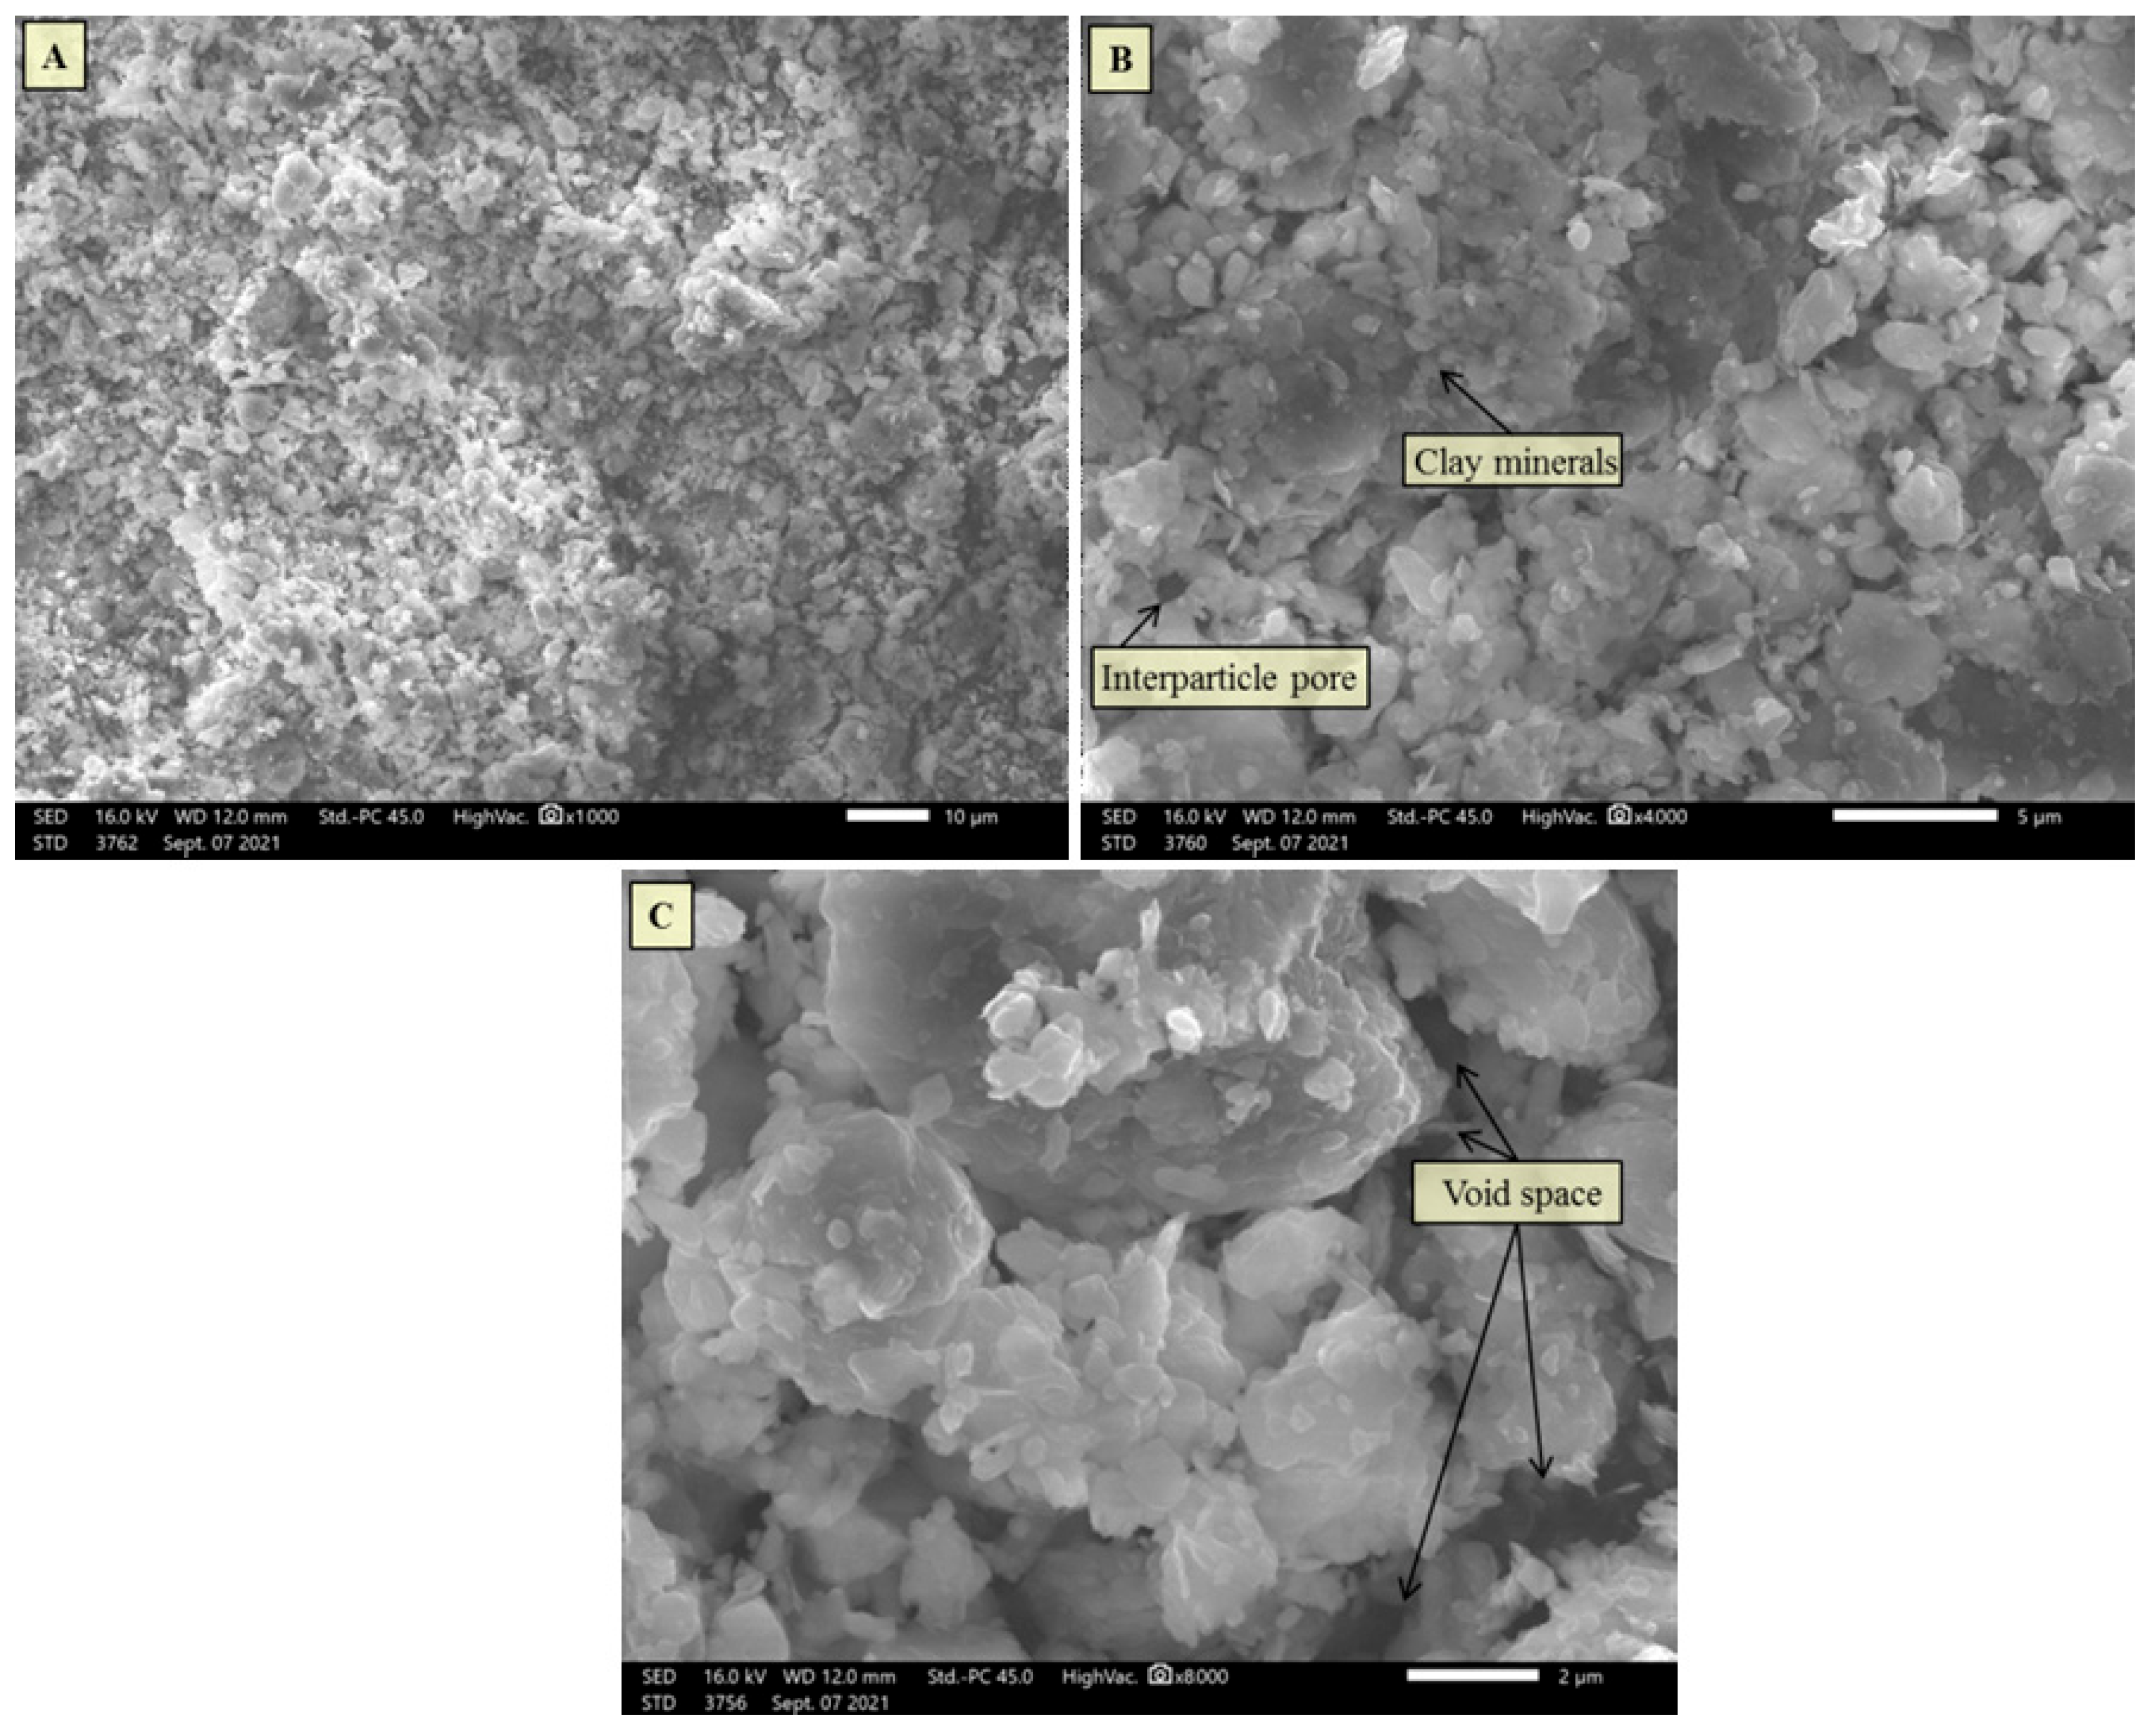
Figure 11 presents SEM micrographs of the marl-limestone sample at different magnifications. The micrograph in Figure 11A shows particles of different sizes and slightly different shapes, which may depend on their mineral composition.
Figure 11.
SEM micrographs of the marl-limestone sample at different magnifications: (A) general view at ×1000 (scale bar: 10 µm) showing particles of different sizes and shapes; (B) ×4000 (scale bar: 5 µm), lamellar clay minerals and interparticle pores; (C) ×8000 (scale bar: 2 µm), void spaces between particles.
Fine particles predominate over large ones. Some fine particles occur as lamellar sheets, consistent with the presence of clay minerals in the microstructure, as shown in Figure 11B.
In addition, voids between the particles are visible in the micrograph in Figure 11C, indicating a less dense microstructure.
4.2. X-Ray Diffraction Analysis
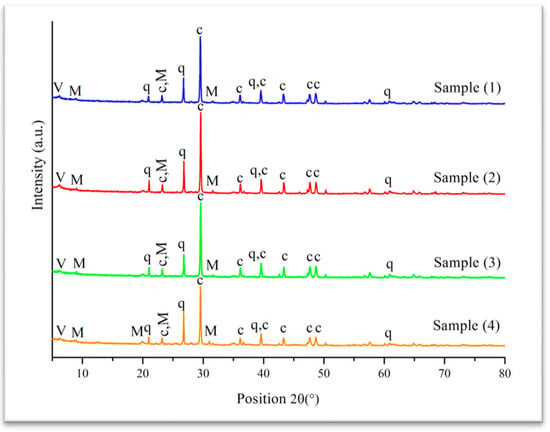
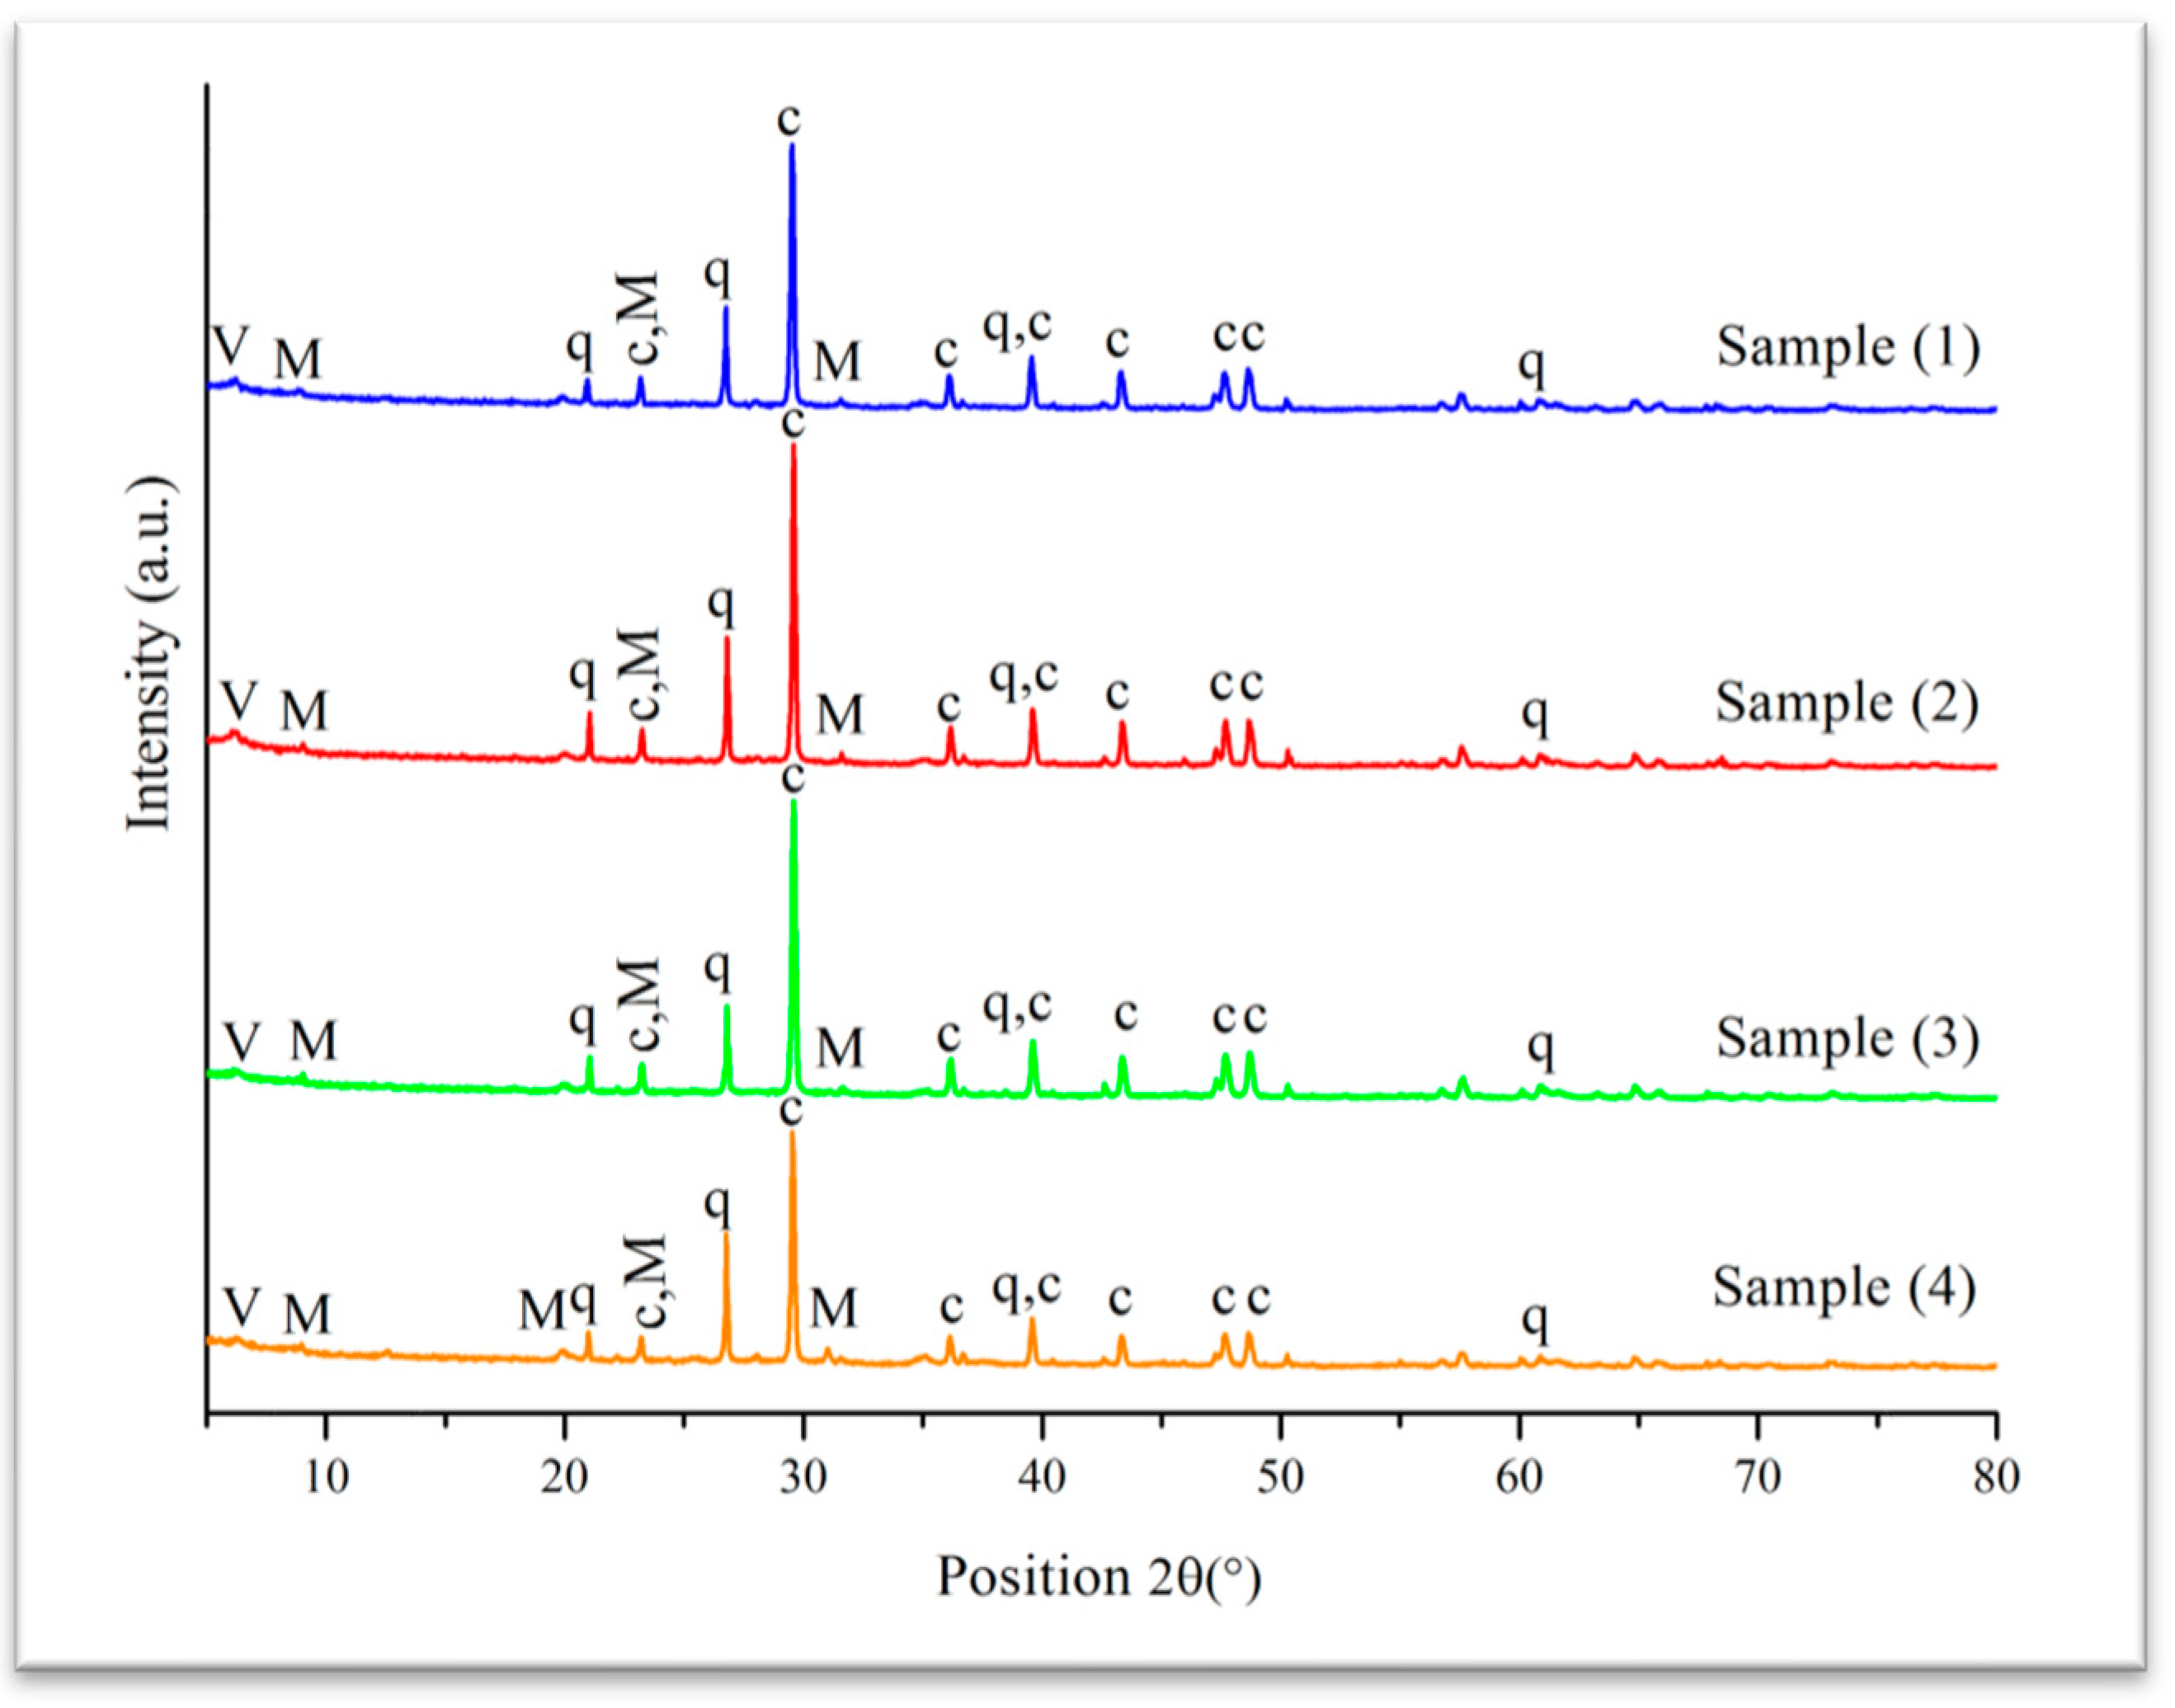
The mineralogical phases of the marl-limestone samples detected by XRD are shown in Figure 12. In all samples, the main phases identified are calcite (CaCO3), quartz (SiO2), muscovite KAl2(AlSi3O10)(OH, F)2, and vermiculite (Mg, Fe, Al)3 (Al, Si)4 O10(OH)2·4H2O. All the marl-limestone samples therefore have the same mineralogical composition, with calcite as the main crystalline phase. Vermiculite and muscovite correspond to the clay minerals present in the marl-limestone.
Figure 12.
X-ray diffractograms of the studied marl-limestone samples (q: quartz; M: muscovite; c: calcite; V: vermiculite).
The clay fraction present in this material is generally known to influence geotechnical behaviour, typically by increasing plasticity and swelling potential. In the present study, plasticity and MBV were measured (Section 4.3), whereas swelling was not; the relation of the clay fraction to the mechanical and NDT parameters could only be discussed qualitatively (Section 4.10).
4.3. Identification of Materials
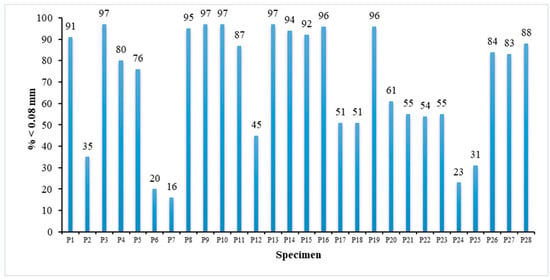
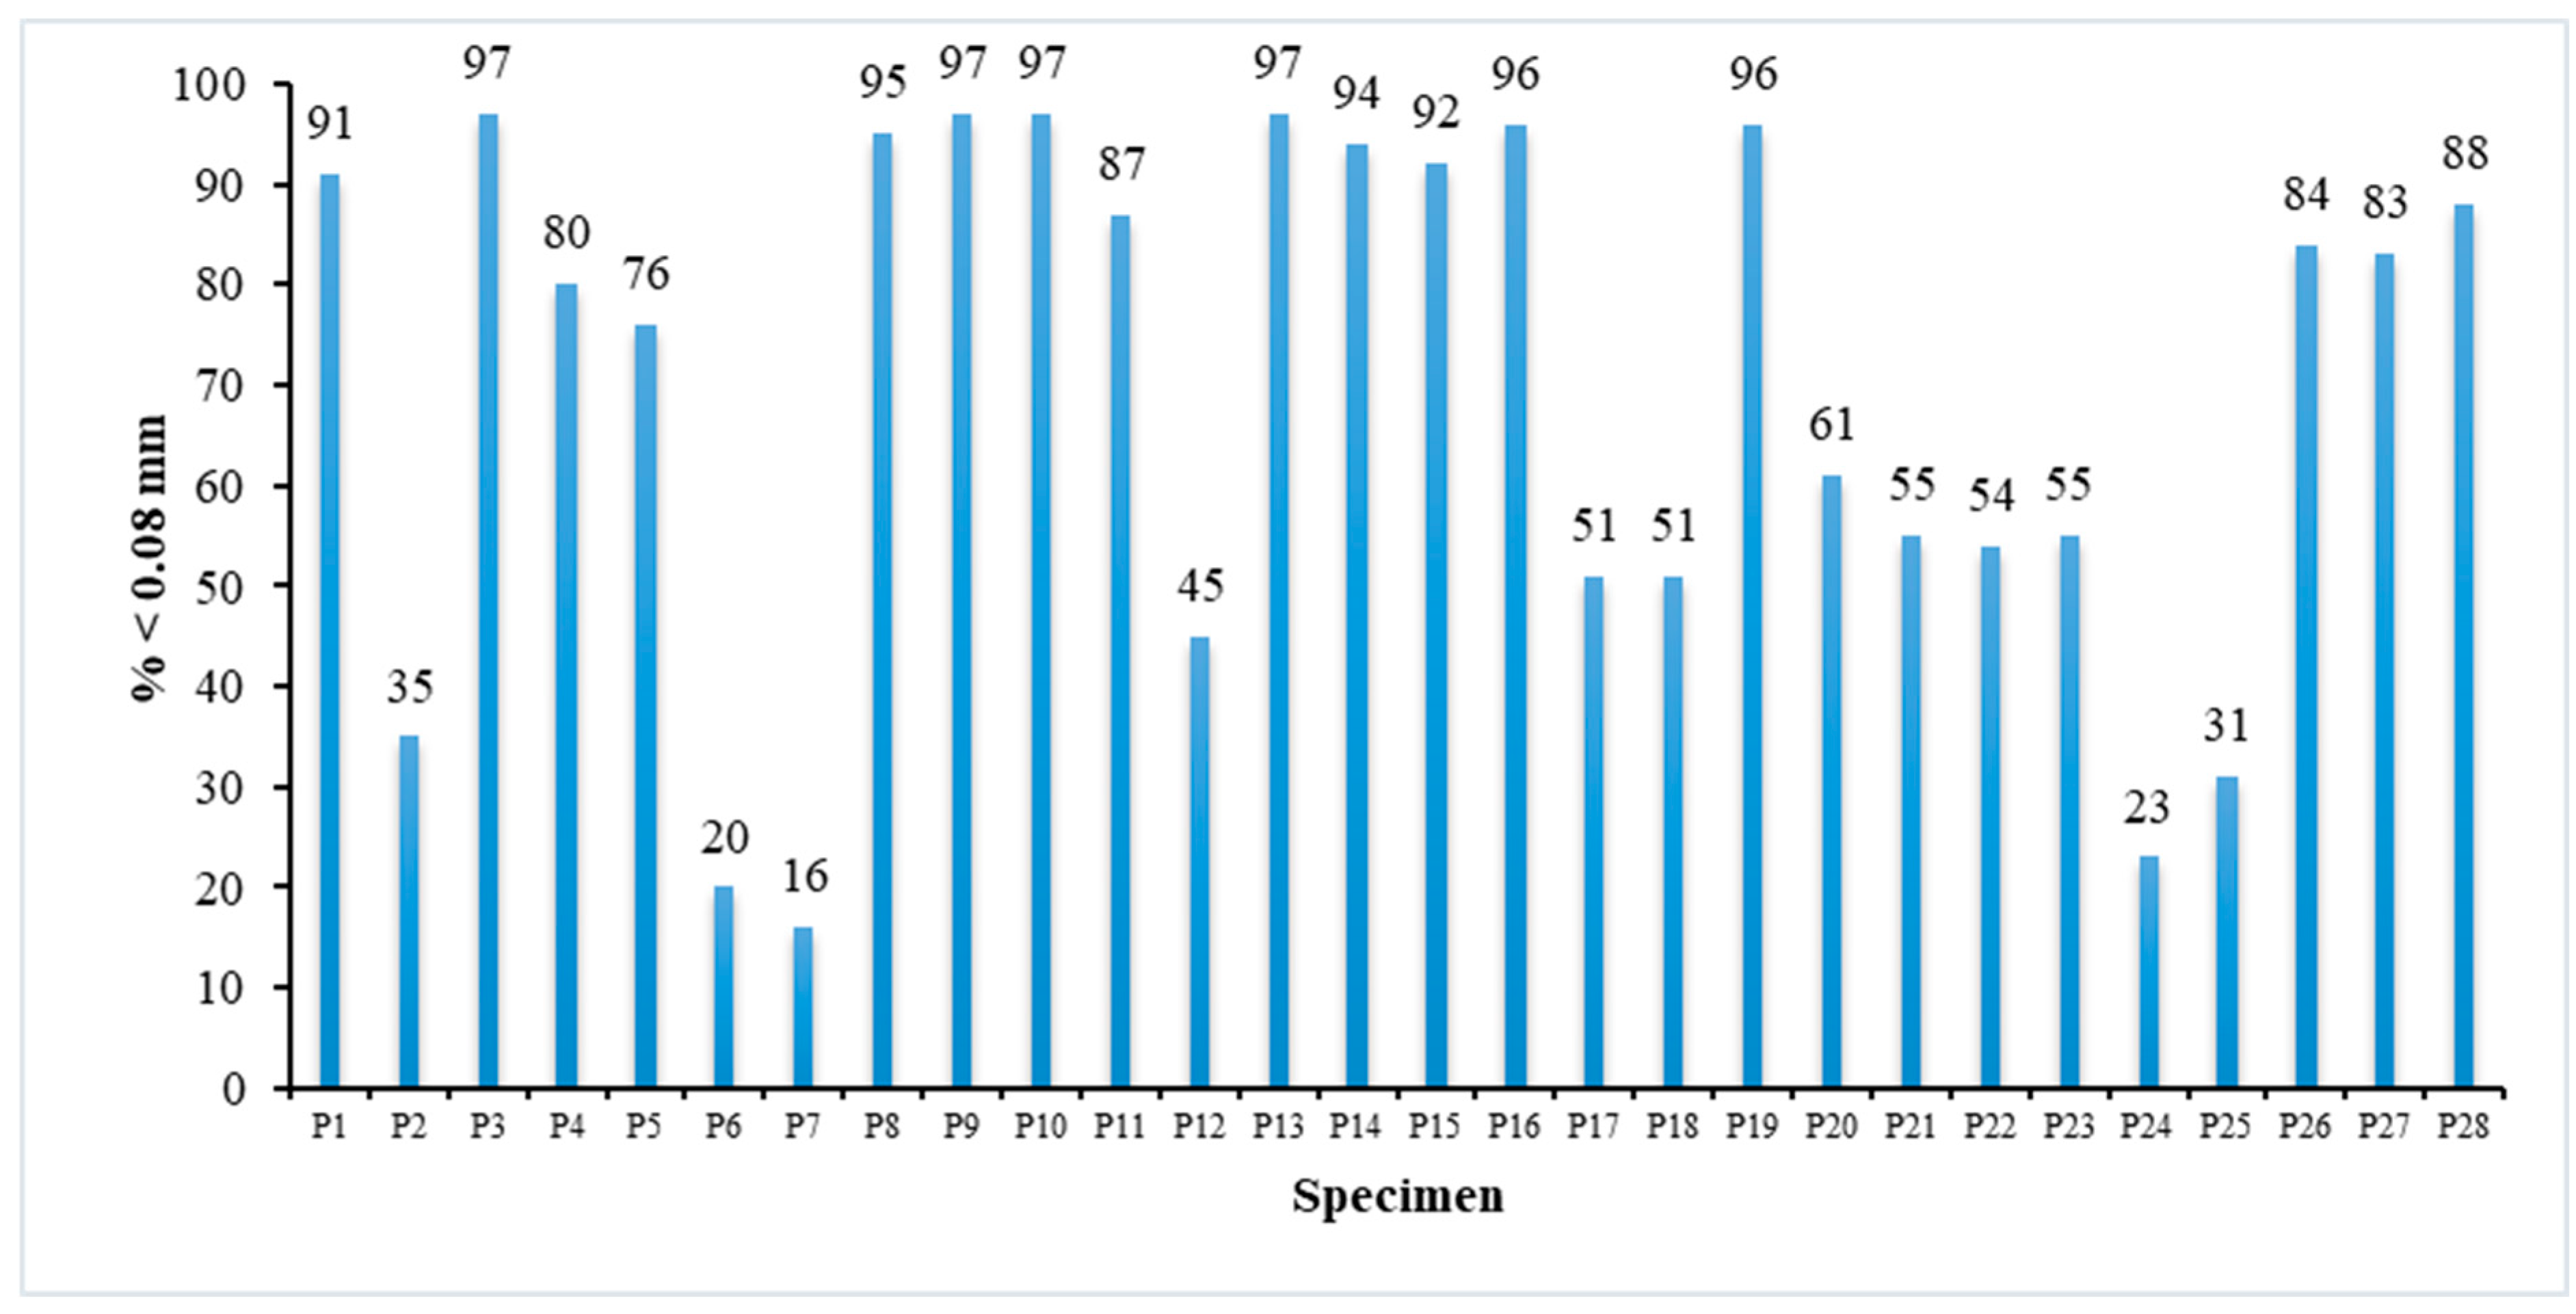
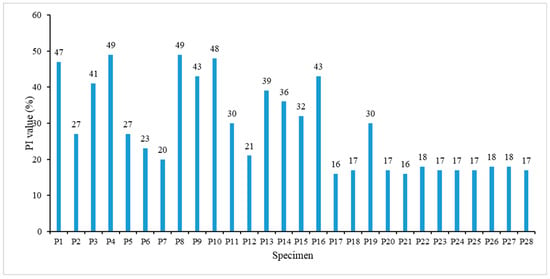
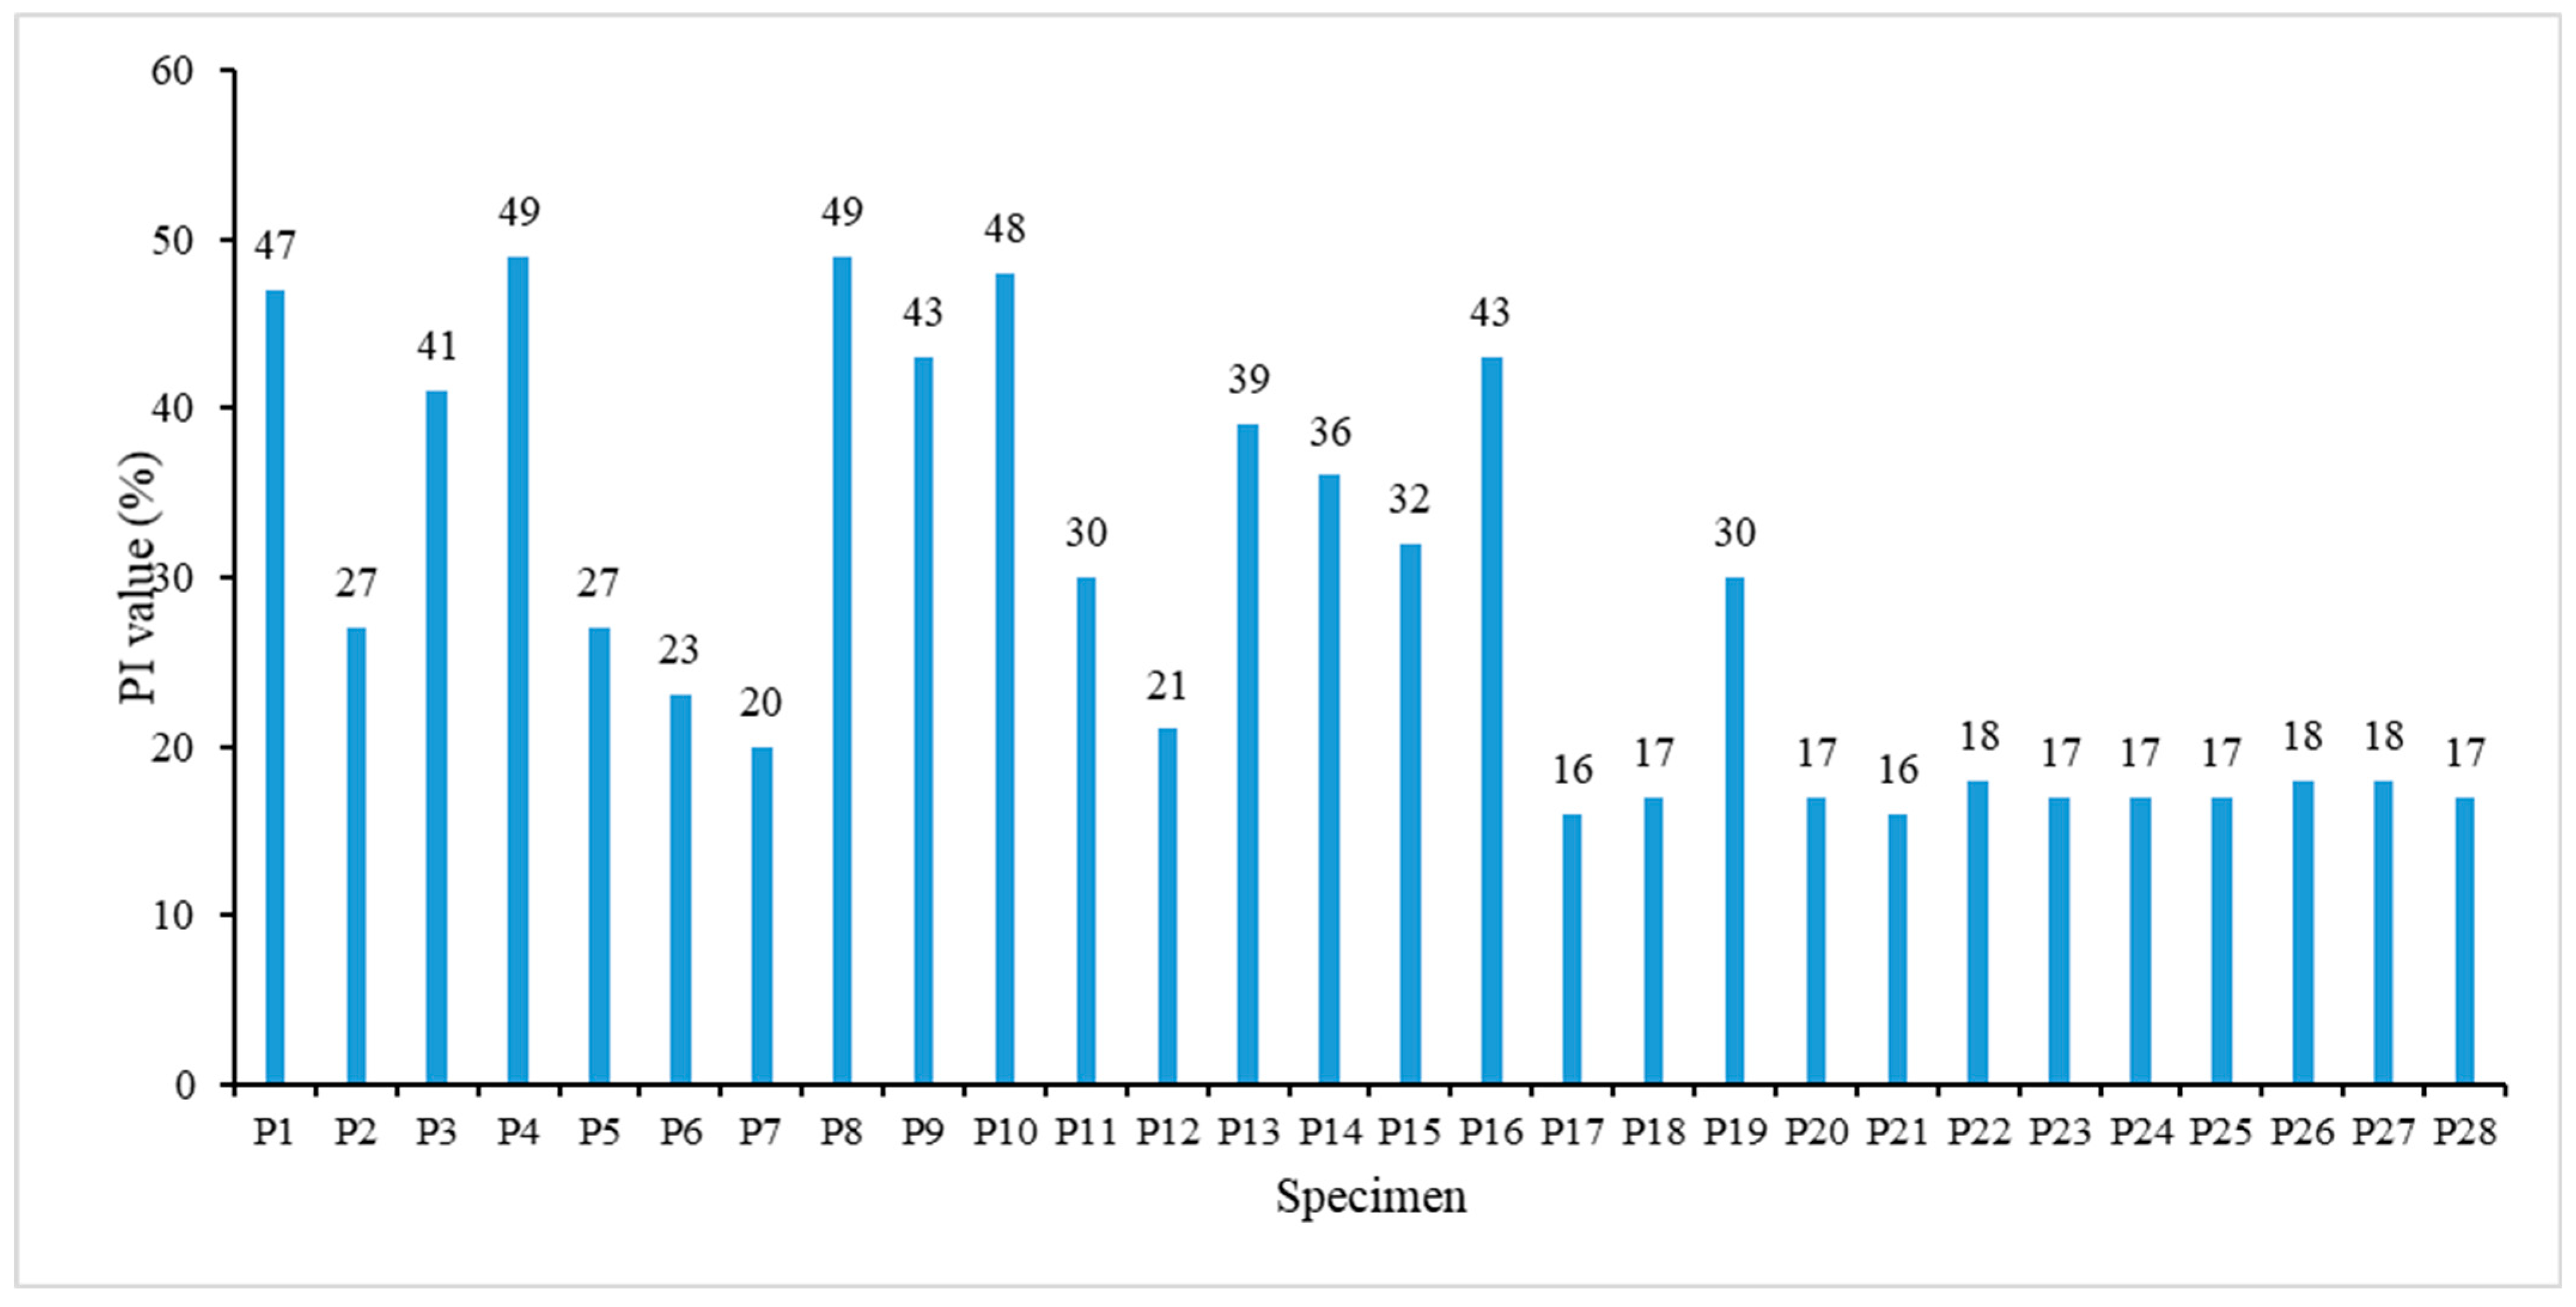
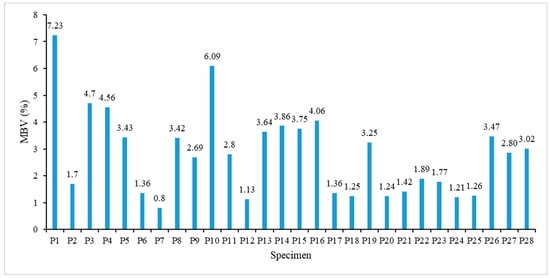
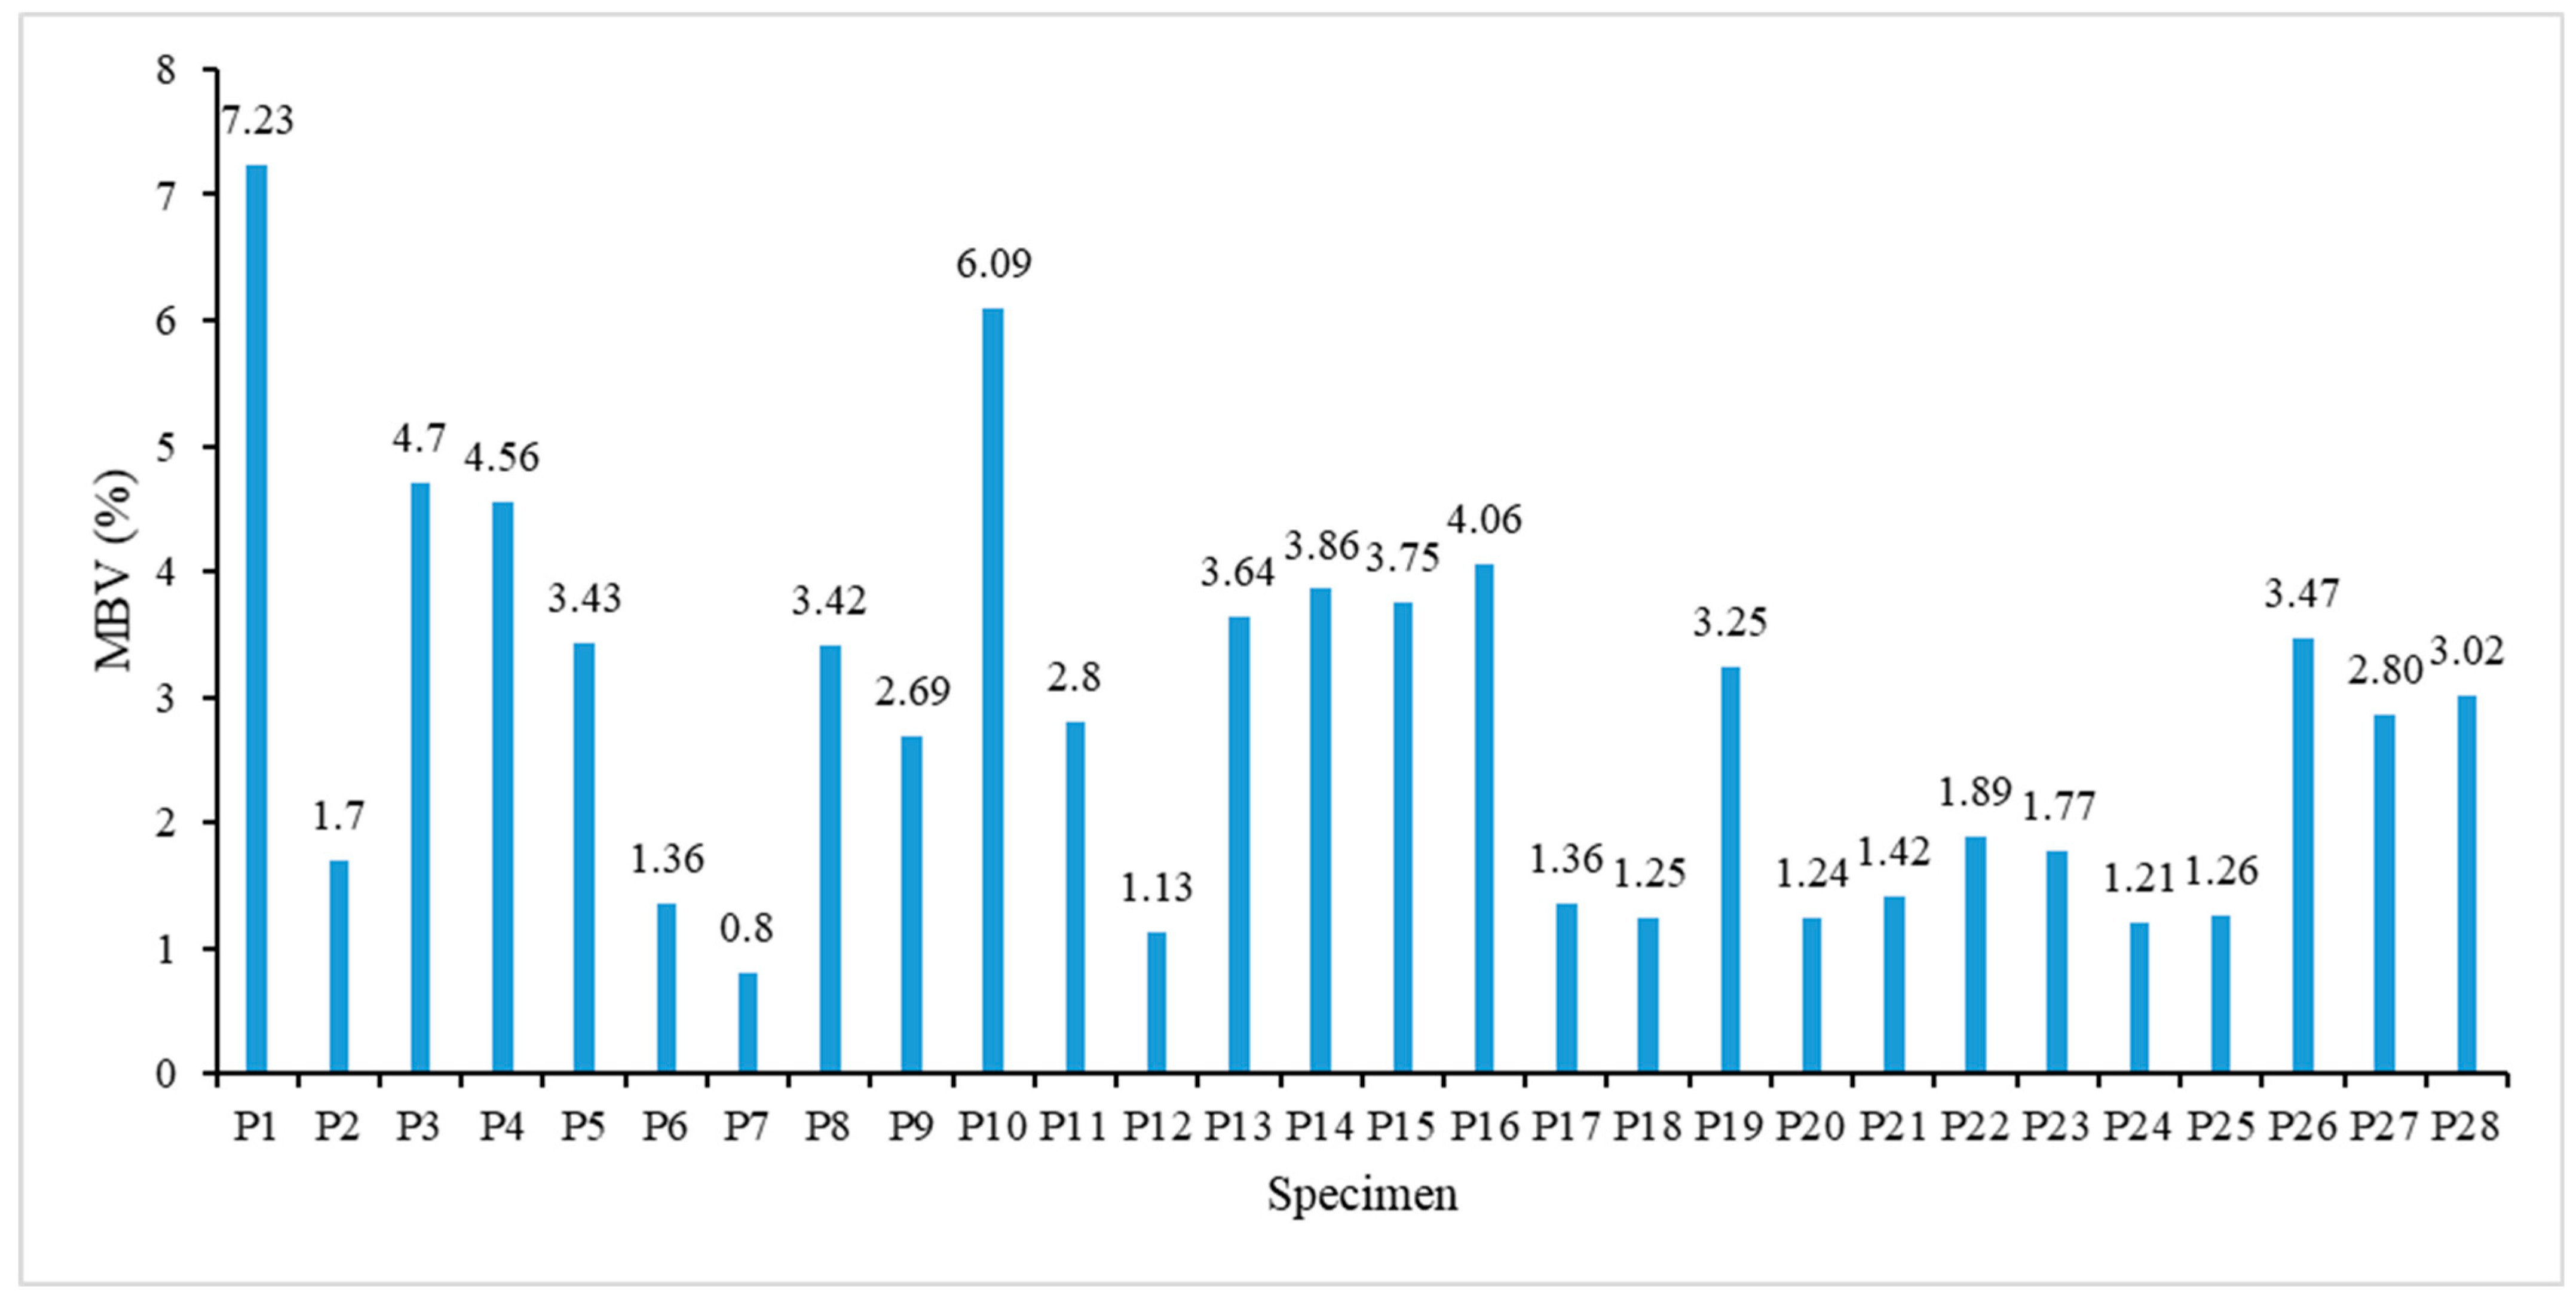
The results of the particle size analysis, plasticity index and methylene blue value (MBV) tests are shown in Figure 13, Figure 14 and Figure 15.
Figure 13.
Particle size analysis results (fines content).
Figure 14.
Plasticity index results.
Figure 15.
Methylene blue value (MBV) results.
The particle size analysis (Figure 13) shows that 86% of the samples contain more than 35% fines, indicating a high proportion of fine particles, whereas 14% have a fines content of 16–35%.
The plasticity index results (Figure 14) indicate that 25% of the samples have a plasticity index greater than 40, 25% a plasticity index of 25–40 and 50% a plasticity index of 12–25. Half of the samples therefore display low plasticity, i.e., a limited ability to deform when subjected to external forces or water; soils with lower plasticity generally provide greater stability and resist deformation under stress.
The MBV results (Figure 15) show that 57% of the samples have an MBV of 2.5–8 and 43% an MBV of 0.8–2. These values suggest moderate to high compressibility, i.e., the material may undergo significant compression or consolidation under load, with a noticeable reduction in volume. This characteristic is important when evaluating the stability and suitability of the material for construction, especially for road embankments.
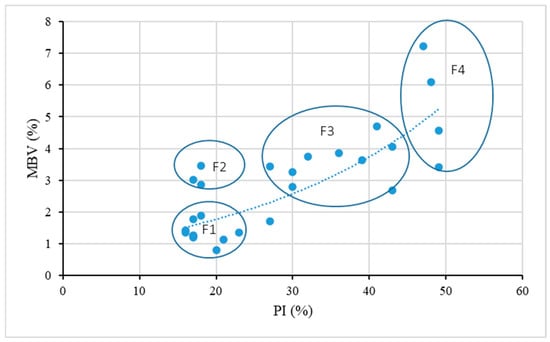
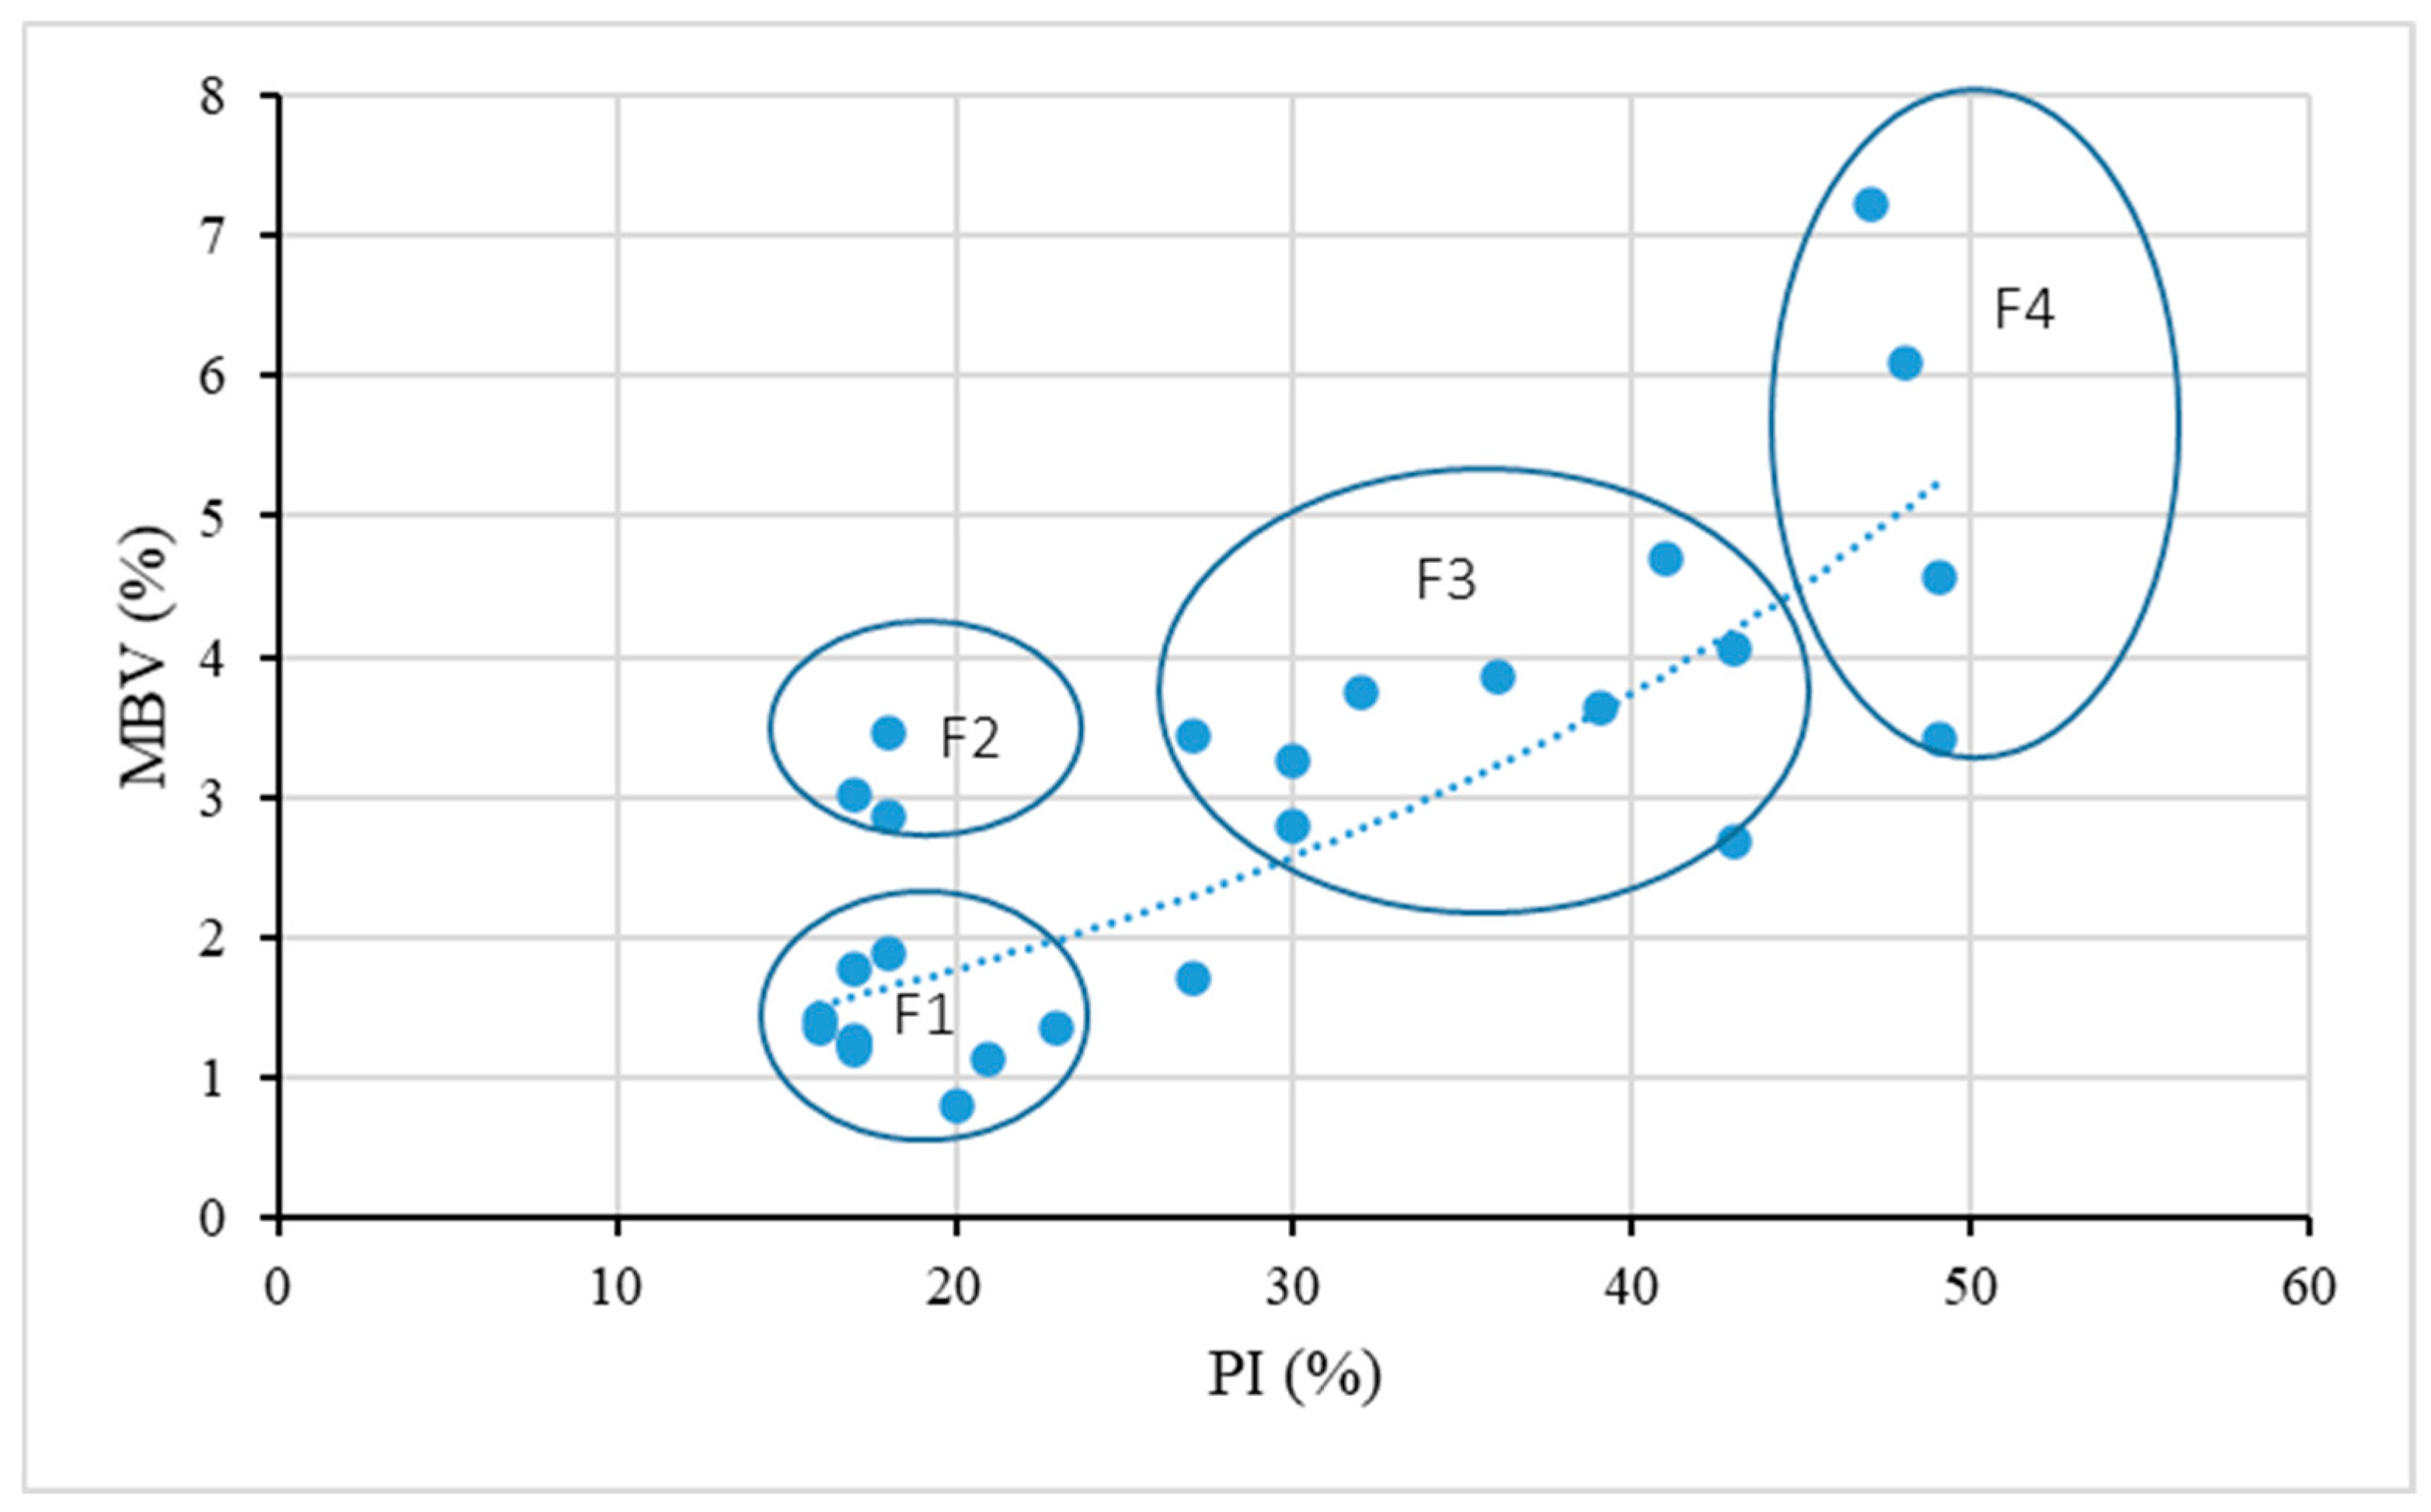
According to the Moroccan GMTR guide for road earthworks [46], the plasticity and MBV results (Figure 16) indicate that 42.86% of the samples belong to group F1 (low plasticity and low MBV), 10.71% to group F2 (low plasticity and medium MBV), 32.14% to group F3 (medium plasticity and medium MBV) and 14.29% to group F4 (high plasticity and high MBV). In total, groups F1, F2, F3 and F4 contain 12, 3, 9 and 4 specimens, respectively (n = 28; Supplementary Table S1). This classification is used to determine the appropriate use of soils in road construction.
Figure 16.
Methylene blue value versus plasticity index.
In summary, 85.71% (groups F1–F3, i.e., 24 of the 28 specimens) of the examined marl-limestone samples are suitable for road embankments [46,47], provided that specific precautions are taken, such as maintaining a fine-grained composition and ensuring adequate waterproofing.
4.4. Degradability and Fragmentability of the Marl-Limestone Samples
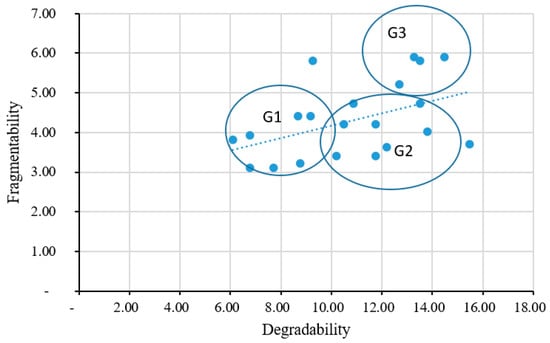
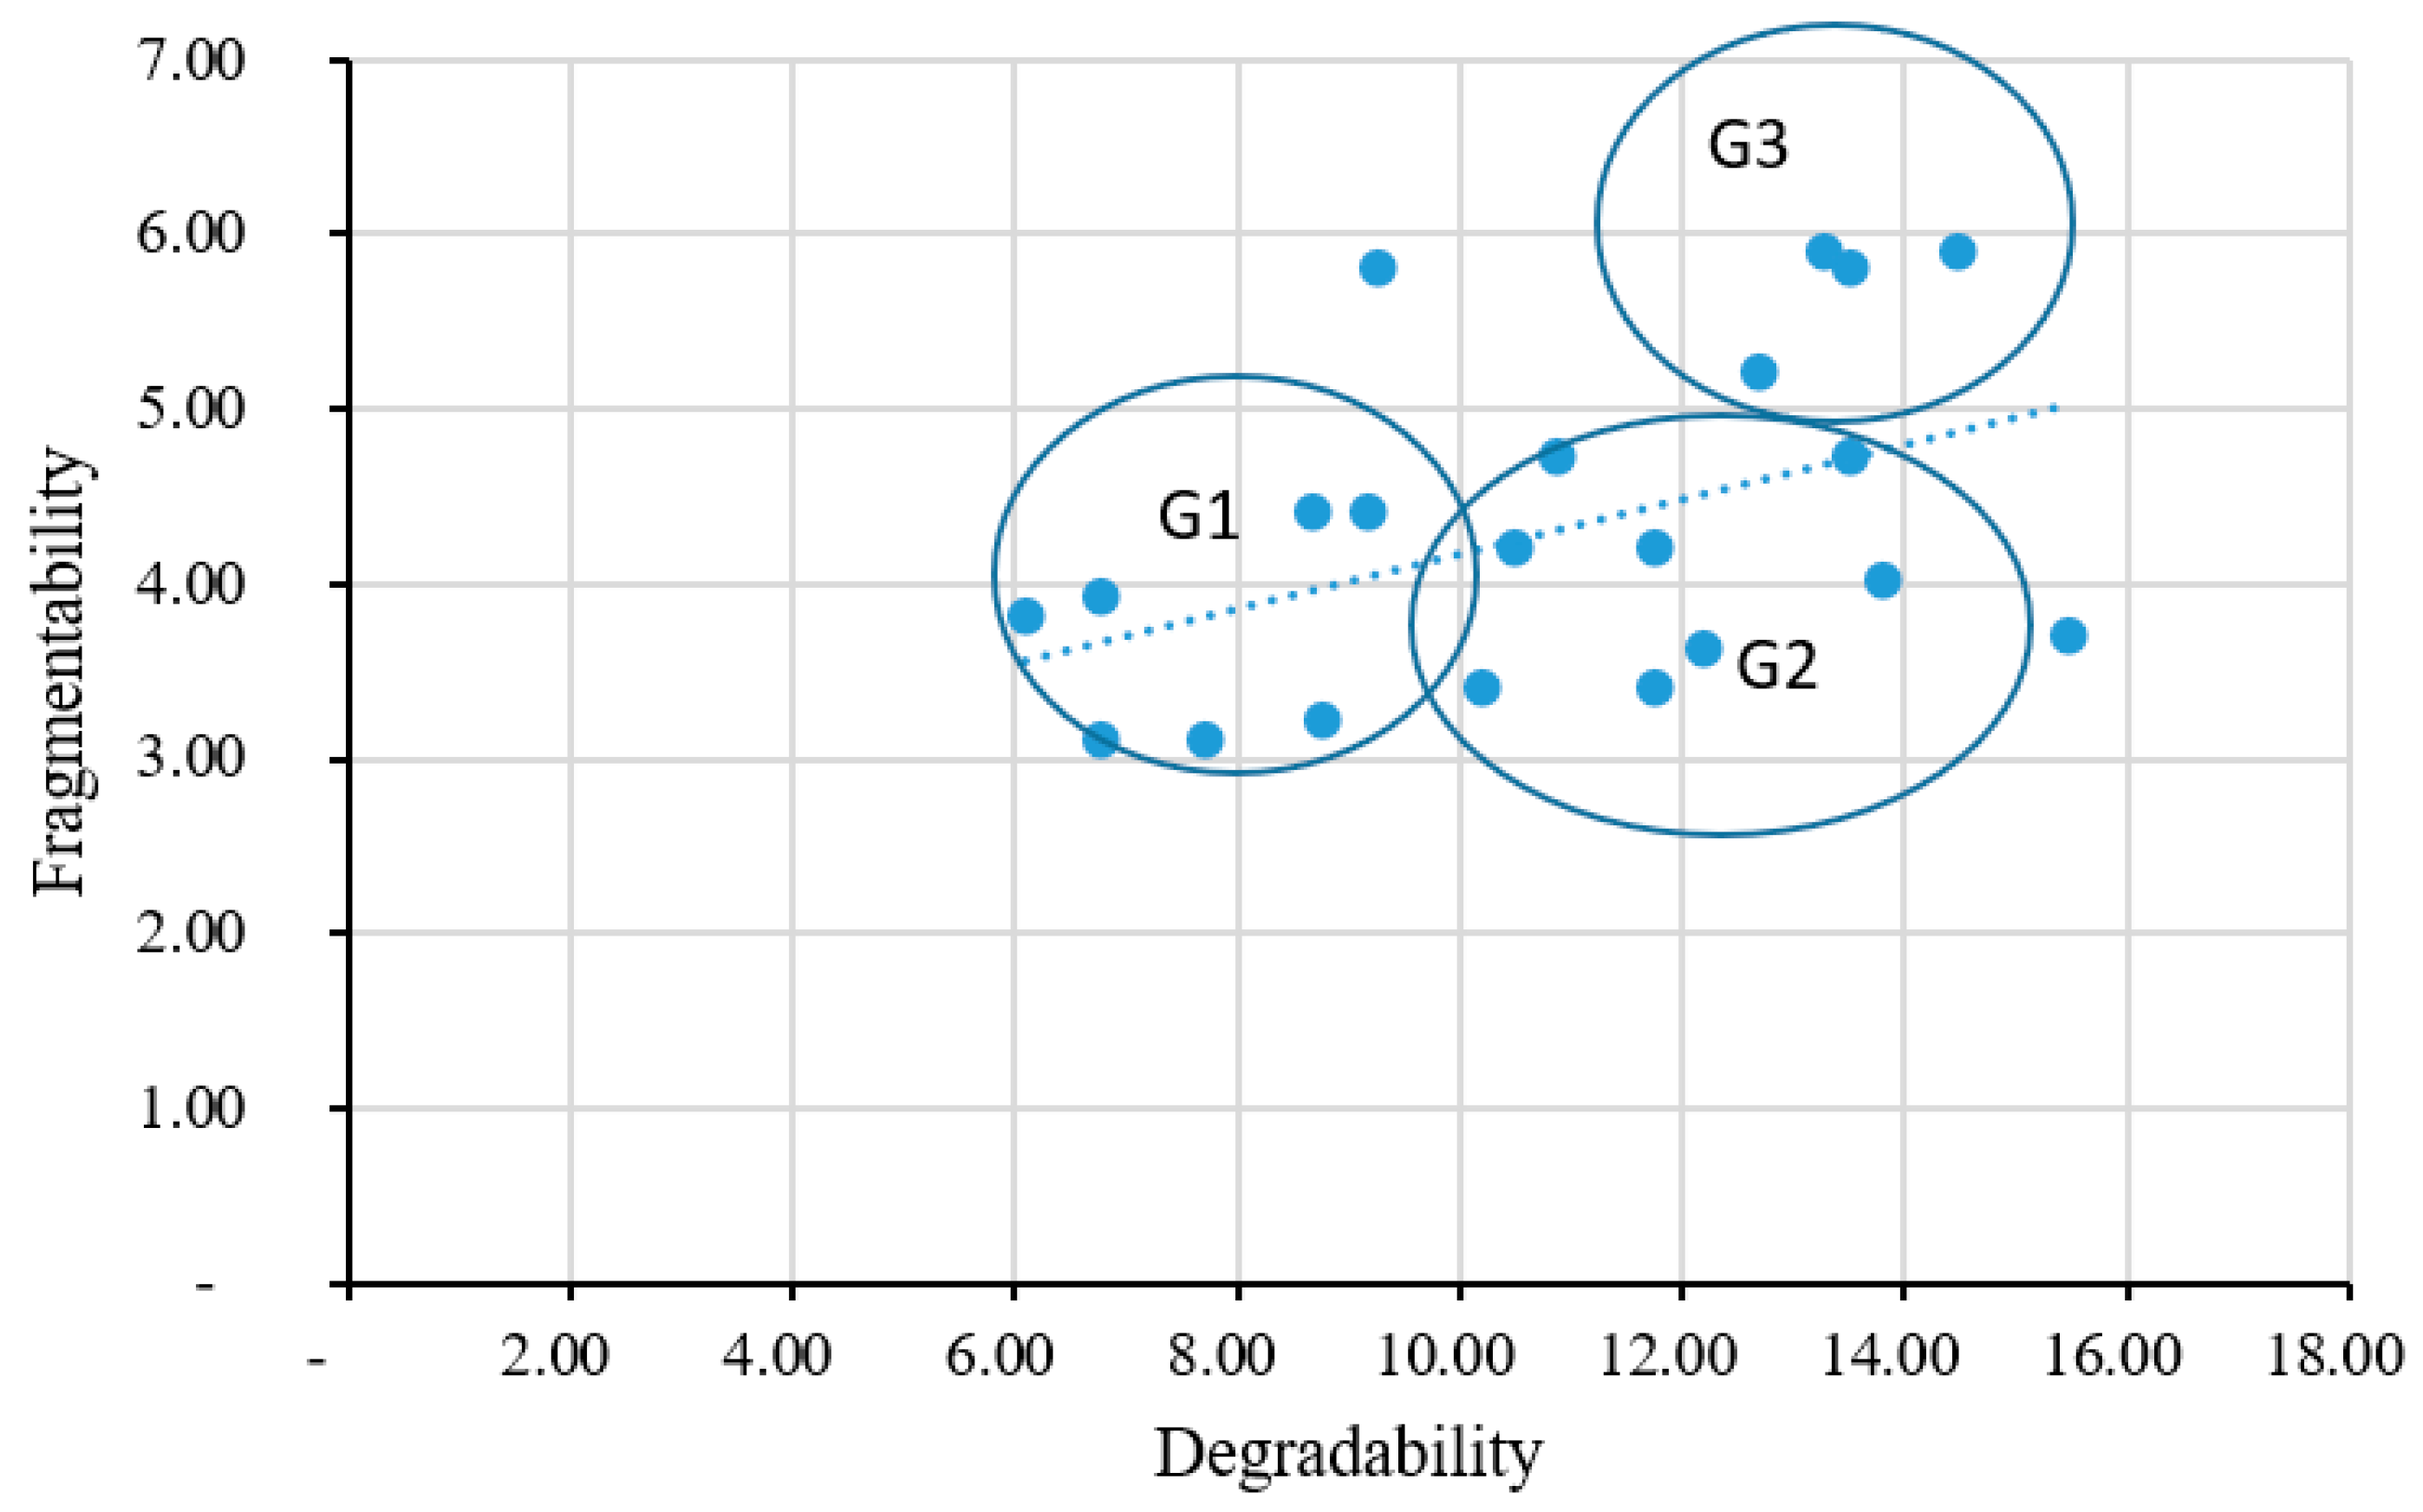
The results of the degradability and fragmentability measurements, presented in Figure 17 (n = 21 specimens), show a distinct grouping of the samples: group G1 (33% of the samples) is characterised by 6 < DG < 10 and FR < 5, group G2 (38%) by 10 < DG < 12 and FR < 5, and group G3 (29%) by 12 < DG < 15 and 5 < FR < 7, where DG and FR are the degradability and fragmentability coefficients.
Figure 17.
Fragmentability coefficient versus degradability coefficient.
According to the GMTR guidelines [46,47], the tested marl-limestone samples display moderate degradability and low fragmentability. Thus, although these materials may undergo some degradation, they do not fragment easily, which is an important consideration for their use in road embankments.
4.5. Calcimetry Results
Calcimetry tests on the four sample groups determined the carbonate content (% CaCO3) of the marl-limestone samples by reaction with hydrochloric acid. According to the classification of standard NM 13-1-029 [45], which is based on the mass percentage of carbonate, the material of the study site qualifies as marl-limestone, with an average CaCO3 content of 75.07% (Table 1 and Table 2).
Table 1.
Calcimetry results.
Table 2.
Classification of materials by carbonate content (Appendix B of NM 13-1-029 [45]).
4.6. Correlation Between UCS and P-Wave Velocity
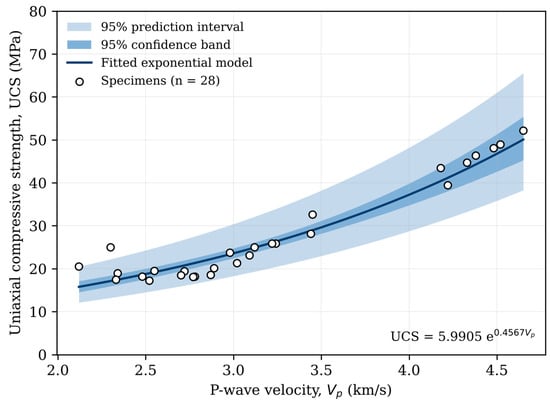
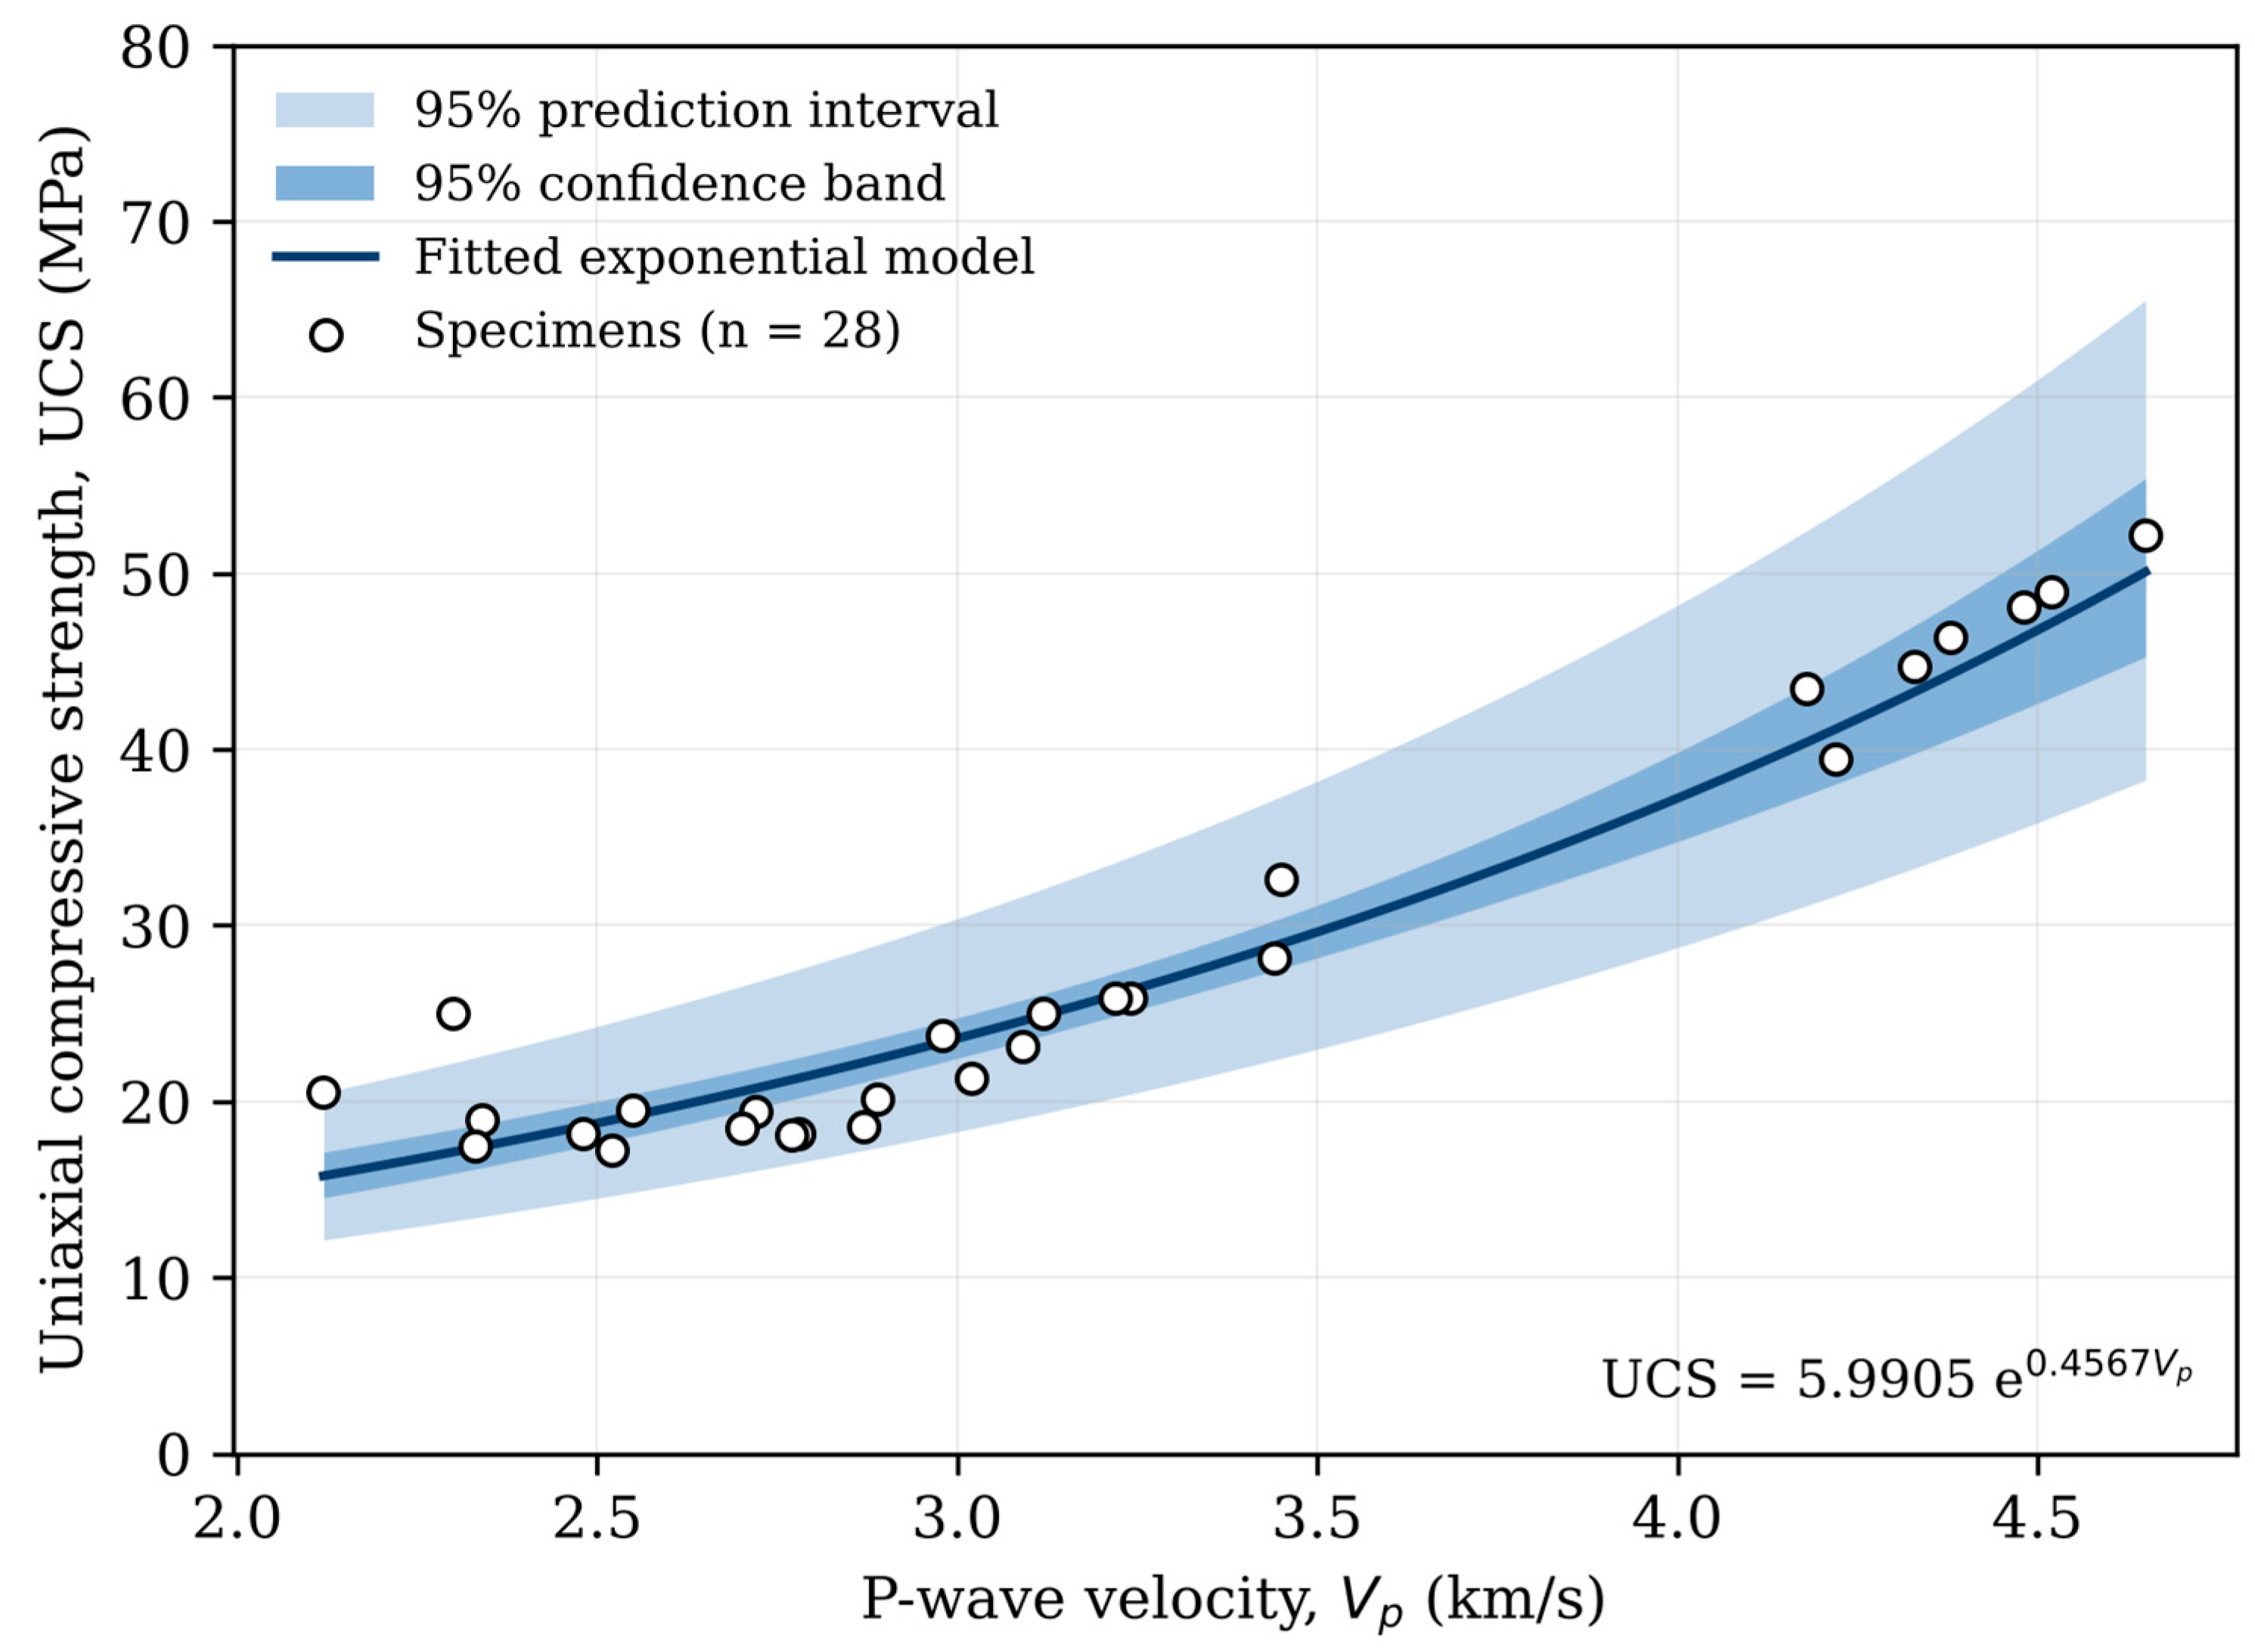
The results in Figure 18 show the relationship between UCS and P-wave velocity (mean of the two transmission directions along the core axis; Section 3.10). The data follow an exponential law. Linear, power and exponential models were tested; the exponential form gave the best calibration fit (R2 = 0.95 vs. 0.91 for both the linear and power forms) and also the lowest cross-validated error and (Section 4.8) was therefore retained.
Figure 18.
Uniaxial compressive strength (UCS) as a function of P-wave velocity (Vp): fitted exponential model, 95% confidence band and 95% prediction interval (n = 28).
The exponential UCS–Vp relationship is highly significant (F(1,26) = 231, p < 0.0001, n = 28; 95% CI of the exponent = [0.395, 0.518]). On the original scale, the fitted equation gives R2 = 0.95, RMSE = 2.6 MPa and MAE = 2.0 MPa; under internal leave-one-out cross-validation these become Q2 = 0.94, RMSECV = 2.8 MPa and MAECV = 2.1 MPa (Section 4.8). The 95% prediction interval (Figure 18) corresponds approximately to a factor of ×/÷1.28 around the fitted value, e.g., 12–21 MPa at Vp = 2.12 km/s and 38–66 MPa at Vp = 4.65 km/s.
Table 3 lists published UCS–Vp equations with their units, rock types, original calibration ranges (where available) and original R2, together with the errors obtained when each equation is applied to the present dataset. Within the calibration range (Vp = 2.12–4.65 km/s; UCS = 17.2–52.2 MPa), Vp can be used as the independent variable to estimate the UCS of the Taza marl-limestone. The regression describes a statistical association with a defined dependent variable; it does not imply that the two parameters are interchangeable, and it should not be extrapolated outside this range.
Table 3.
Published correlations between UCS and P-wave velocity (units, rock type, original R2 and performance when applied to the present Taza dataset) compared with the correlation of this study.
The original R2 values in Table 3 cannot be used to rank the reliability of the equations, because they were derived from different lithologies, strength ranges, sample sizes, moisture states and test procedures. A meaningful comparison requires evaluating all equations against the same observations with common error metrics, which is done in Section 4.9.
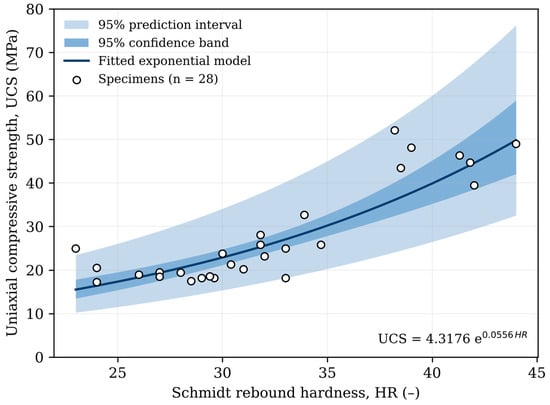
4.7. Correlation Between UCS and Schmidt Rebound Hardness
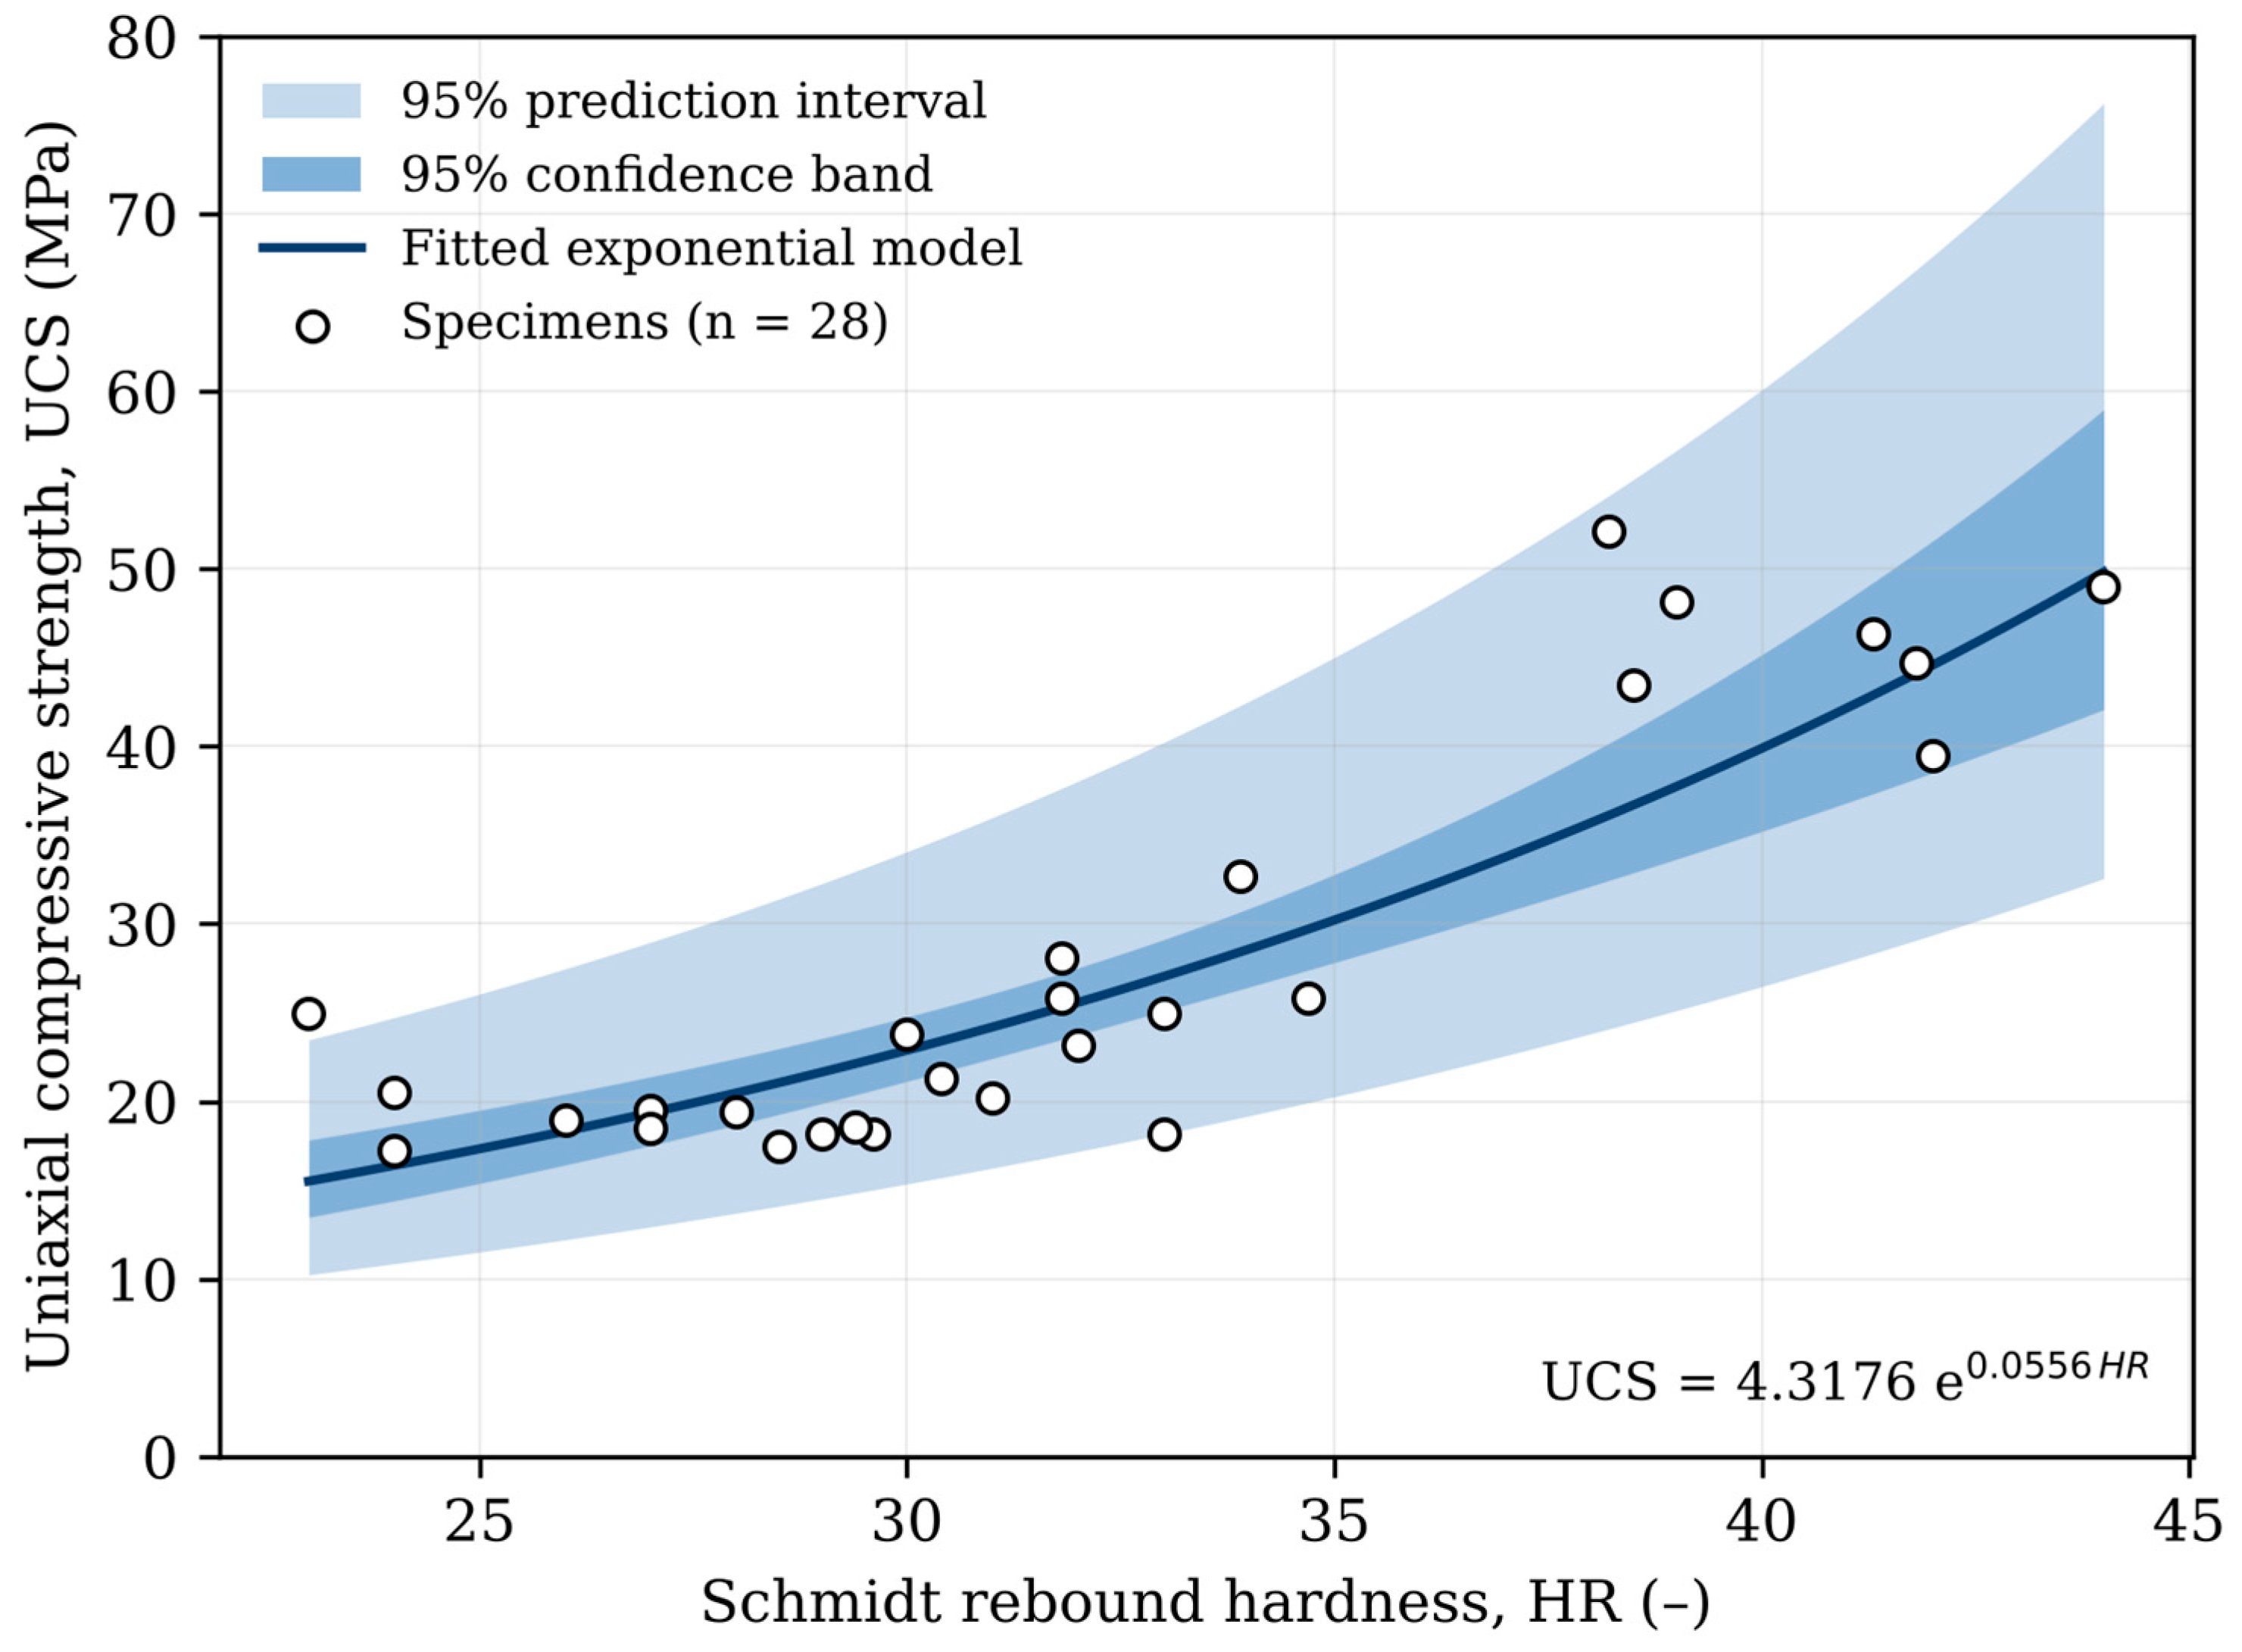
The results presented in Figure 19 show the correlation between UCS and Schmidt rebound hardness (HR; mean of 20 impacts corrected for impact orientation, Section 3.9). The data follow an exponential law. Linear, power and exponential models were tested; the exponential form gave the best calibration fit for HR (R2 = 0.79 vs. 0.75 for the linear and 0.76 for the power form) and also the lowest cross-validated error and (Section 4.8) was therefore retained.
Figure 19.
Uniaxial compressive strength (UCS) as a function of Schmidt rebound hardness (HR, dimensionless): fitted exponential model, 95% confidence band and 95% prediction interval (n = 28).
The exponential UCS–HR relationship is significant (F(1,26) = 78.8, p < 0.0001, n = 28; 95% CI of the exponent = [0.043, 0.068]). On the original scale it gives R2 = 0.79, RMSE = 5.2 MPa and MAE = 3.8 MPa, and under LOOCV Q2 = 0.75, RMSECV = 5.6 MPa and MAECV = 4.1 MPa. The prediction error is about twice that of the UCS–Vp model, and the 95% prediction interval is correspondingly wider (factor ×/÷1.48; e.g., 10–23 MPa at HR = 23 and 33–76 MPa at HR = 44; Figure 19).
The values in Table 4 display UCS and Schmidt rebound hardness across various samples. A coefficient of determination (R2) of 0.79 indicates a moderate positive correlation between UCS and Schmidt rebound hardness. Schmidt rebound hardness generally increases with UCS; however, the moderate correlation indicates some scatter, implying that other factors may also influence the two parameters. Given its larger prediction error, the UCS–HR relationship should be regarded as a complementary, screening-level estimate and not as a substitute for the UCS–Vp relationship. HR denotes the dimensionless Schmidt rebound number and has no stress unit.
Table 4.
Published correlations between UCS and Schmidt rebound hardness (hammer type, rock type, original R2 and performance when applied to the present Taza dataset) compared with the correlation of this study.
4.8. Cross-Validation and Residual Analysis
Table 5 compares the three model forms on the basis of calibration and leave-one-out cross-validated performance. For both predictors, the exponential form gives the lowest calibration and cross-validated errors, and the decrease from R2 to Q2 is small (0.95 to 0.94 for Vp; 0.79 to 0.75 for HR), indicating limited over-fitting. Repeated 5-fold cross-validation (200 repetitions) gave consistent results: Q2 = 0.938 ± 0.005 and RMSECV = 2.82 ± 0.11 MPa for Vp, and Q2 = 0.747 ± 0.020 and RMSECV = 5.69 ± 0.22 MPa for HR (mean ± standard deviation). In relative terms, under internal cross-validation, the UCS–Vp model predicts the UCS of a specimen excluded from calibration with a mean absolute percentage error of 8.7%, compared with 14.9% for the UCS–HR model. These cross-validated errors characterise the precision of the equations for specimens of the sampled Taza material; in the absence of an independent external dataset, they should not be interpreted as the accuracy to be expected at other sites or for field measurements (Section 4.11).
Table 5.
Calibration and leave-one-out cross-validated performance of the linear, power and exponential models (n = 28; bias = predicted − measured).
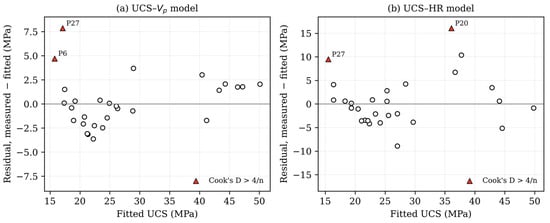
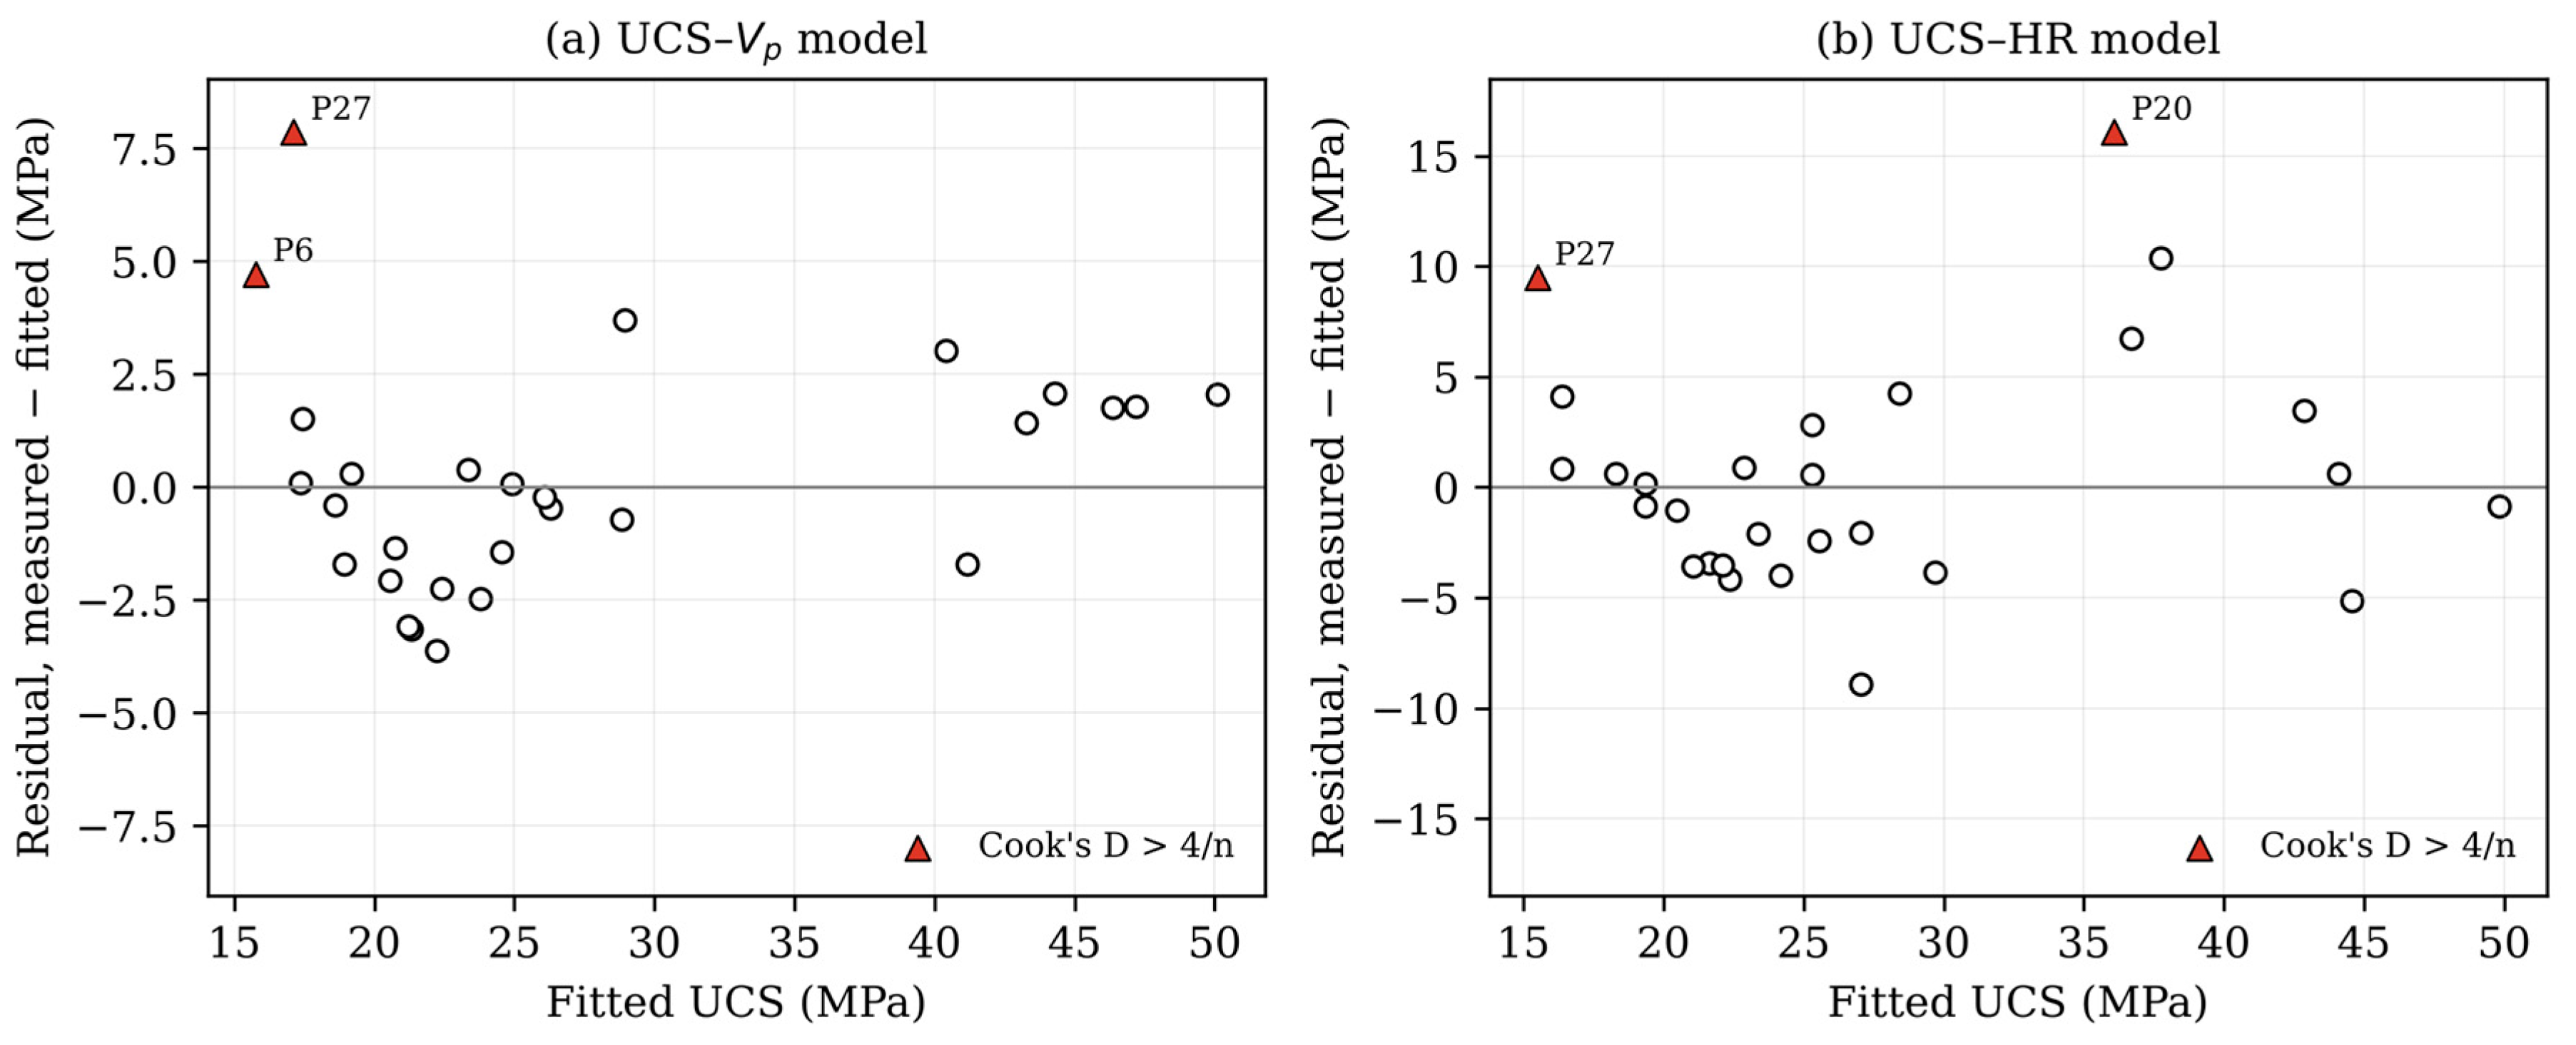
Residuals of the two retained models are plotted against fitted values in Figure 20. For the UCS–HR model, the residuals are approximately normal (Shapiro–Wilk p = 0.52) and homoscedastic (Breusch–Pagan p = 0.44); specimens P20 and P27 exceed the Cook distance threshold of 4/n but remain well below 1. For the UCS–Vp model, specimens P6 and P27 have studentized residuals greater than 2 and Cook’s distances above 4/n (maximum 0.50, below the conventional critical value of 1); they cause non-normality (Shapiro–Wilk p = 0.009) and mild heteroscedasticity (Breusch–Pagan p = 0.04) of the log-residuals. No experimental anomaly was identified for these specimens in the test records, so they were retained; excluding them would raise the apparent fit to R2 = 0.98 (RMSE = 1.6 MPa), which would be optimistic. Figure 20a also shows a weak systematic pattern, with negative residuals for fitted values of 19–27 MPa and positive residuals above 40 MPa. Moreover, the Vp values form two clusters (2.12–3.45 km/s and 4.18–4.65 km/s) with no specimen between 3.45 and 4.18 km/s: the high R2 is partly driven by this separation, and predictions within this interval are interpolations not directly supported by data. Finally, the water content of the specimens was not correlated with UCS, Vp or HR (|r| ≤ 0.03, p > 0.88), nor with the residuals of either model (p > 0.75), indicating that the small moisture variations between specimens (1.8–3.2%) did not influence the correlations.
Figure 20.
Residuals of the retained exponential models versus fitted UCS: (a) UCS–Vp; (b) UCS–HR. Specimens with Cook’s distance > 4/n are highlighted.
4.9. Transferability of Published Equations to the Taza Marl-Limestone
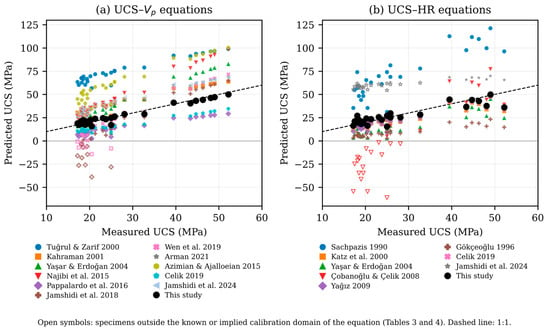
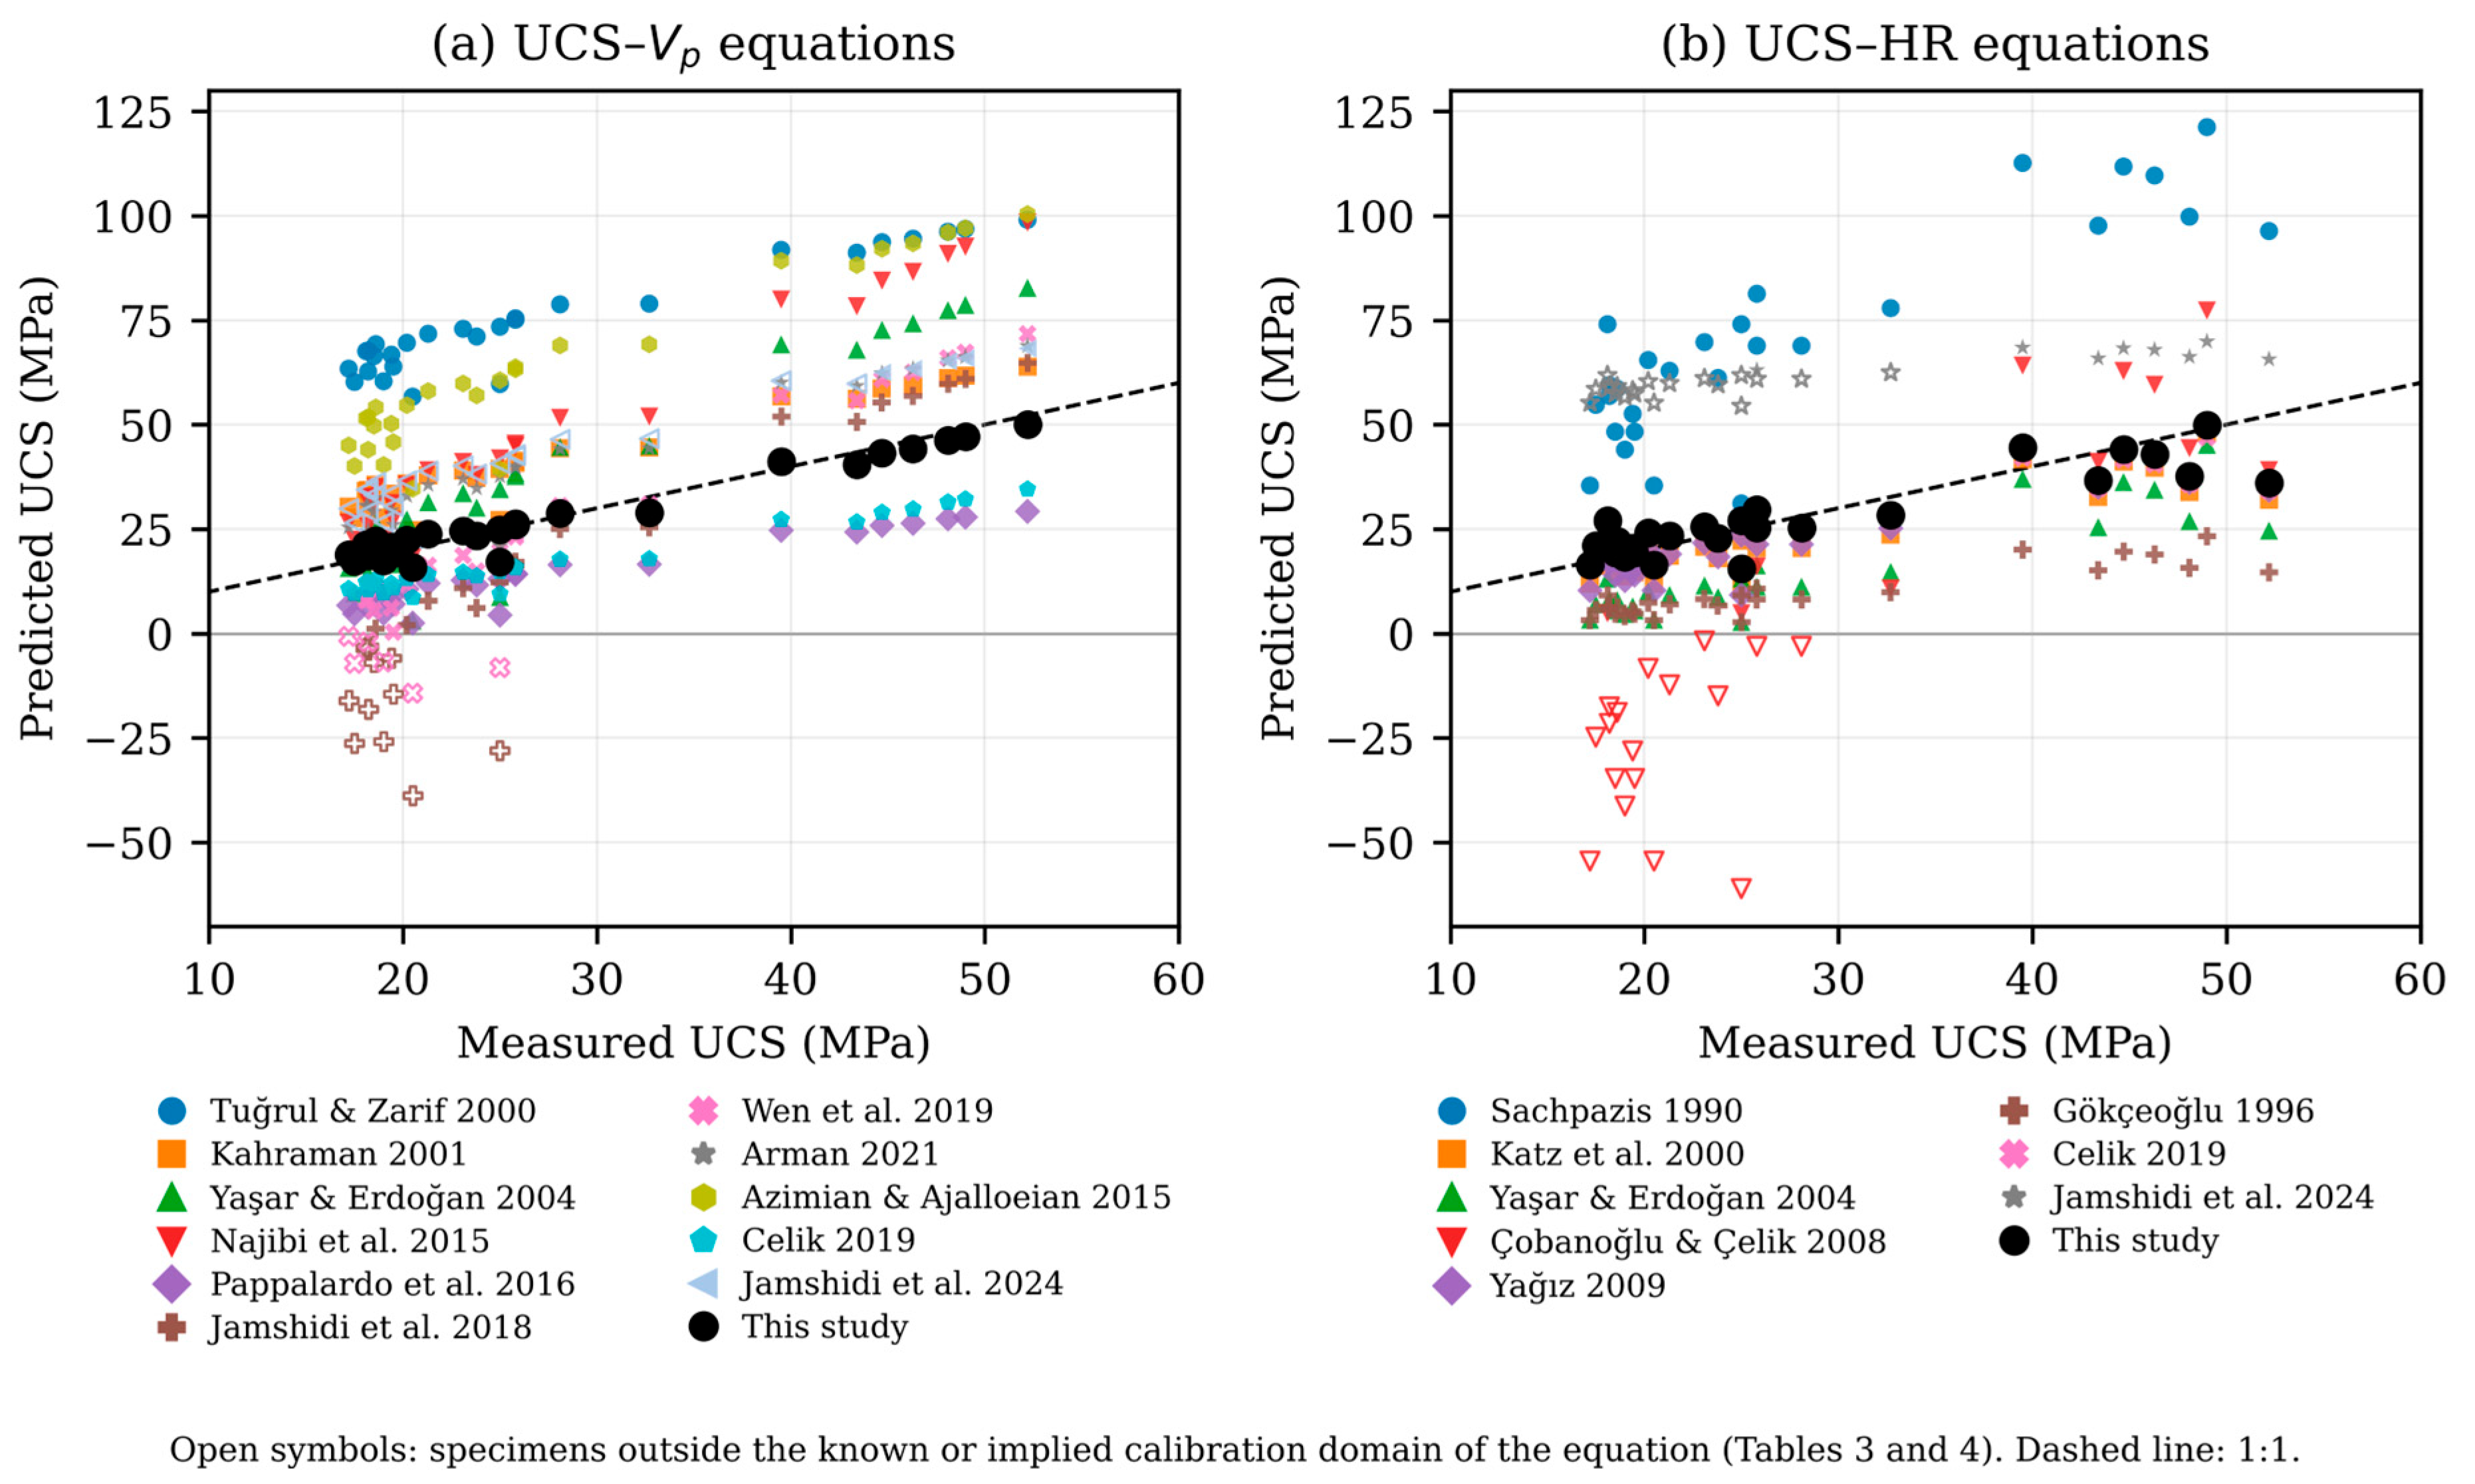
Figure 21 and Table 3 and Table 4 show the performance of published equations applied to the 28 Taza specimens. Two questions must be distinguished: (i) whether a published equation can be transferred to the Taza marl-limestone, which is what this comparison tests, and (ii) whether the equation is valid within its own calibration domain, which this comparison cannot test. Large errors obtained when an equation is applied outside the ranges of predictor and strength from which it was derived reflect extrapolation and do not, by themselves, indicate that the published model is inadequate. The original calibration ranges could be verified for only one study [33]; for the other equations they are not reported in the compilations used, so the degree of extrapolation can only be partly assessed, using the domain limits implied by the equations themselves (Table 3 and Table 4).
Figure 21.
Measured versus predicted UCS for the 28 Taza specimens using published equations and the site-specific equations of this study: (a) UCS–Vp; (b) UCS–HR. Published equations: (a) Tuğrul and Zarif [20], Kahraman [26], Yaşar and Erdoğan [19], Najibi et al. [21], Pappalardo et al. [22], Jamshidi et al. [23], Wen et al. [24], Arman [15], Azimian and Ajalloeian [36], Celik [48] and Jamshidi et al. [33]; (b) Sachpazis [27], Katz et al. [28], Yaşar and Erdoğan [29], Çobanoğlu and Çelik [25], Yağız [30], Gökçeoğlu [37], Celik [48] and Jamshidi et al. [33]. Dashed line: 1:1. Open symbols: specimens outside the known or implied calibration domain of the equation (Table 3 and Table 4).
All eleven published UCS–Vp equations give large errors on the Taza dataset (RMSE = 11.4–47.2 MPa; MAE = 10.7–47.0 MPa), i.e., 4.1 to 17 times the cross-validated RMSE of the site-specific equation (2.8 MPa). Part of these errors is clearly due to extrapolation. The equations of [23,24] predict UCS ≤ 0 below Vp = 2.84 and 2.54 km/s, respectively, and therefore return negative values for 11 and 6 Taza specimens; when these specimens, which lie outside the domain where the equations are physically meaningful, are excluded, the RMSE decreases from 25.7 to 12.2 MPa and from 16.4 to 12.1 MPa, and the bias almost vanishes (−2.5 and +0.4 MPa). Similarly, the UCS of all Taza specimens (17.2–52.2 MPa) lies below the strength range of the Asmari limestones used in [33] (61.1–79.2 MPa), and only five of the 28 specimens fall within its Vp range (4.31–5.30 km/s). Even for these five specimens, however, the equation of [33] over-predicts UCS by about 17 MPa (RMSE = 17.0 MPa, compared with 2.1 MPa for the site-specific LOOCV predictions of the same specimens), which indicates that, at similar Vp, the Taza material is weaker than the Asmari limestone. More generally, seven of the eleven equations systematically over-predict UCS (bias from +9.4 to +47.0 MPa), including the equation established on Iranian marls [36] (bias +35.0 MPa). This systematic over-prediction is consistent with the clay-bearing Taza marl-limestone being weaker, at a given Vp, than the materials used to derive these equations, but it cannot be attributed to lithology alone, because the original calibration ranges of most equations are unknown and differences in testing configuration (specimen size, moisture condition, transducer frequency) may also contribute. The multiple-regression equations combining Vp and Schmidt hardness [33,34] do not perform better (RMSE = 19.1 and 12.0 MPa).
For the Schmidt hammer, the exponential equation of Celik [48], derived for carbonate rocks, performs comparably to the site-specific equation (RMSE = 5.7 MPa, bias −1.9 MPa, versus RMSECV = 5.6 MPa, biasCV = −0.6 MPa), and those of Yağız [30] and Katz et al. [28] are only slightly less accurate (RMSE = 6.7 and 7.1 MPa, with a systematic underestimation of about 4–5 MPa). The large error of the linear equation of Çobanoğlu and Çelik [25] (RMSE = 40.1 MPa) is mainly due to extrapolation: it returns UCS ≤ 0 for HR < 32.3, i.e., for 17 of the 28 specimens, whereas for the remaining 11 specimens its RMSE is 17.2 MPa with no bias. The equation of [33] was established with an N-type hammer on stronger rock (HRN = 34–55; UCS = 61.1–79.2 MPa) and is not directly applicable to L-type rebound values; its large error (RMSE = 34.4 MPa) reflects this incompatibility rather than a deficiency of the original model. The other equations, including the marl equation of Gökçeoğlu [37], give RMSE of 14–46 MPa.
In summary, these comparisons show that, for Vp, the published equations cannot be transferred to the Taza marl-limestone without recalibration, partly because the Taza data lie outside or at the margin of their calibration domains and partly, as shown by the in-range comparison with [33], because of a genuine difference in the UCS–Vp relationship. They do not show that these equations are inadequate for the materials and ranges for which they were developed. For HR, local calibration brings no clear gain over the best carbonate-based equation, which supports the use of HR only as a complementary, screening-level estimate.
4.10. Mineralogical Composition and the UCS–NDT Relationships
XRD identified the same mineral assemblage (calcite, quartz, muscovite and vermiculite) in all analysed samples, and the carbonate content of the four sample groups varies only between 74.3% and 75.7% (Table 1). In relating these observations to the UCS–NDT correlations, two levels of evidence are distinguished below.
Experimentally demonstrated. At the resolution of the methods used, the analysed material is mineralogically homogeneous, whereas UCS varies by a factor of three (17.2–52.2 MPa) and co-varies strongly with Vp and HR (Section 4.6, Section 4.7 and Section 4.8). The proposed correlations are therefore empirical associations established on the mechanical specimens alone. Within the narrow range of the as-sampled condition (w = 1.8–3.2%), water content was not correlated with UCS, Vp, HR or the model residuals (Section 4.8). Published equations calibrated mainly on purer carbonate rocks systematically over-predict the UCS of the Taza specimens, including, for [33], specimens lying within its original Vp range (Section 4.9).
Plausible but not demonstrated. Because the mineralogical (XRD, calcimetry) and identification (fines, PI, MBV) measurements were made on separate samples and cannot be paired with the individual mechanical specimens (Section 3.2), and because porosity, density, quantitative clay content and weathering grade were not measured on the core specimens, no specimen-level relationship between these parameters and UCS, Vp or HR could be tested. The following interpretations are therefore qualitative hypotheses consistent with the observations, not demonstrated relationships: (a) the within-dataset variability of UCS, Vp and HR may be controlled mainly by fabric, porosity, micro-cracking and weathering degree (Figure 2 and Figure 11), which would affect wave propagation, rebound and strength in the same direction; (b) the clay-bearing, less dense microstructure observed by SEM (Figure 11) may contribute to the lower strength at a given Vp compared with purer limestones, which would be consistent with the over-prediction by published equations, although differences in testing configuration may also contribute (Section 4.9); (c) the clay minerals are expected to act mainly when water is available, through swelling and loss of cohesion, which would be consistent with the moderate degradability observed (Section 4.4) but was not tested mechanically, since all specimens were tested in a single moisture condition (Section 4.11).
Testing these hypotheses would require porosity, density, quantitative mineralogy (e.g., Rietveld refinement of XRD data) and weathering grade to be measured on the same specimens as UCS, Vp and HR, which is recommended for future work.
4.11. Limitations and Domain of Applicability
The proposed equations are site-specific empirical correlations derived from 28 intact laboratory specimens of Taza marl-limestone. Their use should be restricted to intact material of comparable mineralogy (calcite-dominated, CaCO3 ≈ 74–76%, with muscovite and vermiculite), tested in the same as-sampled moisture condition, and to the calibrated ranges UCS = 17.2–52.2 MPa, Vp = 2.12–4.65 km/s and HR = 23–44 (L-type hammer). Predictions within the 3.45–4.18 km/s gap in Vp and any extrapolation outside these ranges are not supported by the data.
Moisture. All tests were performed in a single, as-sampled moisture condition (w = 1.8–3.2%). Because the material is clay-bearing and water-sensitive, saturation is expected to reduce UCS and to modify Vp and HR, so that the coefficients of the proposed equations may not hold for wetter or saturated field material. Seepage–stress tests on limestone have shown that progressive cracking and permeability evolution depend strongly on confining pressure and loading rate, with permeability increasing by about one order of magnitude as fractures coalesce at failure [49]; the present correlations, obtained under unconfined loading, do not account for these effects. Additional tests under controlled saturation and confining-stress conditions are required before extending the equations to such conditions.
Scale effect. The correlations apply to intact rock specimens. In the field, Vp and rebound values measured on outcrops or in boreholes are also influenced by joints and other discontinuities, weathering profiles, lithological alternations, moisture and the volume of rock involved in each test; small-scale laboratory measurements therefore do not directly represent large-scale rock behaviour. Zhao et al. [50] showed that properties obtained from small-scale tests on intact specimens can be transferred to the large scale only through a model that accounts for the discontinuity network: in their tests, a joint spacing of 100 mm markedly changed the large-scale response of the rock, whereas a 400 mm spacing behaved like intact rock. Applying the equations to field measurements or to rock mass characterisation requires additional corrections for rock mass quality (e.g., RQD, discontinuity spacing and condition, GSI) and field validation.
Sampling, representativeness and validation. The specimens come from four outcrops (Sites F1–F4) of a single geological corridor. Because the specimen-to-outcrop and core/block correspondence was not recorded, and the identification tests were not systematically performed on the same blocks as the mechanical tests, inter-site variability, the specimen-level influence of the clay fraction and possible differences between core and block specimens could not be assessed; anisotropy relative to bedding and weathering grade were not quantified separately either. Consequently, it cannot be verified that the 28 specimens cover the full range of facies and weathering states of the Taza marl-limestone, and the correlations should be regarded as representative of the sampled material only; this limitation applies to all statements on their practical applicability made in this paper. The predictive performance reported here is based on internal cross-validation only (LOOCV and repeated 5-fold cross-validation on the same 28 specimens); no independent external dataset or field-scale validation was available. The reported Q2 and RMSECV values therefore support the proposed relationships as site-specific empirical correlations for the sampled material, but they do not establish their predictive accuracy for other locations, other marl-limestone formations or field conditions. The equations should be validated with new, independently sampled specimens of recorded outcrop provenance before routine use and recalibrated before application to marl-limestones from other geological settings. Finally, the potential time and cost savings offered by NDT were not quantified in this study.
5. Conclusions
This study presents an in-depth characterisation of the physico-mechanical properties of the marl-limestone from the Taza region, Morocco, focusing on correlations between uniaxial compressive strength (UCS) and non-destructive testing methods, such as P-wave velocity (Vp) and Schmidt rebound hardness.
The novelty of this work lies not in the correlation approach itself but in its application to a clay-bearing marl-limestone, for which no site-specific empirical correlations had previously been calibrated; the proposed relationships complement the UCS–NDT correlations reported for purer limestones, which gave substantially larger errors when transferred to this material (Section 4.9).
Mineralogical and microstructural analyses revealed that the marl-limestone of Taza is primarily composed of calcite, quartz, muscovite, and vermiculite, with an average calcium carbonate CaCO3 content of 75.07%. This composition is homogeneous across the analysed samples, whereas UCS varies by a factor of three, so that the strength variability is not explained by the measured carbonate content. Because the mineralogical and identification measurements could not be paired with the individual mechanical specimens, the possible influence of clay content, porosity and weathering on strength, and on the over-prediction of UCS by published equations, remains a plausible qualitative interpretation that was not demonstrated experimentally.
Degradability and fragmentability tests classified the samples into distinct groups (n = 21), indicating moderate degradability and low fragmentability under hydric and mechanical stresses.
Within the calibrated ranges, UCS showed a strong association with P-wave velocity (exponential model, R2 = 0.95; internal leave-one-out cross-validated Q2 = 0.94, RMSECV = 2.8 MPa) and a moderate association with Schmidt rebound hardness (R2 = 0.79; Q2 = 0.75, RMSECV = 5.6 MPa). The UCS–Vp correlation is therefore the more accurate site-specific estimator of UCS, whereas the UCS–HR correlation provides a complementary, screening-level estimate. When applied to the same specimens, eleven published UCS–Vp equations, including one established on marls, gave substantially larger errors (RMSE = 11–47 MPa), whereas for HR the best carbonate-based equation performed comparably to the site-specific one (RMSE = 5.7 vs. 5.6 MPa). These differences indicate limited transferability of the published equations to the Taza material, partly due to extrapolation beyond their original calibration domains; they do not imply that these equations are inadequate within their own domains.
Because P-wave velocity and Schmidt rebound measurements are quick and non-destructive, the proposed correlations offer a potential practical advantage for the preliminary assessment of the strength of intact Taza marl-limestone, for example, to screen specimens or to reduce the number of destructive UCS tests during reconnaissance. These time and cost benefits were not quantified in the present study and should be evaluated in future work.
Overall, this study addresses a significant gap in the characterisation of locally available materials in the Taza region. The established correlations between mechanical properties and non-destructive testing methods provide site-specific tools for the preliminary, non-destructive evaluation of intact Taza marl-limestone within the calibrated ranges. These tools are supported by internal cross-validation only and are representative of specimens sampled from four outcrops whose individual provenance was not recorded; their representativeness for the whole formation and their predictive accuracy at other locations or in the field have not been established. Their use in the design of road embankments or foundation works would require additional validation, including field-scale and moisture-dependent testing (Section 4.11).
Finally, this research paves the way for future studies aimed at further exploring the properties of marl-limestone in other geological contexts and refining predictive models for a variety of practical applications. The approach may serve as a methodological reference for other marl-limestone-rich regions, but the equations themselves must be recalibrated and independently validated before use in other geological settings.
Supplementary Materials
The following supporting information can be downloaded at: https://www.mdpi.com/article/10.3390/geotechnics6040110/s1. Table S1: Specimen-level dataset (UCS, Vp, HR, identification parameters, GMTR class, specimen dimensions, moisture condition, fitted and cross-validated UCS values) for the 28 Taza marl-limestone specimens.
Author Contributions
All the authors mentioned have contributed to this work in accordance with the criteria of authorship. Conceptualization, M.E. and A.-A.C.; methodology, M.E. and K.K.; software, M.E.; validation, M.E., A.-A.C. and K.K.; formal analysis, M.E.; investigation, M.E., I.R. (Imane Raini) and I.R. (Imad Raini); resources, A.-A.C.; data curation, M.E.; writing—original draft preparation, M.E.; writing—review and editing, A.-A.C., K.K., I.R. (Imane Raini) and I.R. (Imad Raini); visualisation, M.E.; supervision, A.-A.C.; project administration, A.-A.C.; funding acquisition, A.-A.C. All authors have read and agreed to the published version of the manuscript.
Funding
This research received no external funding.
Data Availability Statement
The complete specimen-level dataset used in this study (UCS, Vp, HR, identification parameters, specimen dimensions and moisture condition) is provided as Supplementary Material (Table S1). Additional raw test sheets are available from the corresponding author upon reasonable request.
Acknowledgments
This work was supported by the budget of the Intelligent Systems, Georesources and Renewable Energies Laboratory (SIGER), Faculty of Sciences and Technics, Sidi Mohamed Ben Abdellah University, Fez, Morocco. During the preparation of this manuscript, the author(s) used an AI-based language assistant (Claude Sonnet 5.5, Anthropic) for manuscript structuring, English language editing and assistance with the additional statistical computations requested during revision (cross-validation, residual analysis and evaluation of published equations), which were performed in Python 3.13.18 from the authors’ data and verified by the authors. All data collection, laboratory testing and interpretation of results were performed by the authors. The authors have reviewed and edited the output and take full responsibility for the content of this publication.
Conflicts of Interest
The authors declare that they have no known competing financial interests or personal relationships that could have appeared to influence the work reported in this paper.
References
- Allaby, M. A Dictionary of Earth Sciences; Oxford University Press: Oxford, UK, 2008. [Google Scholar]
- Wysocki, D. Glossary of Landform and Geologic Terms; USDA: Washington, DC, USA, 1996.
- Su, C.; Li, F.; Tan, X.; Gong, Q.; Zeng, K.; Tang, H.; Li, M.; Wang, X. Recognition of diagenetic contribution to the formation of limestone-marl alternations: A case study from Permian of South China. Mar. Pet. Geol. 2020, 111, 765–785. [Google Scholar] [CrossRef] [Scilit]
- Bouazza, N.; El Mrihi, A.; Maâte, A. Geochemical Assessment of Limestone for Cement Manufacturing. Procedia Technol. 2016, 22, 211–218. [Google Scholar] [CrossRef] [Scilit][Green Version]
- Aloui, T.; Ounis, A.; Chaabani, F. Maastritchian limestones of feriana mountain used in white cement production (Central west tunisia). J. Am. Ceram. Soc. 2008, 91, 3704–3713. [Google Scholar] [CrossRef] [Scilit]
- De Kock, T.; Dewanckele, J.; Boone, M.; De Schutter, G.; Jacobs, P.; Cnudde, V. Replacement stones for lede stone in Belgian historical monuments. Geol. Soc. Spec. Publ. 2014, 391, 31–46. [Google Scholar] [CrossRef] [Scilit]
- Mesrar, L.; Benamar, A.; Jabrane, R. Study of Taza’s Miocene marl applications in heavy clay industry. Bull. Eng. Geol. Environ. 2020, 79, 3019–3032. [Google Scholar] [CrossRef] [Scilit]
- Shaqour, F.M.; Jarrar, G.; Hencher, S.; Kuisi, M. Geotechnical and mineralogical characteristics of marl deposits in Jordan. Environ. Geol. 2008, 55, 1777–1783. [Google Scholar] [CrossRef] [Scilit]
- Ettayeb, M.; Chaouni, A.; Cherifi, H. Reuse of Taza marl-limestone in Morocco for road construction. Mater. Today Proc. 2023, 72, 3420–3426. [Google Scholar] [CrossRef] [Scilit]
- Krami, K.; Benamara, A.; Radouani, M.; Ettayeb, M. Evaluation of water sensitivity and the impact of thermal cycles on asphalt mixtures with different aggregates and hydrated lime as additive: Experimental study. Case Stud. Constr. Mater. 2024, 20, e03015. [Google Scholar] [CrossRef] [Scilit]
- Ouali, H.; Ajakane, R. Caractérisation et valorisation du calcaire métamorphique de Bou-Acila (Maroc central) [Characterization and valuation of metamorphic limestone of Bou-Acila (central Morocco)]. Int. J. Innov. Appl. Stud. 2015, 11, 778–784. [Google Scholar]
- Abd El Aal, A.; Abdullah, G.M.S.; Radwan, A.E.; Haroon Ali, S.; Shoukat, N. Linking the sedimentary cyclicity with mechanical and physical properties of limestone and marl rocks, Dam Formation, Eastern Saudi Arabia: Implications for hydrocarbon exploration and reservoir development. J. Asian Earth Sci. 2023, 251, 105656. [Google Scholar] [CrossRef] [Scilit]
- Jamshidi, A.; Nikudel, M.R.; Khamehchiyan, M.; Zarei Sahamieh, R.; Abdi, Y. A correlation between P-wave velocity and Schmidt hardness with mechanical properties of travertine building stones. Arab. J. Geosci. 2016, 9, 568. [Google Scholar] [CrossRef] [Scilit]
- Azarafza, M.; Ghazifard, A.; Asasi, F.; Rahnamarad, J. An empirical classification method for South Pars marls by Schmidt hammer rebound index. MethodsX 2021, 8, 101366. [Google Scholar] [CrossRef] [Scilit] [PubMed]
- Arman, H. Correlation of P-wave velocity with mechanical and physical properties of limestone with statistical analysis. Sci. Rep. 2021, 11, 24104. [Google Scholar] [CrossRef] [Scilit] [PubMed]
- Ulusay, R.; Hudson, J.A. (Eds.) The Complete ISRM Suggested Methods for Rock Characterization, Testing and Monitoring: 1974–2006; ISRM Turkish National Group: Ankara, Turkey, 2007. [Google Scholar]
- Mesrar, L.; El Aroussi, O.; Lakrim, M.; Lahrach, A.; Chaouni, A.; Jabrane, R. Caractérisation de formations Miocène de la région de Taza pour des valorisations et exploitations industrielles. MATEC Web Conf. 2012, 2, 05002. [Google Scholar] [CrossRef] [Scilit]
- Parent, T.; Domede, N.; Sellier, A.; Mouatt, L. Mechanical characterization of limestone from sound velocity measurement. Int. J. Rock Mech. Min. Sci. 2015, 79, 149–156. [Google Scholar] [CrossRef] [Scilit]
- Yasar, E.; Erdogan, Y. Correlating sound velocity with the density, compressive strength and Young’s modulus of carbonate rocks. Int. J. Rock Mech. Min. Sci. 2004, 41, 871–875. [Google Scholar] [CrossRef] [Scilit]
- Tugrul, A.; Zarif, I.H. Engineering Aspects of Limestone Weathering in Istanbul, Turkey; Springer: Berlin/Heidelberg, Germany, 2000. [Google Scholar]
- Najibi, A.R.; Ghafoori, M.; Lashkaripour, G.R.; Asef, M.R. Empirical relations between strength and static and dynamic elastic properties of Asmari and Sarvak limestones, two main oil reservoirs in Iran. J. Pet. Sci. Eng. 2015, 126, 78–82. [Google Scholar] [CrossRef] [Scilit]
- Pappalardo, G.; Mineo, S.; Monaco, C. Geotechnical characterization of limestones employed for the reconstruction of a UNESCO world heritage Baroque monument in southeastern Sicily (Italy). Eng. Geol. 2016, 212, 86–97. [Google Scholar] [CrossRef] [Scilit]
- Jamshidi, A.; Zamanian, H.; Zarei Sahamieh, R. The Effect of Density and Porosity on the Correlation Between Uniaxial Compressive Strength and P-wave Velocity. Rock Mech. Rock Eng. 2018, 51, 1279–1286. [Google Scholar] [CrossRef] [Scilit]
- Wen, L.; Luo, Z.Q.; Yang, S.J.; Qin, Y.G.; Wang, W. Correlation of Geo-Mechanics Parameters with Uniaxial Compressive Strength and P-Wave Velocity on Dolomitic Limestone Using a Statistical Method. Geotech. Geol. Eng. 2019, 37, 1079–1094. [Google Scholar] [CrossRef] [Scilit]
- Çobanoǧlu, I.; Çelik, S.B. Estimation of uniaxial compressive strength from point load strength, Schmidt hardness and P-wave velocity. Bull. Eng. Geol. Environ. 2008, 67, 491–498. [Google Scholar] [CrossRef] [Scilit]
- Kahraman, S. Evaluation of simple methods for assessing the uniaxial compressive strength of rock. Int. J. Rock Mech. Min. Sci. 2001, 38, 981–994. [Google Scholar] [CrossRef] [Scilit]
- Sachpazis, C.I. Correlating Schmidt hardness with compressive strength and Young’s modulus of carbonate rocks. Bull. Int. Assoc. Eng. Geol. 1990, 42, 75–83. [Google Scholar] [CrossRef] [Scilit]
- Katz, O.; Reches, Z.; Roegiers, J.-C. Evaluation of mechanical rock properties using a Schmidt hammer. Int. J. Rock Mech. Min. Sci. 2000, 37, 723–728. [Google Scholar] [CrossRef] [Scilit]
- Yaşar, E.; Erdoğan, Y. Estimation of rock physicomechanical properties using hardness methods. Eng. Geol. 2004, 71, 281–288. [Google Scholar] [CrossRef] [Scilit]
- Yağız, S. Predicting uniaxial compressive strength, modulus of elasticity and index properties of rocks using the Schmidt hammer. Bull. Eng. Geol. Environ. 2009, 68, 55–63. [Google Scholar] [CrossRef] [Scilit]
- Briševac, Z.; Hrženjak, P.; Buljan, R. Models for estimating uniaxial compressive strength and elastic modulus. Građevinar 2016, 68, 19–28. [Google Scholar] [CrossRef] [Scilit]
- Aydin, A. ISRM Suggested method for determination of the Schmidt hammer rebound hardness: Revised version. Int. J. Rock Mech. Min. Sci. 2009, 46, 627–634. [Google Scholar] [CrossRef] [Scilit]
- Jamshidi, A.; Freire-Lista, D.M.; Zalooli, A. The performance of the non-destructive tests in predicting the uniaxial compressive strength of the limestone: A case study of Asmari Formation, Lorestan Province, western Iran. Geopersia 2024, 14, 379–395. [Google Scholar] [CrossRef]
- Khemis, A.; Athmani, A.; Seboui, H. Multivariate regression model for indirect estimation of uniaxial compressive strength of limestone. Ital. J. Eng. Geol. Environ. 2024, 1, 67–77. [Google Scholar] [CrossRef]
- Fereidooni, D.; Karimi, Z.; Ghasemi, F. Non-destructive test-based assessment of uniaxial compressive strength and elasticity modulus of intact carbonate rocks using stacking ensemble models. PLoS ONE 2024, 19, e0302944. [Google Scholar] [CrossRef] [Scilit] [PubMed]
- Azimian, A.; Ajalloeian, R. Empirical correlation of physical and mechanical properties of marly rocks with P wave velocity. Arab. J. Geosci. 2015, 8, 2069–2079. [Google Scholar] [CrossRef] [Scilit]
- Gökçeoğlu, C. An evaluation on the reliability of uniaxial compressive strength data estimated by using the Schmidt hammer hardness. Jeol. Mühendisliği 1996, 48, 78–81. [Google Scholar]
- NM 13 1 038; Determination of Degradability Coefficient of Rock Materials. Moroccan Institute of Standardisation: Rabat, Morocco, 2019.
- NM 13 1 037; Determination of the Fragmentability Coefficient of Rock Materials. Moroccan Institute of Standardisation: Rabat, Morocco, 2019.
- NF EN 933-1; Tests for Geometrical Properties of Aggregates—Part 1: Determination of Particle Size Distribution—Sieving Method. European Committee for Standardization: Brussels, Belgium, 2012.
- NF EN 933-9; Tests for Geometrical Properties of Aggregates—Part 9: Assessment of Fines—Methylene Blue Test. Association Française de Normalisation: Paris, France, 2022.
- NF EN 12504-2; Part 2: Non-Destructive Testing—Determination of Rebound Number. Association Française de Normalisation: Paris, France, 2014.
- NF P 94-420; Rock—Determination of the Uniaxial Compressive Strength. Association Française de Normalisation: Paris, France, 2000.
- NF P94-050; Soils: Investigation and Testing—Determination of the Water Content by Weight of Materials—Oven-Drying Method. Association Française de Normalisation: Paris, France, 1995.
- NM 13.1.029; Soil: Investigation and Testing—Determination of the Carbonate Content—Calcimeter Method. Moroccan Institute of Standardization: Rabat, Morocco, 2019.
- Kingdom of Morocco’s Ministry of Equipment. Moroccan Guide for Earthworks Part 2; Kingdom of Morocco’s Ministry of Equipment: Rabat, Morocco, 2001; pp. 1–108.
- Kingdom of Morocco’s Ministry of Equipment. Moroccan Guide for Earthworks Part 1; Kingdom of Morocco’s Ministry of Equipment: Rabat, Morocco, 2001.
- Celik, S.B. Prediction of uniaxial compressive strength of carbonate rocks from nondestructive tests using multivariate regression and LS-SVM methods. Arab. J. Geosci. 2019, 12, 193. [Google Scholar] [CrossRef] [Scilit]
- Li, Z.-Q.; Nie, L.; Xue, Y.; Li, Y.; Tao, Y. Experimental investigation of progressive failure characteristics and permeability evolution of limestone: Implications for water inrush. Rock Mech. Rock Eng. 2024, 57, 4635–4652. [Google Scholar] [CrossRef] [Scilit]
- Zhao, G.; Li, Z.; Chen, Y.; Gong, Q.; Li, S.; Wei, X. A digital twin-based multiscale framework for predicting full-scale TBM rock cutting performance from miniature point load tests. Smart Undergr. Eng. 2025, 1, 51–63. [Google Scholar] [CrossRef] [Scilit]

Disclaimer/Publisher’s Note: The statements, opinions and data contained in all publications are solely those of the individual author(s) and contributor(s) and not of MDPI and/or the editor(s). MDPI and/or the editor(s) disclaim responsibility for any injury to people or property resulting from any ideas, methods, instructions or products referred to in the content. |
© 2026 by the authors. Licensee MDPI, Basel, Switzerland. This article is an open access article distributed under the terms and conditions of the Creative Commons Attribution (CC BY) license.