


Abstract
Using a single mean collapse strain can misrepresent settlement in spatially variable loess foundations, potentially leading to unsafe hydraulic-structure design and settlement-induced damage. This study examines an archival empirical correction classified by ground and structural conditions. Engineering-geological records from 12 sites informed the factor classification, and monitored settlements of seven irrigation structures were used for validation. The resulting composite factors range from 1.30 to 1.44 across the specified ground and structural classes. For the seven field cases, the corrected predictions achieved a mean absolute percentage error of 12.7%, compared with 35.2% and 32.4% for the two conventional calculation sets. Archival physical-model observations independently supported the proposed load-redistribution mechanism. The correction provides a transparent way to account for ground variability and structural response in preliminary and design-stage settlement assessments, provided that representative collapse-strain data and a defined wetting scenario are available.
1. Introduction
Collapsible loess is a metastable, generally unsaturated aeolian soil that can sustain substantial loads in its natural state but undergoes rapid volumetric compression when wetting destroys suction-supported and cemented particle contacts. Classical work established hydroconsolidation as a defining feature of loess behavior [1,2,3,4,5], while later reviews have shown that collapse is governed by the combined effects of initial fabric, stress state, degree of saturation, suction, and wetting path, rather than by any single index property [6]. This problem is especially important for hydraulic and irrigation structures because leakage, first filling, filtration through joints, and long-term seepage provide persistent sources of local or progressive saturation. The resulting differential settlement may rotate rigid structural segments, open joints, intensify concentrated seepage, and interrupt service, even when the dry-state bearing capacity remains adequate. Field studies of collapsible loess foundations have likewise shown that wetting and stress state can strongly modify bearing response [7,8].
Hydro-mechanical studies have clarified the role of matric suction in the collapse process. Garakani et al. demonstrated that undisturbed loess may exhibit abrupt volumetric strain during wetting and that the magnitude of collapse depends strongly on net stress, suction level, and the applied hydro-mechanical path [9]. Xie et al. subsequently used the soil–water characteristic curve (SWCC) to identify a critical suction below which significant collapse develops and proposed a practical prediction framework that was validated against laboratory and field data [10]. More recently, Li et al. related wetting-induced settlement to characteristic features of the wetting SWCC and showed improved agreement with field settlement compared with conventional code-based estimates [11]. These results indicate that an assumption of instantaneous, spatially uniform saturation is often inappropriate for water-conveyance infrastructure, where the wetting front is transient and strongly nonuniform.
Microstructural investigations provide a physical explanation for this sensitivity. Graded wetting tests on remolded loess have shown that collapse is closely associated with the reduction of unstable inter-aggregate pores and depends on both dry density and vertical stress [12]. Tests on intact and reconstituted loess have demonstrated that natural fabric and bonding substantially alter compression and shearing behavior and may persist even after large strains [13,14]. Quantitative SEM and pore-structure analyses have further linked collapse potential to particle orientation, cementation, fine-particle content, and the evolution of large and medium pores [15,16,17,18]. Three-dimensional X-ray micro-computed tomography has shown that water-induced collapse is heterogeneous even at the particle scale, involving nonuniform particle displacement and rotation and complex changes in interparticle contacts [19]. Thus, a single mean collapse strain cannot fully describe the deformation potential of a natural loess foundation mass.
Directional dependence is another source of uncertainty. Loess is commonly deposited with a preferred fabric and vertical pore network, and early hydroconsolidation experiments have shown that initially anisotropic loess does not respond identically under different stress paths [5]. The persistence of natural structure observed in intact specimens [13,14] and the particle-orientation changes measured in microstructural studies [15,19] provide a mechanistic basis for treating collapse response as direction-dependent. For engineering calculations, this matters because specimens obtained in a limited orientation may not represent the most unfavorable collapse response of the in situ soil. A reliability correction should, therefore, distinguish directional fabric effects from ordinary sampling scatter rather than hiding both in one empirical working-condition coefficient.
A second major issue is the discrepancy between laboratory collapse indices and full-scale field settlement. Wang et al. analyzed compression behavior from several loess sites and proposed a revised method because conventional indoor assessments can differ substantially from field-measured collapse [20]. In situ immersion testing has documented spatially nonuniform subsidence, ground fissuring, and deformation zones extending beyond the directly wetted area [21]. A large field immersion test in thick self-weight collapsible Ili loess reported a measured-to-calculated correction coefficient of approximately 1.64, demonstrating that scale, wetting geometry, and natural heterogeneity can materially alter the settlement response [22]. These observations support the use of site-dependent statistical adjustment when laboratory values are transferred to the foundation scale.
The problem becomes more pronounced for hydraulic infrastructure because the structure itself affects the stress field while simultaneously controlling the location and progression of wetting. Zhang et al. investigated leakage beneath a water-delivery pipeline founded on collapsible loess and showed that collapse deformation depends on loess-layer depth, pipeline embedment, and the stage of leakage development [23]. Their subsequent large-scale immersion study demonstrated temporal discontinuity and spatial nonuniformity of settlement and validated an improved K-G prediction model against measured displacement [24]. Francisca et al. calibrated a coupled hydro-mechanical finite-element model using laboratory data and full-scale shallow-foundation settlements during controlled leakage; sensitivity analysis, inverse analysis, and Monte Carlo simulation showed that uncertain soil parameters strongly influence predicted long-term settlement [25]. These studies indicate that soil variability and structure–foundation interaction should be considered jointly when rigid hydraulic structures experience nonuniform wetting.
The broader reliability literature offers a framework for representing these uncertainties explicitly. Phoon and Kulhawy separated inherent spatial variability, measurement error, and transformation uncertainty and provided statistical descriptors for common geotechnical properties [26,27,28,29]. Random-field reliability studies have since shown that spatial correlation, coefficient of variation, and the scale of fluctuation can change both expected foundation performance and reliability. Wang and Cao incorporated random fields directly into reliability-based pile design [30]; Simões et al. demonstrated that anisotropic soil variability and load eccentricity materially affect shallow-foundation reliability [31]; and Pieczyńska-Kozłowska and Vessia showed that foundation dimensions interact with the spatial scale of soil variability through averaging effects [32]. Liu and Cheung likewise demonstrated that spatially variable soil properties can be incorporated explicitly in reliability-based geotechnical optimization [33]. Collectively, these studies show that replacing a heterogeneous ground mass by a single mean parameter does not necessarily preserve the reliability of the resulting design.
Despite these advances, a practical gap remains between sophisticated random-field or coupled hydro-mechanical analyses and routine design of relatively small hydraulic structures on collapsible loess. The loess literature has mainly addressed collapse mechanisms, laboratory indices, microstructural evolution, field immersion behavior, and deterministic settlement prediction, whereas reliability studies have more often focused on foundations in non-collapsible soils [6,20,25,30,31,32,33]. Large engineering projects in loess regions continue to identify wetting-induced deformation and its spatial complexity as major geotechnical challenges [34]. The present study, therefore, develops a transparent reliability correction in which the design collapse strain is factorized into three physically interpretable components: directional anisotropy, natural spatial variability, and structure–foundation interaction. The specific aims are to (i) classify the dominant sources of variability; (ii) derive composite factors for representative ground and structural conditions; (iii) quantify prediction error against seven monitored hydraulic structures; and (iv) define limits for practical engineering use.
2. Materials and Methods
2.1. Database and Field Evidence
The development dataset was extracted from archival engineering–geological investigations of 12 hydraulic-construction sites in loess regions, documented by the source research program [35]. Multiple vertical profiles and repeated relative-collapse-strain measurements were available for each site. The profiles were classified by lithological continuity, drainage and groundwater conditions, and the ratio of collapsible thickness Hse to the expected lateral wetting width B. The site-variability factor was evaluated at a confidence probability of 0.95 using the archived collapse-strain records, with an effective screening resolution of 0.01. Seven of the 12 sites also had completed hydraulic structures with geodetic settlement observations during construction, wetting, or operation; these seven cases were used for prediction validation. They included chute inlets, canal distributors, water outlets, supports, buried structures, and an earth embankment. The available compiled records do not provide a complete site-by-site list of coordinates, sample counts, loading levels, and original laboratory wetting protocols. Thus, the 12-site material is a retrospective classified dataset rather than a fully reproducible raw-test archive. For terminology only, we compared collapse-potential terminology with ASTM D5333-03, soil identification with ISO 14688-1:2017, and limit-state terminology with EN 1997-1:2004 [36,37,38]. ASTM D5333-03 is withdrawn and was not used as a current design requirement. Table 1 distinguishes the development and validation data.
Table 1.
Information used in model development and validation.
2.2. The Definition and Provenance of the Correction
Let εse,k denote the representative collapse strain from the archived tests and εse,d the design strain. For a ground class i and structural class j, the correction is defined by the archived coefficient Cij:
εse,d(i,j) = Cij × εse,k.
The source research program associated directional collapse anisotropy with a nominal ratio of 1.15, classified spatial variability across 12 investigated sites, and assessed structural influence from monitored hydraulic structures [35]. Its reported ranges for the spatial and structural components were 1.12–1.20 and 1.05–1.08, respectively. The site component was assessed at a confidence probability of 0.95 using collapse-strain samples along multiple verticals. These provenance statements describe the historical construction of the correction; the individual sample records and a complete numerical calibration ledger are unavailable in the compiled source.
2.3. Empirical Ground and Structural Classification
The reported component ranges and the archived composite coefficient are summarized in Table 2.
Table 2.
Reported component ranges and archived composite coefficient.
Table 3 reproduces the archived 5 × 5 matrix of Cij by the ground and structural classes [35]. It is treated here as an empirical lookup matrix, not as values obtained by multiplying the three reported component ranges. Indeed, their endpoint products are 1.15 × 1.12 × 1.05 = 1.3524 and 1.15 × 1.20 × 1.08 = 1.4904, whereas the archived matrix spans 1.30–1.44. The mismatch exceeds two-decimal rounding. Thus, the component ranges cannot serve as an exact generative equation for Table 3 without additional calibration information.
Table 3.
Archived empirical correction coefficient Cij by soil profile and structural system (dimensionless) [35].
The archived matrix can be tested for separability using an interaction ratio. For a reference ground class i0 and structural class j0, define:
Iij = [Cij × C(i0,j0)]/[C(i,j0) × C(i0,j)].
If the ground and structural contributions were exactly separable, every Iij would equal 1. This identity uses only the archived table and does not estimate the correlation of the underlying random variables.
Take homogeneous ground with Hse ≥ B as i0 and earthwork as j0. The separate-support to earthwork ratio is 1.44/1.30 = 1.108 for this ground class and 1.43/1.38 = 1.036 for heterogeneous ground with shallow groundwater. The latter class gives Iij = (1.43 × 1.30)/(1.38 × 1.44) = 0.936. The matrix, therefore, does not exhibit exact separability. Aggregate tabulated values cannot identify covariance among anisotropy, spatial variability, and structural response; no probabilistic safety index is inferred.
A matrix-based error check gives a separable prediction of (1.44 × 1.38)/1.30 = 1.5286 for separate supports on the heterogeneous ground row. The archived entry is 1.43. Ignoring the interaction in this comparison, therefore, overestimates that entry by (1.5286/1.43 − 1) × 100 = 6.9%. This is an error relative to the archival matrix, not a measured settlement-prediction error.
To illustrate the possible effect of statistical dependence separately, consider a hypothetical product of three positive random factors X1, X2, and X3, with log Xi jointly normal. Let each factor have coefficient of variation 0.10 and let each pair of log factors have the same correlation ρ. The standard deviation of each log factor is σ = √ln(1 + 0.102) = 0.09975. Then:
Var[ln(X1X2X3)] = 3σ2 + 6ρσ2.
For an illustrative composite median of 1.38 and an illustrative exceedance threshold of 1.65, the lognormal scenario gives:
P(X1X2X3 > 1.65) = 1 − Φ{ln(1.65/1.38)/[σ√(3 + 6ρ)]}.
At ρ = 0, the threshold-exceedance probability is 15.1%. At ρ = +0.4, it is 22.0%, an increase of 7.0 percentage points (approximately 46% relative to the independent scenario). At ρ = −0.4, it is 1.0%. Equal-correlation values in this illustration satisfy the positive-semidefinite condition ρ ≥ −0.5. These coefficients of variation, correlations, median, and threshold are hypothetical sensitivity assumptions, not measurements from the 12 sites. The calculation shows the direction and possible magnitude of dependence effects under this scenario; it does not estimate an actual failure probability or establish project safety.
2.4. Validation Metrics
Three predictions were compared with observed settlement: a conventional SNiP calculation, a hydraulic-structure VSN calculation, and the proposed reliability-adjusted calculation. For each case, percentage error was computed relative to observed settlement. Overall performance was summarized using the mean absolute error, mean absolute percentage error, and mean signed percentage error. The raw settlement values were recalculated consistently; this avoids relying on rounded percentage annotations in the historical source table.
2.5. Archival Physical-Model Experiment
The archival physical-model experiment was re-analyzed as a mechanism check, separately from the seven-structure prediction statistics [35]. Its prototype was a chute-type irrigation structure on a highly collapsible loess layer approximately 17 m thick, below the foundation level. The source reported an initial collapse pressure of Pse = 25 kPa, a collapse strain epsilon_se = 0.067 under natural stress, and a calculated self-weight collapse of 1.14 m. The approximately 80 × 25 × 35 cm transparent flume contained three structural fragments and remolded loess–quartz-sand model soil proportioned to reproduce the natural collapse-strain response. The geometric scale was M_L = 0.02, with the prototype stress level preserved (M_sigma = 1). Controlled wetting advanced from the upstream and downstream ends. Indicator layers, settlement marks, and embedded stress sensors recorded the changing deformation and contact pressure. The values 154, 110, and 30 kPa describe successive readings below a progressively wetted support zone; approximately 220 kPa was measured in an adjacent drier support zone. These are model observations during a moving wetting front, not pressures measured across all 12 construction sites. They were not used in the seven-case MAE, MAPE, bias, or RMSE calculations.
2.6. Supplementary Regional Archive Synthesis
The 12-site development dataset, seven monitored structures, broader regional compilation, and physical-model experiment are distinct evidence blocks from the research program documented in [35]. The regional compilation was used only to interpret variability and collapse susceptibility; it was not pooled with the 12-site samples to recalibrate gamma_g or with the seven structures to calculate prediction errors. This separation avoids attributing the regional ranges to individual development sites or treating model sensor readings as field measurements.
The source’s regional compilation describes Kazakhstan loess across broad foothill and intermontane geomorphic settings, including foothill steps and adyrs, alluvial fans, proluvial plains, alluvial–proluvial plains, and intermontane depressions [35]. It combines investigations from multiple sites and campaigns rather than one uniform test series. Reported coefficients of variation of approximately 53–125% refer to collapse-related characteristics in that regional synthesis; the source’s 30% criterion was used to indicate strong engineering–geological heterogeneity. The initial collapse pressure Pse was reported by geomorphic collapse class: 10–30 kPa in the strongly collapsible group, 20–60 kPa in the intermediate group, and 50–120 kPa in the comparatively weak group. These intervals are descriptive regional summaries, not measurements at each of the 12 development sites and not project-specific design values. Site-level sample sizes and common loading/wetting protocols for the pooled regional groups are not recoverable from the compiled figures; therefore, the ranges are not treated as a homogeneous probabilistic sample.
The physical-model observations were examined separately under the controlled, two-sided wetting and stress-scaling conditions described in Section 2.5 [35]. Water content and saturation were reported at the moving wetting boundary and behind it. Settlement timing was read relative to the arrival of the wetting front at different structural fragments. Contact-pressure readings were associated with the already wetted and adjacent drier support zones. These data support a qualitative interpretation of gamma_s but were excluded from its numerical calibration and from the field validation statistics.
2.7. The Mechanical Relations Underlying the Empirical Correction
The following relations make explicit the mechanics discussed in the archival study [35]: wetting-induced vertical strain, settlement accumulation, contact-load equilibrium, shear resistance, and deformation decomposition. Equations (5), (6), and (9)–(11) express the strain, strength, and deformation concepts used in that source. Equations (7), (8), and (12) are explicit equilibrium and kinematic statements introduced here to clarify the interpretation. These relations do not derive or recalibrate the empirical coefficients Cij.
Wetting-induced strain and settlement. At a specified vertical test pressure p, relative collapse strain is defined from the change in specimen height during wetting:
Here, hn(p) and hw(p) are specimen heights before and after wetting at the same test pressure. The reference height h0 must follow the adopted test convention; in the archival definition, it is the specimen height at natural moisture under the natural overburden pressure. Collapse strain is positive for wetting-induced shortening. This definition separates wetting-induced deformation from compression caused by an increase in test pressure.
For a specified wetting scenario, the compression-only settlement is obtained by summing the collapse deformation of n computational layers. Application of the archived ground–structure coefficient gives:
Here, hl is the reference thickness of layer l, and pl is its representative vertical pressure for the adopted calculation state. Only layers included in the assumed wetted, collapse-active thickness enter the sum. The second relation assumes one coefficient Cij for the whole classified profile–structure combination, as in Equation (1). It applies to the collapse-settlement component and does not automatically multiply other settlement components. A single-layer constant-strain case reduces to Sse = εse h, as in the source analysis [35].
Contact-pressure equilibrium and load transfer. For quasi-static vertical loading, divide the contact area into m zones. The zone reactions must satisfy the vertical-force and moment equilibrium:
Here, r(t) is the area-averaged upward contact pressure in zone r, Ar is its area, and xr is the reaction lever arm about the chosen horizontal axis. N(t) and M(t) are the net applied downward vertical load and its moment, including external loads and any relevant water forces. For biaxial loading, the corresponding moment equation is also required about the other horizontal axis. A point sensor reading cannot be substituted for an area average without an assumption about the pressure distribution.
A two-zone force balance illustrates transfer from a wetted zone w to a drier zone d. If the total vertical load and the two zone areas remain constant between the two quasi-static states, Equation (7) requires:
Thus, a loss of reaction in one zone requires a compensating gain elsewhere. Structural bending or rotation determines how that reaction is distributed while moment equilibrium is maintained. The reported local pressure decrease from 154 to 110 and then 30 kPa, together with the adjacent increase to approximately 220 kPa, is consistent with this mechanism [35]. The archival point measurements and incomplete contact-pressure map do not permit quantitative verification of the zone-integrated balance.
Wetting-related loss of shear resistance. The limiting shear resistance for a saturated, drained idealization is represented by the Mohr–Coulomb relation:
τf = c′ + σ′n tan φ′; σ′n = σn − u.
Here, τf is limiting the shear resistance, c′ and φ′ are effective-stress strength parameters, σn is the total normal stress, and u is the pore-water pressure. This relation explains why reduced bonding and reduced effective confinement can alter the support mechanism. The archival c = 0 assumption during collapse is an idealization of bonding loss, not a universal property of wetted loess [35]. Equation (9) is not evaluated using the reported contact pressures: pore-water pressure and suction histories were not available. The partially saturated model states, therefore, require an unsaturated constitutive description for a quantitative stress-path analysis.
Deformation contribution and amplification. The source separates the model soil-column shortening into an equivalent compression-only component and an additional component associated with lateral shape change:
Stot = Scomp + Sshape.
Here, Sshape is a vertical-settlement contribution inferred from the source geometric decomposition, rather than the horizontal displacement itself. It is an operational decomposition for this model; volumetric and shear deformation are not generally independent processes in collapsing soil. The contribution ratio and the total-to-compression-only coefficient are:
ηshape = Sshape/Stot; K = Stot/Scomp = 1/(1 − ηshape).
Using the source values, Stot = 2.18 cm, Scomp = 1.40 cm, and Sshape = 0.78 cm gives ηshape = 0.3578, or 35.8%, and K = 1.557, approximately 1.56, when calculated from the displayed rounded values. The source reports K = 1.55 [35]. This small numerical difference reflects the displayed precision. Neither ηshape nor K is identified with the empirical matrix coefficient Cij or with a transferred-load fraction.
Differential settlement and rotation. For a rigid structural fragment with support-point spacing L, the kinematic rotation caused by a settlement difference is:
Δs(t) = s2(t) − s1(t); θ(t) = arctan[Δs(t)/L] ≈ Δs(t)/L.
The approximation applies to small rotations, with θ expressed in radians. For larger rotations, the arctangent form should be retained under the stated geometry. This relation connects asynchronous support settlement to fragment rotation. Joint opening depends on the relative rotations of adjacent fragments and their joint geometry; it cannot be equated directly to the rotation of one fragment. The relation is explanatory here because matching support spacing and settlement histories are not available for all archival observations.
Equations (5)–(12) specify the physical interpretation and the assumptions needed for a mechanical calculation. They are not a closed hydro-mechanical prediction model: wetting-front evolution, unsaturated strength, contact-pressure distributions, and structural stiffness require additional data. The tabulated Cij remains an empirical correction, with the dependence and calibration limitations stated in Section 2.3 and Section 4.7.
3. Results
3.1. Composite Reliability Factors
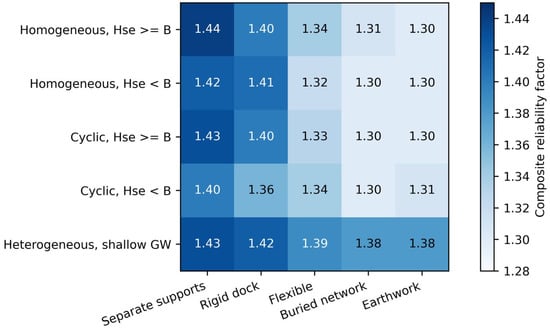
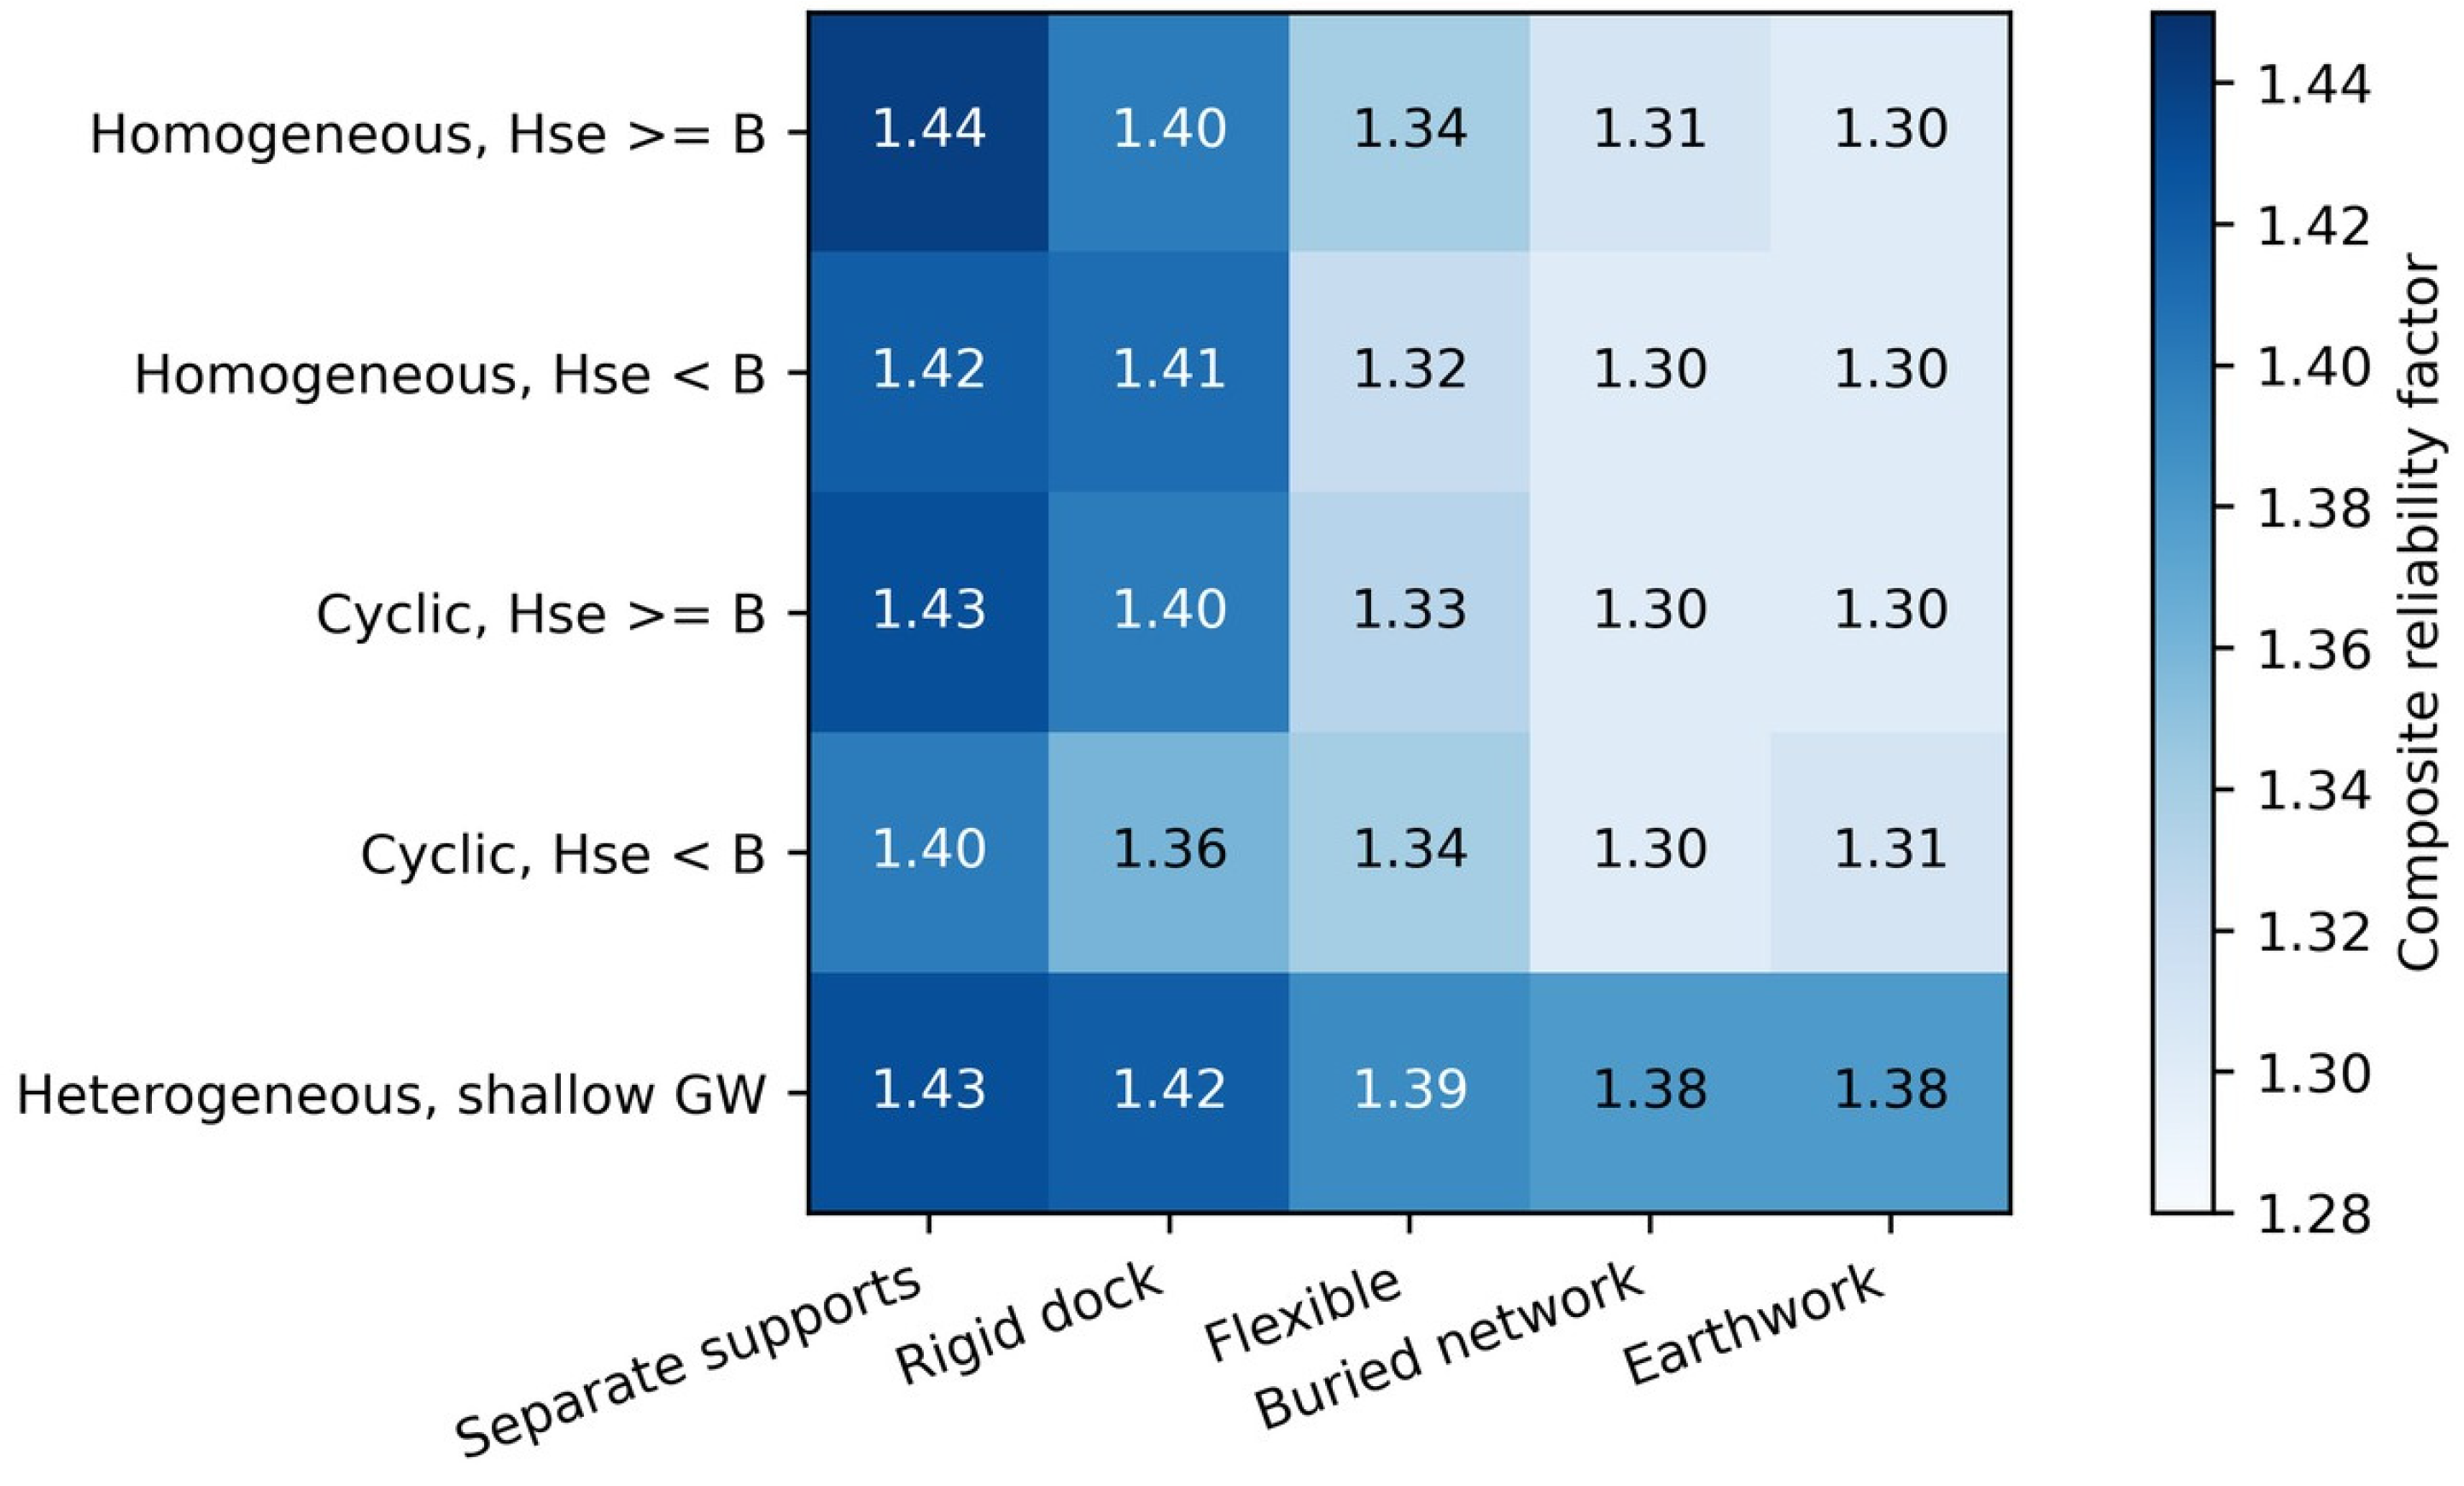
Table 3 gives the archived composite coefficient Cij for each of 25 ground–structure combinations. Select the ground row from lithological continuity, drainage or groundwater conditions, and Hse/B, then select the structural column. The coefficients range from 1.30 to 1.44. These values are historical empirical estimates and should be updated against project-specific collapse tests and monitoring, rather than interpreted as universal reliability factors. The archived empirical correction coefficients for different soil profiles and structural systems are presented in Table 3. Figure 1 visualizes the same matrix.
Figure 1.
The dependence of the composite factor on the ground condition and structural system.
3.2. Settlement Validation
Table 4.
Observed and calculated vertical settlement.
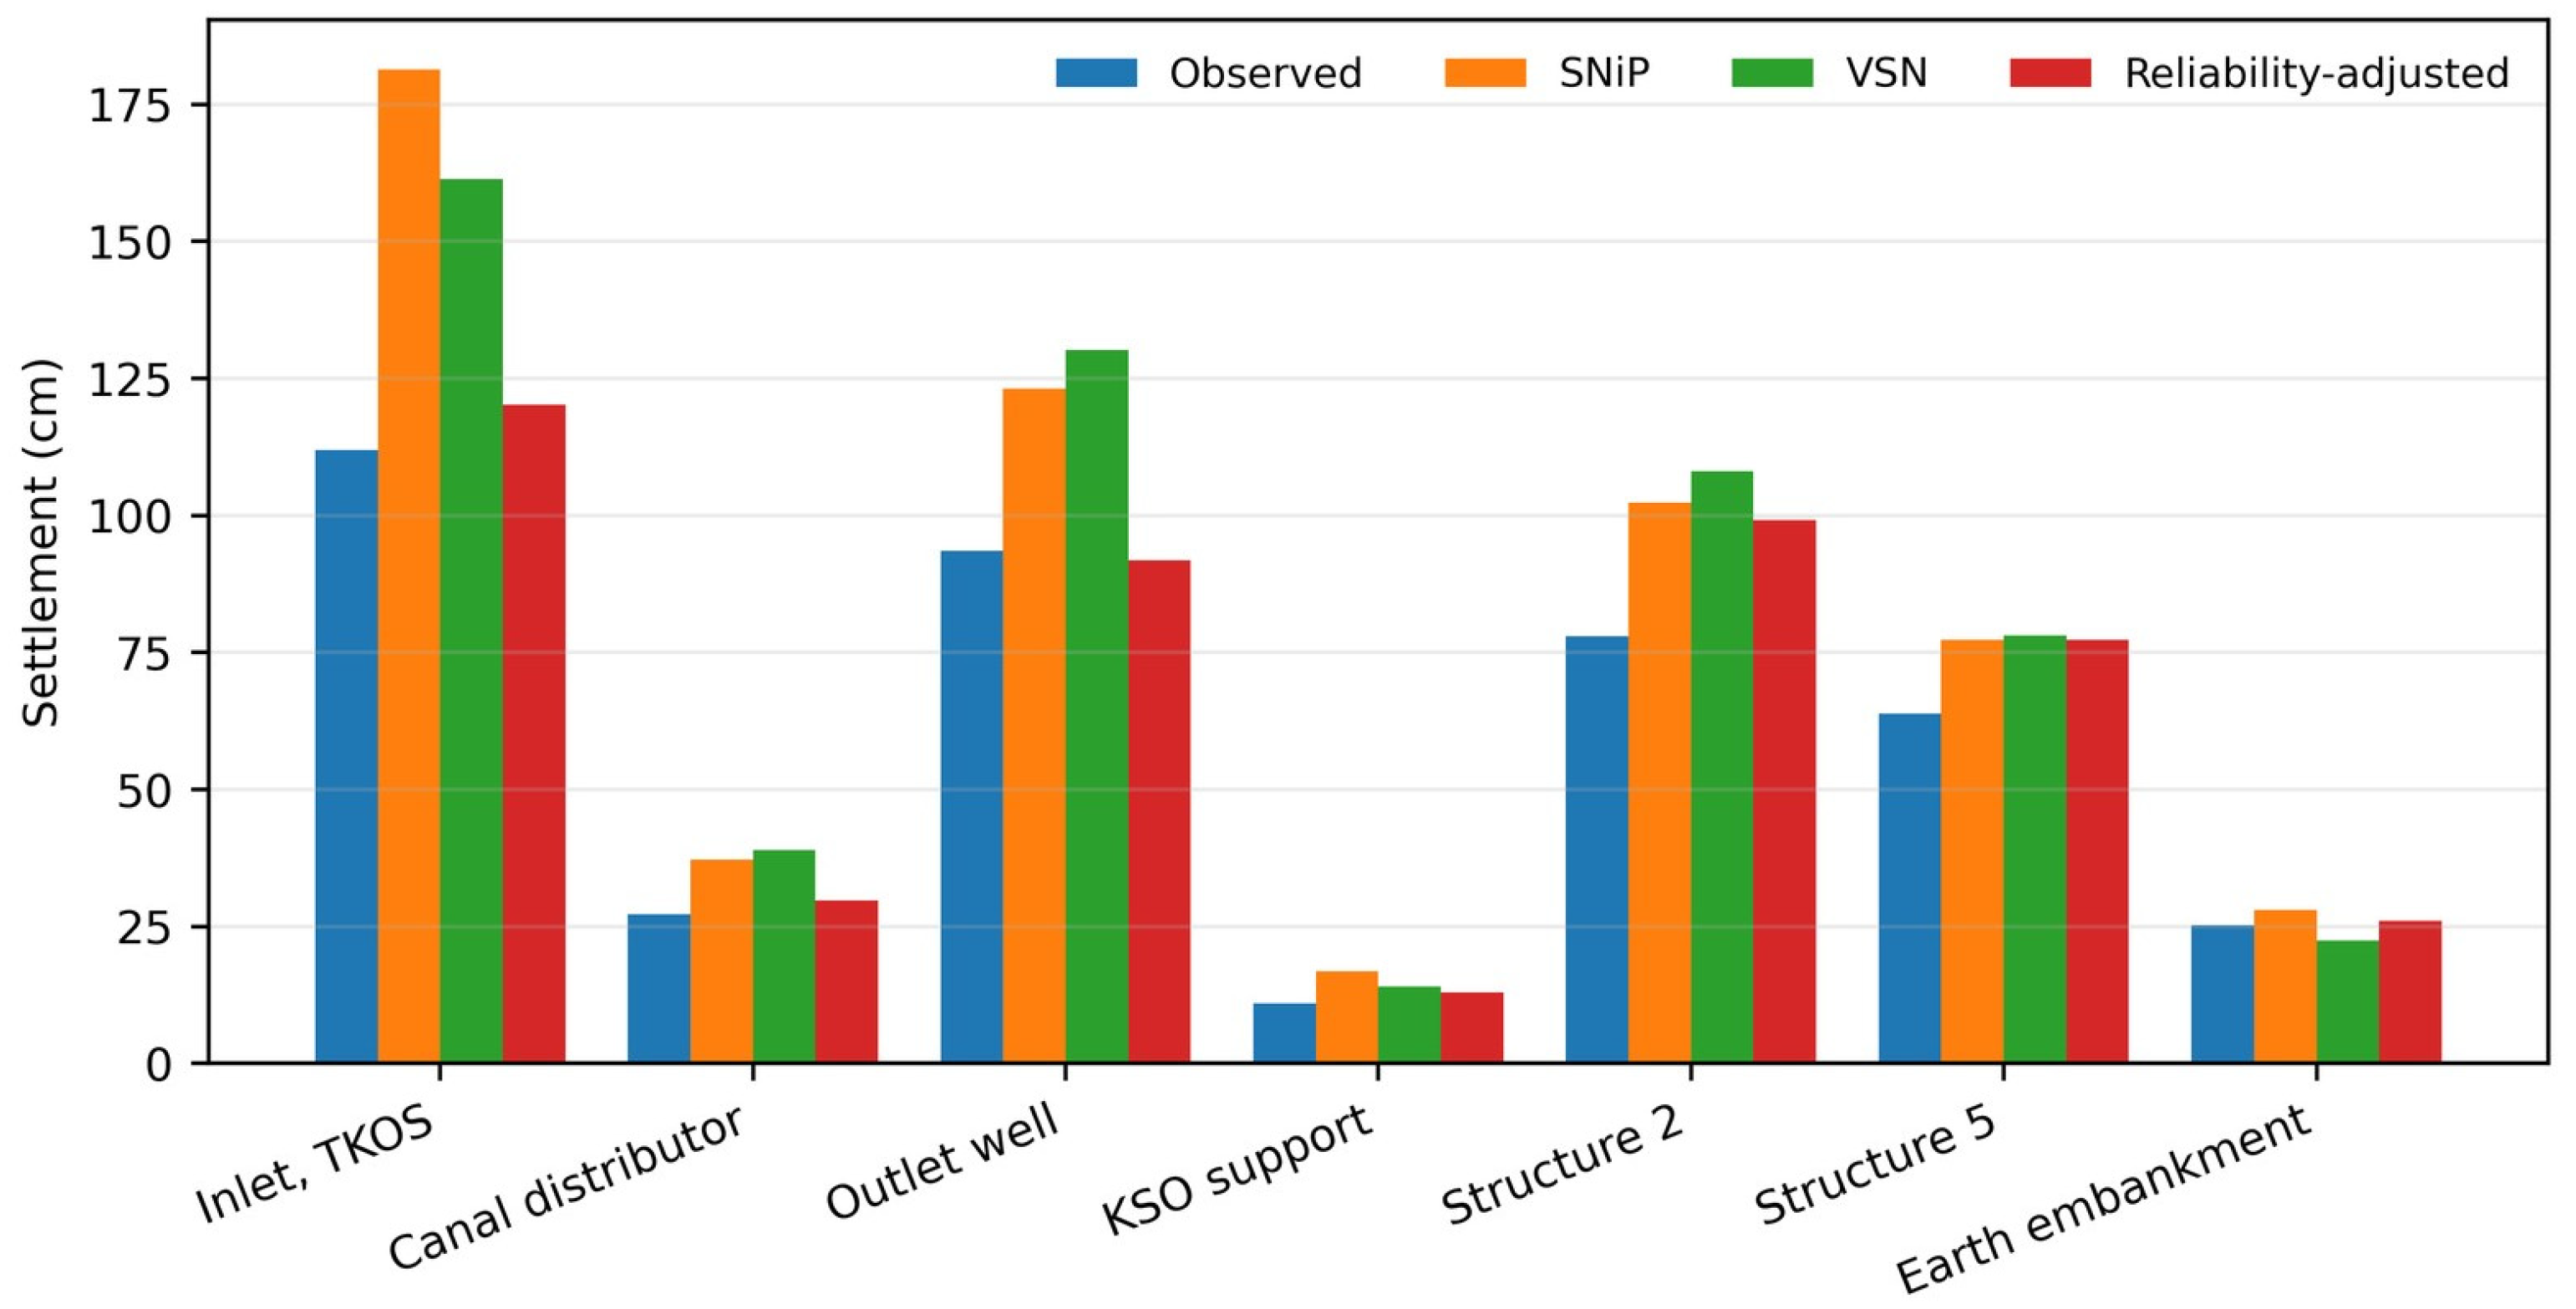
Figure 2.
A comparison of the observed and calculated settlements for the seven validation cases.
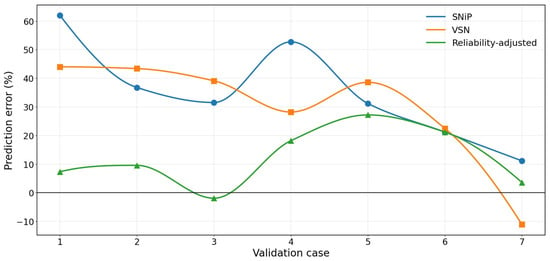
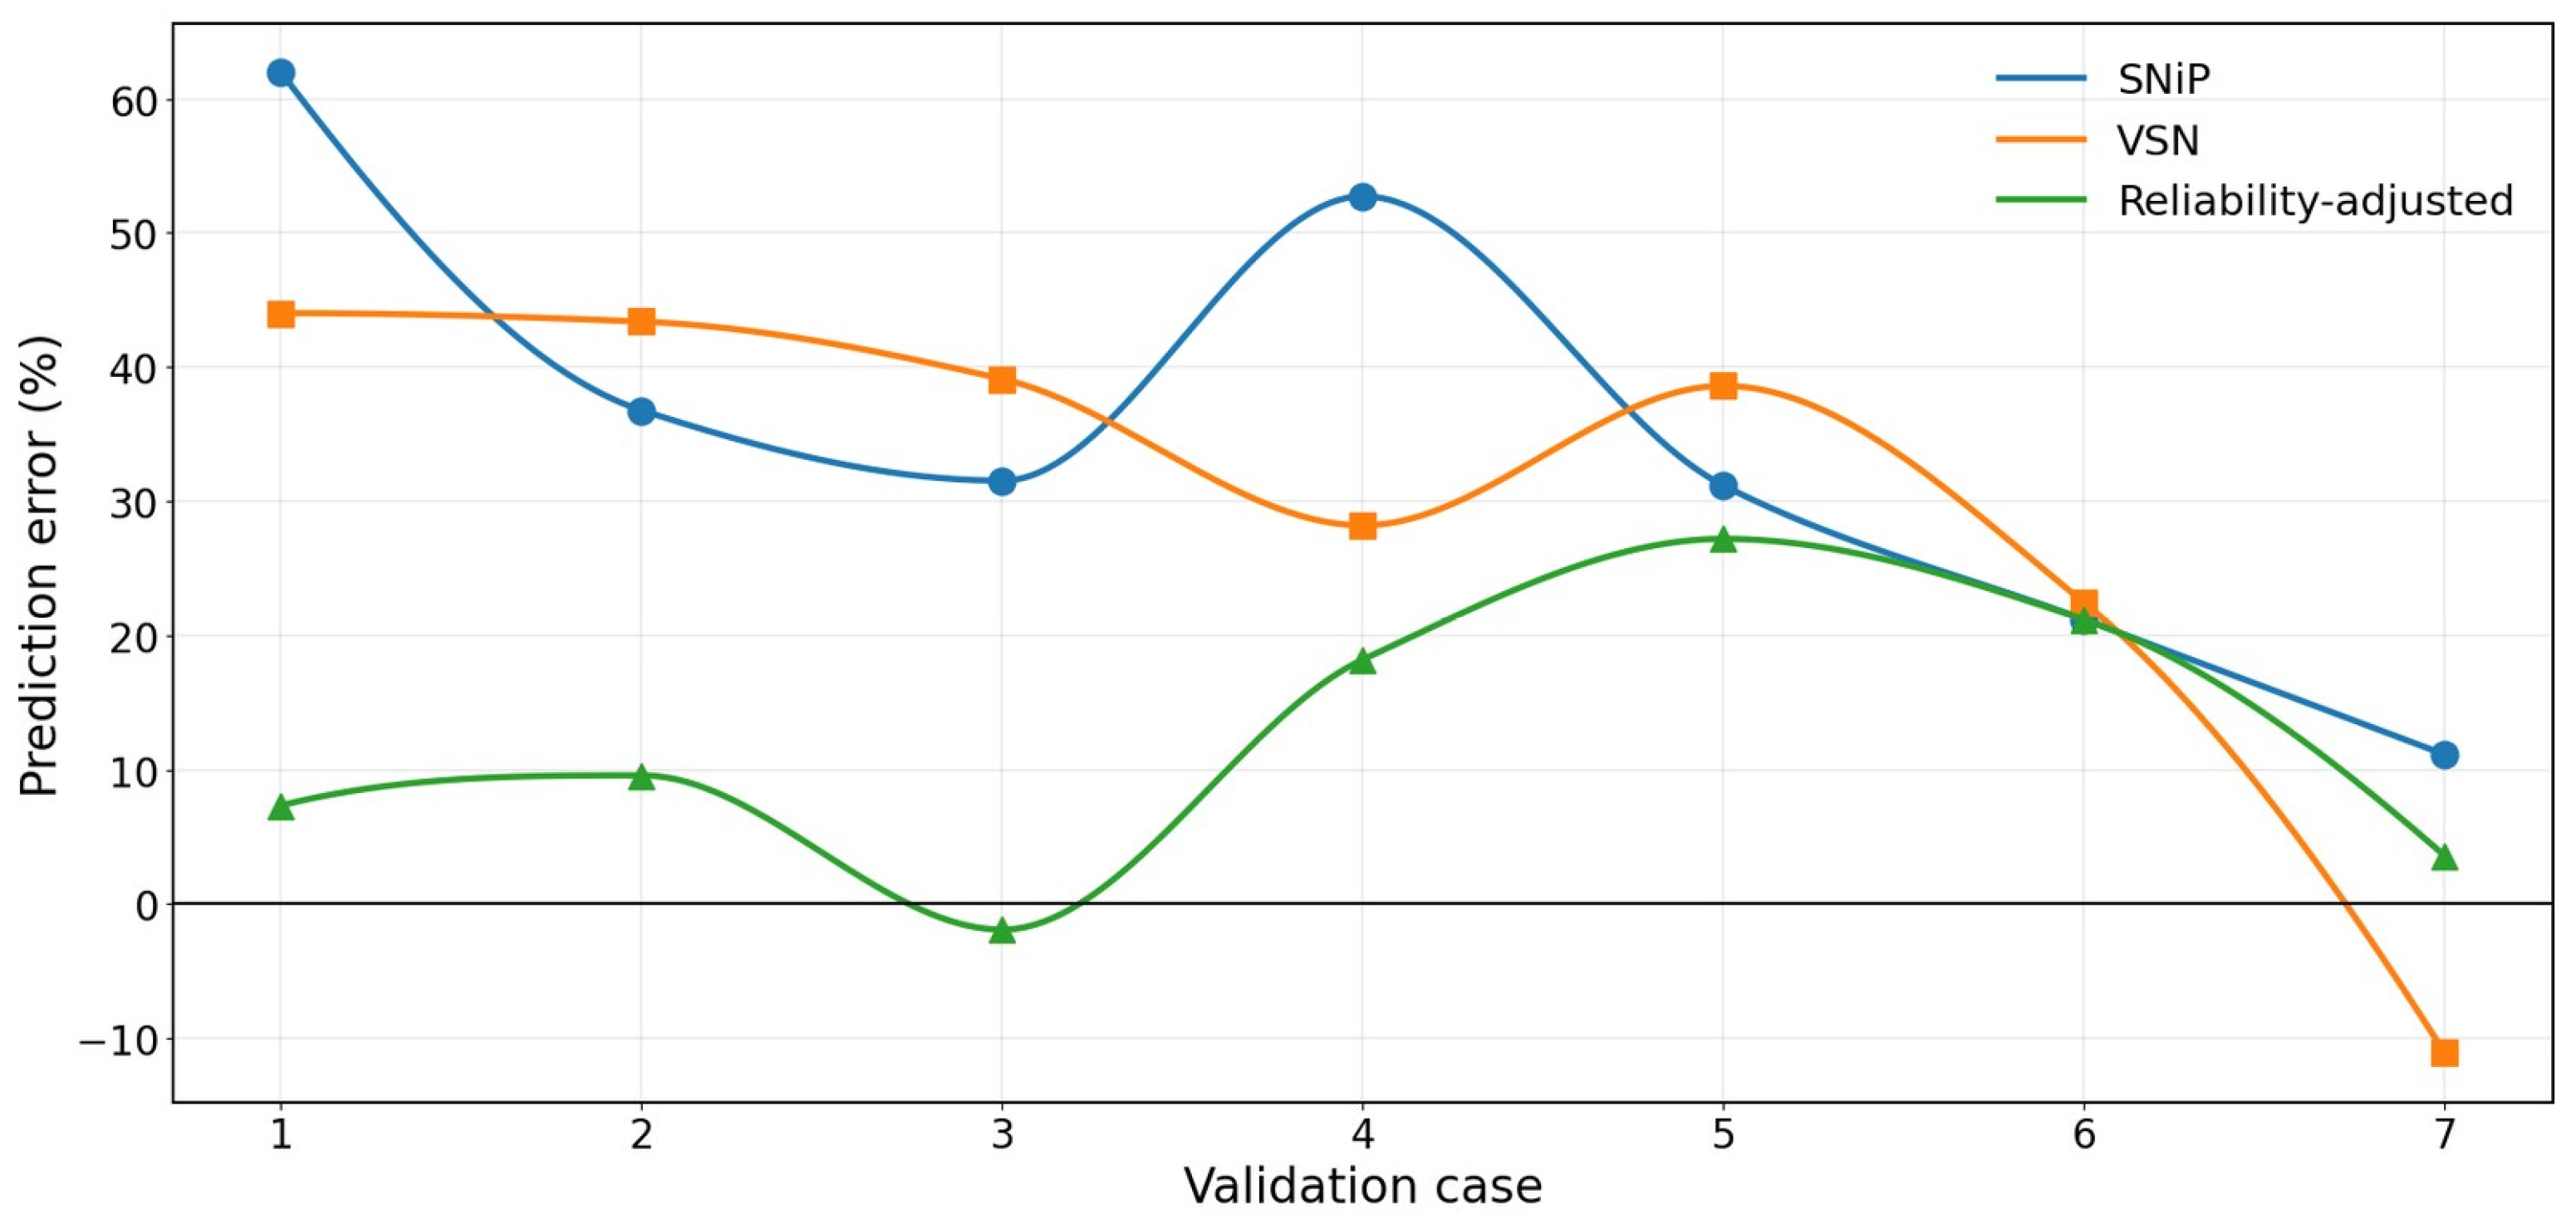
The conventional methods overpredicted most field settlements. The proposed correction tracked the observed magnitude more closely in cases 1–4 and 7, but remained conservative for the two rigid structures represented by cases 5 and 6. Its errors ranged from −1.9% to +27.2%, with no extreme error comparable to the +62.0% SNiP result in case 1. Aggregate prediction metrics are summarized in Table 5, and the case-by-case percentage errors are shown in Figure 3.
Table 5.
Aggregate prediction performance.
Figure 3.
Percentage prediction errors by validation case.
3.3. Physical-Model Evidence for Structure–Foundation Interaction
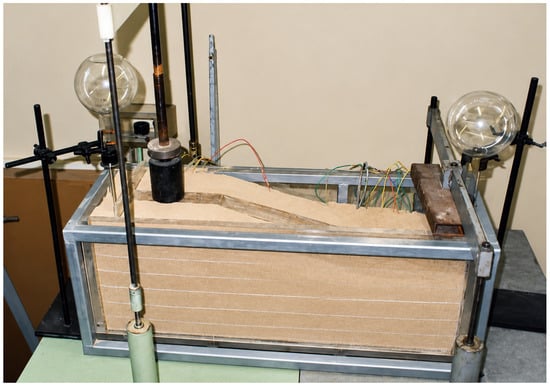
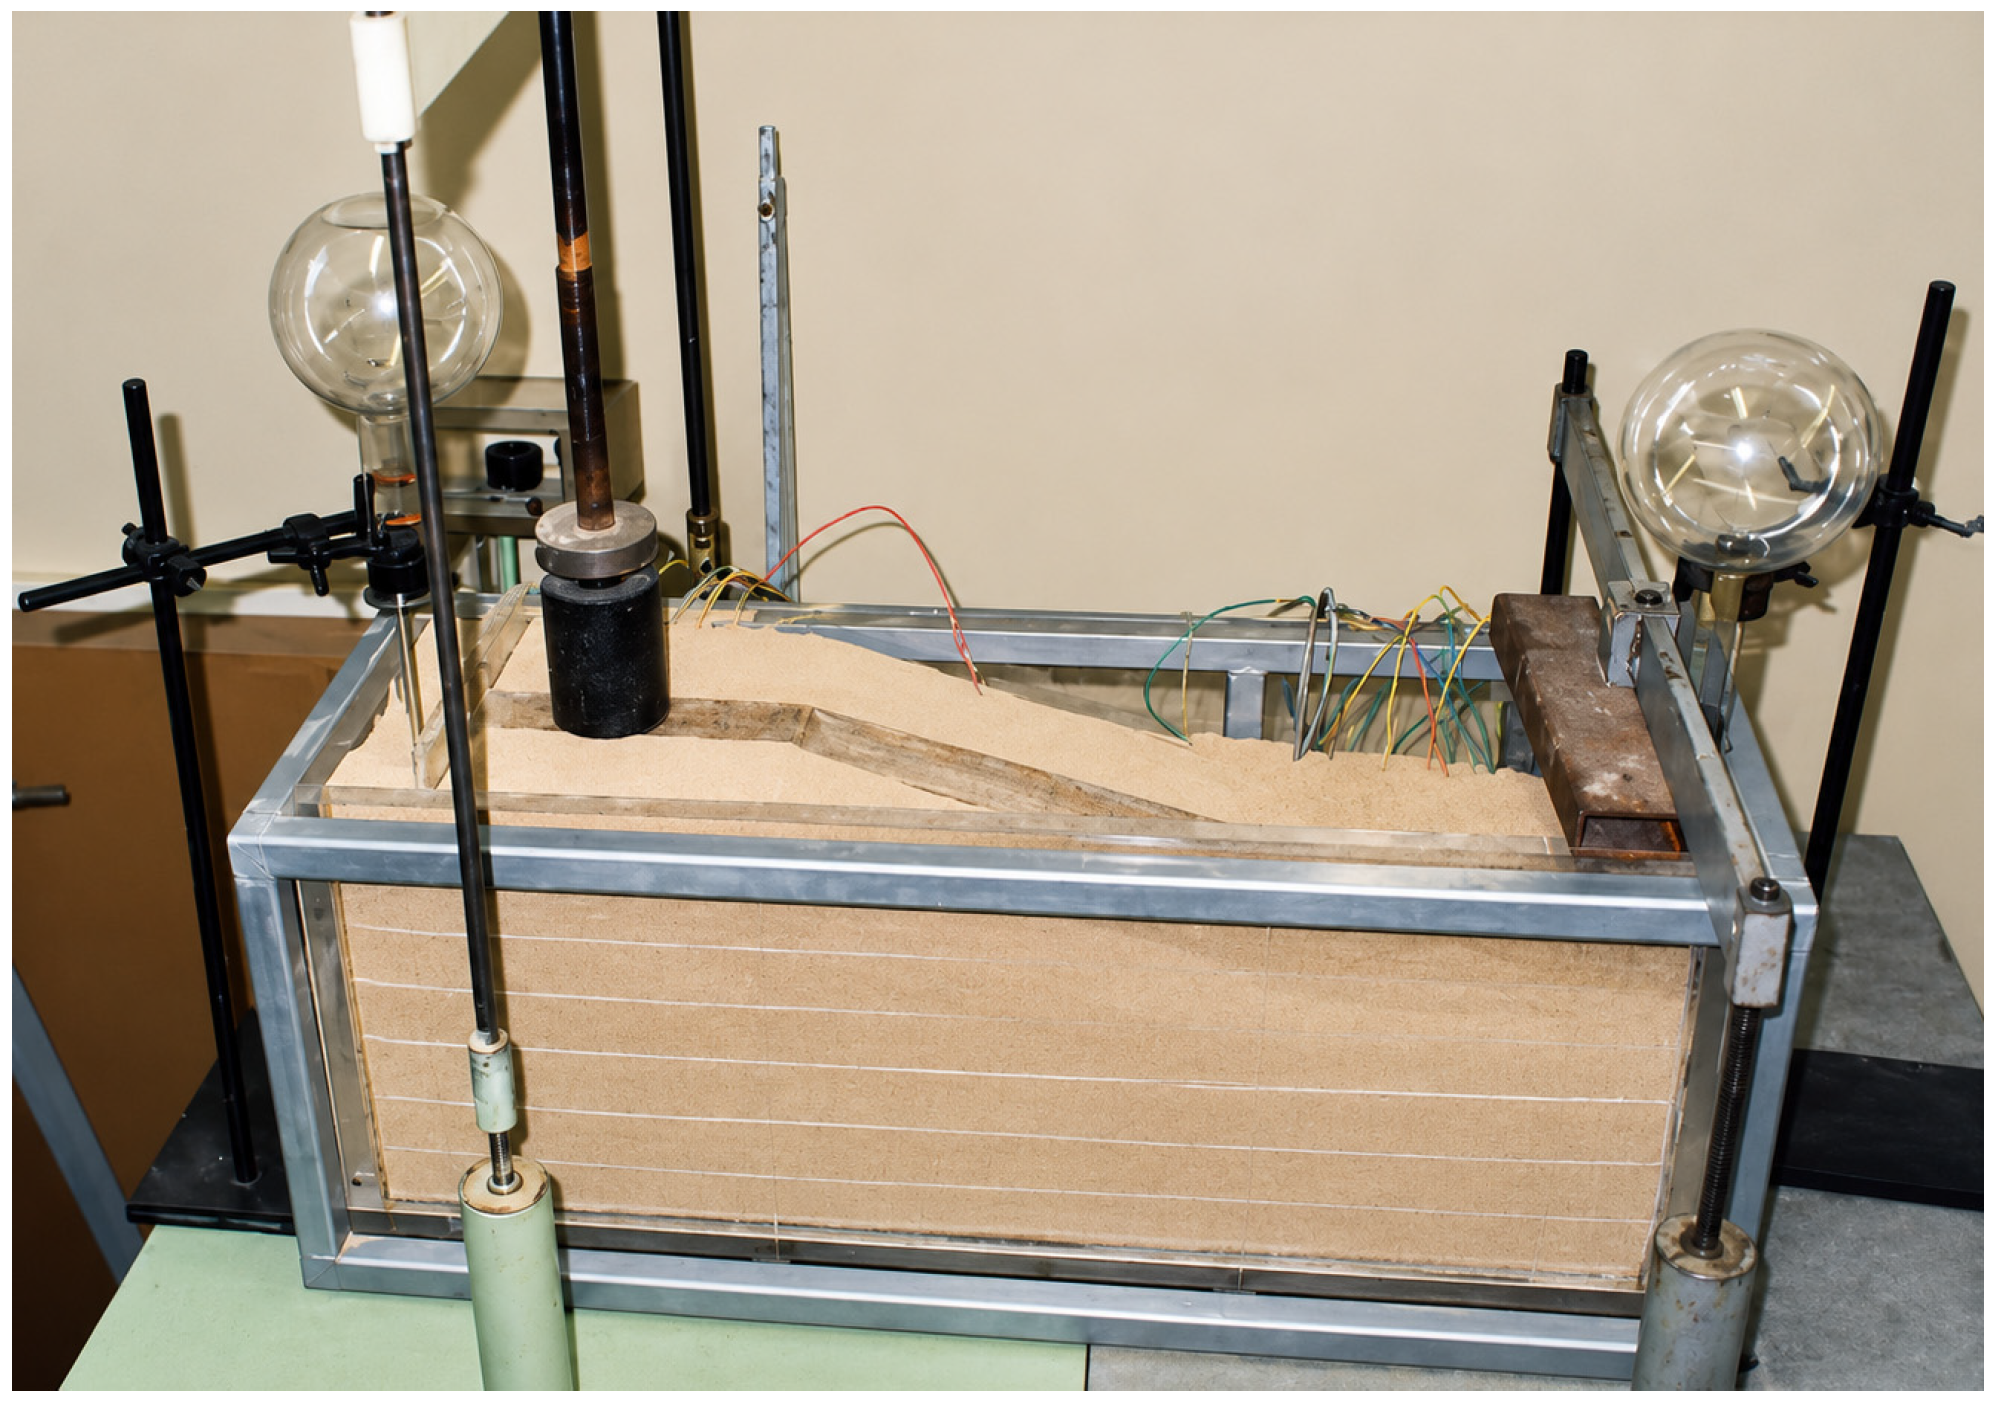
The archival physical-model data revealed a clear dependence of the collapse mechanism on the local stress state [35]. Under the more heavily loaded inlet section, wetting produced a localized vertical deformation column beneath the loaded footprint, bounded approximately by vertical deformation planes beneath the footing edges. The response, therefore, resembled a punching or limit-state mechanism rather than uniform one-dimensional compression. By contrast, beneath the more lightly loaded stilling-basin section, where structural pressure was small relative to excavation surcharge and self-weight stress, the response was closer to compression without pronounced lateral bulging. The experimental flume and loading arrangement are shown in Figure 4.
Figure 4.
The archival laboratory flume used for the physical modeling of the hydraulic structure–collapsible loess system. The loading devices and the upstream/downstream wetting reservoirs are visible. Source: experimental archive reported in [35].
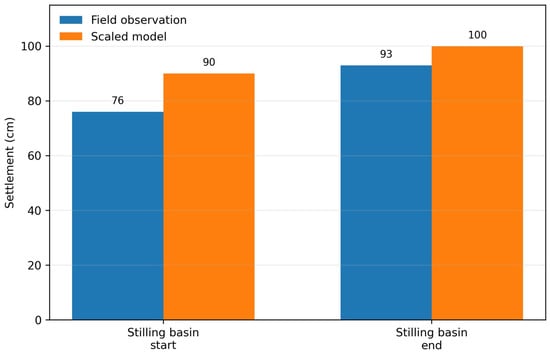
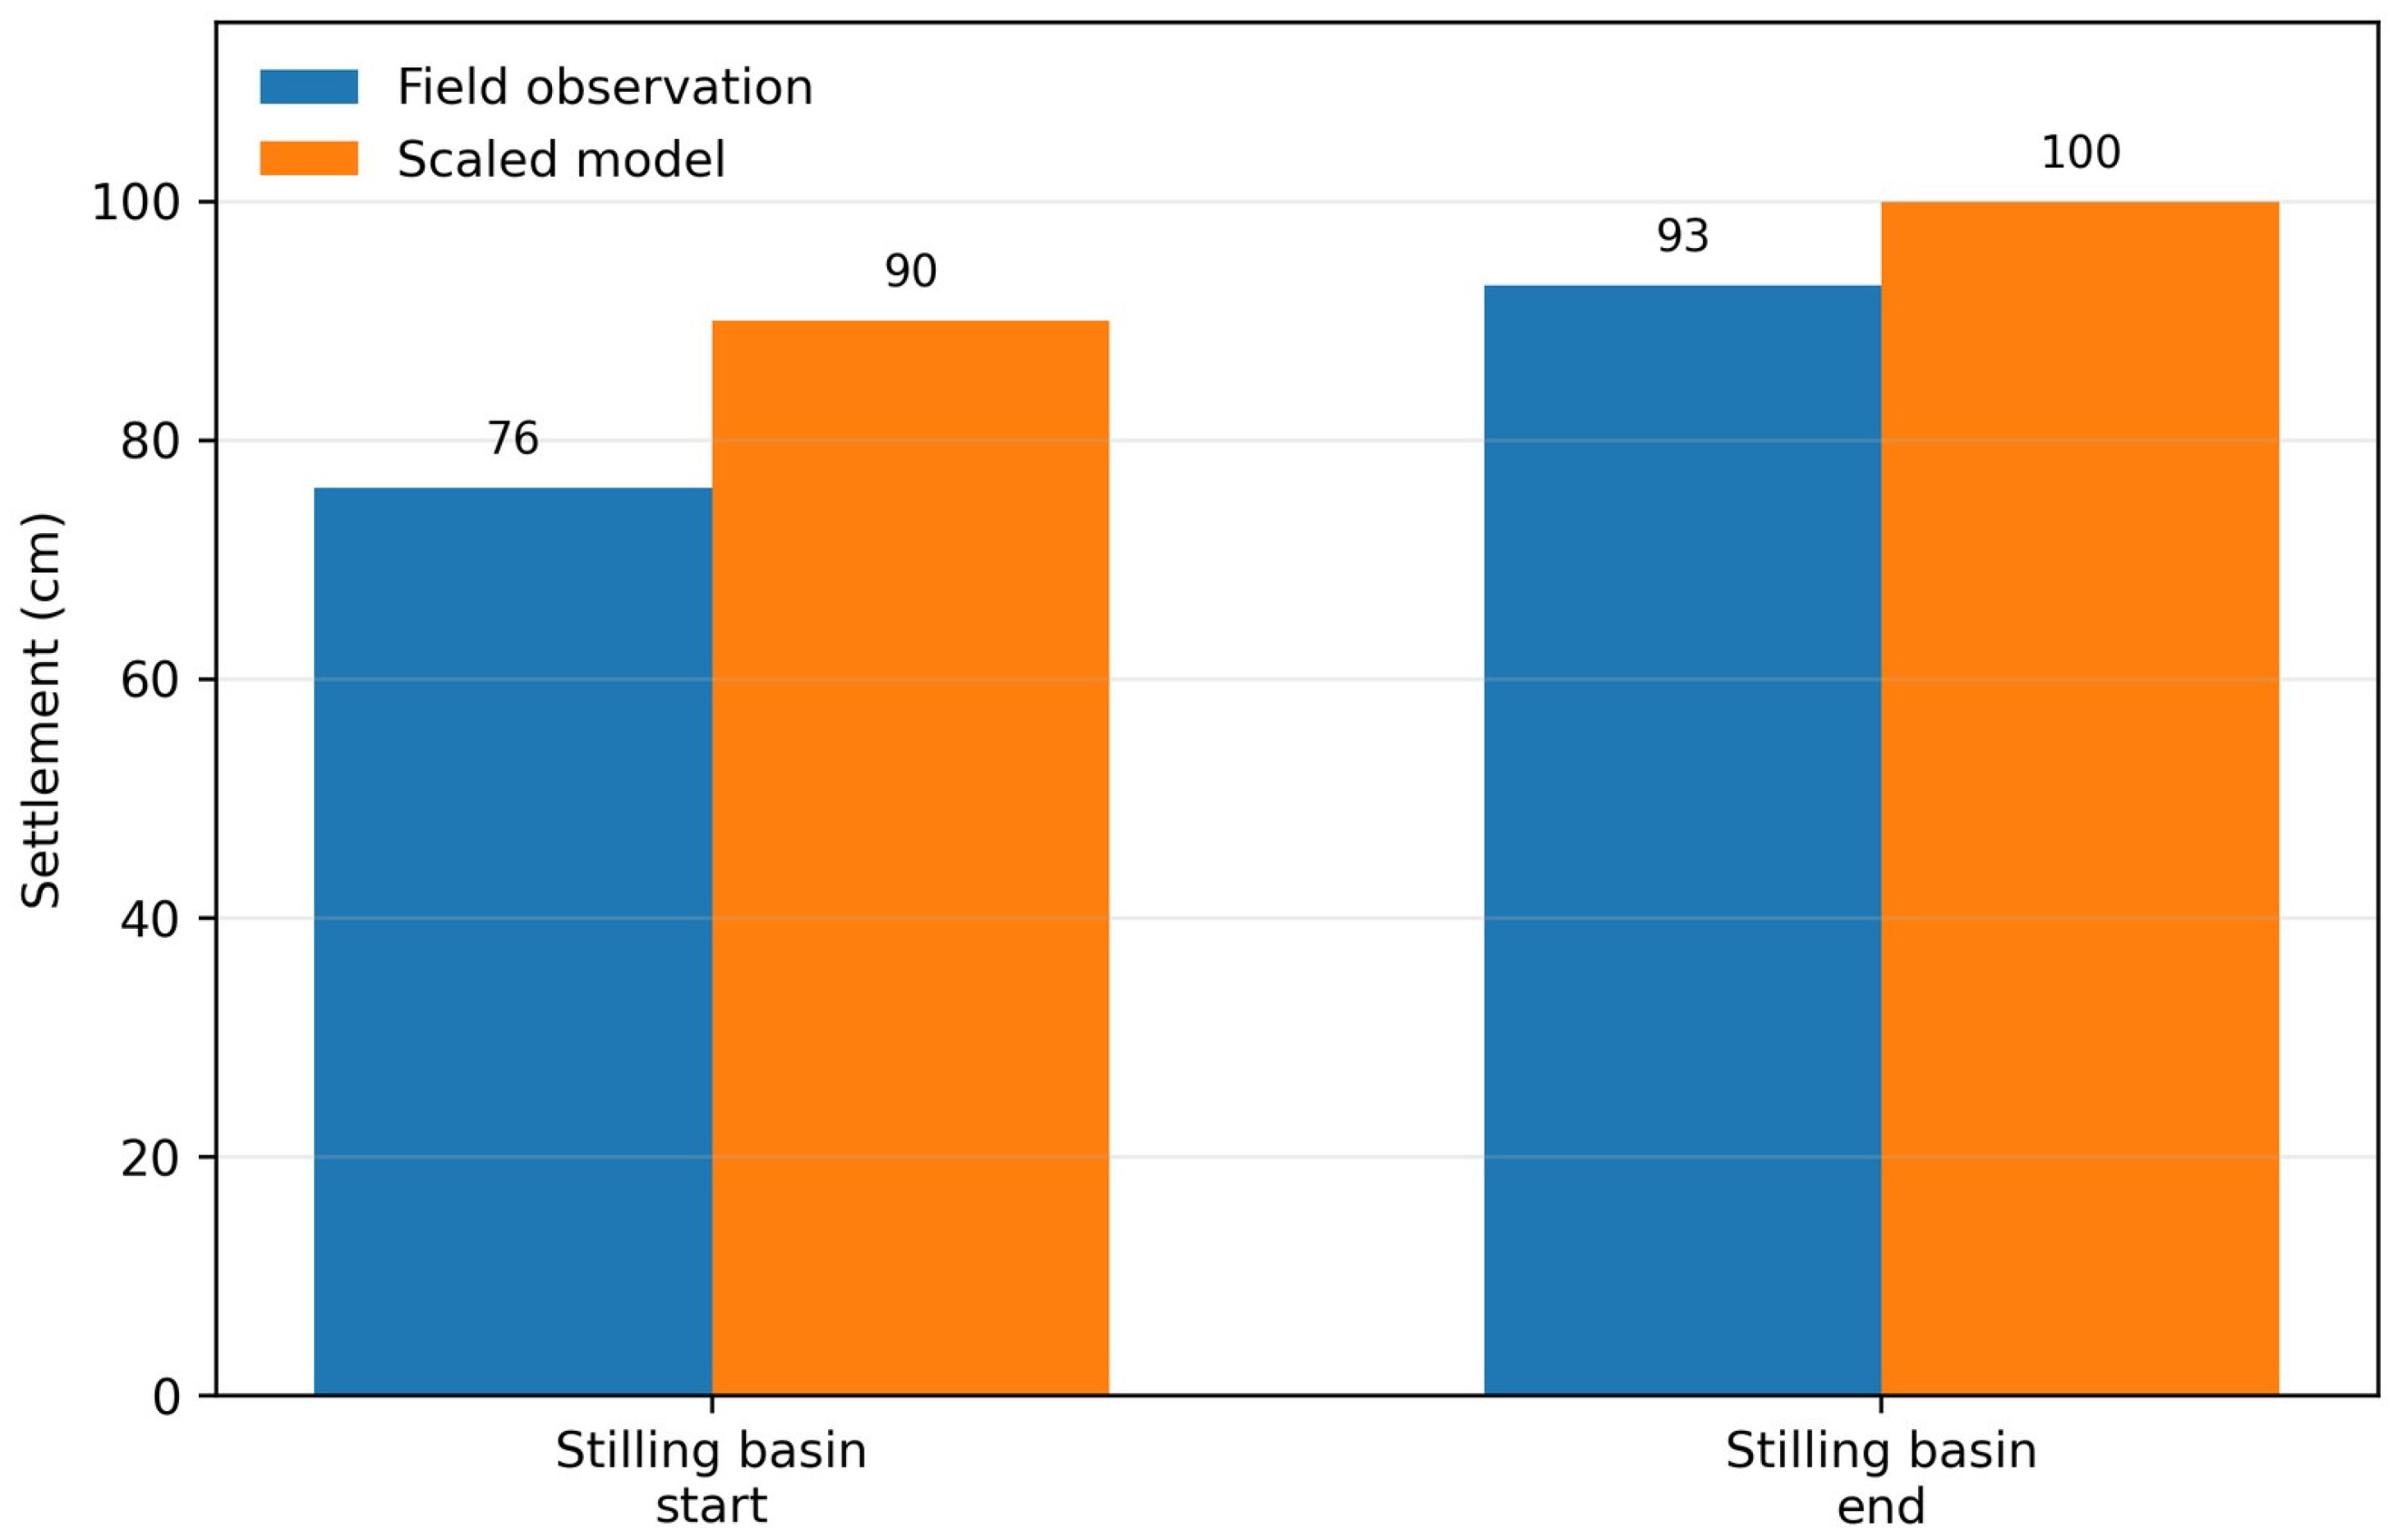
The settlement magnitudes were consistent with the field-scale response. At the beginning and end of the stilling basin, the field settlements were 76 and 93 cm, while the corresponding model values converted to prototype scale were 90 and 100 cm. These differences are approximately 18.4% and 7.5%, respectively. For the inlet section, the conventional calculated mean settlement was 168.2 cm, compared with 185.5 cm obtained from the physical model after scale conversion; the original experimental analysis reported a discrepancy of about 9% when normalized to the model value. The calculated depth of the limit-state deformation zone was 6.46 m, whereas the corrected model-derived depth was 6.91 m, a difference of about 7.0%. These checks are independent of the seven field cases used to compute the prediction-error statistics in Section 3.2. These field-to-model settlement comparisons are illustrated in Figure 5.
Figure 5.
A comparison of field settlements and corresponding prototype-scale settlements obtained from the physical model at the beginning and end of the stilling basin [35].
Deformation contribution. The total collapse deformation of the stressed soil column beneath the inlet was 2.18 cm in the model. The archival decomposition attributed 0.78 cm to the lateral shape change. Its contribution to the total deformation was, therefore, (0.78/2.18) × 100 = 35.8% [35]. This percentage describes a deformation component, not a fraction of transferred load. The decomposition and contribution ratio are defined in Equations (10) and (11).
Deformation coefficient. The reported experimental ratio of total deformation to compression-only deformation was K = 1.55. The independently derived analytical value was approximately 1.60. This coefficient is distinct from the 35.8% contribution ratio. In the lightly loaded stilling-basin section, settlement attributed to the structural load itself was only about 0.1 cm [35].
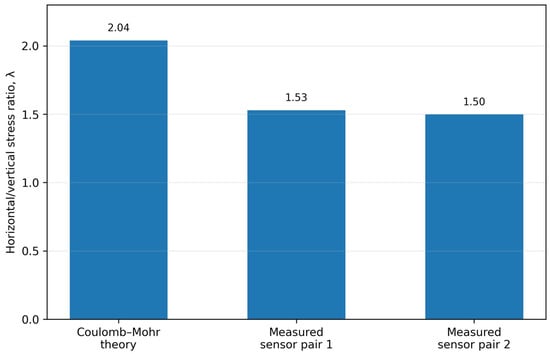
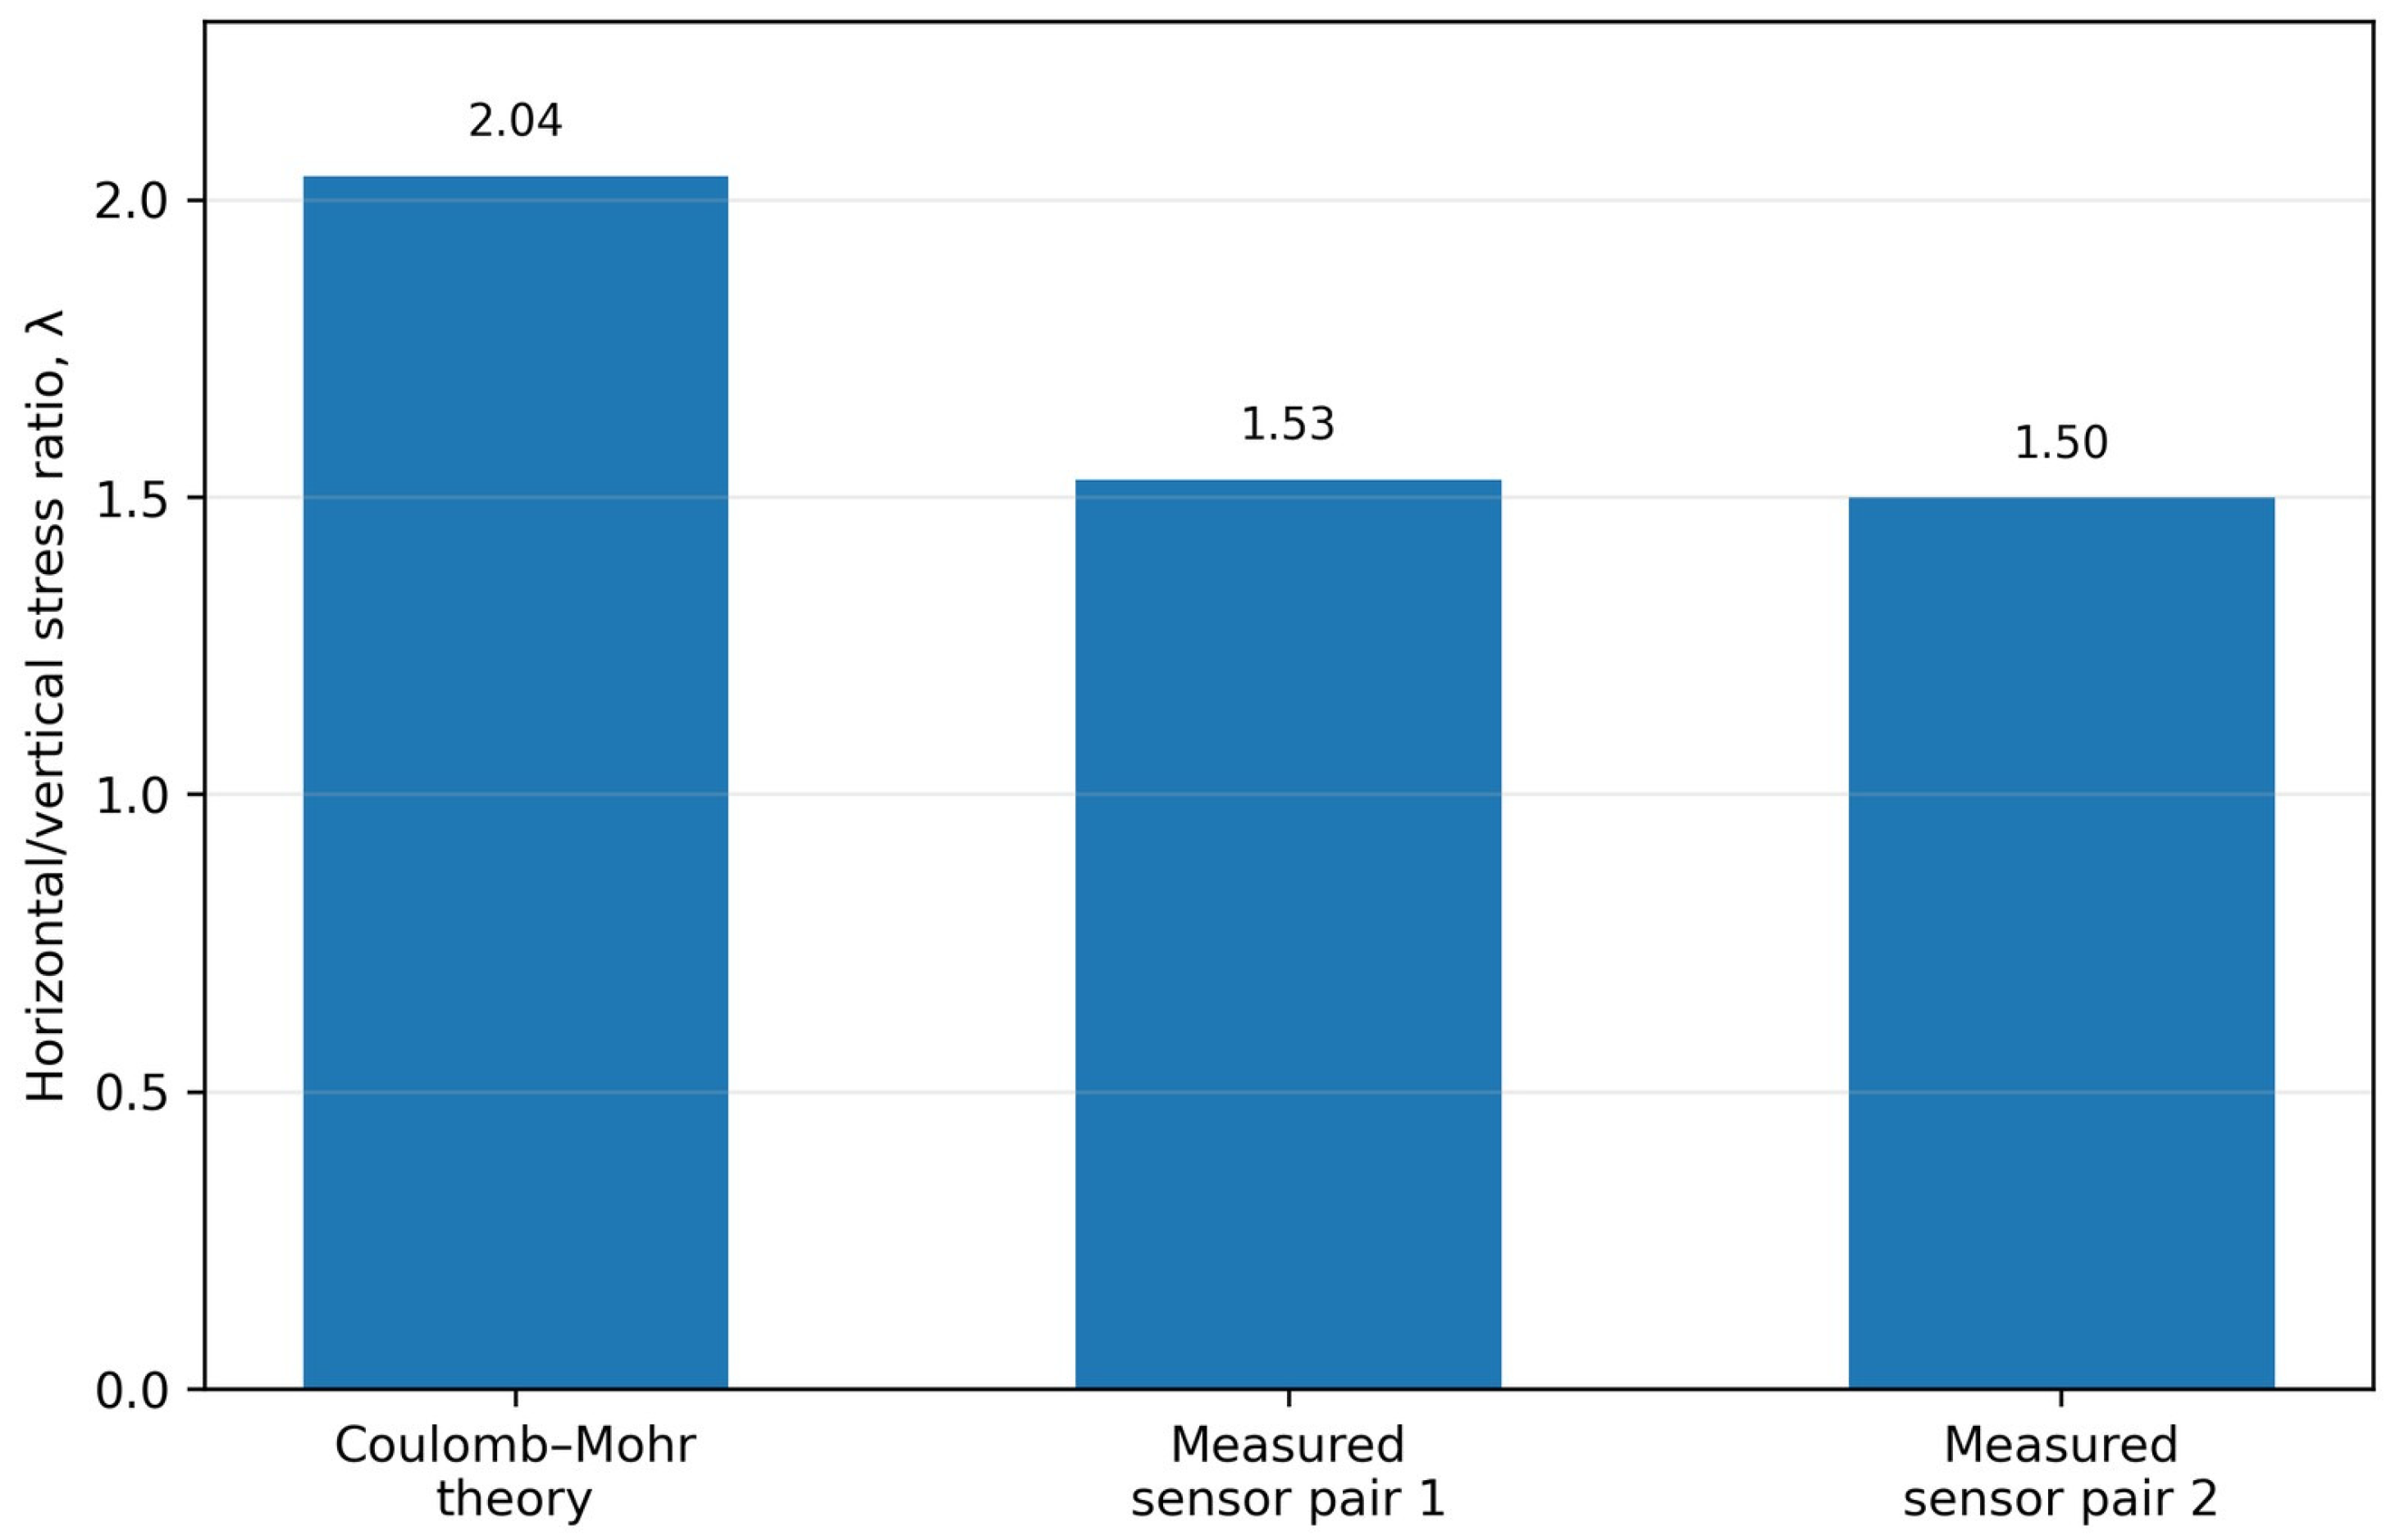
Stress ratios. The measured horizontal-to-vertical stress ratios during collapse were 1.50 and 1.53. The Coulomb–Mohr passive-pressure estimate was 2.04. The measured ratios were approximately 25–26% lower than this theoretical estimate. This comparison illustrates the limitations of describing the evolving stress state with a single deterministic lateral-pressure coefficient [35]. Figure 6 presents the stress ratios, and Table 6 summarizes the quantitative checks from the physical-model program.
Figure 6.
A comparison of the theoretical passive horizontal-to-vertical stress ratio with two ratios measured during collapse in the physical model [35].
Table 6.
Quantitative checks obtained from the archival physical-model program [35].
3.4. Design Interpretation
Table 3 shows that the structural class modifies the coefficient within each ground row. The size of this difference changes between the ground classes; therefore, a single independent structural multiplier does not reproduce the full matrix. Project-specific selection should consider both the wetting conditions and the structural system.
3.5. Regional Variability and Progressive Hydro-Mechanical Response
A coefficient near 1.30 appears in several ground–structure combinations, whereas others exceed 1.40. The matrix should be selected jointly by ground condition and structural class; the numerical values of separate anisotropy, variability, and structure components do not independently reproduce its entries.
The broader Kazakhstan compilation confirms that the loess mass should not be represented by one average state variable. Table 7 summarizes the source means and observed ranges for selected properties. The dispersion is particularly evident for the natural water content, degree of saturation, density-related descriptors, and strength. The mean internal-friction angle changed only from 22 degrees in the natural condition to 21 degrees after saturation, whereas the mean cohesion decreased from 30 to 12 kPa. Thus, at the regional scale, the principal wetting-related strength loss was associated with degradation of bonding/cohesion rather than a comparable reduction in friction angle. This behavior is consistent with a collapse mechanism dominated by the destruction of water-sensitive cementation and the subsequent rearrangement of a porous fabric [35].
Table 7.
The selected regional engineering properties of Kazakhstan loess reported in the archival synthesis [35].
The contrast between the two strength descriptors is important for reliability interpretation. A nearly unchanged mean friction angle does not imply a stable soil skeleton: the simultaneous reduction in mean cohesion by about 60% indicates that wetting removes a large part of the bonding that supports the metastable structure. The source further notes that collapse strain, collapsible thickness, total settlement, density, and water content vary systematically with geomorphic position and also fluctuate rhythmically with depth where loess layers alternate with buried soils. This combination of deterministic regional trends and local scatter explains why a single national or regional mean cannot replace site-specific sampling [35].
3.5.1. Geomorphic Control of Collapse Severity and Trigger Pressure
The archival classification separates three regional geomorphic groups with progressively higher initial collapse pressure Pse (Table 8). Foothill steps, adyrs, and alluvial-fan environments form the most collapse-prone group, with Pse of 10–30 kPa. Foothill proluvial plains occupy an intermediate range of 20–60 kPa, whereas alluvial–proluvial plains and intermontane depressions show higher trigger pressures of 50–120 kPa and were classified as comparatively weakly collapsible. These intervals are not used as direct substitutes for gamma_n; rather, they demonstrate that susceptibility to wetting-induced collapse changes systematically with geomorphic setting even before local sampling variability is considered [35].
Table 8.
Archival regional classification of collapse severity and initial collapse pressure Pse [35].
The same source reports coefficients of variation of approximately 53–125% for collapse-related characteristics in the regional groups. Such values are substantially larger than the 30% heterogeneity criterion used in the historical statistical interpretation. The important point for the present method is not the numerical transfer of these coefficients into gamma_n, because the sampling populations and spatial scales differ, but the persistence of large variability after broad stratigraphic grouping. Even within a nominally similar loess unit, the local foundation response can, therefore, depart materially from the regional mean. This supports the use of a separate natural-variability term and the recommendation that it be updated from the actual project investigation whenever a sufficiently representative sample is available [35].
3.5.2. Progressive Wetting and Transient Redistribution of Contact Stress
The physical-model records show that collapse was strongly path dependent. At the visible wetting boundary, the water content was approximately W = 0.27 and the degree of saturation Sr was about 0.73. Inside the wetted zone, these values rose to W = 0.30 and Sr = 0.85. Settlement of a wetted layer stabilized about two days after the wetting front reached it. Wetting advanced from both ends toward the center of the chute. Consequently, the central part began to settle about four days after collapse started beneath the outer inlet region. This delay caused rotations and relative displacements between structural fragments rather than synchronous vertical settlement [35]. Table 9 summarizes the principal hydro-mechanical observations.
Table 9.
Additional hydro-mechanical observations from the archival field and physical-model program [35].
Contact-stress variation. The pressure beneath the progressively wetted inlet zone decreased from approximately 154 to 110 and then to 30 kPa. In an adjacent drier support region, the pressure increased to about 220 kPa. These values describe local contact-pressure observations from the archival physical model [35].
The load-transfer mechanism. The pressure changes indicate that the structure transferred load away from the softened support zone toward the adjacent drier soil. As wetting advanced, the location of concentrated contact stress also changed. A calculation with fixed contact pressure cannot represent this evolving load path [35]. Equations (7) and (8) state the corresponding equilibrium constraints.
The residual stress response. After collapse, horizontal stress in the loaded column remained above its initial value. The final stress state thus retained the effect of the preceding deformation path [35]. The deformation contribution ratio is reported separately in Section 3.3.
Full-scale observations from the same archival program illustrate the structural consequence of this mechanism. The outer edge of the inlet part settled approximately 162 cm compared with a self-weight collapse reference of 114 cm, and the same fragment moved horizontally by about 12 cm. Relative vertical offsets between structural parts reached approximately 33–50 cm, while joint openings of about 6–9 degrees were reported after progressive wetting. These observations reinforce the interpretation that collapse of hydraulic structures is a system response involving wetting sequence, structural continuity, and load transfer, rather than a soil-only one-dimensional strain process [35].
4. Discussion
4.1. The Physical Basis and Decomposition of the Reliability Factor
The proposed approach separates three sources of departure from a mean laboratory collapse strain: the directional response, spatial variability within the loess mass, and deformation redistribution caused by the structure. The archival records used to construct the database treated relative collapse-strain variability in these terms. Wetting-induced collapse is also a coupled hydro-mechanical process: suction loss, degradation of the metastable fabric, stress path, and local confinement act together [6,9,10]. A single working-condition coefficient may perform adequately for one structure but transfer poorly to another because it combines these distinct mechanisms.
The factorization also provides a useful hierarchy for engineering decisions. The anisotropy term gamma_a represents a directional material effect; gamma_n represents uncertainty associated with the finite spatial sample of the ground mass; and gamma_s represents the feedback of the structural stiffness and the contact-stress redistribution. In the source statistical treatment, the representative collapse-strain data were evaluated at a confidence probability of 0.95 and with an effective resolution of 0.01 in relative collapse strain. These choices are appropriate for the historical database but should be recognized as a source of discretization: rounding and screening at 0.01 can suppress part of the lower-amplitude variance. Accordingly, the factors reported here should be interpreted as design-level reliability corrections rather than intrinsic constants of loess.
4.2. Anisotropy and Natural Spatial Variability of Collapsible Loess
The adopted anisotropy component gamma_a = 1.15 has a direct physical basis in the directional fabric of loess. The archival evidence from paired horizontal and vertical collapse testing indicated that the anisotropy ratio was comparatively insensitive to the stress state and was similar across several lithological varieties, which justified using a constant value in the screening matrix. This interpretation is consistent with studies showing that intact loess retains depositional structure, elongated macropores, preferential particle orientation, and cemented contacts [13,14]. Microstructural and micro-CT investigations have further demonstrated nonuniform particle translation and rotation, destruction of large inter-aggregate pores, and direction-dependent rearrangement during wetting [15,16,17,18,19]. Nevertheless, 1.15 should not be regarded as universal. Where a project has orientation-specific oedometer or suction-controlled tests, gamma_a should be updated directly from those data.
The natural-variability component gamma_n = 1.12–1.20 addresses a different problem: the loss of information that occurs when a highly variable soil mass is represented by one mean collapse strain. The underlying 12-site database was classified using lithological continuity, drainage conditions, and the ratio Hse/B, where Hse is the collapsible thickness, and B represents the expected lateral wetting width. The lower end of the range was associated with relatively homogeneous and well-drained profiles, whereas heterogeneous profiles with shallow groundwater required values near 1.20. The broader regional material compiled in the source investigation also showed coefficients of variation for collapse-related characteristics well above the conventional 30% threshold for strong engineering–geological heterogeneity, in some groupings reaching approximately 53–125%. This magnitude of scatter supports treating spatial variability explicitly rather than absorbing it into the mean. The approach is conceptually consistent with reliability frameworks that distinguish inherent spatial variability from measurement and transformation uncertainty [26,29], and with random-field studies showing the importance of correlation length, anisotropy, and spatial averaging for foundation reliability [30,31,32,33].
4.3. Structure–Foundation Interaction and Support from Physical Modeling
The structure-interaction component gamma_s ranges from 1.05 to 1.08. It is smaller than gamma_n, but determines which part of the heterogeneous ground may control the response. The source records derived gamma_s empirically from monitored hydraulic structures: about 1.05 for flexible earthworks, and up to 1.08 for structures on separated rigid supports. Nonuniform wetting softens part of the foundation. A rigid or segmented structure then redistributes contact pressure and may raise stress in another collapse-prone zone. Leakage from joints, canals, or pipelines, and first filling, therefore, cannot be represented as a uniform reduction in soil stiffness. Recent studies confirm the roles of wetting geometry, leakage stage, embedment, collapsible-layer thickness, and the moving saturation front [11,23,24,25].
The archival laboratory model indicated different deformation mechanisms under the two structural sections. Beneath the heavily loaded inlet, collapse formed a local vertical bearing column. The column also developed barrel-shaped lateral deformation. Beneath the lightly loaded stilling basin, deformation was closer to one-dimensional compression, with no pronounced lateral shape change [35].
The deformation decomposition quantifies this contrast. Lateral shape change contributed 0.78 cm of the total 2.18 cm deformation beneath the inlet, corresponding to 35.8%. The reported total-to-compression-only deformation ratio was approximately 1.55. These two measures describe the deformation response; they are not direct estimates of the structure-interaction correction factor. They provide mechanistic support for considering structural influence separately [35].
The physical-model results also provide a useful independent plausibility check, although they were not included as additional cases in the seven-structure validation set used for the present error statistics. For the stilling-basin portion, field settlements of approximately 76 and 93 cm at two locations were reproduced by scaled model values of about 90 and 100 cm, respectively. For the inlet section, the discrepancy between the calculated and modeled settlement was about 9%, within the accuracy adopted for the historical experimental program. These comparisons support the basic interaction mechanism used to motivate gamma_s, but they should not be interpreted as a separate statistical validation of the present factor matrix because the modeling assumptions, loading scheme, and observation basis differ from those of the seven field cases [35].
4.4. The Prediction Performance and Interpretation of the Conventional Baselines
The seven field cases quantify the practical effect of introducing the three components. The reliability-adjusted method reduced the MAPE from 35.2% for the SNiP calculation set and 32.4% for the VSN set to 12.7%, corresponding to relative reductions of approximately 63.9% and 60.8%, respectively. The RMSE decreased from 30.7 and 26.8 cm to 10.1 cm, reductions of about 67.1% and 62.3%. Importantly, this improvement was not obtained by forcing the mean error to zero: the adjusted method retained a positive mean bias of +12.1%. For preliminary and design-stage screening, such a moderate conservative bias is preferable to an apparently unbiased model that can produce severe case-specific misprediction. The absence of an error comparable to the +62% SNiP error in case 1 further indicates that the correction reduces systematic model mismatch across different ground and structural classes.
The SNiP and VSN calculations in this study should be understood as historical baselines tied to the archival monitoring records, not as a claim that these documents represent current international geotechnical practice. Their value in the comparison is methodological: they show the magnitude of the error produced when the source data are treated using conventional deterministic collapse-strain procedures without the explicit reliability decomposition proposed here. Modern reliability-based and random-field approaches provide more sophisticated treatment of uncertainty [26,29,30,31,32,33], while coupled hydro-mechanical models can represent transient suction and wetting-front development [11,25]. The present method is, therefore, positioned between these two levels: more transparent and uncertainty-aware than a single empirical coefficient, but intentionally simpler than a full stochastic hydro-mechanical analysis.
The two largest remaining adjusted errors occurred in cases 5 and 6, both associated with relatively rigid structural systems. This pattern suggests that the current stiffness classification captures only part of the interaction. Additional descriptors likely include the actual plan dimensions of the loaded area, continuity and rotational stiffness of joints, the location and duration of the wetting source, the ratio of wetting depth to Hse, the lateral extent of seepage, and the time at which geodetic observations were made relative to the progress of saturation. The residual error is, therefore, informative rather than purely random: it identifies gamma_s as the component with the clearest potential for refinement through explicit hydraulic and structural variables.
4.5. Reliability Implications, Field Investigation, and Limitations
The source investigation treated the collapse of hydraulic-structure foundations as a reliability problem because wetting can cause an abrupt loss of structural bonding in loess and generate deformations large enough to interrupt operation, open joints, and initiate concentrated seepage. That interpretation remains useful, although modern limit-state terminology should be applied with care: whether a particular consequence is classified as an ultimate or serviceability limit state depends on the structural system and the governing design standard. The more general implication is that the target reliability should reflect the consequence of differential collapse for the whole structure–foundation system rather than the nominal bearing capacity of the dry soil alone. This system view is particularly relevant to hydraulic structures, for which deformation can create the leakage path that subsequently intensifies wetting and further collapse.
The results also have direct implications for site investigation. Spatial variability should be characterized over the hydraulic influence zone, not only beneath the concrete footprint. The archival classification explicitly used the relationship between collapsible thickness and lateral wetting width, and this should be retained in modern applications because seepage commonly extends beyond the structural plan. For linear irrigation facilities, boreholes and sampling profiles should, therefore, be distributed both along the alignment and transverse to the expected wetting path. Where sufficient samples are available, gamma_n should be recalculated from project-specific statistics; paired sampling orientations can be used to update gamma_a; and staged settlement monitoring during controlled filling or observed leakage can be used to calibrate gamma_s. This updating strategy is consistent with current reliability-based practice and progressively reduces dependence on generalized factors [26,29,30,31,32,33].
The development evidence consists of 12 investigated sites, seven monitored structures, and one archival physical-model study. The source compilation does not provide the site-level samples, sample counts, or complete factor-calibration ledger needed to reproduce Table 3 from the reported component ranges. The matrix has a measurable ground–structure interaction (Equation (2)), so independence or exact multiplicative separability cannot be inferred. Neither covariance between component measurements nor the probability of exceeding a settlement limit can be calculated from these aggregate data. The model also omits transient suction, hydraulic conductivity, progressive saturation, and three-dimensional stress redistribution. Prospective application requires site-specific checking against these effects, especially for high-consequence facilities.
Accordingly, the matrix is a preliminary empirical adjustment rather than a calibrated probabilistic safety factor. Future work should recover or newly collect paired directional tests, spatially located collapse-strain measurements, wetting histories, and settlement observations; estimate their dependence; and validate the matrix on independent sites. The physical-model results support the load-transfer mechanism but do not establish a probability of safety [35].
The Historical Dataset Reflects the Investigation Methods, Measurement Resolution, and Construction Typologies Available at the Time. The Scalar Matrix Does Not Explicitly Simulate Transient Suction, Hydraulic Conductivity, Progressive Saturation, or Three-Dimensional Stress Redistribution. It Should Be Checked Against Independent Observations Before Use Outside the Investigated Settings
The matrix offers an empirical screening aid where project data are sparse. Its classification highlights directional soil behavior, spatial variation, and soil–structure load transfer, but their statistical dependence remains unknown. Future testing should estimate joint behavior before assigning a formal reliability level.
The geomorphic trend in Pse is equally important. A foundation in a foothill-step or alluvial-fan setting may begin to collapse at stresses of only 10–30 kPa, while another loess group in an alluvial–proluvial plain or intermontane depression may require 50–120 kPa before the collapse criterion is reached. These values should not be used as universal design classes outside the source region, but they demonstrate a general reliability issue: two sites with similar index descriptions can occupy very different positions relative to the collapse threshold under the same structural load. In probabilistic terms, spatial variability affects not only the magnitude of collapse strain after triggering but also the probability that a given stress-wetting path crosses the triggering condition.
This distinction suggests a practical updating strategy. During preliminary screening, the present matrix can retain its generalized gamma_n values. Once site data are available, the designer should separate at least two statistical questions: (i) the distribution of collapse strain conditional on the adopted stress and wetting state, and (ii) the spatial distribution of initial collapse pressure or equivalent triggering descriptors. The first governs the magnitude of post-trigger deformation, whereas the second governs where and when collapse is activated. Treating both through one unqualified mean collapse strain can conceal an unfavorable combination of low trigger pressure and high strain in a locally critical zone. This interpretation is consistent with the broader reliability literature, in which inherent spatial variability and transformation uncertainty are kept distinct where possible [26,29,30,31,32,33].
4.6. Progressive Wetting, Stress-Path Dependence, and the Structure-Interaction Component
The contact-pressure observations describe the stress variation directly. Pressure beneath the wetted support region decreased from 154 to 110 and then to 30 kPa. In the adjacent drier region, it increased to about 220 kPa [35].
The inferred mechanism is a change in the structural load path. As wetting softens one support zone, the structure transfers load toward the remaining stiffer zone. If that newly loaded zone is subsequently wetted, collapse may develop under the elevated contact stress. This sequence offers a possible explanation for part of the residual error in rigid structural cases 5 and 6. The present data do not quantify its contribution to those errors.
The wetting sequence also introduces time dependence that the scalar factor matrix does not resolve. In the archival model, deformation of a wetted layer stabilized after roughly two days. Collapse beneath the central structural fragment began about four days after it started beneath the outer fragment. During this interval, the fragments had different support conditions. One behaved as a partially supported or cantilever-like element, while another rested on relatively stiff dry soil. Spatially asynchronous collapse caused rotation and joint opening. Coupled hydro-mechanical models can simulate this sequence explicitly [11,25]. The present gamma_s term instead summarizes its cumulative design-stage effect.
For practical use, this result suggests that structural class alone may be insufficient when the wetting pattern is strongly localized. Two structures with similar global stiffness can experience different interaction effects if one is wetted symmetrically and the other is exposed to leakage from a single joint or channel reach. A future refinement of gamma_s should, therefore, consider at least a dimensionless wetting-location descriptor, the ratio of wetting-front depth to collapsible thickness, and a structural continuity or rotational-stiffness parameter. The present archival observations provide a physical basis for these variables, while the seven-case validation identifies the rigid-structure class as the first priority for additional calibration.
4.7. Design Use of the Expanded Evidence and Limits of Transferability
At screening level, Table 3 can be used as an archived empirical adjustment for the specified ground and structural classes. At project-design level, orientation-specific tests, spatial sampling, monitored settlement, and transient seepage analysis should be used to update or supersede the table. A probabilistic reliability claim requires paired site-level observations, an explicit dependence model, and an independently checked limit-state calculation.
The regional tables added here are intentionally used as mechanistic and contextual evidence rather than as a second calibration database. They combine historical investigation campaigns with different sampling densities and test protocols, and some values represent broad geomorphic populations rather than one statistically stationary field. Directly pooling those records with the 12-site dataset would, therefore, create an artificial sample size and could overstate confidence in gamma_n. The same caution applies to the physical-model observations: they strongly support the mechanism represented by gamma_s, but they do not constitute independent field realizations for probabilistic fitting because the geometry, scaling rules, and boundary conditions differ from those of the monitored structures.
Within these limits, the added material improves transferability of the method by showing which measurements should be collected when the generalized factors are updated. The most informative additions are not simply more collapse-strain tests, but paired directional testing, mapping of Pse or an equivalent triggering parameter, repeated sampling across the expected wetting footprint, documentation of groundwater and drainage conditions, and monitoring of the wetting sequence relative to structural settlement. This information would allow the present physically separated factors to evolve from categorical values toward project-specific reliability variables, without losing the method’s engineering transparency.
5. Conclusions
- The archived ground–structure matrix provides empirical settlement corrections; its entries cannot be reproduced by multiplying the reported component ranges.
- In seven monitored cases, the tabulated correction reduced prediction error but retained a positive mean bias.
- The model observations support load transfer toward drier support zones and lateral deformation beneath heavier loads.
- The matrix captures a ground–structure interaction and supports preliminary screening where its historical conditions apply; site-specific data are required for design calibration.
- The proposed correction method is applicable to conventional loess hydraulic structures. Further verification is required for its suitability under extremely complex terrain, special loess layers with high water content, and large-span hydraulic structures.
Author Contributions
Conceptualization, G.Z.; methodology, G.Z.; data curation, G.Z., N.S., N.T. and A.Z.; validation, G.Z., S.U. and A.Z.; formal analysis, G.Z. and S.U.; investigation, G.Z., N.S., A.B. and A.Z.; writing—original draft preparation, G.Z. and S.U.; writing—review and editing, S.U., A.Z., N.S., N.T. and A.B.; visualization, S.U. and A.B.; supervision, S.U.; project administration, S.U. and A.B. All authors have read and agreed to the published version of the manuscript.
Funding
This research received no external funding.
Institutional Review Board Statement
Not applicable.
Informed Consent Statement
Not applicable.
Data Availability Statement
The data presented in this study are included in the article. Additional information on the reported calculations is available from the corresponding author upon reasonable request.
Conflicts of Interest
The authors declare no conflicts of interest.
References
- Dudley, J.H. Review of collapsing soils. J. Soil Mech. Found. Div. 1970, 96, 925–947. [Google Scholar] [CrossRef] [Scilit]
- Jennings, J.E.; Knight, K. A guide to construction on or with materials exhibiting additional settlement due to collapse of grain structure. In Proceedings of the 6th Regional Conference for Africa on Soil Mechanics and Foundation Engineering, Durban, South Africa, 8–12 September 1975; pp. 99–105. [Google Scholar]
- Derbyshire, E.; Dijkstra, T.; Smalley, I.J. (Eds.) Genesis and Properties of Collapsible Soils; Kluwer Academic Publishers: Dordrecht, The Netherlands, 1995. [Google Scholar] [CrossRef] [Scilit]
- Rogers, C.D.F.; Dijkstra, T.A.; Smalley, I.J. Hydroconsolidation and subsidence of loess: Studies from China, Russia, North America and Europe. Eng. Geol. 1994, 37, 83–113. [Google Scholar] [CrossRef] [Scilit]
- Feda, J. Collapse of loess upon wetting. Eng. Geol. 1988, 25, 263–269. [Google Scholar] [CrossRef] [Scilit]
- Li, P.; Vanapalli, S.K.; Li, T. Review of collapse triggering mechanism of collapsible soils due to wetting. J. Rock Mech. Geotech. Eng. 2016, 8, 256–274. [Google Scholar] [CrossRef] [Scilit]
- Phien-wej, N.; Pientong, G.; Balasubramaniam, A.S. Collapse and strength characteristics of loess in Thailand. Eng. Geol. 1992, 32, 59–72. [Google Scholar] [CrossRef] [Scilit]
- Piyasawat, K.; Nuntasarn, R.; Hormdee, D.; Punrattanasin, P. Bearing capacity of shallow foundation on collapsible Khon Kaen loess. Int. J. GEOMATE 2021, 20, 159–167. [Google Scholar] [CrossRef] [Scilit]
- Garakani, A.A.; Haeri, S.M.; Khosravi, A.; Habibagahi, G. Hydro-mechanical behavior of undisturbed collapsible loessial soils under different stress state conditions. Eng. Geol. 2015, 195, 28–41. [Google Scholar] [CrossRef] [Scilit]
- Xie, W.L.; Li, P.; Vanapalli, S.K.; Wang, J.D. Prediction of the wetting-induced collapse behaviour using the soil-water characteristic curve. J. Asian Earth Sci. 2018, 151, 259–268. [Google Scholar] [CrossRef] [Scilit]
- Li, C.; Chen, Y.; Xiang, K.; Dai, G.; Gong, W.; Yang, S.; Satyanaga, A.; Chua, Y.S.; Gao, P.; Zhai, Q. Estimation of the wetting induced settlement of loess soils from the wetting soil-water characteristic curve. Sci. Rep. 2024, 14, 31533. [Google Scholar] [CrossRef] [Scilit] [PubMed]
- Shao, X.; Zhang, H.; Tan, Y. Collapse behavior and microstructural alteration of remolded loess under graded wetting tests. Eng. Geol. 2018, 233, 11–22. [Google Scholar] [CrossRef] [Scilit]
- Xu, L.; Coop, M.R. Influence of structure on the behavior of a saturated clayey loess. Can. Geotech. J. 2016, 53, 1026–1037. [Google Scholar] [CrossRef] [Scilit]
- Xu, L.; Coop, M.R.; Zhang, M.; Wang, G. The mechanics of a saturated silty loess and implications for landslides. Eng. Geol. 2018, 236, 29–42. [Google Scholar] [CrossRef] [Scilit]
- Li, X.A.; Li, L.; Song, Y.; Hong, B.; Wang, L.; Sun, J. Characterization of the mechanisms underlying loess collapsibility for land-creation project in Shaanxi Province, China—A study from a micro perspective. Eng. Geol. 2019, 249, 77–88. [Google Scholar] [CrossRef] [Scilit]
- Zhang, W.; Sun, Y.; Chen, W.; Song, Y.; Zhang, J. Collapsibility, composition, and microfabric of the coastal zone loess around the Bohai Sea, China. Eng. Geol. 2019, 257, 105142. [Google Scholar] [CrossRef] [Scilit]
- Sadeghi, H.; Kiani, M.; Sadeghi, M.; Jafarzadeh, F. Geotechnical characterization and collapsibility of a natural dispersive loess. Eng. Geol. 2019, 250, 89–100. [Google Scholar] [CrossRef] [Scilit]
- Li, P.; Xie, W.; Pak, R.Y.S.; Vanapalli, S.K. Microstructural evolution of loess soils from the Loess Plateau of China. Catena 2019, 173, 276–288. [Google Scholar] [CrossRef] [Scilit]
- Yu, B.; Fan, W.; Fan, J.H.; Dijkstra, T.A.; Wei, Y.N.; Wei, T.T. X-ray micro-computed tomography (μ-CT) for 3D characterization of particle kinematics representing water-induced loess micro-fabric collapse. Eng. Geol. 2020, 279, 105895. [Google Scholar] [CrossRef] [Scilit]
- Wang, L.; Shao, S.; She, F. A new method for evaluating loess collapsibility and its application. Eng. Geol. 2020, 264, 105376. [Google Scholar] [CrossRef] [Scilit]
- Liu, Z.; Lu, Q.; Qiao, J.; Fan, W. In situ water immersion research on the formation mechanism of collapsible earth fissures. Eng. Geol. 2021, 280, 105936. [Google Scholar] [CrossRef] [Scilit]
- An, P.; Zhang, A.; Xing, Y.; Zhang, B.; Ni, W.; Ren, W. Experimental study on settling characteristics of thick self-weight collapsible loess in Xinjiang Ili region in China using field immersion test. Soils Found. 2018, 58, 1476–1491. [Google Scholar] [CrossRef] [Scilit]
- Zhang, L.; Hu, Z.; Li, H.; She, H.; Wang, X. Impact of water delivery pipeline leakage on collapsible loess foundations and treatment methods. Case Stud. Constr. Mater. 2023, 19, e02341. [Google Scholar] [CrossRef] [Scilit]
- Zhang, L.; Hu, Z.; Li, H.; She, H.; Zhang, Y.; Wang, X. Prediction model of loess immersion settlement based on improved K-G model. Bull. Eng. Geol. Environ. 2024, 83, 58. [Google Scholar] [CrossRef] [Scilit]
- Francisca, F.M.; Giomi, I.; Rocca, R.J. Inverse analysis of shallow foundation settlements on collapsible loess: Understanding the impact of varied soil mechanical properties during wetting. Comput. Geotech. 2024, 167, 106090. [Google Scholar] [CrossRef] [Scilit]
- Phoon, K.K.; Kulhawy, F.H. Characterization of geotechnical variability. Can. Geotech. J. 1999, 36, 612–624. [Google Scholar] [CrossRef]
- Baecher, G.B.; Christian, J.T. Reliability and Statistics in Geotechnical Engineering; Wiley: Chichester, UK, 2003. [Google Scholar]
- Fenton, G.A.; Griffiths, D.V. Risk Assessment in Geotechnical Engineering; Wiley: Hoboken, NJ, USA, 2008. [Google Scholar] [CrossRef] [Scilit]
- Phoon, K.K.; Kulhawy, F.H. Evaluation of geotechnical property variability. Can. Geotech. J. 1999, 36, 625–639. [Google Scholar] [CrossRef]
- Wang, Y.; Cao, Z. Expanded reliability-based design of piles in spatially variable soil using efficient Monte Carlo simulations. Soils Found. 2013, 53, 820–834. [Google Scholar] [CrossRef] [Scilit]
- Simões, J.T.; Neves, L.C.; Antão, A.N.; Guerra, N.M.C. Reliability assessment of shallow foundations on undrained soils considering soil spatial variability. Comput. Geotech. 2020, 119, 103369. [Google Scholar] [CrossRef] [Scilit]
- Pieczyńska-Kozłowska, J.; Vessia, G. Spatially variable soils affecting geotechnical strip foundation design. J. Rock Mech. Geotech. Eng. 2022, 14, 886–895. [Google Scholar] [CrossRef] [Scilit]
- Liu, W.S.; Cheung, S.H. Decoupled reliability-based geotechnical design of deep excavations of soil with spatial variability. Appl. Math. Model. 2020, 85, 46–59. [Google Scholar] [CrossRef] [Scilit]
- Juang, C.H.; Dijkstra, T.; Wasowski, J.; Meng, X. Loess geohazards research in China: Advances and challenges for mega engineering projects. Eng. Geol. 2019, 251, 1–10. [Google Scholar] [CrossRef] [Scilit]
- Zhakapbayeva, G.A. Improvement of Design Methods for Irrigation-System Structures on Collapsible Soils Based on Joint Limit Deformations. Ph.D. Thesis, Moscow State University of Environmental Engineering, Moscow, Russia, 2001. (In Russian) [Google Scholar]
- ASTM D5333-03; Standard Test Method for Measurement of Collapse Potential of Soils (Withdrawn 2012). ASTM International: West Conshohocken, PA, USA, 2003. [CrossRef] [Scilit]
- ISO 14688-1; Geotechnical Investigation and Testing—Identification and Classification of Soil—Part 1. ISO: Geneva, Switzerland, 2017.
- EN 1997-1; Eurocode 7: Geotechnical Design—Part 1: General Rules. European Committee for Standardization: Brussels, Belgium, 2004.

Disclaimer/Publisher’s Note: The statements, opinions and data contained in all publications are solely those of the individual author(s) and contributor(s) and not of MDPI and/or the editor(s). MDPI and/or the editor(s) disclaim responsibility for any injury to people or property resulting from any ideas, methods, instructions or products referred to in the content. |
© 2026 by the authors. Licensee MDPI, Basel, Switzerland. This article is an open access article distributed under the terms and conditions of the Creative Commons Attribution (CC BY) license.