Article

Degradation of Mechanical Properties and Micro-Scale Damage Mechanisms of Mudstone-Type Soft Rock Under Hydro-Mechanical Coupling: A Case Study of the Baoshishan Tunnel, Western Yunnan


1
Baoshan Longying Expressway Co., Ltd., Baoshan 678000, China
2
Faculty of Civil Engineering and Mechanics, Kunming University of Science and Technology, Kunming 650500, China
3
Intelligent Infrastructure Operation and Maintenance Technology Innovation Team of Yunnan Provincial Department of Education, Kunming University of Science and Technology, Kunming 650500, China
*
Author to whom correspondence should be addressed.
Geotechnics 2026, 6(4), 106; https://doi.org/10.3390/geotechnics6040106
Submission received: 7 August 2026 / Revised: 12 September 2026 / Accepted: 16 September 2026 / Published: 10 October 2026

Abstract

Hydro-mechanical coupling governs the stability of tunnel surrounding rock in soft-rock strata. Mudstone-type soft rocks exhibit abrupt strength loss and time-dependent large deformation under groundwater infiltration, posing severe threats to construction safety and long-term service performance. Most existing studies focus on oven-dry and fully saturated end-members, leaving continuous mechanical data across the unsaturated-saturated spectrum scarce, and the quantitative correlation between macroscopic mechanical degradation and microstructural damage remains poorly constrained. This study investigates mudstone intervals from the Baoshishan Tunnel in western Yunnan, where frequent groundwater-related support failures have been recorded. A series of laboratory tests, including uniaxial compression, triaxial compression, and triaxial creep tests, are performed on specimens prepared at six saturation levels ranging from oven-dry to fully saturated. Hydraulic property tests and microstructural analyses (SEM, MIP, XRD) are conducted complementarily to characterize water sensitivity and track pore-structure evolution. The derived degradation relationships are validated against 20 valid rounds of advanced geological prediction (AGP) records. Results show that full saturation reduces uniaxial compressive strength by 62–71%, and cohesion degrades far more significantly than the internal friction angle. The steady-state creep rate increases nonlinearly with rising saturation, while long-term strength follows an exponential decay trend. Hydration swelling of clay minerals and subsequent formation of a connected pore network are identified as the dominant micro-mechanisms driving macroscopic degradation. On this basis, a full-process degradation model, macro-micro damage correlation equations, and a composite water sensitivity index (WSI) are established. The findings provide a quantitative basis for surrounding rock classification revision, support timing optimization, and groundwater control in the Baoshishan Tunnel and similar soft-rock tunnels.

1. Introduction

Groundwater-induced strength loss and uncontrolled deformation of surrounding rock remain the principal constraints on highway tunneling in mountainous soft-rock strata [1]. Western Yunnan is characterized by intense tectonic activity and abundant rainfall, and mudstone and shale are widely distributed there. Hydro-mechanical coupling in this region has triggered numerous incidents of large surrounding-rock deformation, initial-support cracking, and collapse [2]. The Baoshishan Tunnel, a control project along the Laoying-Banqiao realignment of the Dali–Baoshan Expressway, traverses the southwestern Yunnan seismic belt. The portal sections are dominated by strongly weathered sandstone, shale, black mudstone, and carbonaceous mudstone, in which frequent groundwater activity has repeatedly caused excessive deformation and failure of the support structure during construction. Water-induced physical deterioration of the mudstone-type rock mass has been identified as the root cause [3,4]. Under water-rich conditions, the clay minerals in mudstone and carbonaceous shale soften on wetting, so that the mechanical parameters of the rock mass decay continuously. Superimposed on the regional tectonic stress field, this process progressively destabilizes the support system [5].
Previous studies have approached water-induced degradation of soft rock from three complementary angles. With respect to short-term mechanical response, systematic testing of swelling mudstone at varying water contents [6] and of red-bed soft rock [7] has produced empirical relationships and constitutive models for strength, elastic modulus, and cohesion. These works converge in reporting that cohesion degrades markedly, whereas the internal friction angle is comparatively insensitive to water content [6]. The degradation path of mudstone has been quantified by unifying swelling deformation and softening effects [8]. Moisture-absorption softening has been attributed to a dual mechanism of hydro-erosion combined with wedge cracking and has been cast into a statistical damage constitutive model [9]. Coupled stress and wetting-drying cycling has been shown to cause pronounced deterioration of compressive strength and deformation parameters [10]. With respect to time-dependent behavior, creep tests at several water contents and confining pressures have delineated long-term strength attenuation and the critical stress ratios for the onset of steady-state and accelerated creep [11]. Partial immersion has been shown to drive a nonlinear divergence between the short-term and long-term mechanical response of sandstone [12]. Elevated water content weakens soft rock, increases creep deformation, and promotes time-dependent volumetric dilation [13], and conventional and creep triaxial tests on red sandstone under high confining pressure have resolved a staged mechanism of progressive cracking and sustained deformation under groundwater softening [14]. At the micro-scale, the emphasis has shifted from observation to quantification. The evolution of pore and fracture structures in silty mudstone under wetting-drying cycles and acidic conditions has been tracked and related to macroscopic strength loss [15]. The pore-size distribution of red-bed mudstone shifts from unimodal to bimodal as water content increases [16]. Quantitative field-emission SEM statistics combined with energy-dissipation theory have yielded a progressive degradation chain spanning micro, meso and macro scales [17], and an exponential degradation model has been formulated for red-bed mudstone under water-vapor cycling [18]. Hydraulic-property studies have clarified the accelerating effect of mineral inclusions on the slaking of red-bed clay rock [19] and have characterized the staged swelling of water-rich mudstone through coupled constitutive modeling of hydration swelling and load-induced damage [20].
These studies provide a solid basis for understanding hydro-mechanical degradation, yet three limitations restrict their transfer to tunnel practice. First, although some programs span the full water-content range, systematic data and quantitative degradation models for continuous moisture gradients are still scarce, particularly for the damp and seepage conditions that dominate real tunnel faces [21,22]. A further difficulty is that the relationship between macroscopic degradation and microstructural evolution has been described mainly in qualitative terms; quantitative correlations linking pore and fracture development to the loss of strength and modulus under a continuous moisture gradient are not yet mature, so macro-micro damage correlation equations are needed [4,23]. Third, most datasets originate from red-bed mudstone and sandstone [21,22]. The black mudstone and carbonaceous mudstone that prevail in the tectonically active western Yunnan region, which combine high clay-mineral content with low swelling activity, have received little attention. Mo et al. [24] and Yang et al. [25] examined time-dependent and wetting-drying degradation of carbonaceous mudstone, respectively, but the water sensitivity and time-dependent behavior of these rock types remain insufficiently constrained, which hampers the revision of surrounding-rock classification and the prevention of water hazards [24,25].
The present study addresses these gaps using mudstone-type sections of the Baoshishan Tunnel. Six graded moisture states from oven-dry to fully saturated were established. Uniaxial compression, triaxial compression, and triaxial creep tests were performed, accompanied by hydraulic-property tests and by SEM, MIP, and XRD analysis. On this basis, quantitative models linking saturation to mechanical and creep parameters were developed, macro-micro damage correlation equations and a composite water-sensitivity index were constructed, and engineering applicability was examined using data from twenty valid rounds of advanced geological prediction. The degradation relationships obtained here are intended to support dynamic revision of surrounding-rock classification, optimization of support parameters, and prevention of water hazards in comparable soft-rock tunnels in southwestern China.

2. Materials and Methods

2.1. Research Strategy and Technical Route

The study proceeds from analysis of the engineering background, through laboratory testing and model formulation, to engineering appraisal; Figure 1 summarizes the route. Twenty valid rounds of advanced geological prediction (AGP) for the Baoshishan Tunnel were first used to delineate the distribution, hydrological state, and early-warning characteristics of the mudstone-type sections, which in turn defined the sampling locations and the rationale for the moisture-state design. Representative rock samples were subjected to hydraulic-property tests (free swelling ratio, slake durability index and saturated water absorption ratio) and to mineral-composition analysis by X-ray diffraction (XRD) to assign a water-sensitivity category. Specimens were then prepared in six moisture states and tested under uniaxial compression, triaxial compression, and triaxial creep to obtain the evolution of strength, deformation, and time-dependent parameters with saturation. In parallel, SEM and MIP tests were conducted on specimens in representative states to track pore enlargement, fracture initiation, and mineral dissolution. These data were used to establish full-process degradation models and macro-micro correlation equations, to propose a composite water-sensitivity index, and to feed the outcomes back into surrounding-rock classification and support-parameter design.

2.2. Specimens and Engineering Background

The Baoshishan Tunnel is a control project along the Laoying-Banqiao realignment of the Dali–Baoshan Expressway. It traverses the southwestern Yunnan seismic belt, and the shallow-buried portal sections expose the Dingjiazhai Formation. Advanced geological prediction was conducted continuously during construction. Twenty valid AGP rounds recorded at the portal between March 2023 and September 2024 were collected. They cover the left tunnel from ZK6 + 598 to ZK6 + 788 (Rounds 001 to 009, nine rounds) and the right tunnel from K6 + 650 to K6 + 855 (Rounds 001 to 010, of which Round 008 was excluded because of equipment calibration, leaving nine valid rounds). One deep-buried round was added in each tube, namely left-tunnel Round 046 (ZK7 + 646 to ZK7 + 676) and right-tunnel Round 044 (K7 + 645 to K7 + 675), giving twenty rounds in total.
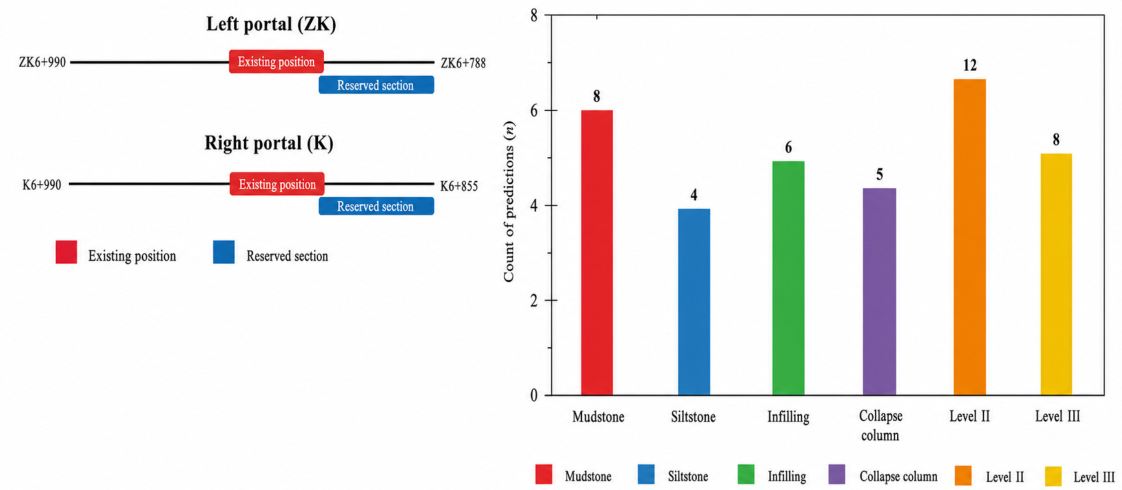
Statistical analysis of the twenty rounds (Figure 2) identified eight mudstone-type rounds: left-tunnel Rounds 006 (sandstone and mudstone), 007 (sandstone and carbonaceous mudstone) and 009 (carbonaceous mudstone), and right-tunnel Rounds 005 (shale), 006, 007, 009 and 010 (black mudstone and shale). The lithologies are dominated by shale, black mudstone with shale, carbonaceous mudstone, and carbonaceous mudstone with limestone. Hydrological states at the face comprised inflow-type discharge in four rounds (right-tunnel Rounds 001 to 003 and left-tunnel Round 009), seepage in six rounds, dampness in five rounds, dry conditions in four rounds, and an unspecified state in one round. Early-warning levels comprised Grade II in twelve rounds and Grade III in eight rounds. Superposition of the mudstone-type sections on the water-rich segments reveals a strong spatial correspondence: left-tunnel Round 009 (carbonaceous mudstone) exhibited inflow-type discharge, and right-tunnel Rounds 006 to 010 (black mudstone and shale) were all accompanied by seepage or dampness together with weak interlayers. Rock-mass fracturing and poor integrity were recorded in all twenty rounds, and weak interlayers and muddy soft-rock interlayers were identified as the controlling adverse geological factors in most rounds. Grade V2 was predicted in twelve rounds, Grade V1 in five rounds, and Grade IV3 in two rounds, while the remaining round was not assigned a class because of incomplete records. The two deep-buried rounds recorded in 2024 were predicted as Grade IV3, one class below the design assumption, which indicates a deviation of the actual rock-mass quality from the design premise. All rounds employed an LTD-2600 ground-penetrating radar with a 100 MHz antenna, and water anomalies were interpreted from the continuity, frequency, and amplitude of reflectors. The interpreted water-rich segments agreed well with the discharge subsequently recorded during excavation, which supports the use of the AGP statistics as a basis for classifying the moisture state of the surrounding rock.
Test specimens were extracted from fresh rock blocks exposed during excavation of the mudstone-type sections described above, specifically from the black mudstone and carbonaceous mudstone between K6 + 750 and K6 + 855 in the right tunnel and between ZK6 + 696 and ZK6 + 788 in the left tunnel; the sampling locations correspond to the early-warning segments shown in Figure 2. The blocks were sealed and transported to the laboratory, where standard cylindrical specimens (50 mm in diameter and 100 mm in height) were prepared in accordance with the Chinese national standard for test methods of engineering rock masses (GB/T 50266-2013). All cylindrical specimens were cored perpendicular to the bedding planes, so that axial loading was applied normal to the lamination, consistent with the radial stress state of tunnel surrounding rock. Specimens with anomalous bedding dip angles or visible macroscopic fractures were discarded to ensure lithological homogeneity. Supplementary anisotropy verification tests showed a strength anisotropy ratio (parallel bedding/perpendicular bedding) of 0.78–0.82, indicating moderate anisotropy in these mudstones. The specimens for each test group were taken from adjacent positions to minimize lithological variability.

2.3. Testing Program

Six moisture states from oven-dry to fully saturated were designed to cover the conditions typically encountered in tunnel surrounding rock, namely dry, damp, seepage and inflow-immersion conditions [22]. Specimens in each state were subjected to uniaxial compression, triaxial compression, and triaxial creep tests; the testing matrix is given in Table 1. The dry state was obtained by oven-drying at 105 °C to constant mass; the intermediate states were prepared by controlling the immersion time and were calibrated by gravimetric measurement of water content; and the fully saturated state was obtained by vacuum saturation [26]. For each specimen, the dry mass was established prior to moisture conditioning: specimens were oven-dried at 105 °C to constant mass, cooled in a desiccator under controlled humidity conditions, and weighed to determine the initial dry mass (md). Specimens designated for the dry state (S1) were loaded immediately following drying. Those assigned to intermediate saturation states underwent immersion conditioning for precisely controlled durations; specimens targeted for full saturation were subjected to vacuum saturation [26]. Immediately prior to mechanical testing, each conditioned specimen was carefully surface-dried using a lint-free cloth and reweighed to obtain its wet mass (mw), thereby preserving the intended moisture condition up to the onset of loading. Gravimetric water content was computed per specimen as w = (mw − md)/md. Following mechanical testing, the tested material from each specimen was fully recovered and re-dried at 105 °C to constant mass; the recovered dry mass deviated from the initial dry mass by ≤0.5% across all specimens, confirming the reliability and consistency of the pre-test dry mass determination. The specific gravity of the rock material, determined via pycnometer testing, is Gs = 2.71. The void ratio (e) of each specimen was calculated individually using its validated dry mass and high-precision geometric measurements (diameter and height, measured to ±0.01 mm). Specimen-specific degree of saturation (Sr) was then derived as Sr = w·Gs/e, where w is expressed as a dimensionless fraction, and e is the corresponding void ratio. Sr serves exclusively as the experimental moisture-state descriptor; no normalization, scaling, or post-hoc adjustment has been applied. The Sr intervals reported in Table 1 represent the empirically observed ranges, i.e., the minimum and maximum values actually measured, for the specimens assigned to each saturation state; they are not prescriptive targets or tolerance bounds. As uniaxial compression, triaxial compression, and creep tests employed mutually exclusive specimen sets, moisture conditioning, and thus Sr assignment, were performed independently for each test series, and no Sr value was extrapolated, interpolated, or transferred between specimens. Supplementary Table S1 provides a complete, row-wise specimen-level registry for all 54 specimens, listing the specimen ID, mechanical test type, experimentally determined water content and Sr, and the corresponding mechanical response. This ensures strict one-to-one correspondence between every reported mechanical measurement and the actual moisture state of the specimen that generated it.
Uniaxial and triaxial compression tests were displacement-controlled at a rate of 0.002 mm/min. Multi-stage triaxial compression tests, however, were conducted on single specimens in accordance with the Type II test procedure (i.e., multiple failure state test) of the ISRM suggested methods, wherein confining pressures of 5, 10, 15, and 20 MPa were applied sequentially. At each confining pressure level, the deviatoric stress was raised to peak failure before the next higher confining pressure was applied. Subsequently, the cohesion and internal friction angle were derived by regression from the peak stress states of successive stages on the Mohr plane.
Triaxial creep tests were conducted using a multi-stage step-loading scheme, in which the deviatoric stress level at each stage was set as a fixed proportion of the instantaneous strength of the corresponding moisture state. The five stress levels applied were 0.30σs, 0.45σs, 0.60σs, 0.75σs, 0.85σs. This loading protocol followed the recommended procedure for determining the creep characteristics of rock proposed in the ISRM suggested methods. Previous studies have shown that the average ratio of long-term strength to instantaneous strength for deep limestone is 0.758; similar step-loading schemes have also been commonly adopted in triaxial creep tests on red-bed soft rocks. Furthermore, it has been observed that creep tends to stabilize when the applied stress percentage lies between 60% and 70%, whereas beyond this range, creep accelerates progressively until failure occurs. Each load level was maintained until the axial deformation stabilized. The criterion for deformation stabilization was defined as an axial strain rate below 1.0 × 10⁻⁴%/h, with a minimum sustained observation period of 2 h. This criterion followed the general stabilization standard commonly adopted in rock creep tests [10]. Previous studies have indicated that in multi-stage step-loading creep tests, the deformation at each stress level must stabilize before the next stress level can be applied [10]; it has also been reported that sandstone specimens reach the steady-state creep stage after 24 h [10]. The duration of each individual load level was 48 h, or until the deformation met the stabilization criterion (axial strain rate below 1.0 × 10⁻⁴%/h), followed by a sustained observation period of no less than 2 h, whichever was longer. The total duration of a complete creep test was 240 h (10 days), corresponding to 5 load levels × 48 h per level. Three replicate specimens were tested at each moisture state. The long-term strength was determined from isochronous curves [1,21].
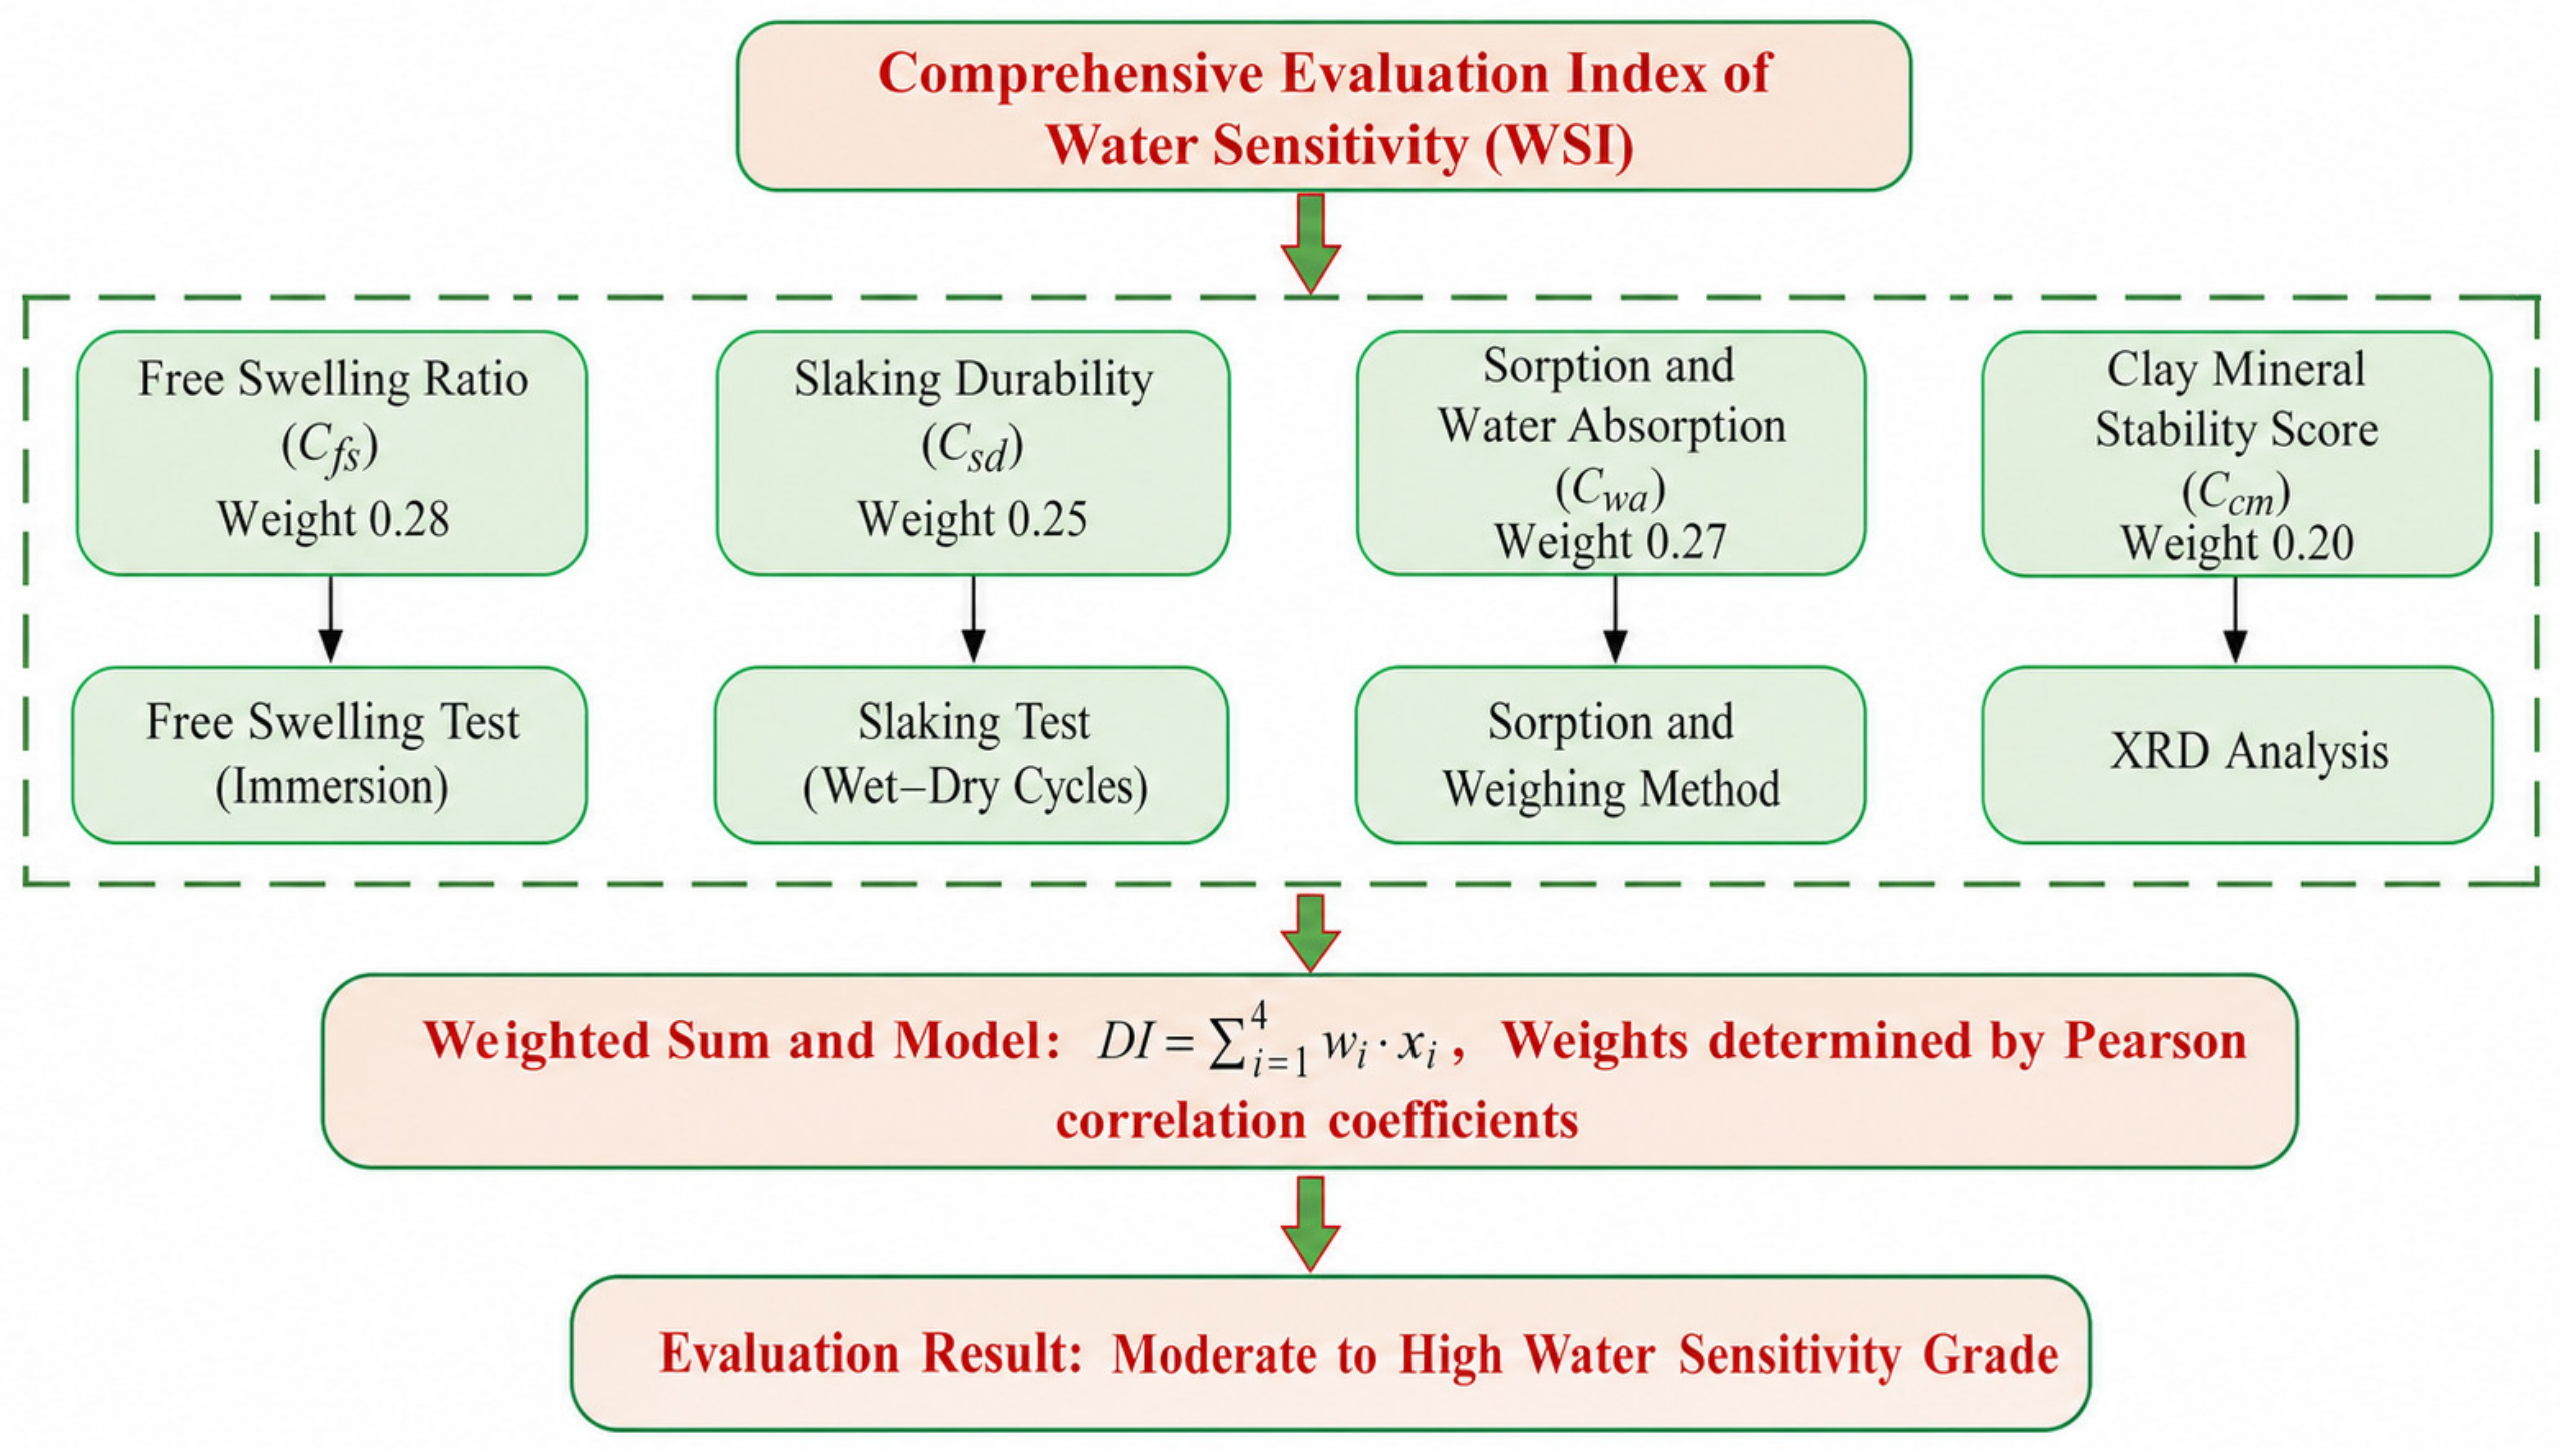
Hydraulic-property testing comprised the free swelling ratio, the slake durability index, and the saturated water absorption ratio, together with XRD mineral-composition analysis. The indicators and methods are summarized in Table 2. The three indicators characterize, respectively, the hydration-swelling potential of the clay minerals, the water resistance of the structural bonding, and the water-storage capacity of the pore system. These three quantitative indicators, together with the qualitative clay-mineral score, form the input set for the water-sensitivity evaluation in Section 3.6.

2.4. Data Analysis Methods

Parameter degradation was quantified by the softening coefficient and the degradation degree. All measurements were analyzed at the specimen level: for each mechanical property, the full set of 18 paired observations, comprising the experimentally determined degree of saturation (Sr) and the corresponding mechanical response, served as the primary fitting dataset. Model selection, parameter confidence-interval estimation, and leave-one-out cross-validation were all rigorously conducted using these specimen-level data. Group-level statistics, including means and standard deviations computed from the three valid replicate specimens per moisture state, are reported solely for descriptive purposes; they were not incorporated into any modeling or inference procedure. For each degradation dataset, exponential, linear, polynomial, logarithmic, and logistic candidate models were compared, and the final model was selected on the basis of the Akaike information criterion (AIC) and the Bayesian information criterion (BIC). Nonlinear fits are reported with 95% confidence intervals of the fitted parameters, and predictive robustness was assessed using leave-one-out cross-validation. Differences among moisture states were examined by one-way analysis of variance at the 0.05 significance level [25,27]. Creep data were processed by the step-loading isochronous-curve method to determine the long-term strength, and the nonlinear time-dependent response was characterized by regressing the steady-state creep rate against saturation [28,29]. Two macro-micro relationships were analyzed: the porosity increment against the reduction in elastic modulus, and the fracture density against the strength-degradation damage variable; an exponential correlation was fitted in each case. The composite water-sensitivity evaluation employed a weighted summation model in which the weights were normalized from the gray relational grades, or alternatively from the correlation coefficients, between each indicator and the softening coefficient [30]. All fits used the dry state as a common baseline, and records affected by loading anomalies or pronounced end effects were excluded so that the datasets for the six moisture states remained statistically comparable.

2.5. Image Analysis and Microstructural Quantification

SEM observation was conducted on specimens across all moisture states. For each state, 15 SEM images were acquired at magnifications of 200×, 500×, 1000×, 2000×, and 5000× (three images per magnification) to capture multi-scale structural features ranging from micropores to mineral grains. Pores and fractures were segmented from these images using the Otsu global automatic thresholding method, followed by manual refinement with adjustments strictly limited to within ±5% of the gray-level range to ensure segmentation accuracy. Consistent with the definition in Section 3.5, fracture density was calculated as the total trace length of fractures per unit area of the SEM image. For quantitative analysis, 10 images per moisture state were retained from the initial 15 after excluding those with poor focus or visible scratches, and each analyzed image covered a field area of 0.5 mm × 0.5 mm. The mean and standard deviation of both porosity and fracture-density measurements were then computed from these retained images. Additionally, mercury intrusion porosimetry (MIP) tests were performed following conventional procedures to determine the pore-size distribution and porosity of the specimens.

3. Theoretical Basis and Degradation Model Formulation

3.1. Softening Coefficient and Degradation Degree

The softening coefficient is a fundamental index characterizing rock water resistance, defined as the ratio of saturated uniaxial compressive strength to dry uniaxial compressive strength:
η   =   σ c , sat σ c , dry
where η is the softening coefficient (dimensionless), and σc,sat and σc,dry are the uniaxial compressive strengths in the saturated and dry states, respectively (MPa). To quantify the parameter loss at an arbitrary moisture state, the degradation degree Dp is defined as Dp = 1 − p(Sr)/p0, where p(Sr) is the value of a mechanical parameter at a degree of saturation Sr, and p0 is its dry-state value. Dp lies between 0 and 1 and is formally similar to the damage variable of damage mechanics, so it can serve as a bridge between macroscopic degradation and micro-scale damage. In this paper, however, Dp denotes only the degradation degree of a macroscopic parameter and is kept distinct from the fracture-density-based damage variable Df introduced in Section 3.5.
The use of Sr as the sole moisture-state descriptor warrants explicit justification. Sr is consistently employed in its standard physical definition, as the ratio of water-filled pore volume to total pore volume, and no further mathematical transformation, scaling, or normalization has been applied to it. Sr is directly measurable and reproducible, and its intervals correspond to the hydrological conditions recorded at the tunnel face (Table 1). Unlike immersion time or gravimetric water content, Sr accounts for differences in pore structure among specimens and permits direct comparison across moisture states and across strata. Three limitations are nevertheless acknowledged. Matric suction and pore-water pressure were not measured directly, so the role of suction invoked in the mechanistic discussion is inferred from the mechanical response rather than observed. The wetting path was unidirectional, toward the target saturation, and wetting-history effects such as those produced by wetting-drying cycling are not covered. Because the suction-Sr relationship is hysteretic and therefore not single-valued, Sr is an incomplete descriptor of the hydraulic state of an unsaturated specimen. The conclusions of this study accordingly apply to conditions in which the rock is wetted unidirectionally to a target degree of saturation, as is typical of surrounding rock exposed to sustained groundwater infiltration after excavation.

3.2. Exponential Degradation Models for Strength and Modulus

When water enters the rock, the adsorbed films on the mineral grain surfaces thicken, and the effective-stress bonding between grains is weakened. The rate of strength loss diminishes progressively as saturation increases, which produces a negative exponential decay. Equation (2) therefore describes the continuous degradation of the uniaxial compressive strength:
σ c S r   =   σ c , dry · exp − λ ⋅ S r
where λ is the strength degradation coefficient (dimensionless) and reflects the water sensitivity of the material. The exponential form is physically grounded as well as empirical: it is isomorphic with the damage variable of Equation (8b), and it shows the correct bounded end-point behavior, returning the dry-state strength as Sr approaches zero, which the linear, polynomial and logarithmic alternatives do not guarantee. Degradation of the elastic modulus follows an analogous mechanism but is governed jointly by pore compaction and mineral softening, so an isomorphic form is adopted:
E(Sr) = E0 exp(−μ⋅Sr)
where E0 is the dry-state elastic modulus (GPa), and μ is the modulus degradation coefficient (dimensionless). Equations (2) and (3) allow intermediate states to be interpolated from end-member calibrations, and they remain compatible with the exponential forms already reported for red-bed mudstone and sandstone [6,7,18].

3.3. Attenuation Models for Shear-Strength Parameters

The two shear-strength parameters do not share a common degradation path. Cohesion originates from inter-granular cementation and matric suction and is therefore highly sensitive to the intrusion of water films, whereas the internal friction angle depends mainly on grain morphology and interlocking and is affected only indirectly. A dual-parameter exponential model is accordingly adopted:
c S r   =   c 0 · exp − α c ⋅ S r   ,   φ S r = φ 0 · exp − α φ ⋅ S r
where c0 and φ0 are the dry-state cohesion (MPa) and internal friction angle (°), respectively; αc and αφ are the corresponding attenuation coefficients (dimensionless). Because cohesion is the more water-sensitive quantity, the model predicts αc > αφ, an expectation that is consistent with published results [6,10] and is tested against the present data in Section 5.3.

3.4. Three-Component Creep Empirical Equation and Time-Dependent Degradation

The creep of soft rock can be decomposed into instantaneous strain, transient (decaying) creep, and steady-state creep:
ε t   =   σ E S r + A 1 − exp − t τ + ε s · t ˙
where σ is the deviatoric stress level (MPa), A is the transient creep amplitude (dimensionless) and represents the maximum additional strain during the decaying stage, τ is the relaxation time (h) and characterizes the rate of decaying creep, and ε s ˙ is the steady-state creep rate (h−1). The instantaneous component is coupled to the moisture state through Equation (3), the decaying component reflects the adjustment of the fracture system, and the steady-state component governs the accumulation of long-term deformation. Because the steady-state rate accelerates nonlinearly as saturation increases, it is described by a composite power-exponential function:
ε s ˙ S r   =   ε S 0 ˙ · exp k ⋅ S r m
where ε s 0 ˙ is the dry-state steady-state creep rate (h−1); κ and m are fitting parameters (dimensionless), with m > 1 characterizing the amplified acceleration of the creep rate in the high-saturation range. Long-term strength decreases with increasing moisture state and is treated with exponential decay:
σ ∞ S r   =   σ ∞ 0 · exp − ξ ⋅ S r
where σ ∞ S r is the long-term strength at a degree of saturation Sr, σ ∞ 0 is the dry-state long-term strength (MPa), and ξ is the attenuation coefficient of the long-term strength (dimensionless). Equation (7) has the same form as Equation (2), but a different coefficient, and the ratio of the two equations describes how the long-term strength compares with the instantaneous strength as saturation increases, which is directly relevant to the choice of support timing.

3.5. Macro-Micro Correlation Models

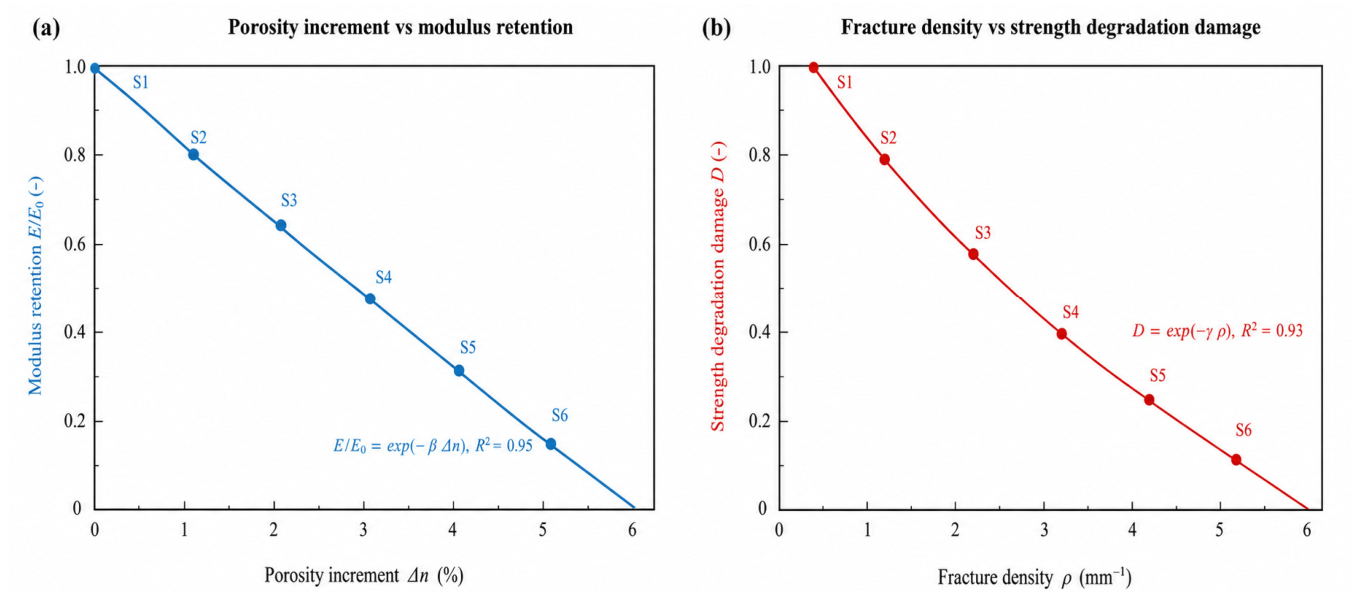
Pore enlargement under hydro-mechanical action is the direct micro-scale carrier of modulus reduction. Taking the porosity increment Δn as the micro-scale variable, an exponential correlation between modulus retention and porosity increment is written as:
E E 0 =   exp − λ ⋅ ∆ n
where β is the pore-sensitivity coefficient (dimensionless) (β replaces the symbol used previously in this equation, avoiding duplication with the strength degradation coefficient λ of Equation (2)). The control of fracture initiation on strength is expressed via a damage variable. A strength-degradation damage variable Df is defined and linked to fracture density ρc:
D f   = 1   −   exp − γ ⋅ ρ c
where γ is the fracture-sensitivity coefficient (dimensionless), and ρc is the fracture density (mm−1, defined here as the total trace length of fractures per unit area of SEM image). Df is numerically comparable with the macroscopic degradation degree Dp defined in Section 3.1, but Df emphasizes the local damage produced by the fracture network whereas Dp describes the overall loss of a macroscopic parameter. Equation (8a,b) introduce continuum damage mechanics into the analysis of hydro-mechanical degradation and allow micro-scale observations to contribute directly to the prediction of macroscopic parameters.

3.6. Comprehensive Water-Sensitivity Evaluation Index

No single hydraulic-property indicator captures the water sensitivity of soft rock, so a weighted composite index is constructed
WSI = ∑ i = 1 n w i · x i     ( i = 1 ~ 9 )
where xi is a normalized hydraulic-property indicator (free swelling ratio, slake durability index, saturated water absorption ratio, and a qualitative clay-mineral score), wi is the corresponding weight normalized from the gray relational grade or correlation coefficient between that indicator and the softening coefficient, n is the number of indicators (n = 4; the summation now runs from i = 1 to n, and the incorrect nine-term index range has been removed), and WSI is the dimensionless composite index. Because a higher slake durability index indicates better resistance to water, this indicator is reverse-normalized before weighting, so that all four normalized inputs increase monotonically with water sensitivity. A higher WSI indicates stronger water sensitivity, and the index can serve as a quantitative input to the revision of surrounding-rock classification and to the zoning of water-hazard risk.

4. Numerical Framework for Engineering-Scale Application

The two components described in this section are frameworks rather than results of the present study. They are reported here so that the parameter-transfer logic between the laboratory data and future engineering-scale analysis is explicit; no simulation output or prediction accuracy is claimed.

4.1. Seepage and Damage Coupled Modeling Framework

Laboratory tests reveal degradation at the material scale, whereas extension to the scale of the surrounding rock requires numerical analysis. A chained seepage and damage coupled framework is therefore proposed. In the first step, the unsaturated seepage equation is solved for the post-excavation pore-pressure field and the fracture-network distribution in order to obtain the spatio-temporal saturation field Sr(x,t). In the second step, the saturation history is substituted into Equation (8a,b) to update the porosity increment and fracture density of each element. In the third step, the updated micro-scale variables are used to reduce the strength, modulus, and shear parameters of each element through Equations (2)–(4), after which the stress field is recomputed. The loop among moisture migration, pore evolution, and strength degradation is thereby closed. Creep effects are embedded in the long-term calculation steps through Equations (5)–(7), which permits prediction of time-dependent deformation before the support is installed.
The framework is conceptually aligned with the coupled moisture-migration and fracture model developed by Huang et al. [1] for Tertiary water-rich soft-rock tunnels. It differs in that the degradation constitutive relationships used here are derived directly from full-saturation-process test data, so that parameter reduction does not rest on empirical assumptions. The implementation, mesh scheme, and a representative cross-section of the Baoshishan Tunnel will be reported separately.

4.2. Machine-Learning Prediction of Mechanical Degradation from Hydraulic Properties

Exponential degradation models have a clear physical meaning, but calibrating their parameters requires a complete sequence of mechanical tests, which is costly [21]. Hydraulic-property tests are, by contrast, simple and rapid, so a mapping from hydraulic parameters to degradation parameters would permit rapid preliminary assessment [22]. A machine-learning model is therefore constructed. The input features are the free swelling ratio, slake durability index, saturated water absorption ratio and encoded qualitative clay-mineral indicators; the output targets are the softening coefficient and the degradation coefficients λ, μ, αc and αφ of Equations (2)–(4) [31,32]. Hybrid Bayesian and group-based machine learning has performed well in predicting the uniaxial compressive strength of rock [33], as have models for sandstone strength under hydro-chemical corrosion [34]. An ensemble regression algorithm with Bayesian hyper-parameter optimization is therefore adopted, and cross-validation is used to control overfitting.
The present dataset comprises six moisture states, three test types, and three replicate specimens, that is, fifty-four records in total, which is too small for a credible assessment of generalization accuracy. At this stage, the model can therefore only be used for framework construction and for checking rule consistency; predictive accuracy will be reported once the project archive and further test data have been compiled and cross-validation has been performed. The feature set will be extended incrementally as samples accumulate, and construction feedback such as crown settlement and convergence rate will be incorporated through incremental learning, so that the model moves progressively from a rule-driven to a hybrid data-driven and rule-driven form.

5. Results and Discussion

5.1. Hydraulic Properties and Water Sensitivity

The hydraulic-property tests confirmed that the black mudstone and carbonaceous mudstone at the Baoshishan Tunnel portal are distinctly water-sensitive. Free swelling was visible on immersion but remained below the level typical of strongly swelling mudstone, which corroborates the mineralogical combination of high clay-mineral content with low swelling activity. Slake durability tests produced obvious spalling and fragmentation after wetting-drying cycling, which indicates poor water resistance of the cement. Saturated water absorption was high, consistent with the frequent identification of water-rich and seepage segments in the AGP rounds for these sections. XRD analysis confirmed that clay minerals are an important constituent and that the assemblage is dominated by species of low swelling activity, in agreement with the free swelling results.
The composite water-sensitivity index system constructed in Section 3.6 is illustrated in Figure 3. The free swelling ratio, slake durability index, saturated water absorption ratio, and qualitative clay-mineral score form the input layer, and the WSI value is output after normalization and weighted summation. The WSI calculated for the present specimens is approximately 0.62 on a scale from 0 to 1. According to the preset criteria (WSI below 0.4, weakly water-sensitive; 0.4 to 0.7, moderately to strongly water-sensitive; 0.7 and above, strongly water-sensitive), these rocks fall into the moderately to strongly water-sensitive category. Compared with published red-bed mudstone, the swelling indicator is lower whereas the slaking and water-absorption indicators are higher. This combination implies that degradation depends more on pore enlargement and structural disintegration than on lattice swelling, which provides an index-level basis for the mechanistic discussion in Section 5.6.

5.2. Continuous Degradation of Strength and Modulus

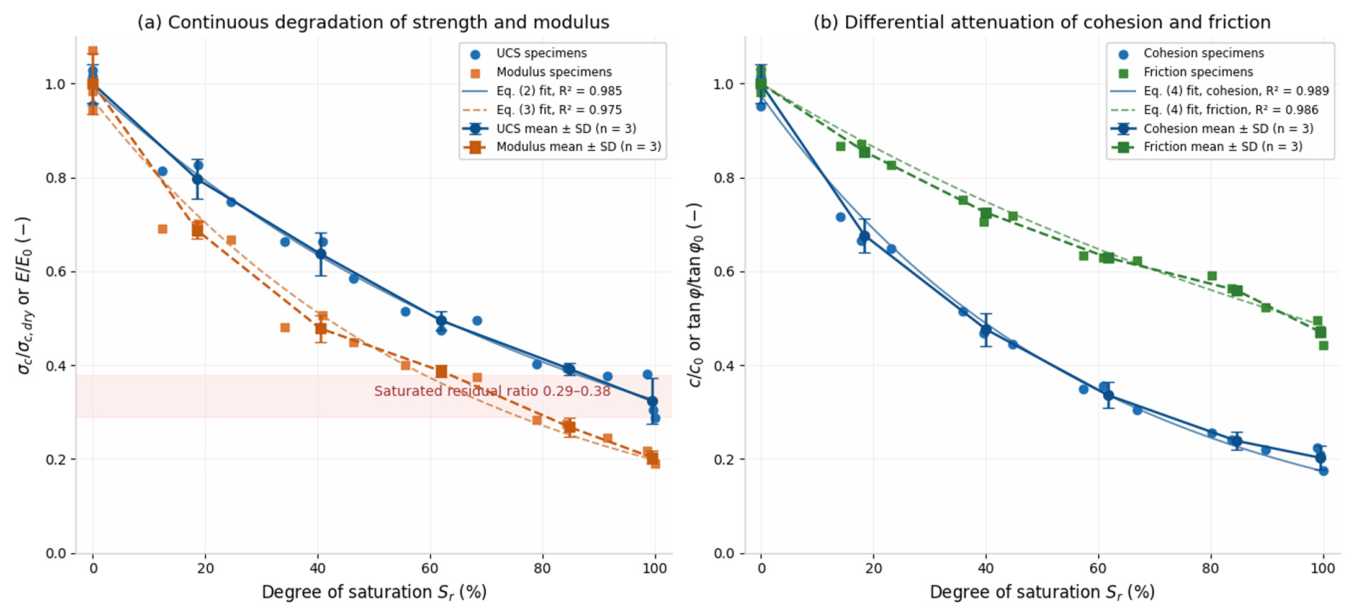
Uniaxial and triaxial compression tests showed that the strength and deformation parameters of the mudstone degraded continuously and monotonically as saturation increased; the full-process curves are shown in Figure 4. The saturated uniaxial compressive strength was 62% to 71% lower than the dry-state value, and the resulting softening coefficient is far below that of typical hard rock. The curve fitted with Equation (2) reproduces the measured data closely (R2 = 0.985) and captures both the rapid loss at low saturation and the gradual attenuation at high saturation. Equation (3) performs comparably for the elastic modulus (R2 = 0.975); modulus degradation is formally synchronous with strength degradation, but the modulus is more sensitive to pore compaction at low saturation, which produces a steeper initial segment.
The exponential forms of Equations (2) and (3) were selected after fitting linear, polynomial, logarithmic, and logistic alternatives to the same dataset and comparing them using the Akaike information criterion (AIC) and Bayesian information criterion (BIC). The exponential model yielded the lowest AIC and BIC values (AIC = −4.0, BIC = −2.2), with ΔAIC and ΔBIC differences of 17.7 and 17.7 for the linear model, 2.8 and 3.7 for the second-order polynomial model, 36.7 and 36.7 for the logarithmic model, and 2.0 and 2.9 for the logistic model, respectively, indicating that the exponential form provided the most parsimonious description of the data. Residuals from both fitted relationships exhibited no systematic trend with saturation. The 95% confidence intervals for the fitted degradation coefficients, derived from the asymptotic standard errors of the nonlinear least-squares regression applied to the full set of 18 specimen-level paired observations, were [1.03, 1.19] (point estimate = 1.11) for the strength degradation coefficient λ and [1.43, 1.74] (point estimate = 1.59) for the modulus degradation coefficient μ. Leave-one-out cross-validation across all 18 specimens yielded a root-mean-square error (RMSE) of 0.93 MPa and a mean absolute error (MAE) of 0.81 MPa (computational details provided in Section 2.4). Figure 4 displays the individual specimen-level data points alongside the fitted exponential relationships; group-level means and their associated standard deviations are overlaid solely for descriptive context and were not used in model fitting or evaluation.
The magnitude of the loss reported here falls within the ranges published for swelling mudstone [6] and red-bed soft rock [7], and the shape of the degradation curve matches the exponential trend obtained from coupled stress and wetting-drying tests [10], which supports the applicability of the exponential full-process model to mudstone of metamorphic origin. The six-level dataset further shows that no degradation plateau exists in the intermediate saturation range: any increase in the moisture state is accompanied by a loss of strength. This has a direct bearing on parameter selection for damp and seepage sections.

5.3. Differential Attenuation of Shear-Strength Parameters

Multi-stage triaxial compression tests yielded the evolution of cohesion and internal friction angle with saturation. The cohesion and internal friction angle of each moisture state were obtained by regressing the peak stress states of the individual loading stages on the Mohr plane. Both parameters attenuated as saturation increased, but the magnitudes differed markedly, cohesion attenuating far more strongly than the internal friction angle. Fitting with Equation (4) gave a cohesion attenuation coefficient αc that was distinctly larger than the attenuation coefficient of the internal friction angle αφ, which confirms the expectation set out in Section 3.3.
The difference arises from the distinct mechanisms that govern the two parameters. Cohesion depends primarily on inter-granular cementitious material and on matric suction; the intrusion of water softens the cement and eliminates the suction, so cohesion weakens rapidly. The internal friction angle is governed by grain angularity and interlocking; although lubrication by water films reduces it, the geometric skeleton of the grain assembly is essentially unchanged. This behavior is consistent with the report of Liu et al. [6] that the internal friction angle of swelling mudstone is insensitive to water content, and with the quantitative result of Zhang et al. [10] that the reduction in cohesion exceeds that in the internal friction angle. For design practice, the distinction matters: in the stability analysis of water-rich sections, cohesion should be the primary target of strength reduction, since reducing only the internal friction angle would substantially overestimate the self-supporting capacity of the surrounding rock.

5.4. Time-Dependent Creep Response

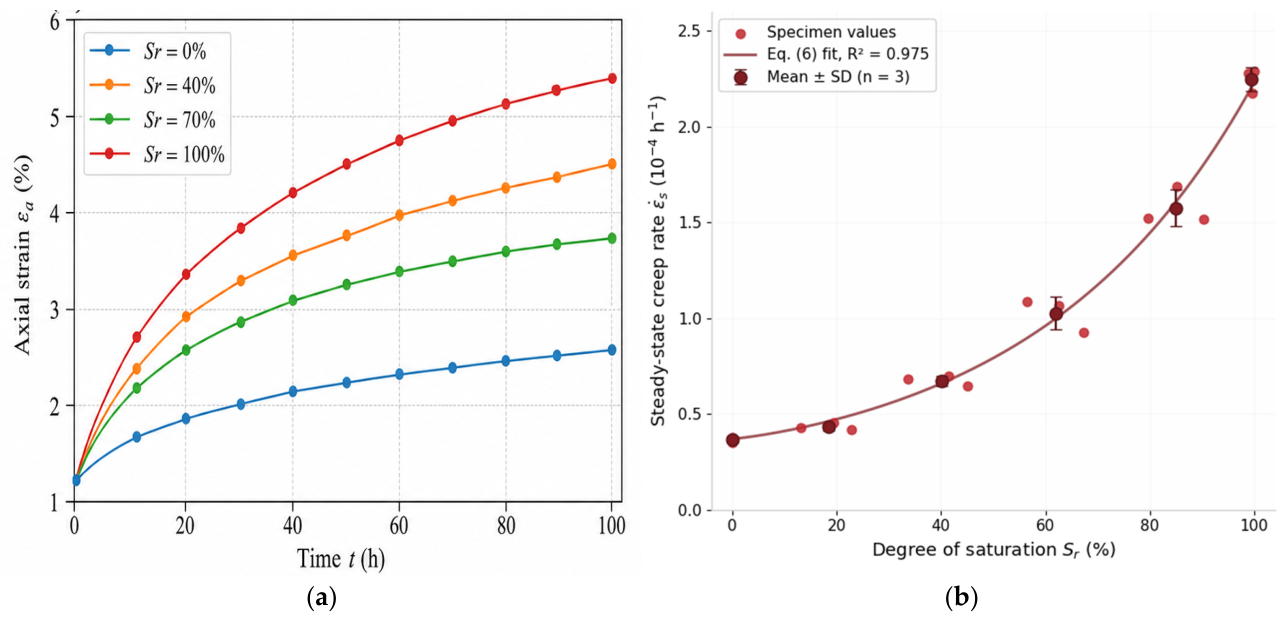
Figure 5 presents the triaxial creep results. The creep curves obtained in all six moisture states comprised instantaneous, decaying, and steady-state stages, and at high stress levels some specimens entered accelerated creep and failed. At a given stress level, a higher moisture state corresponded to larger instantaneous strain, a shorter decaying stage, and a higher steady-state creep rate. The steady-state creep rate increased nonlinearly with saturation, and Equation (6) reproduces the amplified acceleration at high saturation: once saturation exceeds the middle to upper range, the gradient of the creep rate rises steeply and the risk of time-dependent deformation in the surrounding rock increases sharply.
In Figure 5b, the abscissa corresponds to the experimentally measured Sr of each individual creep specimen, and the ordinate displays the associated steady-state creep rate, ensuring one-to-one specimen-level pairing between Sr and creep response. The long-term strength determined from the step-loading isochronous curves decreased as the moisture state rose and followed an exponential decay, which Equation (7) describes closely. This attenuation means that strength indices measured in the dry state cannot represent the long-term bearing capacity of water-rich sections, and that the support structure must carry a share of the load transferred with time. The ratio of long-term to instantaneous strength also decreased as saturation increased; in other words, the higher the moisture state, the larger the proportion of the strength reserve consumed by time-dependent effects and the shorter the interval between short-term stability and long-term instability. These observations agree with the findings of Miao et al. [11] and Zheng et al. [13] on long-term strength attenuation and creep enhancement in water-bearing soft rock. They add continuous data for the partially saturated intermediate states [12], thereby extending time-dependent analysis from end-member conditions to the moisture range actually encountered in tunnels.

5.5. Microstructural Evolution and Macro-Micro Correlation

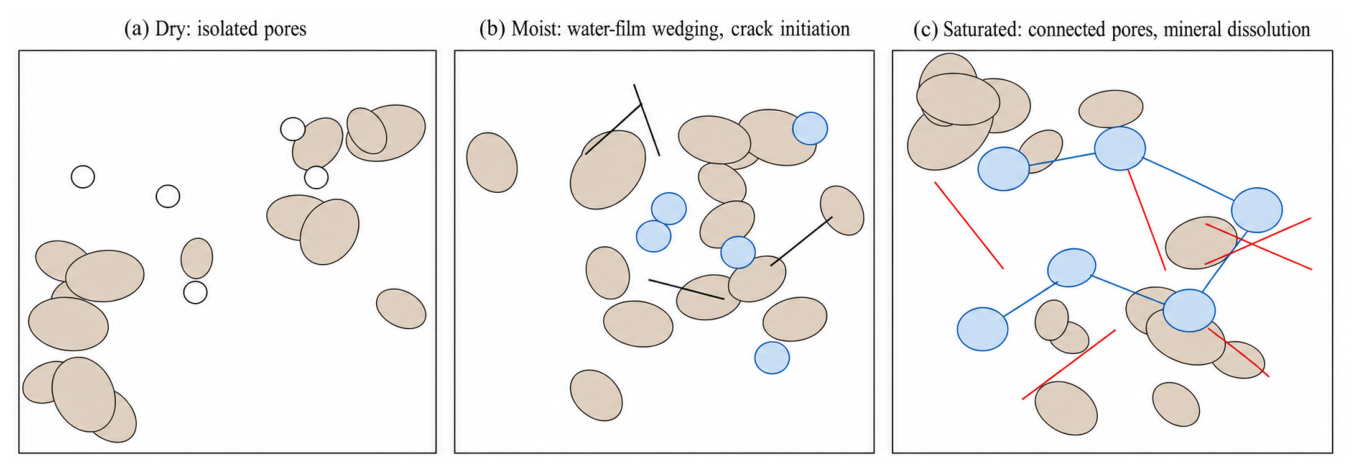
The combined SEM, MIP, and XRD analyses indicate a three-stage microstructural evolution under hydro-mechanical coupling (Figure 6).
In Stage I (low saturation): Water intrudes along primary micro-fractures and bedding planes, mineral grains at the pore margins absorb water and detach, and the peak of the MIP pore-size distribution shifts slightly toward larger pore sizes.
In Stage II (intermediate saturation): Hydration swelling of the clay minerals generates internal swelling stress, micro-fractures nucleate and propagate, porosity increases markedly, and the pore-size distribution changes from unimodal to bimodal, which matches the observation of Chen et al. [16] on red-bed mudstone.
In Stage III (high saturation to full saturation): The fractures interconnect to form a continuous pore network, dissolution intensifies the loss of inter-granular cement, and the integrity of the specimen approaches disintegration.
Figure 7 presents the quantitative macro-micro correlations. The relationship between the porosity increment and the retention of elastic modulus follows Equation (8a) with a satisfactory fit, which confirms that pore enlargement is the direct micro-scale carrier of modulus reduction. The relationship between fracture density and the strength-degradation damage variable follows Equation (8b), which quantifies the control exerted by fracture nucleation and coalescence on strength loss. Taken together, the two correlations indicate that hydration swelling of clay minerals and the formation of a connected pore network are the dominant mechanisms of macroscopic degradation: the former supplies the swelling force that drives fracture nucleation, and the latter provides the pathway for deeper water intrusion and for the propagation of dissolution, so that degradation spreads from a local to a global scale. This evidence supports the dual mechanism of hydro-erosion and wedge cracking proposed by Tang et al. [9] and the pore and fracture observations of Yu et al. [15], and it advances macro-micro analysis from qualitative comparison to a computable correlation by linking porosity increment and fracture density directly to macroscopic parameters.

5.6. Coupling of Four Degradation Mechanisms

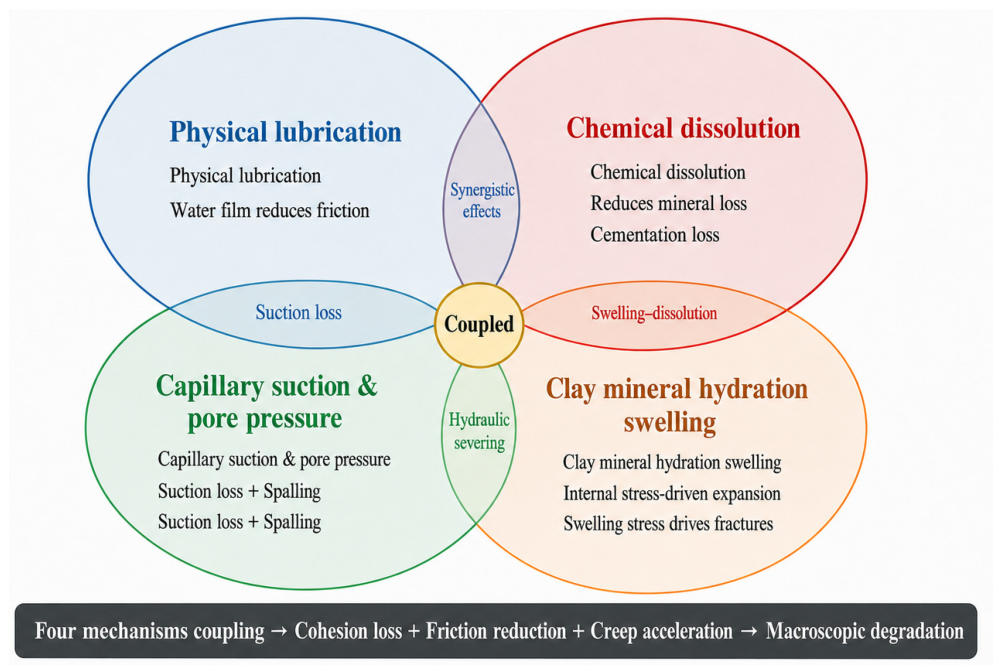
The test results and microstructural observations together indicate that degradation of the Baoshishan Tunnel mudstone is driven by four interacting mechanisms, whose coupling is summarized in Figure 8. Physical lubrication is the first: water films adsorb onto the mineral grain surfaces, reduce inter-granular friction and weaken interlocking; this mechanism is inferred from the limited attenuation of the internal friction angle [9]. Chemical dissolution acts alongside it: groundwater dissolves the cementing material and the soluble minerals, so the cemented bonding is lost; this mechanism is inferred from the pronounced attenuation of cohesion and from the reduced slake durability [9,24]. A third mechanism operates through capillary suction and pore pressure: matric suction in the unsaturated range provides an additional apparent strength, and as saturation rises, this suction is interpreted to be lost while pore-water pressure under load produces a splitting effect. This mechanism accounts for the continuous strength decline without a plateau in the intermediate moisture range and is the direct cause of rapid instability in inflow sections after excavation [35]. Underlying all three is hydration swelling of the clay minerals, directly evidenced by the measured free swelling response and by the SEM and MIP observations of swelling-driven micro-fracture nucleation and pore-network coalescence: the minerals absorb water and swell, generating internal swelling stress that drives micro-fracture nucleation and the coalescence of the pore network, and thereby providing the driving force for the growth of fracture density and for accelerated long-term creep [36,37]. Direct measurements of suction, pore-water pressure, and cement dissolution were not performed; the corresponding mechanisms are therefore presented as interpretations constrained by the observed trends, not as demonstrated processes.
Two differences from earlier work deserve comment. Liu et al. [6] reported that the internal friction angle of swelling mudstone is insensitive to water content, whereas in the present specimens the internal friction angle still attenuated visibly, although far less than cohesion; the higher content of layered minerals in carbonaceous mudstone, for which lubrication of bedding-plane friction cannot be neglected, is the most plausible explanation. In addition, hydration swelling is often treated as the primary mechanism in red-bed mudstone [20], but in the present specimens the free swelling ratio is low while the slaking and water-absorption indicators are high, so the relative weights of the four mechanisms differ and dissolution together with pore-network coalescence contributes more. These contrasts, which originate in mineral composition and diagenetic environment, indicate that water-sensitivity evaluation must be rock-specific and that experience gained from red-bed strata cannot be transferred without verification.

5.7. Comparison with Existing Studies of Water-Induced Degradation

Most published programs set dry, natural, and saturated states, and only a minority extend to four or five moisture levels [6,10], so the unsaturated intermediate range remains coarsely resolved. The present six-state design yields continuous data across the whole unsaturated-to-saturated spectrum. Three consequences follow. The applicability of the exponential model across the full saturation range is confirmed, which avoids the systematic bias introduced when end-member fits are extrapolated to intermediate states. Because no degradation plateau appears in the intermediate range, direct evidence is available for parameter selection in damp and seepage sections. The continuous sampling also supplies the statistical basis for identifying the parameters of Equations (6) and (7), that is, for the nonlinear growth of the creep rate and the exponential decay of the long-term strength. The dataset further exposes the inadequacy of conventional surrounding-rock classification based on dry-state parameters in water-rich sections, which is the starting point for the application described in Section 5.8.
Two methodological differences should also be noted. Compared with wetting-drying cycle studies [10,17], the unidirectional wetting path adopted here excludes the fatigue damage that accumulates through repeated swelling and shrinkage, so the degradation curves correspond more closely to the actual history of tunnel surrounding rock from excavation exposure to sustained groundwater infiltration. Compared with studies that use immersion duration as the independent variable [7], normalization against the degree of saturation removes the influence of differences in initial moisture among specimens and facilitates comparison across strata.
The comparison is nevertheless limited in four respects. All specimens came from a single portal area, so the degradation coefficients reported here should be regarded as site-specific rather than as generic constants for mudstone. Because the wetting path was unidirectional, the present curves are likely to underestimate the degradation of surrounding rock that experiences seasonal fluctuation of the groundwater table. Third, anisotropy was not tested systematically: the bedding-plane dip angles of the specimens were screened to a narrow range, and the loading direction relative to bedding was held fixed, so the conclusions apply strictly to that fixed orientation. Fourth, the degree of saturation was adopted as the single moisture variable, so the influences of matric suction and of wetting history, identified in Section 3.1 as components of the moisture state, are not separately resolved.

5.8. Engineering Application

The findings are applied to the mudstone sections of the Baoshishan Tunnel at three levels.
Surrounding rock classification revision: The 20 valid AGP rounds show a spatial correspondence between mudstone intervals and water-rich segments, with 12 Grade II warnings. A WSI correction term is recommended in addition to conventional BQ or Q-system classification for sections where black mudstone or carbonaceous mudstone coincide with water-rich conditions. Where WSI reaches the moderately to strongly water-sensitive category, and the tunnel face is in seepage or wetter conditions, the surrounding rock grade should be lowered by one level to avoid overestimating rock mass quality based on dry-state parameters.
Water hazard prevention: Advance probing and drainage should be intensified before excavation of mudstone sections to keep surrounding rock saturation within the low range, and cut off the water supply required for pore network coalescence. For inflow-type sections such as Round 009 in the left tunnel, advance pre-grouting to seal water-conducting channels is advisable.
Support timing optimization: The exponential decay of long-term strength and nonlinear growth of steady-state creep rate indicate that initial support in water-rich mudstone sections should be closed into a ring as early as possible, and secondary lining should not be delayed. Where necessary, a deformation allowance should be reserved based on creep prediction to prevent support cracking under time-dependent load transfer.
These measures are directionally consistent with the treatment actually adopted in exposed sections such as Round 009, and the quantitative parameters can be further refined by combining the degradation models with back-analysis of field monitoring data.

6. Conclusions

Uniaxial compression, triaxial compression, and triaxial creep tests were performed on mudstone in six moisture states, together with hydraulic-property tests and SEM, MIP, and XRD analysis, to establish full-saturation-process degradation models and macro-micro damage correlation equations. The relationships were appraised against records from twenty valid rounds of advanced geological prediction. The main conclusions are as follows:
(1) For the black mudstone and carbonaceous mudstone at the portal of the Baoshishan Tunnel, continuous degradation data were obtained across the whole unsaturated to saturated spectrum. Saturation reduced the uniaxial compressive strength by 62% to 71%; both strength and modulus followed exponential degradation models, and no degradation plateau was observed in the intermediate saturation range.
(2) The shear-strength parameters attenuated differentially, cohesion far more strongly than the internal friction angle; cohesion is therefore the primary target of strength reduction in the stability analysis of water-rich sections. The steady-state creep rate increased nonlinearly with saturation, and the long-term strength decayed exponentially, which requires support design in water-rich mudstone sections to allow for the load transferred with time.
(3) The microstructure evolved in three stages: detachment at the pore margins at low saturation, nucleation and propagation of fractures at intermediate saturation, and coalescence into a connected pore network from high saturation to full saturation. The exponential correlations linking the porosity increment to modulus retention and fracture density to the strength-degradation damage variable indicate that hydration swelling of clay minerals and the formation of a connected pore network are the dominant mechanisms of macroscopic degradation.
(4) The composite water-sensitivity index constructed from the free swelling ratio, slake durability index, saturated water absorption ratio and qualitative clay-mineral indicators places the present mudstone in the moderately to strongly water-sensitive category (WSI of approximately 0.62). Combined with the AGP statistics (eight mudstone-type rounds, four inflow-type rounds and twelve Grade II warnings), the index provides a practical route to revising surrounding-rock classification, preventing water hazards and selecting support timing.
(5) Several limitations qualify these conclusions. Specimens were taken only from the portal of the Baoshishan Tunnel, so the regional representativeness of the fitted coefficients is restricted. Because all specimens were cored at a single, fixed orientation relative to bedding, anisotropy of the degradation response remains untested, and the fitted coefficients describe only that orientation. The degree of saturation was treated as the sole moisture-state variable, so the fitted relationships may not represent mudstone subjected to different suction levels or wetting histories. The number of replicates was small, which means that the reported degradation coefficients carry appreciable uncertainty and should be updated as further data become available. The coupled seepage and damage framework and the machine-learning model remain conceptual; coupling with temperature, stress, and hydro-chemistry was not considered, and the ultra-long-term parameters rest on extrapolation from laboratory tests, so their application to service life predictions of decades should be treated with caution. Future work will address systematic comparison of strength and degradation between specimens loaded parallel and perpendicular to bedding, multi-field coupling of temperature, stress and hydro-chemistry, ultra-long-duration creep monitoring, numerical case validation and expansion of the machine-learning sample set, so that the multi-scale prediction framework can be refined.

Supplementary Materials

The following supporting information can be downloaded at: https://www.mdpi.com/article/10.3390/geotechnics6040106/s1, Table S1: Table S1a Specimen-level data of the uniaxial compression tests, Table S1b Specimen-level data of the triaxial compression tests, Table S1c Specimen-level data of the triaxial creep tests.

Author Contributions

H.L.: Conceptualization, Data curation, Formal analysis, Methodology, Visualization, Writing-original draft. Q.S.: Conceptualization, Methodology, Supervision. J.Y.: Conceptualization, Methodology, Supervision, Validation. Z.Z.: Conceptualization, Methodology, Software, Validation, Formal analysis, Investigation. S.L.: Investigation, Resources, Data Curation, Writing—Original Draft. Z.D.: Resources, Data Curation, Methodology, Supervision. W.X.: Resources, Data Curation, Writing—review & editing, Visualization, Supervision. M.W.: Conceptualization, Validation, Investigation, Resources, Visualization, Supervision, Writing—Original Draft, Writing—Review & Editing. All authors have read and agreed to the published version of the manuscript.

Funding

This research was supported by the Yunnan Provincial Science and Technology Talent and Platform Program (Grant No. 202605AK340001) and the KUST Open Access Publishing Fund.

Institutional Review Board Statement

Not applicable.

Informed Consent Statement

Not applicable.

Data Availability Statement

The original contributions presented in this study are included in the article and in its Supplementary Material (Supplementary Table S1). Further inquiries can be directed to the corresponding authors.

Conflicts of Interest

Authors Huachao Li, Qingsong Su, Jian Yao, Zhengjie Zhang, Shaohui Lv, Zhixiang Deng was employed by the company Baoshan Longying Expressway. The remaining authors declare that the research was conducted in the absence of any commercial or financial relationships that could be construed as a potential conflict of interest.

References

  1. Huang, K.; Huang, S.; Ding, X.; Zhang, Y.; Liu, D.; Dai, Z. Study on the deformation and failure mechanism of tertiary water-rich soft rock tunnels based on the moisture migration-fracture coupling model. Tunn. Undergr. Space Technol. 2025, 163, 106715. [Google Scholar] [CrossRef] [Scilit]
  2. Wu, J.; Peng, F.; Jin, Z.; Han, Z.; Cheng, G.; Jia, J. Mechanism of time-dependent deformation and support collaborative failure in water-rich red-bed soft rock tunnels. Appl. Sci. 2025, 15, 9810. [Google Scholar] [CrossRef] [Scilit]
  3. Li, J.; Zhang, J.; Chen, Q.; Ao, R.; Sun, J.; Guan, P. Numerical simulation optimization analysis and field test for large deformation control of soft rock in Tabaiyi tunnel. J. China Coal Soc. 2024, 49, 659–673. [Google Scholar]
  4. Wang, Y.; Yan, L.; Mao, S.; Chen, T. Multi-scale deterioration mechanism of mudstone under water-rock-stress relaxation coupling effect. J. Eng. Geol. 2024, 33, 845–857. [Google Scholar]
  5. Zhao, C.; Lei, M.; Jia, C.; Zheng, K.; Song, Y.; Shi, Y. Asymmetric large deformation of tunnel induced by groundwater in carbonaceous shale. Bull. Eng. Geol. Environ. 2022, 81, 260. [Google Scholar] [CrossRef] [Scilit]
  6. Liu, C.; Cheng, Y.; Jiao, Y.; Zhang, G.; Zhang, W.; Ou, G.; Tan, F. Experimental study on the effect of water on mechanical properties of swelling mudstone. Eng. Geol. 2021, 295, 106448. [Google Scholar] [CrossRef] [Scilit]
  7. Wang, T.; Yan, C. Investigating the influence of water on swelling deformation and mechanical behavior of mudstone considering water softening effect. Eng. Geol. 2023, 318, 107102. [Google Scholar] [CrossRef] [Scilit]
  8. Tang, J.; Lan, T.; Lai, Y.; Li, M.; Ma, Q. Softening mechanism and characteristics of mudstone after absorbing moisture. Appl. Clay Sci. 2024, 254, 107398. [Google Scholar] [CrossRef] [Scilit]
  9. Zhang, J.; Wang, W.; Deng, H.; Li, J.; Wan, L.; Li, J.; Liu, P.; Qian, X. Experimental study on shear characteristics of mudstone under combined action of stress-dry-wet cycles. Rock Soil Mech. 2026, 47, 1961–1972. [Google Scholar]
  10. Hu, H.; Li, J.; Fan, W.; Lin, Y.; He, J. Damage and deterioration characteristics and constitutive model of red layer soft rock under the influence of water-rock interaction. Rock Soil Mech. 2025, 46, 685–694. [Google Scholar]
  11. Miao, C.; Jiang, M.; Wang, L.; Yang, J.; Sun, X. Experimental study on long-term strength and creep characteristics of sandstone under different water content and confining pressure. Rock Mech. Rock Eng. 2024, 57, 9035–9054. [Google Scholar] [CrossRef] [Scilit]
  12. Chen, P.; Tang, S.; Liang, X.; Zhang, Y.; Tang, C. The influence of immersed water level on the short- and long-term mechanical behavior of sandstone. Int. J. Rock Mech. Min. Sci. 2021, 138, 104631. [Google Scholar] [CrossRef] [Scilit]
  13. Zheng, Z.; Zhuo, L.; Pei, J.; Xiao, M.; Liu, H.; Xie, H.; Luo, T. Creep of water-bearing soft rock and its influence on long-term rock mass stability. Eng. Geol. 2026, 362, 108505. [Google Scholar] [CrossRef] [Scilit]
  14. Zhang, S.; Meng, L.; Qu, X.; Li, T.; Yu, Z. Experimental study on the deformation and failure mechanism of red sandstone under groundwater softening. Mod. Tunn. Technol. 2025, 62, 201–211. [Google Scholar]
  15. Yu, J.; Deng, H.; He, S.; Lv, L. Effects of wet–dry cycles and acidic environments on the mechanical properties and microstructure of silty mudstone. Rock Mech. Rock Eng. 2025, 58, 7259–7285. [Google Scholar] [CrossRef] [Scilit]
  16. Chen, K.; Liu, X.; Jiang, G.; Yuan, S.; Ma, J.; Chen, Y. Effect of water content on dynamic properties of red mudstone fill material. Rock Soil Mech. 2024, 45, 3705–3716. [Google Scholar]
  17. Wang, Z.; Wei, Y.; Chen, Y.; Qiu, E.; Qu, M.; Song, J.; Wan, X.; Yan, Z. Experimental study on deterioration mechanism of mechanical properties and energy evolution of red mudstone under dry-wet cycle in Central Sichuan. J. Eng. Geol. 2025, 33, 1304–1316. [Google Scholar]
  18. Yu, T.; Jiang, G.; Rao, Q.; Zhu, D.; Chen, H.; Liu, X. Damage and deterioration characteristics of red mudstone under water vapor cycles. Rock Soil Mech. 2025, 46, 479–491. [Google Scholar]
  19. Cheng, S.; Zeng, Y.; Ye, Y.; Gao, R. Slake durability test and mineral inclusion effect of Gansu red-bed clay rock. Rock Soil Mech. 2023, 44, 1–8. [Google Scholar]
  20. Zuo, Q.; Zhou, X.; Chen, Z.; Li, Z.; Li, P.; Deng, M.; Wang, B. Macro–micro mechanisms and damage modeling of mudstone swelling under water–rock interaction. Geotech. Geol. Eng. 2025, 43, 447. [Google Scholar] [CrossRef] [Scilit]
  21. Chen, K.; Zhang, R.; Yuan, S.; Ma, J.; Wang, H. Degradation of natural red mudstone subjected to long-term relative humidity cycles. J. Rock Mech. Geotech. Eng. 2025, 17, 5800–5815. [Google Scholar] [CrossRef] [Scilit]
  22. Xie, Q.; Huang, Q.; Kang, X.; Wu, S.; Lan, H. Study on the effect of water on the shear behavior and microstructure of red mudstone. Sci. Rep. 2024, 14, 29858. [Google Scholar] [CrossRef] [Scilit] [PubMed]
  23. Ye, D.; Liu, G.; Ji, M.; Wang, F.; Zhou, J. A new approach to evaluate the interactions between the surrounding rock microstructure and water inrush for tunnel excavation. Comput. Geotech. 2023, 157, 105336. [Google Scholar] [CrossRef] [Scilit]
  24. Mo, P.; Tang, Q.; Luo, J.; Huang, H.; Yang, Q.; Chen, Y. Study on time-effect to the strength deterioration of carbonaceous mudstone under water-rock interaction. Matéria (Rio de Janeiro) 2023, 28, 3337–3344. [Google Scholar] [CrossRef] [Scilit]
  25. Yang, Y.; Zhang, T.; Liu, S.; Luo, J. Mechanical properties and deterioration mechanism of remolded carbonaceous mudstone exposed to wetting–drying cycles. Rock Mech. Rock Eng. 2022, 55, 3769–3780. [Google Scholar] [CrossRef] [Scilit]
  26. Labuz, J.; Sulem, J.; Amann, F.; Asem, P.; Braun, P.; Delage, P.; Detournay, E.; Fortin, J.; Ghabezloo, S.; Hart, D.; et al. ISRM suggested method for achieving full water saturation of rock. Rock Mech. Rock Eng. 2025, 59, 5475–5484. [Google Scholar] [CrossRef] [Scilit]
  27. Huang, K.; Dai, Z.; Meng, Y.; Yu, F.; Yao, J.; Zhang, W.; Chi, Z.; Chen, S. Mechanical behavior and fracture mechanism of red-bed mudstone under varied dry-wet cycling and prefabricated fracture planes with different loading angles. Theor. Appl. Fract. Mech. 2023, 127, 104094. [Google Scholar] [CrossRef] [Scilit]
  28. Xu, J.; Wang, M.; Luo, X.; Jiang, P.; Sun, Q.; Song, J.; Yu, B. Creep characteristics and nonlinear creep modeling of water-bearing sandy mudstone under triaxial loading conditions. Mech. Time-Depend. Mater. 2026, 30, 48. [Google Scholar] [CrossRef] [Scilit]
  29. Yu, M.; Liu, B.; Liu, K.; Sun, J.; Deng, T.; Wang, Q. Creep behavior of carbonaceous mudstone under triaxial hydraulic coupling condition and constitutive modelling. Int. J. Rock Mech. Min. Sci. 2023, 164, 105357. [Google Scholar] [CrossRef] [Scilit]
  30. Yang, H.; Li, P.; Su, S.; Chen, J. Creep evolution characteristics and deformation mechanisms of carbonaceous slate under the action of groundwater. Sci. Rep. 2025, 15, 7978. [Google Scholar] [CrossRef] [Scilit] [PubMed]
  31. Shao, Z.; Song, Y.; Zheng, J.; Shen, F.; Liu, C.; Yang, J. Damage degradation mechanism and macro-meso structural response of mudstone after water wetting. J. Mt. Sci. 2024, 21, 2825–2843. [Google Scholar] [CrossRef] [Scilit]
  32. Wu, Z.; Wu, Y.; Weng, L.; Li, M.; Wang, Z.; Chu, Z. Machine learning approach to predicting the macro-mechanical properties of rock from the meso-mechanical parameters. Comput. Geotech. 2024, 166, 105933. [Google Scholar] [CrossRef] [Scilit]
  33. Piao, S.; Huang, S.; Wei, Y.; Tan, J.; Ma, B. A novel hybrid Bayesian-group-based machine learning (HB-GML) method for predicting uniaxial compressive strength (UCS) of rock. Rock Mech. Rock Eng. 2025, 58, 5817–5843. [Google Scholar] [CrossRef] [Scilit]
  34. Xie, N.; Luo, X.; Chen, J.; Yan, S. Machine learning models for prediction of sandstone compressive strength under hydro-chemical corrosion. Rock Mech. Rock Eng. 2025, 58, 13349–13367. [Google Scholar] [CrossRef] [Scilit]
  35. Li, K.; Sun, P.; Wang, H.; Ren, J. Insight into failure mechanisms of rainfall induced mudstone landslide controlled by structural planes: From laboratory experiments. Eng. Geol. 2024, 343, 107774. [Google Scholar] [CrossRef] [Scilit]
  36. Cai, G.; Yin, F.; Liu, H.; Su, Y.; Yang, R. Creep behavior and microstructural evolution of unsaturated red-bed mudstone under coupled matric suction-stress effects. Eng. Geol. 2026, 363, 108558. [Google Scholar] [CrossRef] [Scilit]
  37. Yu, X.; Fu, H.; Zeng, L.; Zhang, G.; Zhang, H.; Liu, J. Cracking of silty mudstone subjected to wetting-drying cycles. J. Rock Mech. Geotech. Eng. 2025, 17, 4195–4210. [Google Scholar] [CrossRef] [Scilit]
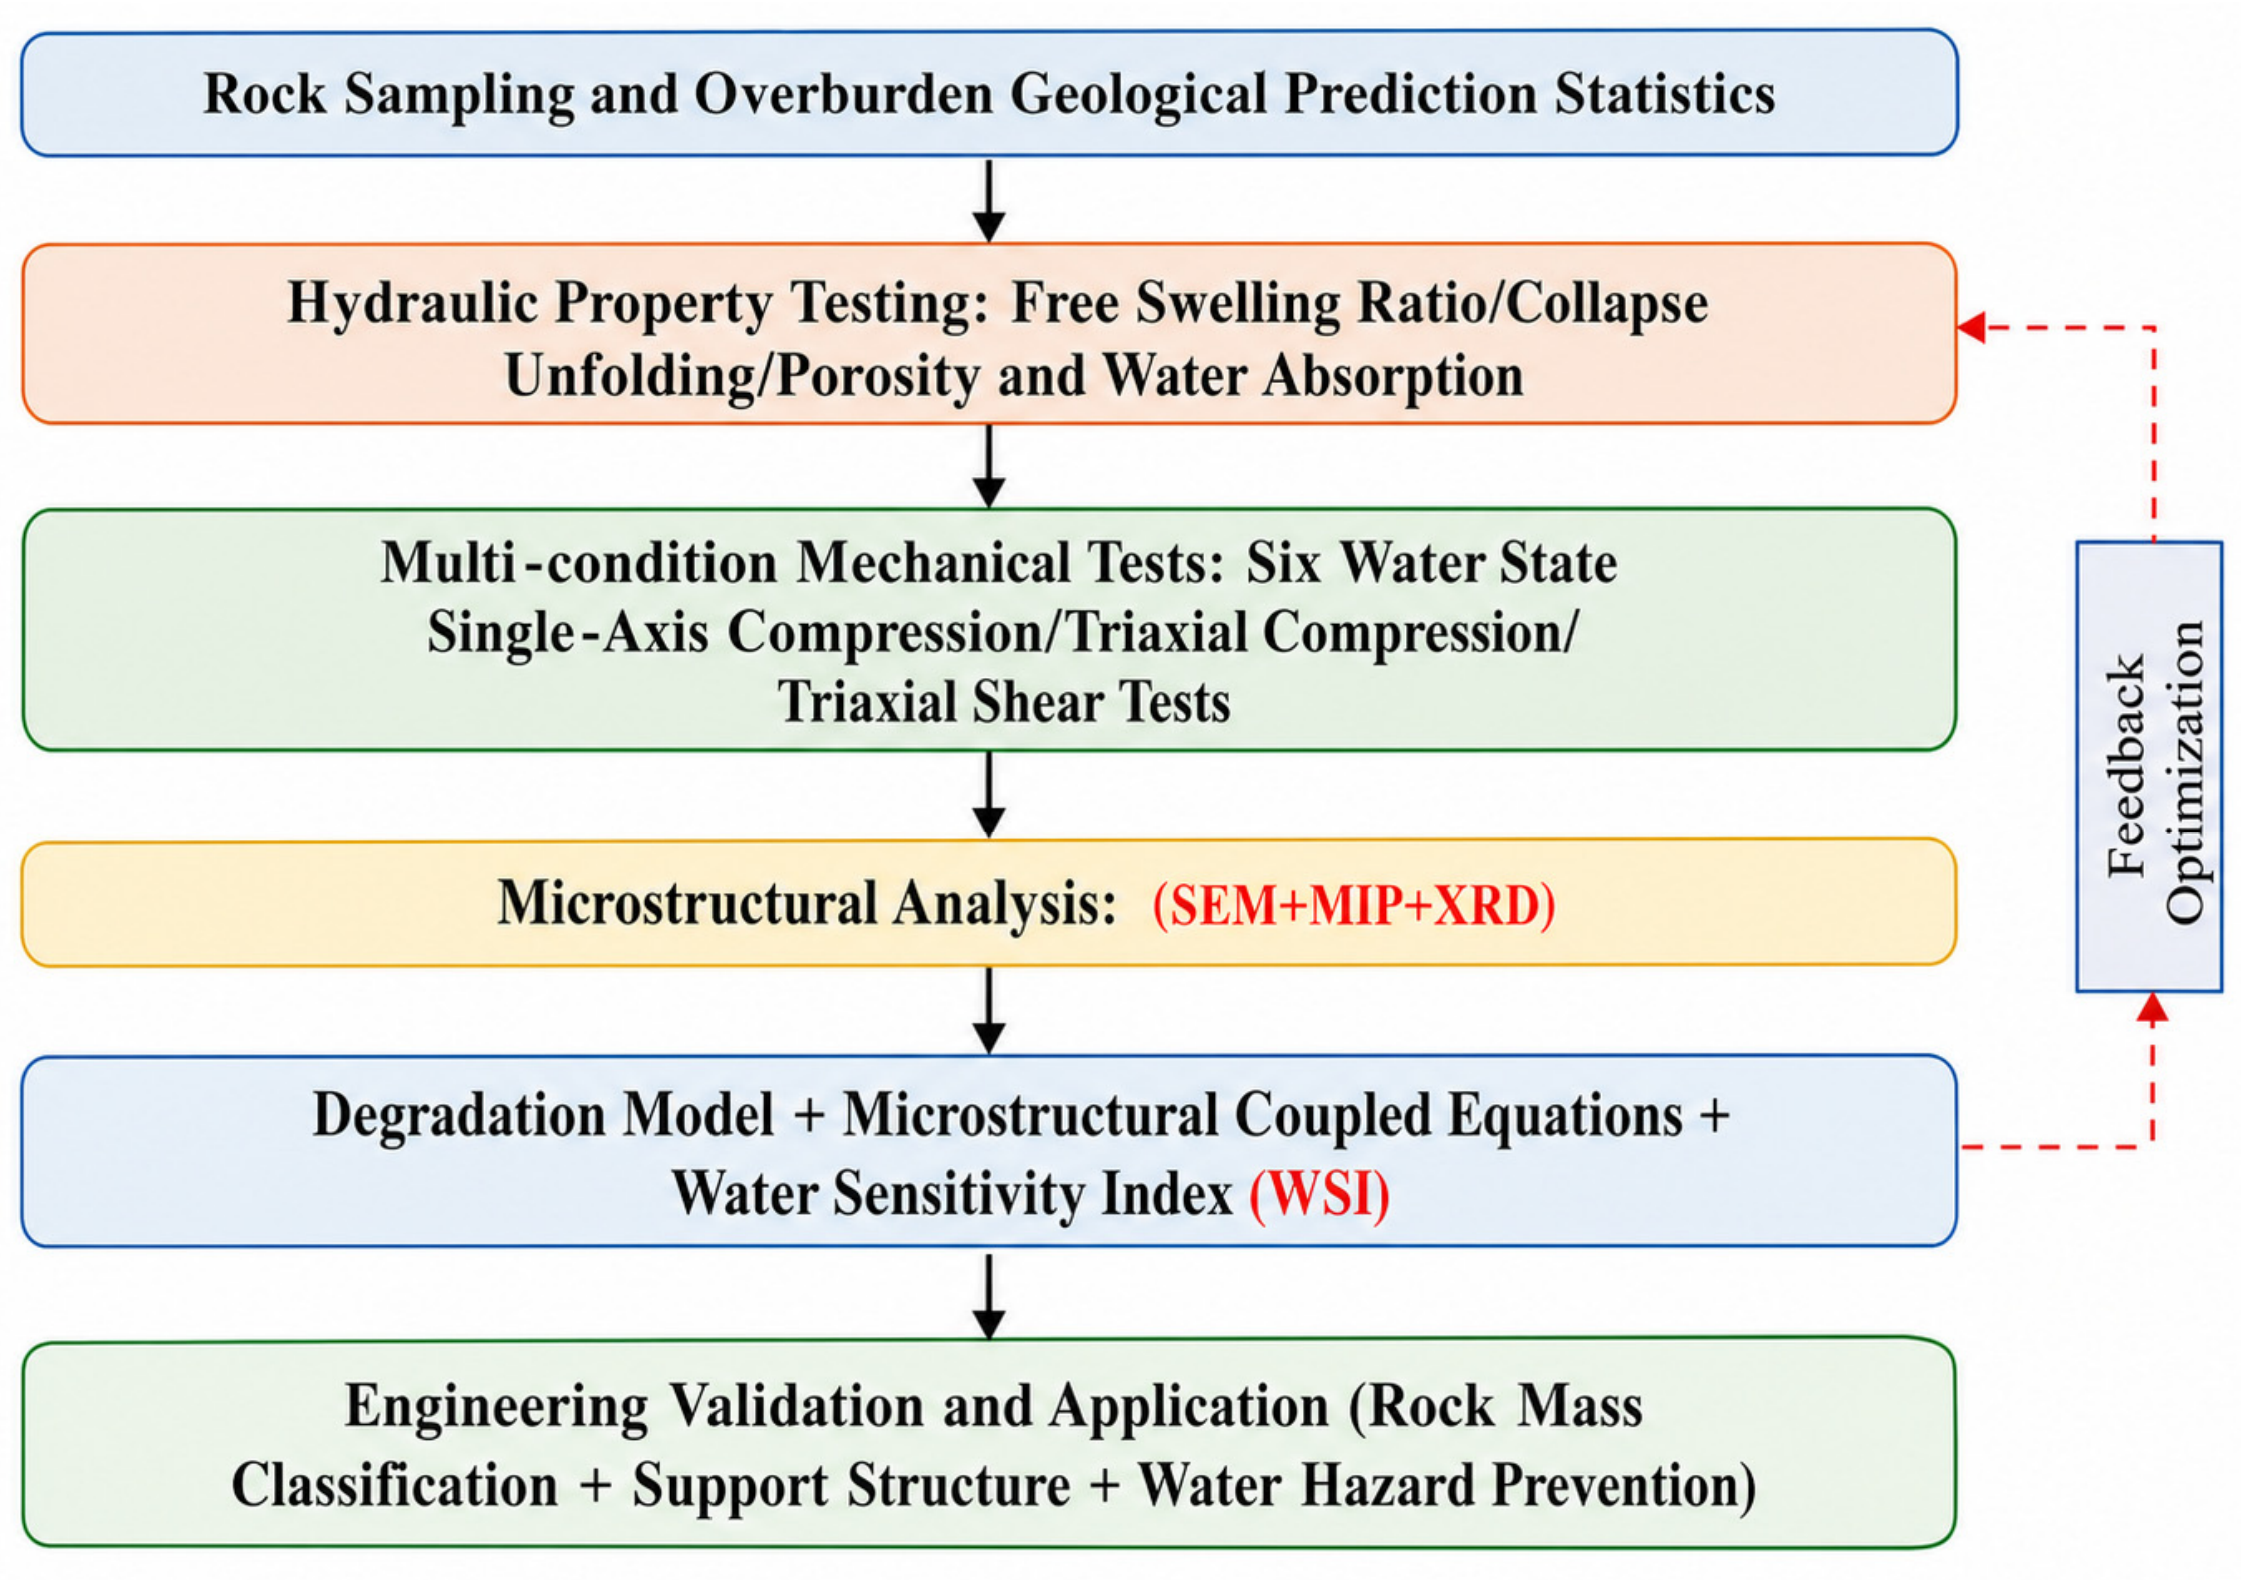
Figure 1. Research technology roadmap.
Geotechnics 06 00106 g001
Figure 2. Sampling locations and statistical chart of advanced geological prediction.
Geotechnics 06 00106 g002
Figure 3. Comprehensive evaluation index system for water sensitivity of soft rock.
Geotechnics 06 00106 g003
Figure 4. Degradation of uniaxial compressive strength, Young’s modulus, and shear strength parameters of mudstone with increasing degree of saturation. Individual specimen-level measurements are shown as discrete symbols (n = 18 per mechanical property); group means are represented by connected markers; error bars indicate ± one standard deviation across the three replicate specimens within each moisture state (n = 3); solid curves represent nonlinear fits to Equations (2)–(4) performed at the specimen level.
Geotechnics 06 00106 g004
Figure 5. Triaxial creep response of mudstone across moisture states. Individual specimen-level measurements are shown as discrete symbols (n = 18); group means are indicated by connected markers; error bars represent ± one standard deviation across the three replicate specimens within each moisture state (n = 3); the solid curve corresponds to the specimen-level nonlinear fit of Equation (6). (a) Representative creep curves for specimens tested under four distinct moisture conditions. (b) Steady-state creep rate as a function of degree of saturation.
Geotechnics 06 00106 g005
Figure 6. Three-stage evolution model of micro-meso structure of mudstone under hydro-mechanical coupling.
Geotechnics 06 00106 g006
Figure 7. Correlations of porosity increment and fracture density with macroscopic mechanical parameters.
Geotechnics 06 00106 g007
Figure 8. Coupling relationship of four mechanisms in mudstone degradation under hydro-mechanical coupling.
Geotechnics 06 00106 g008
Table 1. Mechanical testing matrix of mudstone under different moisture states.
Moisture State IDMoisture State DescriptionDegree of Saturation Sr (%) (Range of Measured Values)Corresponding Tunnel ConditionUniaxial CompressionTriaxial CompressionTriaxial Creep
S1Dry0Dry section√√√
S2Low water absorption0–30Damp section√√√
S3Medium water absorption30–50Transition from damp to seepage√√√
S4Medium-high water absorption50–75Seepage section√√√
S5High water absorption75–100Inflow-affected section√√√
S6Fully saturated100Long-term immersed section√√√
Note: √ indicates that the test was performed under the corresponding moisture condition. Results are reported as mean ± standard deviation (SD). The Sr ranges listed above summarize specimen-level measurements; the measured water content, Sr value, and mechanical response for each individual specimen are provided in Supplementary Table S1.
Table 2. Hydraulic-property indicators and test methods.
IndexPhysical SignificanceTest Method
Free swelling ratio, FsHydration-swelling potential of the clay mineralsFree swelling test on oven-dried rock powder immersed in water
Slake durability index, Id2Water resistance of structural bondingTwo-cycle slake durability test
Saturated water absorption ratio, wsatPore water storage capacityVacuum saturation and weighing method
Mineral composition (qualitative)Clay-mineral type and assemblageX-ray diffraction (XRD)
Disclaimer/Publisher’s Note: The statements, opinions and data contained in all publications are solely those of the individual author(s) and contributor(s) and not of MDPI and/or the editor(s). MDPI and/or the editor(s) disclaim responsibility for any injury to people or property resulting from any ideas, methods, instructions or products referred to in the content.