


Abstract
Desiccation cracking in expansive soils on slopes accelerates soil erosion and reduces water retention capacity, posing significant threats to agricultural sustainability. This study investigates the combined effects of organic fertilizer (OF), slow-release fertilizer (SRF), and rice straw (RS) on crack inhibition in expansive soil under wet–dry (W-D) cycles. A three-factor Box–Behnken design (BBD) was used with OF at 5–15%, SRF at 0.3–0.9 kg/m3, and RS at 0.25–0.75%, and crack development was followed through 20 W-D cycles. The quadratic response-surface model fitted to the BBD crack-ratio data was significant (R2 = 0.952, adjusted R2 = 0.865, p = 0.008), with significant linear effects of OF, SRF, and RS, whereas the two-factor interaction terms were not statistically significant as a group (p = 0.701). The lowest observed crack ratio in the BBD matrix was 1.7% at 10% OF + 0.9 kg/m3 and SRF + 0.75% RS; this is therefore reported as an observed low-response combination rather than evidence of a statistically confirmed SRF–RS interaction. An LSTM model was retained as a complementary dynamic predictor and yielded R2 = 0.927, MAE = 0.325, and RMSE = 0.478 for the evaluated dataset; however, divergence between training and validation losses indicated overfitting, so external generalizability remains to be established. The results support agricultural-waste-based amendment as a promising crack-control strategy while emphasizing the need for independent replication and field validation.
1. Introduction
Montmorillonite-rich expansive soils undergo pronounced shrink–swell deformation as water content changes [1,2], and repeated W-D cycles can progressively reorganize pore structure, promote surface cracking, and weaken soil strength. The measured crack ratio is strongly conditioned by experimental setting; important factors include soil plasticity and mineralogy, initial water content, compaction state, specimen thickness and geometry, drying temperature and relative humidity, wetting–drying amplitude, cycle number, and the image-analysis procedure. Recent international studies illustrate this sensitivity. Zhao et al. [3] showed that initial moisture content, compaction degree, specimen thickness, expansibility, and cycle number materially alter crack development; Liu et al. [4] linked cumulative W-D crack damage with changes in the soil–water characteristic curve; Wang et al. [5] likewise documented the evolution of fissures and soil–water characteristic curves under drying–wetting cycles; Zhou et al. [6] related controlled W-D conditions to crack evolution and strength deterioration; Dai et al. [7] monitored three-dimensional crack evolution using resistivity; and Shafqat et al. [8] demonstrated coupling between W-D cycling and initial compaction state in clays of different plasticity. These findings indicate that comparisons of crack metrics are meaningful only when the relevant test conditions are reported explicitly.
Conventional stabilizers such as lime and cement can reduce expansive-soil deformation, but their environmental burden has motivated interest in lower-carbon amendments and agricultural residues [9,10,11]. Organic amendments can modify water retention and pore structure, while fibrous residues can bridge incipient cracks and redistribute shrinkage-induced tensile stress. Shah et al. [12], for example, reported substantial crack reduction in expansive soil reinforced with fibers and admixtures under controlled drying conditions. For vegetation-assisted expansive-soil improvement, previous studies have documented effects of vetiver roots on cracking, strength, and mechanical behavior [13,14,15,16,17,18]. Chen et al. [14] reported favorable vetiver-root responses at an OF dosage near 5%; Fu et al. [16] showed that root/fiber reinforcement can enhance soil strength; and Xue et al. [19] identified an effective straw-content range near 0.55–0.65% in reinforced soil. Nevertheless, most studies emphasize individual amendments or static responses. The combined influence of OF, SRF, and RS on crack development, and the transition from static formulation effects to time-dependent crack accumulation during repeated W-D cycling, remain insufficiently resolved.
Accordingly, the novelty claimed here does not rest on the use of RSM alone. Instead, the study integrates three elements within one experimental framework: (1) a BBD/RSM analysis to quantify the main, interaction, and quadratic effects of OF, SRF, and RS on crack ratio; (2) repeated observations through 20 W-D cycles to characterize the accumulation and stabilization of cracking; and (3) an LSTM-based exploratory predictor to examine whether time-dependent crack evolution can be represented beyond a static response surface. This combined design allows statistically supported formulation effects to be distinguished from descriptive treatment combinations and dynamic predictive behavior.
2. Methods
2.1. Soil Samples
This research used weakly expansive soil collected from Shuxiang Road, Changsha, Hunan Province, China (112°58′28.06″ E, 28°06′31.04″ N). Following collection, the soil was air-dried, gently crushed, and passed through a 2 mm sieve before index characterization. Thus, particles larger than 2 mm were removed before the reported Atterberg limit and other index tests.
The basic index tests were performed according to the Chinese Standard for Geotechnical Testing Method (GB/T 50123-2019) [20], which was the governing laboratory standard in this study. For international comparability, the corresponding test purposes are broadly comparable with ASTM D2216-19 [21] for gravimetric water content, ASTM D698-12 [22] for standard-effort laboratory compaction, ASTM D4318-17e1 [23] for Atterberg limits, and ASTM D6913/D6913M-17 [24] for sieve-based particle-size distribution. These ASTM documents are cited as methodological counterparts; they were not additional tests performed independently of GB/T 50123-2019 [20].
Moisture Content: The water content of the air-dried soil was tested via the standard oven-drying procedure, resulting in a measured value of 4%. Specifically, the soil specimen was dried at a constant temperature of 105–110 °C until its weight reached a steady state.
Free Swell Ratio: The free swell index was tested following the standard volumetric procedure. A controlled mass of oven-dried soil, previously sieved through a 0.5 mm screen, was added to a graduated cylinder containing distilled water. The final equilibrium volume of the soil after 24 h was then measured and logged.
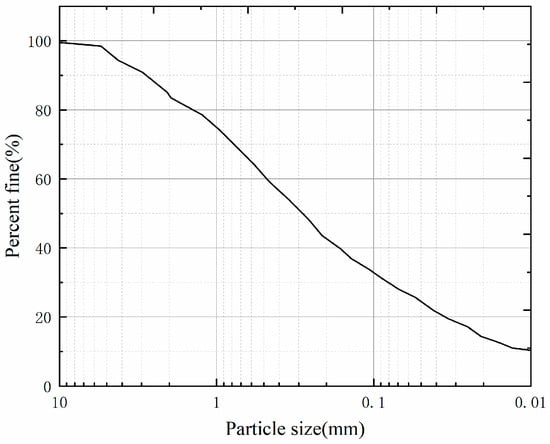
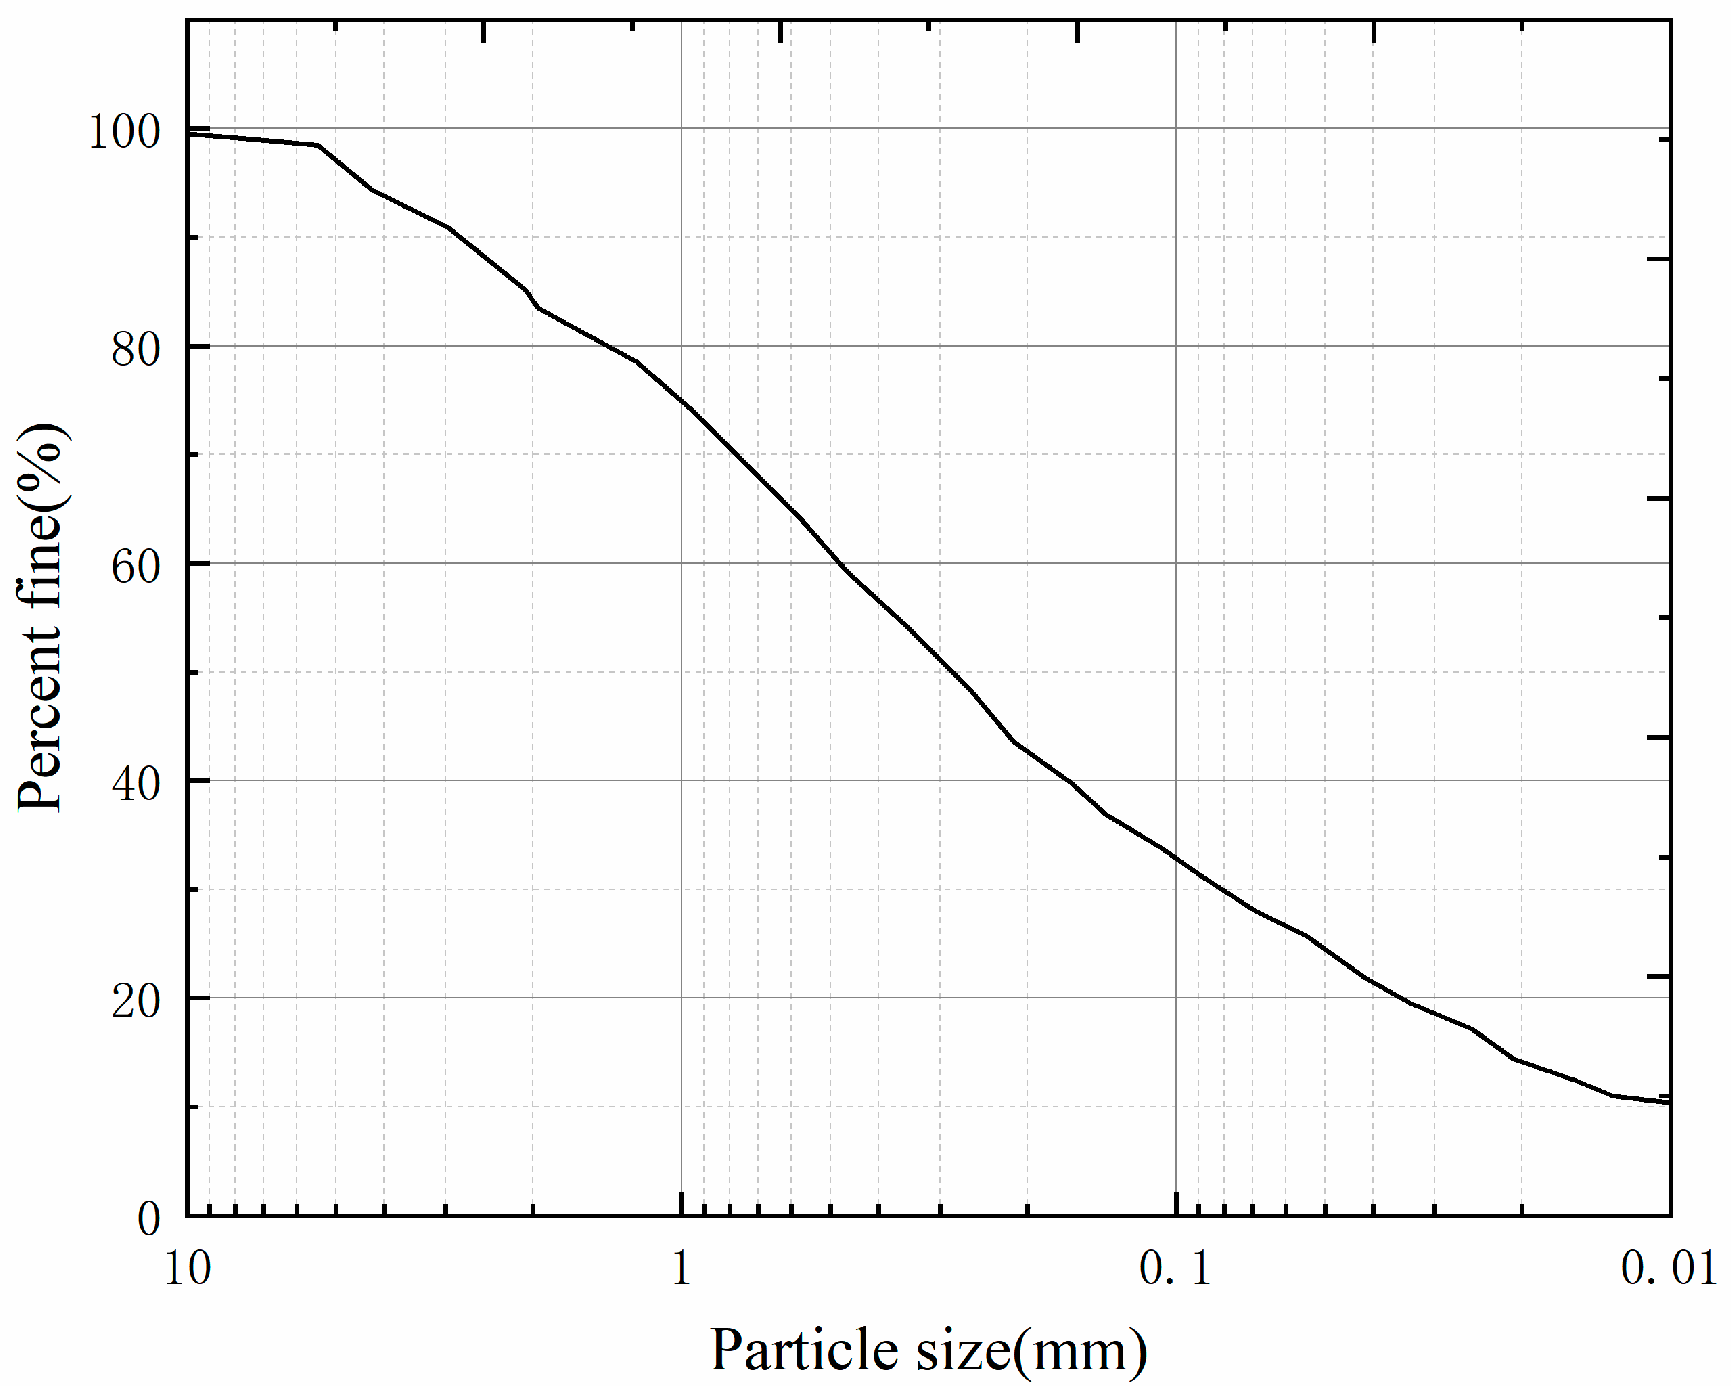
Particle Size Distribution: The gradation shown in Figure 1 was obtained from the mechanical-sieving record, and “percent fine” denotes the cumulative percentage of dry mass passing through the sieve. Because sieve analysis cannot robustly resolve the clay-size fraction, particularly particles below approximately 75 μm and especially the <2 μm fraction, the finest part of the curve is used only as a descriptive gradation trend and is not interpreted as a quantitative clay or smectite fraction. Wet-dispersion hydrometer/laser diffraction and mineralogical methods such as X-ray diffraction would be required for that purpose.
Figure 1.
Sieve-based particle-size distribution of the test soil. “Percent fine” denotes the cumulative percent of dry mass passing through a sieve; the curve is not used to quantify the <2 μm clay fraction.
Compaction Characteristics: A standard Proctor-type compaction test was used to establish a reproducible laboratory reference relationship between water content and dry density. The compaction procedure was used to standardize specimen preparation; it was not intended to simulate “induced” field compaction or to prescribe large-scale field machinery. The conditions of laboratory compaction should therefore not be interpreted as a field-scale construction requirement.
Atterberg Limits: The liquid limit (Wl) was determined using the cone-penetrometer procedure specified in GB/T 50123-2019 [20], and the plastic limit (Wp) was determined by the thread-rolling method; the plasticity index was calculated as Ip = Wl − Wp. The archived dataset available for this revision retains the reported summary values but not the individual replicate readings from the index tests.
The measured physical properties, determined according to the above standard procedures, are summarized in Table 1.
Table 1.
Basic parameters of test soil samples.
2.2. Experimental Design
A three-factor, three-level Box–Behnken design (BBD) was used to examine the effects of organic fertilizer (OF), slow-release fertilizer (SRF), and rice straw (RS) on root content and crack ratio. OF was a locally sourced horticultural fertilizer containing 74.2% organic matter (pH 6.8, 26.3% moisture content, bulk density 0.43 g·cm−3). The SRF was a resin-coated bulk-blending fertilizer with 64% nutrient release over 28 days and a reported fertilizing period of approximately 60 days. Rice straw was cut to 30 mm segments and soaked in 5% NaOH for 24 h before oven drying. Alkali treatment was selected to modify the lignocellulosic surface, remove part of the non-cellulosic surface components, increase surface roughness, and potentially improve fiber–soil contact; a 5% NaOH/24 h protocol has also been reported for paddy-straw fibers by Majid et al. [25]. The present study did not directly measure straw hydrophilicity, tensile strength, chemical composition, or cyclic fiber degradation before and after alkali treatment; therefore, these effects are discussed as literature-supported mechanisms rather than measured properties. The factor ranges (Table 2) were selected to span low, middle, and high levels relevant to the available literature and preliminary formulation design: OF = 5, 10, and 15% (bracketing the 5% level is associated with favorable vetiver response, as reported by Chen et al., [14]); RS = 0.25, 0.50, and 0.75% (covering the 0.55–0.65% range reported by Xue et al., [19]); and SRF = 0.3, 0.6, and 0.9 kg/m3 with low/middle/high design levels of around 0.6 kg/m3. The SRF upper level is an experimental factor level, not a field safety threshold. The BBD comprised 15 experimental runs, including three center-point replicates (runs 13–15). The remaining 12 non-center formulations were represented by one independent model specimen each.
Table 2.
Table showing the levels of response surface analysis factors.
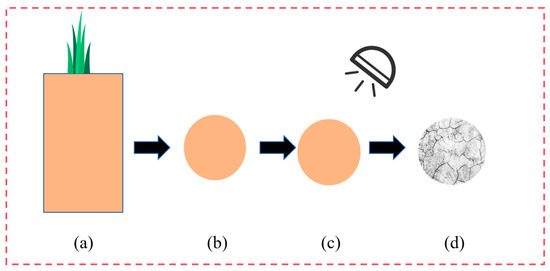
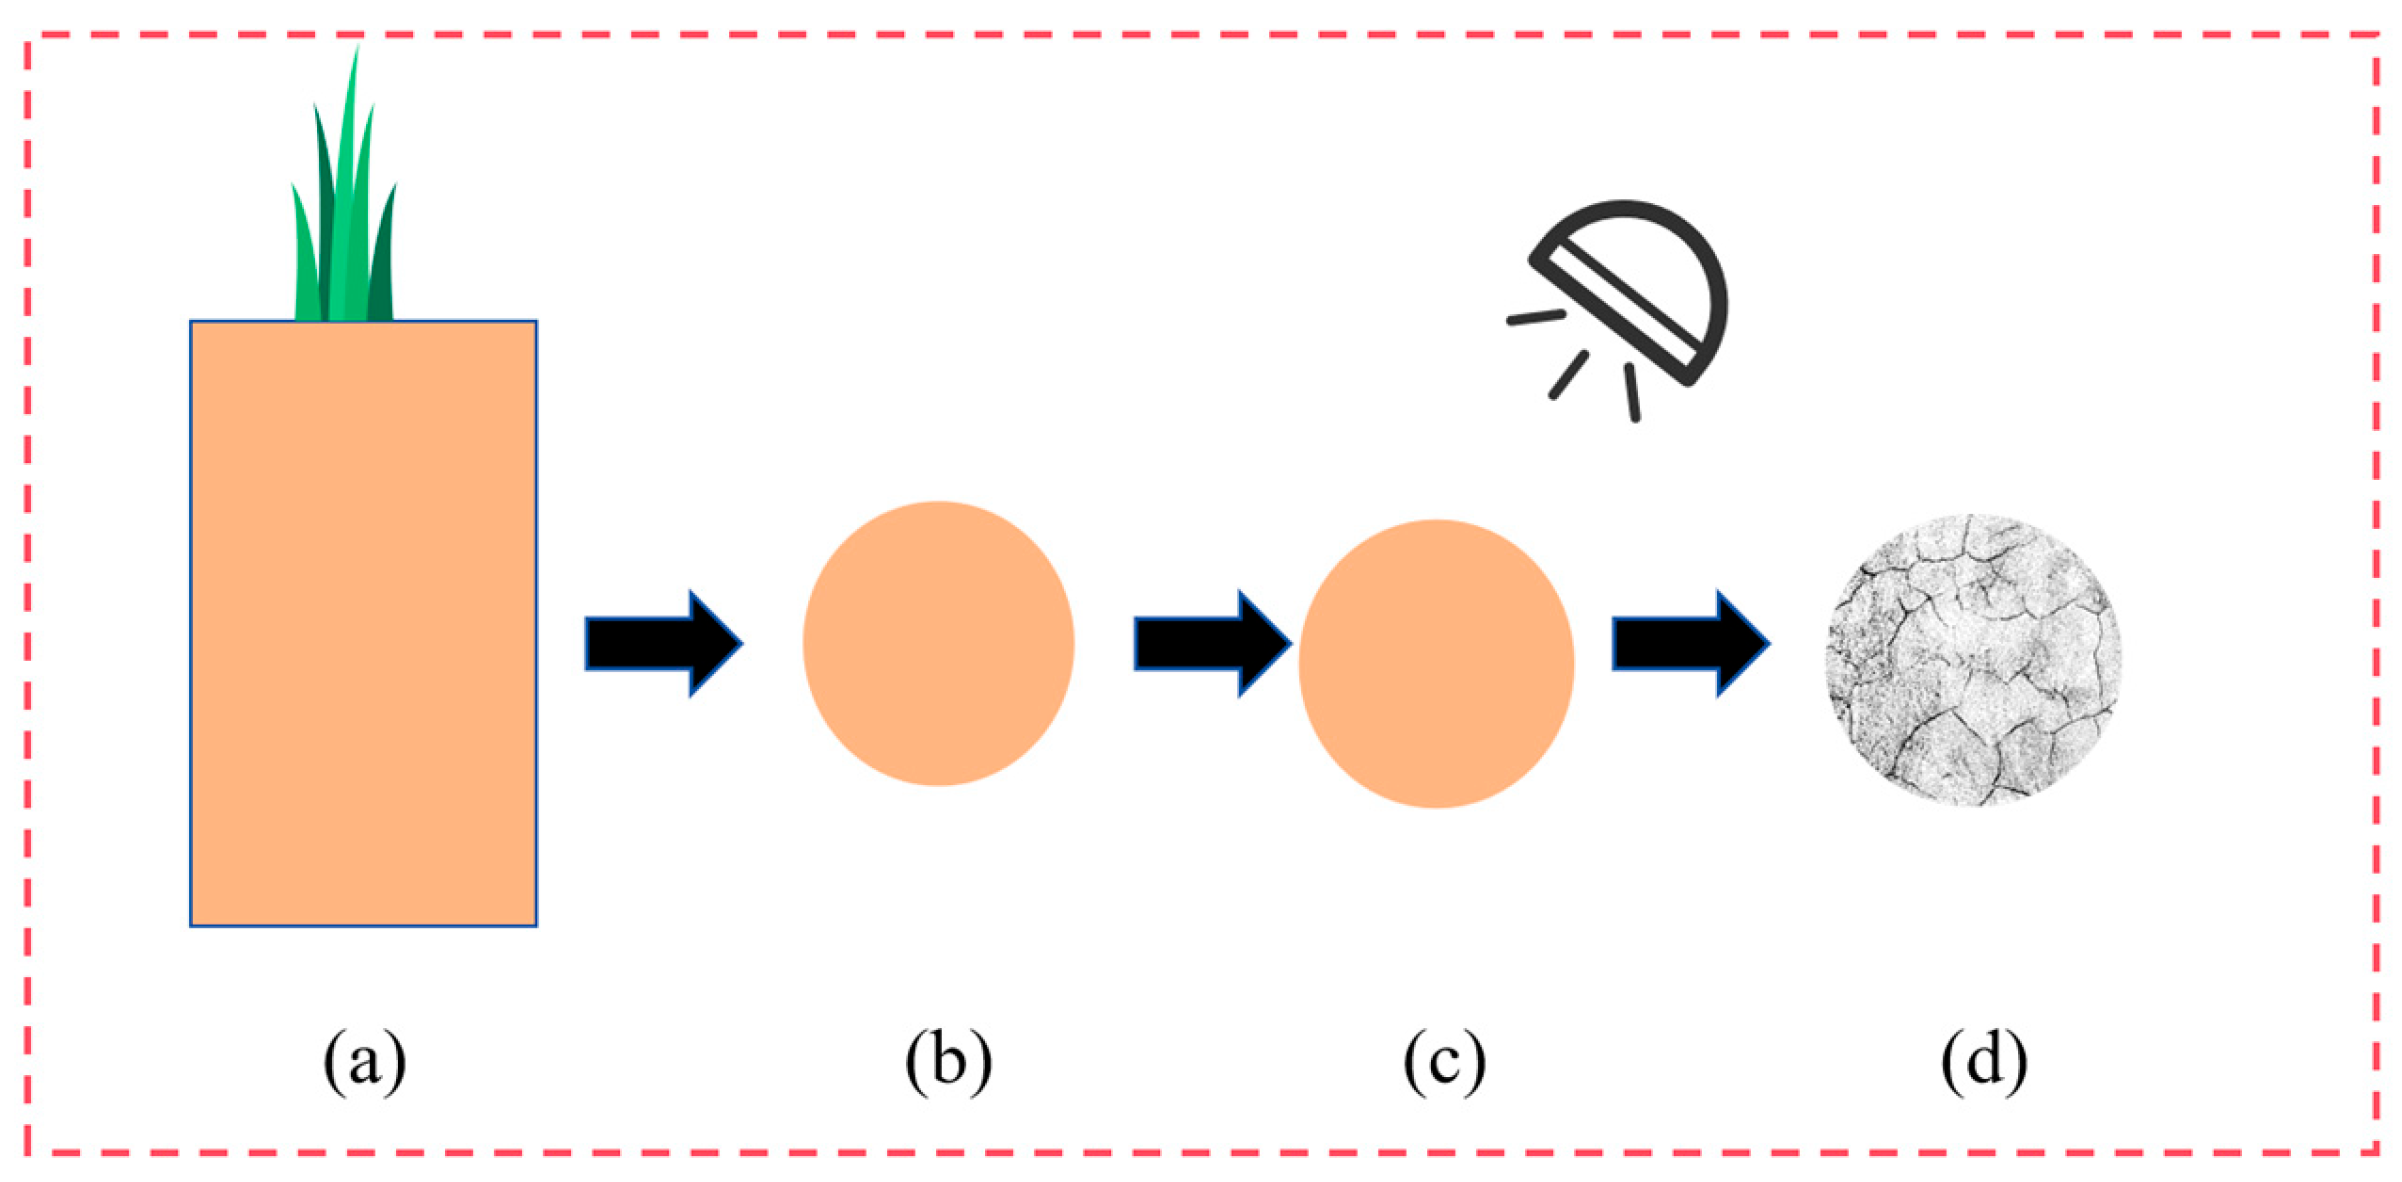
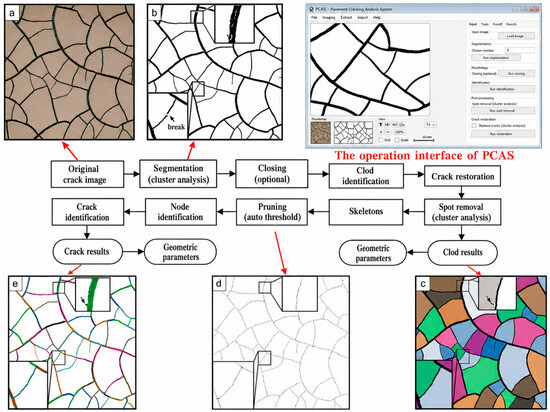
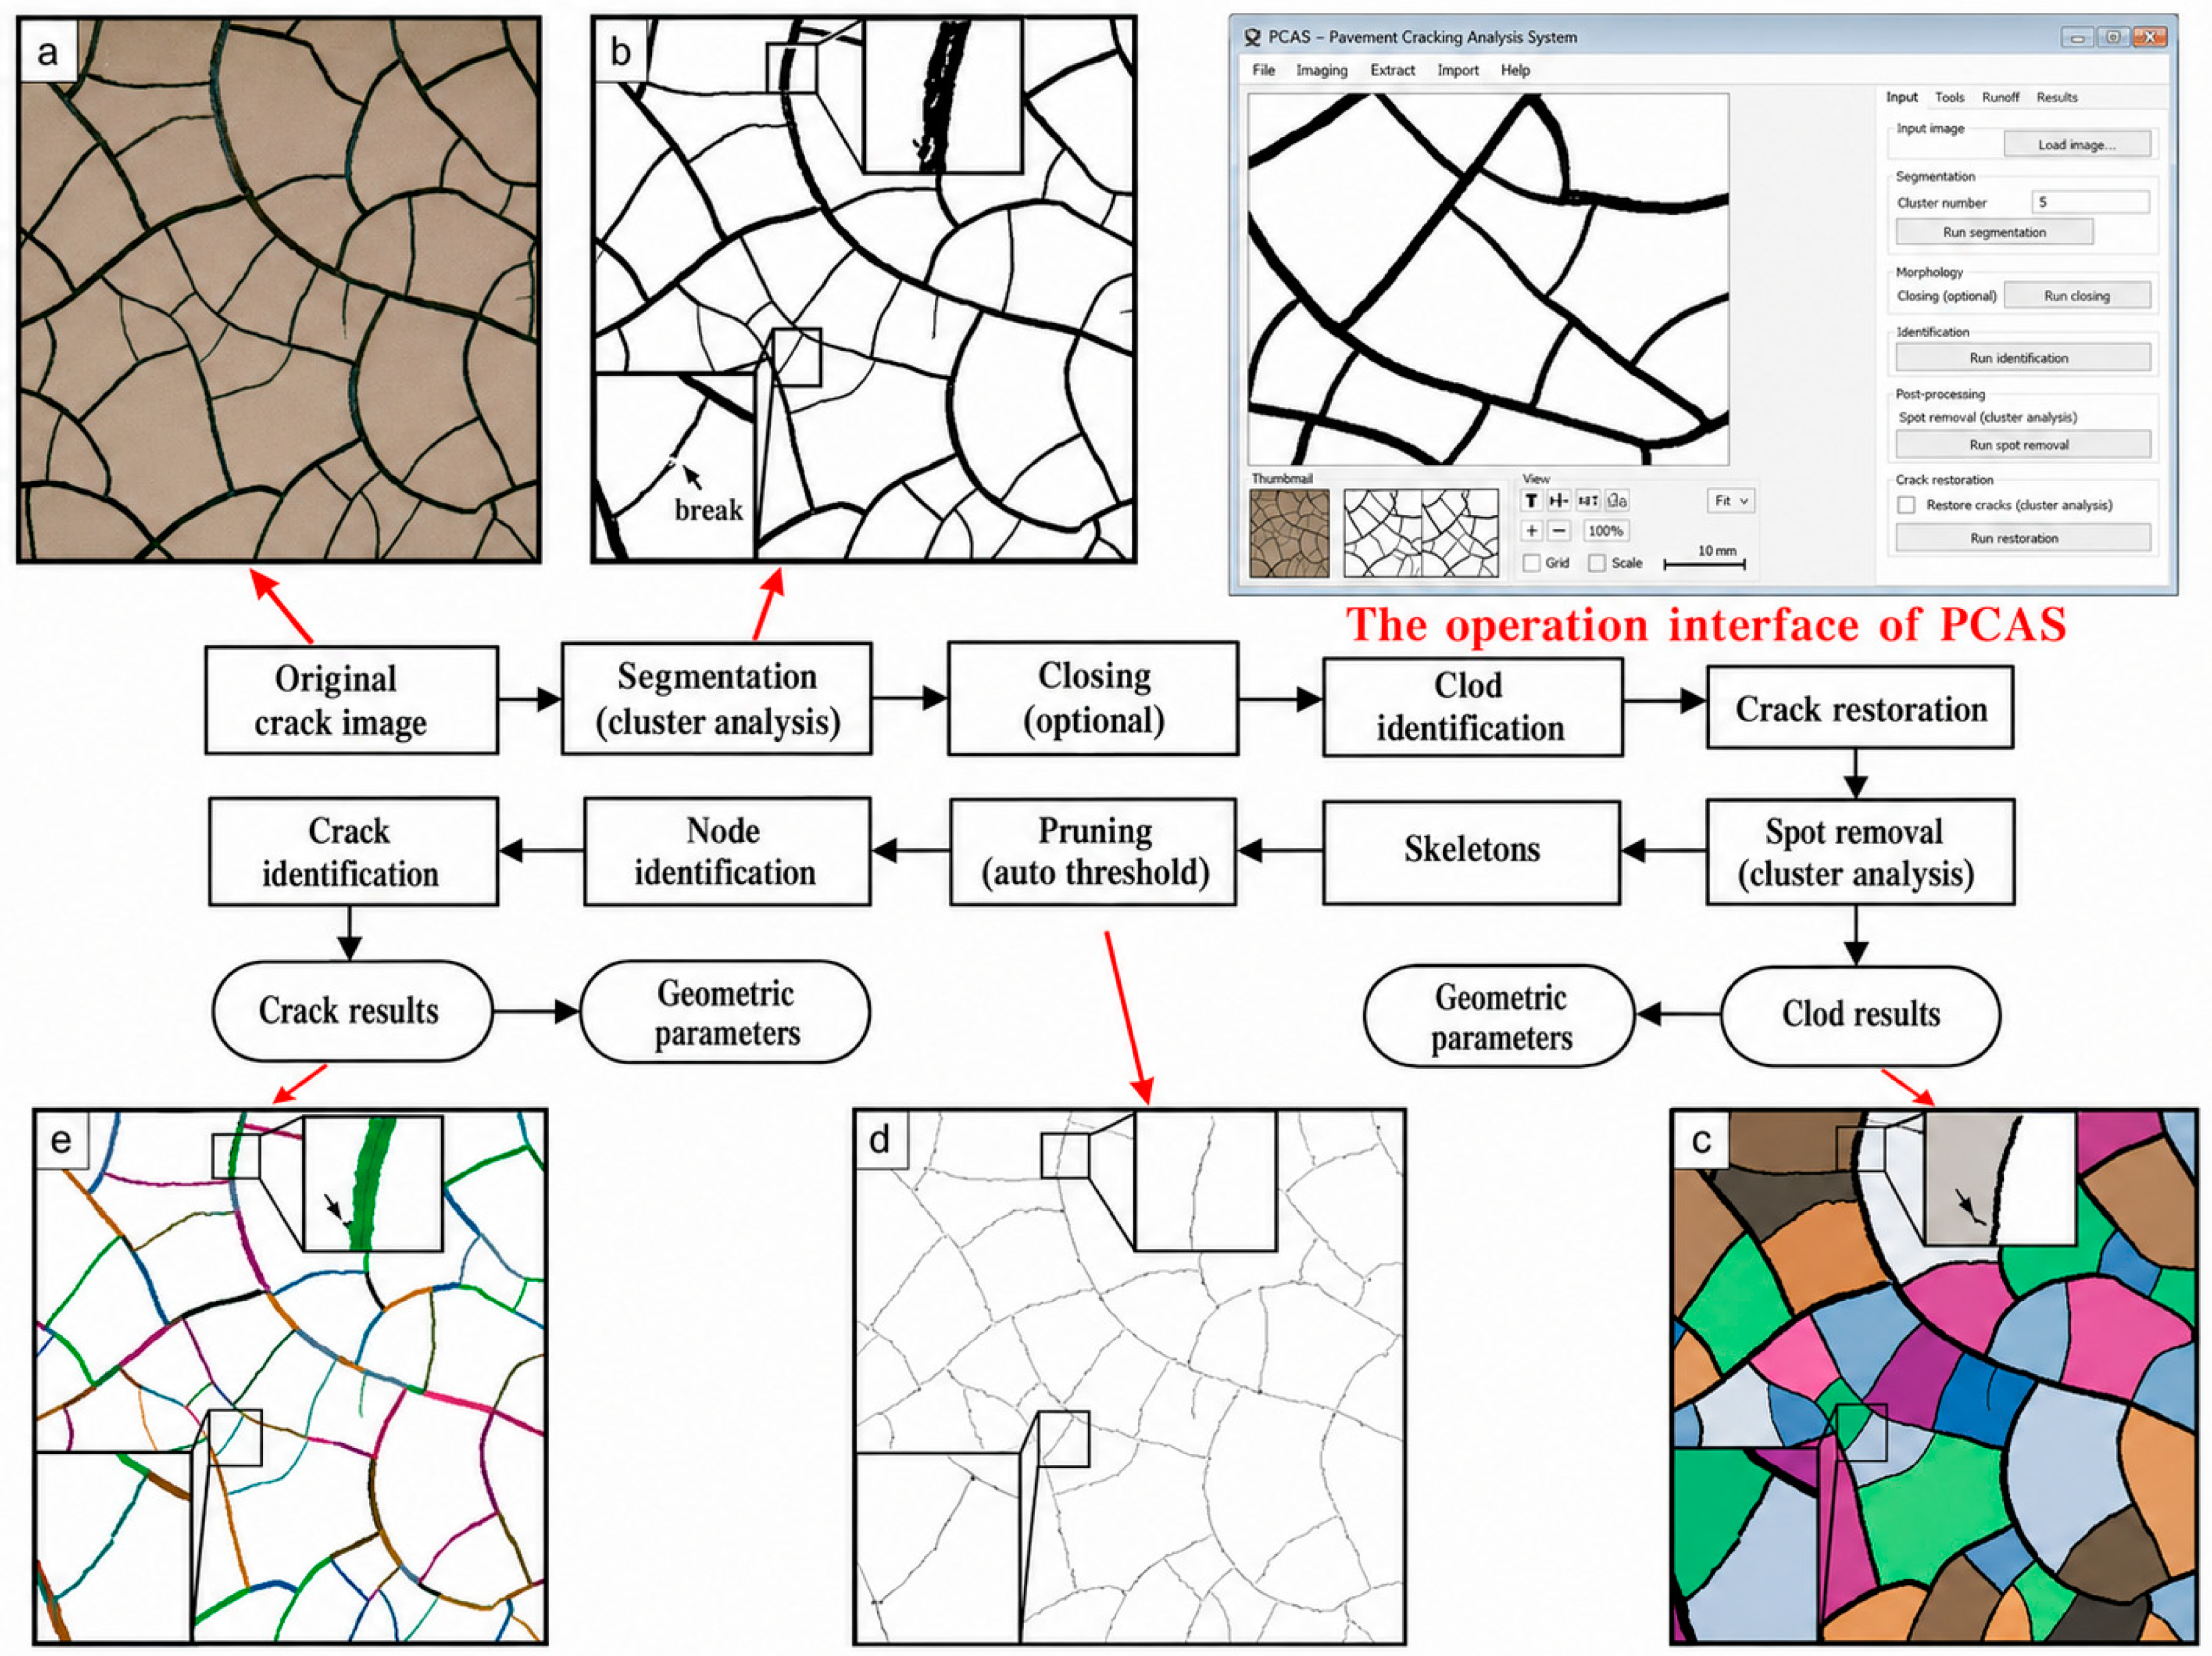
For specimen preparation, the soil and amendments were mechanically blended at 60 r/min for 10 min and compacted to the target dry density of 1.65 g/cm3 to standardize laboratory specimens. The compacted material was sealed and cured for 28 days at 25 ± 1 °C with moisture content controlled within ±1%. Acrylic model boxes (15 cm × 10 cm × 35 cm), fabricated in-house at Hunan City University (Yiyang, China), were filled with the test substrate and planted with vetiver. The 120-day plant-growth phase was conducted outdoors under the watering regime described in the original experiment: approximately every 3–4 days in March (100–150 mL per box, target substrate water content 20–25%) and every 1–2 days from April to June (150–200 mL per box, target 25–30%). Root morphology was subsequently scanned using WinRHIZO (2023, Regent Instruments Inc., Québec, QC, Canada [26]) and root dry mass per unit soil volume was determined after oven drying at 105 °C. For the controlled W-D test, one cycle lasted 48 h and alternated wetting to 32 ± 1.5% soil water content with drying at 40 ± 1 °C; 20 cycles were completed. After each cycle, the same specimen surface was photographed with a high-resolution camera and analyzed using PCAS (version 2.3, School of Earth Sciences and Engineering, Nanjing University, Nanjing, China) for crack ratio and related geometric descriptors. Thus, the 20 sequential images for each run are repeated measurements on the same model specimen rather than independent replicates. Because the non-center BBD treatments were not independently replicated, treatment-specific SD/SEM/95% CI and error bars cannot be estimated validly for those runs. The three center-point runs are therefore reported individually in Table 3 rather than being used to imply replication for every treatment. Particle-size distributions of the three additives were not measured in the archived experiment and are identified as a limitation for future mechanistic work. The experimental procedure is shown in Figure 2. The detailed process for obtaining fractures is shown in Figure 3.
Table 3.
BBD treatment matrix and observed root content and crack ratio. Runs 13–15 are center-point replicates; the other formulations correspond to one independent model specimen each.
Figure 2.
Experimental workflow for crack-ratio acquisition: (a) 120-day vetiver cultivation in the amended expansive soil; (b) extraction/preparation of the root–soil composite specimen; (c) controlled W-D cycling; and (d) high-resolution surface imaging used for PCAS crack quantification.
Figure 3.
PCAS image-processing workflow: (a) original crack image; (b) segmented crack image after cluster analysis; (c) clod-region identification result; (d) skeletonized and pruned crack network; (e) reconstructed crack network and crack-identification result. The workflow includes segmentation, optional closing, clod-region identification, crack restoration, spot removal, skeletonization, pruning, node/crack identification, and extraction of crack and clod geometric parameters.
For the BBD response-surface analysis, crack ratio after the fourth W-D cycle (Table 3) was used as the response variable. A full quadratic model containing the three linear terms, three two-factor interactions, and three quadratic terms was fitted in coded variables. Model significance was evaluated using the F distribution with α = 0.05. The ANOVA was recalculated directly from the 15 values reported in Table 3 because several p-values in the submitted table were inconsistent with the corresponding F-statistics and degrees of freedom. The center-point values are identical at the reported precision, so a separate lack-of-fit test cannot be estimated robustly from the rounded archived values and is not used as evidence of model adequacy. For the LSTM analysis, the documented settings are as follows: time step = 5; an 80% training/20% test split; dynamic inputs comprising cycle number, drying temperature, wetting-stage water content, previous-cycle crack ratio, and root content; static inputs comprising OF, SRF, and RS levels; and crack ratio as the prediction target. Performance was assessed using MAE, RMSE, and R2. The plant-growth phase was outdoors, whereas the subsequent W-D cycling and crack-measurement phase was conducted under controlled laboratory conditions.
3. Results and Analysis
3.1. Response Surface Model Fitting
Response surface methodology was implemented through the Box–Behnken design used in this study. The quadratic polynomial contains linear, two-factor interaction, and squared terms, allowing the effects of the three coded factors and their curvature to be evaluated within the experimental domain. The generic regression relations are given in Equations (1)–(6).
Y = β0 + ΣβiXi + ε
The first-order model in Equation (1) is extended to the full quadratic response-surface form in Equation (2), which includes linear, squared, and two-factor interaction terms.
Y = β0 + ΣβiXi + ΣβiiXi2 + ΣβijXiXj + ε
For observation i, the residual is defined as the difference between the measured response and the model prediction [Equation (3)], and the residual sum of squares is given by Equation (4).
εi = yi − ŷi
SSE = Σ(yi − ŷi)2
The regression coefficients are estimated by ordinary least squares [Equation (5)], and fitted responses are obtained from the design matrix and estimated coefficient vector [Equation (6)]. Here, n is the number of experimental runs.
The 15 BBD observations in Table 3 were fitted with the full quadratic model defined by Equations (1)–(6). The resulting coded-factor equation for crack ratio is given in Equation (7).
Y1 = 2.300 + 0.2625X1 − 0.2125X2 − 0.2500X3 − 0.0500X1X2 + 0.0750X1X3 − 0.0250X2X3 + 0.4250X12 + 0.0250X22 − 0.2000X32
In Equation (7), Y1 denotes the predicted crack ratio (%), and X1, X2, and X3 are the coded OF, SRF, and RS factors, respectively.
3.2. Effects of Mixing Ratio on Crack Ratio
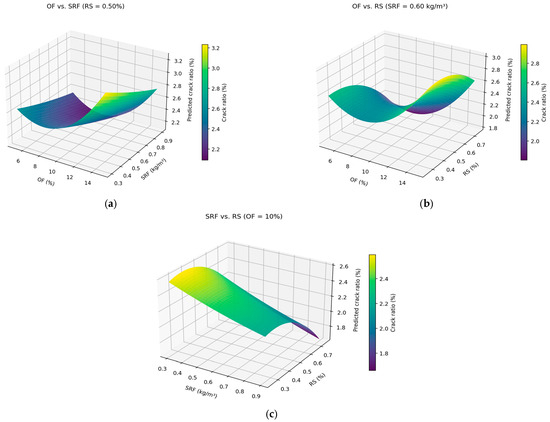
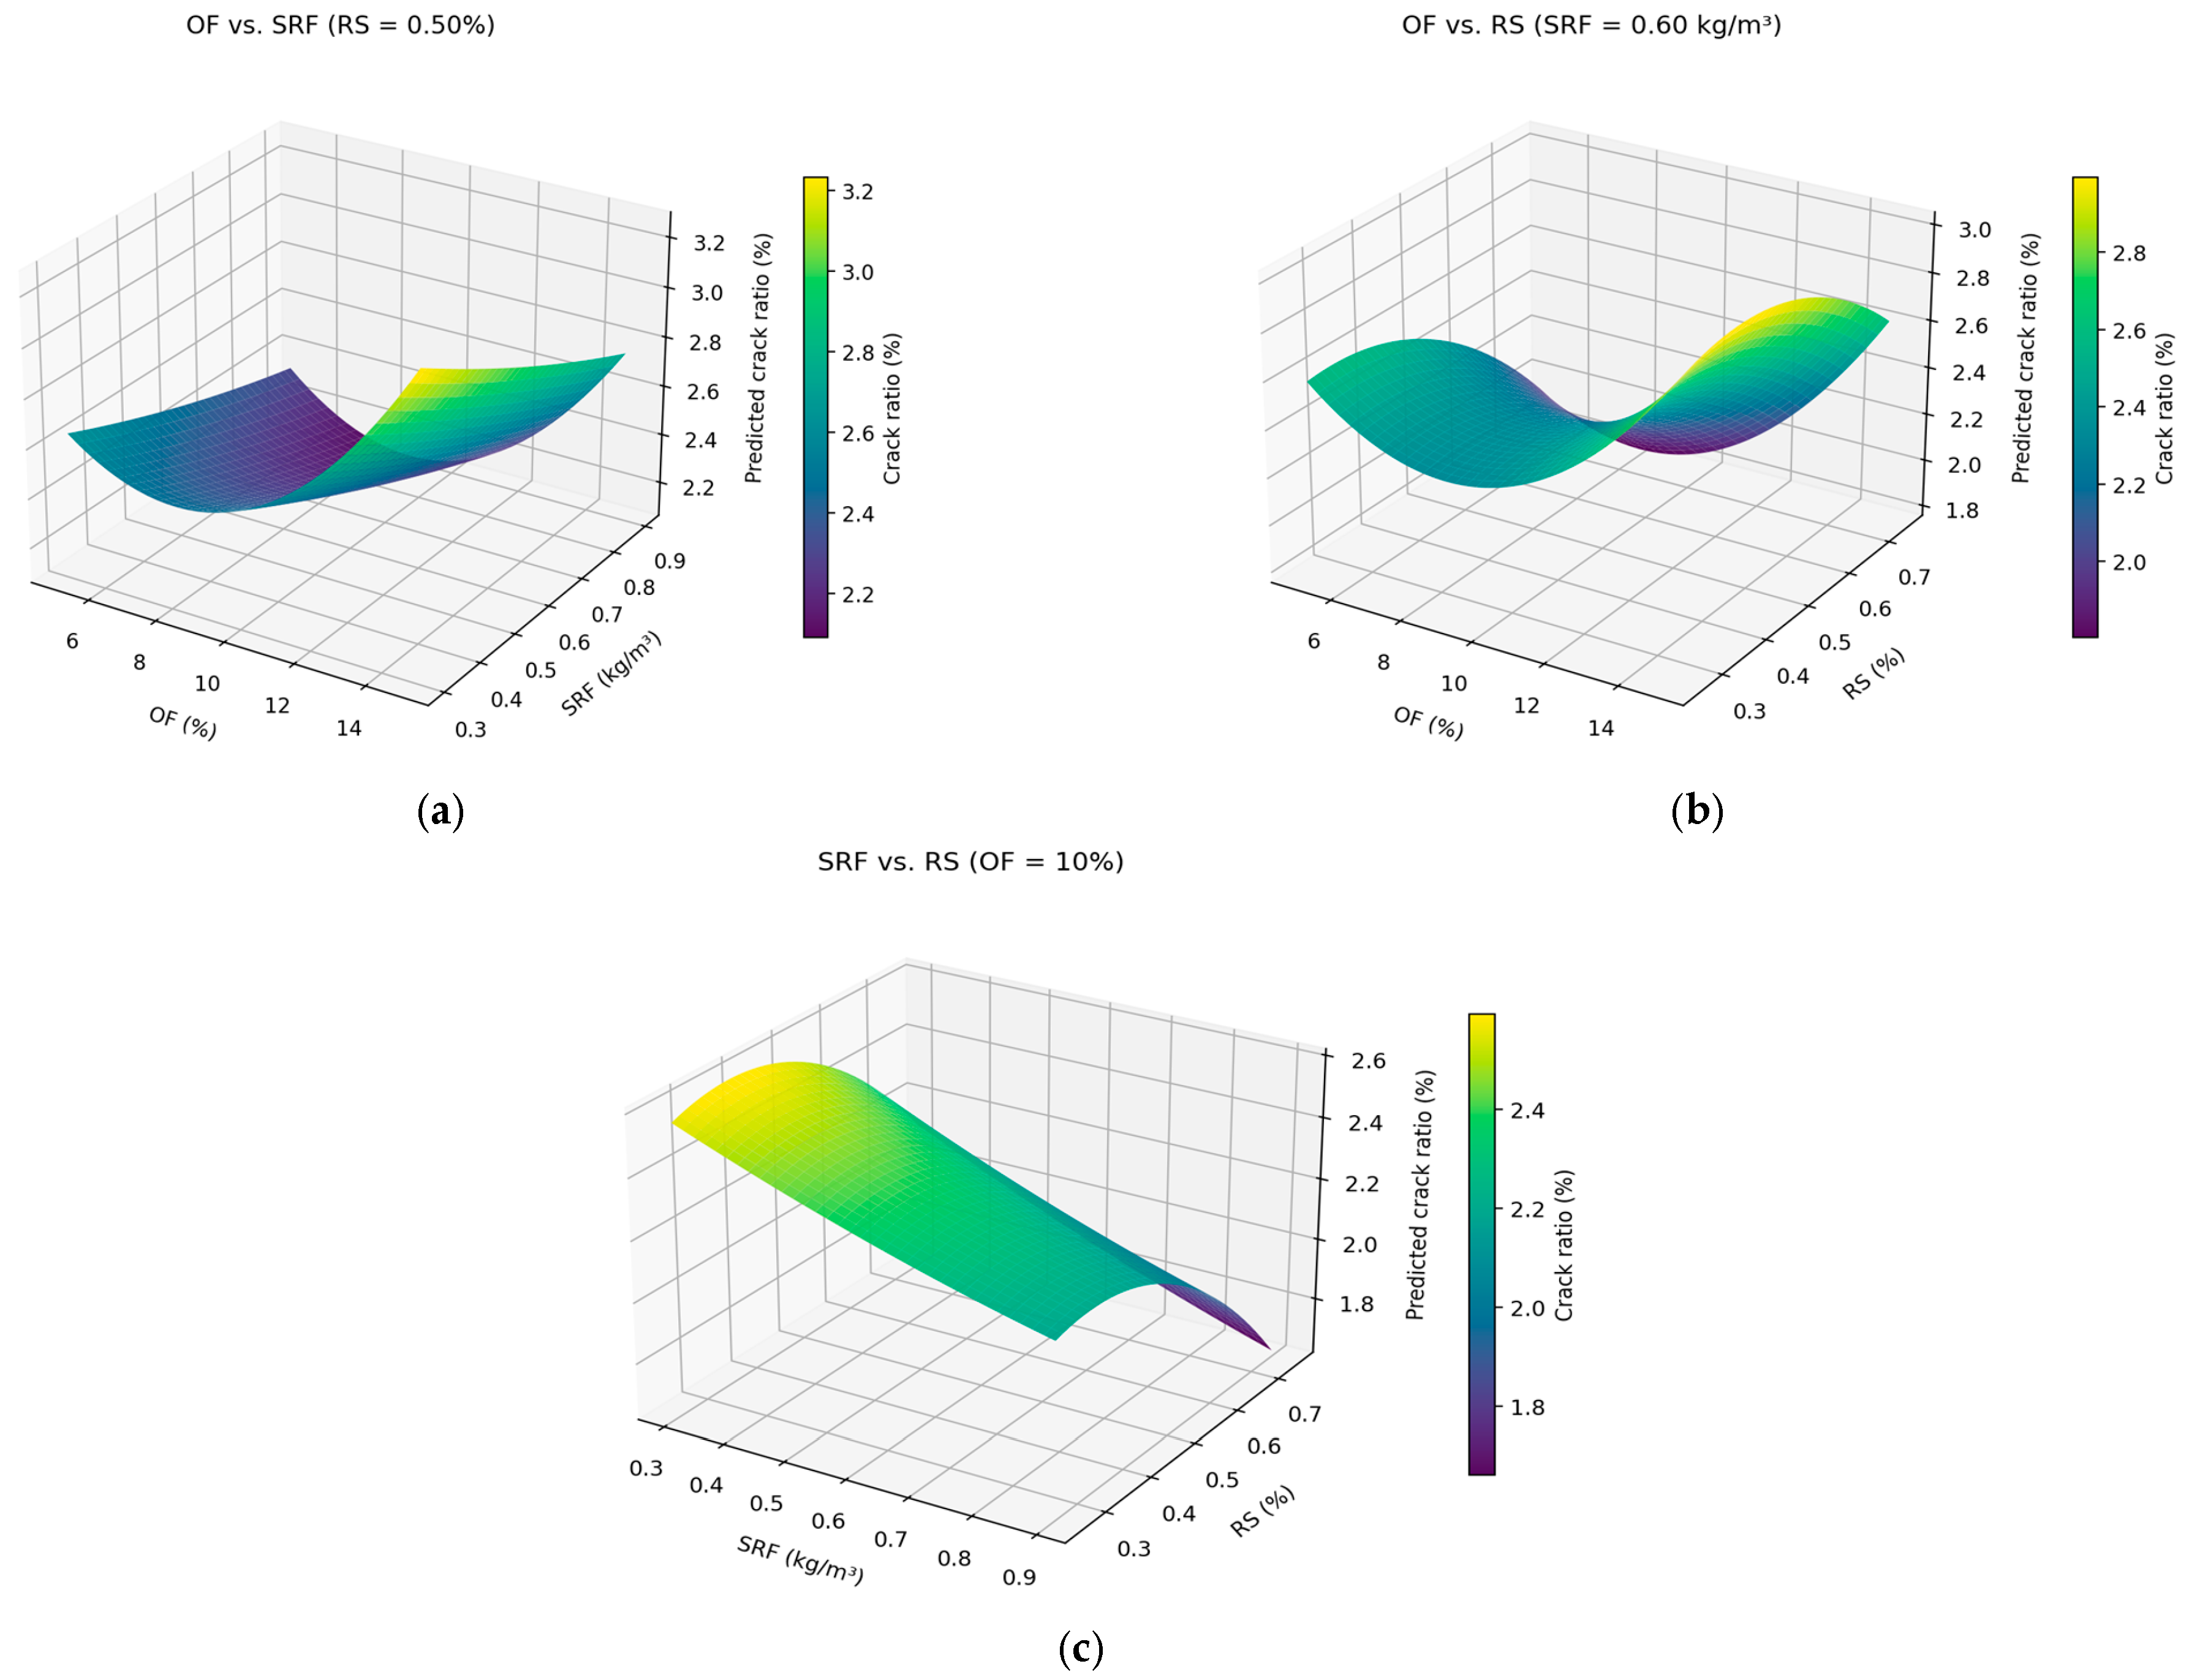
The crack-ratio response was analyzed using the full three-factor quadratic model (Figure 4). Recalculation from the 15 observations in Table 3 gave R2 = 0.952 and adjusted R2 = 0.865. The overall model was significant (F = 10.95, p = 0.008). The joint linear effect was significant (F = 20.04, p = 0.003), whereas the three two-factor interaction terms were not significant as a group (F = 0.50, p = 0.701). The joint quadratic contribution was significant (F = 12.32, p = 0.010).
Figure 4.
Predicted crack-ratio response surfaces from the recalculated quadratic BBD model: (a) OF–SRF interaction at RS = 0.50%; (b) OF–RS interaction at SRF = 0.60 kg/m3; and (c) SRF–RS interaction at OF = 10%. The surfaces visualize the fitted response within the tested domain; pairwise interaction coefficients were not statistically significant (Table 4).
RS showed a significant linear association with crack ratio in the fitted model (F = 21.28, p = 0.0058). Within the tested range, higher RS generally corresponded to lower observed crack ratios, consistent with a plausible fiber-bridging mechanism in which distributed straw elements interrupt crack continuity and redistribute shrinkage-induced tensile stress. However, fiber–soil interfacial strength and stress transfer were not measured directly in this experiment, so this mechanism is used to interpret the trend rather than to claim direct micro-mechanical verification.
OF also had a significant linear effect (F = 23.46, p = 0.0047), and the OF quadratic term was significant (F = 28.38, p = 0.0031), indicating a nonlinear response across the 5–15% range. The rise in crack ratio at the upper OF level is consistent with the possibility that organic matter alters pore structure and water-retention heterogeneity, but pore-size distribution and spatial water-retention gradients were not measured here.
SRF had a statistically significant linear effect in the recalculated model (F = 15.37, p = 0.011). Increasing SRF within the experimental range was associated with a lower crack ratio in several treatment contrasts. Potential explanations include changes in local ionic conditions, water availability, or pore filling by fertilizer granules; however, electrical conductivity, ion migration, and cementitious products were not measured.
None of the individual two-factor interaction terms reached statistical significance in the recalculated model: OF × SRF (F = 0.43, p = 0.543), OF × RS (F = 0.96, p = 0.373), and SRF × RS (F = 0.11, p = 0.758). Accordingly, Group 12 (10% OF + 0.9 kg/m3 SRF + 0.75% RS), which exhibited the lowest observed crack ratio of 1.7% in Table 3, is described as an experimentally favorable combination rather than evidence of a statistically confirmed SRF–RS synergy.
The absence of significant pairwise interaction terms does not exclude combined practical effects within the tested mixtures; it means that, given the present 15-run BBD and residual variance, the data do not provide sufficient statistical evidence to distinguish the interaction coefficients from zero. Mechanistic interpretations of combined OF–RS–SRF behavior are therefore presented as hypotheses to be tested with independent replication and microstructural/hydraulic measurements.
3.3. Soil-Conservation Implications of Crack-Ratio Reduction
The experimental results demonstrate substantial differences in surface crack ratio among amendment combinations, which is relevant to soil conservation because cracks can alter infiltration pathways, preferential flow, and near-surface erodibility [27,28]. However, runoff, sediment yield, infiltration rate, and field erosion were not measured in this study. Therefore, the crack-ratio reduction is treated as an intermediate indicator of erosion-mitigation potential rather than converted directly into t·ha−1·yr−1 of avoided soil loss. The magnitude of any field erosion benefit will depend on rainfall intensity, slope, vegetation cover, antecedent water content, soil texture, and crack connectivity. Field plots that measure runoff and sediment yield alongside crack dynamics are required before a quantitative erosion-reduction factor can be claimed.
3.4. Effects of Number of Cycles on Crack Ratio
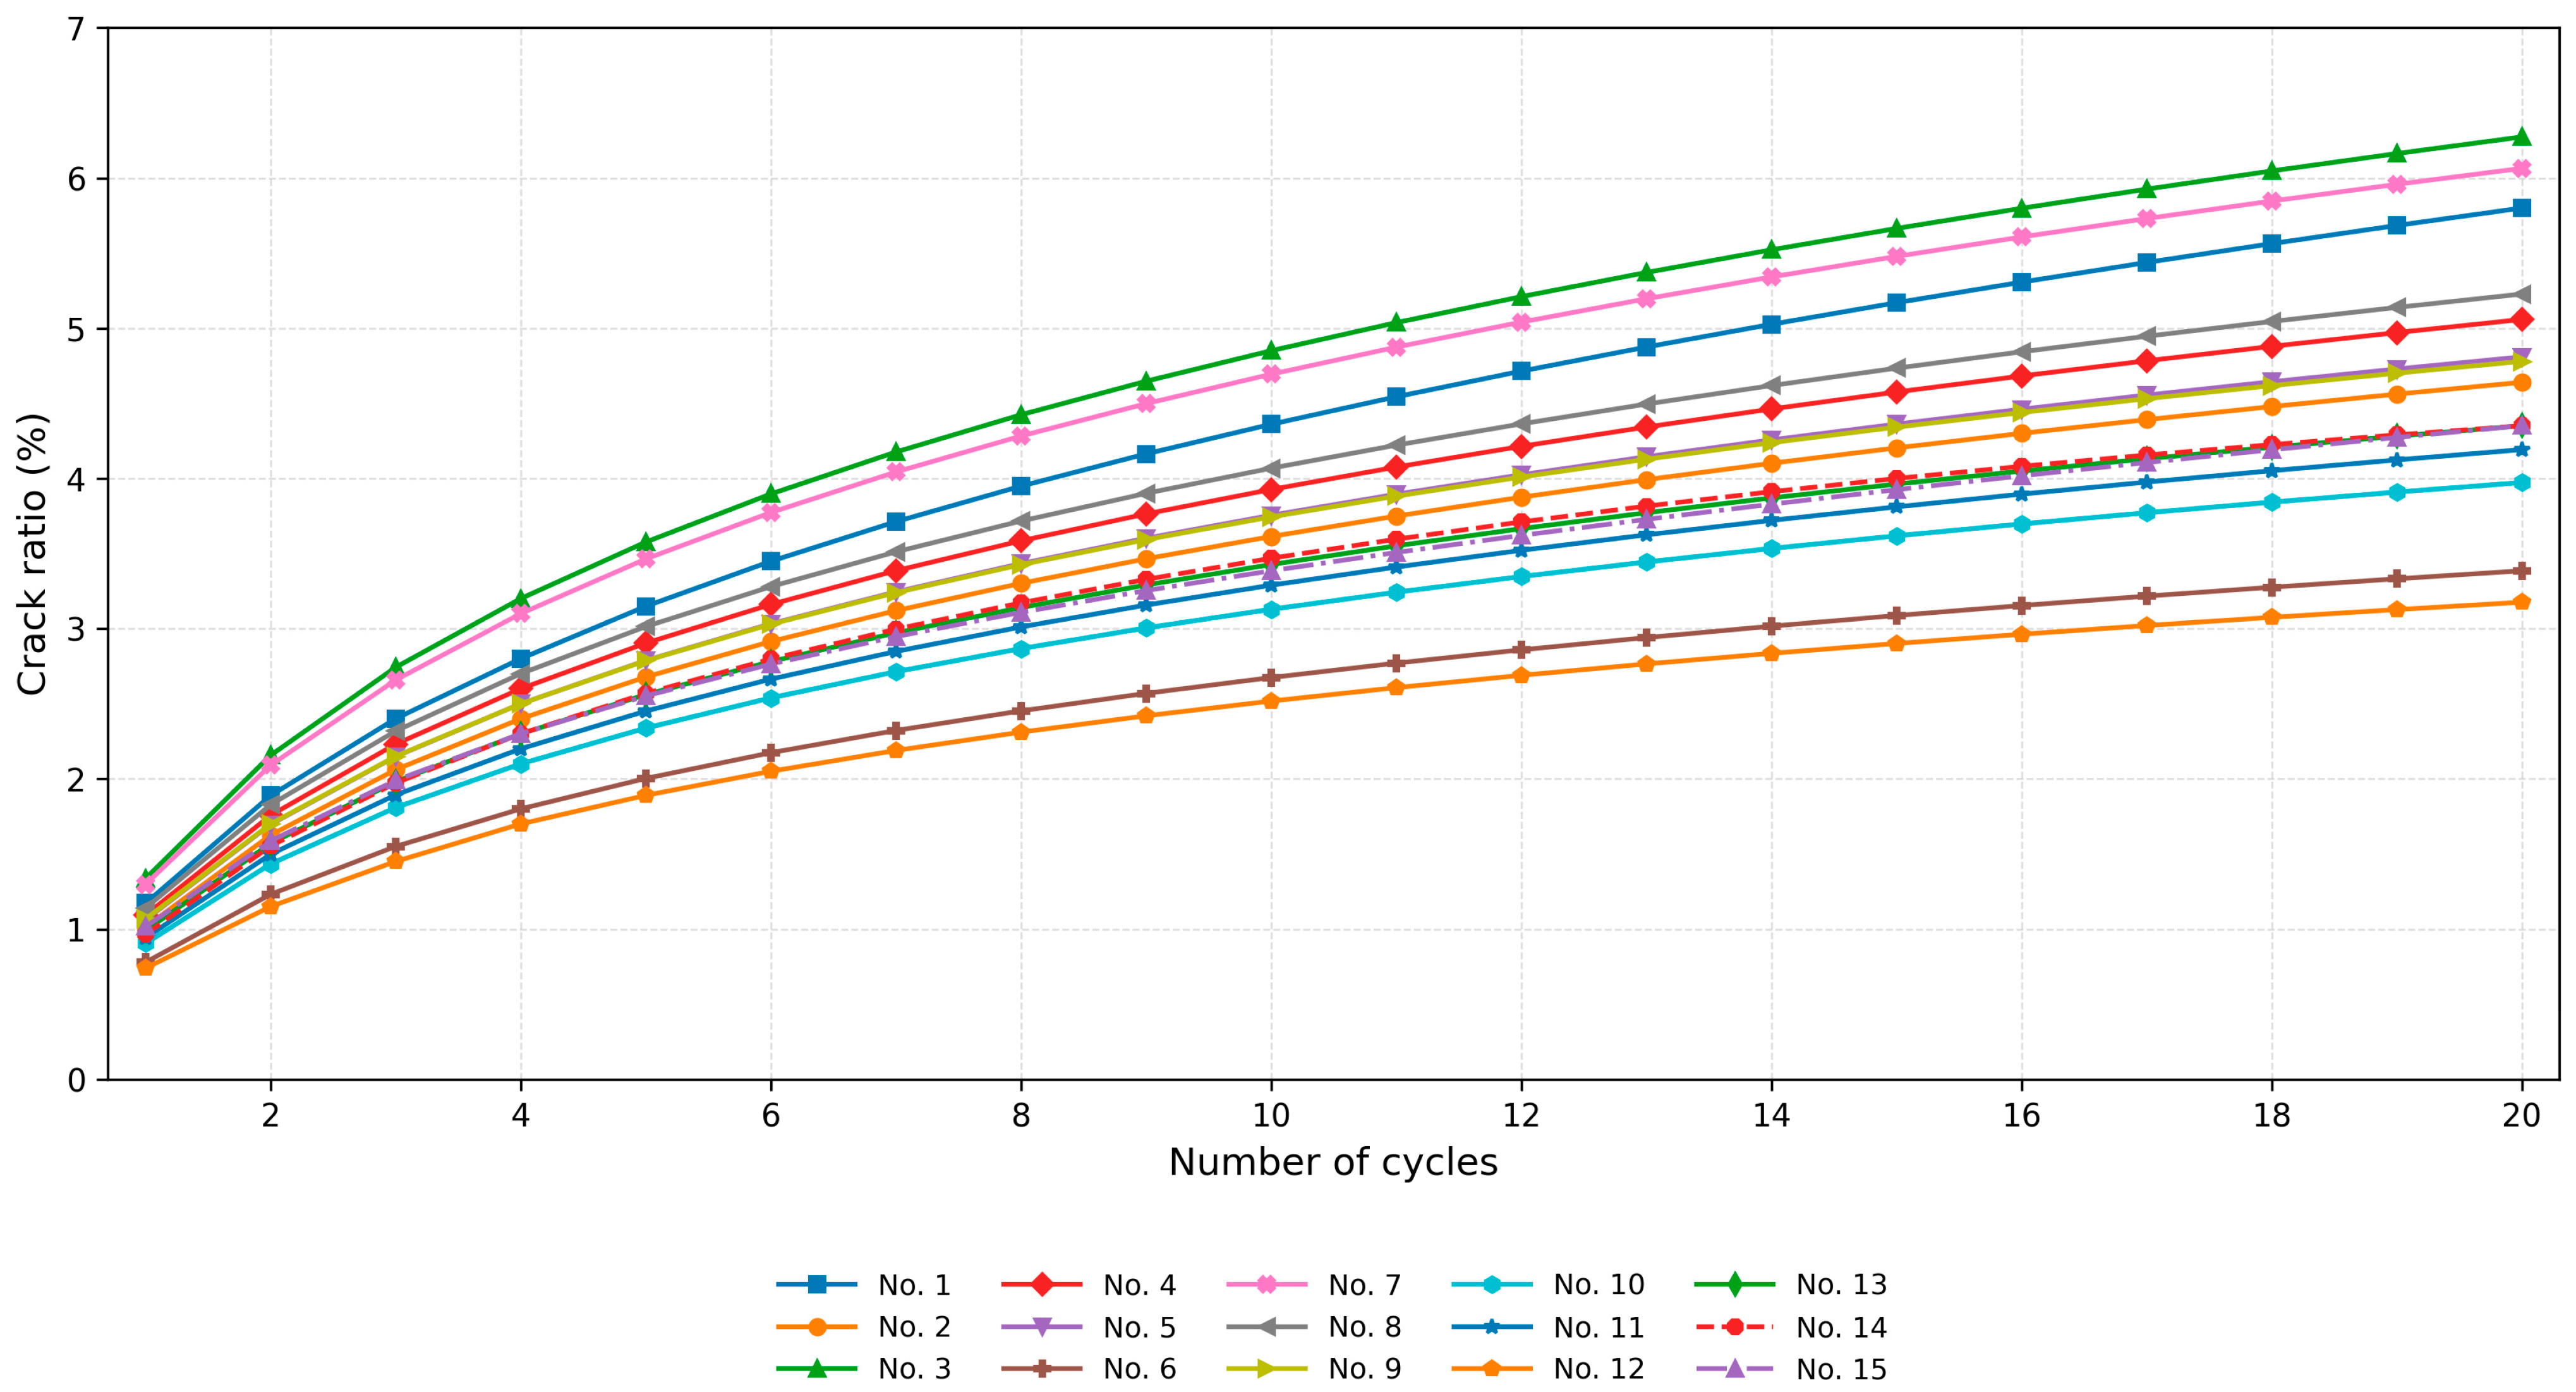
Repeated W-D cycling increased the crack ratio, but the rate of increase declined with cycle number (Figure 5). Within the 1–20-cycle window, this evolution was represented by a logarithmic-type growth relation. Because the same specimen was followed repeatedly, the curve describes longitudinal crack evolution rather than independent observations at each cycle.
Figure 5.
Crack-ratio trajectories over 20 W-D cycles for the 15 BBD runs. Runs 13–15 have identical center-point factor settings and overlap. Each line connects repeated measurements on the same specimen; the non-center treatments are not replicate means, so treatment-level error bars are not shown.
For comparison with the sequence model, the observed cycle dependence was also represented by a logarithmic growth function:
In the equations, the parameter reflects the growth rate, and characterizes the initial state crack ratio. Examples are given below:
- No. 1 (OF = 5%, SRF = 0.3 kg/m3, RS = 0.5%): ;
- No. 7 (OF = 15%, SRF = 0.3 kg/m3, RS = 0.25%): .
Taking Run 1 as an example, crack ratio increased from approximately 0.5% after the first cycle to 5.8% after the 20th cycle. The trajectory can be divided descriptively into a rapid-growth stage (cycles 1–5, about 0.6 percentage points per cycle), a decelerating stage (cycles 5–10, about 0.3 percentage points per cycle), and a later stabilization stage (cycles 10–20, about 0.1 percentage points per cycle). This early rapid increase followed by stabilization is consistent with recent cyclic-cracking studies in expansive/clayey soils [3,4,5,8]. A plausible explanation is progressive rearrangement of the soil fabric and persistence/reopening of existing cracks, although microstructural evolution was not measured directly in the present specimens.
The 20-cycle trajectories also provide useful descriptive contrasts among formulations. Run 3 (15% OF, 0.3 kg/m3 SRF, 0.50% RS) reached a higher final crack ratio than Run 1, whereas increasing SRF from 0.3 to 0.9 kg/m3 at otherwise comparable settings reduced the observed final crack ratio in Runs 1 and 2. Increasing RS to 0.75% likewise reduced crack ratio in several matched comparisons. These trajectory contrasts support the main-effect trends of the BBD model, but they should not be interpreted as statistically significant pairwise interaction effects: the recalculated interaction terms in Table 4 were non-significant. Fiber bridging by RS and pore/water-retention modification by OF are plausible mechanisms; ionic or cementation effects of SRF remain hypotheses because the corresponding physicochemical variables were not measured.
Table 4.
Recalculated ANOVA for the quadratic regression model of crack ratio.
Although the logarithmic model showed high prediction accuracy within 1–20 cycles, its limitation lay in not considering the material fatigue effect and the interference of dynamic root growth. It is suggested that subsequent research could improve the prediction ability of long-term cycles by introducing an attenuation factor λ (such as CR(n) = a·ln(n) + b·e−λn) and combining in situ monitoring data to verify the multi-factor coupling mechanism.
3.5. Dynamic Prediction Performance of LSTM
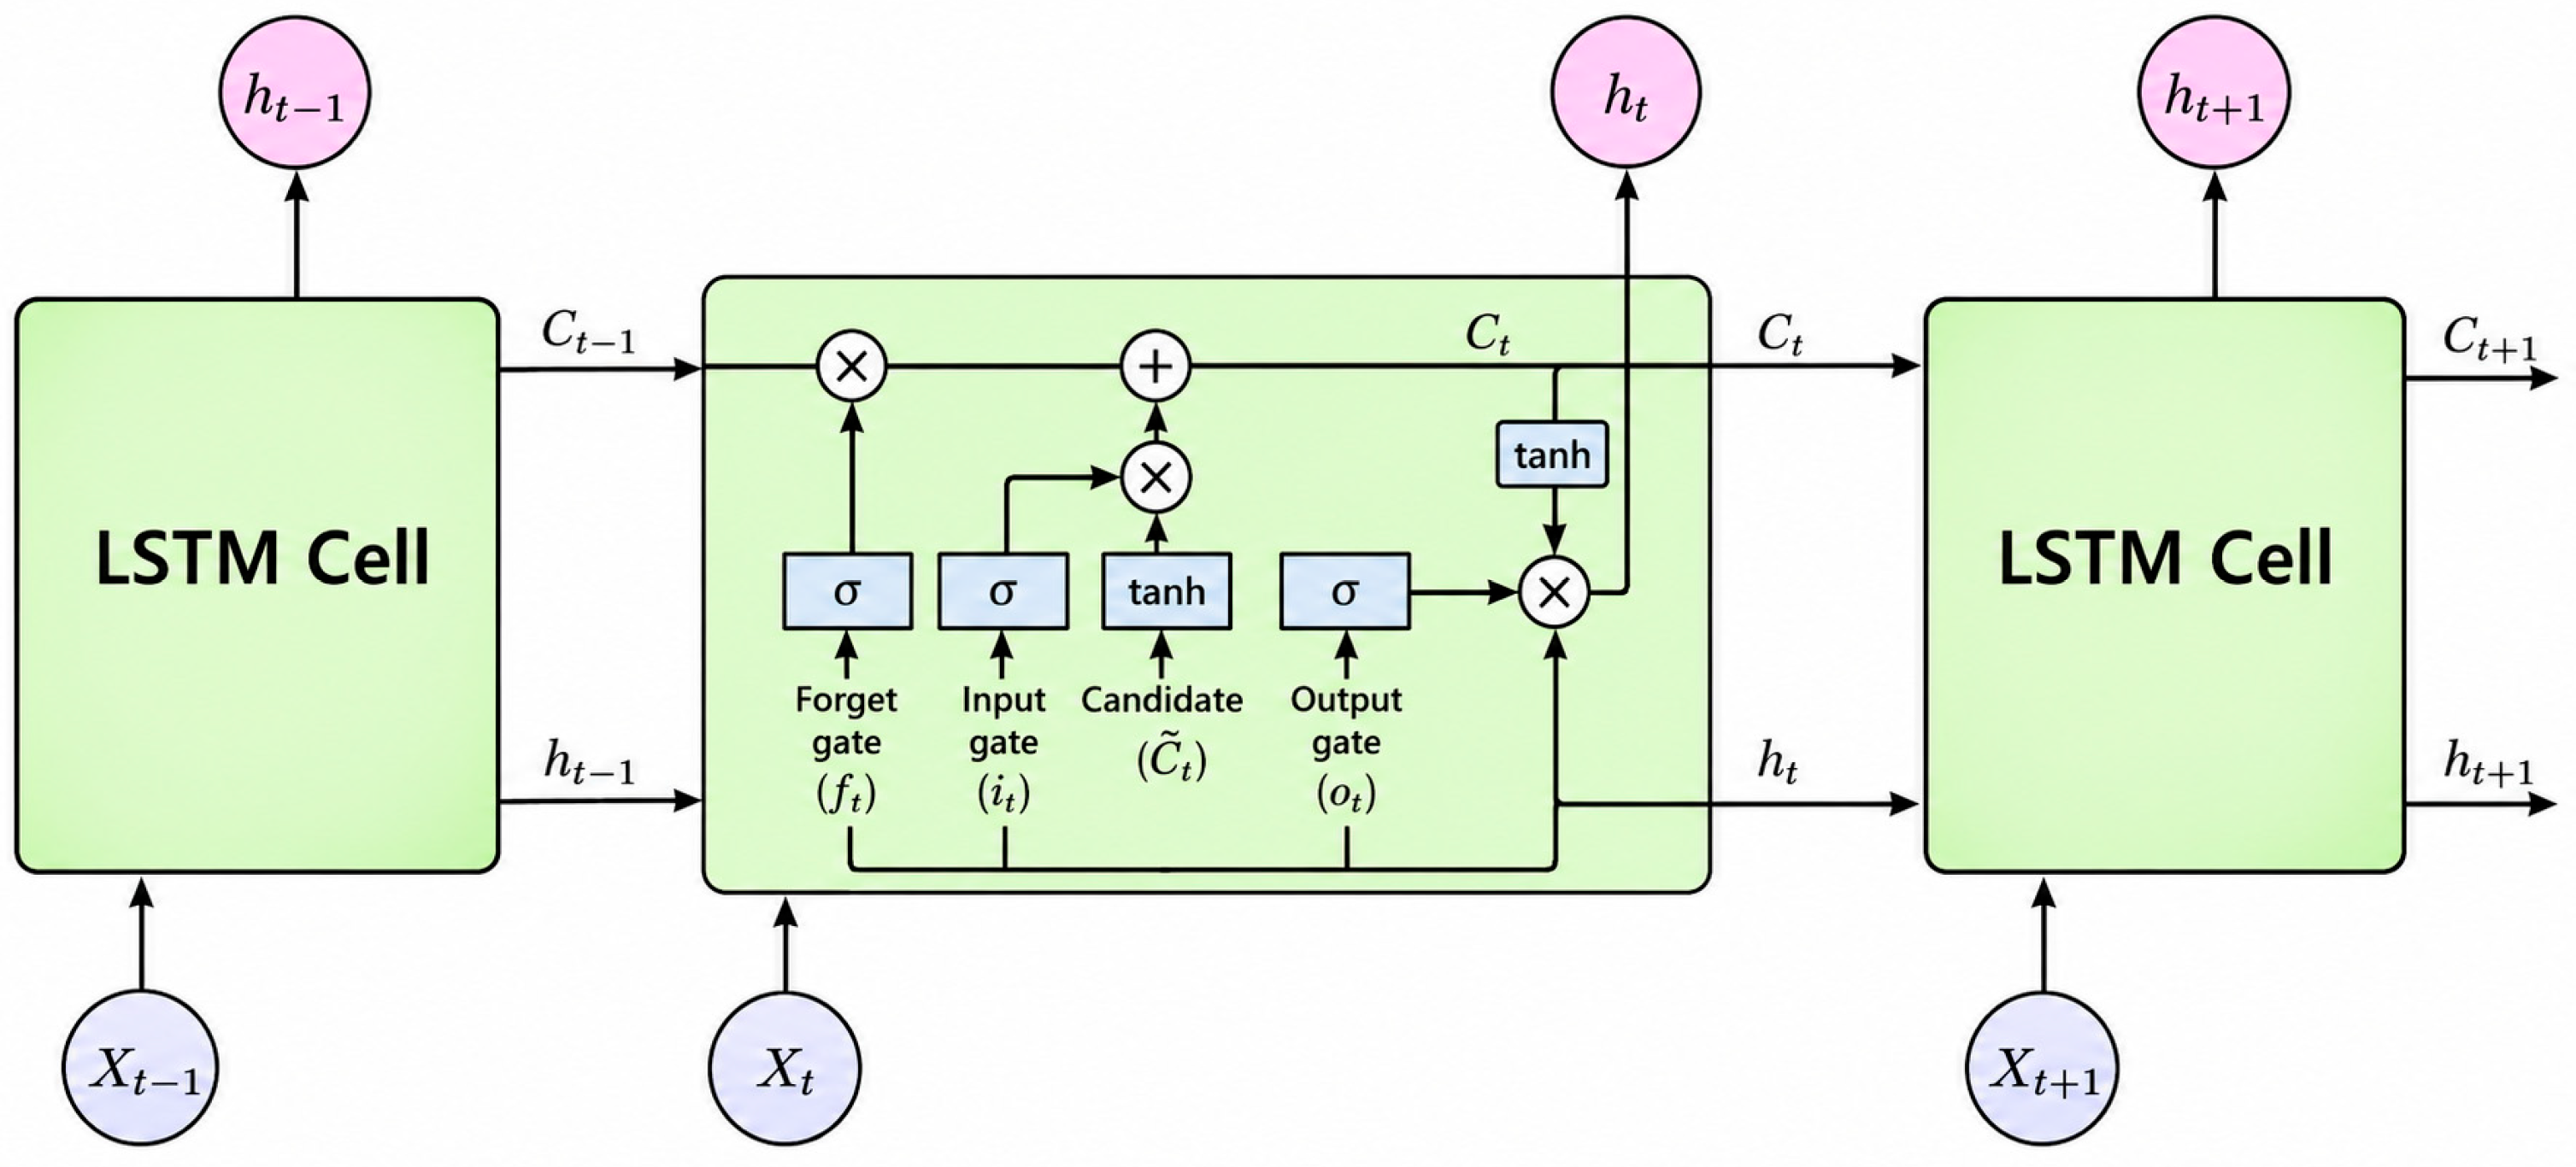
Long short-term memory (LSTM) networks are recurrent neural networks designed to retain or discard information through gated state transitions. Figure 6 presents the standard LSTM-cell logic, in which sigmoid gates regulate information flow and hyperbolic-tangent functions update the candidate and cell states. In the present study, LSTM was used as an exploratory sequence model to relate the preceding crack state and experimental inputs to the subsequent crack ratio. The purpose of Figure 6 is to explain the gating principle; it should not be interpreted as a complete layer-by-layer specification of the implemented network.
Figure 6.
Standard LSTM-cell schematic illustrating recurrent state transfer and the sigmoid/tanh gating operations used to control information retention and updating.
The documented LSTM inputs were divided into dynamic and static variables as follows:
- Time series variables (dynamic input)
Cycle: The cumulative number of dry–wet cycles (1 to 20 times) as an integer variable;
Temperature: The set temperature of the constant temperature drying oven (40 °C ± 1), in °C;
Humidity: The average moisture content of the sample after the wetting stage (32% ± 1.5), in %;
Crack Ratio: The measured value of the crack ratio of the previous cycle (e.g., for the nth cycle with the crack ratio of the (n − 1)th cycle input), in %;
Root content: The root content of the sample, with the unit mg/cm3.
- 2.
- Static proportion parameters (fixed input)
OF: Organic fertilizer content: 5% to 15% within the test design range;
SRF: Slow-release fertilizer dosage: 0.3 to 0.9 kg/m3 within the test design range;
RS: Rice straw content: 0.25% to 0.75% within the test design range.
Model configuration and reproducibility note: The archived model record confirms a time step of 5, an 80:20 training/test split, 200 nominal training iterations in the diagnostic curves, and evaluation by MAE, RMSE, and R2. The final manuscript/figures available for this revision do not preserve the exact number of stacked LSTM layers, number of hidden units, optimizer, learning rate, batch size, or random seed. These settings cannot be reconstructed reliably from the final plots and are therefore not reported as uncertain reconstructed values. This limitation is stated explicitly, and the LSTM results are interpreted as exploratory within-dataset prediction rather than a fully reproducible externally validated model.
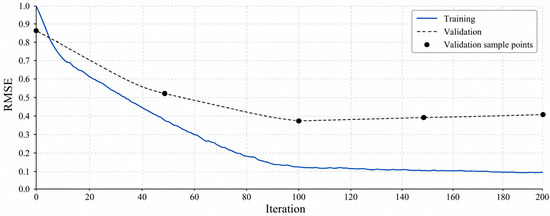
The training RMSE decreased substantially with iteration, whereas the validation RMSE remained appreciably higher (Figure 7). This divergence indicates an overfitting tendency: the model fitted the training sequence more closely than unseen validation observations. RMSE is reported here as a prediction-error metric, not as a standard deviation of replicated experimental crack measurements.
Figure 7.
Training and validation RMSE over 200 nominal iterations. The training curve continues to decrease while the validation curve remains higher and plateaus, indicating an overfitting tendency rather than evidence of strong generalization.
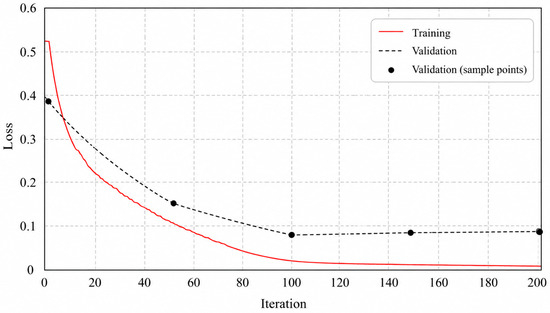
The loss curves in Figure 8 show the same pattern: training loss approaches zero while validation loss decreases more slowly and then plateaus. The widening training–validation gap after approximately 100 iterations indicates that further optimization of the training objective does not translate into comparable improvement on held-out data.
Figure 8.
Training and validation losses over 200 iterations. The training loss continues to decrease, whereas the validation loss plateaus after roughly 100 iterations; the separation between the curves indicates overfitting.
Potential strategies for reducing overfitting include a simpler network, dropout or L2 regularization, larger independent training datasets, grouped cross-validation by treatment, and early stopping based on validation loss. The original statement that early stopping was definitively implemented at iteration 100 has been removed because the displayed training curves continue to 200 iterations; instead, the plateau near 100 iterations is treated as evidence that early stopping would be appropriate in future re-training.
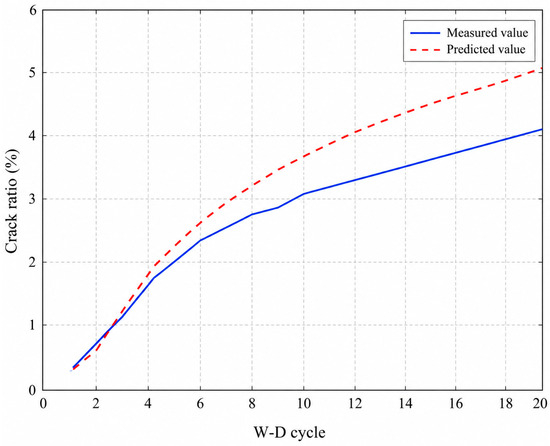
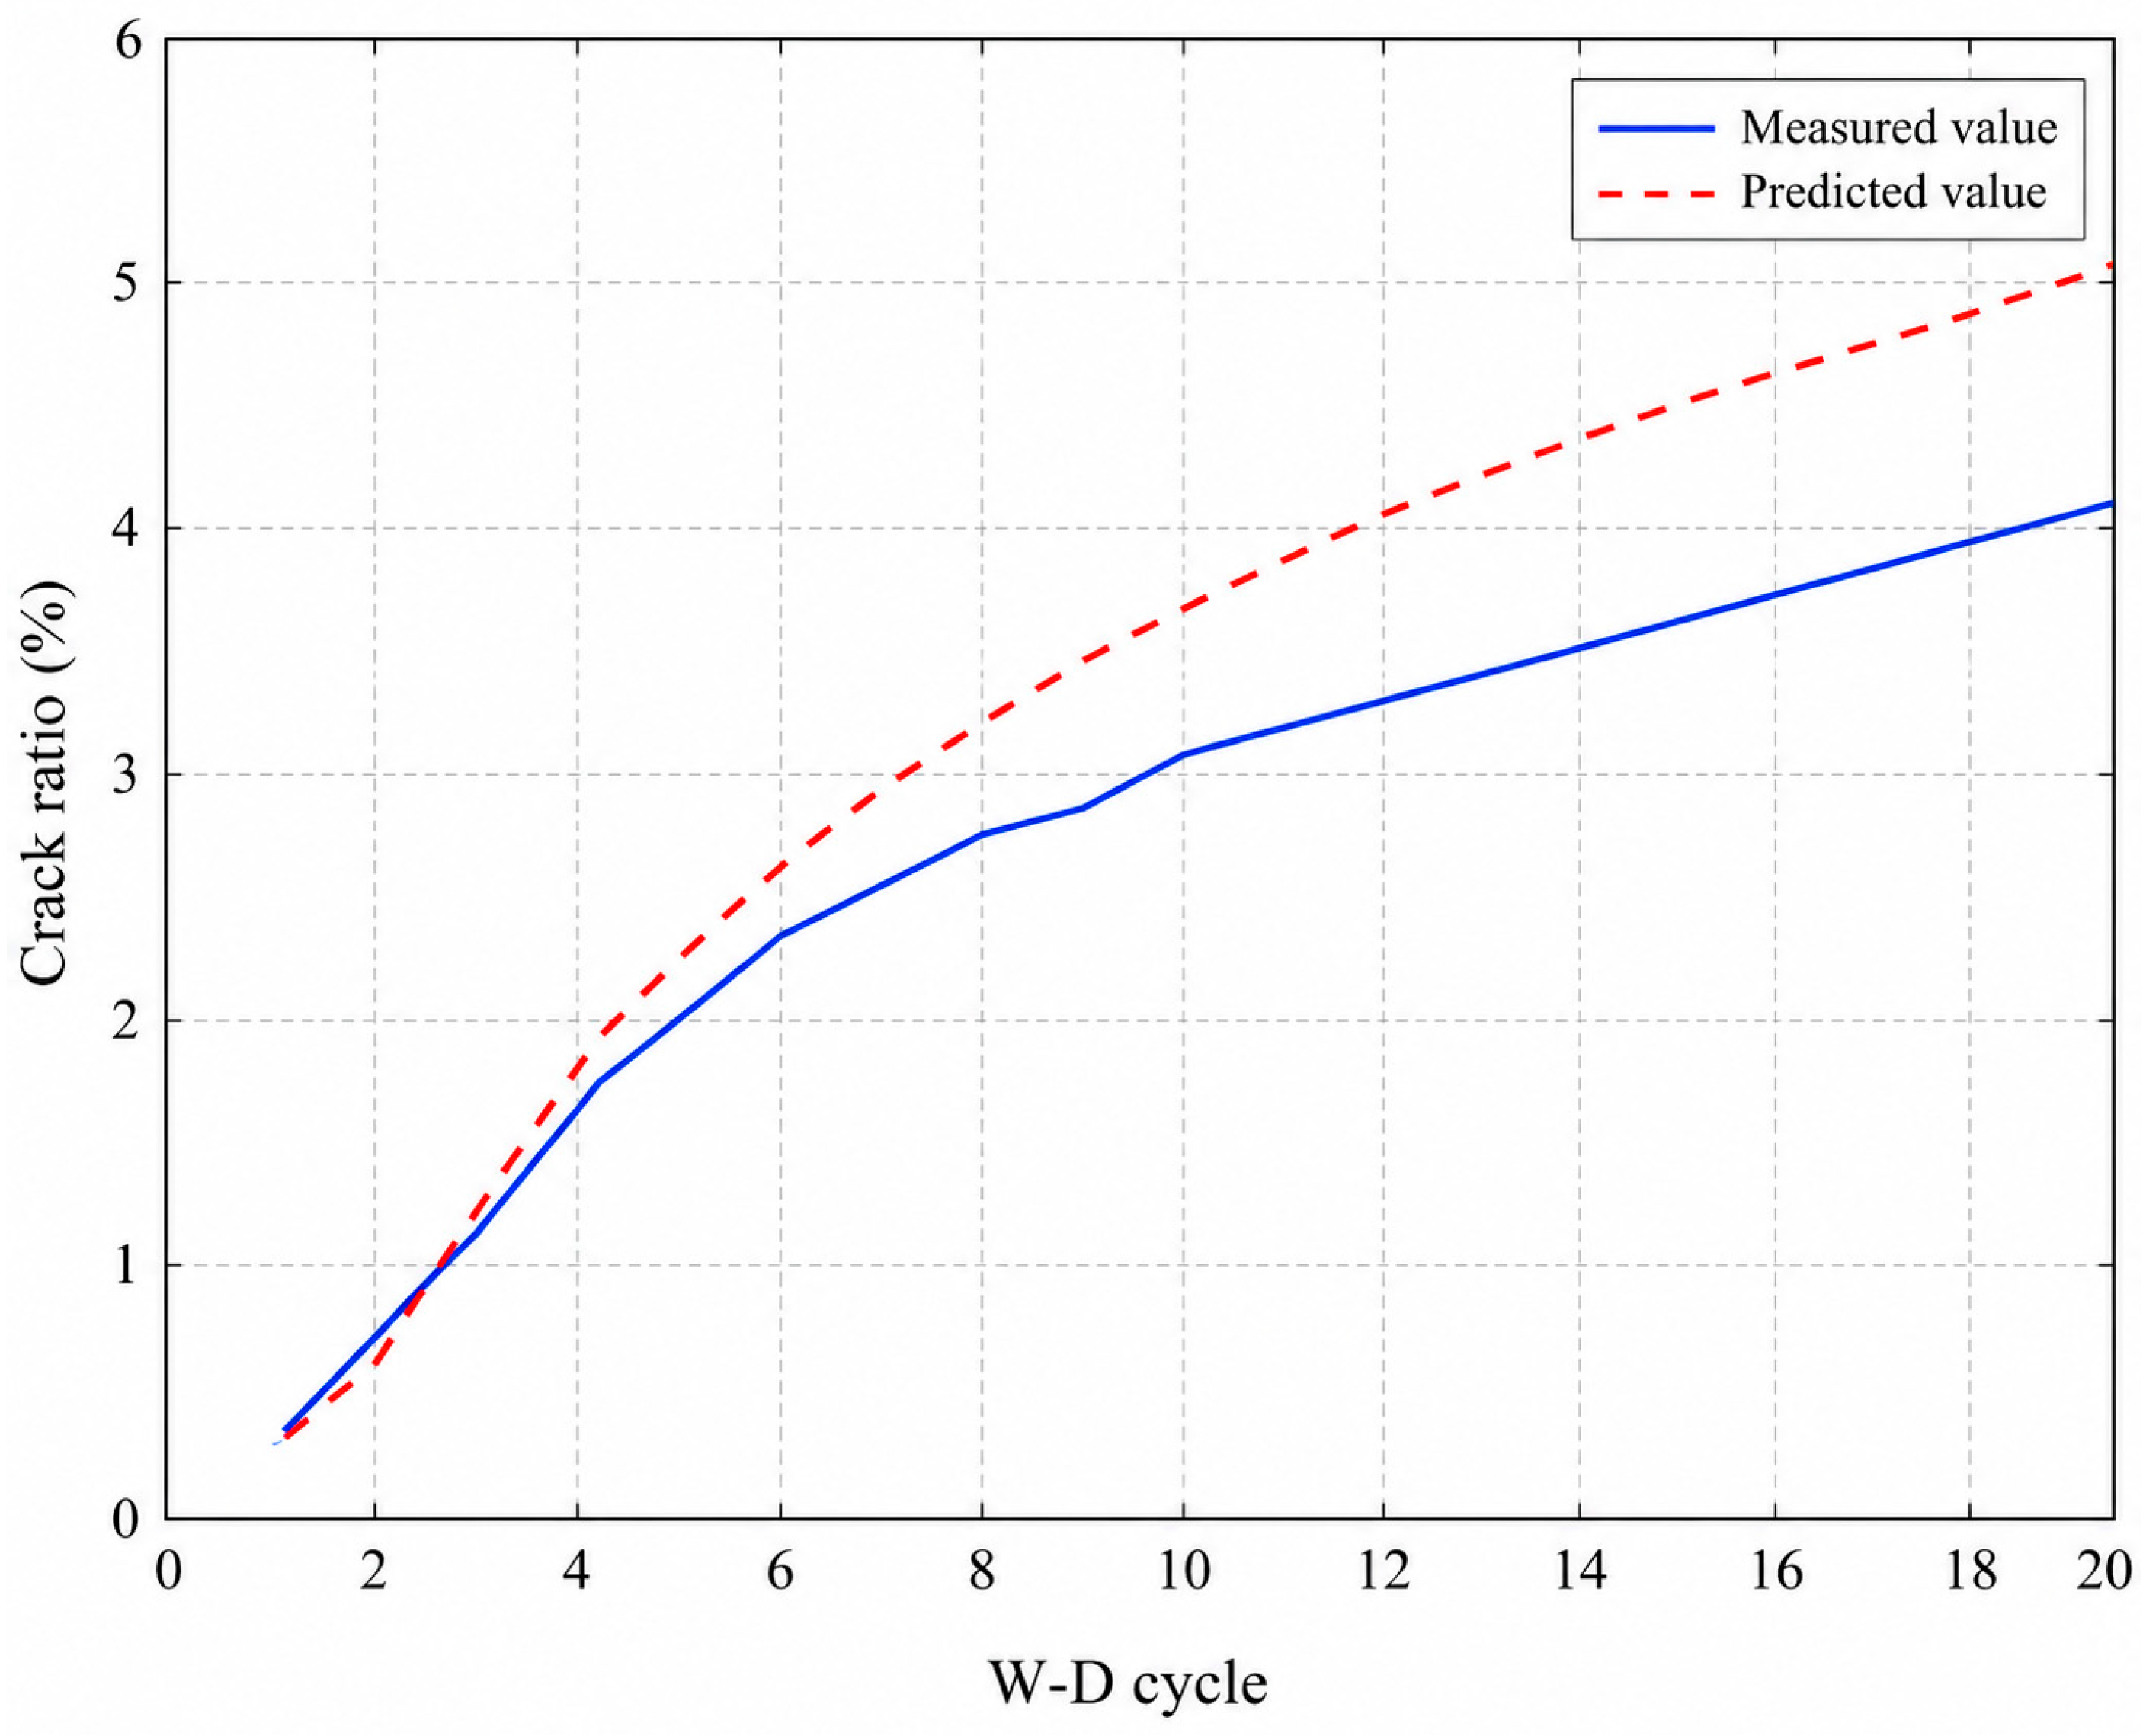
Within the evaluated dataset, the LSTM predictions followed the general measured trend with R2 = 0.927, MAE = 0.325, and RMSE = 0.478 (Figure 9). These values indicate good within-dataset fit, but they do not by themselves demonstrate external generalization. Given the training–validation divergence and incomplete archived hyperparameter record, the model should be viewed as an exploratory dynamic predictor whose transferability must be tested using independently generated specimens and field datasets.
Figure 9.
Comparison between measured and LSTM-predicted crack-ratio values across the evaluated 20-cycle sequence. Agreement is summarized by R2, MAE, and RMSE, while external generalizability is discussed separately.
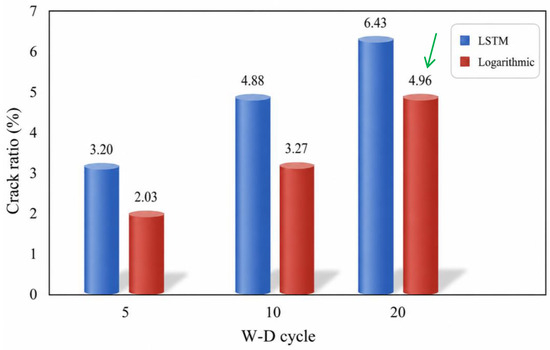
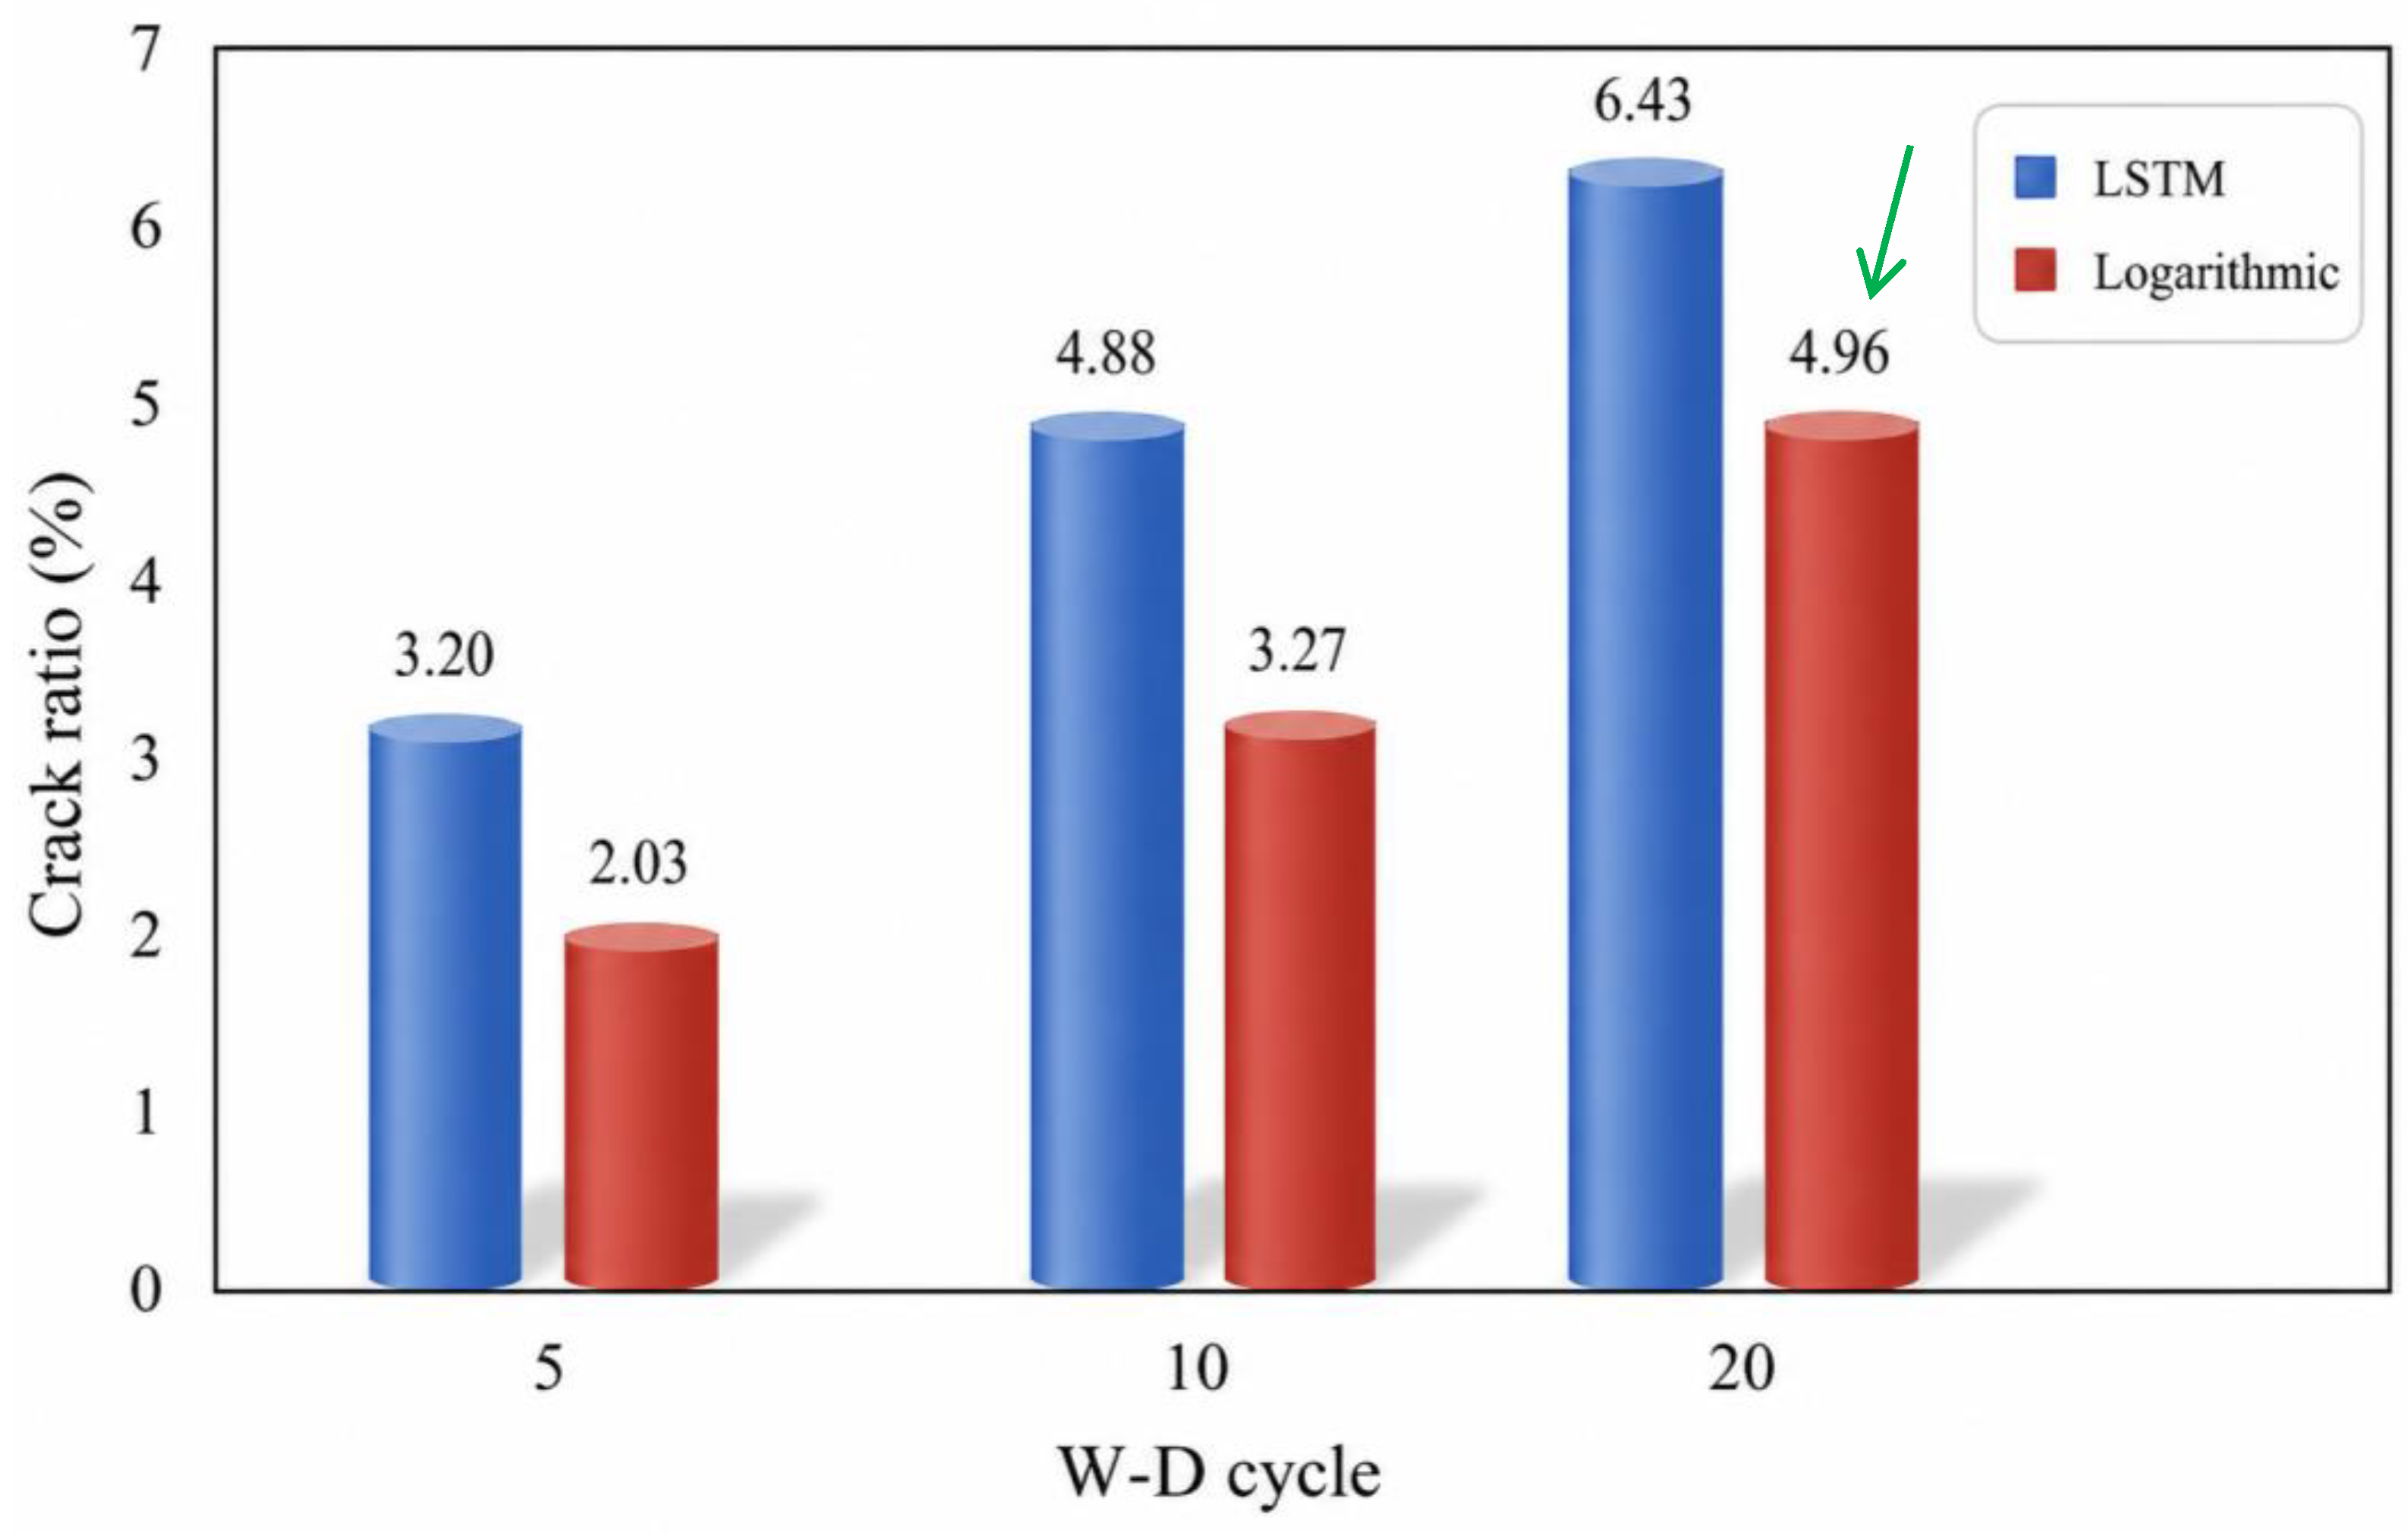
Across the 1–20-cycle range, the LSTM and logarithmic models produced broadly similar increasing trends (Figure 10), although their predicted magnitudes differed at the selected comparison checkpoints. The reported input-sensitivity ordering (cycle number > RS content > OF content) is treated as an exploratory model result rather than a causal ranking. Relative to the logarithmic expression, the LSTM can represent nonlinear dependence on preceding crack state and amendment variables, but the current overfitting evidence means this added flexibility should be interpreted cautiously.
Figure 10.
Comparison of LSTM and logarithmic-model crack-ratio predictions at three selected W-D cycle checkpoints. Values are shown above the paired bars. The green arrow highlights the logarithmic-model value at the third checkpoint (4.96%); the blue callout marks are visual annotations only, and arrow color does not encode an additional variable.
3.6. Field-Scale Application Considerations and Limitations
The laboratory results provide a basis for field-scale hypotheses rather than a validated application prescription. Before adoption, the amendment combination should be tested in pilot plots under natural rainfall and site-specific expansive-soil conditions, with simultaneous monitoring of crack formation, infiltration/runoff, sediment yield, vegetation performance, and amendment persistence. The Proctor-based laboratory compaction was used only to standardize specimen preparation and does not imply that large-scale field compaction to the same state is required. Field mixing depth, machinery demand, energy consumption, economic cost, and the carbon footprint of installation were not quantified in this study. Similarly, the laboratory data do not establish universal thresholds for slope angle, annual rainfall, crop type, amendment depth, or pilot-plot area. These variables should be determined through site-specific agronomic and geotechnical assessment. This limitation is important when translating the controlled laboratory findings to practical soil-conservation projects.
4. Conclusions
This study investigated the combined effects of OF, SRF, and RS on desiccation-crack evolution in expansive soil under repeated W-D cycling. Reanalysis of the BBD data confirmed a significant quadratic crack-ratio model (R2 = 0.952; adjusted R2 = 0.865; p = 0.008). The three linear terms were significant, whereas none of the individual pairwise interaction terms were statistically significant. The lowest observed BBD crack ratio was 1.7% for 10% OF + 0.9 kg/m3 SRF + 0.75% RS; this observation should not be interpreted as proof of a significant SRF–RS interaction. The previously identified multi-objective formulation of 10% OF + 0.6 kg/m3 SRF + 0.75% RS retained a favorable balance between root content and cracking response within the tested domain.
Crack development over 20 W-D cycles was characterized by a rapid early increase, a subsequent deceleration, and later stabilization. RS-related crack suppression is consistent with fiber bridging and stress redistribution, while OF may alter pore and water-retention characteristics; these mechanisms remain interpretations because the corresponding microstructural variables were not measured directly. The retained LSTM model achieved R2 = 0.927, MAE = 0.325, and RMSE = 0.478 within the evaluated dataset, but the training–validation gap indicated overfitting. Accordingly, the model is presented as an exploratory predictor rather than as evidence of externally validated generalization or early-warning capability.
Several limitations should be considered. First, most non-center BBD formulations were represented by one independent specimen, so treatment-specific SD/SEM/CI cannot be estimated, and the cyclic trajectories should be interpreted as repeated measurements rather than replicate means. Second, sieve analysis alone does not resolve the clay-size fraction, and particle-size distributions of the additives were not measured. Third, the experiment did not directly measure pore-structure evolution, electrical conductivity/ion migration, straw interfacial strength, runoff, sediment yield, or long-term ecological effects. Fourth, the available LSTM archive does not preserve all architecture and optimization hyperparameters, and the validation behavior indicates overfitting. Finally, field-scale cost, machinery, carbon footprint, and long-term performance remain to be validated.
Future work should prioritize independently replicated W-D tests, wet-dispersion/laser particle-size and mineralogical characterization, direct measurements of hydraulic and microstructural mechanisms, external validation and fully documented re-training of the LSTM model, and field plots that quantify runoff, sediment yield, agronomic performance, cost, and life-cycle environmental impacts.
Author Contributions
Conceptualization, Y.H. (Yonggang Huang); Methodology, Y.H. (Yanfang Huang); Writing—original draft, Y.H. (Yonggang Huang), L.L. and Y.H. (Yanfang Huang); Writing—review & editing, Y.H. (Yonggang Huang), L.L. and Y.H. (Yanfang Huang); Supervision, H.Z. and X.W.; Project administration, H.Z.; Funding acquisition, H.Z., Y.H. (Yonggang Huang), X.W., Z.X. and Y.W. All authors have read and agreed to the published version of the manuscript.
Funding
This work was supported by the Natural Science Foundation of China (Grant No. 42477143), the Guangxi Key R&D Program (Grant No. Guike AB23075184), the Joint Laboratory for Special Soil in Southwest Guangxi (Grant No. Chongke 2023ZY0504), the Guangxi Major Talent Program, the Natural Science Foundation of Hunan Province (Grant No. 2026JJ80436, 2026JJ60177), the Research Foundation of Education Bureau of Hunan Province (Grant No. 23B0732, 23B0737 and 24B0738), and the Hunan Province University Students Innovation Training Program (Grant No. S202511527057). The funding sources had no role in study design, data collection/analysis, or manuscript preparation.
Institutional Review Board Statement
Not applicable.
Informed Consent Statement
Not applicable.
Data Availability Statement
The raw data supporting the conclusions of this article will be made available by the authors on request.
Conflicts of Interest
Author Long Li was employed by the company Research and Design Institute Co., Ltd., China Academy of Railway Sciences (Shenzhen). The remaining authors declare that the research was conducted in the absence of any commercial or financial relationships that could be construed as a potential conflict of interest.
References
- Jones, L.D.; Jefferson, I. Chapter 33 Expansive soils. In ICE Manual of Geotechnical Engineering, Volume I—Geotechnical Engineering Principles, Problematic Soils and Site Investigation; Burland, J., Chapman, T., Skinner, H., Brown, M., Eds.; ICE Publishing: London, UK, 2012; pp. 413–442. [Google Scholar] [CrossRef]
- Nelson, J.D.; Chao, K.C.; Overton, D.D.; Nelson, E.J. Foundation Engineering for Expansive Soils, 1st ed.; John Wiley & Sons: Hoboken, NJ, USA, 2015. [Google Scholar] [CrossRef] [Scilit]
- Zhao, Y.; Zhang, H.; Wang, G.; Yang, Y.; Ouyang, M. Development characteristics and mechanism of crack in expansive soil under wet–dry cycling. Appl. Sci. 2024, 14, 6499. [Google Scholar] [CrossRef] [Scilit]
- Liu, Y.; Zhao, Y.; Vanapalli, S.K.; Mehmood, M. Soil-water characteristic curve of expansive soils considering cumulative damage effects of wetting and drying cycles. Eng. Geol. 2024, 339, 107642. [Google Scholar] [CrossRef] [Scilit]
- Wang, S.J.; Wang, X.Q.; Li, D.; Li, X.; Liang, G.C. Evolution of fissures and soil-water characteristic curves of expansive soil under drying-wetting cycles. Chin. J. Geotech. Eng. 2021, 43, 58–63. [Google Scholar]
- Zhou, R.; Wang, B.-T.; Han, S.-Y.; Wang, D.-Y.; Zhang, F.-H. Mechanisms of crack development and strength deterioration in compacted expansive soils under controlled wetting-drying conditions. Eng. Fail. Anal. 2024, 159, 108133. [Google Scholar] [CrossRef] [Scilit]
- Dai, Z.; Guo, J.; Zhong, K.; Tong, K.; Li, S.; Huang, K.; Chen, S. Dynamic evolution of three-dimensional cracks in expansive soil under wet-dry cycles: Insights from resistivity monitoring. Bull. Eng. Geol. Environ. 2024, 83, 305. [Google Scholar] [CrossRef] [Scilit]
- Shafqat, K.; Khalid, U.; Ur Rehman, Z. Coupling effect of cyclic wet-dry environment and compaction state on desiccation cracking and mechanical behavior of low and high plastic clays. Bull. Eng. Geol. Environ. 2025, 84, 66. [Google Scholar] [CrossRef] [Scilit]
- Fu, C.L.; Zeng, Z.T.; Mo, H.Y.; Huang, L.H. Experimental Study on the Engineering Characteristics of Lime-Modified Expansive Soil. J. Guangxi Univ. (Nat. Sci. Ed.) 2019, 44, 524–533. [Google Scholar]
- Wang, D.X.; Zhang, Z.W.; Wang, X.Q.; Zhou, W.L. Pavement Performance and Micro-Mechanism of Cement-Modified Expansive Soil under Dry-Wet and Freeze-Thaw Cycles. J. Cent. South Univ. (Sci. Technol.) 2022, 53, 306–316. [Google Scholar]
- Xu, H.B.; Song, X.J.; Wang, P.; Xu, L. Experimental Study on the Strength and Deformation Characteristics of Cement-Modified Expansive Soil. South-to-North Water Transf. Water Sci. Technol. 2019, 17, 172–177. [Google Scholar]
- Shah, V.; Wanare, R.; Iyer, K.K.R.; Rotte, V.M. Evaluation of the role of fibres and admixture(s) on sustainable crack reduction in expansive soil. Mater. Today Proc. 2023. [Google Scholar] [CrossRef] [Scilit]
- Huang, Y.; Deng, P.; Wang, G.; Zhang, H. Effects of Vetiver Root on Cracking of Expansive Soils and its Mechanistic Analysis. Sci. Rep. 2024, 14, 19737. [Google Scholar] [CrossRef] [Scilit]
- Chen, D.J.; Wang, G.Y.; Ouyang, M.; Yang, Y.Q. Experimental Study on the Influence of Organic Fertilizer Application on Expansive Soil with Vetiver Grass Planting. J. China Foreign Highw. 2024. online ahead of print. Available online: http://kns.cnki.net/kcms/detail/43.1363.U.20240403.1548.002.html (accessed on 8 June 2026).
- Li, R.F.; Wang, G.Y.; Zhang, Y.J.; Huang, Y.G. Experimental Study on the Influence of Vetiver Root System Planting on the Characteristics of Expansive Soil. J. Highw. Transp. Res. Dev. 2020, 37, 43–52. [Google Scholar]
- Fu, J.L. Experimental Study on the Mechanical Characteristics of Expansive Soil Reinforced by Vetiver Root System. Master’s Thesis, Changsha University of Science and Technology, Changsha, China, 2018. [Google Scholar]
- Wang, G.Y.; Huang, Y.G.; Li, R.F.; Chang, J.M.; Fu, J.L. Influence of Vetiver Root on Strength of Expansive Soil-Experimental Study. PLoS ONE 2020, 15, e0244818. [Google Scholar] [CrossRef] [Scilit]
- Wang, G.Y.; Huang, Y.G.; Li, R.F.; Chang, J.M.; Fu, J.L. Influence of Vetiver Root System on Mechanical Performance of Expansive Soil: Experimental Studies. Adv. Civ. Eng. 2020, 2020, 2027172. [Google Scholar] [CrossRef] [Scilit]
- Xue, Z.F.; Wang, L.; Zheng, W.J. Shear Characteristics of Loess Reinforced with Agricultural Waste Straw. J. Yangtze River Sci. Res. Inst. 2020, 37, 180–186. [Google Scholar]
- GB/T 50123-2019; Standard for Geotechnical Testing Method. Ministry of Housing and Urban-Rural Development of the People’s Republic of China: Beijing, China, 2019.
- ASTM D2216-19; Standard Test Methods for Laboratory Determination of Water (Moisture) Content of Soil and Rock by Mass. ASTM International: West Conshohocken, PA, USA, 2019.
- ASTM D698-12(2021); Standard Test Methods for Laboratory Compaction Characteristics of Soil Using Standard Effort (600 kN·m/m3). ASTM International: West Conshohocken, PA, USA, 2021.
- ASTM D4318-17e1; Standard Test Methods for Liquid Limit, Plastic Limit, and Plasticity Index of Soils. West ASTM International: Conshohocken, PA, USA, 2017.
- ASTM D6913/D6913M-17(2025); Standard Test Methods for Particle-Size Distribution (Gradation) of Soils Using Sieve Analysis. ASTM International: West Conshohocken, PA, USA, 2025.
- Majid, M.A.; Mohd Hishammudin, M.A.; Abdul Hamid, N.A.; Jamellodin, Z.; Salleh, N. Tensile properties of treated and untreated paddy straw fiber using sodium hydroxide strengthened with polypropylene resin. MATEC Web Conf. 2016, 47, 01019. [Google Scholar] [CrossRef] [Scilit]
- Regent Instruments Inc. WinRHIZO Pro User Manual (v. 2023a); Regent Instruments Inc.: Quebec City, QC, Canada, 2023. [Google Scholar]
- Li, Z. Fissure Development Patterns in Qinling-Daba Mountains and Their Impact on Soil and Water Loss. Doctoral Dissertation, University of Chinese Academy of Sciences, Beijing, China, 2022. [Google Scholar]
- Morgan, R.P.C. Soil Erosion and Conservation, 3rd ed.; Blackwell Publishing: Oxford, UK, 2005. [Google Scholar]

Disclaimer/Publisher’s Note: The statements, opinions and data contained in all publications are solely those of the individual author(s) and contributor(s) and not of MDPI and/or the editor(s). MDPI and/or the editor(s) disclaim responsibility for any injury to people or property resulting from any ideas, methods, instructions or products referred to in the content. |
© 2026 by the authors. Licensee MDPI, Basel, Switzerland. This article is an open access article distributed under the terms and conditions of the Creative Commons Attribution (CC BY) license.