


Abstract
Reservoir landslides pose a persistent threat to the safe operation of hydropower projects, particularly where altered rock masses within water-level fluctuation zones undergo repeated wetting–drying and seepage-induced deterioration. This study investigates the mechanical behavior and long-term strength evolution of altered granite from the Guobu Slope near the Laxiwa Arch Dam in Qinghai, China. Rock masses with four alteration degrees, ranging from complete to slight alteration, were examined through an integrated experimental program involving torsional shear tests, hydro-mechanical coupled triaxial tests, large-scale direct shear and ring shear tests, Brazilian splitting tests, and long-term P-wave velocity monitoring. The results demonstrate that increasing water content progressively weakens the shear strength of altered granite, while elevated seepage pressure further reduces its strength and deformation resistance under hydro-mechanical coupling. Residual shear behavior also shows a clear dependence on water content, indicating that post-peak strength deterioration should be considered in slope stability assessment. Long-term P-wave monitoring further reveals that mechanical degradation is more pronounced during the early stage and gradually approaches a relatively stable state, suggesting a site-specific decelerating deterioration process rather than unlimited strength loss. Based on the experimental results, empirical relationships between shear-strength parameters and water content are established, and long-term lower-bound strength parameters are proposed for altered granite with different degrees of alteration. These findings provide experimental support for understanding the hydro-mechanical deterioration and long-term deformation behavior of reservoir-bank altered rock masses and offer a basis for parameter selection and stability assessment when combined with rock-mass reduction, field calibration, and sensitivity analysis.
1. Introduction
Large-scale reservoir landslides represent one of the most catastrophic geological hazards in hydropower engineering, with their sudden occurrence being capable of generating destructive impulse waves that threaten dam safety and cause significant loss of life and property downstream [1,2,3]. The Vajont Landslide of 1963 remains a somber reminder of this, where a 200 m long slope failed and slid into the Vajont Reservoir, generated a 250 m surge, resulting in over 2000 fatalities. More recently, reservoir-induced slope instabilities have been widely documented worldwide, including the Clyde Reservoir in New Zealand, the Gepatsch Reservoir in Austria, the Canelles Reservoir in Spain, and numerous cases in the Three Gorges Reservoir in China, where more than 5000 landslides or potential landslides have been identified [4,5]. Among these, altered rock masses within the water-level fluctuation zone are of particular concern, as their mechanical properties are highly sensitive to hydrological variations, and their progressive degradation can drive long-term slope creep or even catastrophic failure. Understanding how alteration degree, water content, and seepage pressure influence the strength and deformation behaviors of such rocks is therefore essential for reservoir slope stability assessment and risk mitigation [6,7].
Extensive research has been devoted to understanding the mechanisms of reservoir landslides and the factors controlling their initiation and evolution. From the perspective of triggering mechanisms, water level fluctuations and rainfall have been recognized as the two dominant external factors affecting reservoir slope stability. Dong et al. (2025) [8] systematically analyzed the combined effects of water level changes and rainfall, showing that landslide deformation sensitivity decreases with repeated water level fluctuations but can be reactivated by heavy rainfall events. Sun et al. (2023) [9] employed the combined finite-discrete element method to simulate reservoir slope behavior under fluctuating water levels, revealing that dynamic water pressure during drawdown significantly reduces slope stability. Lu et al. (2026) [2] investigated the Tanjiahe Landslide in the Three Gorges Reservoir of China using field monitoring and discrete element simulations, demonstrating that permeability contrasts between surface and deep layers governed the landslide’s response to water level changes. Moreover, the water–rock interaction mechanism has been recognized as a key factor in the long-term evolution of reservoir landslides, where the periodic rise and fall of reservoir water levels causes cumulative damage to rock masses through cycles of wetting, drying, and seepage erosion (Jaakson, 2010) [10].
A substantial body of experimental work has quantified the effects of wetting–drying cycles on rock mechanical properties, primarily in sedimentary rocks such as sandstone and mudstone. Wang et al. (2023) [11] performed triaxial compression tests on jointed sandstone subjected to 20 dry–wet cycles and found that the peak strength and elastic modulus decreased progressively with increasing cycle number, with the deterioration of intact rock being more pronounced than that of jointed rock. Similarly, studies on red sandstone revealed that P-wave velocity, peak strength, elastic modulus, internal friction angle, and cohesion all decrease with increasing dry–wet cycles, while the microstructural integrity is severely damaged, with interstitial fillers dissolved over large areas after 15 cycles (Dong et al., 2023) [12]. For granite, shear creep tests under dry–wet cycling conducted by researchers showed that creep deformation gradually increases with cycle number while creep failure stress, creep duration, and long-term strength decrease significantly, and a variable-parameter creep damage model was proposed to account for the effects of cycling [13,14]. Beyond cyclic wetting–drying, hydro-mechanical coupling under sustained seepage pressure has also received attention. Wang et al. (2025) [13] conducted a series of triaxial compression, unloading, and cyclic loading–unloading tests to examine the effects of stress path and seepage pressure on rock deformation, strength, and permeability, and proposed a statistical damage model that captures the compaction stage. Jiang et al. (2021) [15] proposed a damage model accounting for seepage pressure effects, which has been successfully applied to deep rock structures. For altered granite specifically, recent studies have begun to address its unique characteristics. Dong et al. (2025) [8] investigated the alteration mechanism, degree classification, and mechanical parameters of altered granite using field testing, thin section identification, and X-ray diffraction, revealing that the main alteration mechanisms are chloritization of biotite and clayization of feldspar minerals, and that bulk density, elastic modulus, cohesion, and internal friction angle decrease with increasing alteration degree. Ibroximovich (2026) [16] examined the engineering geological characteristics of altered granite in Hunan Province of China and found that hydrothermal alteration induces significant changes in mineral composition and physico-mechanical properties, with strongly weathered granite exhibiting considerable mechanical deterioration. Lu et al. (2026) [17] conducted large-scale direct shear tests on strongly altered granite under five water content levels, revealing a dual degradation mechanism involving pore water pressure and weakened mineral cementation, and found that shear strength peaks at 10% water content. However, these studies have predominantly focused on either individual aspects of alteration or single testing methods. A systematic experimental framework integrating multiple testing approaches (shear, triaxial, direct shear, ring shear, and P-wave velocity monitoring) to characterize the complete strength degradation process of altered granite under varying water content and seepage pressure conditions remains lacking.
Numerical simulation approaches have also been extensively applied to reservoir landslide analysis [18,19,20,21]. The discrete element method (DEM) and combined finite-discrete element method (FEM/DEM) have been successfully employed to simulate slope failure processes and P-wave generation. Sun et al. (2023) [9] demonstrated the capability of the combined FEM/DEM in capturing the progressive failure of reservoir slopes under fluctuating water levels. Lu et al. (2026) [2] used the MatDEM system to simulate the failure motion of the Tanjiahe Landslide of China, revealing a typical thrust load-caused failure mechanism where the upper part slides first and pushes the lower part. Hybrid DEM-SPH methods have also been developed to model landslide-generated impulse waves throughout their entire lifecycle. Nevertheless, the accuracy and reliability of numerical predictions are fundamentally dependent on the input mechanical parameters, yet systematic experimental data on the mechanical properties of altered granite under reservoir operating conditions remain scarce. The long-term strength parameters essential for predicting slope behavior over engineering timescales (decades to centuries) are particularly lacking [18,22].
Despite significant advances in understanding reservoir landslide mechanisms, several critical knowledge gaps persist. Firstly, the mechanical behavior of altered granite under the coupled effects of varying water content and sustained seepage pressure has not been systematically characterized. Secondly, although the short-term effects of water content on rock strength have been documented, the long-term degradation trend, specifically whether strength deterioration continues indefinitely or stabilizes over time, remains unresolved. Thirdly, comprehensive experimental data integrating multiple testing methods to establish reliable strength parameters for different alteration degrees are urgently needed for engineering design. Guobu Slope at the Laxiwa Reservoir in China provides an ideal natural laboratory to address these gaps, as this large-scale slope has undergone continuous deformation since reservoir impoundment in 2009, with a maximum displacement reaching 45.0 m and a deformed volume exceeding 10.0 × 10⁶ m3. Furthermore, extensive field investigations and adit excavations have revealed four distinct degrees of alteration in granite on the hanging wall of the Laxiwa Fault (F2), thereby offering unique opportunities for systematic sampling and testing.
To address the aforementioned gaps, the present study aims to comprehensively characterize the physical and mechanical properties of altered granite with different alteration degrees through a multi-method experimental program. Specifically, the effects of water content and seepage pressure on shear strength, deformation modulus, and failure behavior are quantified, and empirical relationships between strength parameters and water content are subsequently established. Meanwhile, the long-term degradation trend of altered granite is investigated via multi-temporal P-wave velocity monitoring, allowing assessment of whether strength deterioration stabilizes over engineering timescales. Based on these experimental results, long-term strength parameters are proposed for engineering applications. Consequently, the findings are expected to provide essential experimental data for understanding the long-term deformation behavior of Guobu Slope at the Laxiwa Reservoir in China, as well as to offer practical reference values for stability assessments of similar reservoir slopes under long-term hydrological cycling.
2. Environment Setting
2.1. Geomorphological Conditions
Guobu Slope at the Laxiwa Reservoir in China is located on the right bank of the Yellow River, approximately 800–1700 m upstream of the Laxiwa Arch Dam (Figure 1). The slope exhibits a planar NE30° orientation and a gradient ranging from 33° to 47°, with local steep sections reaching 50°. Before impoundment, the river water level in front of the slope ranged between 2254 m and 2257 m, whereas the designed normal reservoir water level is 2452 m. The slope is composed of six gullies (Shuangshu Gully, Huanghua Gully, and Gullies No. 1–4 from upstream to downstream) and six ridges (Shuanghuang Ridge and Ridges No. 1–5 from upstream to downstream). The Guobu platform, with an elevation of 2930–2950 m, sits approximately 700 m above the original riverbed and forms an isosceles-triangular shape extending 850 m in the river’s direction with a maximum width of 300 m. A steep scarp (LF1 fault) delimits the rear edge of the platform.
Figure 1.
Overall view: (a) Guobu Slope’s location; (b) grouping isodensity diagram of the fault structure plan; (c) steep scarp formed by fault (Lf1) located at the rear edge of slope.
2.2. Regional Fault Systems
Two major faults control the geological structure of Guobu Slope: the Laxiwa Fault (F2) and the LF1 fault (Figure 1c). The Laxiwa Fault (F2) is an NNW-striking subregional fault extending approximately 20 km, separating the Lower Triassic metamorphosed sandstone and slate (upstream) from the Indosinian granite (downstream). The fault zone is 20–30 m wide, with an influence zone extending to 100 m, and its overall attitude is NW330–345°/NE60–70°. Thermoluminescence dating gives an age of 243 ± 19 ka, indicating no activity since the late Pleistocene. The fault initially acted as a reverse fault and later evolved into a right-lateral strike-slip fault, generating numerous secondary faults and joints with similar orientations within the downstream granite body. This structural damage significantly enhanced subsequent weathering, unloading, and slope deformation. The LF1 fault emerges at the slope top and forms the rear boundary of Guobu Slope, creating a continuous scarp 30 m high and 850 m long. Its overall attitude is NE20°/NW75°, and it extends downslope to approximately 2700 m elevation without intersecting the gently dipping fault Hf104. After reservoir impoundment, the scarp exhibited fresh scratch marks, indicating ongoing subsidence of the Guobu platform.
2.3. Definition and Spatial Distribution of Altered Granite
Altered granite is predominantly distributed on the hanging wall of the Laxiwa Fault, i.e., the downstream side of F2, covering the lower parts of Ridges No. 4 and No. 5 and extending beneath the Shuanghuang Ridge and Shuangshu Gully. Field surveys along the left and right banks of the river, as well as along the Shuanghuang Ridge and Shuangshu Gully, have delineated a distinct alteration boundary. This boundary strikes NNW (NW315–345°) and dips NE at 45–65° (Figure 1c). Below this boundary, granite exhibits significant hydrothermal alteration characterized by red to brick-red discoloration, mineral alteration (chloritization of biotite and clayization of feldspar), and a notable decrease in hardness and intactness.
The three-dimensional spatial distribution of the altered granite was further constrained by adit and borehole investigations. The contact between altered and unaltered granite was identified in the PD10-5 adit at chainage 0 + 325 m, in the PD10-7 adit at chainage 0 + 250 m, and in the borehole ZK15 at a depth of 122.7 m. Based on these constraints, the total volume of altered granite below the ground surface is calculated to be 113.44 × 10⁶ m3. Within this volume, 28.98 × 10⁶ m3 lies within the deformed zone (including 20.23 × 10⁶ m3 below the normal water level of 2452 m), while the remaining 84.46 × 10⁶ m3 belongs to the stable zone.
2.4. Classification of Alteration Degrees
Based on macroscopic field identification, including color, texture, hammer sound, and drillability, and supported by thin-section petrography, the altered granite is classified into four degrees: complete alteration, strong alteration, weak alteration, and slight alteration. Their typical characteristics are summarized in Figure 2. The proportions of each alteration degree encountered in the adits (with a total statistical length of 557 m) are as follows: complete alteration accounts for 10.2%, strong alteration for 26.2%, weak alteration for 57.5%, and slight alteration for 6.1%. Complete alteration is characterized by a grayish white to reddish brown color, a fragmented to granular texture, a dull hammer sound, and being crushable by hand. Strong alteration is characterized by a brick-red color, a fragmented to blocky texture, a dull, soft sound, and breaking easily with a pick. Weak alteration is characterized by a light red to grayish red color, a blocky to fragmented texture, and a dull but relatively hard sound. Slight alteration is characterized by a grayish black to fresh gray color, a blocky texture, and a clear, crisp hammer sound. Importantly, these four alteration degrees do not form regular layers; instead, they occur as nested lenses, pods, or patches that cross-cut each other, indicating a complex hydrothermal alteration history.
Figure 2.
Characteristics and distribution of altered rocks.
2.5. Sampling and Basic Physical Properties
Rock block samples for laboratory testing were collected from several adits and boreholes. The PD10-5 adit (elevation approximately 2470 m) provided samples from chainage 0 + 323 to 0 + 595 m, representing strong to weak alteration, while the PD10-7 adit (elevation approximately 2470 m) supplied complete to strong alteration samples from chainage 0 + 000 to 0 + 250 m. The ZK14 borehole, drilled from the PD10-5 adit, recovered cores from depths of 0–250.5 m covering all alteration degrees, and the ZK15 borehole, drilled from the PD10-6 adit, provided weak to slight alteration samples from depths of 0–250.2 m. All samples were sealed immediately after collection to preserve their natural water content, then transported to the laboratory for specimen preparation.
Following sample preparation, basic physical properties, including density, water content, specific gravity, porosity, and grain size distribution, were measured for each alteration degree. Representative values are listed in Table 1, and the grain-size distribution curve for strongly altered granite is shown in Figure 3. The results show that, with an increasing alteration degree, dry density and specific gravity decrease, while water content and porosity increase markedly. The strongly altered granite exhibits a well-graded gravelly sand texture with a fines content (particles < 0.075 mm) of approximately 17–23%.
Table 1.
Basic physical properties of altered granite (average values).
Figure 3.
Grain gradation curves of strongly altered rocks.
The baseline physical properties in Table 1 provide representative characteristics for material classification and comparison among alteration degrees. These baseline values are not treated as an additional loading condition in the controlled mechanical tests. The subsequent testing program was designed to isolate the effects of prescribed water content, confining pressure, and seepage pressure. Complete alteration occurs predominantly as fragmented to granular material and is represented in this study mainly through field classification and P-wave velocity monitoring. The baseline properties summarized in Table 1 therefore correspond to the alteration categories for which representative standard laboratory specimens were used in the mechanical characterization. The grain-size distribution shown in Figure 3 is included as part of the routine geotechnical characterization of the granular material obtained from strongly altered granite. It is used to describe the overall grading and fines content of the material and is not used directly to derive the mechanical parameters reported in the subsequent tests.
3. Materials and Testing Methods
3.1. Sampling and Basic Physical Properties
Based on the classification of alteration degrees established in Section 2.4, rock blocks and drill cores representing complete alteration (CA), strong alteration (SA), weak alteration (WA), and slight alteration (SLA) were selected for specimen preparation. Block samples collected from the PD10-5 and PD10-7 adits were first trimmed to remove weathered surfaces and then cored, cut, and ground into standard cylindrical specimens following the International Society for Rock Mechanics (ISRM)-suggested methods. For hollow torsional shear tests, hollow cylindrical specimens with an outer diameter of 60 mm, an inner diameter of 30 mm, and a height of 120 mm were prepared. For conventional triaxial tests, solid cylindrical specimens of 50 mm diameter and 100 mm height were used. For large-scale direct shear and ring shear tests, the natural granular materials obtained from crushing the strongly altered rock blocks were compacted to a target dry density of 1.65–1.70 g/cm3, which corresponds to the in situ density measured in the field. For Brazilian splitting tests, disk specimens with a 50 mm diameter and 25 mm thickness were prepared. All specimens were oven-dried at 105 °C for 24 h to reach the dry state, and then vacuum-saturated for 48 h to achieve full saturation. For tests requiring specific water contents (6%, 8%, 10%, 12%), the specimens were placed in a humidity-controlled chamber until the target water content was reached, with continuous weighing to monitor moisture gain.
The water-content range was selected to represent progressive wetting of strongly altered granite under engineering-relevant conditions. The highest target water content of 12% is close to the 13.6% natural water content measured at an in situ seepage point and used in the ring shear tests, whereas 6%, 8%, 10%, and 12% represent gradually increasing water-content states for sensitivity analysis. The seepage pressures of 0.3, 0.6, and 0.9 MPa correspond approximately to hydraulic heads of 30, 60, and 90 m, respectively. These three levels were used to define low-, intermediate-, and high-seepage-pressure conditions within an engineering-relevant range.
3.2. Shear Tests Under Different Water Contents
To comprehensively evaluate the effect of water content on the shear strength of strongly altered granite, three types of shear tests were conducted: hollow torsional shear tests for peak strength under consolidated-undrained conditions, large-scale direct shear tests for peak strength under drained conditions, and large-scale ring shear tests for residual strength after large displacement. Hollow torsional shear tests were performed using a hollow cylinder apparatus (HCA) under four target water contents (6%, 8%, 10%, and 12%). For each water content, four independent specimens were subjected to confining pressures of 50, 100, 150, and 200 kPa, respectively, to establish the strength envelope; these four specimens were not parallel repetitions under the same stress condition. After isotropic consolidation, shearing was applied at a constant loading rate of 0.1 mm/min, with pore-water pressure monitored throughout. Each deviatoric stress–axial strain curve in Figure 4 therefore represents the response of one independent specimen under a specific confining pressure. The failure criterion was taken as the peak deviatoric stress or the stress at 15% axial strain, whichever occurred first. The cohesion c and internal friction angle φ were derived from the Mohr–Coulomb failure envelope in terms of total stress. The total-stress strength parameters obtained from these tests are denoted in the text as cu and φu. Because the four specimens at a given water content correspond to different stress paths, calculating standard deviations, error bars, or confidence intervals for a single stress–strain curve would not have direct statistical meaning. The reliability of the data was evaluated from the consistency of trends across stress levels and from the fitted strength envelopes. The typical stress–strain curves and strength envelopes are presented in Figure 4 and Figure 5, respectively. In Figure 4, the plotted stress quantity corresponds to the axial deviatoric stress, q = σ1 − σ3. The hollow cylinder apparatus was used as the loading system; however, no torsional loading was applied in this test series. The tests are therefore interpreted as consolidated-undrained axial compression tests on hollow cylindrical specimens. For the hollow-cylinder tests, the drainage boundary was kept closed during axial loading, and pore-water pressure was monitored continuously. The consolidated-undrained condition was therefore defined primarily by the hydraulic boundary condition rather than by the loading rate alone. The axial loading rate of 0.1 mm/min was adopted to maintain a stable quasi-static loading process and continuous data acquisition. Pore-water pressure was monitored as test–control information during undrained loading. Because the strength envelopes are reported in terms of total stress, the pore-water-pressure records are not used directly to derive the reported cohesion and friction angle. The present analysis therefore focuses on the total-stress response and the corresponding strength envelopes. The applied confining pressures used to construct the strength envelopes were 50, 100, 150, and 200 kPa.
Figure 4.
Hollow torsional shear deviation–axial strain curve: (a) 6% moisture content; (b) 8% moisture content; (c) 10% moisture content; (d) 12% moisture content.
Figure 5.
Consolidated non-draining strength envelope: (a) 6% moisture content; (b) 8% moisture content; (c) 10% moisture content; (d) 12% moisture content.
Large-scale direct shear tests were conducted using a digital direct shear apparatus with a shear box of 300 mm × 300 mm × 200 mm. The granular material was compacted to a dry density of 1.68 g/cm3 and adjusted to water contents of 6%, 8%, 10%, and 12%. For each water content, four independent specimens were sheared under normal stresses of 200, 400, 600, and 800 kPa, respectively; these specimens were used to establish the drained peak-strength envelope and were not parallel repetitions under the same normal stress. Each shear stress–shear displacement curve in Figure 6 represents one specimen under a specific normal stress. Shearing proceeded at a constant displacement rate of 1 mm/min until a shear displacement of 15 mm was reached. The displacement rate of 1 mm/min is reported as the operational loading condition of the large-scale direct-shear test. The resulting parameters are interpreted as peak-strength parameters obtained under the corresponding direct-shear boundary conditions, rather than as an independent quantitative verification of complete pore-pressure dissipation. The horizontal deformation variable presented in Figure 6 is referred to in the text as shear displacement.
Figure 6.
Large direct shear stress–shear displacement curves: (a) 6% moisture content; (b) 8% moisture content; (c) 10% moisture content; (d) 12% moisture content.
The peak shear strength was taken as the maximum shear stress observed, and the c′ and φ′ values were obtained by linear regression of the peak strength–normal stress relationship. The shear stress–shear displacement curves and peak strength envelopes are plotted in Figure 6 and Figure 7, respectively, and the variation in c and φ with water content is plotted in Figure 8. Large-scale ring shear tests were performed using a Bromhead-type ring shear apparatus to determine the residual strength under large-displacement conditions. Specimens were prepared at water contents of 6%, 8%, 10%, 12%, and an additional 13.6%, representing the natural water content of an in situ seepage point. Under normal stresses of 200–800 kPa, the specimens were sheared at a constant rotation speed of 1°/min until the shear stress reached a stable residual value. The residual c and φ values are summarized in Table 2. The total-stress strength parameters obtained from the consolidated-undrained hollow-cylinder tests are denoted in the text as cu and φu, whereas the parameters obtained from the large-scale direct-shear tests are denoted as c′ and φ′. The symbols distinguish the test origins and boundary conditions of the two parameter sets.
Figure 7.
Large direct shear peak strength–normal stress relationship: (a) 6% moisture content; (b) 8% moisture content; (c) 10% moisture content; (d) 12% moisture content.
Figure 8.
Curve of shear strength parameter change with moisture content: (a) the cohesion of the strong altered rock with moisture content in the direct shear test; (b) the friction angle with moisture content in the direct shear test of strongly altered rock.
Table 2.
Residual shear strength parameters of strongly altered granite from ring shear tests.
In this testing program, the hollow torsional shear test characterizes material-scale peak response under consolidated-undrained conditions, the large-scale direct shear test characterizes drained peak strength, the ring shear test characterizes stable residual strength after large displacement, and the hydro-mechanical triaxial test characterizes saturated and consolidated behavior under controlled confining and seepage pressures. The different specimen sizes, drainage paths, and stress boundaries influence pore-pressure dissipation, particle interlocking, and the absolute values of the derived parameters. Therefore, comparisons among different devices are used mainly to identify common variation trends. In this study, ‘pore-water pressure’ refers to the pressure monitored within the specimen during the consolidated-undrained hollow-cylinder tests, whereas ‘seepage pressure’ refers to the externally prescribed hydraulic pressure applied during the hydro-mechanical triaxial tests.
3.3. Hydro-Mechanical Coupled Triaxial Tests
To evaluate the combined effects of confining pressure and seepage pressure on the deformation and strength of altered granite, a series of triaxial compression tests were performed using a rock mechanics servo-controlled testing system equipped with a pore pressure control unit. Two sets of specimens were tested: strong-to-medium altered granite (SA-MA) and weak-to-medium altered granite (WA-MA). For each set, three confining pressures (4, 6, and 8 MPa) and three seepage pressures (0.3, 0.6, and 0.9 MPa) were applied, resulting in nine testing conditions. The specimens were first saturated by applying a back pressure while monitoring the Skempton B-value until B ≥ 0.95. Then, the confining pressure and seepage pressure were increased to the target values, and the specimens were consolidated before axial loading. For the hydro-mechanical triaxial tests, the specimens were saturated and consolidated before axial loading, and the prescribed seepage pressure was maintained during loading. These tests are therefore interpreted as triaxial compression tests under controlled seepage-pressure boundary conditions. Axial loading was applied at a constant displacement rate of 0.02 mm/min until failure while the confining pressure and seepage pressure were controlled. The 0.02 mm/min displacement rate was adopted as an operational quasi-static loading condition for stable stress–strain measurement under the prescribed hydraulic boundary. During the test, axial stress, axial strain, and volumetric strain were recorded continuously. Each stress–strain curve in Figure 9 and Figure 10 represents one independent specimen tested under a specific combination of confining pressure and seepage pressure. For the interpretation of Figure 9 and Figure 10, the stress ordinate corresponds to axial deviatoric stress and is expressed in MPa. The term ‘osmotic pressure’ appearing in the plotted panels refers to the externally controlled seepage pressure applied during the hydro-mechanical triaxial tests. From the data, the peak strength, yield strength, elastic modulus, deformation modulus, and Poisson’s ratio were determined for each condition. Peak strength was defined as the maximum axial deviatoric stress, qpeak = (σ1 − σ3)max, recorded before the post-peak stress reduction. Figure 9 and Figure 10 present the overall stress–strain response and the associated axial, hoop, and volumetric strain components, whereas the precise derived mechanical parameters for each test condition are summarized in Table 3 and Table 4. The deformation modulus represents the static modulus derived from the axial stress–strain response of the corresponding compression test. The stress–strain curves for SA-MA and WA-MA are shown in Figure 9 and Figure 10, respectively, and the derived mechanical parameters are summarized in Table 3 and Table 4.
Figure 9.
Three-axial stress–strain curve of strong altered rock (confining pressure–osmotic pressure): (a) 4 MPa–0.3 MPa; (b) 6 MPa–0.3 MPa; (c) 8 MPa–0.3 MPa; (d) 4 MPa–0.6 MPa; (e) 6 MPa–0.6 MPa; (f) 8 MPa–0.6 MPa; (g) 4 MPa–0.9 MPa; (h) 6 MPa–0.9 MPa; (i) 8 MPa–0.9 MPa.
Figure 10.
Three-axial stress–strain curve of weak altered rock (confining pressure–osmotic pressure): (a) 4 MPa–0.3 MPa; (b) 6 MPa–0.3 MPa; (c) 8 MPa–0.3 MPa; (d) 4 MPa–0.6 MPa; (e) 6 MPa–0.6 MPa; (f) 8 MPa–0.6 MPa; (g) 4 MPa–0.9 MPa; (h) 6 MPa–0.9 MPa; (i) 8 MPa–0.9 MPa.
Table 3.
Triaxial mechanical parameters of altered granite under different confining and seepage pressures for strong-to-medium altered granite (SA-MA).
Table 4.
Triaxial mechanical parameters of altered granite under different confining and seepage pressures for weak-to-medium altered granite (WA-MA).
3.4. Tensile Strength Test
The tensile strength of strongly altered granite was measured using the Brazilian splitting method. All Brazilian splitting specimens used in this test series were prepared from strongly altered granite. Disk specimens with a 50 mm diameter and 25 mm thickness were prepared under two water-content conditions: dry (0% water content) and 0.37% water content. Three specimens were tested for each condition. The test was performed using a servo-controlled compression machine with a loading rate of 0.5 mm/min. The load and displacement were recorded continuously until the specimen failed by splitting along the diametral plane. The tensile strength was calculated using the Brazilian formula σt = 2P/(πDt), where P is the peak load, D is the disk diameter, and t is the disk thickness. The labels GB-Q1, GB-R1, GB-Q2, and GB-R2 are specimen identification codes used in this study. GB denotes the Guobu sampling site, whereas the remaining letters and numbers distinguish individual specimens.
3.5. Long-Term P-Wave Velocity Monitoring
To investigate the long-term degradation trend of altered granite, seismic wave velocity measurements were conducted along the adit walls at multiple time points between 2010 and 2024. The tests were performed using a seismograph with a 24-channel geophone array. For each measurement, a hammer source was used to generate seismic waves, and the first arrival times of P-waves were recorded at 1 m intervals along the adit walls. The P-wave velocity Vp was calculated as the distance between source and receiver divided by the travel time. Measurements were repeated at six time points: 2010, 2013, 2014, 2015, 2017, and 2024. Based on the alteration degree classification, the P-wave velocity data were grouped into four categories: complete alteration, strong alteration, weak alteration, and slight alteration. For each category, the mean, median, and lower quartile velocities were calculated and plotted against time to reveal the degradation trend. In Figure 11, the three statistical series correspond to the mean, median, and lower-quartile P-wave velocities, respectively. The term ‘median’ refers to the median value of the measured P-wave velocity distribution for the corresponding alteration category and monitoring campaign. The exponential function is used as a descriptive representation of the observed decelerating trend within the available monitoring period. Because the exponential function is asymptotic by definition, the fitted asymptote should not be interpreted as independent proof of a unique physical stabilization time. The extrapolated trend should therefore be applied cautiously and updated using subsequent monitoring data. Because the monitoring sections were located on adit walls, the measured velocities may be affected by excavation-induced unloading, opening of preexisting microcracks and joints, and enhanced moisture exchange along exposed wall surfaces. Therefore, the velocities near the adit wall may be lower than those of deeper undisturbed rock mass and may show faster apparent degradation. However, because the testing positions and methods were kept consistent among measurement campaigns, the multi-temporal data remain suitable for identifying relative time-dependent trends. The stabilized P-wave parameters are interpreted as conservative long-term lower-bound indicators near the adit-wall environment rather than as direct equivalents of intact deep rock mass. The box plots showing the velocity distribution at different times are presented in Figure 12, the fitted exponential-decay curves for the P-wave velocity statistical series are shown in Figure 11, and the stabilized velocity values and site-specific engineering estimates of long-term mechanical parameters are listed in Table 5 and Table 6, respectively.
Figure 11.
Box plot of P-wave velocities: (a) in completely altered rocks; (b) in strongly altered rocks; (c) in weakly altered rocks; (d) in slightly altered rocks.
Figure 12.
Fitting relationship between P-wave velocity and time: (a) in completely altered rocks; (b) in strongly altered rocks; (c) in weakly altered rocks; (d) in slightly altered rocks.
Table 5.
Stabilized P-wave velocity values for different alteration degrees.
Table 6.
Predicted long-term mechanical parameters for altered granite at different time stages.
The figures and tables presented in this section document the corresponding test configurations, measurement conditions, and measured responses, whereas their comparative interpretation and engineering implications are discussed systematically in Section 4 according to test type.
To estimate the long-term mechanical parameter levels corresponding to the temporal evolution of P-wave velocity, a site-specific and alteration-class-constrained engineering estimation procedure was adopted. This procedure does not assume a universal one-to-one relationship between P-wave velocity and an individual mechanical parameter. The fitted P-wave velocity at each target time was first used to characterize the relative temporal evolution of each alteration category. The corresponding mechanical parameter levels were then interpreted within the physical and mechanical property ranges associated with the respective alteration degrees. Conservative representative values were adopted to describe the relative long-term degradation of the different alteration categories. Therefore, the values listed in Table 6 should be regarded as site-specific engineering estimates for comparative and sensitivity analyses, rather than independently measured parameters or generally applicable predictions based solely on P-wave velocity.
The deformation modulus of 0.648 GPa listed for slightly altered granite at the 30-year stage was rechecked and confirmed to be the intended value; it is therefore re-tained in Table 6.
4. Test Results
4.1. Physical Properties and P-Wave Velocity Characteristics
The basic physical properties of altered granite with different alteration degrees are summarized in Table 1. As the alteration degree increases from slight to strong, dry density decreases from 2.67 g/cm3 to 2.61 g/cm3, saturated density decreases from 2.68 g/cm3 to 2.63 g/cm3, and specific gravity decreases from 2.69 to 2.66. Conversely, water content and porosity increase markedly, from 0.18% to 0.65% and from 0.66% to 1.86%, respectively. The strongly altered granite exhibits a well-graded gravelly sand texture with a fines content (particles < 0.075 mm) of approximately 17–23% (Figure 3). These physical property variations reflect the progressive replacement of primary minerals by clay minerals, which directly influences the mechanical behavior of the rock mass. The physical-property summary in Table 1 is used here as a baseline reference for material classification and comparison among alteration degrees, rather than as an additional mechanical loading condition. The grain-size distribution in Figure 3 supports the description of the strongly altered granular material and its fines content, but it is not used directly to calculate the mechanical parameters summarized in the later tables.
The long-term P-wave velocity monitoring results reveal a clear degradation trend for all alteration degrees (Figure 12). The P-wave velocities decrease rapidly during the first decade after excavation and then gradually stabilize. For complete alteration, the mean velocity stabilizes at approximately 1286 m/s; for strong alteration, at 1714 m/s; for weak alteration, at 2019 m/s; and for slight alteration, at 3090 m/s (Table 5). The fitted exponential decay curves (Figure 11) indicate that more than 80% of the total velocity reduction occurs within the first 10 years. Beyond 30 years, the velocity changes become negligible, suggesting that the mechanical degradation of altered granite does not continue indefinitely but reaches a stable long-term state. Because the measurements were repeatedly conducted with consistent positions and methods, the six time points from 2010 to 2024 provide a basis for comparing relative temporal changes, while the absolute velocities near the adit walls should be interpreted conservatively because of excavation-induced unloading. The fitted asymptote of the exponential function should be interpreted as a descriptive extrapolation of the observed decelerating trend, rather than as independent proof of a unique physical stabilization time.
4.2. Effect of Water Content on Shear Strength
The hollow torsional shear tests revealed that water content exerts a pronounced influence on the undrained shear strength of strongly altered granite. Figure 4 presents the deviatoric stress versus axial strain curves under four water contents (6%, 8%, 10%, and 12%) at different confining pressures. Each curve corresponds to one independent specimen under a specific confining pressure, and the four curves at a given water content were used to establish the corresponding strength envelope rather than to represent four parallel repetitions. At a given water content, the peak deviatoric stress increases with increasing confining pressure, indicating a positive pressure-dependent behavior. However, as water content increases, the stress–strain curves transition from strain-softening behavior (at 6% and 8% water content) to strain-hardening behavior (at 10% and 12% water content), suggesting that higher water content promotes ductile deformation. The total stress strength envelopes derived from these tests are shown in Figure 5. The cohesion c decreases from 45.87 kPa at 6% water content to 23.32 kPa at 12% water content, a reduction of approximately 49%, while the internal friction angle φ decreases from 34.06° to 28.74°, a reduction of approximately 16%. The relationships between strength parameters and water content were fitted to power functions (Figure 8), providing empirical equations for predicting strength parameters at intermediate water contents.
The large-scale direct shear tests yielded consistent results under drained conditions. Figure 6 shows the shear stress versus shear displacement curves for water contents of 6%, 8%, 10%, and 12% under different normal stresses. Each curve represents one independent specimen under a specific normal stress, and the four specimens at each water content were used to obtain the peak-strength envelope. All curves exhibit a clear peak followed by strain softening, with the peak shear stress increasing with normal stress. The peak strength envelopes (Figure 7) show good linearity, from which the peak cohesion and friction angle were derived (Table 7). The peak cohesion decreases from 59.09 kPa at 6% water content to 30.56 kPa at 12% water content (a reduction of 48%), while the peak friction angle decreases from 34.47° to 29.13° (a reduction of 15%). A check based on the existing data in Table 7 indicates that simple empirical fits over the tested 6–12% water-content range give R2 values greater than 0.98 for both cohesion and friction angle. This goodness-of-fit assessment describes interpolation within the tested range. The variation trends (Figure 8) are consistent with the hollow torsional shear results, confirming that water content is a critical factor controlling the shear strength of strongly altered granite. The slight differences in absolute values between the two test methods can be attributed to the different drainage conditions (undrained vs. drained) and specimen sizes.
Table 7.
Peak shear strength parameters of strongly altered granite from direct shear tests.
The large-scale ring shear tests provided the residual strength parameters after large displacement shearing (Table 2). Under the same water content, the residual cohesion is significantly lower than the peak cohesion, ranging from 15.33 kPa at 6% water content to 2.22 kPa at 13.6% water content, while the residual friction angle ranges from 25.96° to 20.26°. These results define the residual parameter range for strongly altered granite after large displacement and show a clear decrease in residual strength with increasing water content. The ratio of residual strength to peak strength decreases with increasing water content, indicating that highly saturated altered granite is more prone to progressive failure once the peak strength is exceeded.
4.3. Hydro-Mechanical Coupling Behavior
The triaxial compression tests under coupled hydro-mechanical conditions revealed the combined effects of confining pressure and seepage pressure on the deformation and strength of altered granite. For strong-to-medium altered granite (SA-MA), the stress–strain curves under different confining and seepage pressures are plotted in Figure 9. At a constant seepage pressure, increasing the confining pressure from 4 MPa to 8 MPa leads to a significant increase in both peak strength and deformation modulus. For example, at a seepage pressure of 0.3 MPa, the peak strength increases from 57.18 MPa at 4 MPa confining pressure to 75.80 MPa at 8 MPa, an increase of 33%, while the deformation modulus increases from 7.45 GPa to 10.93 GPa, an increase of 47%. Conversely, at a constant confining pressure, increasing the seepage pressure from 0.3 MPa to 0.9 MPa reduces the peak strength and deformation modulus. At a confining pressure of 4 MPa, the peak strength decreases from 57.18 MPa to 51.51 MPa (a reduction of 10%), and the deformation modulus decreases from 7.45 GPa to 5.96 GPa (a reduction of 20%). The friction angle and cohesion derived from these tests are 44.0–44.4° and 7.1–8.0 MPa, respectively (Table 3).
For weak-to-medium altered granite (WA-MA), the stress strain curves (Figure 10) exhibit higher peak strengths and deformation moduli compared to SA-MA, reflecting the better rock quality of weaker alteration. At a seepage pressure of 0.3 MPa, the peak strength increases from 97.92 MPa at 4 MPa confining pressure to 125.77 MPa at 8 MPa (an increase of 28%), and the deformation modulus ranges from 9.13 GPa to 12.60 GPa. Increasing the seepage pressure from 0.3 MPa to 0.9 MPa at a constant confining pressure of 4 MPa reduces the peak strength from 97.92 MPa to 88.95 MPa (a reduction of 9%) and the deformation modulus from 9.13 GPa to 7.28 GPa (a reduction of 20%). The friction angle and cohesion for WA-MA are approximately 50.2–51.0° and 11.5–12.3 MPa, respectively (Table 4). These results demonstrate that while confining pressure enhances the strength and stiffness of altered granite, seepage pressure has a deteriorating effect, and the magnitude of this deterioration is more pronounced in more strongly altered rocks.
4.4. Tensile Strength
The Brazilian splitting tests (Figure 13) show that the presence of water markedly reduces the tensile strength of strongly altered granite. The peak load for dry specimens (0% water content; GB-Q1 and GB-R1 in Figure 13a,b) is approximately 26–31% higher than that for specimens with 0.37% water content (GB-Q2 and GB-R2 in Figure 13c,d). The labels GB-Q1, GB-R1, GB-Q2, and GB-R2 are specimen identification codes used in this study; GB denotes the Guobu sampling site, while the remaining letters and numbers distinguish individual specimens. Specifically, the dry specimen curves show peak loads of 1.75–2.10 kN, while the 0.37% water-content specimen curves show peak loads of 1.20–1.55 kN. This marked reduction in tensile strength with minimal water absorption highlights the high sensitivity of altered granite to water, which is attributed to the weakening of mineral cementation and the development of micro-cracks upon wetting. The low tensile strength of strongly altered granite has important implications for slope stability, as it facilitates the propagation of tension cracks, particularly in the upper portions of the slope where tensile stresses dominate.
Figure 13.
Load-force point displacement curve: (a) GB-Q1 0% moisture content; (b) GB-R1 0% moisture content; (c) GB-Q2 0.37% moisture content; (d) GB-R2 0.37% moisture content.
5. Discussions
The experimental results presented in this study provide comprehensive insights into the mechanical behavior and long-term degradation of altered granite from Guobu Slope. The findings have important implications for understanding the deformation mechanisms of Guobu Slope and for guiding stability assessments of similar reservoir bank slopes. Several key aspects are discussed below under four thematic headings.
5.1. Controlling Factors: Water Content and Seepage Pressure
The hollow torsional shear and large-scale direct shear tests consistently demonstrate that water content exerts a first-order control on the shear strength of strongly altered granite. The cohesion decreases by approximately 50% as water content increases from 6% to 12%, while the internal friction angle decreases by about 15%. This differential sensitivity can be explained by the micro-structure of the altered granite. The strongly altered granite contains a significant proportion of clay minerals (chlorite and smectite group), as revealed by X-ray diffraction in previous studies. When water is added, these clay minerals hydrate, expand, and form lubricating films between particles, thereby reducing the interparticle attraction (c) and, to a lesser extent, the interlocking friction (φ). The empirical power-law relationships established between strength (c, φ) and water content (in Figure 8) provide practical tools for estimating strength parameters under partially saturated conditions, which is particularly relevant for the water-level fluctuation zone of the reservoir. Application to other water contents, other lithologies, or other engineering sites requires field calibration or independent validation. This restricted interpretation is particularly relevant for the water-level fluctuation zone of the reservoir and helps explain why deformation of Guobu Slope is sensitive to water-level changes: an increase in water content in the submerged or partially saturated altered granite can lead directly to strength reduction and accelerated deformation.
5.2. Peak Versus Residual Strength and Implications for Slope Failure Mode
Having established the dominant roles of water content and seepage pressure in controlling the immediate strength of altered granite, it is equally important to examine the post-peak behavior, which governs how the slope responds once local failure initiates. The large-scale ring shear tests conducted in this study provide critical insights into the residual strength of strongly altered granite under large-displacement shearing. As summarized in Table 2, the residual cohesion ranges from 15.33 kPa at 6% water content to as low as 2.22 kPa at 13.6% water content. In contrast, the residual friction angle decreases from 25.96° to 20.26° over the same water content range. Compared with the peak strength parameters obtained from the direct shear tests (Table 7), the residual strength is substantially lower, with the residual/peak ratio ranging from approximately 50% to 70% depending on water content. Notably, this ratio decreases as water content increases, meaning that under saturated or near-saturated conditions, the post-peak strength drop is more severe.
This behavior has important implications for the deformation and failure mode of Guobu Slope. The large difference between peak and residual strength implies that once a local failure occurs, for example, the collapse of a small rock block on the slope surface, the strength along the failure surface may drop to residual values. This reduction in shear resistance could, in principle, allow progressive failure to propagate if the driving forces (primarily the self-weight of the slope and hydrostatic pressures) exceed the residual strength along a continuous surface. However, several lines of evidence suggest that such progressive failure leading to a catastrophic, rapid landslide is unlikely for Guobu Slope. First, the long-term P-wave velocity monitoring (Section 5.3) indicates that Guobu Slope has been in a state of slow creep since 2013, with no detectable acceleration in deformation rates. Second, Guobu Slope is dissected by multiple faults and joints (LF1, Hf104, and Laxiwa Fault), which compartmentalize the rock mass into relatively independent blocks. This structural segmentation limits the potential for a single, through-going failure surface to develop over the entire 1.7 km length of the slope. Third, the field observation record shows that since 2013, both the frequency and volume of surface collapses have decreased significantly, suggesting that Guobu Slope has largely adjusted to the post-impoundment stress regime and is now approaching a stable creeping equilibrium.
Nevertheless, the residual strength parameters determined in this study are valuable for understanding the ongoing creep behavior. The fact that Guobu Slope continues to deform at a low but measurable rate (approximately 0.51 m/year at the Guobu platform’s front) suggests that the driving forces are currently balanced by the residual strength along one or more sliding surfaces at depth. If the residual strength were to degrade further, for instance due to additional wetting or cyclic loading, the deformation rate could increase. However, the stabilization trend observed in the P-wave velocity data (Section 5.3) indicates that such further degradation is limited. Therefore, the most plausible scenario for the future evolution of Guobu Slope is continued slow creep with occasional local collapses of small blocks, rather than a sudden, catastrophic failure. This interpretation is consistent with the risk classification of Guobu Slope as Grade II (moderate risk) by the National Energy Administration of China [23], which permits continued operation of the hydropower station under enhanced monitoring. It should be emphasized that Table 6 is not used as stand-alone evidence for predicting the future failure mode of the entire slope. The interpretation of the long-term slope behavior is based on the combined evidence of the multi-temporal P-wave velocity trend, the observed deformation history, the alteration distribution, and the laboratory mechanical test results. The parameters in Table 6 provide conservative engineering estimates for comparative.
5.3. Long-Term Degradation Trend and Its Implications for Slope Stability
Building upon the understanding of how water content and seepage pressure affect the immediate strength of altered granite, it is equally important to examine how these properties evolve over extended time scales. The multi-temporal P-wave velocity monitoring conducted on adit walls from 2010 to 2024 provides unique insights into the time-dependent degradation of altered granite under natural environmental conditions. As shown in Figure 12, the P-wave velocities for all alteration degrees decrease rapidly during the first decade after excavation, followed by a gradual deceleration of the degradation rate. After approximately 30 years, the velocities approach stable asymptotic values (Table 5). This trend is well described by exponential decay functions (Figure 11), indicating that more than 80% of the total velocity reduction occurs within the first 10 years, and the remaining 20% is spread over the subsequent two decades.
This stabilization phenomenon carries critical implications for long-term slope stability assessments. It suggests that the mechanical parameters of altered granite do not degrade indefinitely under reservoir operating conditions. Instead, they approach a relatively stable level according to the fitted trend under the monitored conditions, which should not be interpreted as proof of a unique stabilization time. For Guobu Slope, the observed creep deformation rate (approximately 0.51 m/year at the platform front since 2013) is consistent with this interpretation: Guobu Slope has already passed the most rapid degradation phase and is now approaching a steady creep regime. The site-specific engineering estimates of long-term mechanical parameters constrained by the P-wave velocity evolution and alteration category (Table 6) can be used as conservative representative values for comparative and sensitivity analyses over the design life of the hydropower station (typically 50–100 years). For strongly altered granite, the long-term lower-bound deformation modulus is approximately 0.255 GPa, the cohesion is approximately 0.054 MPa, and the friction angle is approximately 22.8°. These values are lower than the peak parameters obtained from short-term tests and should be interpreted as conservative long-term indicators for the adit-wall rock mass environment.
It is worth noting that the degradation observed on adit walls may be accelerated compared with deeper undisturbed rock mass, because adit excavation reduces the confining pressure near the wall, promotes opening of pre-existing microcracks and joints, and exposes fresh surfaces to water exchange. As a result, P-wave velocities near the adit wall may be lower than those of deeper rock mass and may show faster apparent deterioration. Nevertheless, when the measurement locations and procedures are kept consistent, the multi-stage P-wave data remain useful for identifying the relative temporal trend of degradation and stabilization. Therefore, the parameters presented in Table 6 should be regarded as site-specific, alteration-class-constrained engineering estimates for comparative and sensitivity analyses rather than independently measured parameters or direct equivalents of intact deep rock mass properties. The lack of accelerating deformation since 2013 supports the interpretation that the rapid degradation phase has largely passed under the monitored conditions, while field monitoring should continue to update engineering parameters as reservoir and slope conditions evolve.
An internal consistency check was conducted using the results reported in this study. Overall, the alteration-dependent ordering of the estimated parameters is consistent with the basic physical properties and mechanical test results: the more intensely altered materials generally exhibit lower P-wave velocities and lower mechanical parameter levels, whereas the less altered materials exhibit higher values. In addition, the magnitude of the estimated temporal change decreases as the fitted P-wave velocity curves become flatter. This consistency supports the use of Table 6 for comparative and sensitivity analyses at Guobu Slope. However, this comparison is an internal consistency assessment rather than an independent external validation, and the absolute values should be updated through continued monitoring and field calibration when used in slope-scale calculations.
5.4. Comparison with Similar Reservoir Slopes, Limitations, and Future Work
The mechanical behavior of altered granite from Guobu Slope shares notable similarities with other reservoir landslides around the world. For example, the shear strength reduction due to wetting observed in this study (approximately 50% reduction in cohesion and 15% reduction in friction angle) is comparable to that reported for the clay-rich layers in the Vajont Landslide (Italy), where the post-failure analysis attributed the catastrophic event to progressive strength degradation of the sliding-zone material. Similarly, in the Three Gorges Reservoir of China, extensive studies on the Bazimen and Shuping landslides have documented cohesion reductions of 40–60% with increasing water content, leading to a significant decrease in the factor of safety during reservoir impoundment and drawdown. Guobu Slope thus fits a well-recognized pattern: the presence of water-sensitive minerals (such as smectite and chlorite) in altered granite makes the slope highly responsive to hydrological changes.
However, the long-term stabilization of P-wave velocity and inferred strength after approximately 30 years is a distinctive feature that has rarely been documented in previous studies. Most experimental investigations have focused on short-term wetting–drying cycles (typically 5–20 cycles) or on monotonic saturation, rather than on decadal-scale in situ monitoring. Guobu Slope thus provides site-specific monitoring evidence that the degradation of altered granite follows a decelerating trend within the monitored conditions. This observation may provide a reference for other large reservoirs constructed in altered granite or similar weak crystalline rocks, provided that site conditions and monitoring calibration are considered. It suggests that the initial post-impoundment period (roughly 10–30 years) is the most critical phase for slope stability, during which rapid strength degradation may trigger accelerated deformation. After this period, Guobu Slope may approach a relatively stable creeping phase according to the fitted trend, provided that no new destabilizing factors (such as extreme rainfall or seismic events) intervene.
Several limitations of this study must be acknowledged. First, the laboratory tests reflect material-scale behavior, whereas the in situ rock mass contains persistent joints, faults, block boundaries, anisotropy, and irregular alteration lenses. These structural features can influence equivalent rock mass strength, deformation, and seepage behavior, so laboratory parameters should not be directly assigned to the entire slope without mechanical parameter reduction of rock mass, field calibration, and sensitivity analysis. Peak parameters are most suitable for relatively intact materials and short-term analyses, whereas residual parameters or conservative long-term lower-bound parameters are more appropriate for existing shear zones, persistent sliding zones, and long-term stability evaluation. Second, the cyclic wetting–drying effects due to seasonal reservoir fluctuations were not directly simulated in the laboratory program, although the long-term P-wave monitoring reflects cumulative field evolution to some extent. Third, the P-wave velocity monitoring was conducted on adit walls, where excavation-induced unloading and wall exposure may accelerate apparent degradation; therefore, the derived long-term parameters should be interpreted conservatively. Fourth, the empirical relationships between water content and strength parameters are site-specific and applicable only within the corresponding tested ranges. Fifth, different specimen sizes, drainage paths, and stress boundaries among the hollow torsional shear, direct shear, ring shear, and triaxial tests affect the absolute parameter values. These limitations constrain direct extrapolation and absolute parameter use, but they do not negate the material-scale trends observed in this study, namely that increasing water content and increasing seepage pressure reduce the strength and stiffness of altered granite.
Based on these limitations, several directions for future research are recommended. First, in situ strength testing at depth, such as borehole shear tests, dilatometer tests, or cross-hole seismic tomography, should be conducted to calibrate the laboratory-derived parameters and to assess the influence of scale and in situ stress on rock-mass behavior. Second, cyclic wetting–drying triaxial tests should be designed as a separate program to quantify the cumulative damage from seasonal water-level fluctuations, with attention to the number of cycles and the amplitude of pore-pressure variations. Third, a complete coupled hydro-mechanical numerical analysis should be developed as an independent slope-scale study that incorporates three-dimensional geometry, faults and joint networks, hydrogeological boundaries, reservoir operation processes, and field deformation calibration. Fourth, mineralogical and micro-CT investigations are needed to better understand the mechanisms of strength stabilization after prolonged immersion, including the role of clay mineral reorientation, cementation by dissolved minerals, and the development of a stable microfabric. Finally, comparative studies with other reservoir slopes underlain by altered or weathered crystalline rocks would help to generalize the findings and to develop empirically calibrated guidelines for long-term stability assessment.
In summary, while Guobu Slope remains a challenging case due to its large volume, continuous deformation, and proximity to the dam, the experimental evidence presented in this study suggests that its long-term behavior is governed by a progressive but finite degradation of the altered granite’s mechanical properties. The peak parameters from hollow torsional shear and direct shear tests, the residual parameters from ring shear tests, the deformation modulus from triaxial compression, and the long-term lower-bound parameters from P-wave monitoring have different engineering meanings and should be selected according to the deformation stage, material condition, and analysis objective. The slope is likely to persist in a state of slow creep, with occasional local collapses, but the risk of catastrophic rapid failure appears low under normal reservoir operation. The long-term parameters proposed in Table 6 provide a rational basis for engineering parameter selection and risk assessment when used with field calibration.
5.5. Recommended Engineering Application Procedure
Divide the slope materials according to alteration degree and identify relatively intact zones, water-sensitive altered zones, and persistent shear zones. Establish representative water-content and seepage-pressure scenarios according to reservoir level, groundwater conditions, and the position of the water-level fluctuation zone. For strongly altered granite within the tested water-content range of 6–12%, use the empirical relationships in Figure 8 and the data in Table 7 to estimate peak cohesion and friction angle as site-specific interpolation parameters. According to the expected confining pressure and seepage pressure, select the corresponding strength and deformation-modulus ranges from the hydro-mechanical triaxial results in Table 3 and Table 4. Use peak parameters for short-term analyses or relatively intact materials, residual parameters from Table 2 for existing shear zones and large-displacement analyses, and conservative long-term lower-bound parameters from Table 6 for long-term sensitivity analyses. Conduct parameter sensitivity analyses using upper-bound, representative, and lower-bound values, and update the adopted parameters using subsequent field monitoring.
This procedure provides a framework for parameter selection and application. Practical slope-scale applications still require rock-mass parameter reduction, field calibration, and analysis models constrained by geometry, structural surfaces, hydrogeological boundaries, reservoir operation history, and deformation monitoring.
6. Conclusions
This study has presented a comprehensive experimental investigation into the physical and mechanical properties of altered granite from Guobu Slope, a large-scale reservoir deforming slope at the Laxiwa Reservoir in China. Based on detailed field surveys, adit and borehole explorations, multi-method laboratory testing (including hollow torsional shear, hydro-mechanical coupled triaxial, large-scale direct shear, large-scale ring shear, and Brazilian splitting tests), and long-term P-wave velocity monitoring at six time points from 2010 to 2024, the mechanical behavior of altered granite with different alteration degrees has been characterized. The effects of water content, confining pressure, and seepage pressure on shear strength, deformation modulus, and failure behavior have been quantified. The long-term degradation trend has been revealed through P-wave velocity evolution analysis, and site-specific empirical relationships as well as long-term lower-bound parameters have been proposed for engineering parameter selection. The main conclusions are summarized as follows:
(1) Water content is the primary controlling factor for the shear strength of strongly altered granite. As water content increases from 6% to 12%, the cohesion decreases by approximately 50%, from 45.9 kPa to 23.3 kPa in undrained tests and from 59.1 kPa to 30.6 kPa in drained tests, while the internal friction angle decreases by about 15%, from 34.1° to 28.7°. The empirical relationships between strength parameters and water content are site-specific interpolation relationships for estimating strength parameters within the tested 6–12% water-content range.
(2) Confining pressure and seepage pressure have opposing effects on the strength and deformation of altered granite. Increasing confining pressure from 4 MPa to 8 MPa at a constant seepage pressure of 0.3 MPa increases the peak strength of strong-to-medium altered granite by 33% and the deformation modulus by 47%. Conversely, increasing seepage pressure from 0.3 MPa to 0.9 MPa at a constant confining pressure of 4 MPa reduces the peak strength by 10% and the deformation modulus by 20%. The deteriorating effect of seepage pressure is more pronounced in more strongly altered rocks, indicating that the lower part of Guobu Slope, where alteration is stronger and seepage pressures are higher, is more susceptible to long-term strength degradation.
(3) The residual strength of strongly altered granite is substantially lower than the peak strength, and the ratio of residual value to peak value decreases with increasing water content. The residual cohesion ranges from 15.3 kPa at 6% water content to 2.2 kPa at 13.6% water content, and the residual friction angle ranges from 26.0° to 20.3°. The long-term P-wave velocity monitoring reveals that mechanical degradation is most rapid in the first decade after excavation and approaches a relatively stable level according to the fitted trend under the monitored conditions after approximately 30 years, supporting the interpretation that Guobu Slope is likely to persist in a state of slow creep with occasional local collapses rather than progressing to catastrophic rapid failure. For strongly altered granite, the long-term lower-bound deformation modulus is approximately 0.255 GPa, the cohesion is approximately 0.054 MPa, and the friction angle is approximately 22.8°; these values can be used as conservative parameters for long-term stability sensitivity analyses over the design life of the hydropower station.
(4) The findings provide experimental data for understanding the long-term deformation behavior of Guobu Slope and offer practical reference values for similar reservoir slopes. The relationships between strength and water content, the quantified effects of seepage pressure, and the predicted long-term parameters should be applied within the tested ranges and with appropriate field calibration. The stabilization trend observed in the P-wave velocity data suggests that the initial post-impoundment period of approximately 10–30 years is the most critical phase for slope stability, after which the slope may approach a relatively stable creeping regime according to the fitted trend under normal reservoir operation.
(5) The applicability of the results is limited by scale effects between laboratory specimens and the in situ jointed rock mass, the absence of direct laboratory simulation of long-term cyclic wetting–drying, the influence of excavation-induced unloading on adit-wall P-wave monitoring, the site-specific nature of the empirical relationships, and the different boundary conditions of the testing devices. These limitations mainly restrict direct extrapolation and absolute parameter use, but they do not change the basic material-scale finding that an increasing water content and seepage pressure reduce the strength and stiffness of altered granite.
Author Contributions
Conceptualization, J.X. and W.F.; methodology, J.D.; software, Q.W.; validation, F.Z., Y.L. and J.X.; formal analysis, W.F.; investigation, J.X.; resources, Q.W.; data curation, J.D.; writing—original draft preparation, J.X.; writing—review and editing, J.X.; visualization, F.Z.; supervision, Y.L.; project administration, J.X.; funding acquisition, W.F. All authors have read and agreed to the published version of the manuscript.
Funding
This research was funded by the National Natural Science Foundation of China, grant number No. 42377145, the Sichuan Science and Technology Program of China, grant No.2024YFFK0112, the Sichuan Science and Technology Program of China, grant No.2025YFNZH0041, and the Fundamental Research Funds for the Central Universities, grant No. 2024SCUQJTX033.
Institutional Review Board Statement
Not applicable.
Informed Consent Statement
Not applicable.
Data Availability Statement
The raw data supporting the conclusions of this article will be made available by the authors on request.
Acknowledgments
The authors gratefully acknowledge the support provided by the project team.
Conflicts of Interest
Jianjun Xu, Junbang Duan, and Fenghua Zhang were employed by State Power Investment Corporation Yellow River Hydropower Development Co., Ltd. and Qinghai-Upper Yellow River Hydropower-Development-Co., Ltd. Qihong Wang and YaochengLv were employed by Power China Northwest Engineering Co. Ltd. The remaining authors declare that the research was conducted in the absence of any commercial or financial relationships that could be construed as a potential conflict of interest.
References
- Qu, J.; Zhu, Q.; Qi, S.; Zhou, J. Instability mechanism of reservoir landslides under combined effects of water level fluctuations and rainfall. Eng. Geol. 2025, 352, 108092. [Google Scholar] [CrossRef] [Scilit]
- Lu, T.; Zhong, H.; Fu, W.; Zhang, H. Geodynamic analysis of curved tunnels under rayleigh wave loading: A virtual-force analytical model for axial deformation joints and subgrade response. Transp. Geotech. 2026, 62, 102122. [Google Scholar] [CrossRef] [Scilit]
- He, M.; Leng, Y.; Peng, J. The engineering geological characteristics and alteration classification of altered granite in East Quwu Mountain, Gansu, China. Appl. Sci. 2026, 16, 2993. [Google Scholar] [CrossRef] [Scilit]
- Elshater, A. Geological and engineering characteristics of expansive soils in Western Desert, Egypt. Civ. Eng. Res. J. 2019, 7, 555707. [Google Scholar] [CrossRef] [Scilit]
- Jin, L.; Fu, W.; Wang, Y.; Xiao, Q.; Li, Y.; Ye, F. A novel method for evaluating stability and mechanism of flexural toppling based on energy conservation principle and numerical simulation. Int. J. Rock Mech. Min. Sci. 2024, 183, 105896. [Google Scholar] [CrossRef] [Scilit]
- Li, B.; Wang, G.; Chen, L.; Sun, F.; Wang, R.; Liao, M.; Xu, H.; Li, S.; Kang, Y. Analysis of landslide deformation mechanisms and coupling effects under rainfall and reservoir water level effects. Eng. Geol. 2024, 343, 107803. [Google Scholar] [CrossRef] [Scilit]
- Wang, L.; Wang, L.; Zhang, W.; Meng, X.; Liu, S.; Zhu, C. Time series prediction of reservoir bank landslide failure probability considering the spatial variability of soil properties. J. Rock Mech. Geotech. Eng. 2024, 16, 3951–3960. [Google Scholar] [CrossRef] [Scilit]
- Dong, J.; Shi, S.; Liu, H.; Ren, M.; Li, J. Alteration mechanism, classification, and mechanical properties of altered granite. J. Earth Sci. 2025, 36, 2658–2673. [Google Scholar] [CrossRef] [Scilit]
- Sun, L.; Tang, X.; Abdelaziz, A.; Liu, Q.; Grasselli, G. Stability analysis of reservoir slopes under fluctuating water levels using the combined finite-discrete element method. Acta Geotech. 2023, 18, 5403–5426. [Google Scholar] [CrossRef] [Scilit]
- Jaakson, R. A method to analyze the effects of fluctuating reservoir water levels on shoreline recreation use. Water Resour. Res. 1970, 6, 421–429. [Google Scholar] [CrossRef] [Scilit]
- Wang, G.; Zhang, T.; Zhang, L. The law of strength damage and deterioration of jointed sandstone after dry-wet cycles. J. Mt. Sci. 2023, 20, 1170–1182. [Google Scholar] [CrossRef] [Scilit]
- Dong, Q.; Sun, X.; Lei, N.; Liu, B. Effect of dry-wet cycling on the degradation characteristics and mechanisms of red sandstone. Geofluids 2023, 2023, 1–15. [Google Scholar] [CrossRef] [Scilit]
- Zheng, Z.; Xu, H.; Wang, W.; Zhang, Q.; Wang, Y.; Sun, Q.; Tao, H.; Han, X. Seepage-stress combined experiment and damage model of rock in different loading and unloading paths. Int. J. Damage Mech. 2024, 33, 3–38. [Google Scholar] [CrossRef] [Scilit]
- Zhang, F.; Jiang, A.; Yang, X. Shear creep experiments and modeling of granite under dry-wet cycling. Bull. Eng. Geol. Environ. 2021, 80, 5897–5908. [Google Scholar] [CrossRef] [Scilit]
- Jiang, C.; Yang, Y.; Wei, W.; Duan, M.; Yu, T. A new stress-damage-flow coupling model and the damage characterization of raw coal under loading and unloading conditions. Int. J. Rock Mech. Min. Sci. 2021, 138, 104601. [Google Scholar] [CrossRef] [Scilit]
- Ibroximovich, B.N. Geological and hydrogeological characteristics of the Isfara Underground Water Deposit. Am. J. Eng. Technol. 2026, 8, 151–157. [Google Scholar] [CrossRef] [Scilit]
- Lu, T.; Xiao, Z.; Fu, W.; Zhang, H.; Zhang, S. Analytical modeling of dynamic responses and vulnerable zones in curved finite tunnels with deformation joints. J. Cent. South Univ. 2026. [Google Scholar] [CrossRef] [Scilit]
- Lu, T.; Li, S.; Wang, Y.; Li, Y.; Fu, W.; Ju, G. An integrated survey-modelling-testing framework for seismic characterization of deep overburden: Application to a high-altitude pumped storage project. Int. J. Geotech. Eng. 2026, 20, 373–397. [Google Scholar] [CrossRef] [Scilit]
- Lu, T.; Zhong, H.; Zhang, H.; Fu, W.; Xue, P. An Analytical Framework with Closed-Form Solutions for Hybrid Curved-Straight Tunnel Segments with Deformation Joints under Arbitrary Dynamic Loads. Appl. Math. Model. 2026, 161, 117171. [Google Scholar] [CrossRef] [Scilit]
- Li, Y.; Wei, H.; Fu, W.; Ye, F.; Lu, T. Investigation of the dynamic failure behavior and liquefaction resistance of sand under seismic loading. J. Appl. Geophys. 2026, 248, 106170. [Google Scholar] [CrossRef] [Scilit]
- Wang, C.; Jin, L.; Fu, W.; Ye, F.; Qian, R.; Lv, G.; Yao, S. Failure mechanism of toppling in anti-dip layered rock slope: A case study of the Xiangpingshan landslide in southwest China. Bull. Eng. Geol. Environ. 2024, 84, 8. [Google Scholar] [CrossRef] [Scilit]
- Lu, T.; Fu, W. A Dirac Delta function approach for closed-form dynamic response of jointed curved beams. Mech. Res. Commun. 2026, 155, 104699. [Google Scholar] [CrossRef] [Scilit]
- Hu, Y.; Huang, H.; Zhang, Y. Treatment of the deformable body of Guobu slope of Laxiwa hydropower station and its effect. Dam Saf. 2025, 0, 16–22. [Google Scholar]
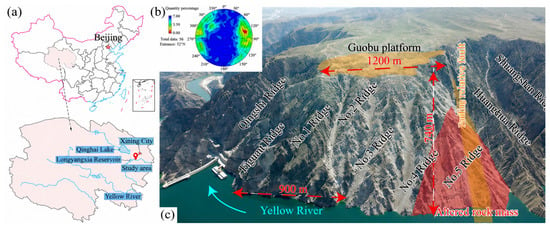
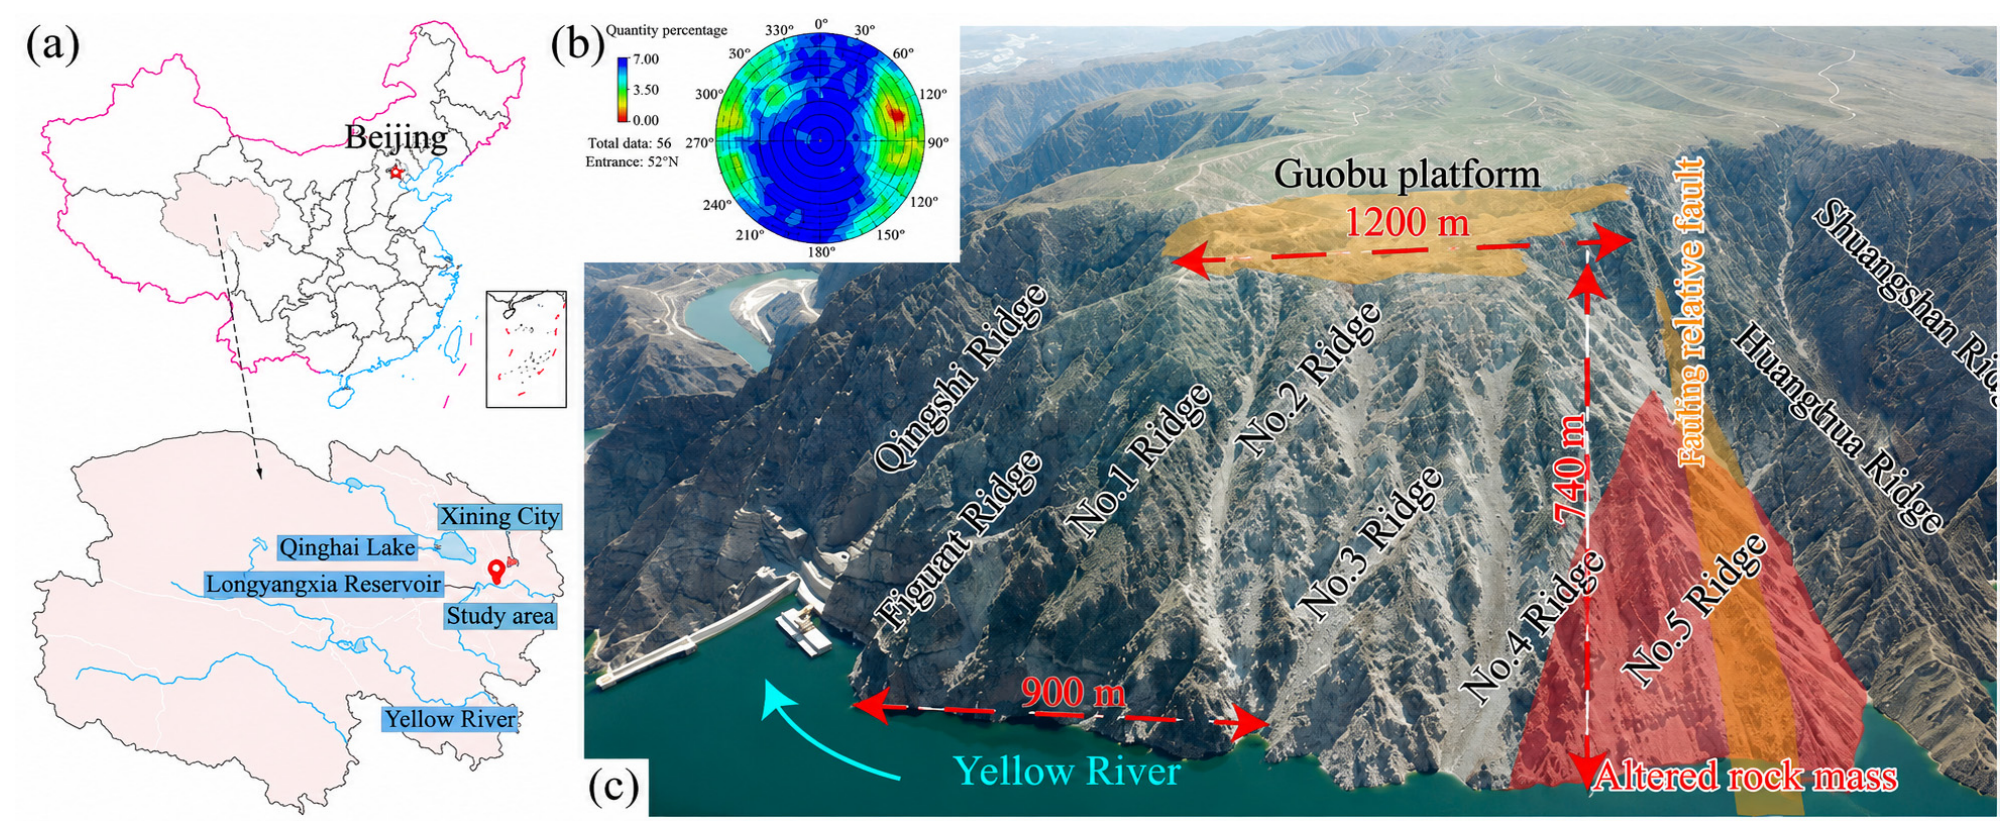
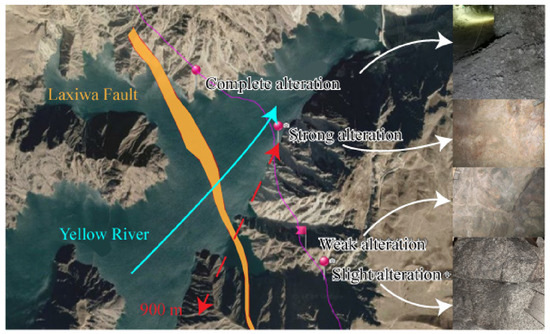
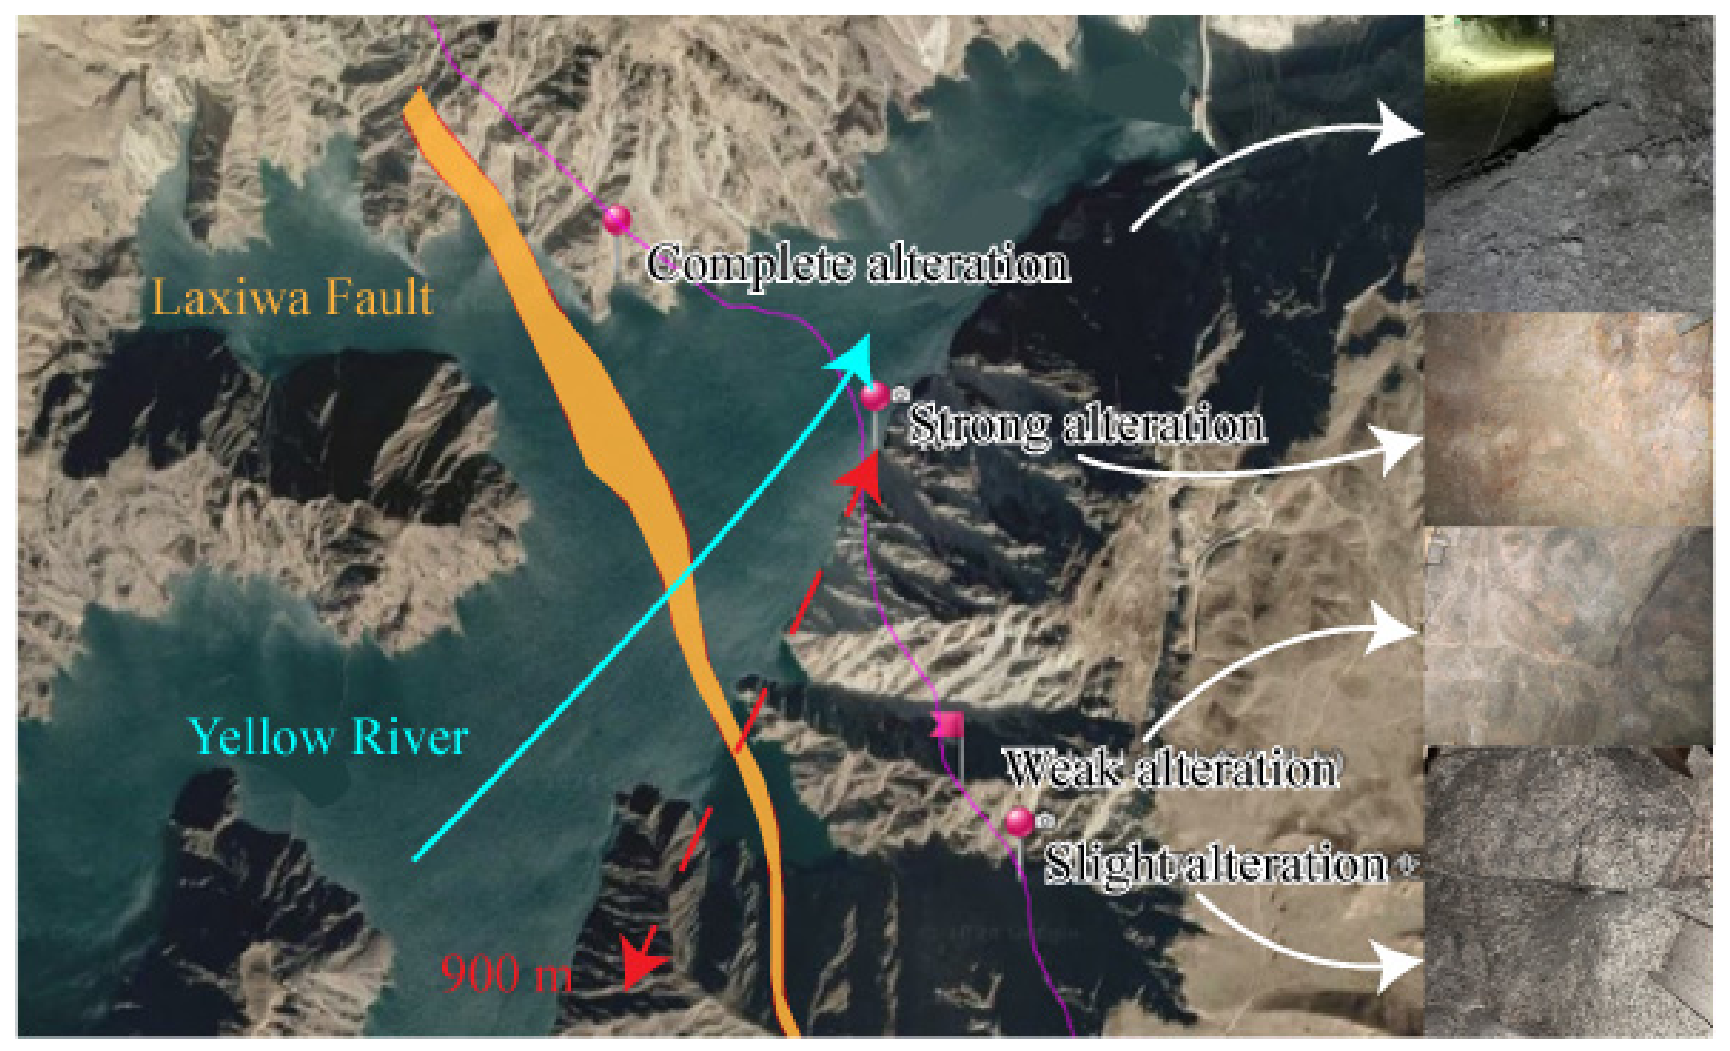
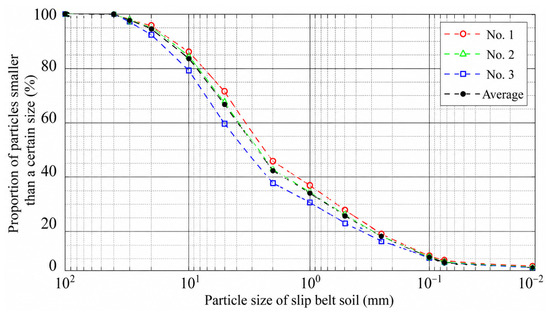
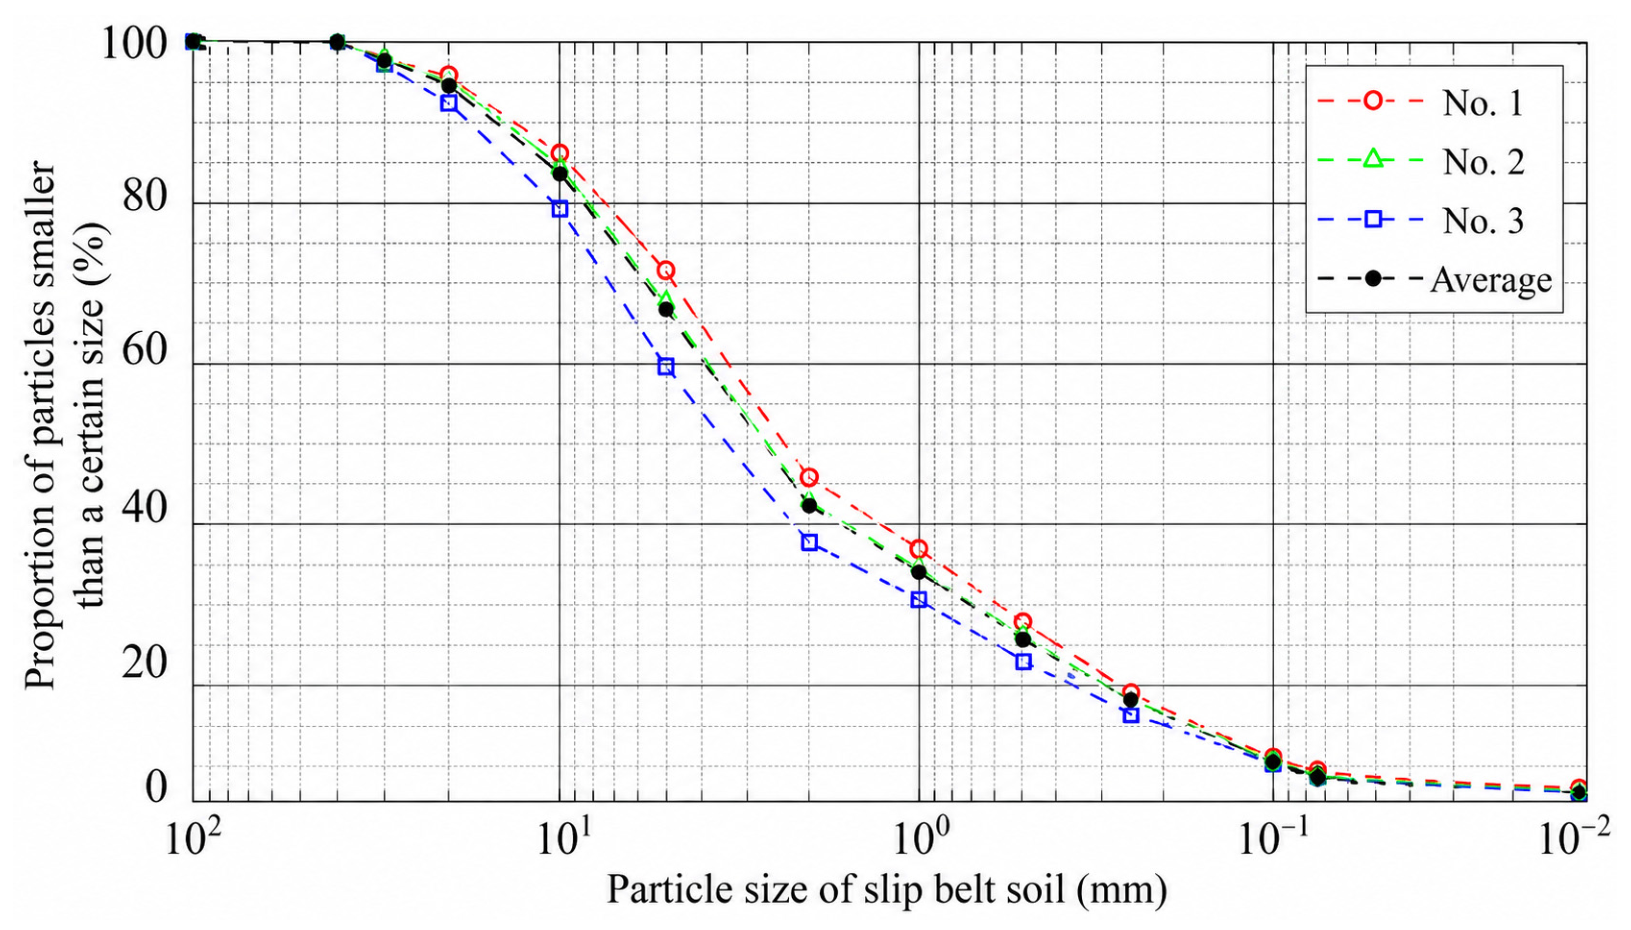
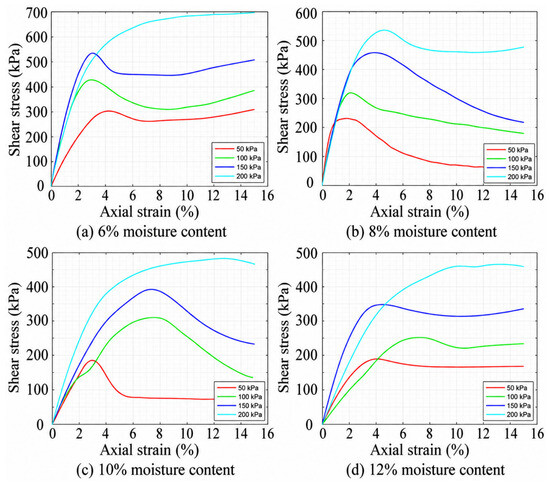
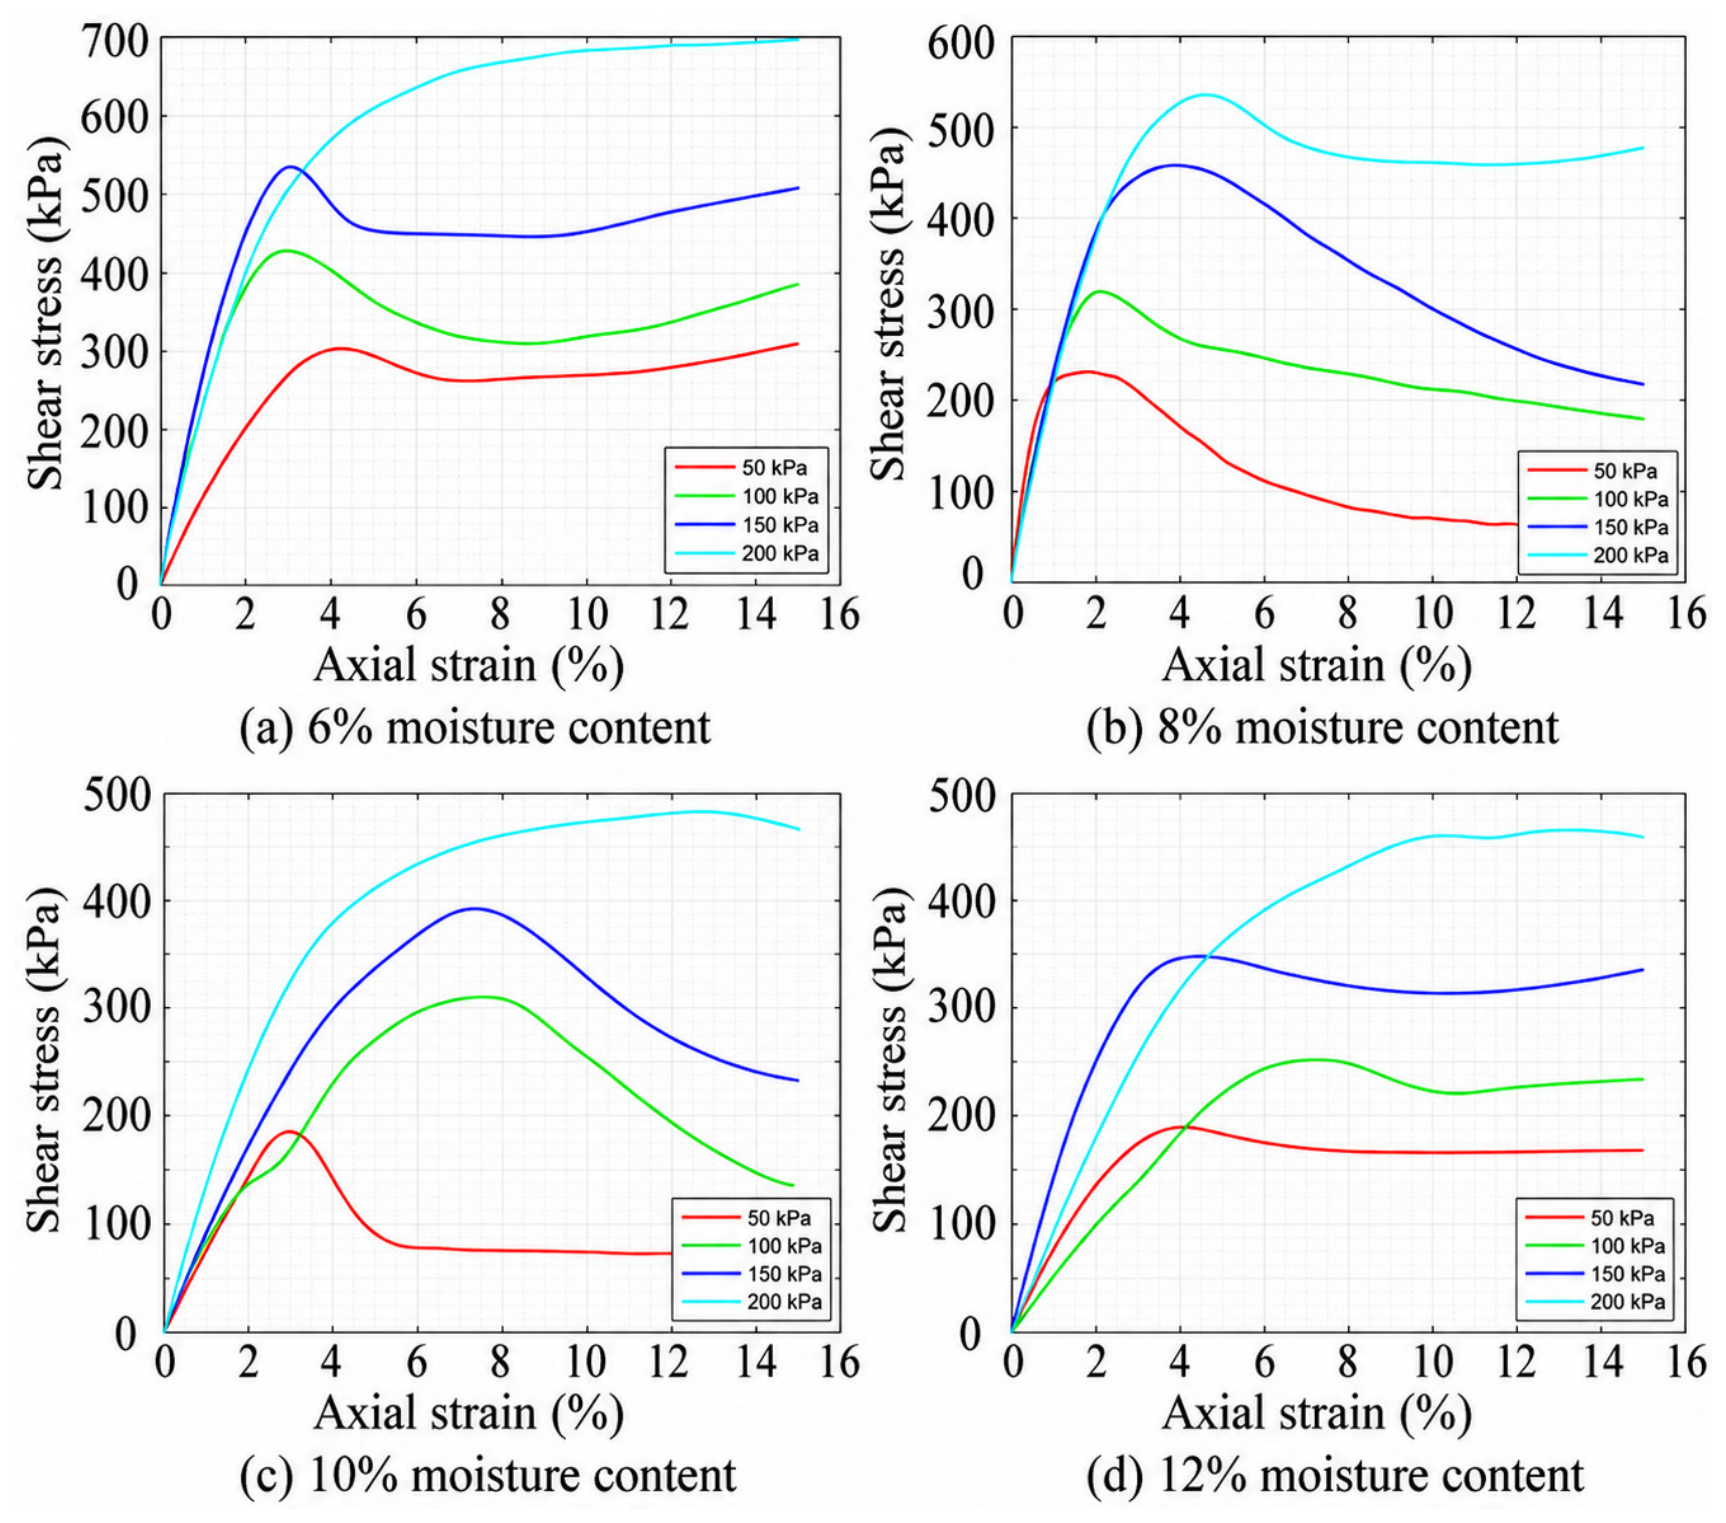
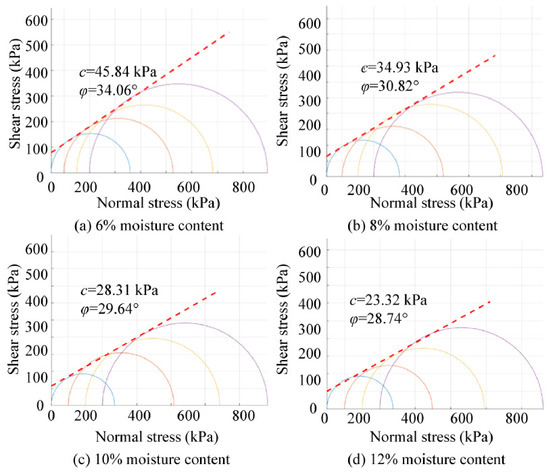
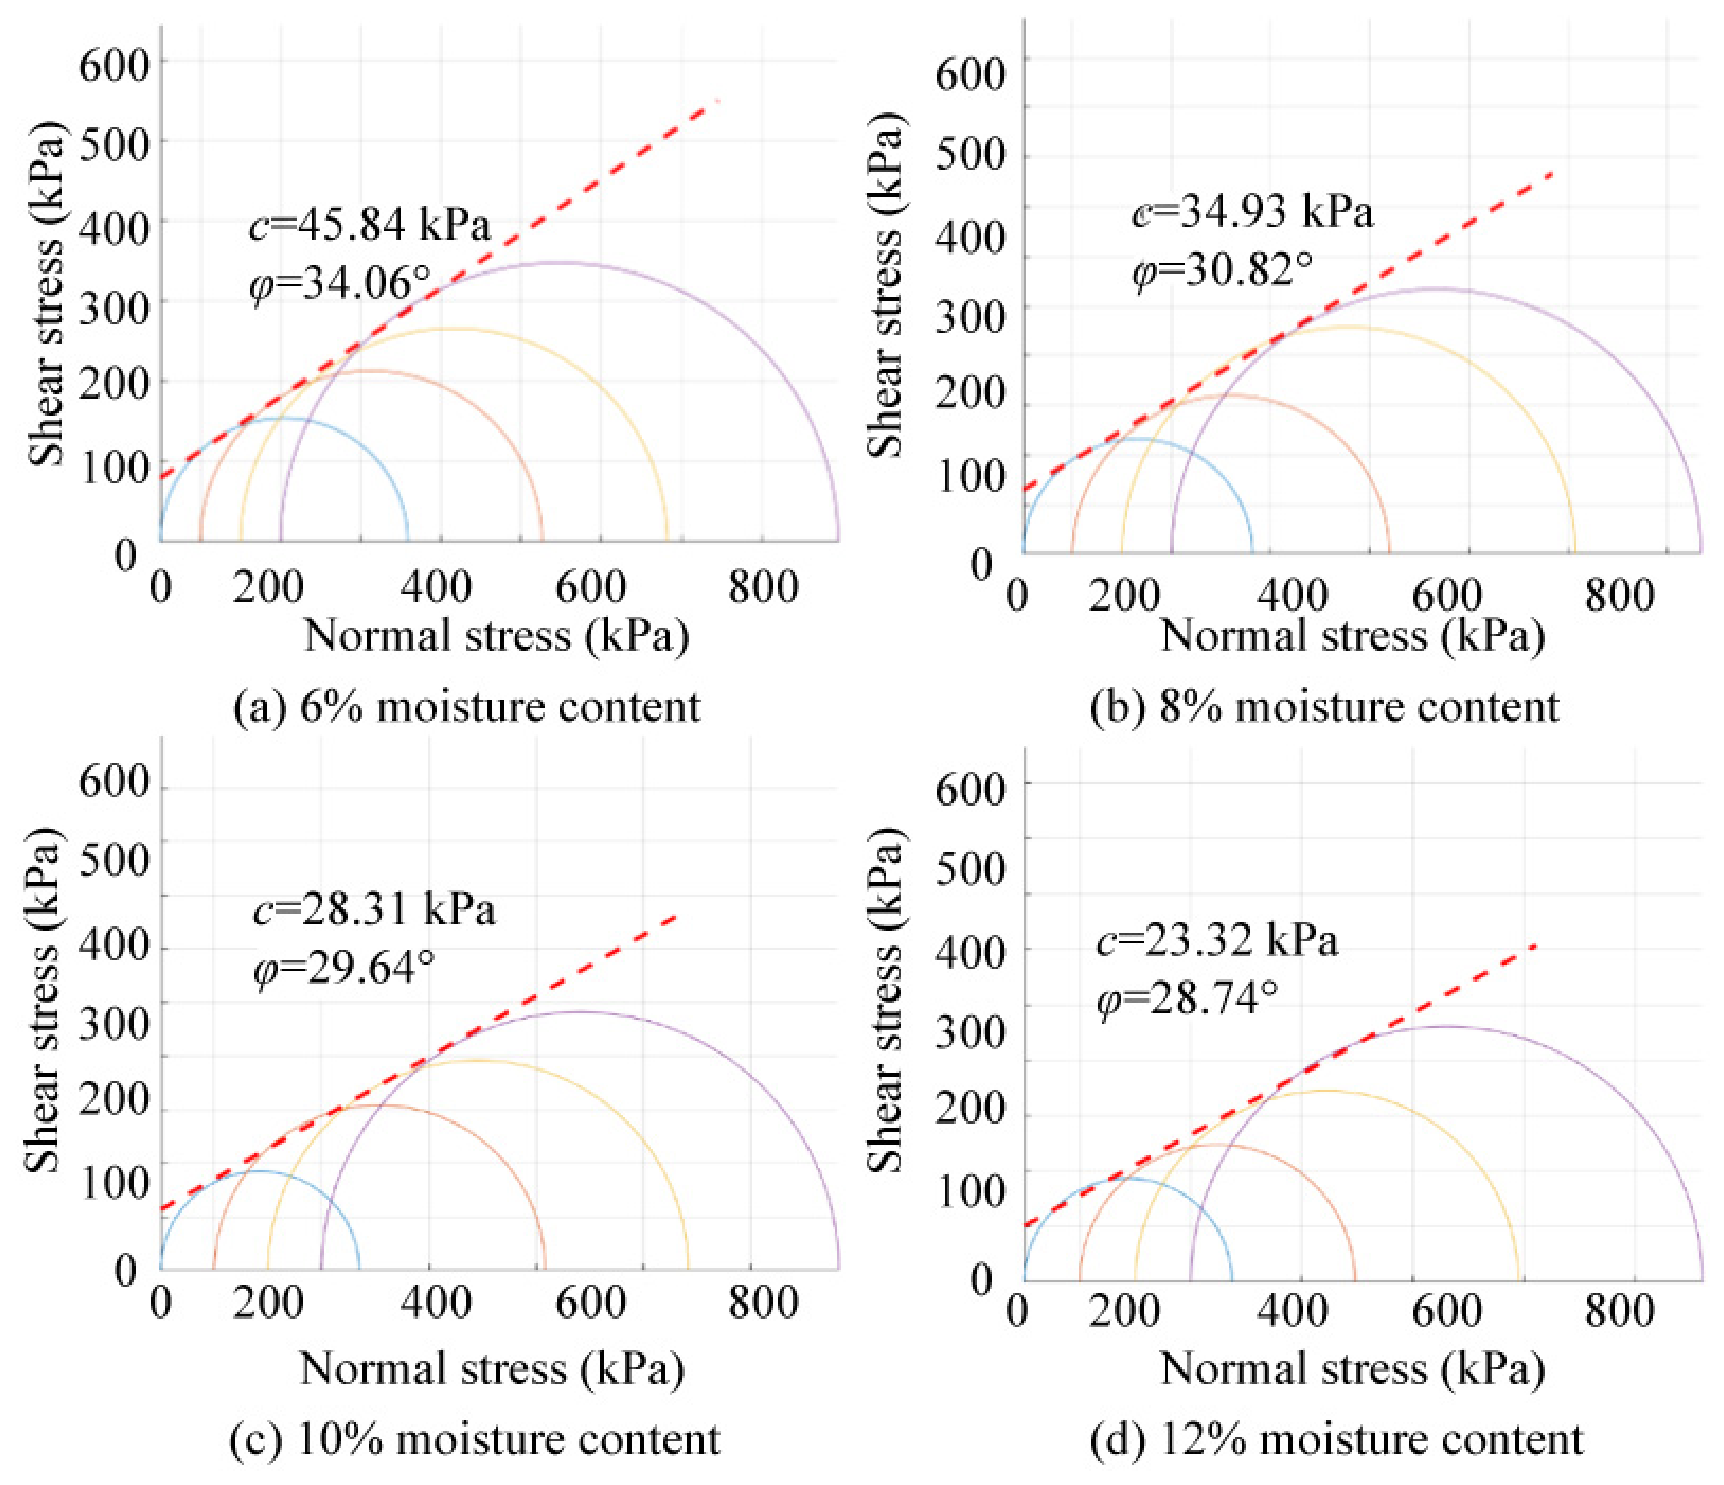
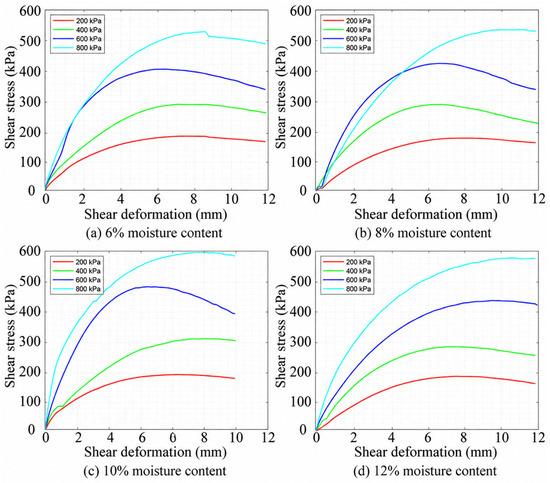
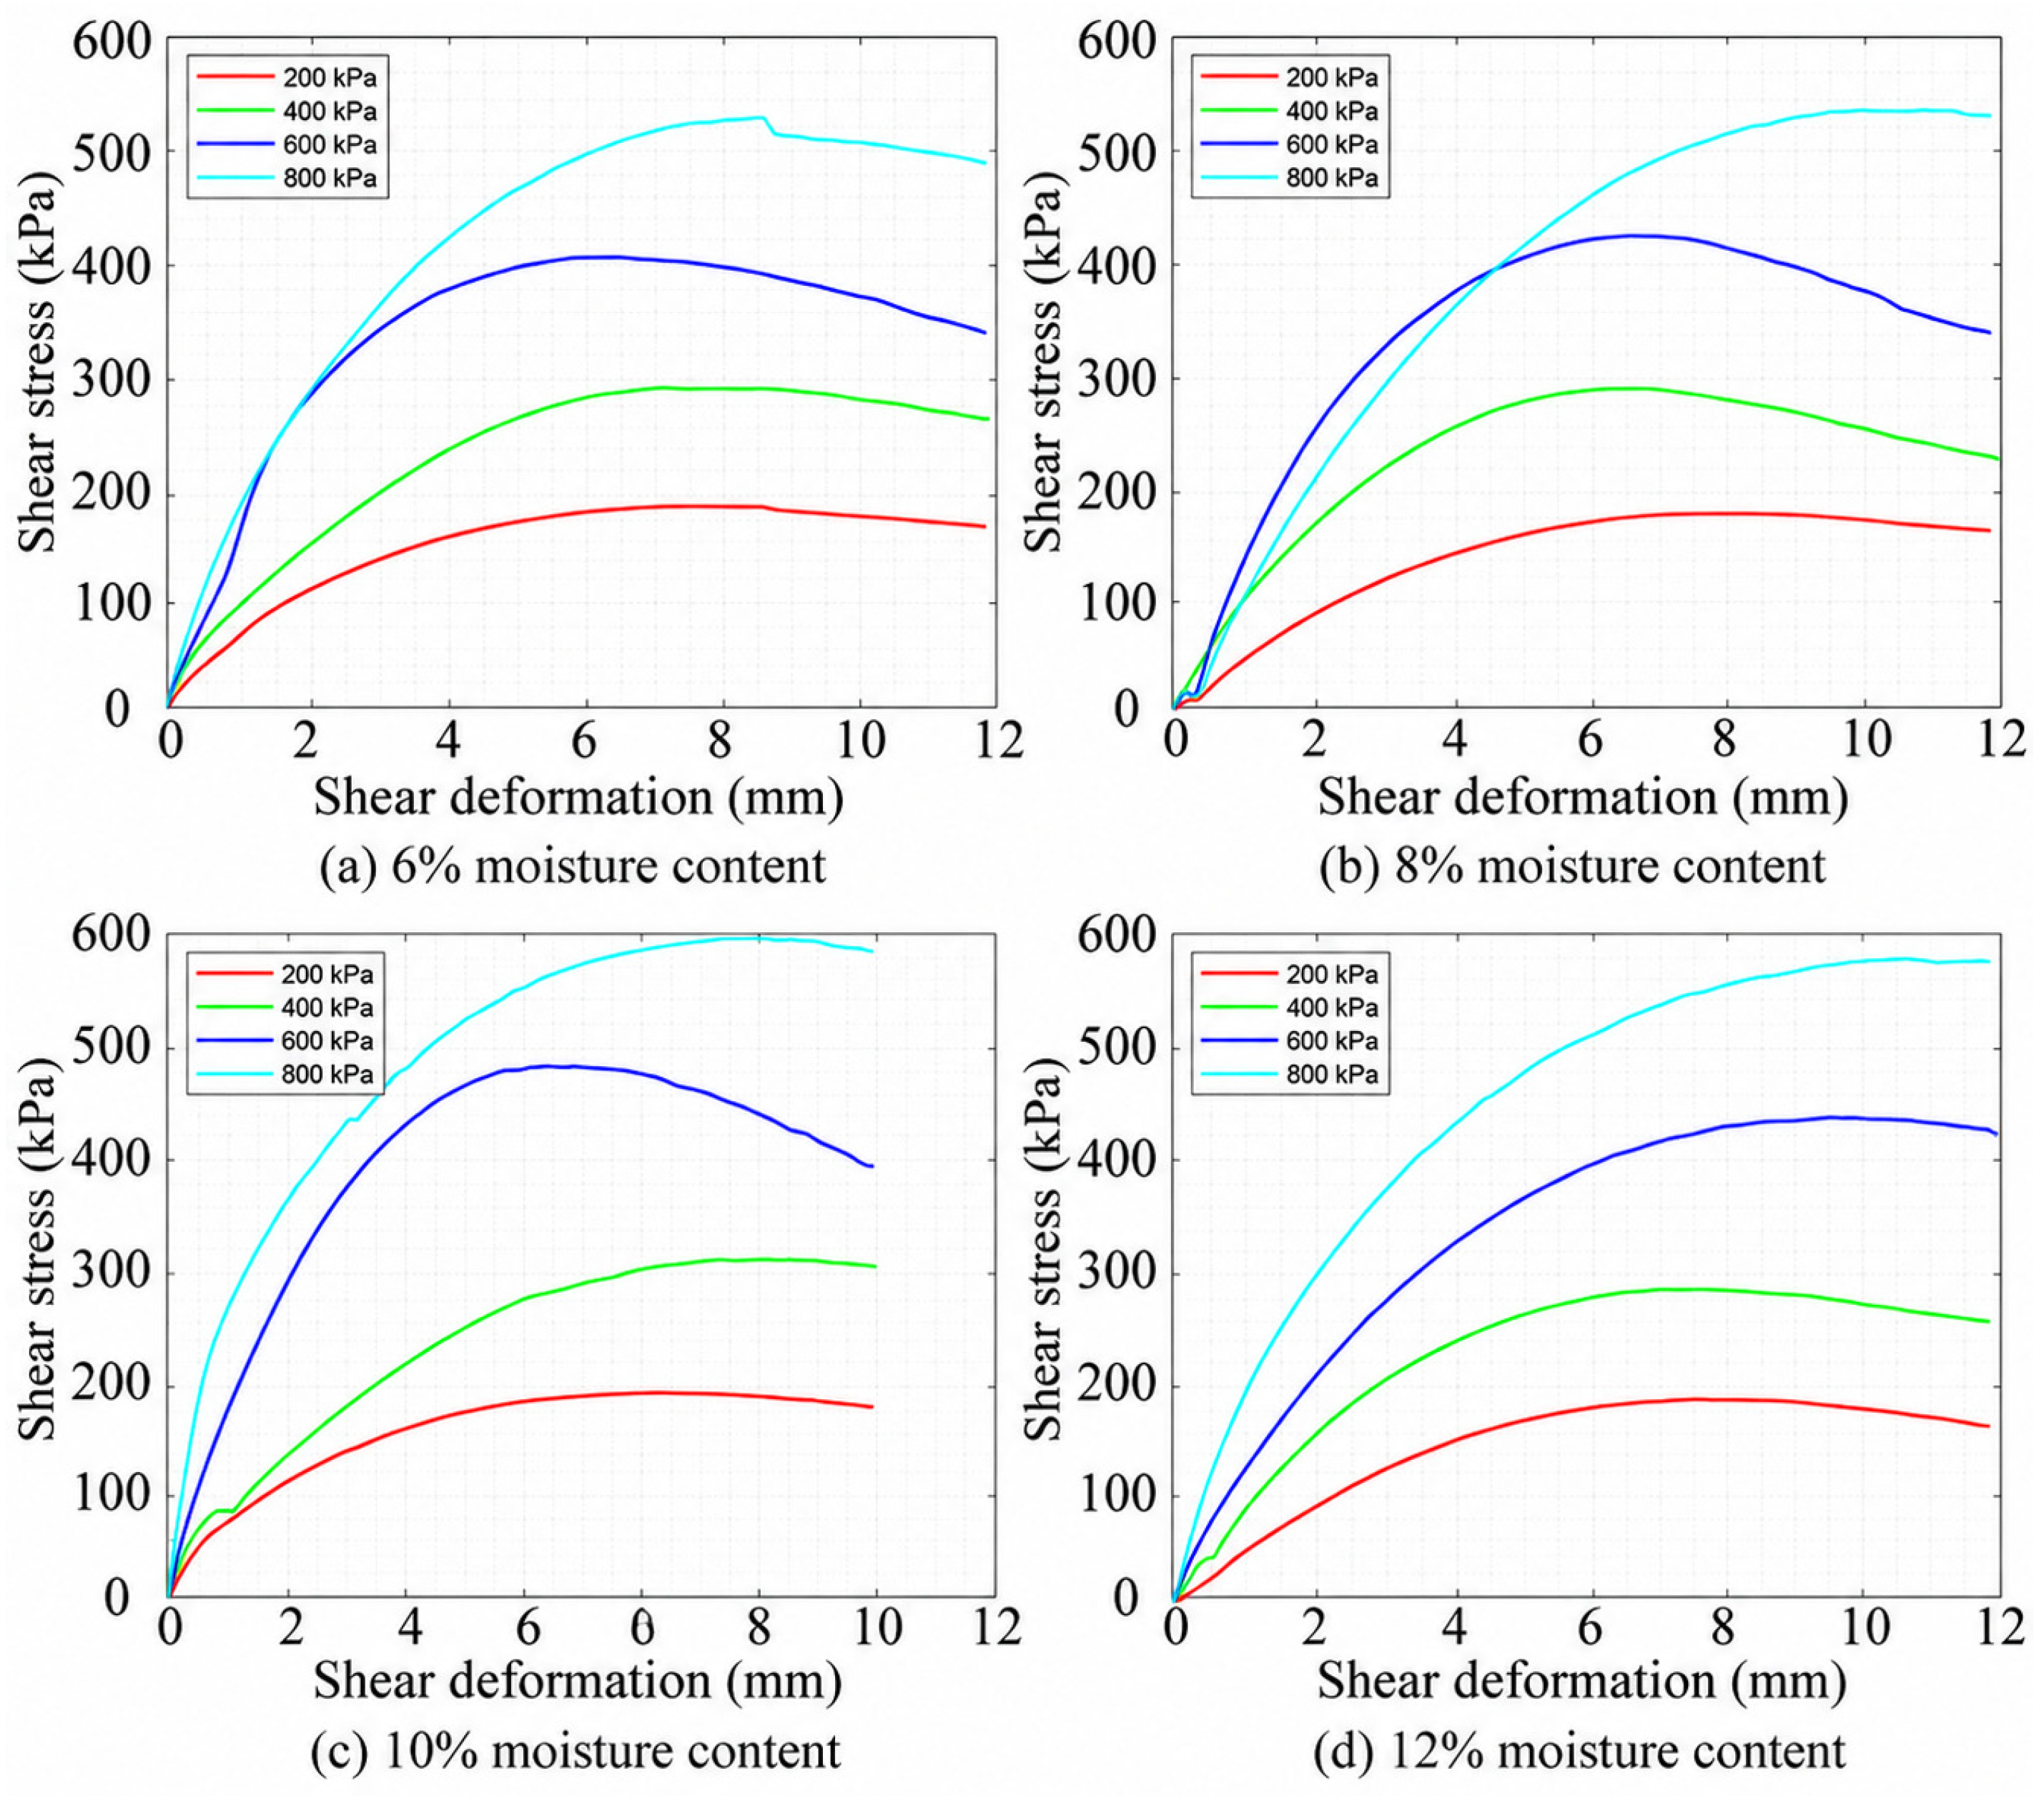
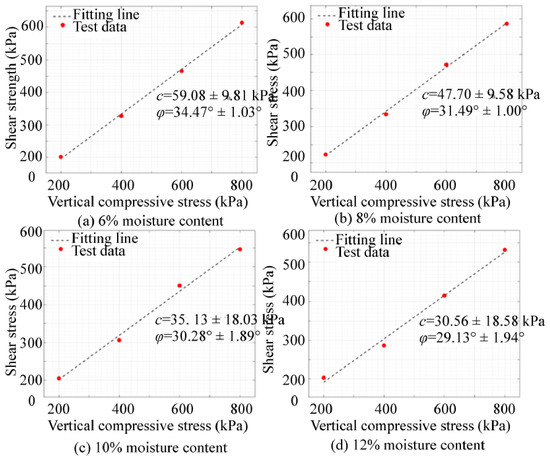
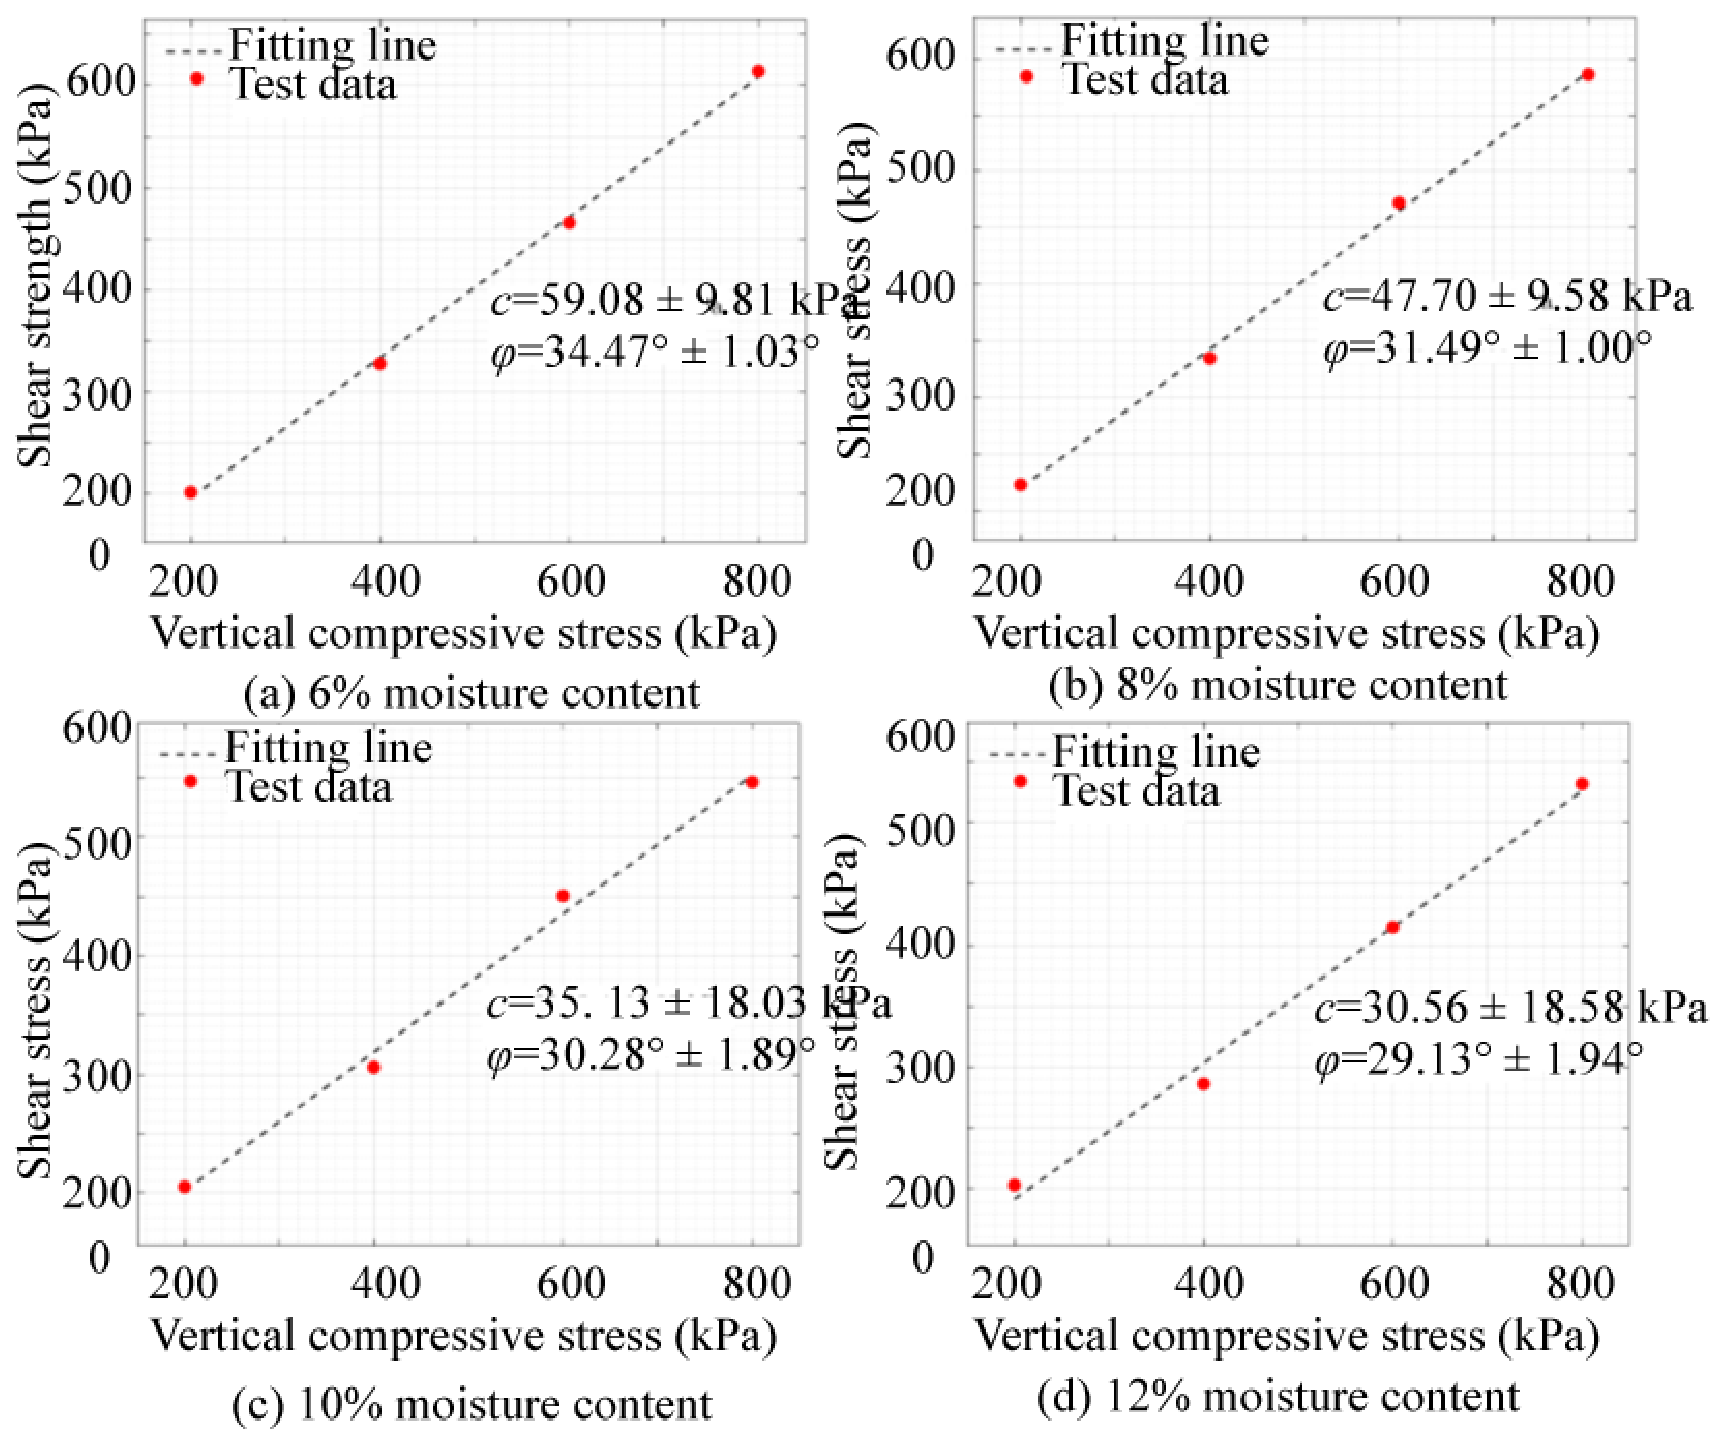
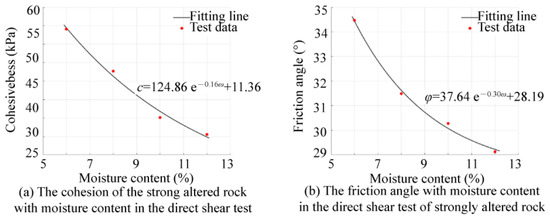
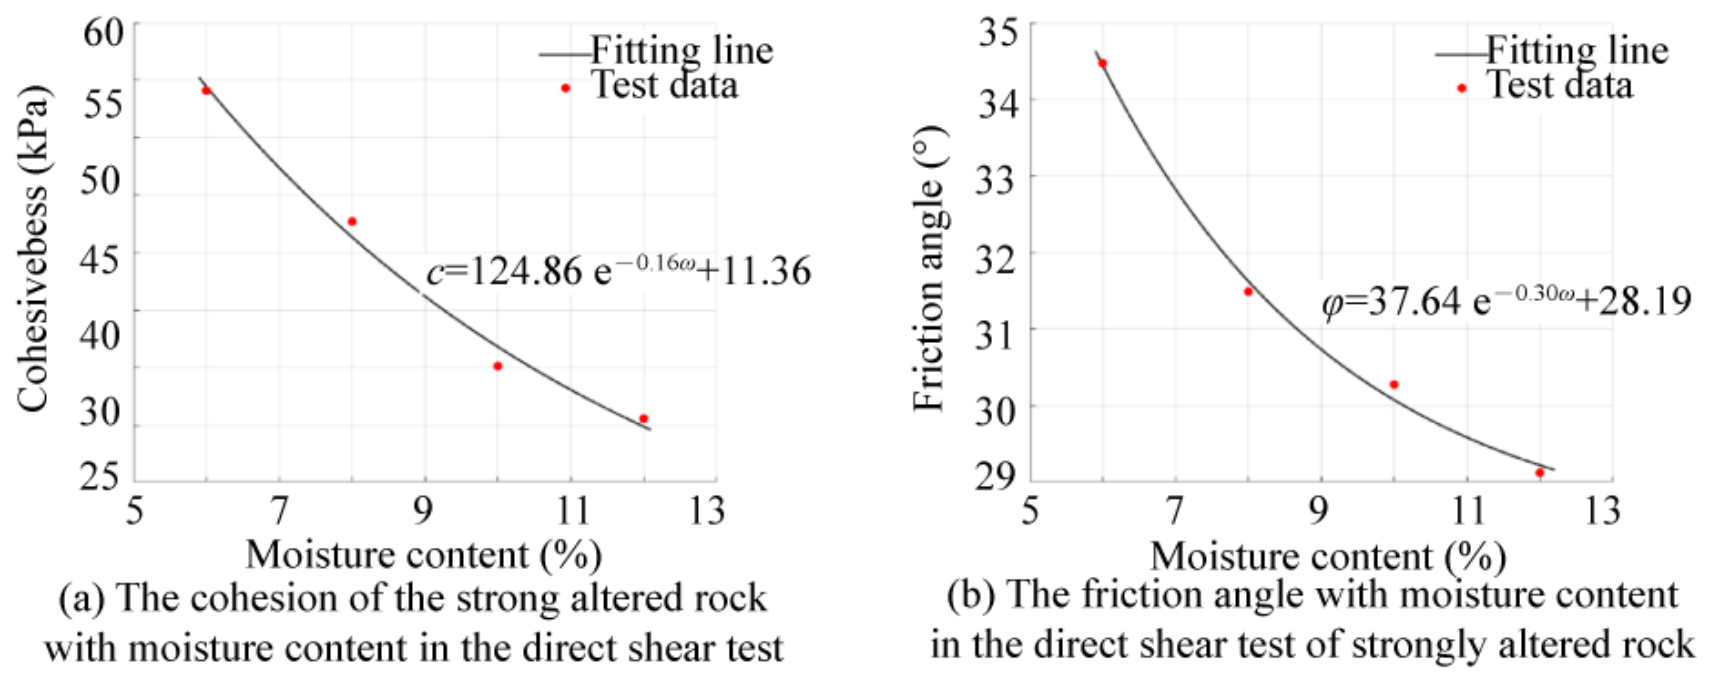
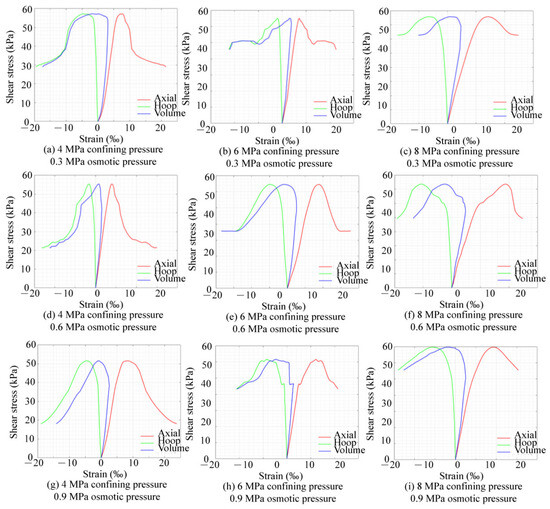
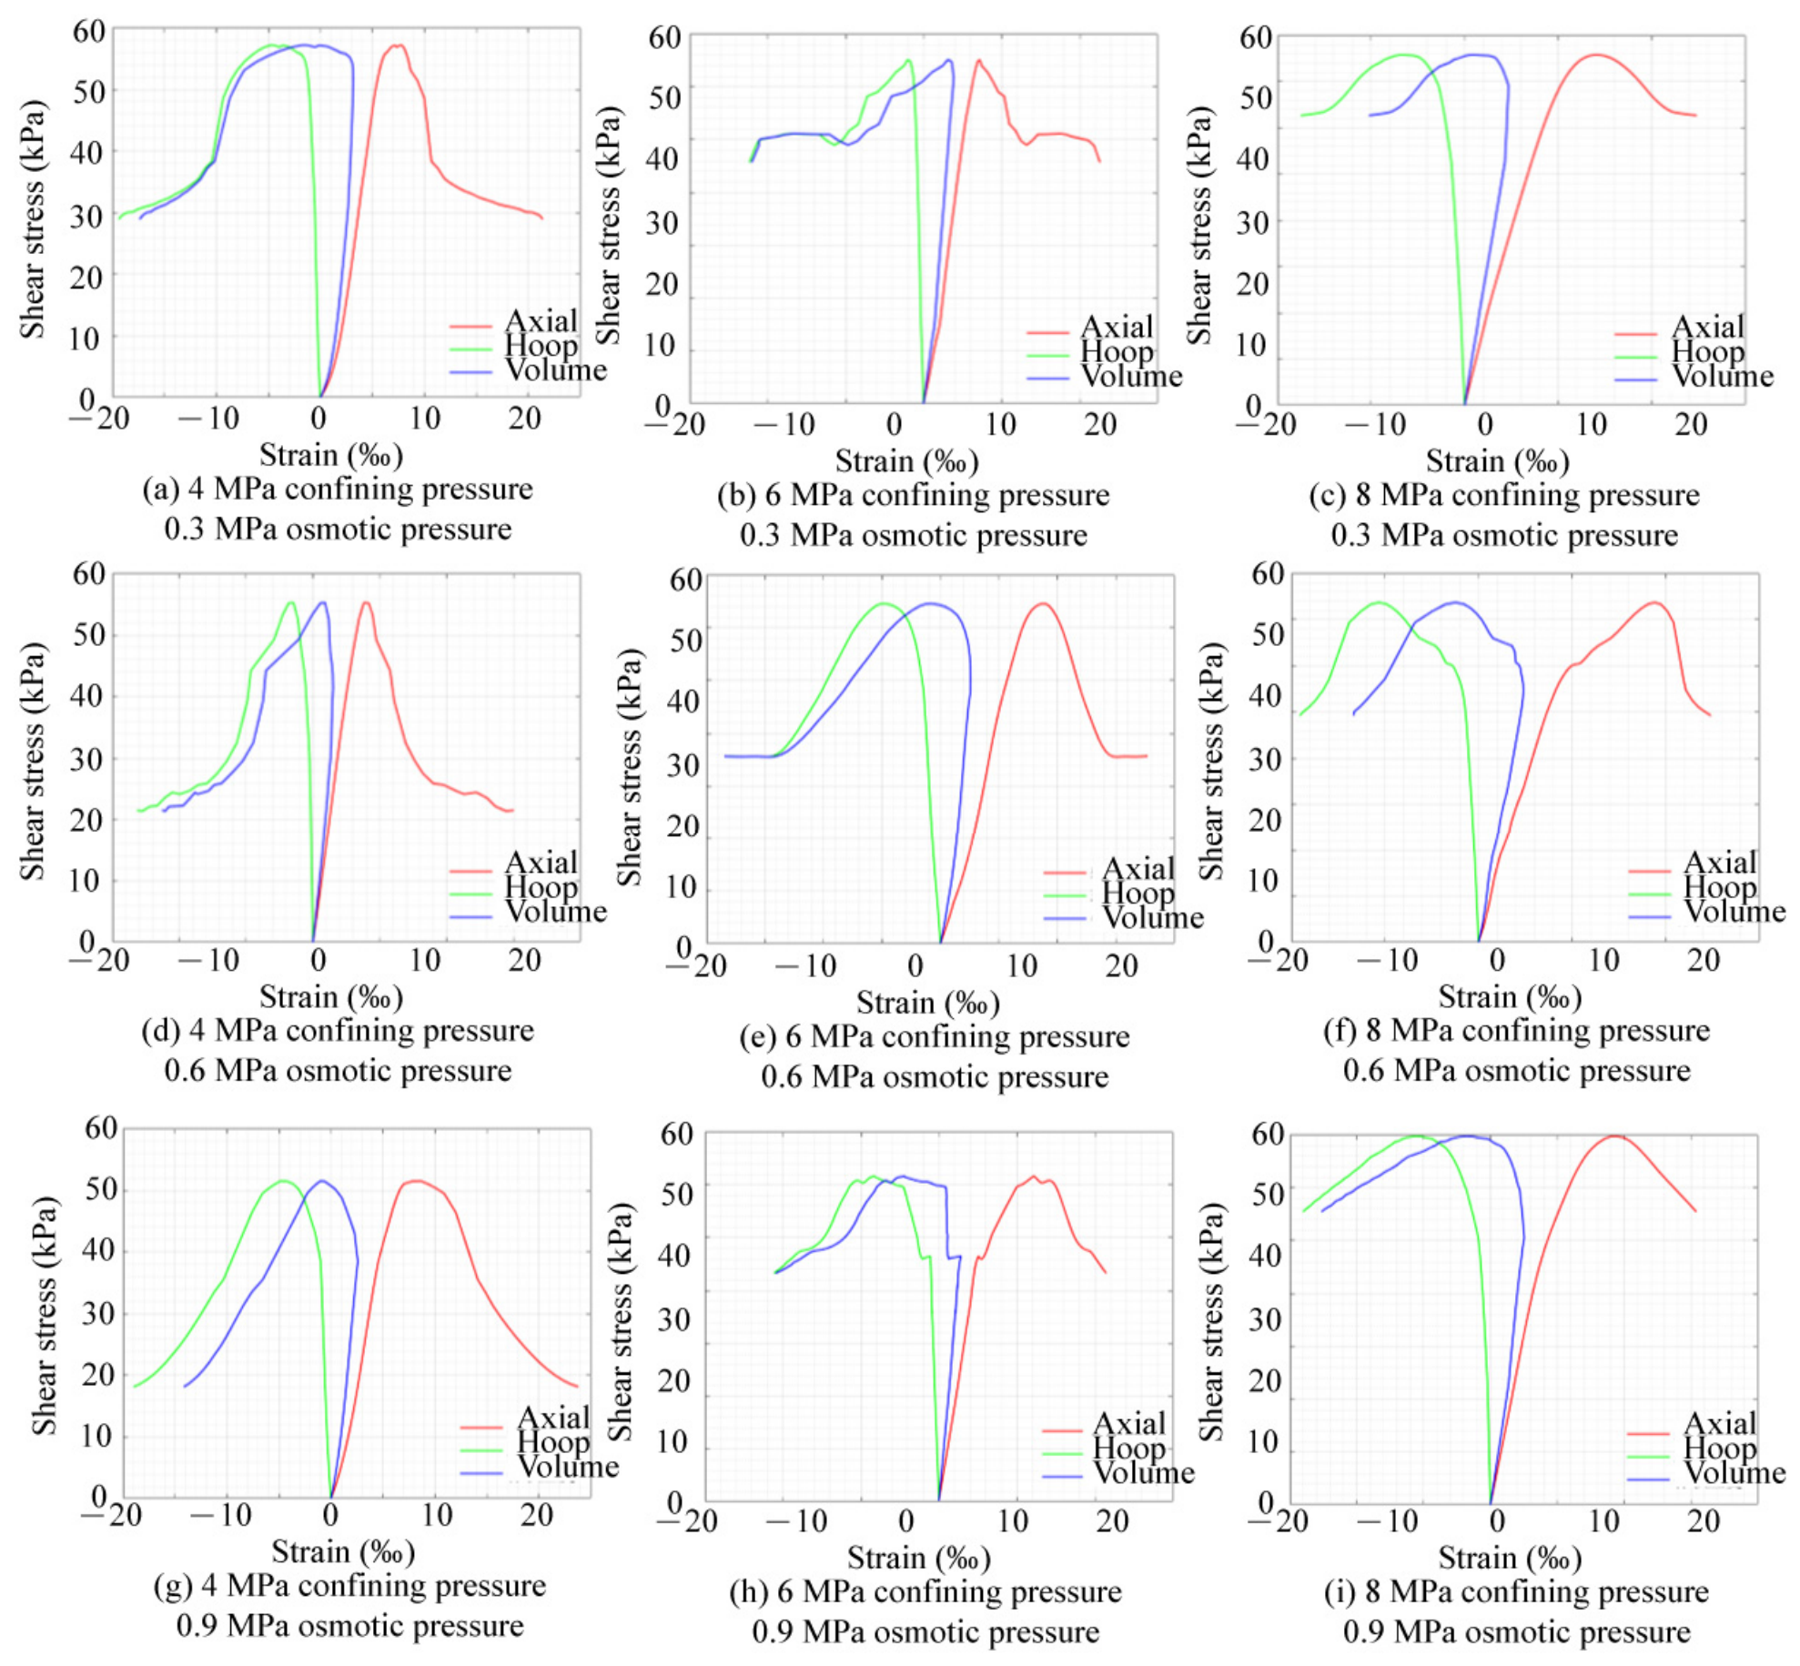
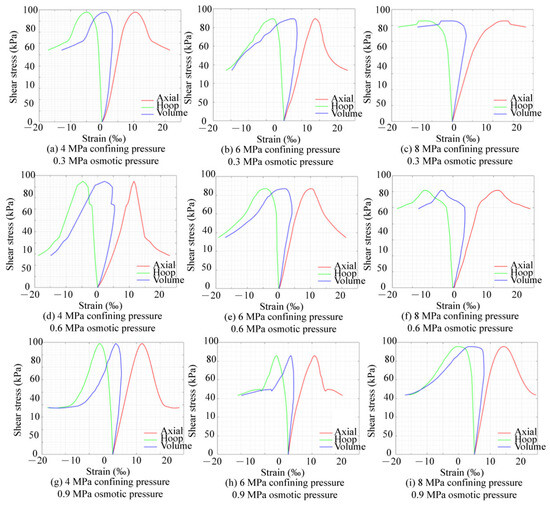
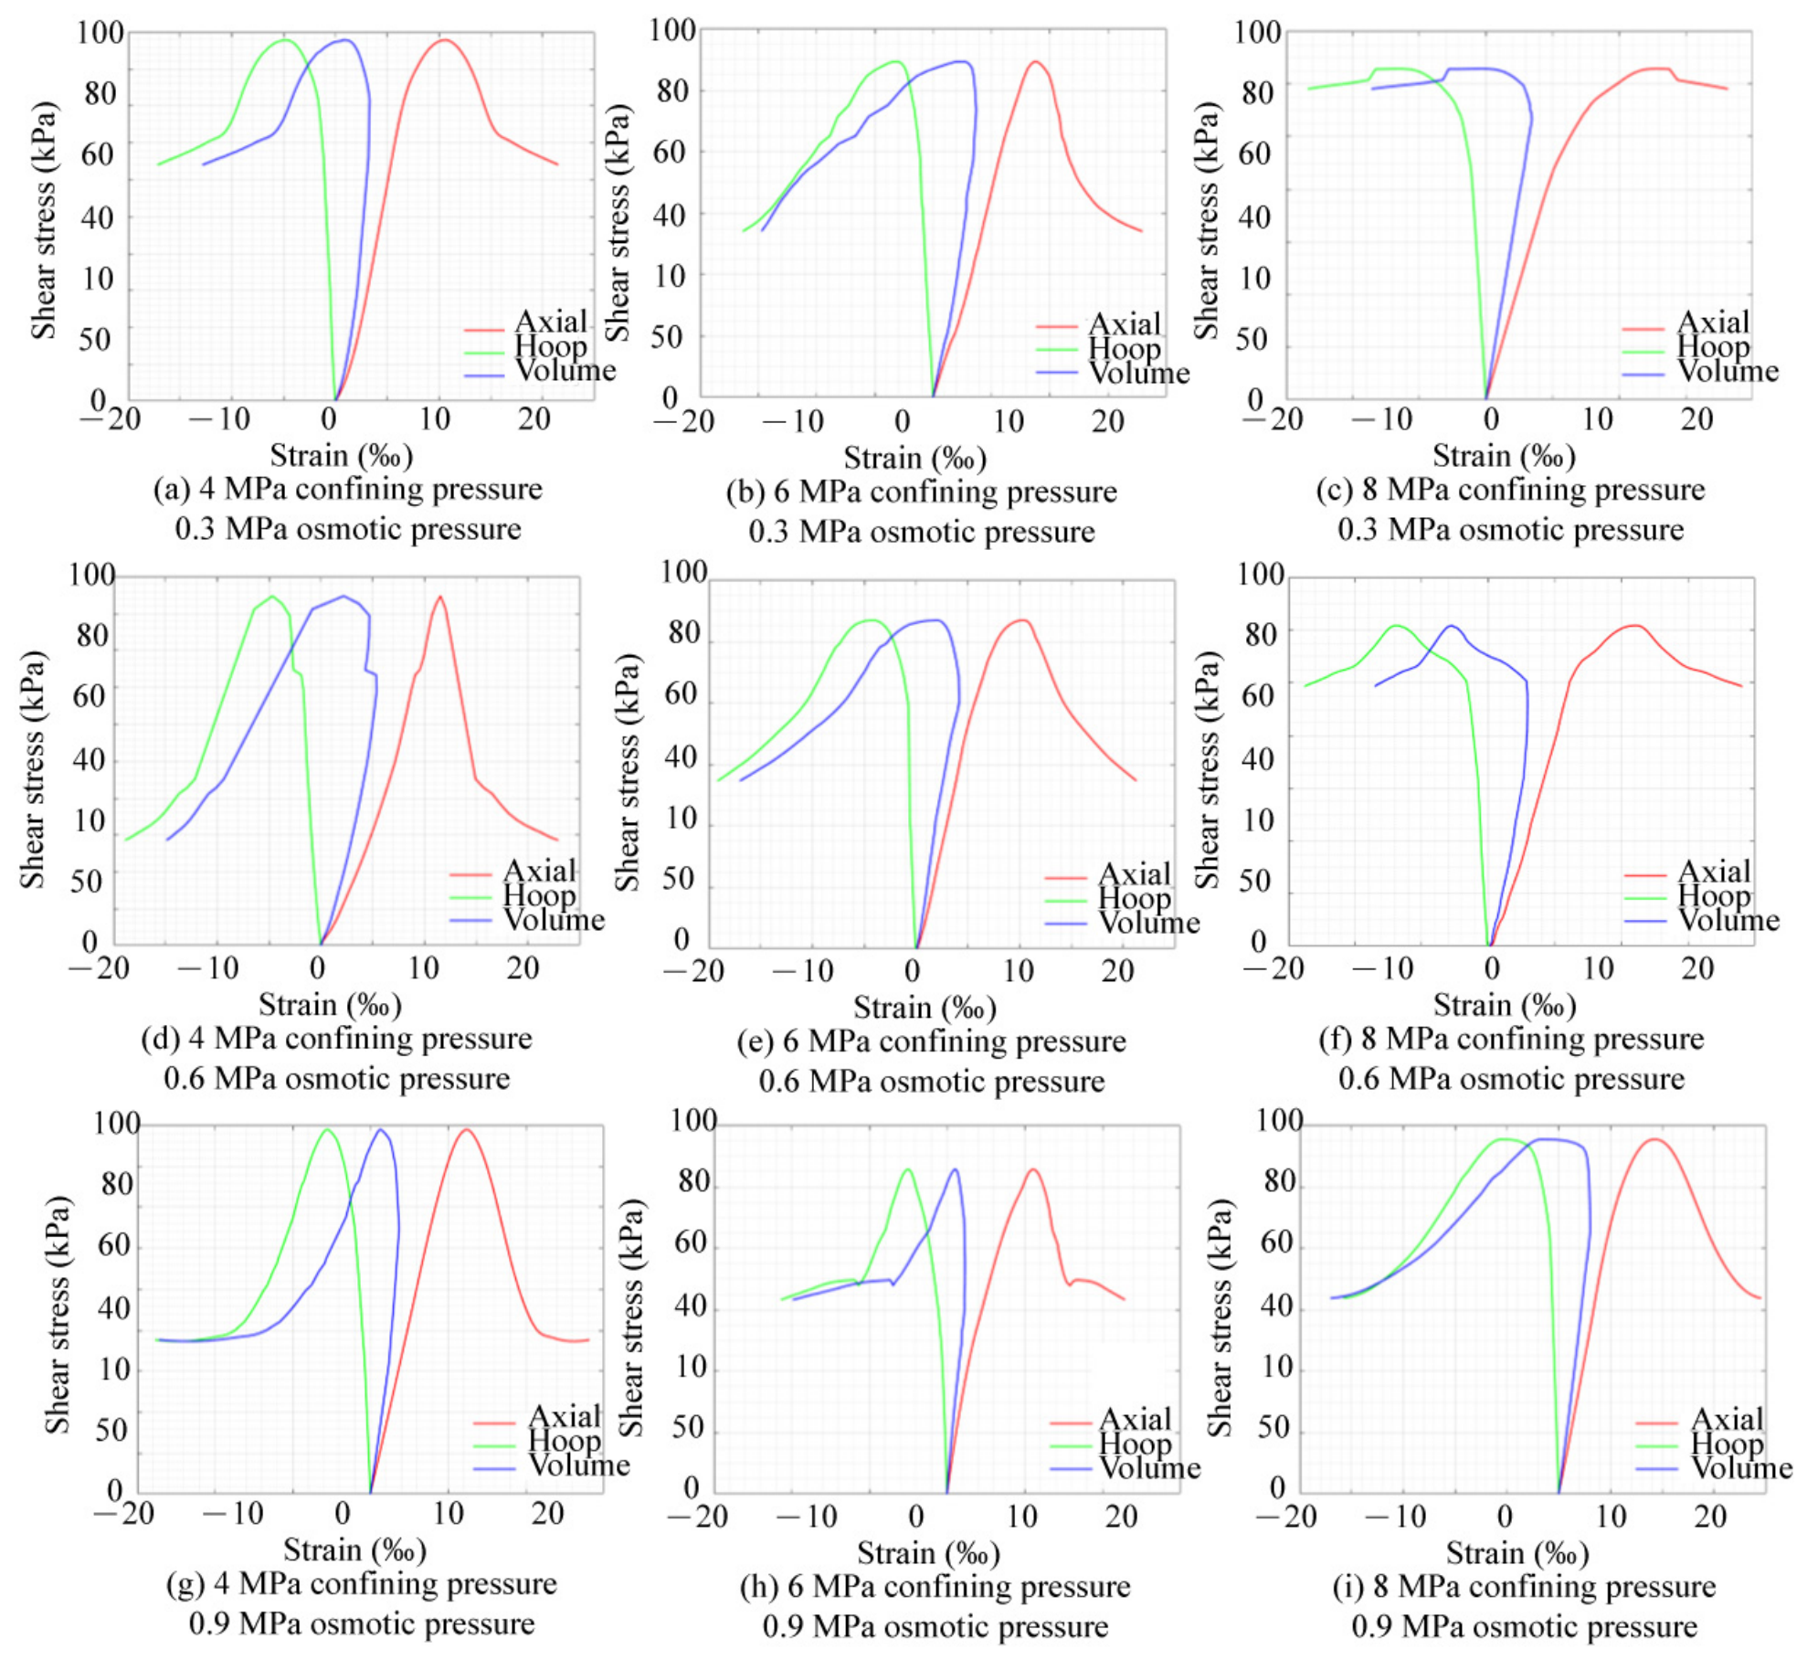
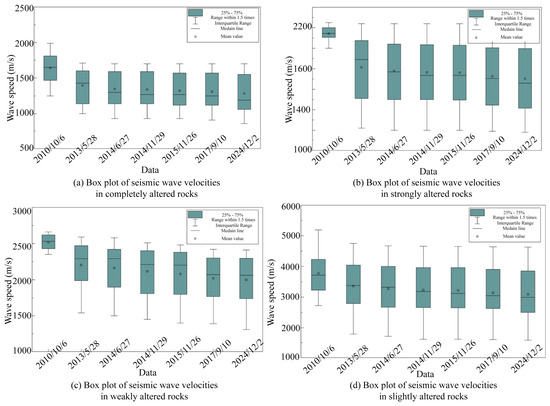
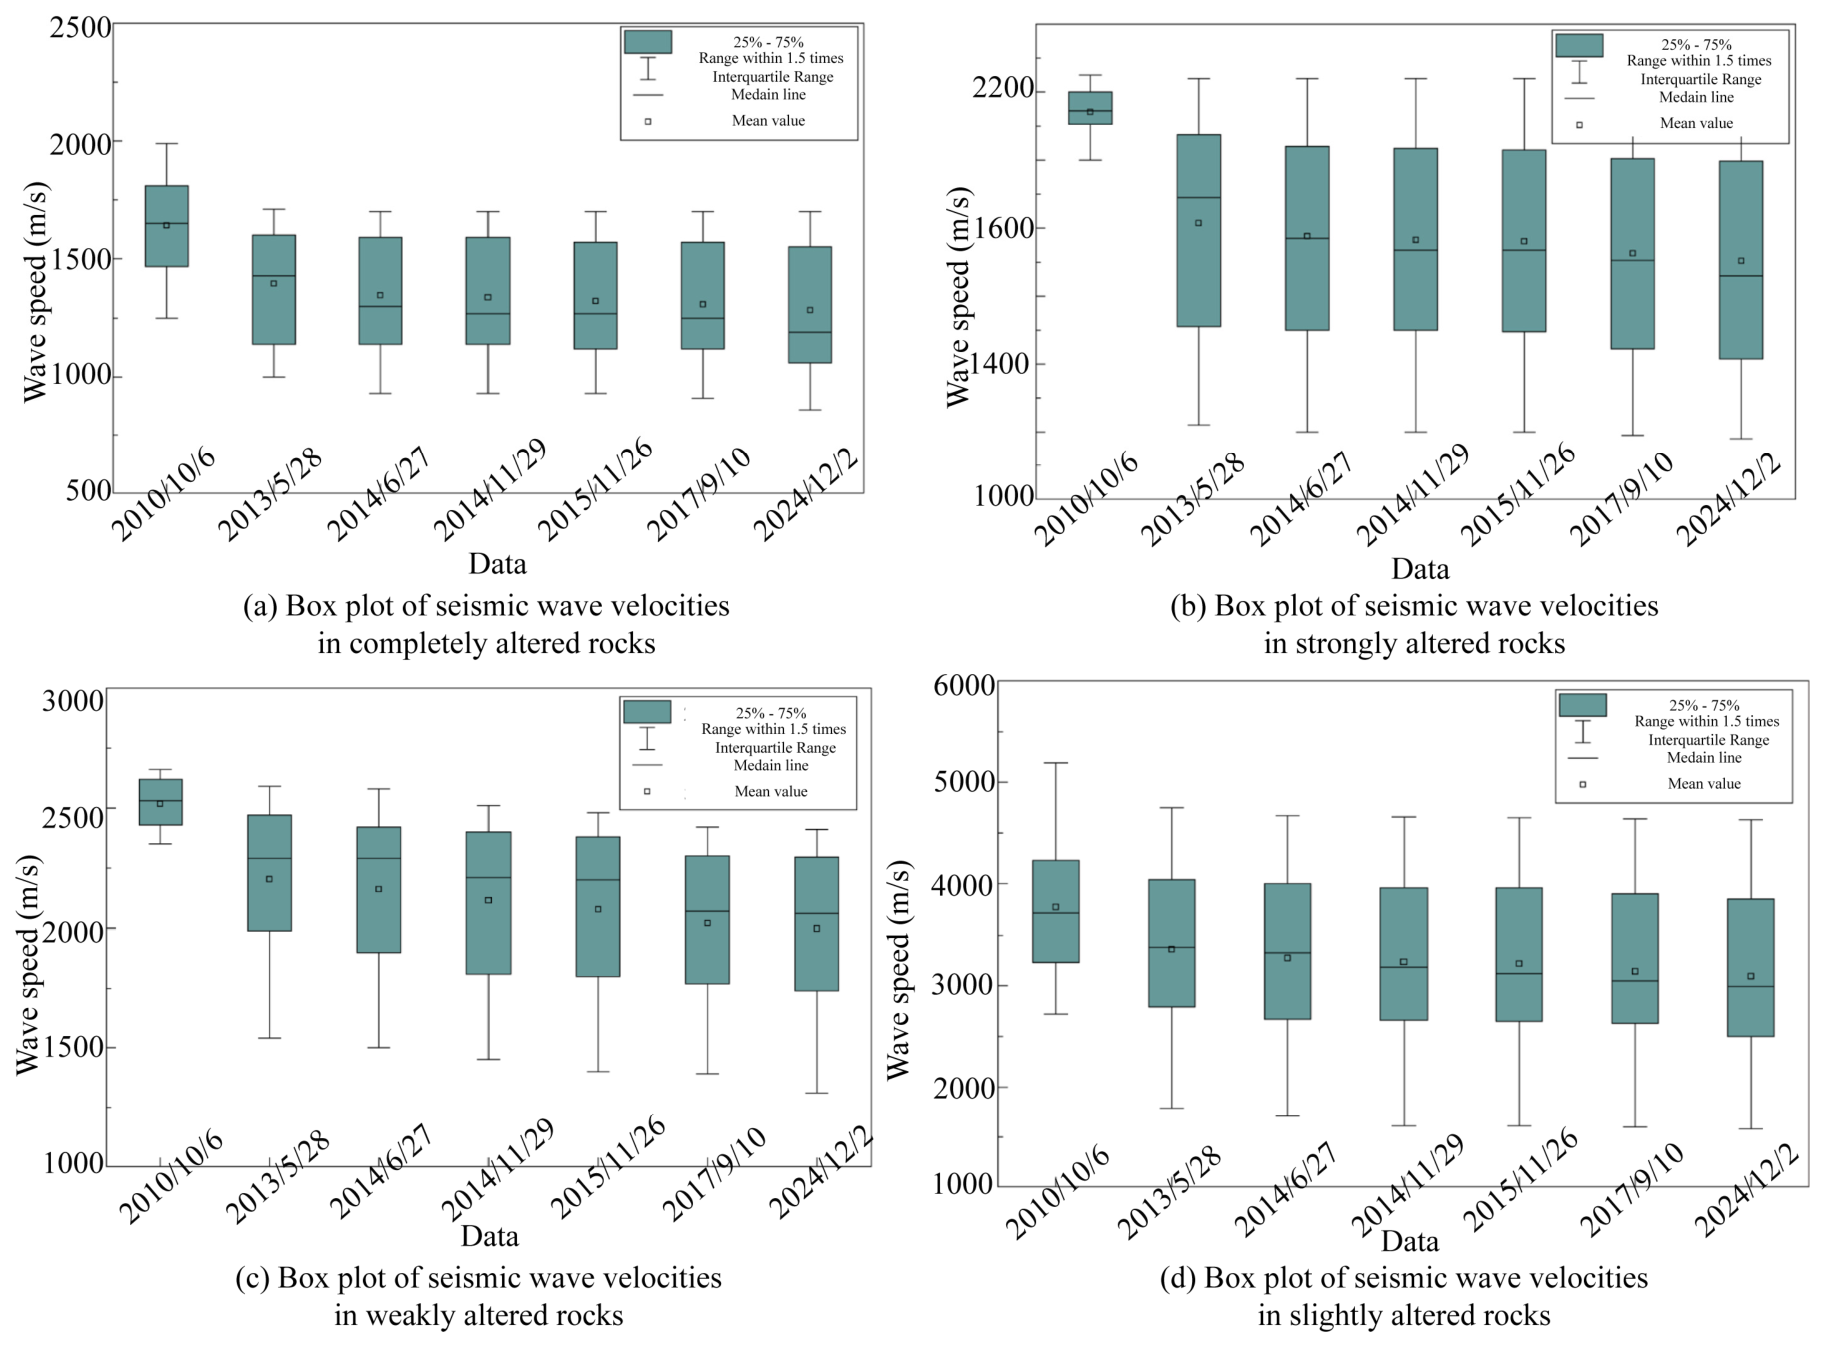
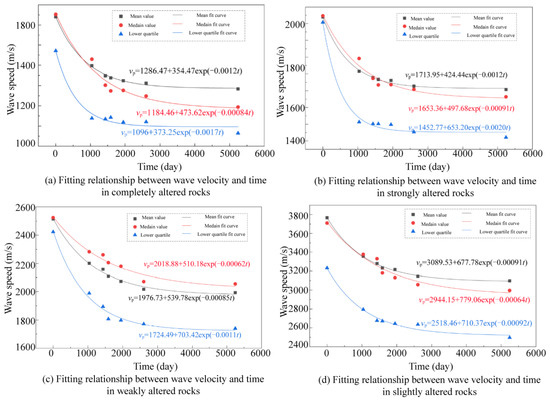
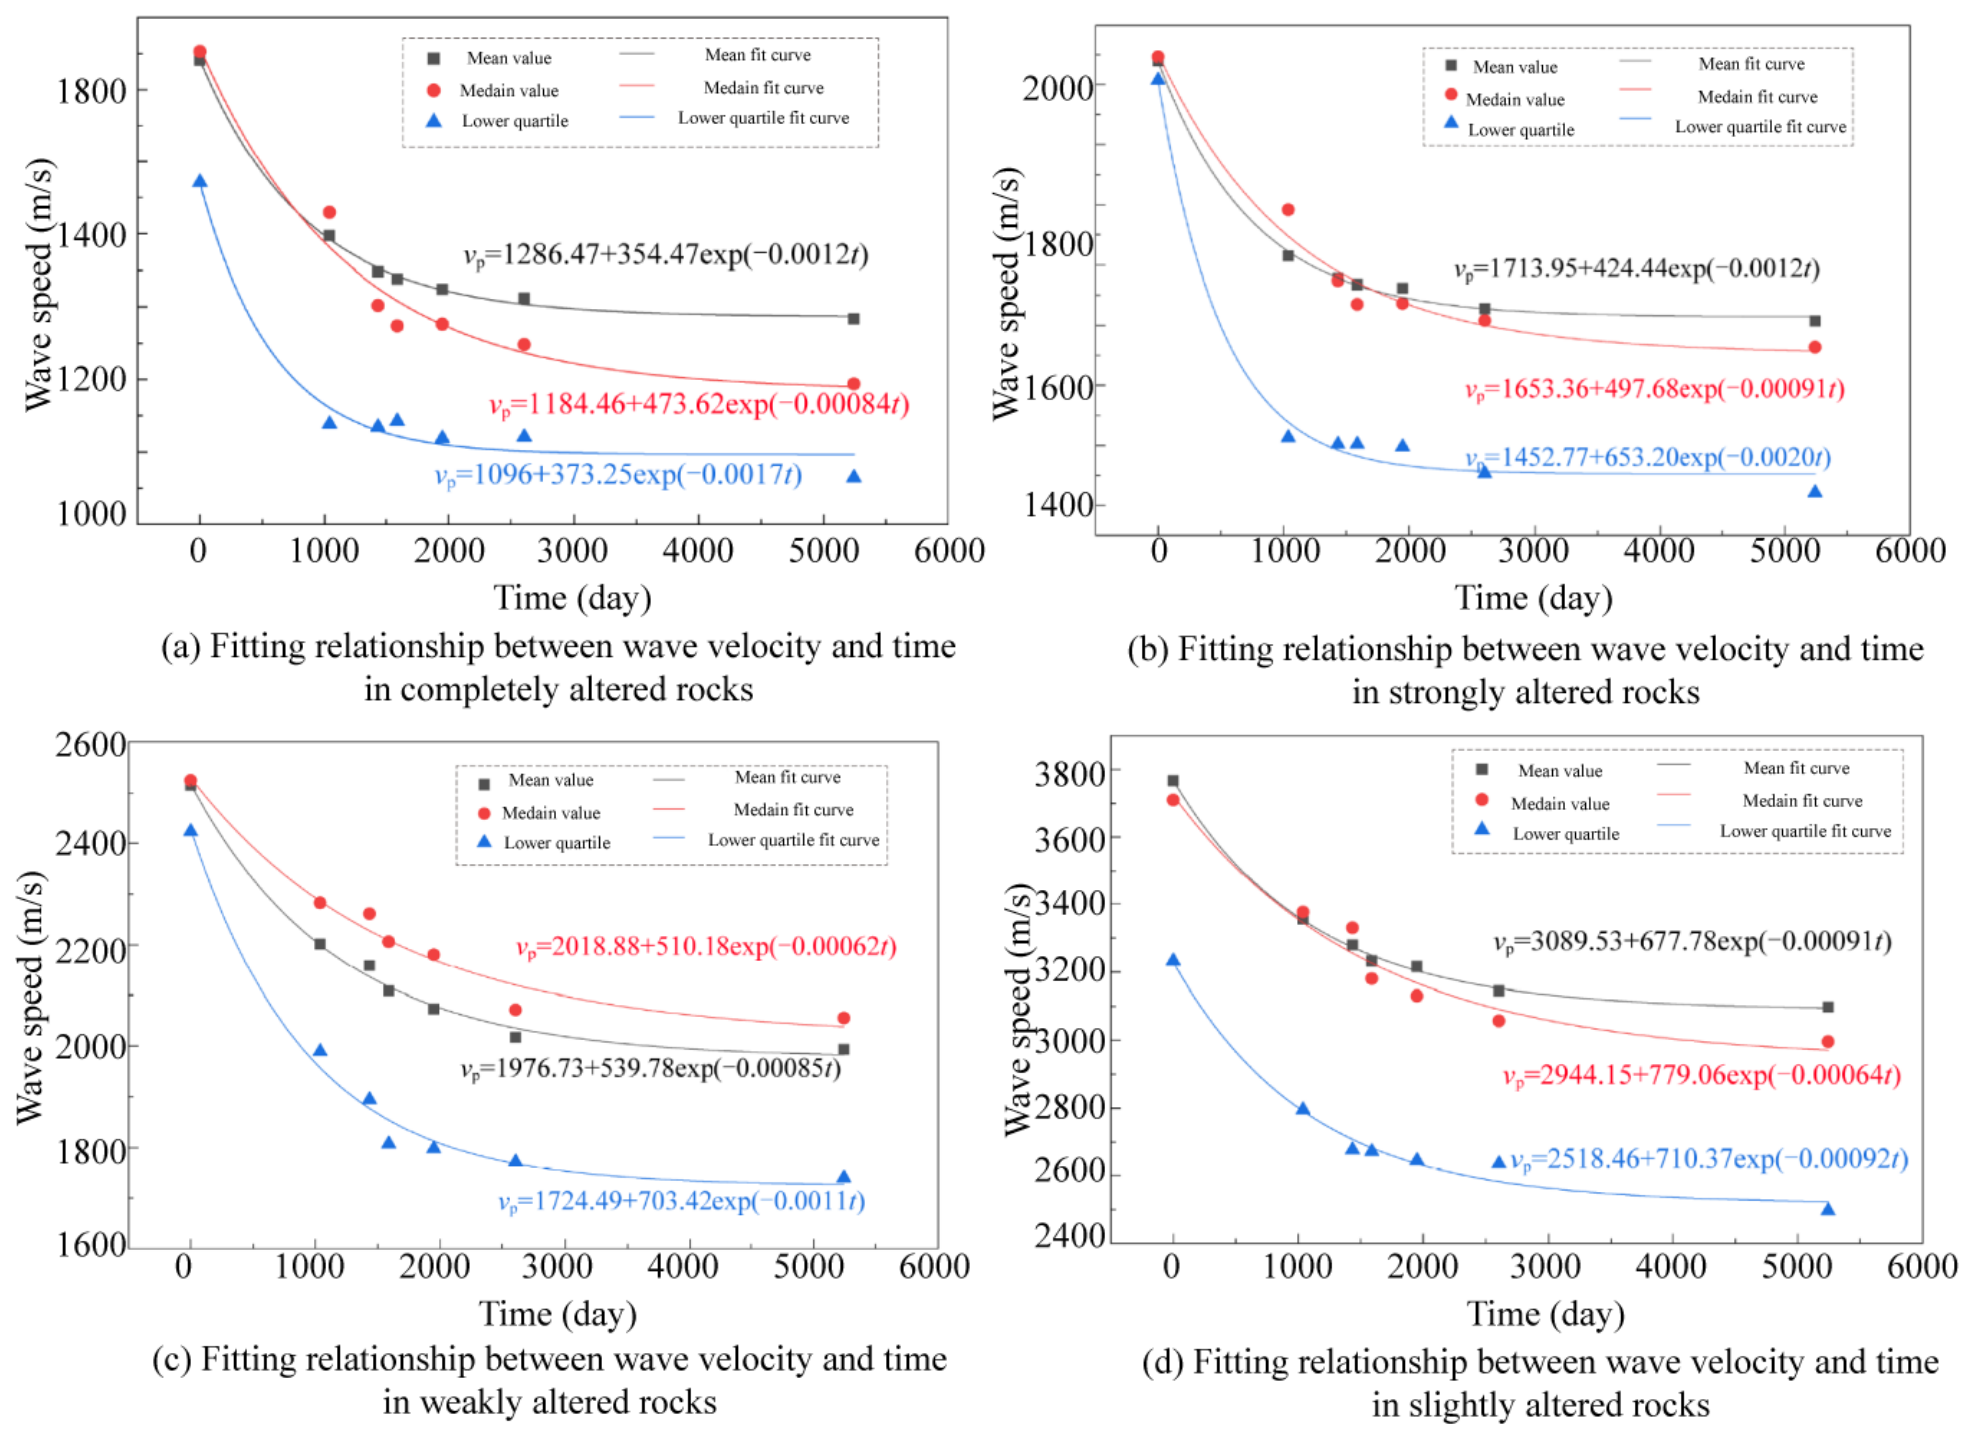
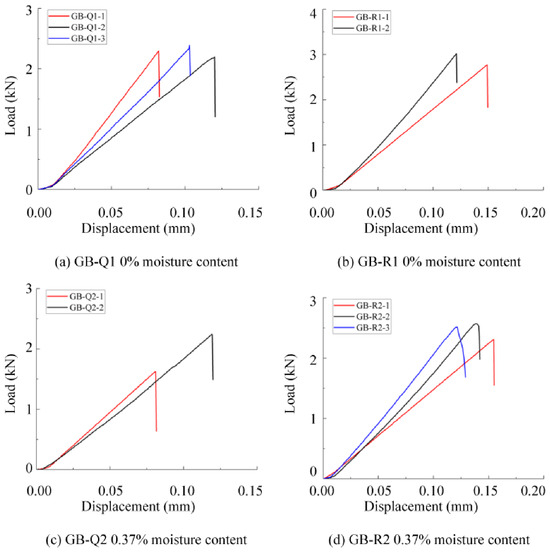
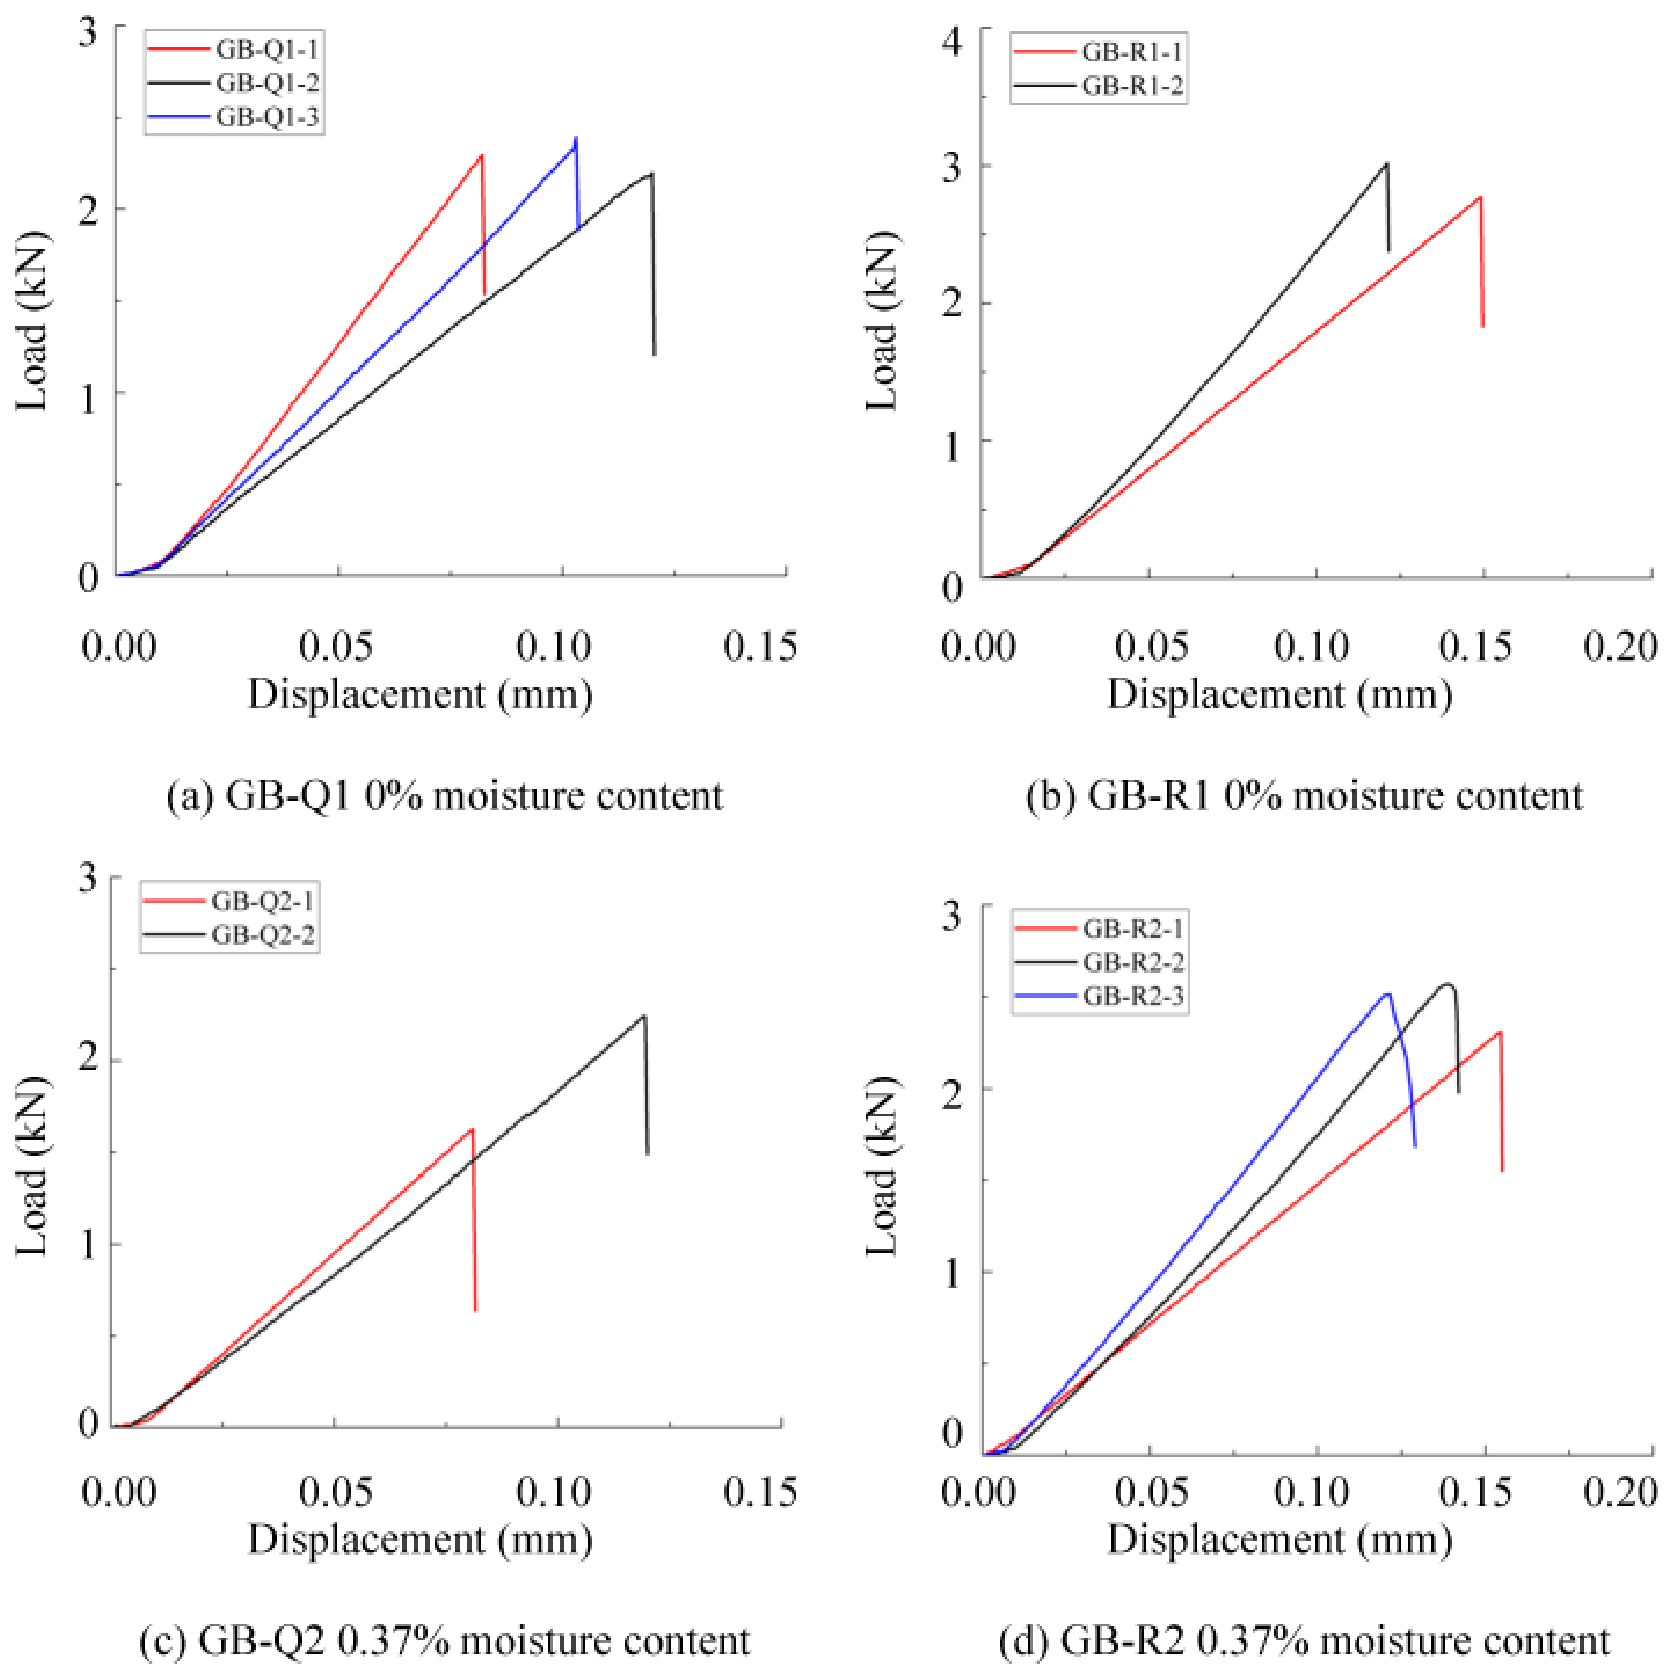

Disclaimer/Publisher’s Note: The statements, opinions and data contained in all publications are solely those of the individual author(s) and contributor(s) and not of MDPI and/or the editor(s). MDPI and/or the editor(s) disclaim responsibility for any injury to people or property resulting from any ideas, methods, instructions or products referred to in the content. |
© 2026 by the authors. Licensee MDPI, Basel, Switzerland. This article is an open access article distributed under the terms and conditions of the Creative Commons Attribution (CC BY) license.