


Highlights
- Mapped three decades of urban expansion using Landsat-based LULC analysis.
- Quantified agricultural land loss and rapid urban growth in Multan, Pakistan.
- Assessed temperature and rainfall trends using statistical trend methods.
- Linked land use change with local climatic variability.
- Provided insights for sustainable urban and agricultural planning.
What are the main findings?
- Urban land increased by 133.6%, expanding from 14.6% to 34.1% during 1988–2020.
- Orchard area declined by 84%, decreasing from 42.6% to 8.5% due to urban expansion.
- Landsat-based LULC classification achieved high accuracy (84.5–87.6%; κ = 0.79–0.83).
- Temperature and rainfall showed significant seasonal trends, while annual trends remained mostly non-significant.
- Urban growth has reshaped the landscape, highlighting the need for sustainable land-use planning.
What are the implications of the main findings?
- Supports improved urban planning to reduce agricultural land loss.
- Emphasizes the importance of conserving peri-urban agricultural areas.
- Highlights the need for climate-resilient agricultural management.
- Provides scientific evidence for sustainable land-use policies.
- Demonstrates the value of remote sensing for environmental monitoring.
Abstract
Urban sprawl in developing countries may cause loss of agricultural lands and modifications in the climatic profile of the region. In this context, this research explores three decades’ worth of changes in land use/land cover (LULC) in Multan City of Punjab Province in Pakistan and analyzes their effects on the climatic profile in terms of temperature and rainfall. Landsat Thematic Mapper images of 1988 and 1999 and Landsat 8 Operational Land Imager images of 2020 were classified by applying a per-pixel supervised classification method with the Maximum Likelihood Classification algorithm to urban, river, fishpond, orchard, and field crop land classes. Accuracy assessment of the classification was done via an error matrix and kappa statistic. Monthly and yearly climatic data (temperature and rainfall) from 2000 to 2020 were analyzed using the non-parametric Mann-Kendall trend test. Innovative Trend Analysis (ITA) was used independently to analyze trends in the low, medium, and high datasets. Urban land increased from 14.6% to 34.1%, i.e., a 125% increase in LULC, whereas orchard land decreased from 42.6% to 8.5%. There was an increase in field crop land from 42.4% to 56.2%. Classification accuracy ranged between 84.5 and 87.6% (κ = 0.79–0.83). Seasonal trends in temperature and rainfall were found significant, whereas trends in annual temperature and rainfall were non-significant.
1. Introduction
The world’s population has been primarily urban for decades, and by 2050 the proportion of people living in cities will be about two-thirds [1]. This shift is especially fast in Asia and Africa, as rural areas are rapidly being lost to cities, with the rate of urbanization outpacing the ability of planning institutions, especially in those areas, to adequately plan for it [2]. In South Asia, its effects are apparent in the continuous decline of the farms and agricultural land around urban centers: In India alone, the area engaged in non-agricultural uses has increased by around 24% from 1993–1994 to 2014–2015, leading to the loss of several million hectares of previously farmed land.
It has been a similar path in Pakistan as well. The ratio of urban population grew from around 33% to 36% of the total population between 1998 and 2018, and cultivable land decreased around urban areas [3,4], while the total number of people more than doubled during the same period. In low- and middle-income economies, planning capacities and government structures often do not exist, as is observed in more developed countries, leading to informal urban growth that is built on fertile peri-urban land, without much consideration of agricultural productivity and ecological function. Such conversion also degrades the ecosystem services that agricultural landscapes provide, and the links between LULC change and ecosystem services have become a rapidly growing research focus, particularly in ecologically fragile regions [5]. The use and alteration of land and its cover is now well established as a major contributing factor to local and regional climatic variability, as well as a spurious indicator of climatic variability at these scales [6,7]. The transformation of vegetated and irrigated surfaces to impervious and built surfaces in the urban area affects the surface energy balance, the way in which evapotranspiration and precipitation occur, and other factors related to urban hydrology, including the urban heat island effect and the changes in the timing and intensity of precipitation [8,9,10]. Similar effects have been documented in Punjab, Pakistan, where rapid built-up expansion in Sheikhupura District between 2000 and 2020 was accompanied by rising land surface temperatures [11]. The bidirectional nature of these interactions means that land use and land cover (LULC) dynamics in a particular urbanizing area need to be analyzed together with climate trends in the same period of time [12,13].
One such fast-growing urban city is Multan of South Punjab, Pakistan. The district is historically noted for its orchards (some of which are irrigated) and fertile alluvial agricultural fields that line the Scheduled River Chenab, for mango cultivation in particular, and there has been high growth in residential and commercial investment activities in the district in the last 30 years. By 2017, an official estimate was that over 10,000 hectares of land belonging to the irrigated sector in Multan had become urban land, and dozens of new housing schemes were approved by the local development authority since 2015. Multan experienced substantial population growth between 1998 and 2017, with its population increasing from 1,197,384 to 1,871,843, representing a total increase of approximately 56.34% over the 19-year period, equivalent to an average annual increase of approximately 2.97% [14]. The loss of farmland and the rapid rate of population growth directly threaten the provision of food for local populations, and the land cover change affects local climates, but in separate but related ways. However, complete multi-decadal quantification of LULC change in Multan city based on remote sensing data, coupled with meticulous statistical modeling of the climate record during the same period, has not yet been done. Several regional studies have been conducted in different districts to monitor changes in crop patterns and land degradation in the nearby region in recent years [15,16], but to our knowledge, a comprehensive assessment of habitat characteristics and climate change in that region within the area of Multan from 1988 to 2020 has not been documented in the peer-reviewed literature.
This study aims to quantify and characterize land use/land cover (LULC) changes in Multan, Pakistan, from 1988 to 2020 using multi-temporal Landsat imagery and per-pixel supervised classification, with classification accuracy assessed through an error matrix and Cohen’s kappa statistic. It further investigates long-term monthly and annual trends in temperature and rainfall from 2000 to 2020 using the non-parametric Mann–Kendall trend test and Innovative Trend Analysis (ITA). Finally, the study examines the relationships between observed climatic trends, urban expansion, and agricultural and orchard land loss, providing empirical insights into land-use change and climatic variability in a rapidly urbanizing South Asian city. The study hypothesizes that urban settlement has expanded significantly and that agricultural and orchard areas have declined alongside detectable changes in climatic variables.
2. Materials and Methods
2.1. Study Area
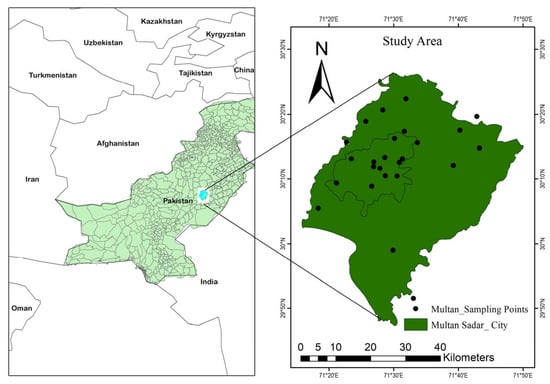
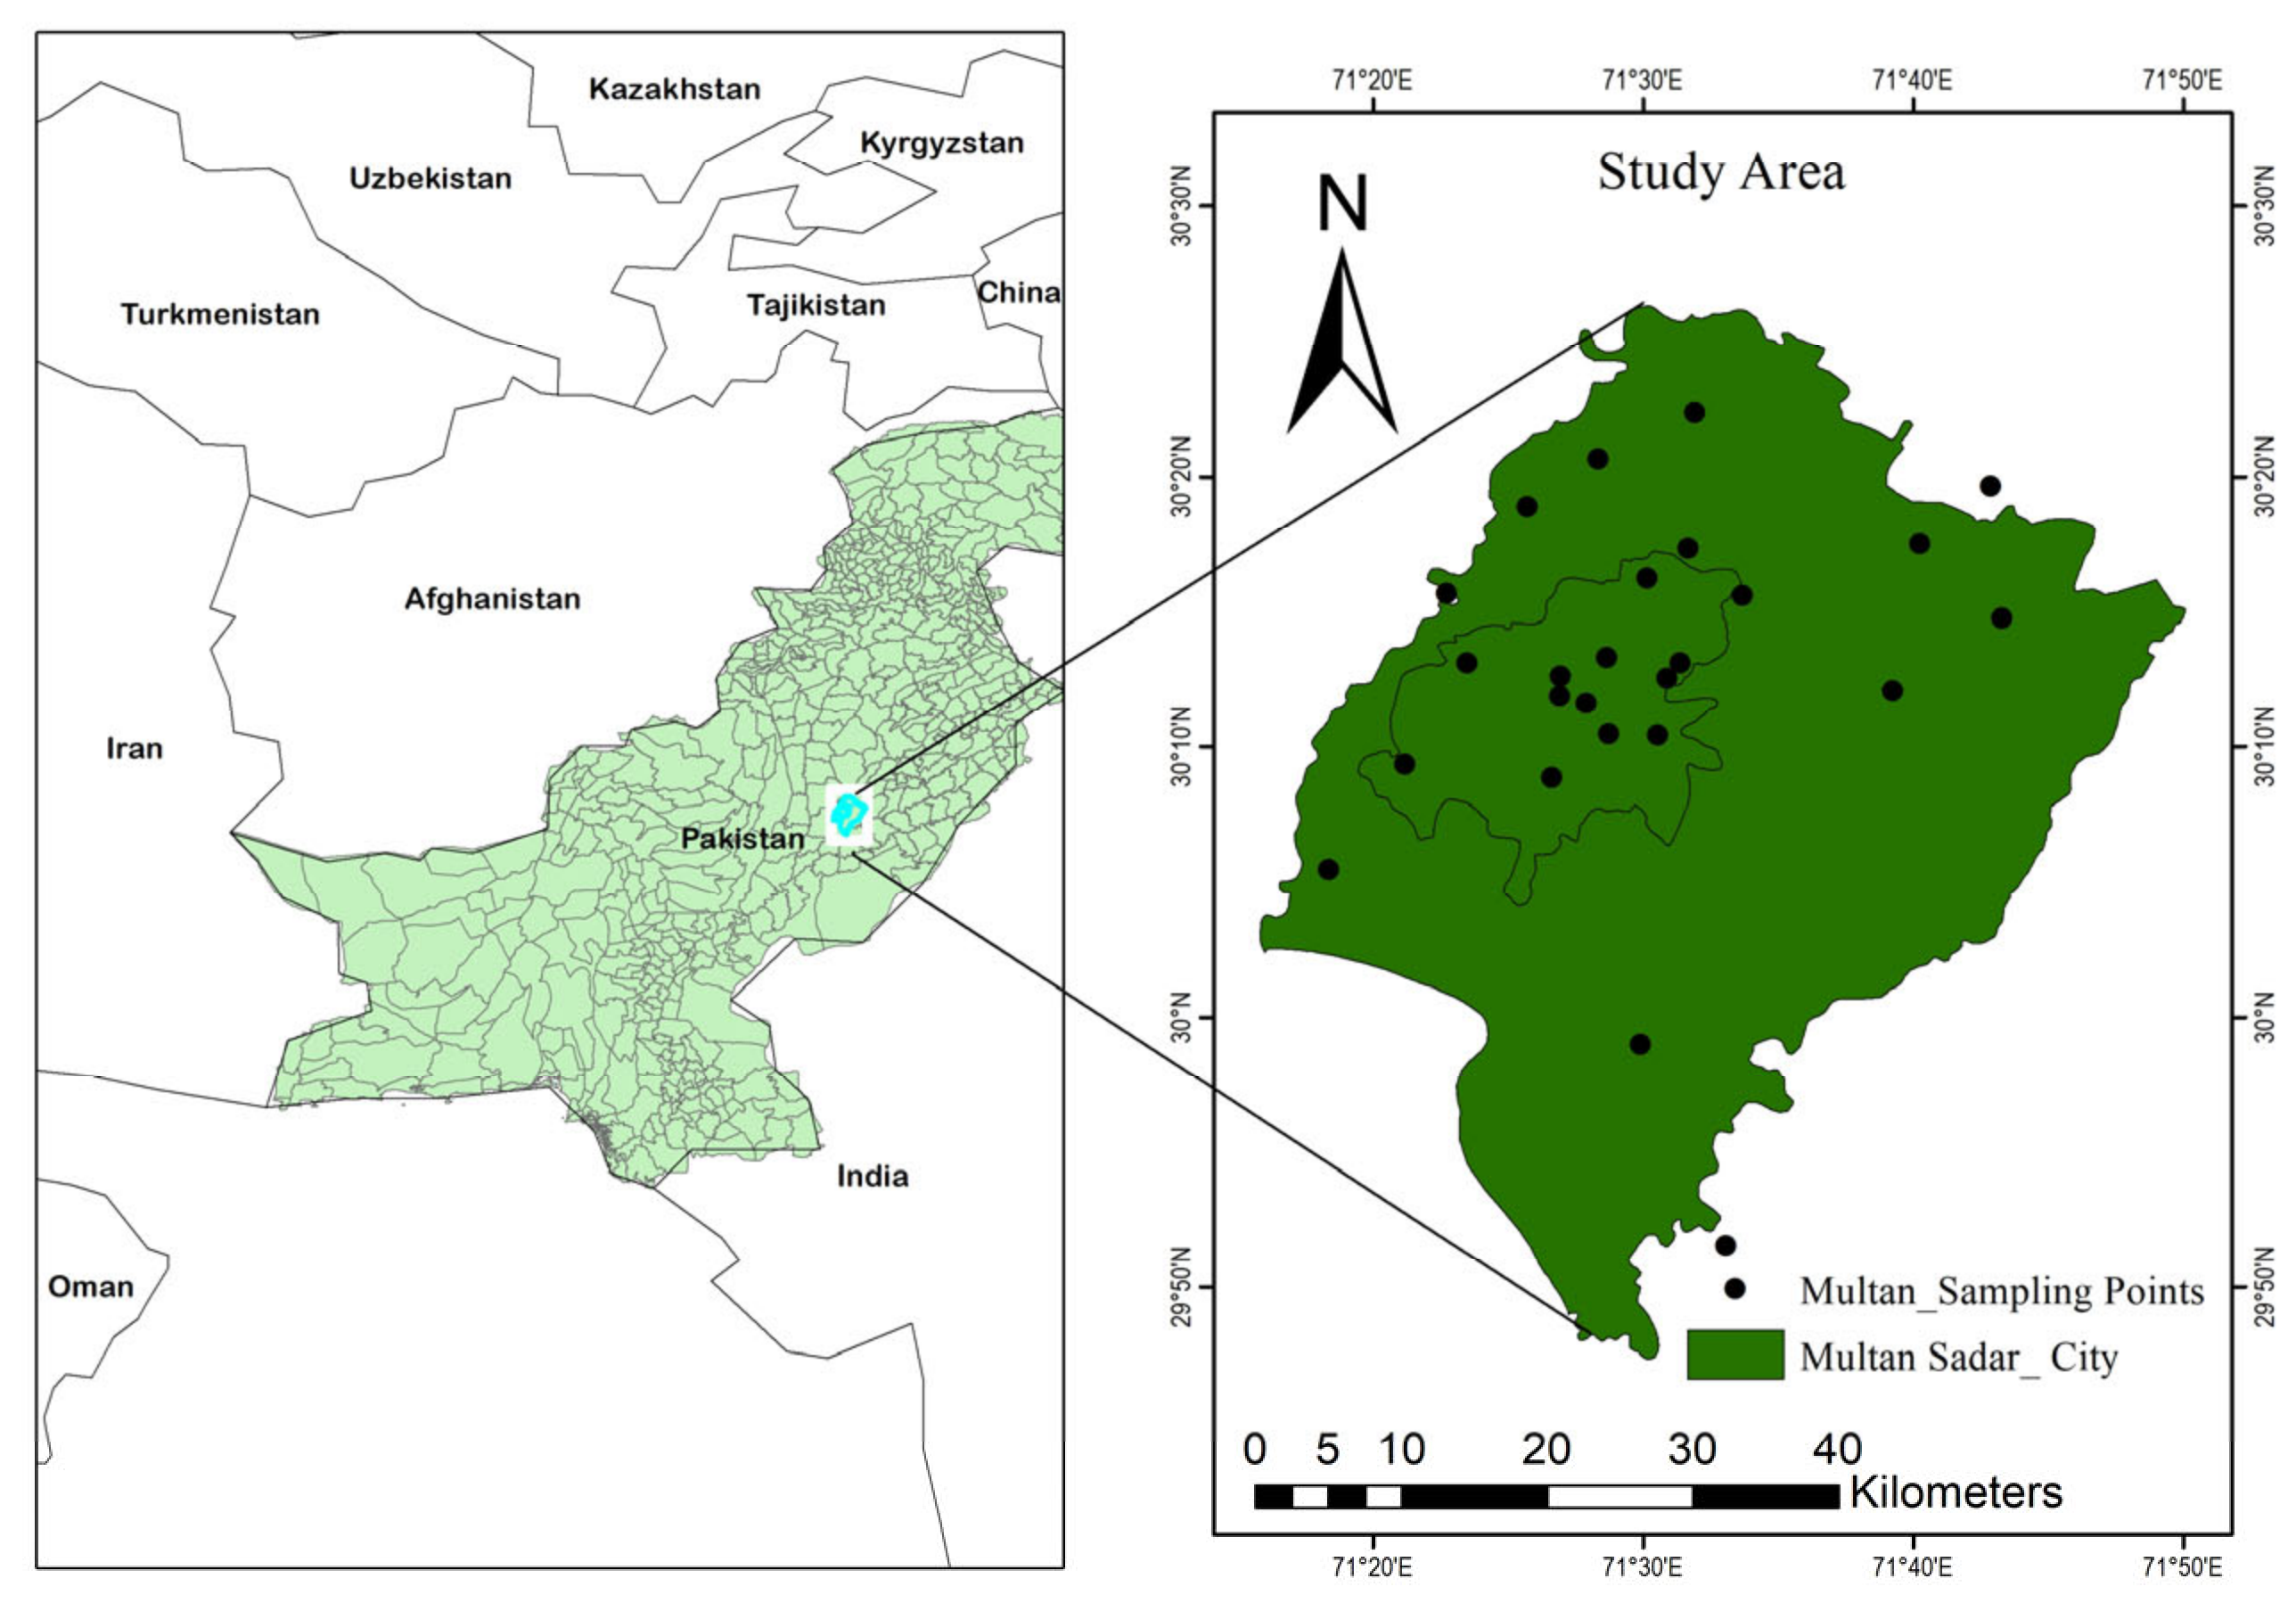
The study area consists of two administrative tehsils of Multan district: Multan City and Multan Saddar in southern Pakistan, with an area of about 1020 km2 (29.32–30.46° N and 70.96–71.81° E) [17] (Figure 1). It is located in the middle part of the country, and the soil varies from sandy gravel to sandy clay loam. The district is at an average height of about 122 m, and is bordered in the west by the Chenab River, in the east by Lodhran district, in the north by Khanewal district, and in the south by Bahawalpur district. The colloidal nature of the soil varies from sandy gravel to sandy clay loam. Saddar tehsil is the closest to the river and commonly gets flooded by monsoon rains. It is an agriculturally important region, known for a great mango orchard [18] and for rich alluvial cropland, and its population increased from about one million in 1988 to nearly 2.5 million in 2018, with about 40% urban population as per the Government of Pakistan, 2021 [4]. Multan’s climate is semi-arid to arid with hot summers and cool winters. As per the records of the Pakistan Meteorological Department, mean winter minimum temperatures (December–January) reach up to 4.6 °C, and mean summer maximum temperatures reach about 50 °C during the hottest summer months (May–August), while the mean annual rainfall falls below 200 mm, occurring during the summer monsoon [19].
Figure 1.
Location map of the study area showing Multan district within Punjab, Pakistan, and the distribution of ground-truth sampling points used for classification accuracy assessment.
2.2. Data Acquisition
Multispectral satellite imagery was obtained free of charge from the USGS Global Visualization Viewer (glovis.usgs.gov), comprising Landsat 4–5 Thematic Mapper (TM) scenes for January–October 1988 and January–October 1999, and a Landsat 8 Operational Land Imager (OLI) scene for January–October 2020, all at 30 m spatial resolution and referenced to World Reference System path/row 150/039 (Table 1 and Table 2). Ancillary meteorological data—monthly precipitation, mean temperature, wind speed, humidity and sunshine duration for the period 1988–2020—were obtained from the Pakistan Meteorological Department, Islamabad.
Table 1.
Dataset and source information used in this study.
Table 2.
Landsat satellite image specifications.
2.3. Image Classification
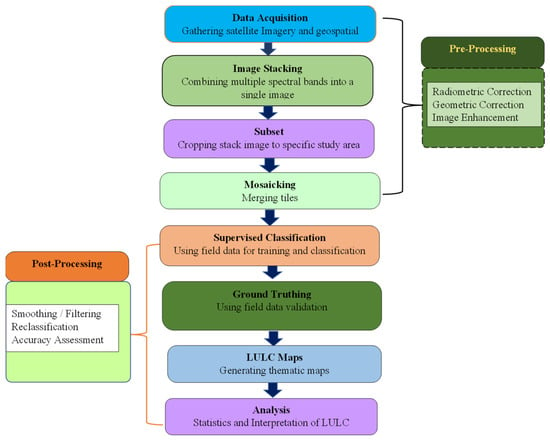
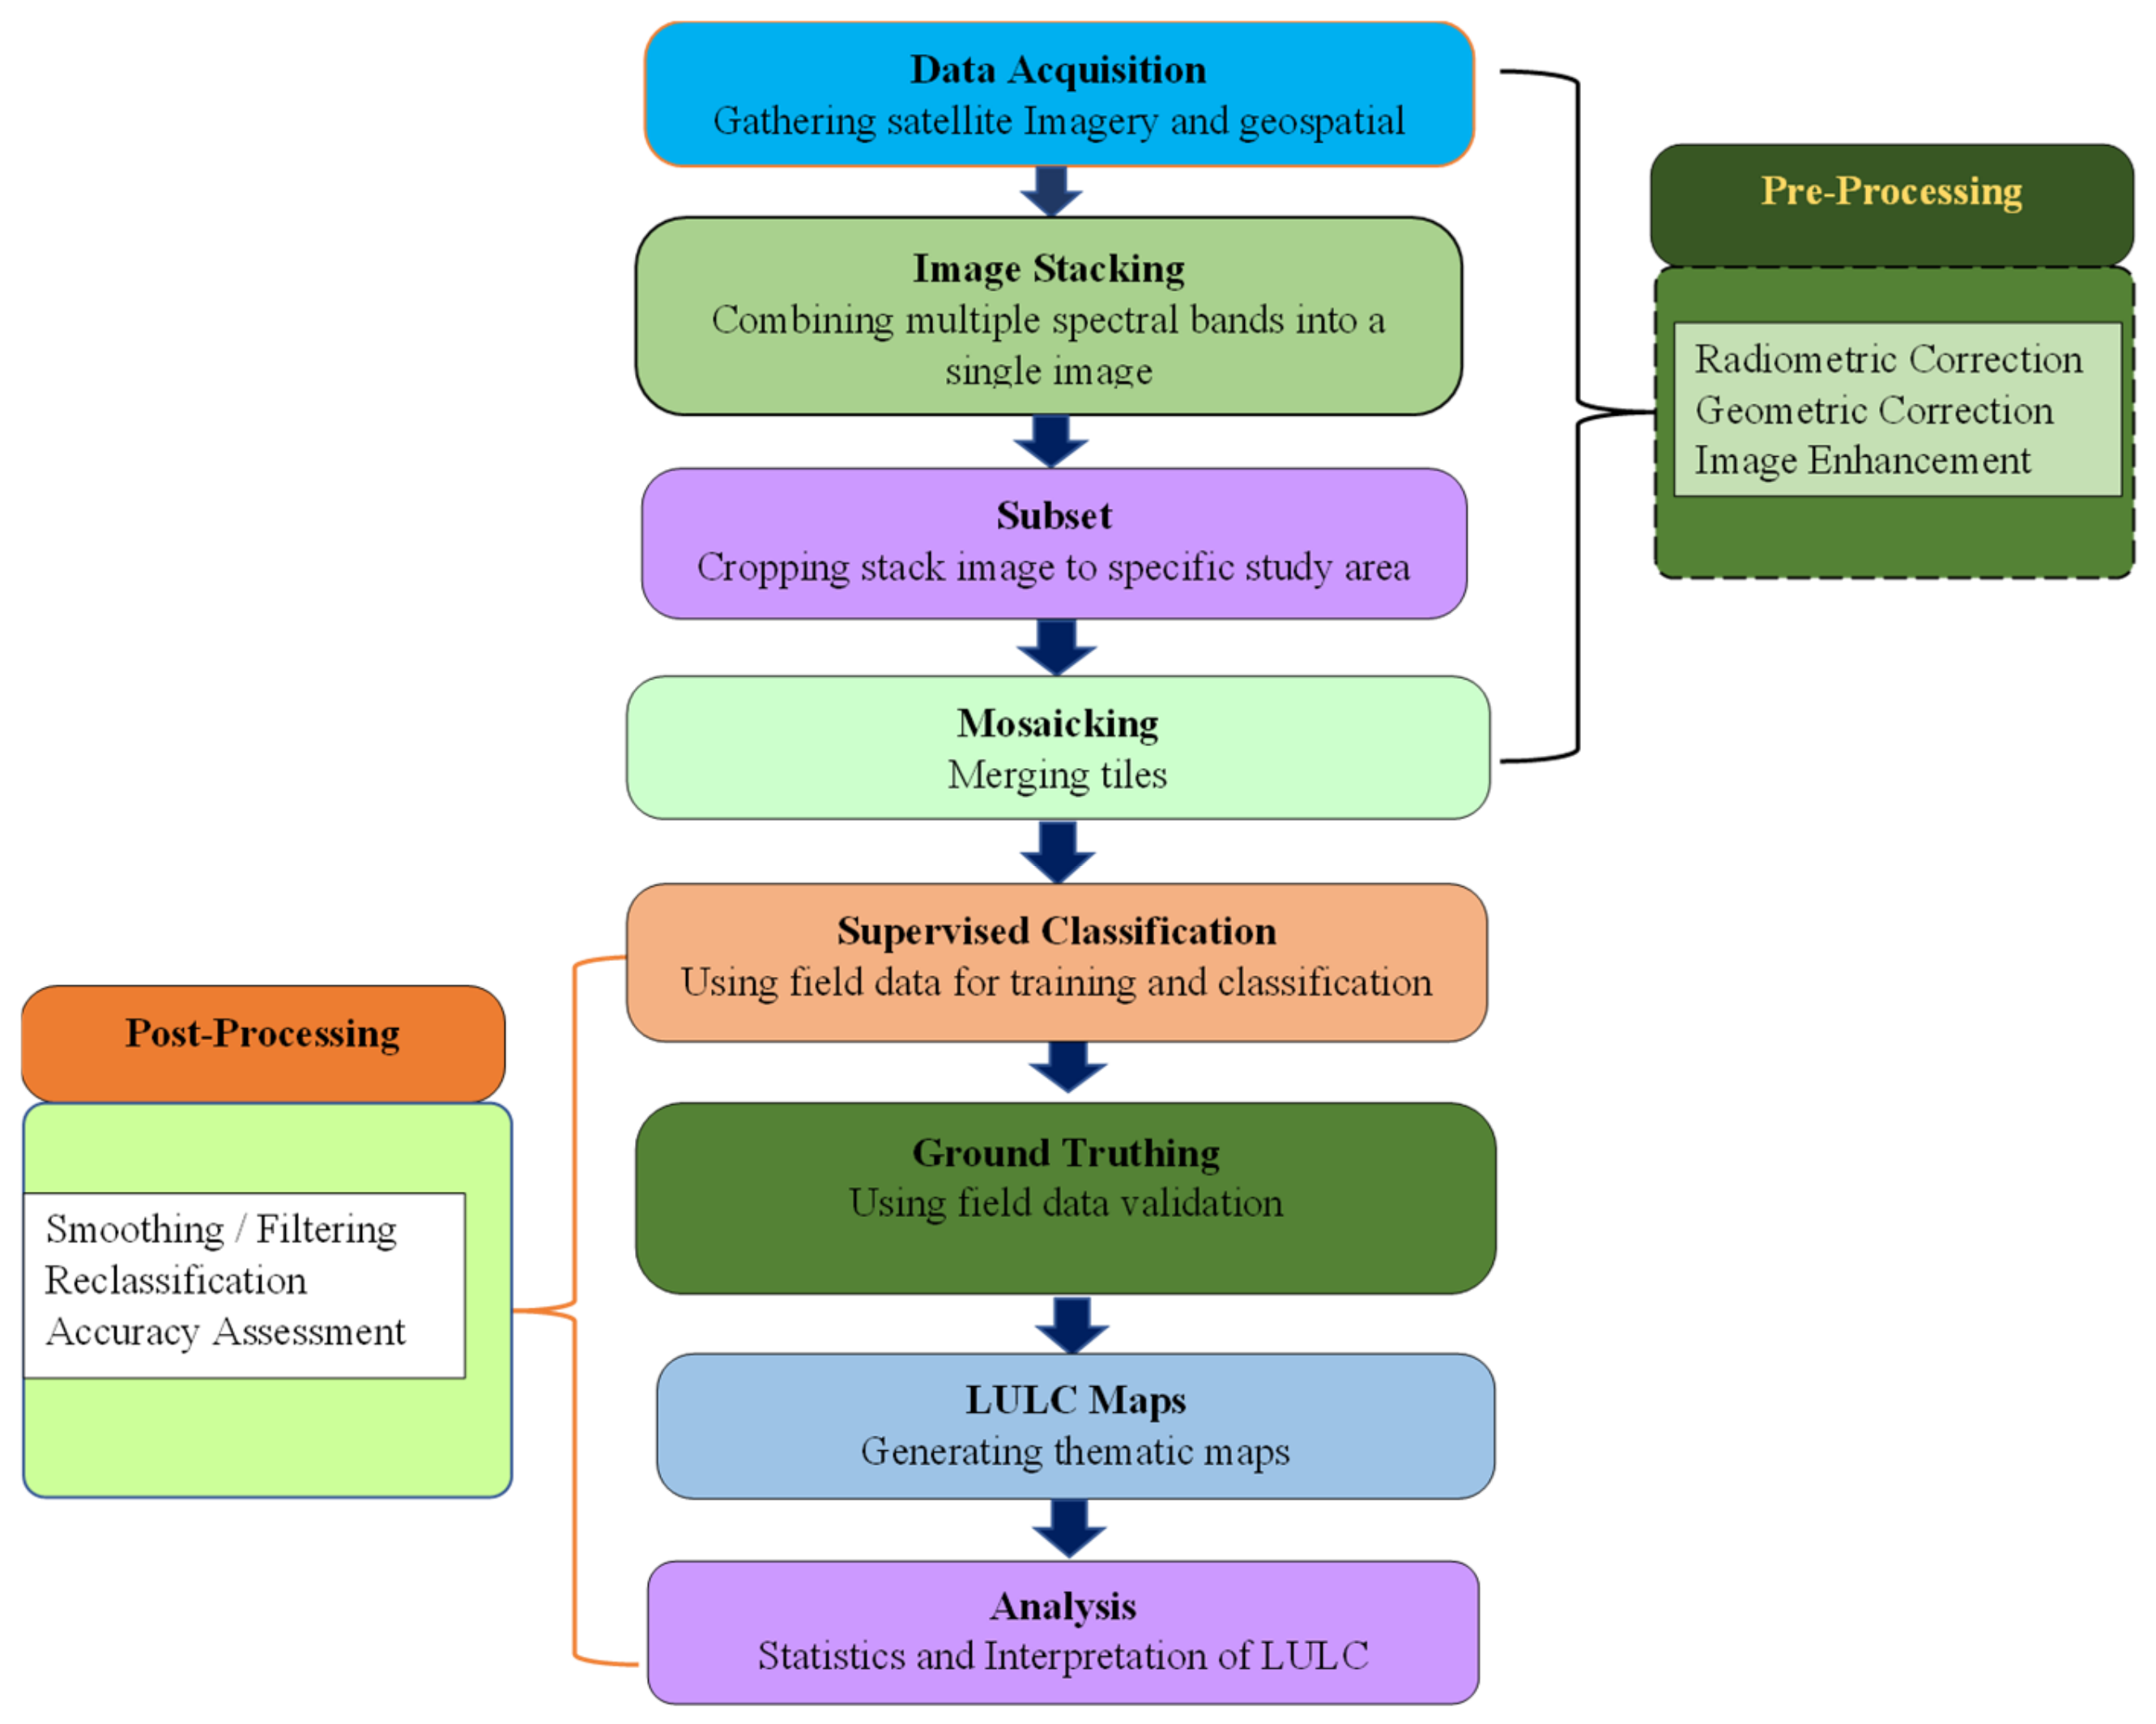
The LULC and LULC change classes were produced from the three Landsat scenes (1988, 1999 and 2020) with ERDAS Imagine software v16.8.1. The field-surveyed data of the GPs were imported into ArcGIS 10.1vs, and a shapefile of the study area was created after delineating the area boundary; then, the included GPs were used to subset the study area boundary with the two tehsils, Multan City and Multan Saddar, from the source images (Figure 2). These were broken down to date before classification into layer-stacked composites, which were radiometrically consistent.
Figure 2.
Workflow of Remote sensing data pre-processing and post-processing for land use/land cover classification.
2.3.1. Land Use/Land Cover (LULC) Classification
For assigning the most reliable class to each pixel, the supervised classification algorithm, such as Maximum Likelihood Classification, was applied for per-pixel classification based on the creation of a signature file with ground control points verified in the field. The selected Maximum Likelihood Classification algorithm is a well-established technique for LULC classification because it uses the characteristics of the training polygon area to estimate the likelihood of each pixel [17,20]. The parameters such as training polygons, input spectral bands, average spectral signature, covariance matrix and probabilities of each class were estimated and evaluated for LULC classification. The training polygons and input bands were selected based on prior knowledge. The mean spectral signature and covariance matrix were automatically collected from the training samples. According to the statistical parameters and digital-number signature, the study area was classified into five major LULC classes (Table 3).
Table 3.
Land use/land cover classes used in the supervised classification.
2.3.2. Accuracy Assessment
Classification accuracy was assessed with the standard error-matrix approach, comparing classified pixels against 144 independently collected ground-truth points (42 urban, 9 river, 10 fishpond, 64 field-crop and 19 orchard points), following Erasu (2017) [21]. Producer’s accuracy, the proportion of a given ground-truth class correctly represented on the classified map, and user’s accuracy, the proportion of a mapped class that corresponds to the correct class on the ground, were calculated as:
where in is the number of correctly classified pixels in class i, in+ is the total number of reference (ground-truth) pixels in class i (row total of the error matrix), and n + i is the total number of pixels assigned to class i on the classified map (column total). Omission error (1 − PA) reflects reference pixels excluded from their correct class on the classified map, whereas commission error (1 − UA) reflects pixels incorrectly assigned to a class; the Kappa coefficient was additionally calculated for each classification date as an index of agreement beyond chance [22].
2.4. Mann–Kendall Trend Test
Monotonic trends in monthly and annual temperature and rainfall (2000–2020) were tested using the non-parametric Mann–Kendall test [23]. For a time series x1, x2, …, xn, the test statistic S is computed as:
where sign (xj − xi) equals +1 if xj − xi > 0, 0 if xj − xi = 0, and −1 if xj − xi < 0. For sample sizes below 8, S is approximately normally distributed; its variance is estimated as:
where it denotes the number of data points in the tied group. For n > 10, the standardized test statistic Z is calculated as:
A positive Z indicates an increasing trend and a negative Z a decreasing trend; trend significance was evaluated at both the 0.05 and 0.10 significance levels, together with Kendall’s tau (τ) as a normalized measure of trend strength [24].
2.5. Innovative Trend Analysis (ITA)
Designing innovative solutions to problems and interpreting real-world trends. The Innovative Trend Analysis [25] which is a complementary distribution-free methodology, is also applied to the same monthly and annual series. Both the medians of each series were divided into two equal halves, which were independently sorted in ascending order, and then each of the halves (Xi) was plotted against the other (Xj) on a Cartesian coordinate system. The further above the 1:1 line, the more positive the trend; below the 1:1 line, the more negative the trend; the greater the distance from the line, the stronger the trend in either of the directions of the low, medium and high portions of the data spread. In addition, a trend indicator (B) was calculated based on the mean difference between the two sub-series, divided by their sub-series standard deviations, with a positive B representing an increasing trend and a negative B representing a decreasing trend, and compared with the corresponding Mann–Kendall results at the 10% significance level for cross-validation [26].
All the data sets used in this study have varying time spans. The LULC assessment data set was used during the period 1988 to 2020 to allow analysis of the long-term change. However, the climate data set was only able to be used during the period 2000 to 2020 due to reliable meteorological information being available within this timeframe. In order to maintain consistency and reliability within the data sets, it was necessary to analyze the data within these time frames. Even though there is an overlap between the time frames (2000 to 2020), the difference in time length does not allow for a direct comparison between the full LULC data set and climate data set. Therefore, results have been interpreted based on their time frame of observation.
3. Results and Discussion
3.1. Land Use/Land Cover Change, 1988–2020
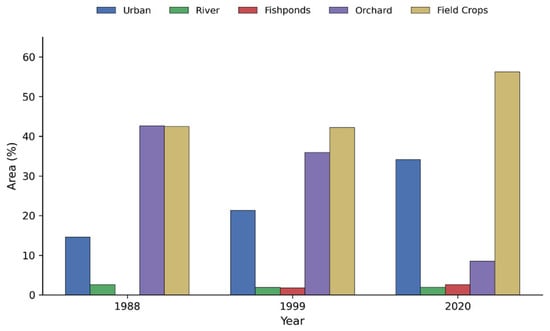
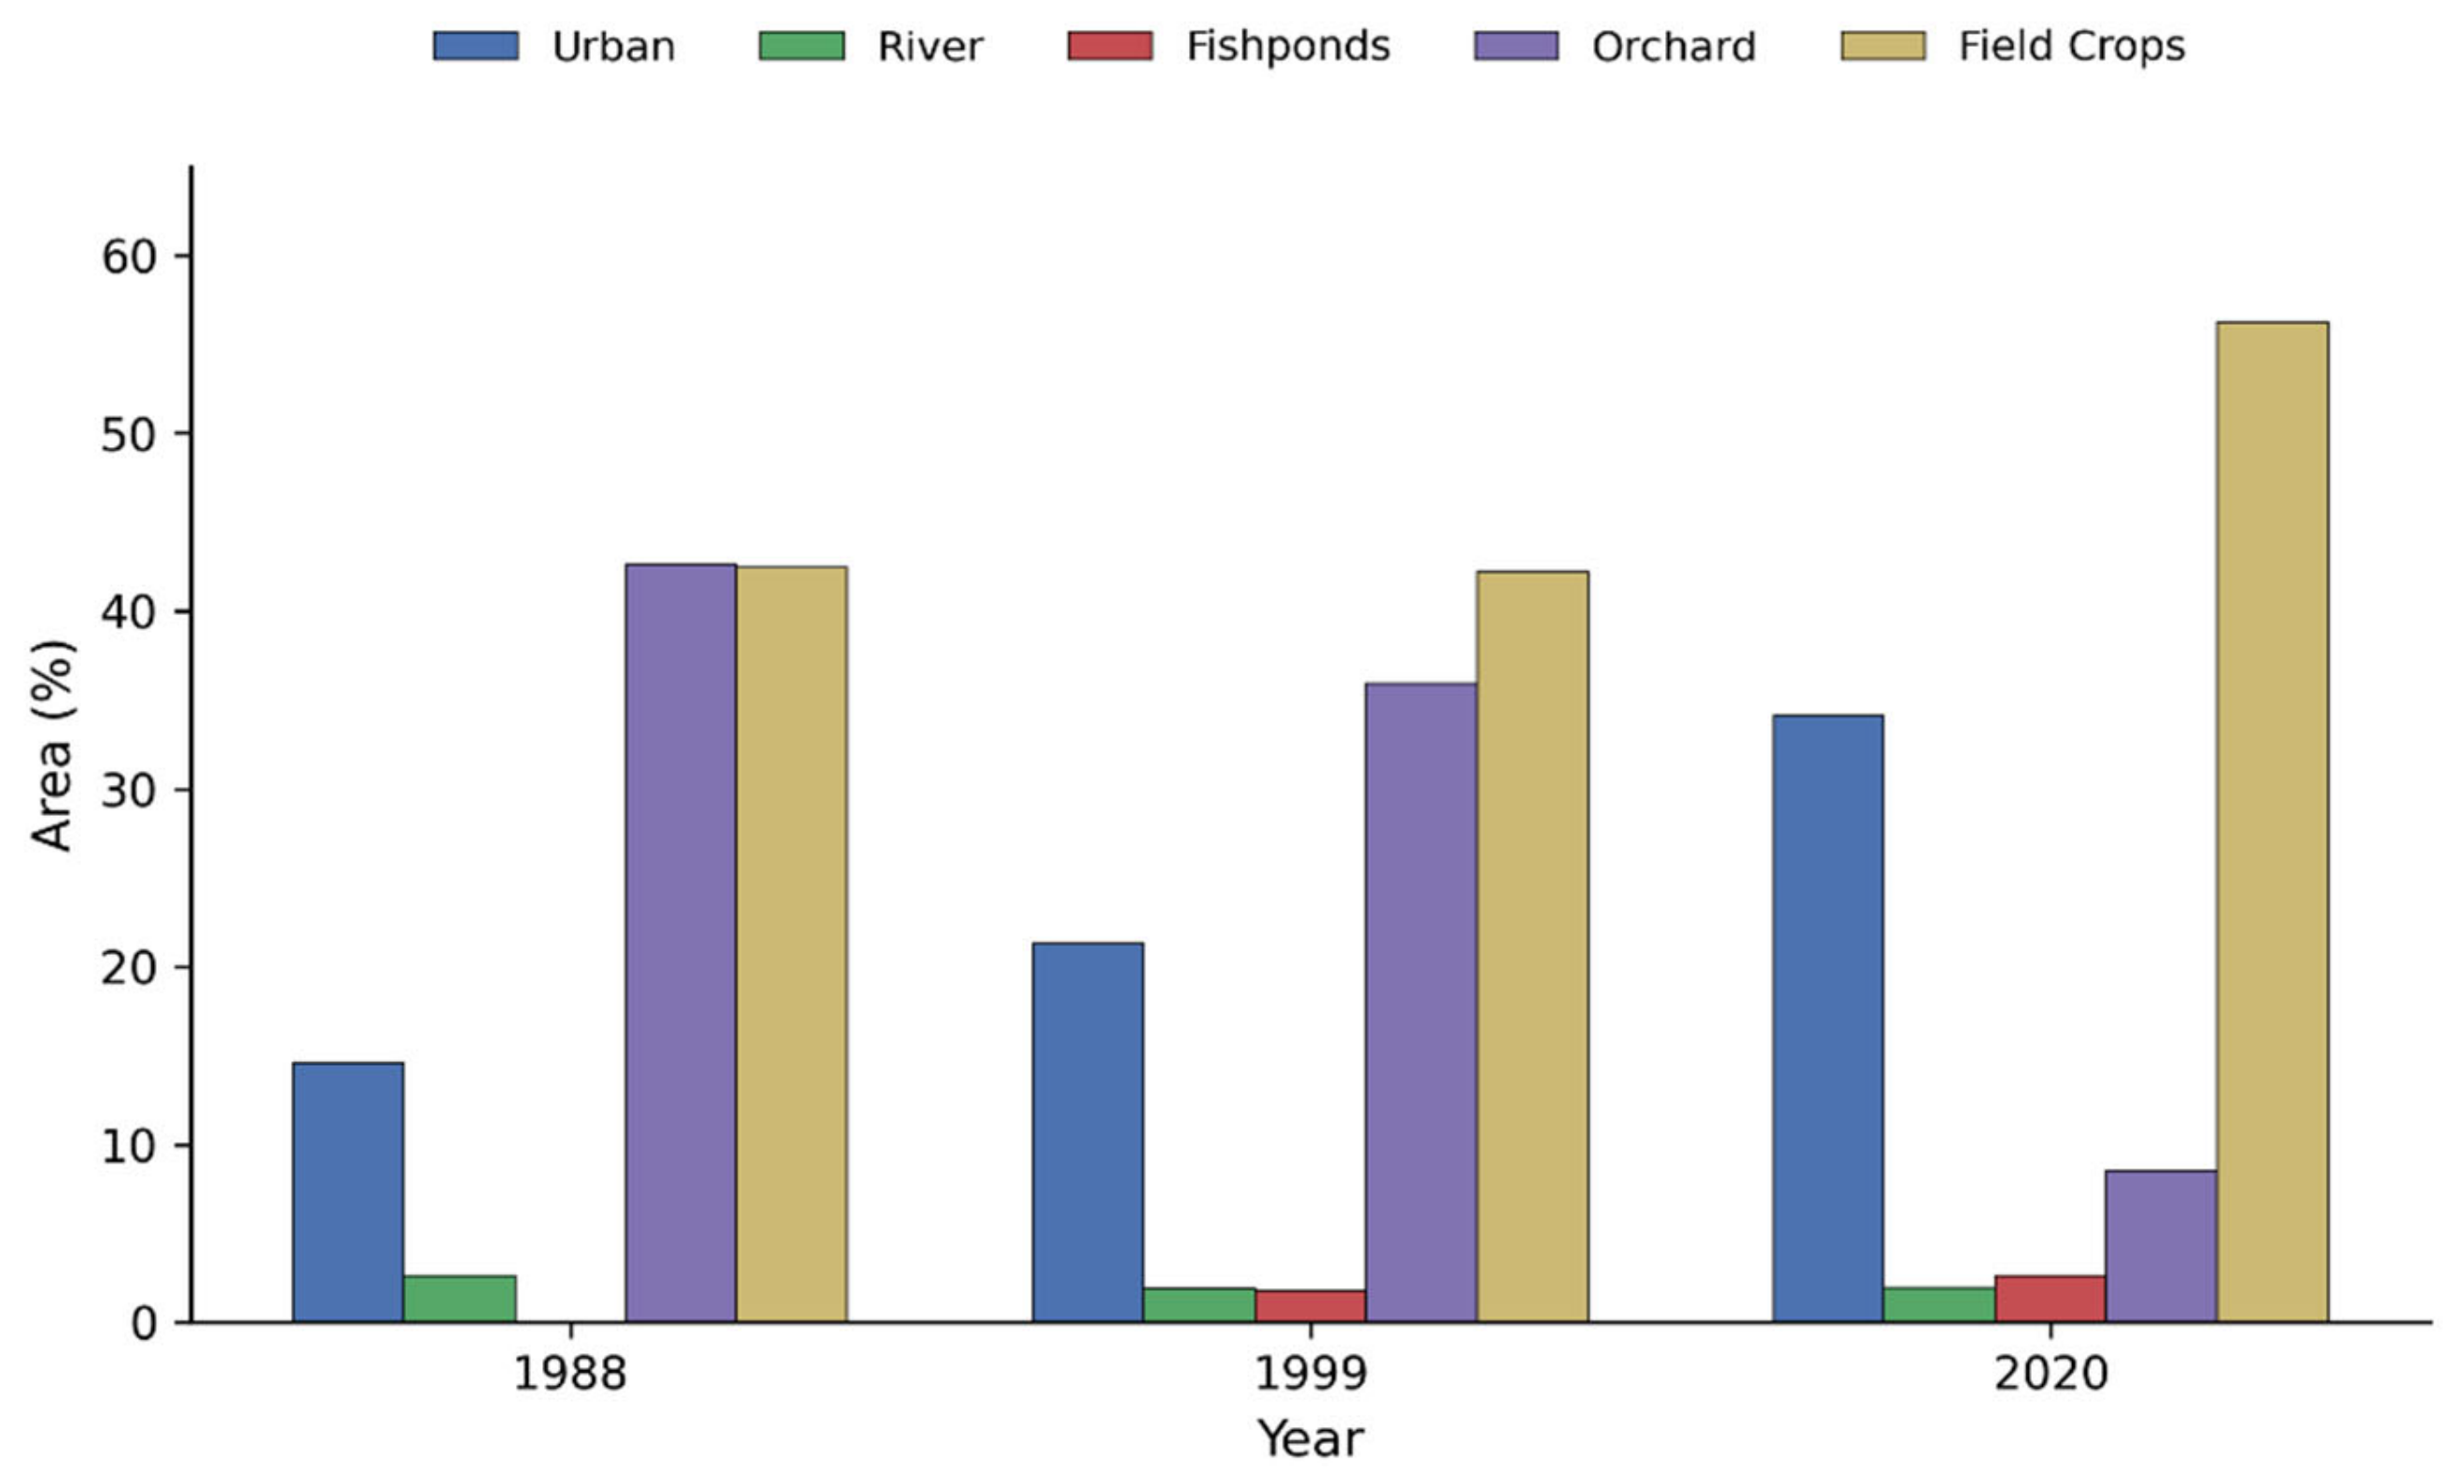
Table 4 and Figure 3 indicate a significant and continuous change in the landscape of Multan in the three Landsat scenes classified (1988, 1999 and 2020). Field crops and orchards (42.4% and 42.6%, respectively) dominated the study area, with only 14.6% of the land in urban use. The amount of land used for field crops, urban land and orchards changed significantly by 2020, to 56.2%, 34.1% and 8.5%, respectively. The area of rivers decreased slightly (1.9% in 2020 compared to 2.6% in 1988); however, fishponds, which were not present in 1988, increased to occupy 2.6% of the study area in 2020, indicating an increasing demand for freshwater aquaculture.
Table 4.
Land use/land cover distribution (% of total study area), 1988–2020.
Figure 3.
Land use/land cover distribution (% of total area) in the Multan study area for 1988, 1999 and 2020.
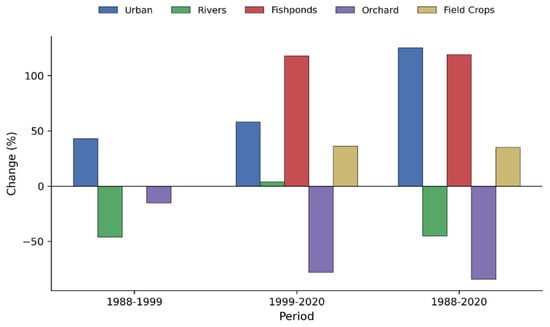
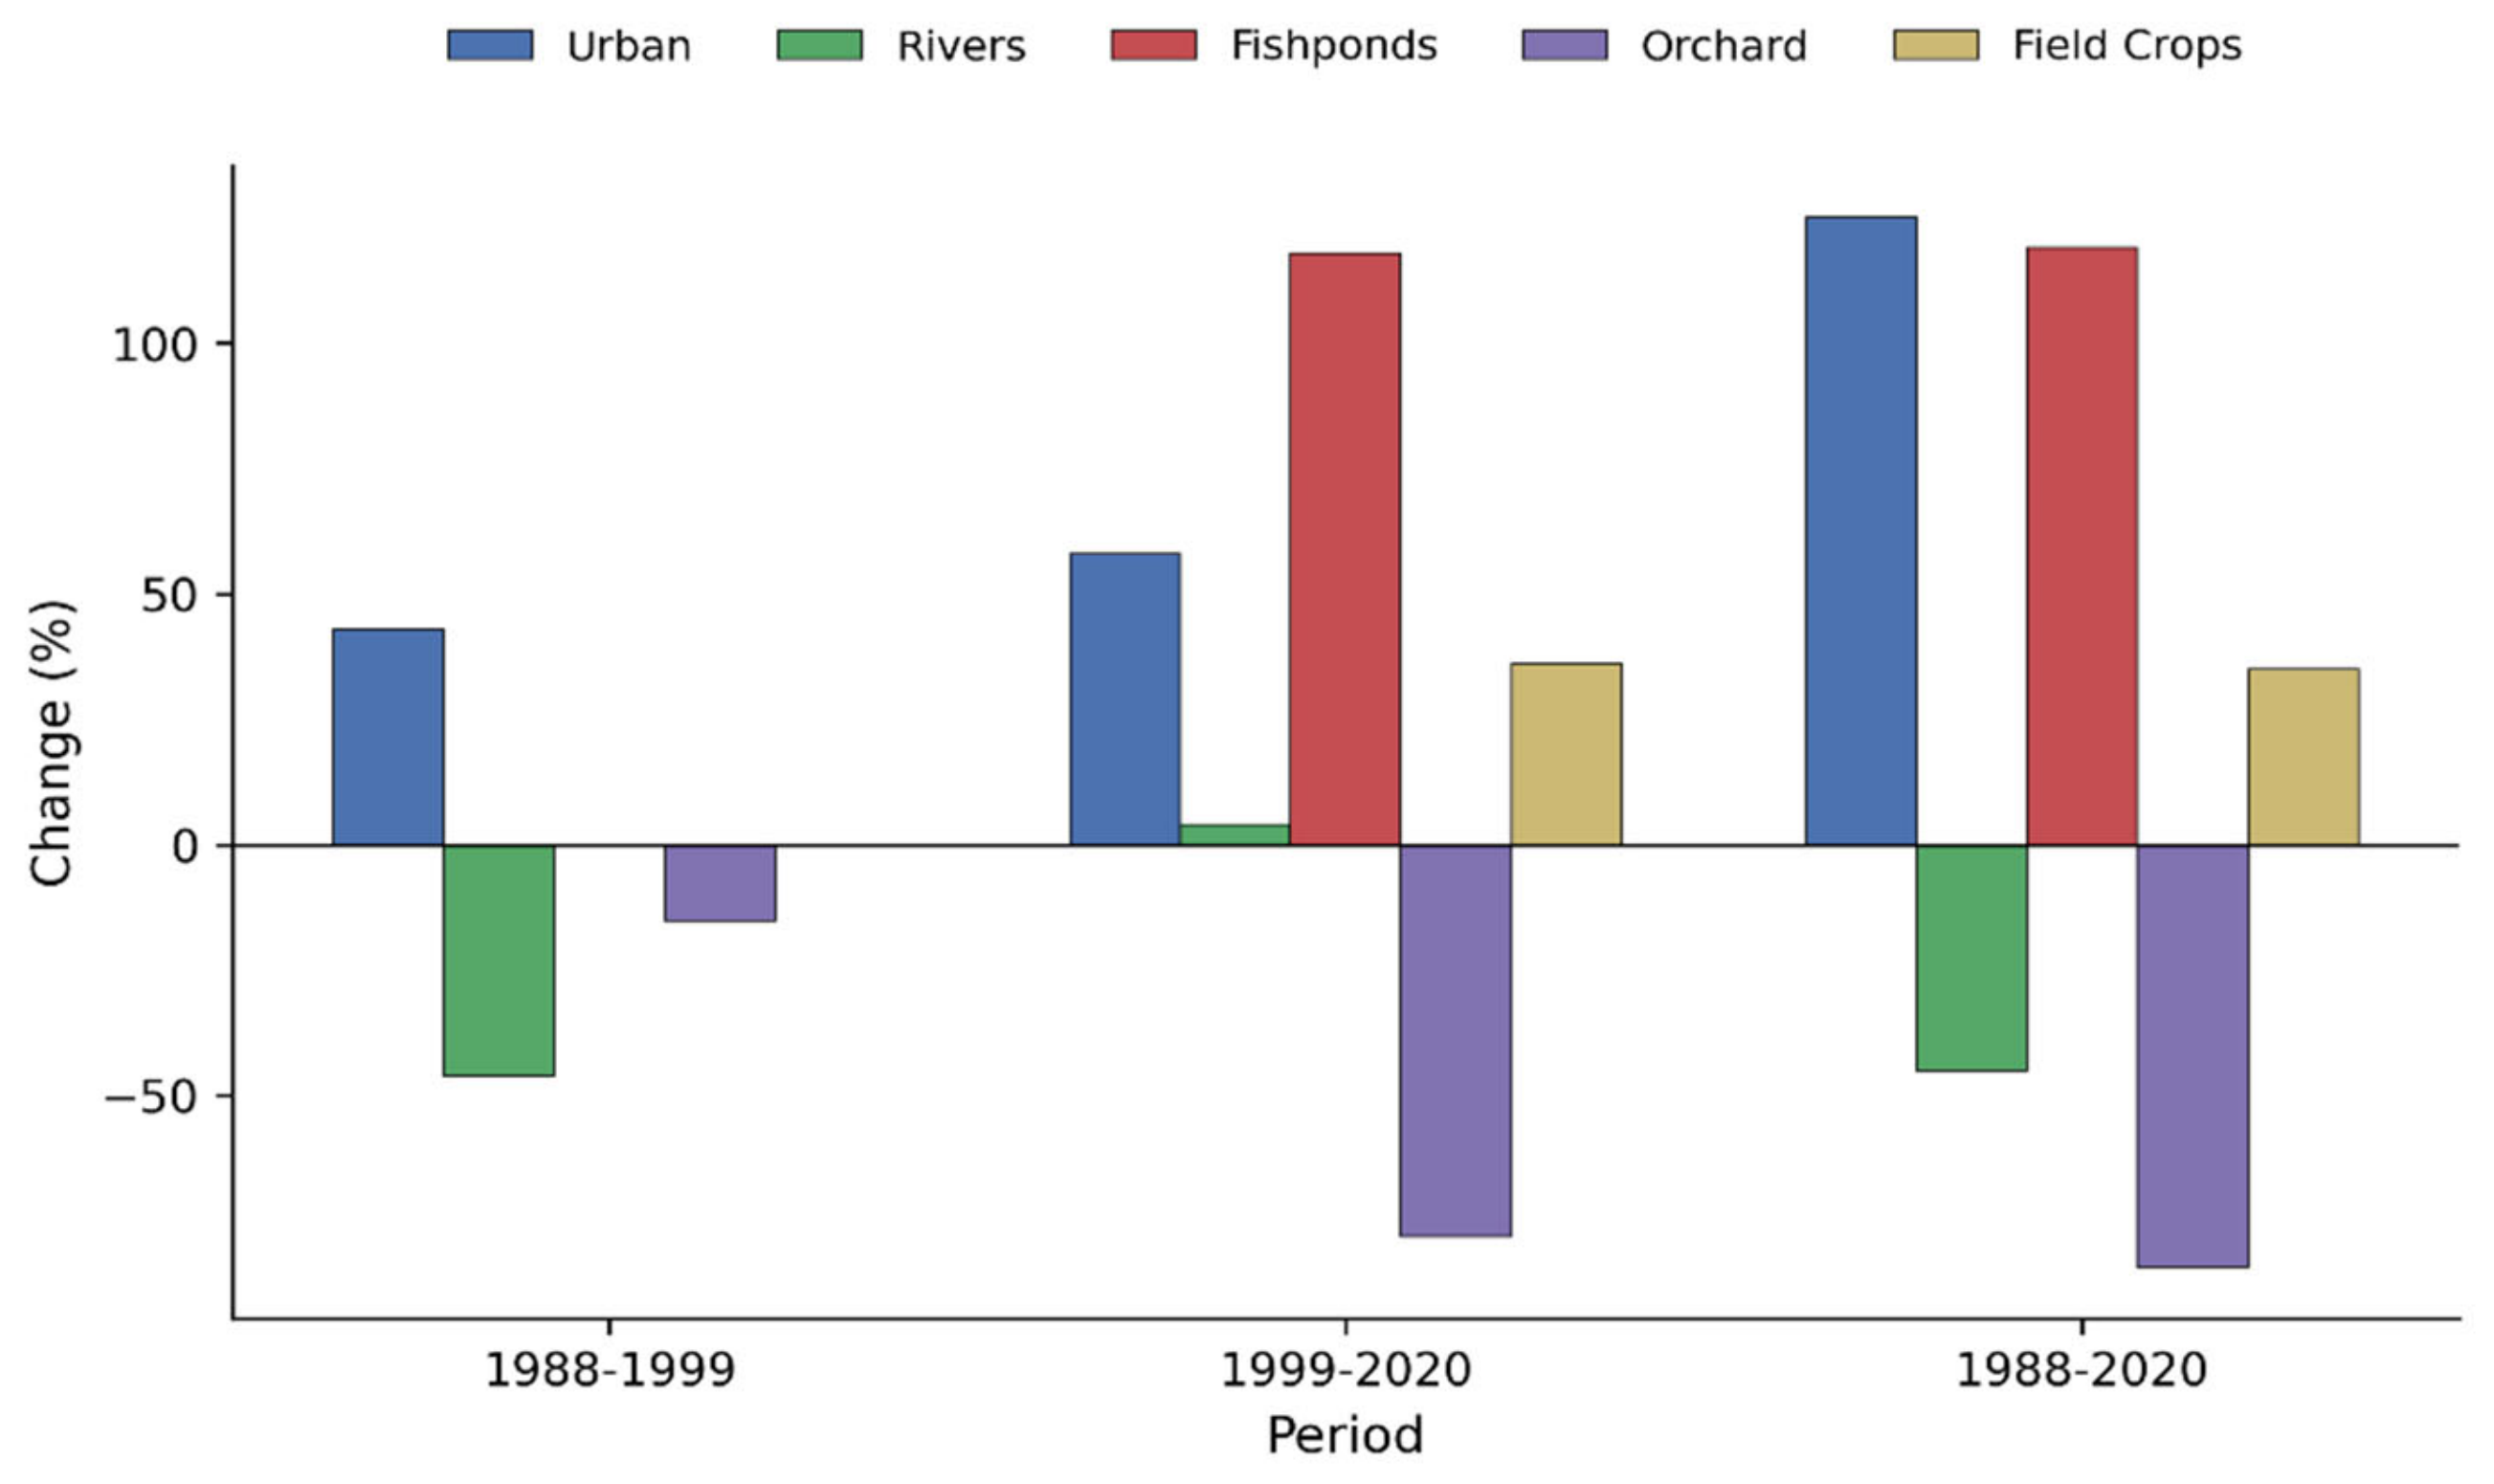
The change detection statistics (Table 5, Figure 4) support these trends of increased urbanization, with an increase of 43% between 1988 and 1999, a larger increase of 58% between 1999 and 2020 and a total increase of 133.6% over the entire 32-year period (4.2% per year). The Orchard area decreased by 15% from 1988 to 1999 and further by 78% between 1999 and 2020, a total loss of 84%. This was the largest percentage change in land cover category over the study period. Field-crop area was essentially stable between 1988 and 1999 (0% change) before increasing by 36% between 1999 and 2020. Between 1999 and 2020, the area of Fishpond grew at a rate of 118%, whereas the area of river shrank by 46% between 1988 and 1999, an effect possibly due to channel regulation and flood-bund construction, before leveling off thereafter.
Table 5.
Change detection statistics for land use/land cover classes (% change relative to the earlier date).
Figure 4.
Percentage change in land use/land cover class area between 1988–1999, 1999–2020 and 1988–2020.
The spatial distribution of these changes is similar to the orchard-to-urban conversion found in the northwestern part of the study area, where there were once many mango orchards. This is similar to the reported orchard decline factors in the South Asian peri-urban environment: increasing value of land, new housing schemes encroaching on orchard land, declining mango profitability at the farm-level and rural-to-urban labor migration, reducing orchard labor [27]. Fast urbanization in Multan demands proper land use planning and management practices to protect peri-urban agricultural areas. Urbanization is increasing rapidly, which will result in increased conversion of productive agricultural and orchard lands. Thus, it is very important to establish good coordination between municipal bodies, urban planning agencies, and agricultural departments to implement land use regulations, planned urban growth, and GIS-based land management to achieve sustainable urban development and protect agricultural areas.
The significant urban expansion in the fishpond area, coupled with the increase in field-crop area, is also in line with the increased demand for freshwater fish due to population growth and increased household income in Multan, whereas the net growth in field-crop area, despite the high rate of urban expansion, aligns with the intensified cultivation of the remaining agricultural land to produce food to satisfy the increasing demand of the population of Multan. The results are similar to other multi-decadal land use and land cover (LULC) assessments conducted in other districts in the country and the region, such as Lodhran district, adjacent to the present study area, showing significant and growing urbanization of agricultural land or orchards over similar periods [15], Mardan district [16], and Hyderabad, India [28].
Classification Accuracy
Classification accuracy was 87.6% in 1988, 84.5% in 1999 and 85.1% in 2020, with corresponding kappa values of 0.82, 0.83 and 0.79 (mean kappa = 0.81), suggesting good agreement between the extent of classified vegetation and the ground-truth observations for all three dates (Table 6 and Table 7). Producer’s accuracy for urban land was 84% to 87% (mean 86.6%), and for orchards ranged from 81% to 85% (mean 82.6%), with 80% to 90% for rivers, fishponds and field crops. These levels are similar to and, in some instances, better than other LULC studies in the region based on the Landsat data [29,30,31] and corroborate the accuracy of the change detection results presented above.
Table 6.
Land use/land cover classification accuracy assessment (producer’s and user’s accuracy, %).
Table 7.
Periodic kappa coefficient and overall accuracy by classification date.
3.2. Mann–Kendall Trend Results
3.2.1. Temperature Trends
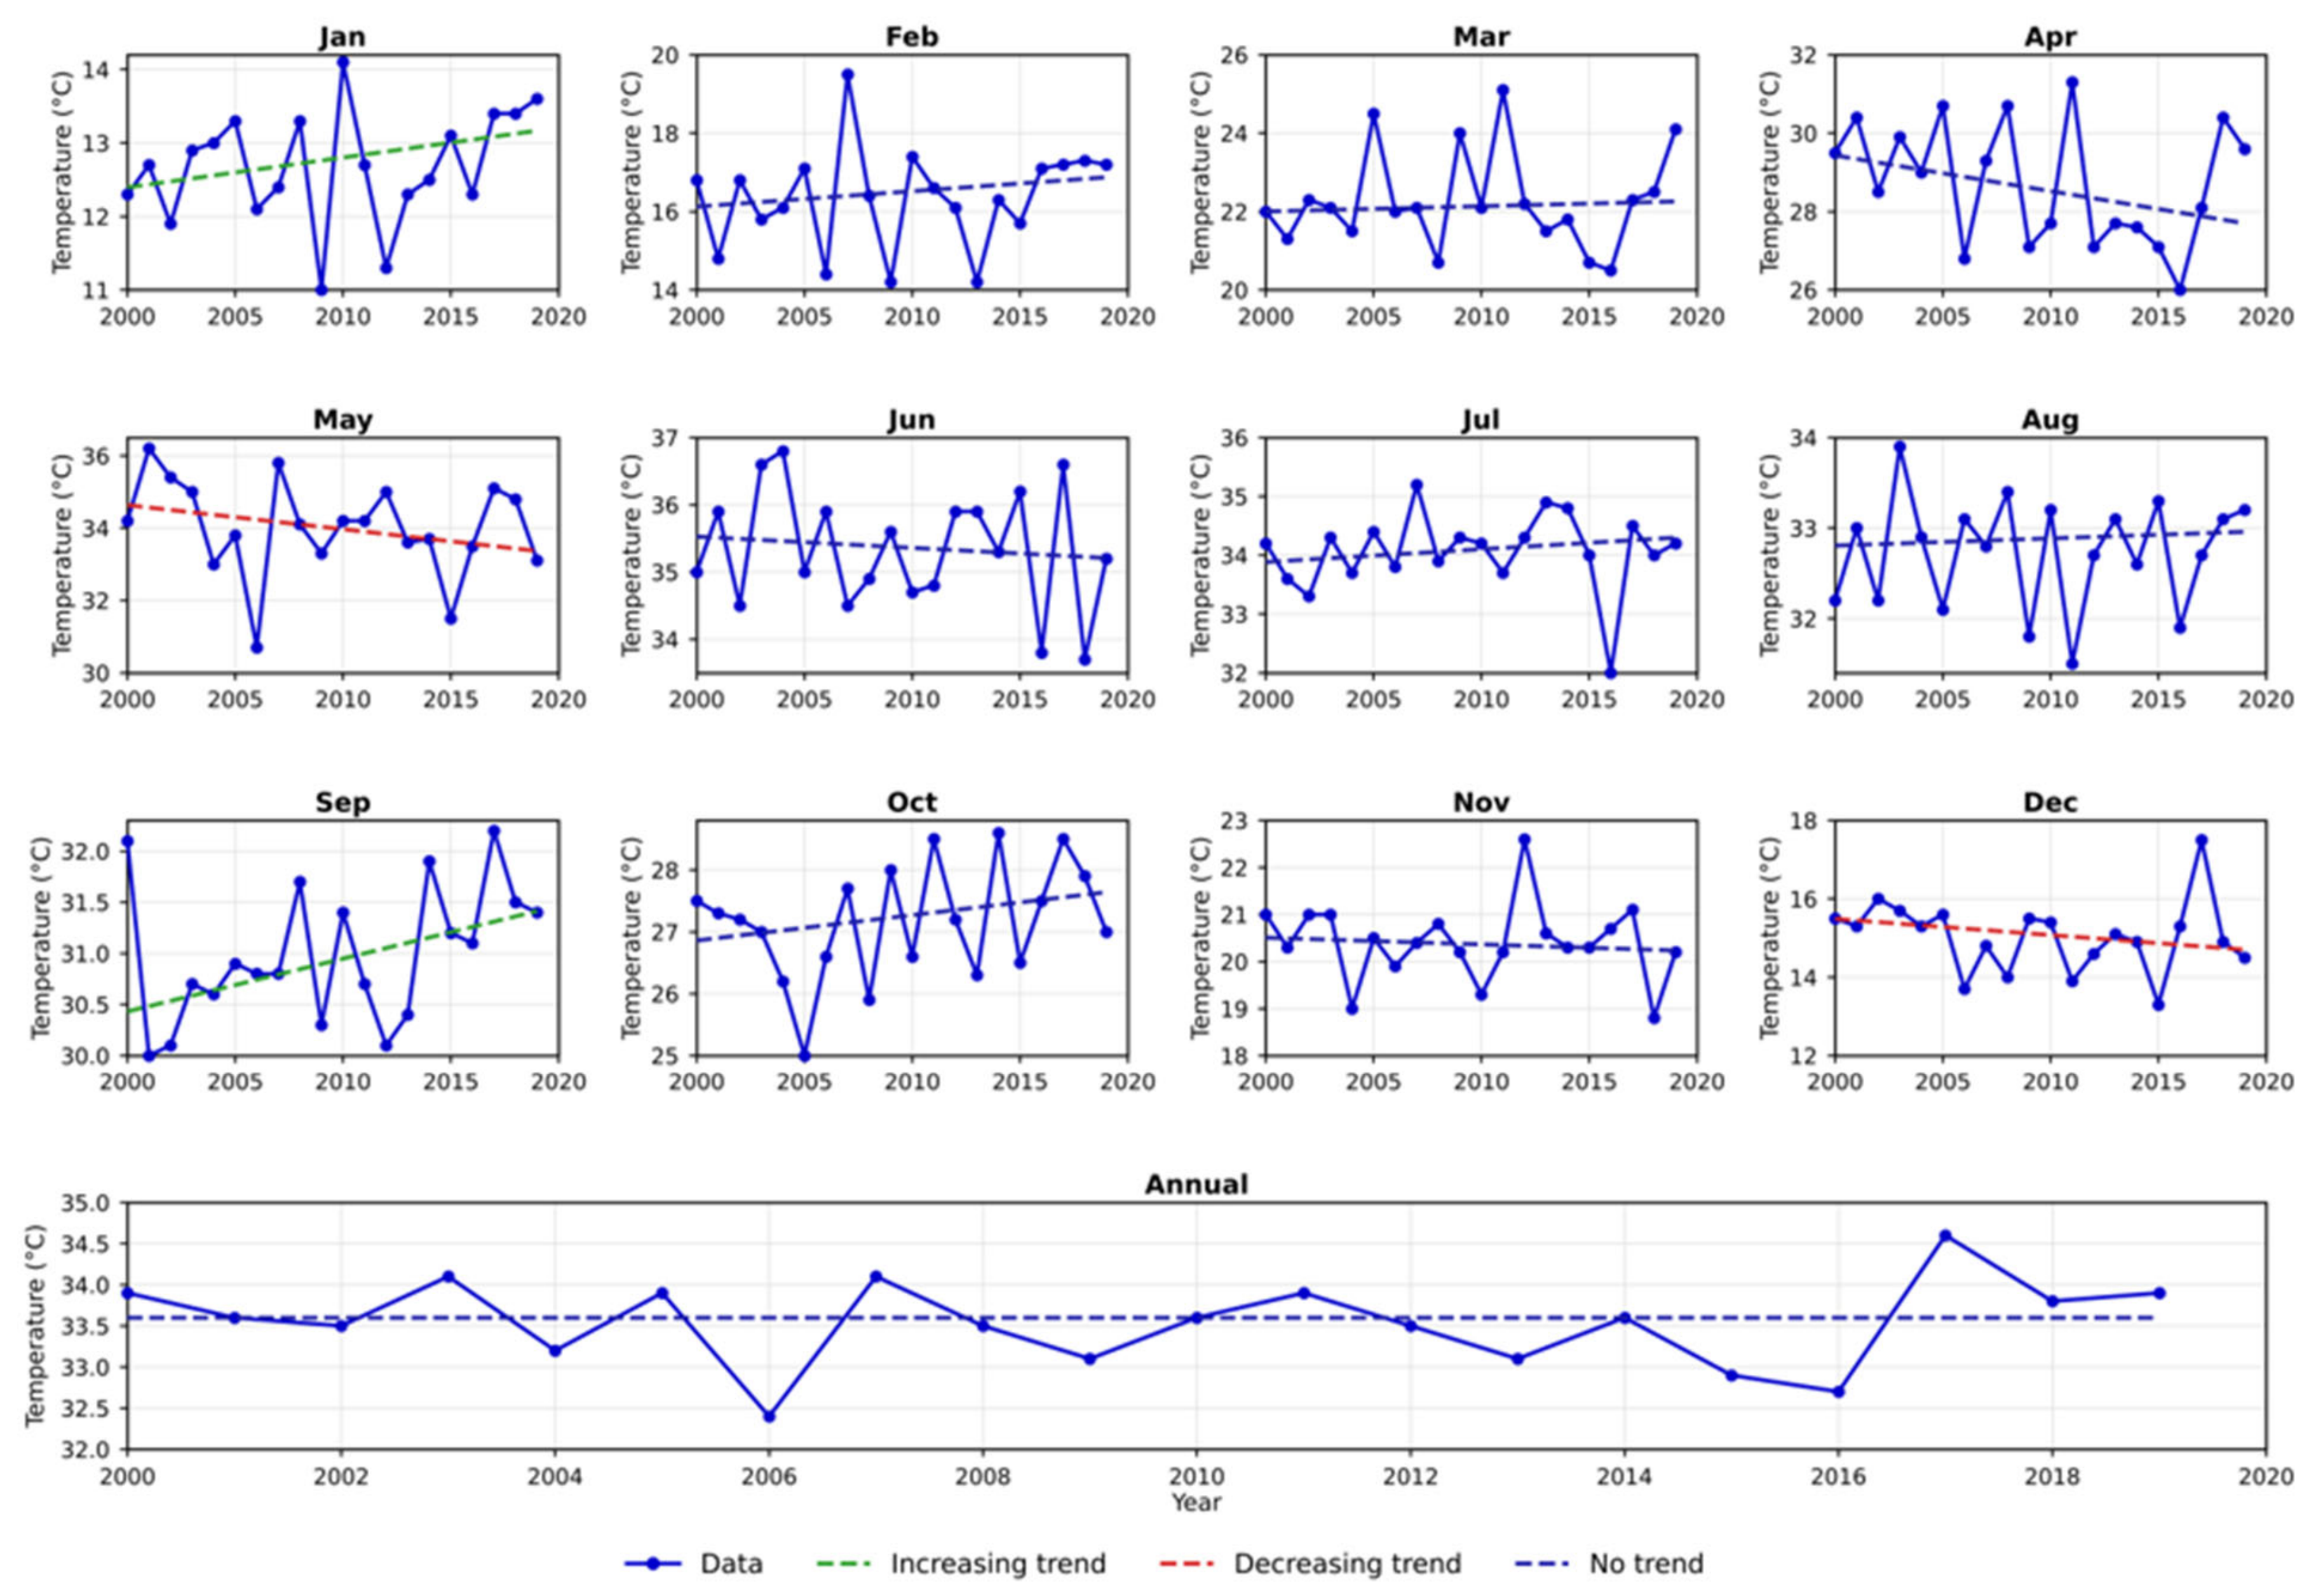
The 0.05 level of significance was used to test statistically significant trends; only September had a statistically significant increasing trend in mean temperature (Kendall’s τ = 0.305, Z = 1.853, p = 0.032). At this threshold, there was no significant trend in all other months and the annual series. When the significance level was lowered to 0.10, the seasonal trends expanded: January (τ = 0.258, p = 0.046) and September (τ = 0.305, p = 0.032) indicated statistically significant increasing trends, and December indicated a statistically significant decreasing trend (τ = −0.253, p = 0.063). In May, a slight downward trend was observed, but it was not statistically significant (p = 0.050). There were no significant trends at either threshold (τ = −0.042, p = 0.410) in the annual temperature series, meaning that any warming or cooling in the annual record is seen in specific months, but not evenly throughout the year (Figure 5).
Figure 5.
Monthly and annual temperature trends in Multan (2000–2020) detected by the Mann–Kendall test (0.10 significance level); dashed lines indicate the direction of significant trends where present.
Although this study focused on long-term meteorological temperatures and precipitation patterns associated with changes in land use and land cover (LULC) in the area, it is important to note that meteorological data cannot always be representative of thermal conditions across the landscape. As urban expansion occurs, natural vegetation is replaced with impervious surfaces. This can impact the local energy balance and can result in heightened urban temperatures. The meteorological temperature data do not include land surface temperatures (LST); therefore, this study should not be seen as an assessment of the urban heat island (UHI) effect in Multan. Multi-temporal Landsat data can be used to obtain land surface temperatures, vegetation indices and other environmental indicators, which will help provide a better understanding of their relationship with urban expansion and vegetation loss. This will help with climate sensitivity and identifying thermally vulnerable areas of the urban environment [32].
3.2.2. Rainfall Trends
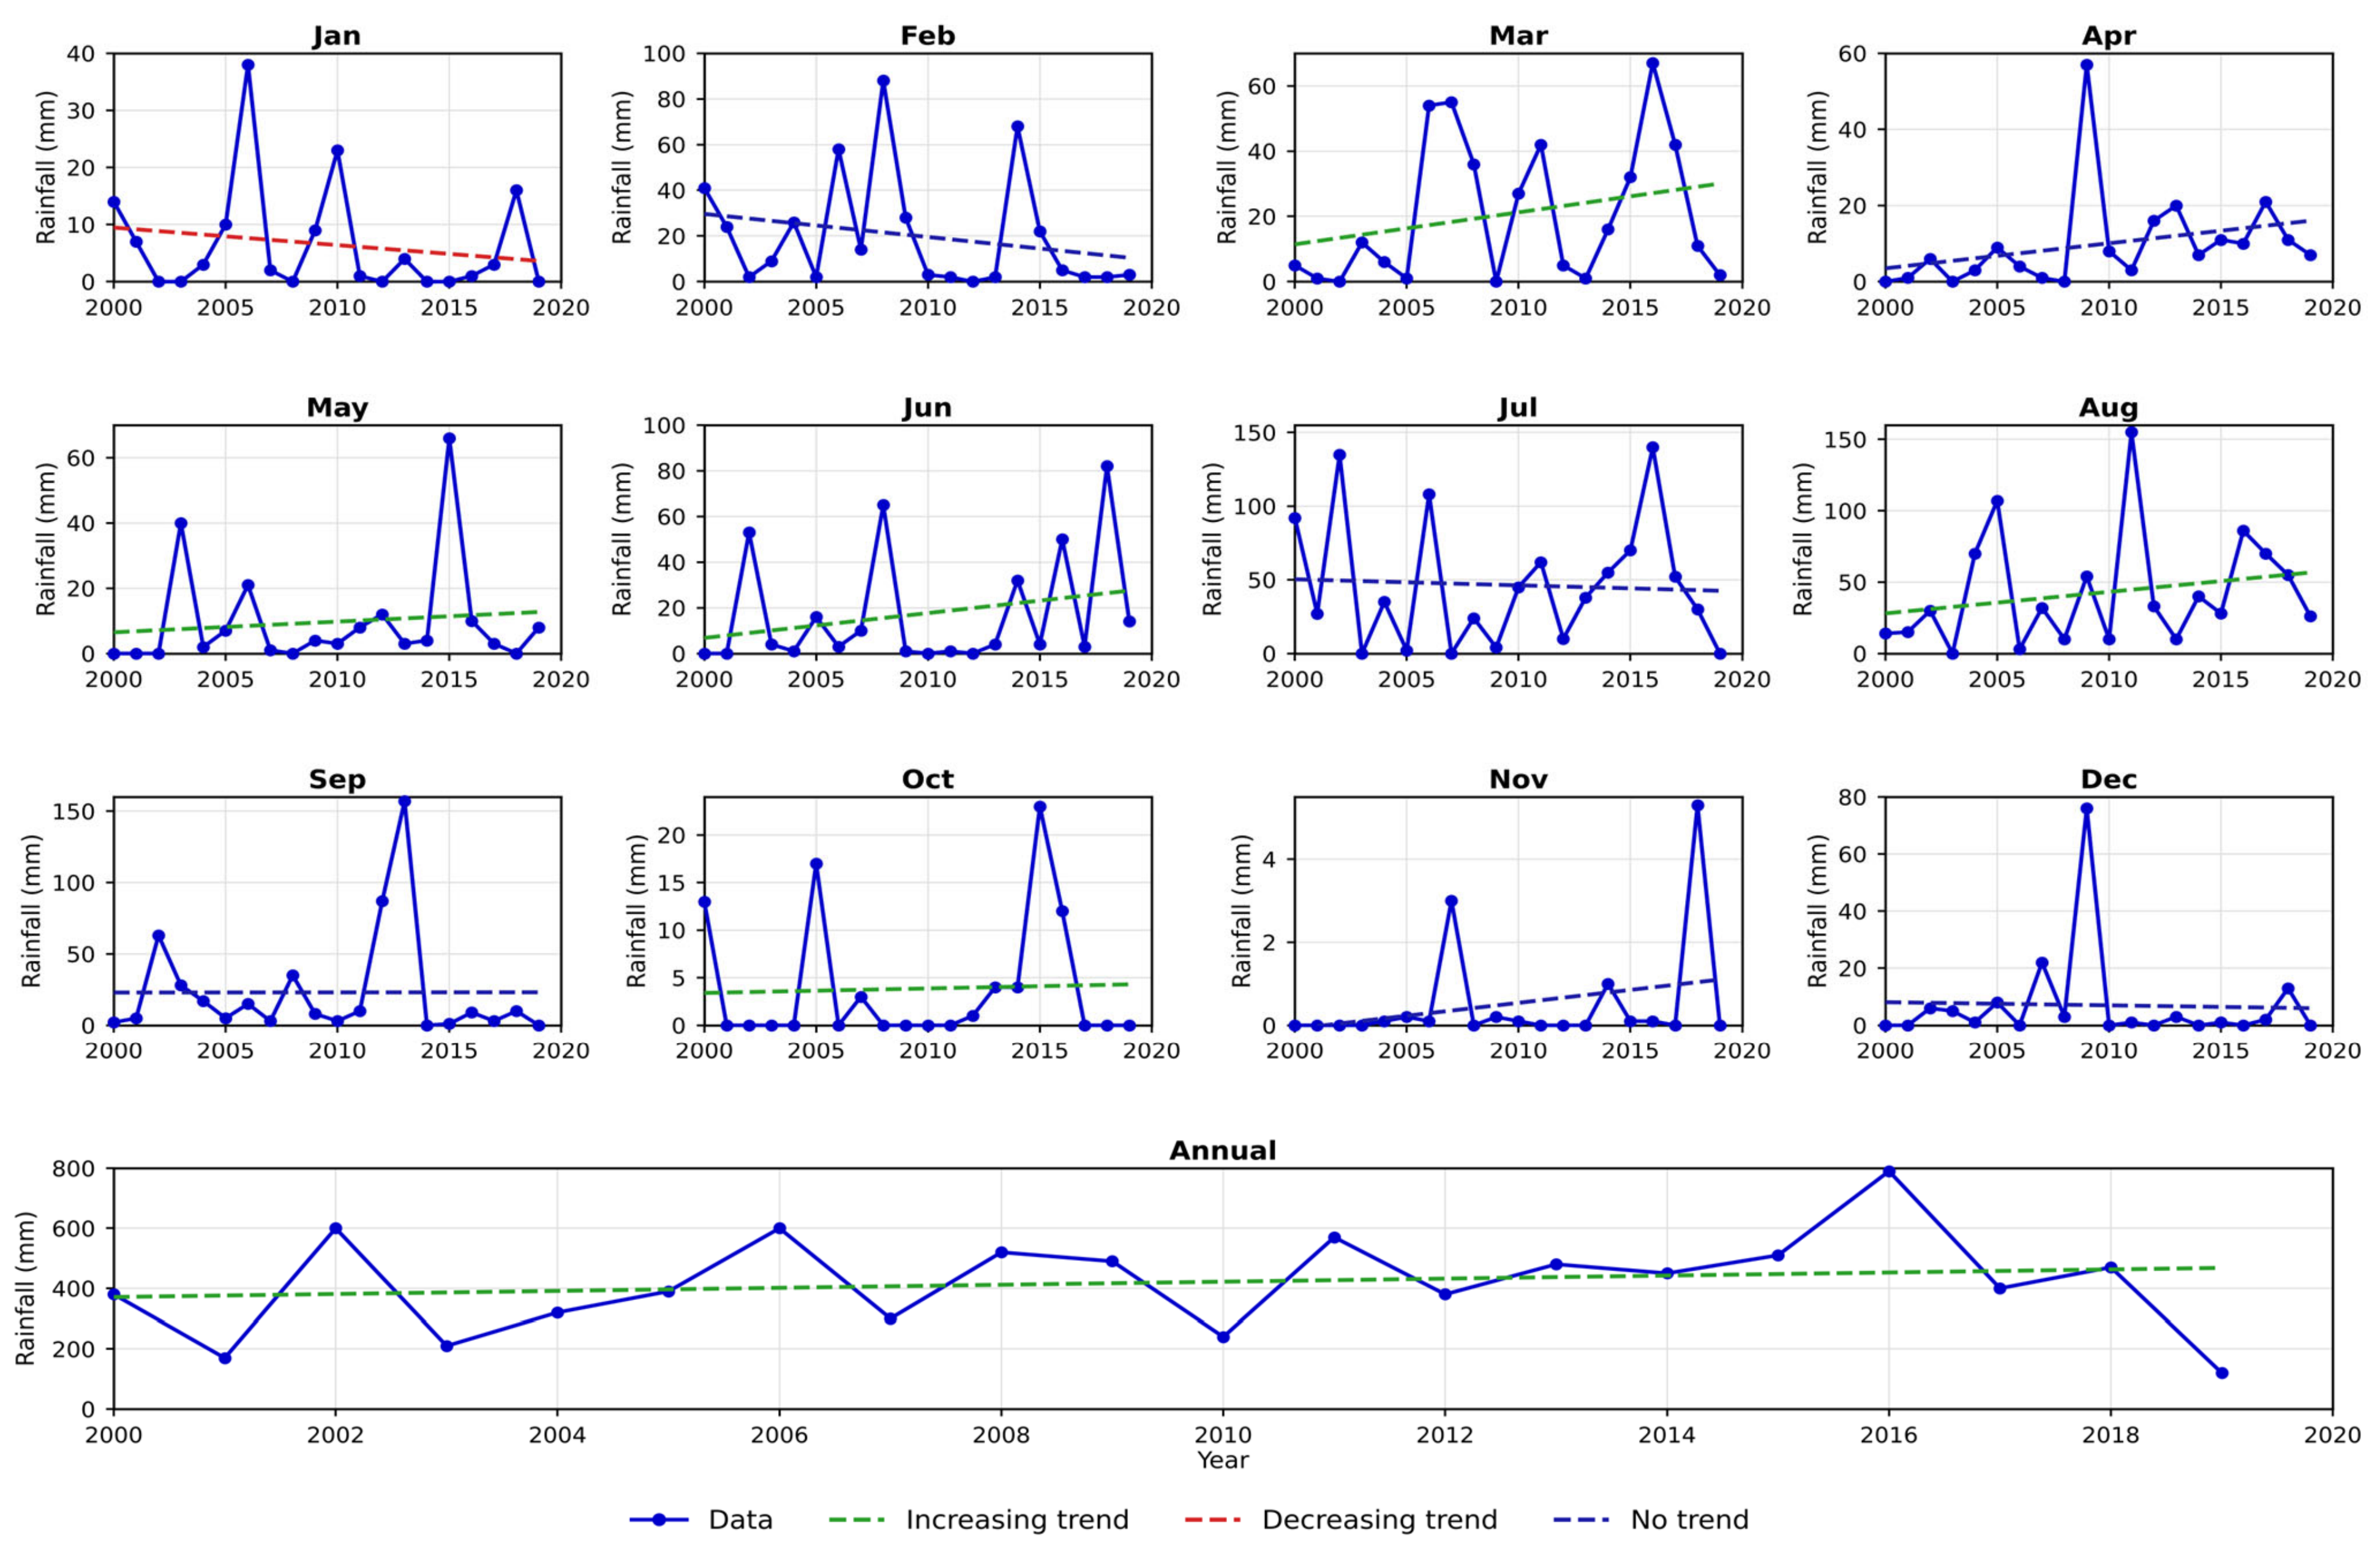
Variability of year-to-year rainfall changes was more of a year-round concern than that of temperature. Only September identified a single significant trend at the 0.05 level, in an upward direction (τ = 0.305, p = 0.032), whereas no significant trend was found in the Annual series (τ = −0.042, p = 0.410). January had a significant downward trend at the 0.10 level of significance (τ = −0.142 with p = 0.046), April had a strong and highly significant increase at the 0.001 level (τ = 0.468 with p = 0.001), and June had a significant increase at the 0.11 level of significance (τ = 0.137 with p = 0.011). This threshold level was the only threshold level that did not exhibit a significant trend either during this month or across the annual series (Figure 6).
Figure 6.
Monthly and annual rainfall trends in Multan (2000–2020) detected by the Mann–Kendall test (0.10 significance level); dashed lines indicate the direction of significant trends where present.
3.3. Innovative Trend Analysis Results
3.3.1. Temperature Trends
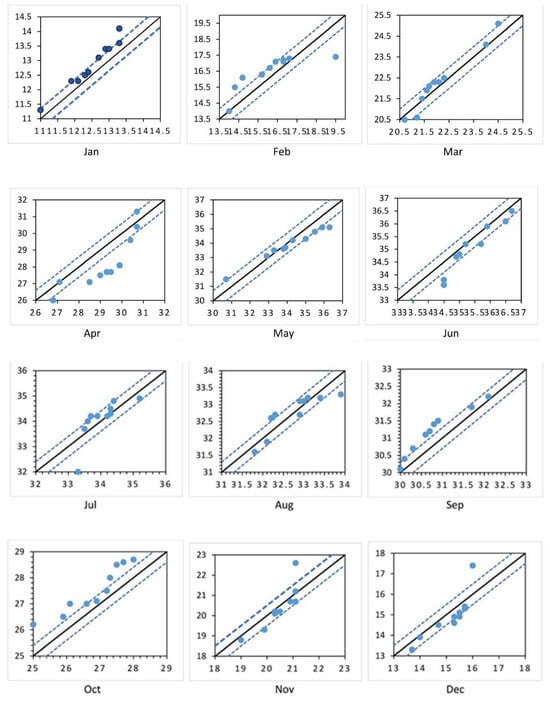
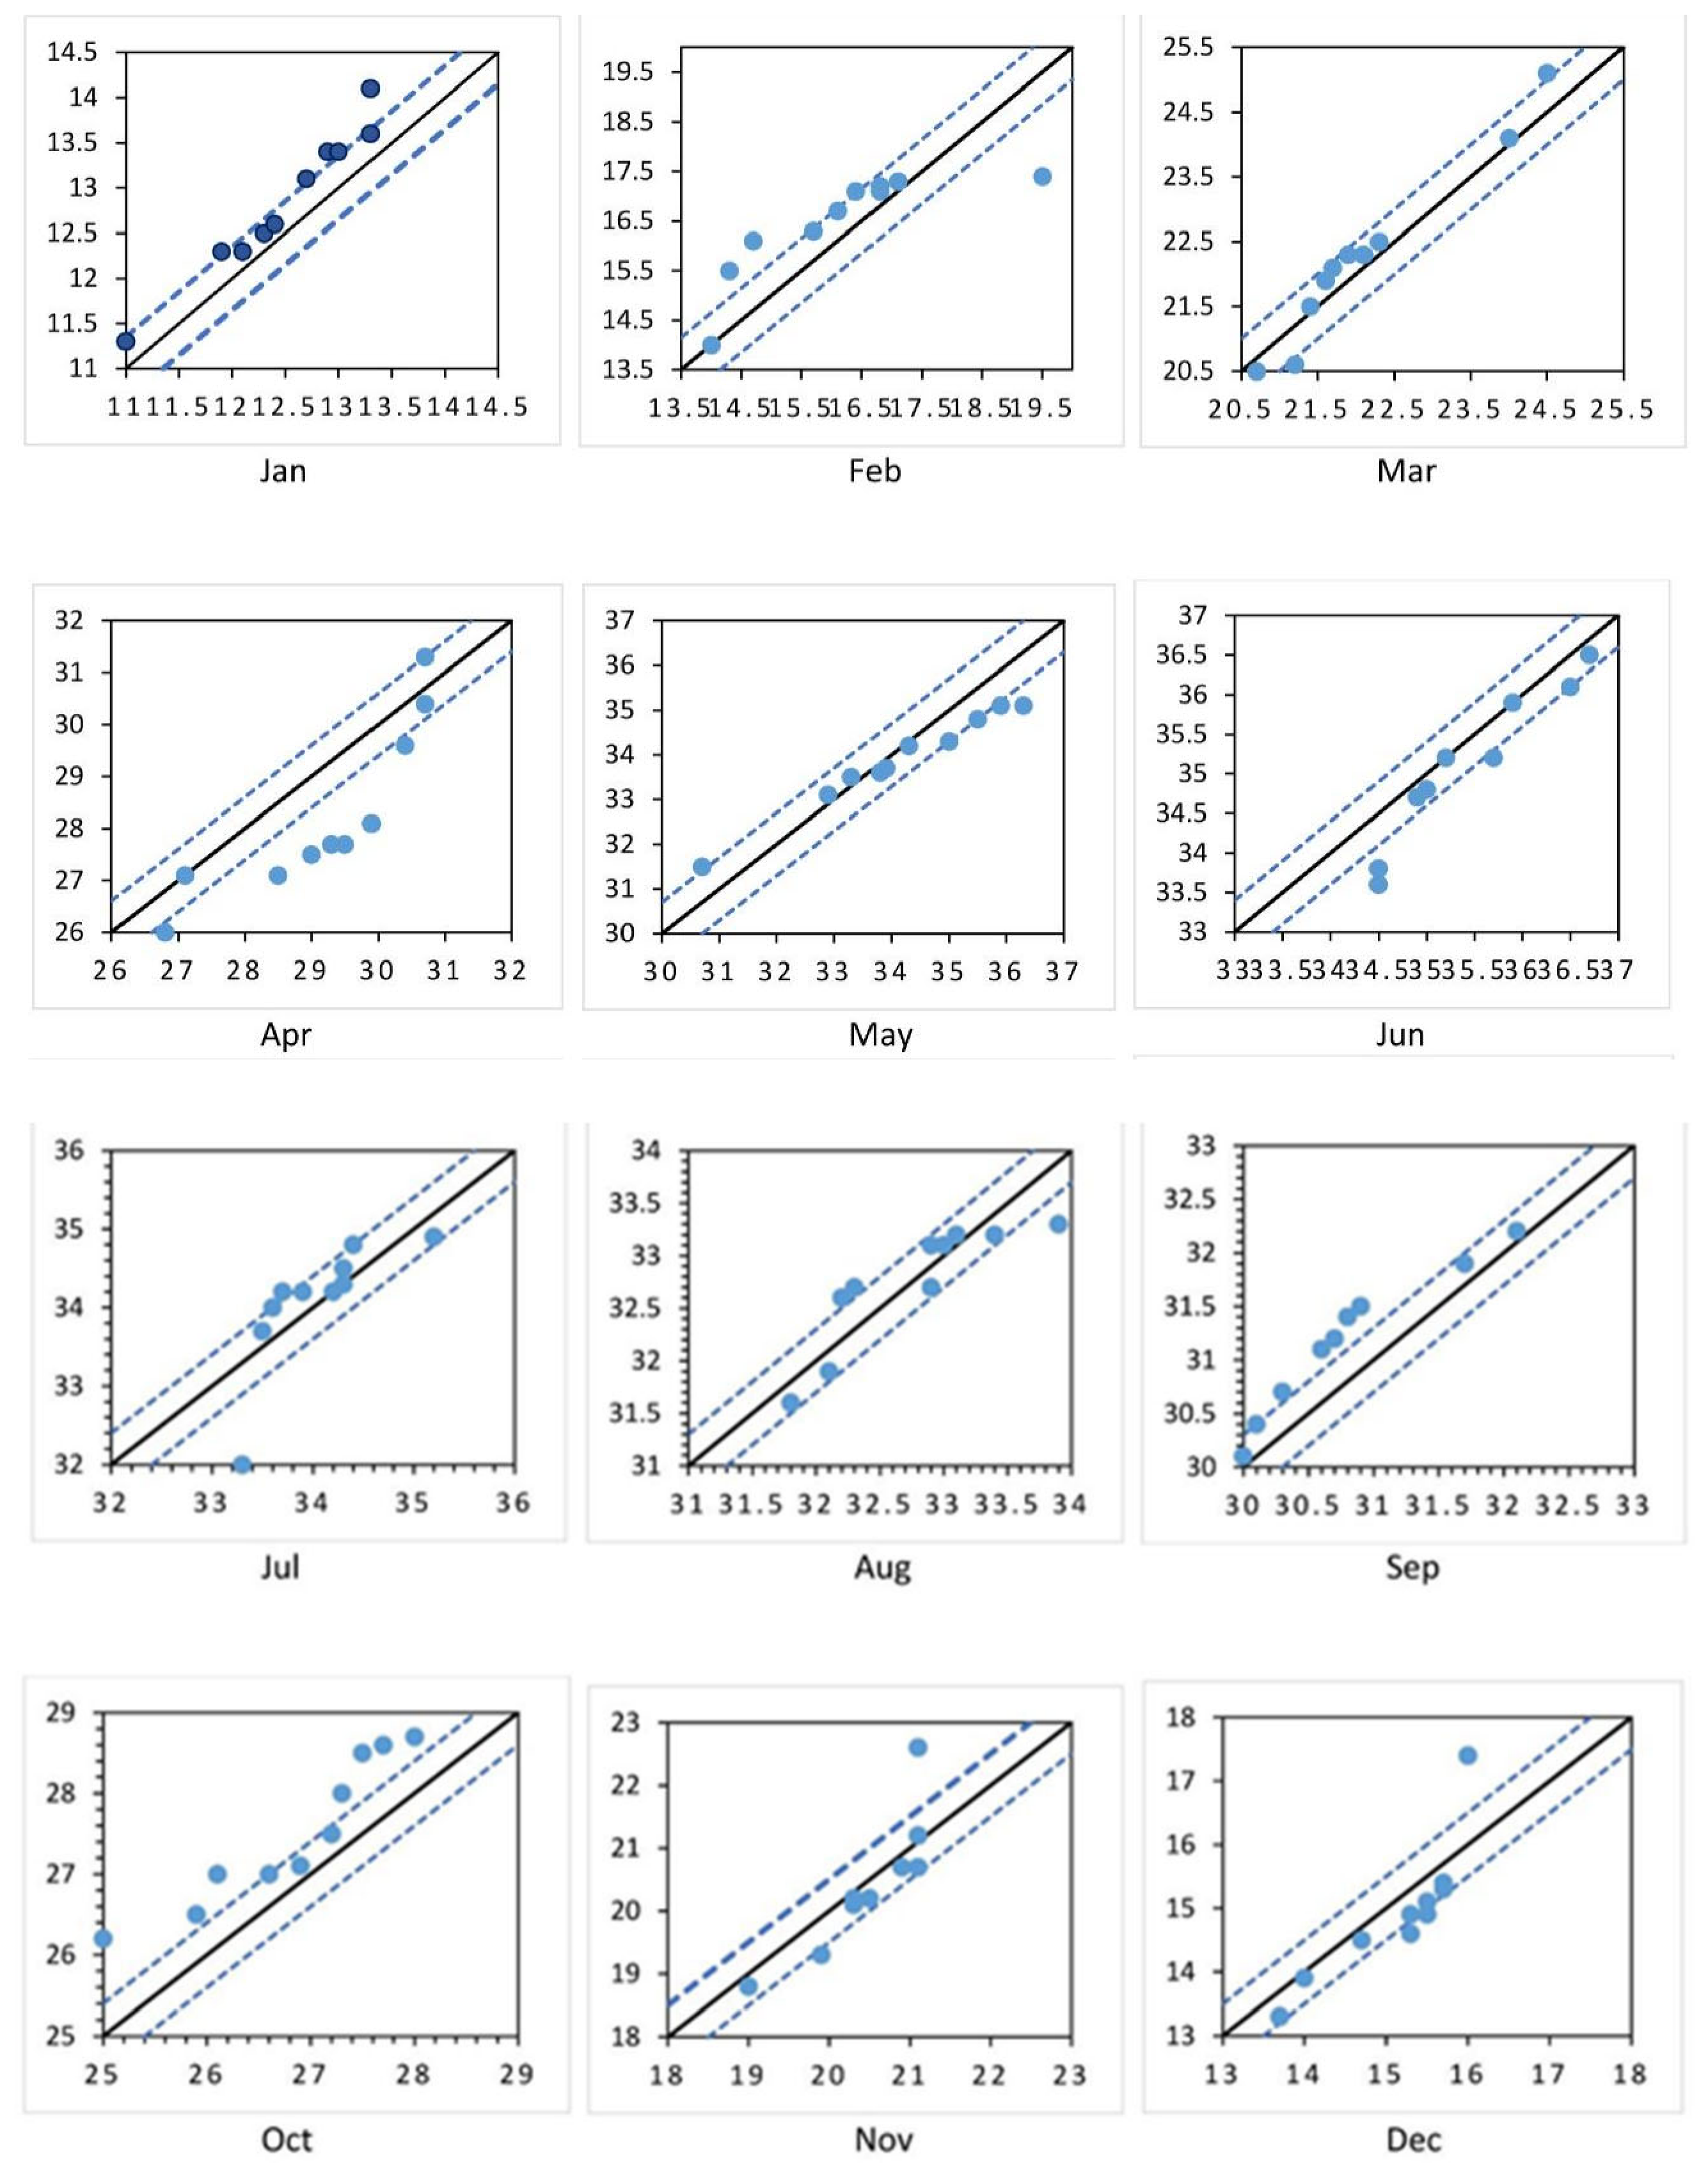
ITA identified an increasing trend that became pronounced in January (upward trend indicator value of 0.30), February (0.26) and March (0.12). The trend became pronounced negative in April (−0.75) and continued to show decreases in May (−0.22) and June (−0.25). July was marginally warmer (+0.03), while August was marginally cooler (−0.02). September (0.31) and October (0.55) had the highest positive signals, and November and December had negative signals, returning to decreasing trends (−0.06 and −0.17, respectively). The annual trend indicator was 0, indicating no net annual trend based on the full monthly cycle data (Figure 7), similar to the Mann–Kendall result at the annual time scale for the annual series.
Figure 7.
Innovative Trend Analysis scatter plots for monthly temperature in Multan (2000–2020); points above the 1:1 line indicate an increasing trend and points below indicate a decreasing trend.
3.3.2. Rainfall Trends
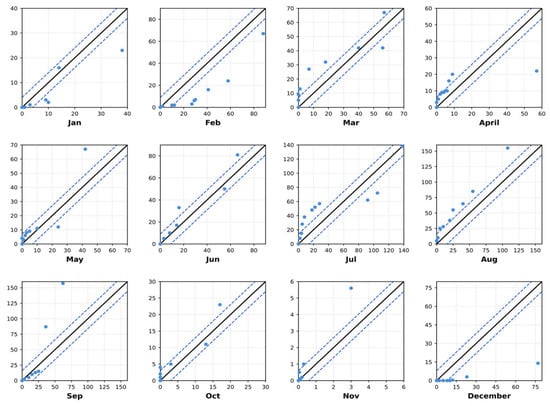
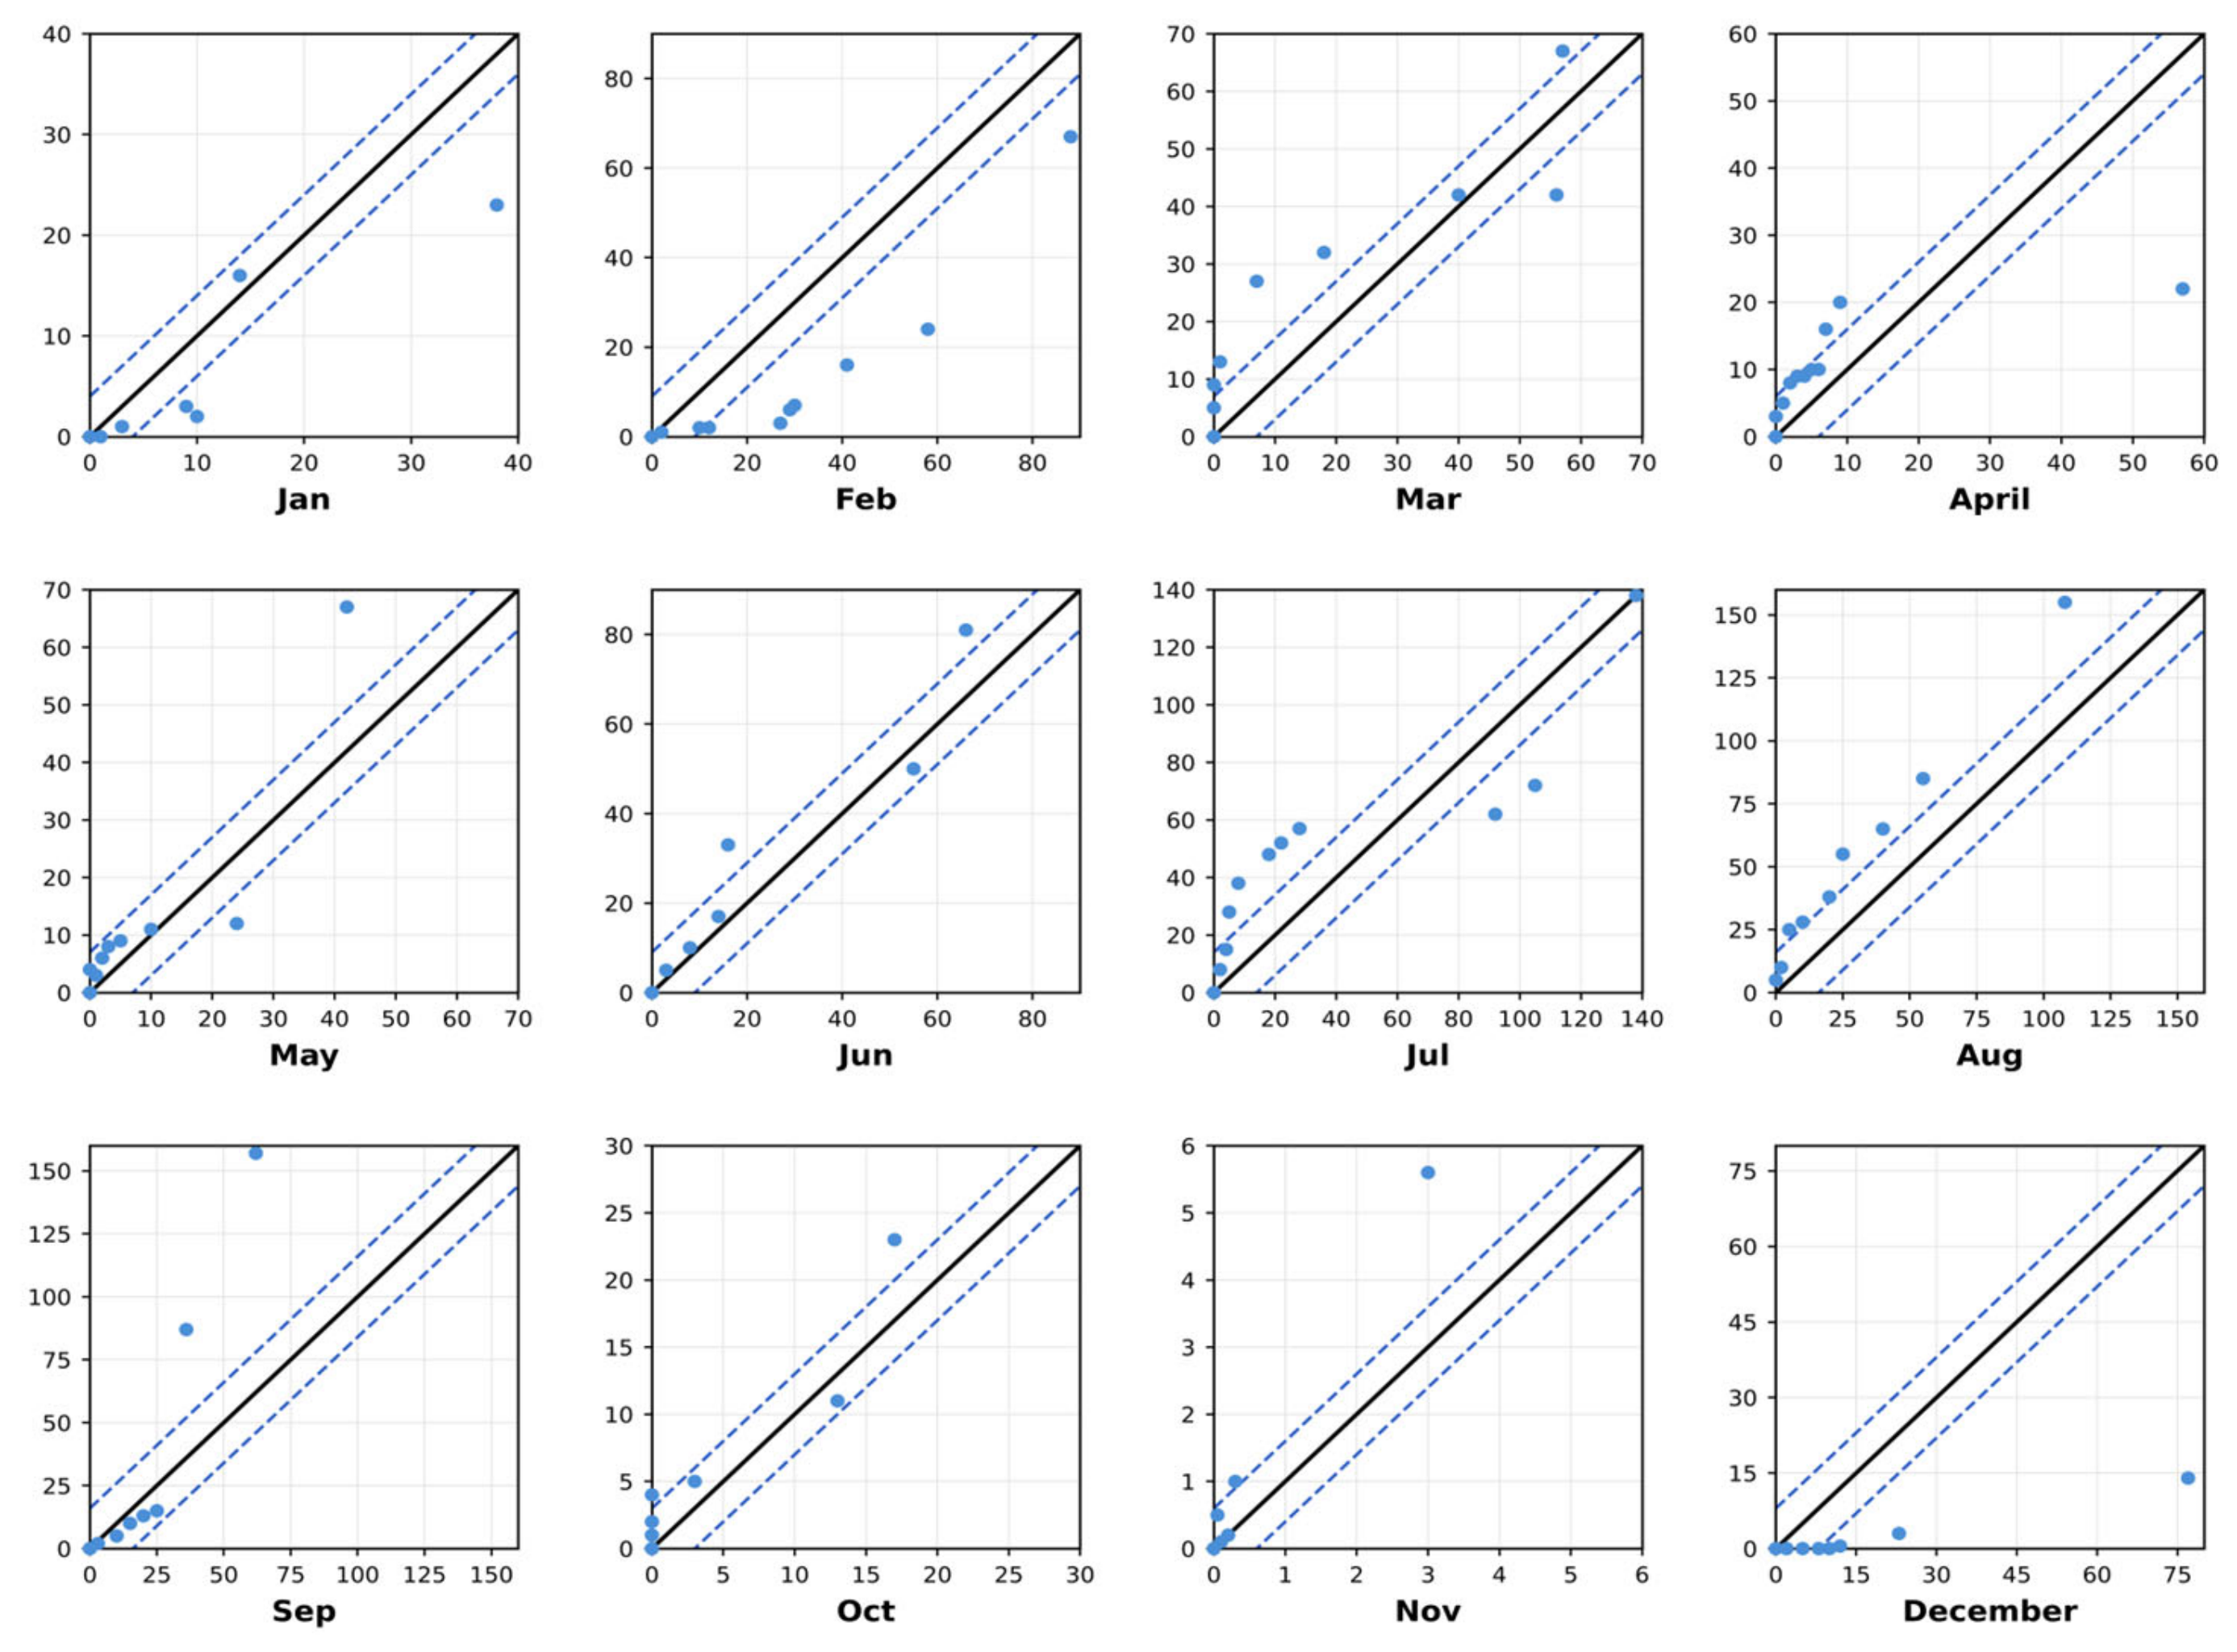
Rainfall trend indicators were less consistent than temperature indicators in regard to sign and magnitude. The monthly trends ranged from decreasing in January and February (−4.40 and −5.76, respectively), to increasing trends of various magnitudes from March through November (between 1.53 and 10.00). There was a substantial turnaround into the worst conditions in the annual cycle for December (+ −10.00). Although monthly variability occurred, the Mann–Kendall annual test did not show significant change, with the positive annual trend indicator (1.22) reflecting an increase in the amount of annual rainfall, as shown in Figure 8, and highlighting the enhanced sensitivity of ITA to distributional shifts that are not apparent from a purely rank-based test.
Figure 8.
Innovative Trend Analysis scatter plots for monthly rainfall in Multan (2000–2020); points above the 1:1 line indicate an increasing trend and points below indicate a decreasing trend.
3.4. Comparison of Mann–Kendall and Innovative Trend Analysis Results
The two trend-detection methods agreed on a generally consistent picture for temperature, with neither showing a significant trend in the annual series, or both showing a positive trend in January and in September, with a negative trend in December. This agreement between the two methods, with distinctly different statistical assumptions, increases the confidence in the value of these specific monthly signals as being sources from real climatic variability, and reinforces the importance of monthly-resolution analysis in the study of climate variability over and above the use of annual aggregates alone [33]. At the monthly scale, the two methods matched in their direction of change for April and June (upward) and January (downward); there was no significant monthly trend estimated by the Mann–Kendall test for rainfall in the annual record, but a slight positive trend suggested by ITA, which was caused by increases in events in most months counteracting a large drop in December. This difference is in line with the well-known property ITA has of being more sensitive to unevenly distributed trends across the value range of a series and highlights the need to use both methods together to characterize climatic change, particularly in a data-scarce regional domain like Multan. Overall, climatic evidence suggests that there has been no uniform, monotonic, annual trend in the temperature and rainfall regimes of the city area in Multan between 2000 and 2020, but rather an annual shift in the intensity of temperature and rainfall over specific months, with direct impacts on cropping calendars, irrigation planning and orchard management, and which reflects the scenario detailed in Section 3.1 (of contracting agricultural land base due to urban expansion). The strengthening of the land use–climate feedback, as described in Section 2.1 [6,7], has been observed in the Multan context, in terms of a smaller, more fragmented agricultural base and a changing seasonal climate signal and implies that land use planning and agro-climatic adaptation should be considered together, and not separately.
The changes in urban and agricultural areas and climate are shown to be occurring simultaneously. Whilst urban growth and agricultural land conversion can affect local environmental conditions, climatic variation is also influenced by regional and global factors in the atmosphere [34]. This study shows that there are temporal relationships between the variables but cannot quantify how much urbanization has contributed to climate change. Further analysis is required to understand these relationships using spatial modeling techniques, multivariate regression and more environmental variables.
While Landsat provides suitable data for district-scale land cover analysis, the 30 m resolution may hinder the detection of small, fragmented land cover features [35]. Classification uncertainty may arise due to mixed pixel values, especially at urban-agricultural land cover boundaries [36,37]. The use of higher-resolution satellite data and ground data can provide increased accuracy in future studies.
4. Conclusions
This study combined the classification of multi-temporal Landsat data with two complementary non-parametric trend detection techniques, allowing three decades of land use change and two decades of 20th-century climatic variability to be characterized for the city of Multan, Pakistan. The land in the city (built-up) has grown by 125%, gaining about 3.9% of the total area in the study area, from 14.6% to 34.1% of the total area, while land use as orchards has reduced by 84% from 42.6% of the total area to 8.5% of the total area at an average annual growth rate of 2.8%. While field crops grew moderately (35% net), there was a sizeable expansion in the fishponds from a negligible base to 2.6% of the study area by 2020. Overall accuracy in classifications was high for all three dates (84.5–87.6%), and the kappa value ranged from good to very good (0.79–0.83), lending confidence to these estimates of change. Trend analysis of the 2000–2020 data (both with and without smoothing) showed no statistically significant monotonic trend in the annual average of both temperature and rainfall, but there were strong significant monthly trends for increasing temperature in January and September and decreasing temperature in December; decreasing rainfall in January but increasing rainfall in April and June. On the question of trends in annual rainfall, a slow upward trend also emerged from the long record of annual rainfall data and was picked up by the innovative trend analysis but was not discerned by the Mann–Kendall test, providing a further illustration of the utility of supplementing the application of complementary trend-detecting tests to short, seasonally varying regional climate records. These findings are indicative of a current and future evolution of the state of the landscape around Multan, from a periphery dominated by orchards and croplands towards a built-up, more urbanized landscape, and surrounded by an increasing level of variability in the months, while not a year-round shift.
Author Contributions
Conceptualization, S.J. and M.T.I.; methodology, Z.U., M.I.A.; software, Z.Z.; validation, S.J., and M.A.; formal analysis, M.A.; investigation, S.A.G.; resources, M.I.A.; data curation, S.J.; writing—original draft preparation, M.T.I.; writing—review and editing, M.A. and M.I.A.; visualization, S.A.G. and M.T.I. contributed to conceptualization, data acquisition, image classification, formal analysis, and writing—original draft. S.J. contributed to supervision, methodology, and writing—review and editing. H.U.F. contributed to supervision, methodology, and writing—review and editing. M.A., F.A. and M. contributed to the research and manuscript development. All authors have read and agreed to the published version of the manuscript.
Funding
This research received no external funding.
Institutional Review Board Statement
Not applicable.
Informed Consent Statement
Not applicable.
Data Availability Statement
Landsat imagery is publicly available from the U.S. Geological Survey Global Visualization Viewer (glovis.usgs.gov). Meteorological data were obtained from the Pakistan Meteorological Department, Islamabad, and are available from that source subject to its data-sharing policies. Derived datasets and classification outputs are available from the corresponding author upon reasonable request.
Acknowledgments
During the preparation of this manuscript, the authors used Claude (Anthropic) (Free plan, Claude Sonnet 5 model, accessed via claude.ai, 2026) and Grammarly (Free plan, web version, accessed 2026) for language editing. Mendeley (version 2.151.0, free version) was used for reference management. No data or values were generated by these tools. All output was reviewed and edited by the authors and the authors take full responsibility for the integrity, accuracy, and originality of this publication.
Conflicts of Interest
The authors declare no conflicts of interest.
References
- United Nations, Department of Economic and Social Affairs, Population Division. World Urbanization Prospects: The 2018 Revision; United Nations: New York, NY, USA, 2018. [Google Scholar]
- Weng, Q. Land use change analysis in the Zhujiang Delta of China using satellite remote sensing, GIS and stochastic modelling. J. Environ. Manag. 2002, 64, 273–284. [Google Scholar] [CrossRef] [Scilit]
- Government of Pakistan. Census 2016–2017. Pakistan Bureau of Statistics. 2017. Available online: https://www.pbs.gov.pk/ (accessed on 5 July 2022).
- Ahmed, S.; Huifang, W.; Akhtar, S.; Imran, S.; Hassan, G.; Wang, C. An analysis of urban sprawl in Pakistan: Consequences, challenges, and the way forward. Int. J. Agric. Extension. 2021, 8, 257–278. [Google Scholar] [CrossRef] [Scilit]
- Ahamad, M.I.; Mehmood, M.S.; Mahmood, S.; Su, Y.; Mahmood, F.; Ijaz, J.; Gil, S.A.; Abbas, S. Mapping global research trends in land use/land cover change and ecosystem services in ecologically fragile regions: A bibliometric review. GeoJournal 2026, 91, 161. [Google Scholar] [CrossRef] [Scilit]
- Niyogi, D.; Mahmood, R.; Adegoke, J.O. Land-use/land-cover change and its impacts on weather and climate. Bound.-Layer Meteorol. 2009, 133, 297–298. [Google Scholar] [CrossRef] [Scilit]
- Pielke, R.A., Sr. Land use and climate change. Science 2005, 310, 1625–1626. [Google Scholar] [CrossRef] [Scilit]
- Chen, F.; Yang, X.; Zhu, W. WRF simulations of urban heat island under hot-weather synoptic conditions: The case study of Hangzhou City, China. Atmos. Res. 2014, 138, 364–377. [Google Scholar] [CrossRef] [Scilit]
- Wang, J.; Feng, J.; Yan, Z. Potential sensitivity of warm season precipitation to urbanization extents: Modeling study in Beijing–Tianjin–Hebei urban agglomeration in China. J. Geophys. Res. Atmos. 2015, 120, 9408–9425. [Google Scholar] [CrossRef] [Scilit]
- Wang, J.; Yan, Z.; Quan, X.W.; Feng, J. Urban warming in the 2013 summer heat wave in eastern China. Clim. Dyn. 2017, 48, 3015–3033. [Google Scholar] [CrossRef] [Scilit]
- Ashraf, T.; Aslam, J.; Mehmood, M.S.; Ahamad, M.I.; Rehman, A. Geospatial assessment of built environment on land surface temperature in district Sheikhupura, Punjab Pakistan. Discov. Geosci. 2024, 2, 30. [Google Scholar] [CrossRef] [Scilit]
- Pielke, R.A., Sr.; Pitman, A.; Niyogi, D.; Mahmood, R.; McAlpine, C.; Hossain, F.; Klein Goldewijk, K.; Nair, U.; Betts, R.; de Noblet, N.; et al. Land use/land cover changes and climate: Modeling analysis and observational evidence. Wiley Interdiscip. Rev. Clim. Change 2011, 2, 828–850. [Google Scholar] [CrossRef] [Scilit]
- Pongratz, J.; Reick, C.H.; Raddatz, T.; Claussen, M. Biogeophysical versus biogeochemical climate response to historical anthropogenic land cover change. Geophys. Res. Lett. 2010, 37, L08702. [Google Scholar] [CrossRef] [Scilit]
- Qasim, M.; Ali, N.; Aqeel, M. Trends and patterns of temporal urban population growth in Pakistan. Pak. Soc. Sci. Rev. 2023, 7, 551–564. [Google Scholar]
- Hussain, S.; Mubeen, M.; Ahmad, A.; Akram, W.; Hammad, H.M.; Ali, M.; Masood, N.; Amin, A.; Farid, H.U.; Nasim, W.; et al. Using GIS tools to detect the land use/land cover changes during forty years in Lodhran District of Pakistan. Environ. Sci. Pollut. Res. 2020, 27, 39676–39692. [Google Scholar] [CrossRef] [Scilit]
- Sarwar, A.; Gulzar, S.S.; Qayyum, M.S.N.; Khurshid, T. Land use land cover change analysis (2000–2018) of Tehsil Katlang District, Mardan, Pakistan, using GIS and remote sensing. J. Environ. Agric. Sci. 2019, 20, 21–27. [Google Scholar]
- Zakariya, K.M.; Sarwar, T.; Farid, H.U.; Albano, R.; Inam, M.A.; Shoaib, M.; Ahmad, A.; Ahmad, M. Land Use Land Cover (LULC) Mapping for Assessment of Urbanization Impacts on Cropping Patterns and Water Availability in Multan, Pakistan. Earth 2025, 6, 79. [Google Scholar] [CrossRef] [Scilit]
- Tahir, Z.; Haseeb, M.; Mahmood, S.A.; Hassan, N.E.; Dogar, M.M.; Hassan, S.Z. From green to grey: Assessing the impact of urbanization on land surface temperature and thermal comfort in Multan City. Earth Syst. Environ. 2025, 9, 777–800. [Google Scholar] [CrossRef] [Scilit]
- Hussain, S.; Mubeen, M.; Akram, W.; Ahmad, A.; Habib-ur-Rahman, M.; Ghaffar, A.; Nasim, W. Study of land cover/land use changes using RS and GIS: A case study of Multan district, Pakistan. Environ. Monit. Assess. 2020, 192, 2. [Google Scholar] [CrossRef] [Scilit]
- Islam, M.R.; Khan, M.N.I.; Khan, M.Z.; Roy, B. A three decade assessment of forest cover changes in Nijhum dwip national park using remote sensing and GIS. Environ. Chall. 2021, 4, 100162. [Google Scholar] [CrossRef] [Scilit]
- Erasu, D. Remote sensing-based urban land use/land cover change detection and monitoring. J. Remote Sens. GIS 2017, 6, 5. [Google Scholar] [CrossRef]
- Olofsson, P.; Foody, G.M.; Herold, M.; Stehman, S.V.; Woodcock, C.E.; Wulder, M.A. Good practices for estimating area and assessing accuracy of land change. Remote Sens. Environ. 2014, 148, 42–57. [Google Scholar] [CrossRef] [Scilit]
- Gocic, M.; Trajkovic, S. Analysis of changes in meteorological variables using Mann–Kendall and Sen’s slope estimator statistical tests in Serbia. Glob. Planet. Change 2013, 100, 172–182. [Google Scholar] [CrossRef] [Scilit]
- Arra, A.A.; Keskin, M.Z.; Şişman, E. Trend Analysis of Hydro-Meteorological Variables Using Mann-Kendall and Sen’s Slope with Standardization (SSS): Case Study of the Kızılırmak Catchment, Türkiye. Phys. Chem. Earth Parts A/B/C 2025, 141, 104115. [Google Scholar] [CrossRef] [Scilit]
- Şen, Z. Innovative trend analysis methodology. J. Hydrol. Eng. 2012, 17, 1042–1046. [Google Scholar] [CrossRef] [Scilit]
- Güçlü, Y.S. Multiple Şen-innovative trend analyses and partial Mann-Kendall test. J. Hydrol. 2018, 566, 685–704. [Google Scholar] [CrossRef] [Scilit]
- Fazal, S. Urban expansion and loss of agricultural land: A GIS based study of Saharanpur City, India. Environ. Urban 2000, 12, 133–149. [Google Scholar] [CrossRef] [Scilit]
- Gumma, M.K.; Mohammad, I.; Nedumaran, S.; Whitbread, A.; Lagerkvist, C.J. Urban sprawl and adverse impacts on agricultural land: A case study on Hyderabad, India. Remote Sens. 2017, 9, 1136. [Google Scholar] [CrossRef] [Scilit]
- Kantakumar, L.N.; Neelamsetti, P. Multi-temporal land use classification using hybrid approach. Egypt. J. Remote Sens. Space Sci. 2015, 18, 289–295. [Google Scholar] [CrossRef] [Scilit]
- Rawat, J.S.; Biswas, V.; Kumar, M. Changes in land use/cover using geospatial techniques: A case study of Ramnagar town area, district Nainital, Uttarakhand, India. Egypt. J. Remote Sens. Space Sci. 2013, 16, 111–117. [Google Scholar] [CrossRef] [Scilit]
- Usman, M.; Liedl, R.; Shahid, M.A.; Abbas, A. Land use/land cover classification and its change detection using multi-temporal MODIS NDVI data. J. Geogr. Sci. 2015, 25, 1479–1506. [Google Scholar] [CrossRef] [Scilit]
- Rodríguez-Antuñano, I.; Sousa, J.J.; Bakoň, M.; Ruiz-Armenteros, A.M.; Martínez-Sánchez, J.; Riveiro, B. Empowering intermediate cities: Cost-effective heritage preservation through satellite remote sensing and deep learning. Int. J. Remote Sens. 2024, 45, 4046–4074. [Google Scholar] [CrossRef] [Scilit]
- Frimpong, B.F.; Koranteng, A.; Molkenthin, F. Analysis of temperature variability utilising Mann–Kendall and Sen’s slope estimator tests in the Accra and Kumasi Metropolises in Ghana. Environ. Syst. Res. 2022, 11, 24. [Google Scholar] [CrossRef] [Scilit]
- Lin, C.; Wu, C.C.; Tsogt, K.; Ouyang, Y.C.; Chang, C.I. Effects of atmospheric correction and pansharpening on LULC classification accuracy using WorldView-2 imagery. Inf. Process. Agric. 2015, 2, 25–36. [Google Scholar] [CrossRef] [Scilit]
- Lu, D.; Mausel, P.; Brondizio, E.; Moran, E. Change detection techniques. Int. J. Remote Sens. 2004, 25, 2365–2401. [Google Scholar] [CrossRef] [Scilit]
- Ministry of Climate Change. Climate Change: Past and Future Trends; Government of Pakistan: Islamabad, Pakistan, 2015.
- Rawat, J.S.; Kumar, M. Monitoring land use/cover change using remote sensing and GIS techniques: A case study of Hawalbagh block, district Almora, Uttarakhand, India. Egypt. J. Remote Sens. Space Sci. 2015, 18, 77–84. [Google Scholar] [CrossRef] [Scilit]

Disclaimer/Publisher’s Note: The statements, opinions and data contained in all publications are solely those of the individual author(s) and contributor(s) and not of MDPI and/or the editor(s). MDPI and/or the editor(s) disclaim responsibility for any injury to people or property resulting from any ideas, methods, instructions or products referred to in the content. |
© 2026 by the authors. Licensee MDPI, Basel, Switzerland. This article is an open access article distributed under the terms and conditions of the Creative Commons Attribution (CC BY) license.