Article

Understanding Multidimensional Poverty Through the Lens of Local Determinants: A Micro-Level Perspective from Suri Sadar Sub-Division, Birbhum District, Eastern India

by
Ranajit Ghosh
1 and
Prolay Mondal
2,*
1
Department of Geography, Suri Vidyasagar College, The University of Burdwan, Birbhum, Suri 731101, India
2
Department of Geography, Raiganj University, Raiganj 733134, India
*
Author to whom correspondence should be addressed.
Geographies 2026, 6(2), 49; https://doi.org/10.3390/geographies6020049
Submission received: 22 February 2026 / Revised: 22 April 2026 / Accepted: 4 May 2026 / Published: 11 May 2026

Abstract

This study examines the multidimensional nature of poverty and its underlying local determinants within the Suri Sadar Sub-Division of Birbhum District, Eastern India, an area marked by sharp ecological and socio-economic contrasts. Adopting a mixed-method approach, the research integrates primary household survey data (2024-25) with secondary spatial datasets to construct a comprehensive analytical framework. The extent and intensity of multidimensional poverty were measured using the Alkire–Foster (AF) method, while the determinants were identified through a Binary Logistic Regression model. Findings reveal that multidimensional poverty in the region is deeply rooted in the intersection of human, environmental, and spatial factors rather than mere income deprivation. Approximately 26.8 per cent of households were found to be multidimensionally poor, with the western plateau blocks, i.e., Rajnagar, Khoyrasole, and Md. Bazar, showing the highest deprivation levels. Spatial poverty drivers include education, agriculture, and gender equality improvements. Policy implications emphasise the need for geographically tailored, multi-sectoral interventions that focus on human capability, investing in infrastructure, and promoting gender-inclusive development. By elucidating the localized dynamics of poverty, this research contributes to the broader discourse on spatial inequality and sustainable development in rural Eastern India, offering actionable insights for evidence-based regional planning and targeted poverty alleviation.

1. Introduction

Poverty remains one of the most persistent and multifaceted challenges in the contemporary world, transcending the boundaries of mere economic deprivation to encompass multiple dimensions of human well-being [1,2]. Although the global community has made significant strides toward reducing extreme poverty in the last few decades, particularly under the framework of the Millennium Development Goals (MDGs) and the ongoing Sustainable Development Goals (SDGs), poverty continues to manifest in complex, interwoven forms across developing regions [3]. The recognition that poverty extends beyond low income to include deficits in education, health, housing, and social inclusion has fundamentally reshaped academic discourse and policy approaches [4]. In this context, the multidimensional understanding of poverty provides a more holistic and human-centered framework for analyzing deprivation, capturing the intricate interplay between structural, spatial, and socio-economic variables that define the lived experiences of poor households [5,6].
Traditional unidimensional measures of poverty, primarily income- or consumption-based, have historically served as dominant tools for evaluating economic deprivation. While these measures offer valuable insights into the financial condition of households, they fall short of representing the complex realities of poverty in its entirety [7]. The economic approach, rooted in resource inadequacy, often overlooks the qualitative dimensions of human life, such as access to education, healthcare, housing conditions, environmental quality, empowerment, etc., which are equally vital for assessing well-being [8]. This conceptual limitation has been critically addressed by scholars such as Sen [9,10] who introduced the capability approach, emphasizing the substantive freedoms individuals possess to lead lives they value. Following this paradigm, multidimensional poverty measurement frameworks, including the Human Development Index (HDI) and the Multidimensional Poverty Index (MPI), have emerged as more comprehensive alternatives that assess deprivation through multiple interrelated indicators. In recent years, the multidimensional poverty framework has gained considerable prominence in both academic and policy circles [11]. The approach recognizes that poverty is not a unidirectional phenomenon but rather a network of intersecting disadvantages that jointly constrain individuals and households [12]. For instance, a household may experience deprivation in education and health even if it marginally exceeds the income poverty threshold, indicating that economic growth alone cannot guarantee improved well-being [13]. Thus, multidimensional poverty analysis allows researchers and policymakers to capture the cumulative effects of multiple deprivations, identify interconnections among indicators, and design targeted interventions that address both economic and non-economic dimensions of poverty.
India, as one of the world’s largest developing economies, presents a compelling case for examining poverty from a multidimensional perspective [14]. Despite achieving notable progress in economic growth and human development since the 1990s, poverty continues to exhibit significant regional and social disparities [15]. The persistence of deprivation in rural areas underscores the limitations of growth-driven poverty alleviation strategies that neglect local and structural constraints [16]. According to the Global Multidimensional Poverty Index [17,18], India has successfully reduced its MPI-poor population over the past decade; however, rural areas, particularly in the eastern and central states, continue to experience high deprivation levels [19]. States such as Bihar, Jharkhand, Odisha, Chhattisgarh, Madhya Pradesh, and West Bengal represent the core of India’s poverty belt, where economic underdevelopment, social exclusion, and infrastructural deficiencies reinforce cycles of deprivation. Within these states, intra-regional variations are particularly significant, with pockets of intense poverty often concentrated in specific ecological and socio-cultural zones [20].
West Bengal, located in eastern India, occupies a paradoxical position in the national development narrative. The state has achieved moderate economic progress and notable improvements in human development indicators, yet large segments of its rural population continue to endure persistent multidimensional poverty [21]. The reasons for this persistence are deeply embedded in the state’s agrarian structure, uneven industrialization, demographic pressures, and spatial disparities between the western plateau fringe and the more fertile eastern plains [22]. Within the state, Birbhum district exemplifies this duality of development. While certain areas benefit from proximity to urban centers and better infrastructural connectivity, others, particularly those situated in the western plateau fringe, remain marginalized due to adverse agro-ecological conditions, lower agricultural productivity, and limited access to basic amenities [23]. Such heterogeneity within a single district underscores the importance of conducting micro-level analyses that account for local determinants influencing multidimensional poverty. The Suri Sadar Sub-Division of Birbhum district serves as an appropriate micro-level case for examining these disparities due to its pronounced environmental and socio-economic heterogeneity. The coexistence of plateau and alluvial regions, along with variations in agricultural productivity and infrastructure, creates a diverse setting for analyzing multidimensional poverty.
Understanding poverty in such a micro-regional framework requires an analytical approach that integrates both household-level and spatial determinants. While conventional poverty studies in India often rely on macro-level datasets, they tend to obscure the local variability that shapes deprivation patterns. A micro-level approach, supported by household surveys and spatial analysis, enables the identification of localized drivers of poverty that remain invisible in aggregated statistics [24]. In this context, the present study adopts a multidimensional and spatially sensitive framework to examine how individual and regional factors jointly determine poverty outcomes in the Suri Sadar Sub-Division. By doing so, it aligns with the growing emphasis in geographical scholarship on place-based analyses of poverty that recognize the interplay between socio-economic structures, environmental conditions, and institutional contexts.
The multidimensional nature of poverty necessitates examining determinants that go beyond mere income or expenditure [25]. At the household level, factors such as the size of the household, the gender and educational attainment of the household head, and marital status significantly shape poverty outcomes by influencing resource allocation, income-generating capacity, and access to social networks [26]. Simultaneously, regional determinants, including physiographic conditions, elevation, soil type, distance from markets, cropping intensity, and gender gaps in literacy, employment, etc., create the spatial context within which households experience deprivation [27]. This interaction between individual and structural factors forms the foundation of the current investigation. The study thus emphasizes the need to interpret poverty as a geographically embedded process influenced by both human and environmental systems.
From the perspective of regional development theory, poverty is often closely linked to spatial inequality in the distribution of resources, infrastructure, and economic opportunities [28]. Scholars of economic geography have long argued that uneven regional development results from historical processes of capital concentration, infrastructural investment, and ecological endowments, which together shape the spatial pattern of welfare outcomes [29]. In developing countries, regions characterized by fragile environments, poor connectivity, and limited institutional support frequently experience persistent deprivation despite broader economic growth. Consequently, geographic determinants such as terrain conditions, soil fertility, irrigation potential, and accessibility to markets and services become critical factors influencing livelihood opportunities and human well-being [30]. Integrating these spatial dimensions into poverty analysis, therefore, allows for a deeper understanding of how regional inequalities translate into multidimensional deprivation at the household level.
From a methodological standpoint, multidimensional poverty assessment offers a systematic framework for quantifying deprivation through multiple indicators [31]. The Alkire–Foster (AF) method, which serves as the backbone of multidimensional poverty measurement, has been widely adopted at global and national levels, including by India’s NITI Aayog in its estimation of the National Multidimensional Poverty Index [1,31,32,33]. Therefore, the present research employs a micro-level adaptation of the AF methodology, coupled with binary logistic regression, to explore how local determinants influence multidimensional poverty across different community development blocks within Suri Sadar.
The rationale for focusing on local determinants stems from the recognition that poverty reduction policies must be tailored to the specific socio-spatial realities of each region [34]. The experience of poverty in plateau-fringe areas differs fundamentally from that in alluvial plains, just as the constraints faced by female-headed households differ from those of male-headed ones [23,35]. Consequently, policy interventions grounded in localized empirical evidence are likely to be more effective in addressing the root causes of poverty than uniform, top-down strategies [36]. By identifying the determinants that significantly contribute to multidimensional poverty in Suri Sadar, this research seeks to inform the design of place-specific interventions that promote equitable and sustainable development. Moreover, studying multidimensional poverty through a geographical lens enriches our understanding of how spatial inequality interacts with socio-economic processes. Geography, as a discipline, provides critical tools to analyze the spatiality of poverty, how it is distributed, how it correlates with environmental features, and how access to resources and opportunities varies across space [37]. Spatial heterogeneity is not merely a background condition but an active determinant that mediates the translation of economic and social capital into human well-being [38]. The inclusion of geographical parameters such as elevation, soil texture, and market accessibility in this study underscores the necessity of integrating spatial variables into poverty analysis, an approach that remains underrepresented in mainstream economic studies.
The study also contributes to the broader discourse on sustainable development. The United Nations’ 2030 Agenda explicitly identifies the eradication of poverty in all its forms as the first Sustainable Development Goal (SDG 1) [39]. However, the goal’s realization depends on recognizing the localized and multidimensional character of poverty. Understanding how specific regional and household-level factors perpetuate deprivation provides the empirical foundation for achieving other interconnected goals, including quality education (SDG 4), gender equality (SDG 5), reduced inequalities (SDG 10), and sustainable communities (SDG 11) [40,41]. Thus, this research transcends mere academic inquiry; it aligns with global efforts to operationalize inclusive and sustainable pathways of development through evidence-based policymaking.
In this regard, the Suri Sadar Sub-Division represents an instructive case study that illustrates the complex interrelations among environment, economy, and society in shaping human well-being. Its physiographic diversity, agricultural dependence, and socio-economic stratification offer fertile ground for analyzing how localized conditions influence multidimensional poverty. The empirical findings generated from this study will not only provide insights into the spatial patterning of poverty within Birbhum district but also contribute to comparative studies across other regions of eastern India facing similar challenges. By highlighting the intersection of geography and human deprivation, the research underscores the indispensable role of spatial analysis in understanding and addressing multidimensional poverty in rural India.
The selection of the Suri Sadar Sub-Division as the study area is motivated by its unique combination of environmental diversity and socio-economic inequality. Marked contrasts between plateau fringe and alluvial plains, disparities in resource accessibility, and variations in livelihood opportunities make the region particularly suitable for investigating how local conditions shape multidimensional poverty at a micro scale.
Against this background, the present study aims to examine multidimensional poverty from a micro-level perspective in the Suri Sadar Sub-Division of Birbhum district, West Bengal. The specific objectives are threefold: first, to measure the extent and intensity of multidimensional poverty using the Alkire–Foster method; second, to identify the key household-level and regional determinants influencing poverty through a binary logistic regression framework; and third, to analyze the spatial patterns of deprivation to generate insights for targeted and place-specific policy interventions. Through this integrative approach, the study seeks to contribute to a more nuanced geographical understanding of poverty in eastern India.

2. Materials and Methods

2.1. Study Area

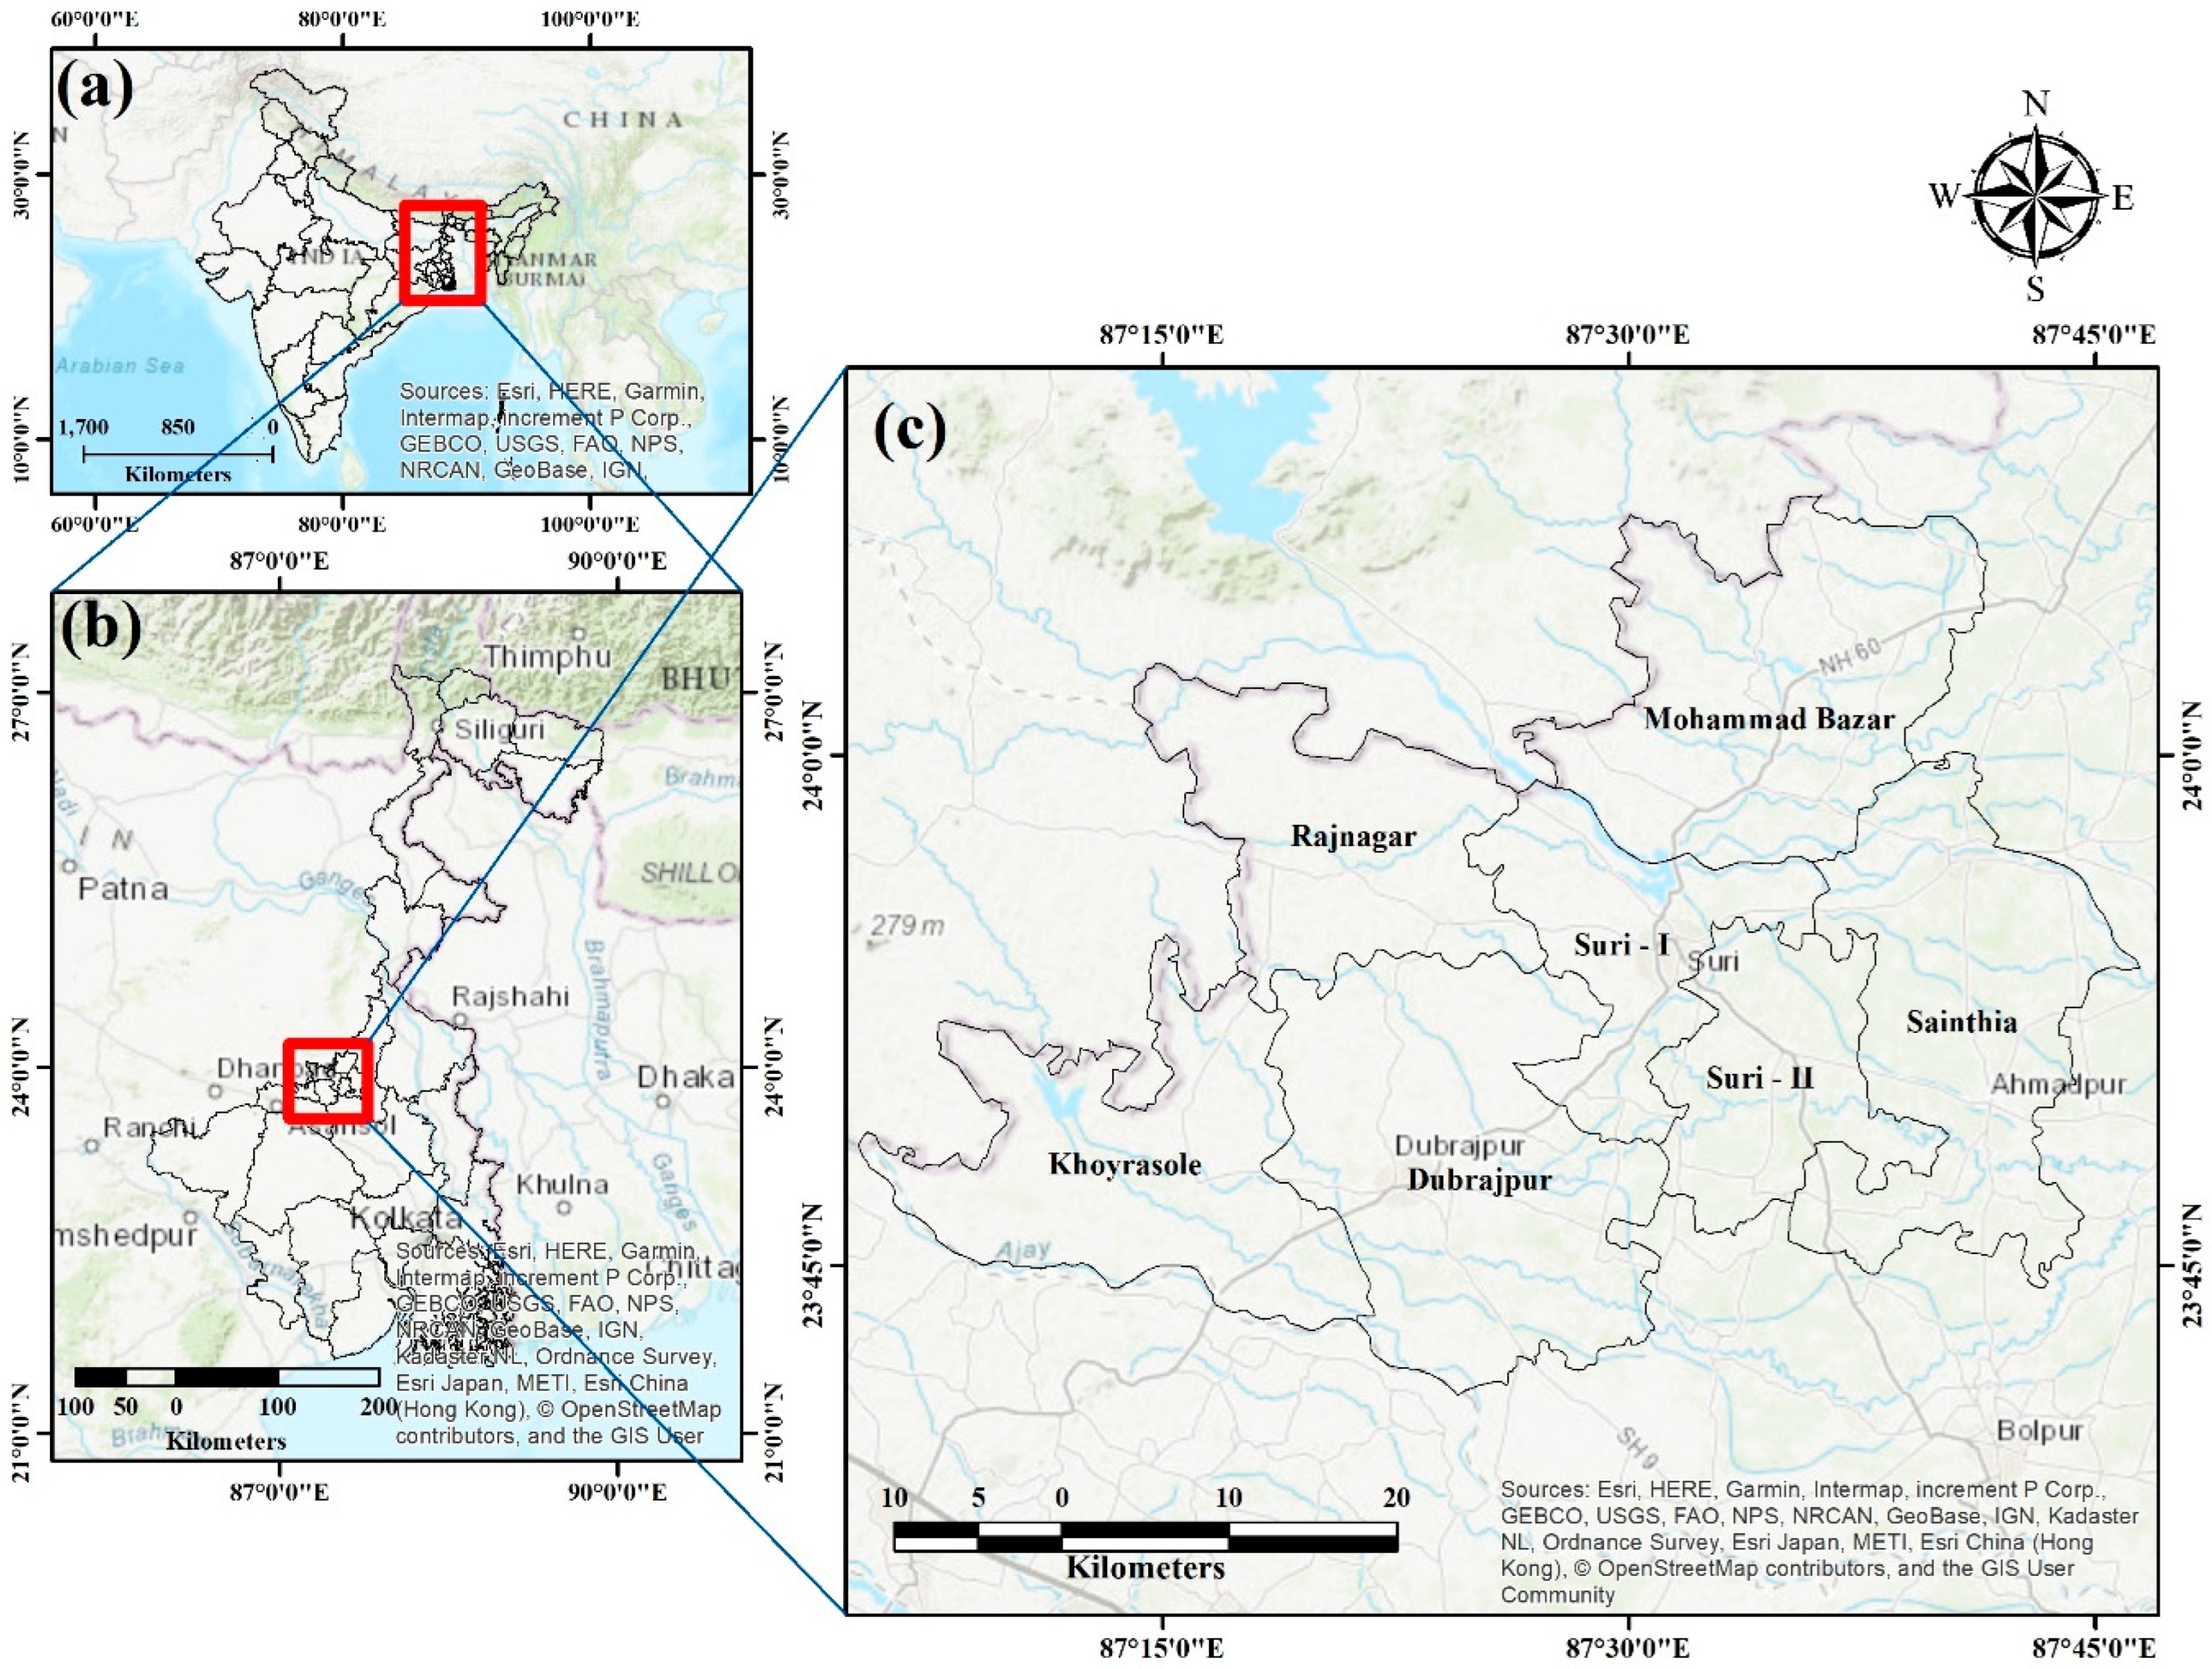
The present study has been conducted in the Suri Sadar Sub-Division, one of the three administrative sub-divisions of Birbhum District in the state of West Bengal, Eastern India. Geographically, the area lies approximately between 23°07′40″ N and 23°41′30″ N latitudes and 87°05′20″ E and 87°46′20″ E longitudes, covering the central to western parts of the district (Figure 1). The sub-division comprises seven Community Development (C.D.) Blocks, namely, Suri-I, Suri-II, Sainthia, Dubrajpur, Mohammad Bazar, Rajnagar, and Khoyrasole, and three municipalities, namely, Suri, Sainthia, and Dubrajpur [27]. The total geographical area of this administrative unit represents a significant proportion of the district’s rural population and displays a distinctive spatial diversity in terms of its physiographic and socio-economic characteristics.
According to recent Census and district statistical records, the sub-division is predominantly rural, with agriculture and allied activities forming the principal source of livelihood for a large share of the population [27]. Paddy cultivation, along with oilseeds and pulses, dominates the cropping pattern, although productivity varies considerably across the plateau and alluvial zones [42]. In addition to agriculture, segments of the population depend on small-scale industries, mining-related activities, informal trade, and service-sector employment in nearby towns such as Suri and Sainthia. However, disparities in infrastructure, educational attainment, irrigation facilities, and market accessibility contribute to uneven patterns of socio-economic development across the blocks [23]. These variations provide an important contextual background for understanding the spatial distribution of multidimensional poverty in the study region.
Physiographically, the region occupies a transitional zone between the Chhotanagpur Plateau fringe in the west and the Brahmani-Mayurakshi Plain in the east, which gives rise to noticeable contrasts in relief, soil, and land use [43]. The western C.D. Blocks, including Rajnagar, Khoyrasole, and Mohammad Bazar, are characterized by undulating lateritic terrain, coarse-textured soils, and relatively low water-retention capacity, conditions that limit agricultural productivity. In contrast, the eastern and southern blocks, such as Sainthia and Suri-II, exhibit fertile alluvial soils and a more intensive agricultural economy supported by irrigation [23]. These environmental variations substantially influence patterns of livelihood, settlement distribution, and poverty intensity across the sub-division.
The climate of Suri Sadar Sub-Division is tropical monsoonal, with hot summers, a pronounced rainy season from June to September, and a cool, dry winter. Rainfall averages around 1200–1400 mm annually, though its distribution is uneven, contributing to frequent droughts in the plateau fringe areas [44]. The economy is primarily agrarian, supplemented by small-scale industries, animal husbandry, and informal sector employment. This diverse and ecologically sensitive environment makes the sub-division an ideal case for exploring the spatial variability and determinants of multidimensional poverty, where both natural and socio-economic factors intersect to shape the well-being of rural households.
In addition to its physical and economic characteristics, the Suri Sadar Sub-Division also exhibits important demographic and socio-cultural features. The region is predominantly rural, with a significant share of the population engaged in agriculture and informal activities [27]. The presence of Scheduled Castes and Scheduled Tribes, particularly in the western plateau areas, reflects existing social disparities. Variations in literacy, gender roles, and workforce participation further indicate uneven social development across the sub-division [23]. These human dimensions provide essential context for understanding the spatial patterns of multidimensional poverty in the study area.

2.2. Database and Data Sources

The present research relies on a combination of primary and secondary data sources, integrated to construct a robust analytical framework for understanding the determinants of multidimensional poverty in this study region. The use of mixed data sources ensures both empirical depth and spatial comprehensiveness, enabling the study to address household-level deprivation within the broader environmental and infrastructural context of the region.
The primary data were obtained through an extensive household survey conducted between January 2024 and May 2025 across all seven C.D. Blocks. A multi-stage sampling technique was employed to achieve representativeness and spatial balance. In the first stage, villages were selected using the Probability Proportionate to Size (PPS) method [45], ensuring that the number of selected households in each block was proportional to its population size. In the second stage, households were chosen through simple random sampling from the village-level household list provided by the 2011 census data [46].
The sample size for the survey was determined using Cochran’s formula, which is appropriate for large and finite populations. The formula for a finite population [47] is expressed as:
n = n o 1 + n o N
n o = Z 2 p ( 1 p ) e 2
where n represents sample size, N represents population size, e represents acceptable sampling error (5% = 0.05), p represents the proportions of the population, and Z is the Z value at the reliability level or significance level.
Adjusting for the finite population of 246,863 households from the entire Sub-Division, the minimum required sample size was approximately 3763 households. However, to account for possible non-responses and to improve statistical precision, an additional 5% of the sample has been taken into consideration from each C.D. block and municipality area, and the final survey included 3952 households distributed across all seven C.D. Blocks and municipality areas. This approach ensured both representativeness and robustness of data for subsequent statistical and spatial analysis.
A structured questionnaire schedule was developed to capture multidimensional aspects of poverty following the conceptual framework of the Alkire–Foster (AF) methodology, consistent with the parameters used by NITI Aayog (2023) for India’s National Multidimensional Poverty Index. The questionnaire covered three primary dimensions, i.e., education, health, and standard of living, along with supplementary socio-economic and demographic information. It included indicators such as school attendance, years of schooling, access to drinking water, sanitation, electricity, type of housing, cooking fuel, asset ownership, employment characteristics, etc. Each question was carefully framed to quantify deprivation levels among rural households.
Before the main survey, a pilot study was conducted in two villages to test the reliability and internal consistency of the questionnaire. Necessary modifications were incorporated based on the pilot feedback. The reliability of the survey instrument was statistically verified using Cronbach’s Alpha, which produced a coefficient of 0.968, indicating excellent internal consistency among variables. Field data were collected through direct interviews conducted by trained investigators using a combination of structured and semi-structured questions.
The secondary data sources complemented the primary data by providing broader contextual and spatial information. Demographic and socio-economic indicators such as literacy rate, workforce participation, and housing conditions were obtained from the Census of India (2011) and the District Census Handbook of Birbhum. Topographical and elevation data were extracted from the Shuttle Radar Topography Mission (SRTM) 30 m Digital Elevation Model (DEM), while soil texture and land use data were collected from the National Bureau of Soil Survey and Land Use Planning (NBSS&LUP) and the National Remote Sensing Centre (NRSC). Climatic and rainfall data were obtained from the India Meteorological Department (IMD) and the District Statistical Handbook (2022). Data related to cropping intensity, irrigation coverage, and agricultural productivity were compiled from the Department of Agriculture, Government of West Bengal, and the District Agriculture Office, Suri. Road networks and market locations were mapped using open-source geospatial datasets (OpenStreetMap) and verified through ground truthing during fieldwork.
All spatial datasets were standardized into a common coordinate reference system (WGS 84, UTM Zone 45N). The integration of these secondary layers with household-level primary data was performed in ArcGIS 10.5 (evaluated copy), enabling the extraction of location-specific attributes for each surveyed household. This geospatial integration provided the analytical foundation for assessing how socio-economic and environmental factors jointly influence multidimensional poverty within the study area.
The synthesis of both primary and secondary databases thus established a comprehensive and spatially referenced dataset. This hybrid framework not only strengthens the empirical validity of the study but also facilitates the application of both Alkire–Foster (AF) multidimensional poverty measurement and binary logistic regression modeling for determinant analysis [48,49,50]. Such integration of household and spatial data enhances the capacity to identify localized patterns of deprivation, thereby contributing to a more nuanced geographical understanding of poverty in the Suri Sadar Sub-Division.

2.3. Selection and Description of Variables

The selection of explanatory variables for this study is guided by both theoretical reasoning and empirical observations linking socio-economic characteristics, environmental attributes, and infrastructural accessibility with multidimensional poverty. Poverty is not merely an outcome of income insufficiency; it arises from multiple interrelated deprivations shaped by demographic, educational, environmental, and locational factors [37]. To capture these complex interactions, the present study considers a comprehensive set of variables classified into two broad categories: household-level variables and regional or spatial variables. Each variable was selected based on its relevance to the multidimensional poverty framework and its potential explanatory influence on household deprivation patterns.
Household-Level Variables
  • Household Size (X1): Household size denotes the total number of members residing within a single family unit. Larger households generally exhibit a higher dependency ratio, lower per capita income, and greater consumption burden, thereby increasing their likelihood of falling into multidimensional poverty [51]. This variable was measured as a discrete count of individuals per household.
  • Gender of the Household Head (X2): Gender plays a crucial role in determining access to resources, decision-making, and livelihood opportunities. Female-headed households often experience limited asset ownership, lower education, and reduced access to credit and employment opportunities [52]. This variable was coded as a binary category, 1 for male-headed and 0 for female-headed households.
  • Educational Attainment of the Household Head (X3): Education serves as a fundamental determinant of human capability and economic productivity. Households where the head has higher education levels are more likely to diversify income sources and access formal employment [53]. This variable was measured categorically based on the highest completed level of formal education: illiterate, primary, secondary, and higher.
  • Marital Status of the Household Head (X4): Marital stability influences economic security and social support systems. Widowed or separated household heads often face economic marginalization and limited access to social safety nets [54,55]. This variable was coded dichotomously: married (1) and unmarried/widowed/separated (0).
  • Living Area (Rural or Urban) (X5): The type of residential location, rural or urban, affects livelihood opportunities, access to infrastructure, and service availability. Urban households usually enjoy better access to education, healthcare, and employment markets, whereas rural households often face limited access to such facilities, making them more susceptible to multidimensional deprivation [56,57]. This variable was classified as a binary category: rural (0) and urban (1).
Regional or Spatial Variables
6.
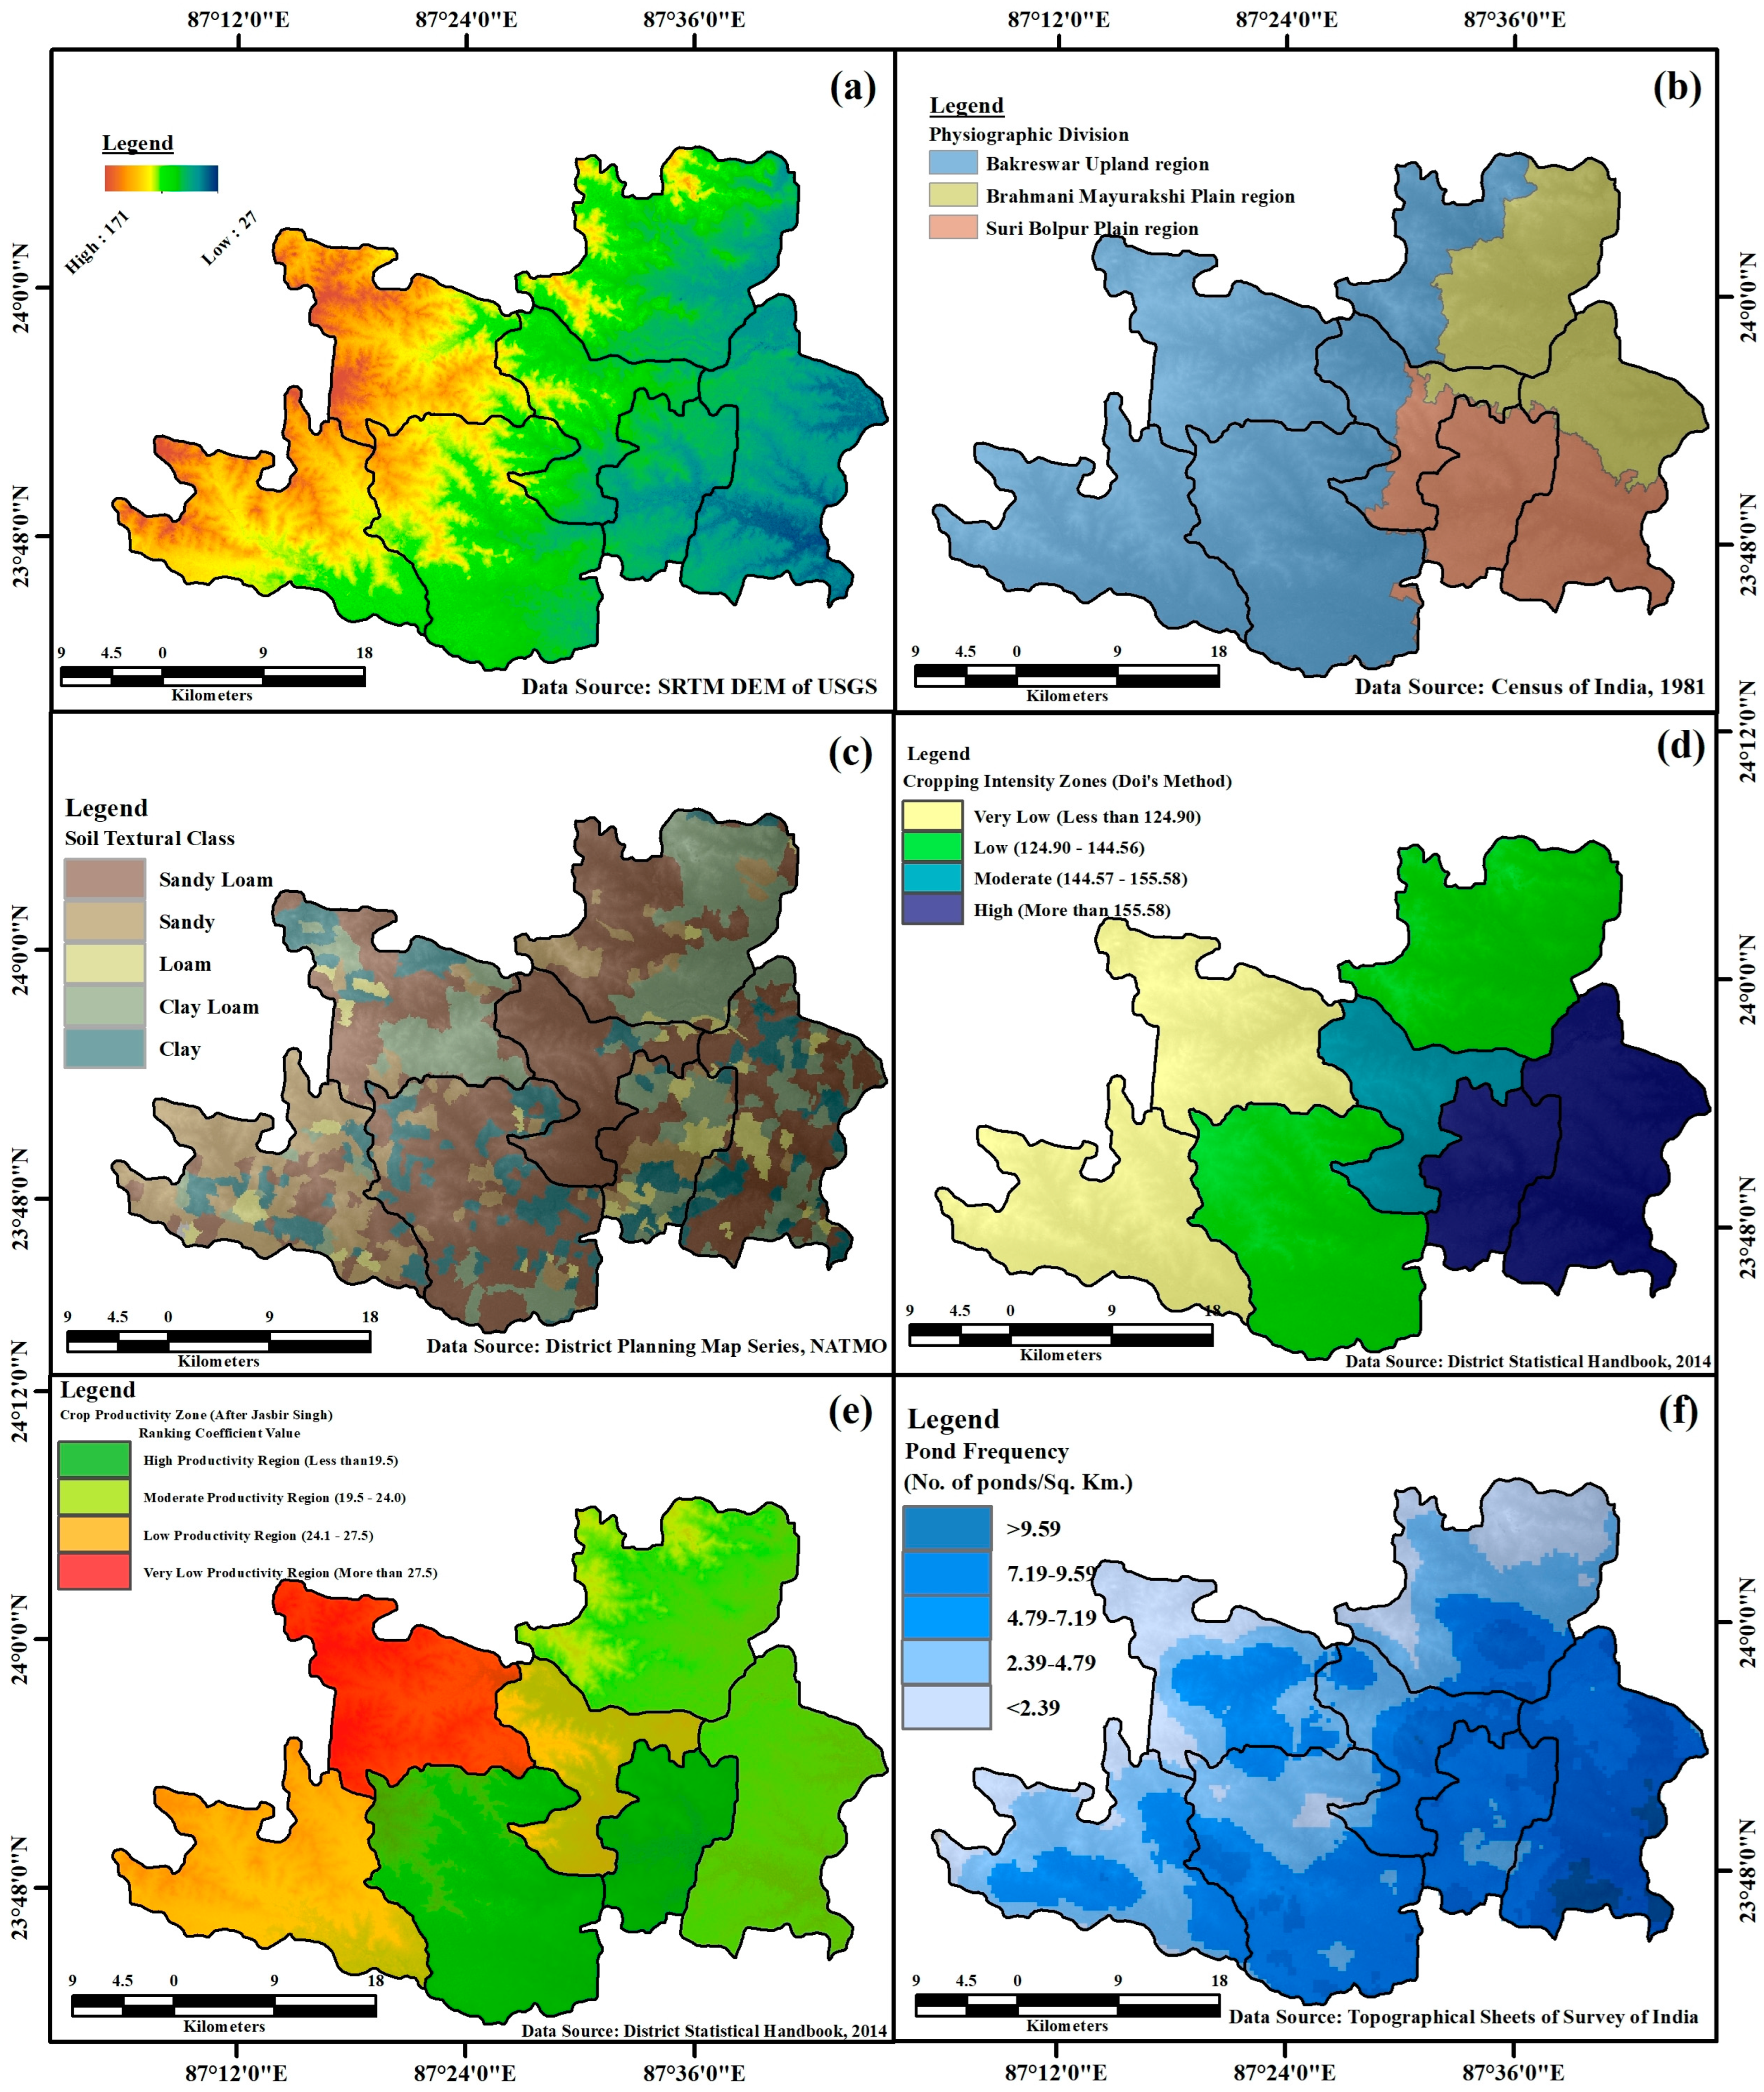
Elevation (X6): Elevation, derived from Shuttle Radar Topography Mission (SRTM) 30 m DEM data, serves as an indicator of terrain and agro-ecological potential [58,59]. Higher elevation areas in the western plateau fringe correspond to poor soils and water scarcity, contributing to livelihood insecurity. Figure 2a illustrates the spatial distribution of elevation, revealing a distinct west–east gradient that influences agricultural potential and settlement density.
7.
Physiographic Division (X7): Physiographic division determines land usability and irrigation feasibility. Upland and dissected terrains restrict cultivation, accelerate soil erosion, and limit mechanization, while plain regions support agriculture; together, these contrasts shape livelihoods and influence the intensity of rural poverty [60,61]. The study area comprises three physiographic units, i.e., the Bakreswar Upland, the Brahmani-Mayurakshi Plain, and the Suri-Bolpur Plain (Figure 2b).
8.
Soil Texture (X8): Soil texture is a major determinant of agricultural productivity. Coarse-textured lateritic soils dominate the western uplands, while fine-textured alluvial soils occur in the eastern plains [62]. The variable was categorized into sandy, loamy, and clayey classes based on NBSS&LUP data. Areas with lateritic soil correspond with low fertility and high poverty incidence. Figure 2c presents the spatial pattern of soil texture across the Suri Sadar Sub-Division.
9.
Cropping Intensity (X9): Cropping intensity, expressed as the ratio of gross cropped area to net sown area, reflects the level of agricultural utilization and livelihood engagement. Higher intensity indicates better land use efficiency and income stability [63]. Data were derived from block-level agricultural records. Figure 2d depicts the spatial variation in cropping intensity, showing higher values in the alluvial plains of Sainthia and Suri-II blocks.
Cropping   Intensity = ( G r o s s   C r o p p e d   A r e a   ( T o t a l   p h y s i c a l   a r e a   c u l t i v a t e d ) N e t   S o w n   A r e a   ( T o t a l   s e a s o n a l   a r e a   s o w n ) ) × 100
10.
Crop Productivity (X10): Crop productivity measures the average yield per hectare for major crops and reflects the efficiency of agricultural production systems. Lower productivity, common in the plateau areas, correlates with higher vulnerability to poverty [64]. Data were obtained from district agricultural statistics. Figure 2e illustrates the spatial pattern of agricultural productivity within the study region.
11.
Pond Frequency (X11): Ponds serve as critical local water resources for irrigation, aquaculture, and domestic use, particularly in rural areas. A higher pond frequency enhances livelihood security and reduces vulnerability during dry seasons [65]. The variable was calculated as the number of ponds per square kilometre using remote sensing and field verification data. Figure 2f illustrates the spatial distribution of pond frequency across the study area, with higher concentrations in the eastern and southern blocks.
12.
Distance from Nearest Market Centre (X12): Proximity to market centres determines access to goods, services, and non-farm employment. Greater distances increase transaction costs and limit livelihood diversification [66]. This variable was measured in kilometres using the nearest road distance.
13.
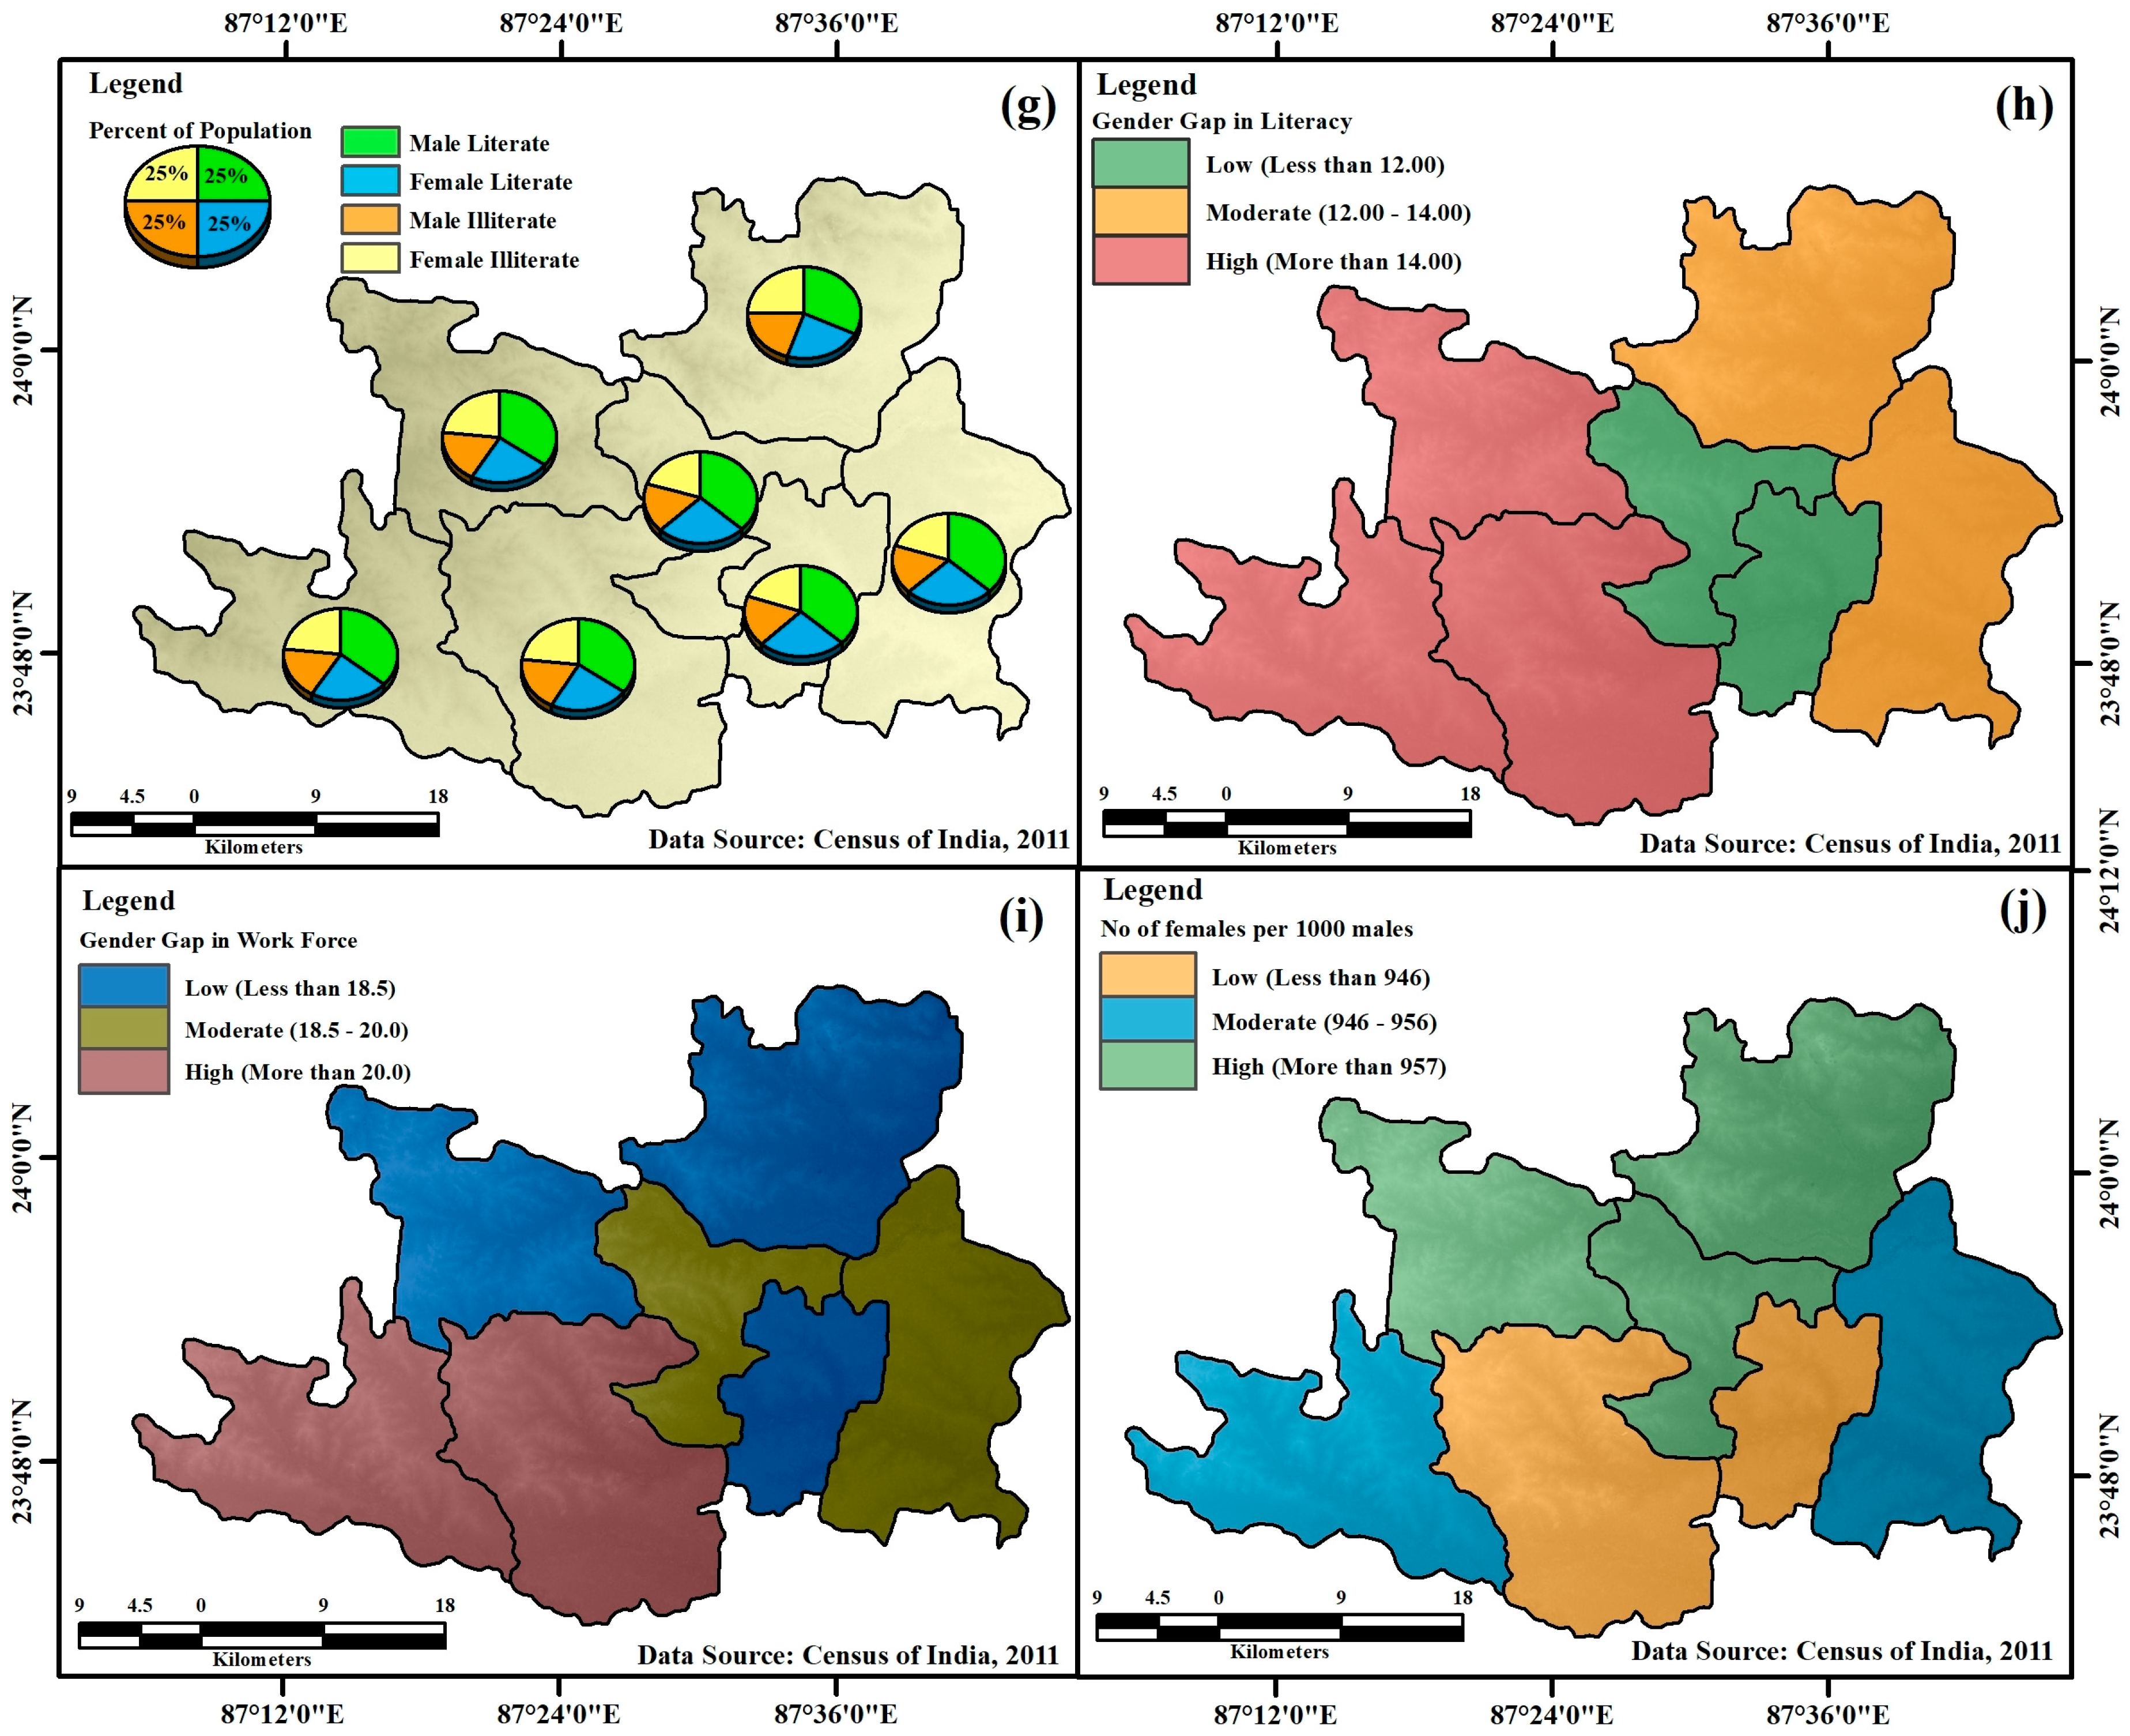
Literacy Rate (X13): Literacy promotes human development and enhances economic participation [67]. Block-level literacy data were sourced from the Census of India (2011). Areas with higher literacy levels tend to exhibit lower multidimensional poverty. Figure 2g shows the spatial distribution of literacy across the study region.
14.
Gender Gap in Literacy (X14): Gender disparities in education reflect broader social inequality, constraining women’s economic participation [68]. This variable was calculated as the difference between male and female literacy rates at the block level. Figure 2h demonstrates the spatial distribution of gender literacy gaps within the subdivision.
15.
Gender Gap in Workforce Participation (X15): Gender disparity in work participation reduces household income and economic security [69]. The variable was computed as the difference between male and female workforce participation rates using Census data. Figure 2i depicts the spatial distribution of this variable, with wider gaps in western plateau areas.
16.
Sex Ratio (X16): Sex ratio, defined as the number of females per 1000 males, which represents the demographic balance between males and females within the population. While variations in the sex ratio may reflect demographic and social processes such as migration, mortality patterns, or cultural preferences, they do not necessarily imply gender inequity. Regions with lower sex ratios often exhibit socio-cultural discrimination and gender-based disparities in access to health and education [70]. In this study, the sex ratio was considered as a contextual demographic variable that may influence household socio-economic conditions. Data were derived from the Census of India (2011). Figure 2j presents the spatial distribution of sex ratio across the Suri Sadar Sub-Division, highlighting gender imbalances in certain rural areas.

2.4. Analytical Methods

The analytical framework adopted in this study integrates both descriptive and inferential approaches to capture the extent, intensity, and determinants of multidimensional poverty at the micro-regional scale. The analysis is based on two principal methods: (i) the Alkire–Foster (AF) method, which measures the incidence and intensity of multidimensional poverty [71,72], and (ii) the Binary Logistic Regression model, which identifies the significant socio-economic and spatial determinants influencing household poverty status [73,74]. The combined use of these methods allows a comprehensive understanding of how individual and locational characteristics interact to shape the pattern of deprivation across the Suri Sadar Sub-Division.

2.4.1. Measurement of Multidimensional Poverty: The Alkire–Foster (AF) Approach

The framework of Alkire & Foster [75] provides a robust and widely accepted methodology for quantifying multidimensional poverty through the identification and aggregation of multiple deprivations experienced by households. The approach is founded on Amartya Sen’s capability theory, which views poverty as a deprivation of basic capabilities rather than solely a lack of income. This method enables the estimation of both the incidence (H) and the intensity (A) of poverty, combining them into a single composite measure known as the Multidimensional Poverty Index (MPI) [2,14,33,75].
In this study, three key dimensions, i.e., Education, Health, and Standard of Living, were considered following the structure adopted by India’s National Multidimensional Poverty Index (NITI Aayog, 2023). The selection of indicators was guided by the National Multidimensional Poverty Index framework, which is based on the Alkire–Foster methodology for measuring multidimensional deprivation. These indicators capture critical aspects of human well-being such as educational attainment, health status, and access to basic living standards. The final set of indicators used in this study was also determined by the availability and reliability of household-level data collected during the field survey. Each dimension comprises specific indicators reflecting the quality of human life. The Education dimension includes two indicators: years of schooling and school attendance. The Health dimension includes indicators of nutrition, antenatal care, and child mortality. The Standard of Living dimension encompasses indicators such as housing condition, access to drinking water, sanitation, electricity, cooking fuel, and asset ownership.
Each dimension was equally weighted at one-third, and indicators within each dimension were assigned equal weights as per the NITI Aayog framework. A household is considered deprived in an indicator if it falls below the predefined cut-off threshold (for instance, no household member has completed six years of schooling, or the household lacks improved sanitation). The nutrition indicator was assessed using anthropometric information collected during the household survey. A household was considered deprived in nutrition if at least one adult member had a Body Mass Index (BMI) below the standard threshold (below 18.5 kg/m2) for undernutrition, or if any child in the household exhibited signs of undernutrition according to age-specific anthropometric standards. If any households, that do not have children or adolescents are treated as not deprived for this indicator. In a few instances when nutritional information was unavailable for some households, these data were regarded as missing values and removed from the calculation of the nutrition deprivation index. However, such households were retained in the overall MPI computation, and their deprivation scores were calculated based on the remaining available indicators in accordance with the Alkire–Foster methodology.
A household is identified as multidimensionally poor if its weighted deprivation score exceeds or equals k = 0.33, meaning that it is deprived in at least one-third of the weighted indicators. Mathematically, the AF method can be represented as [2,33,75]:
M 0 = H × A
where M0 represents the Multidimensional Poverty Index (MPI), H represents Headcount Ratio (proportion of multidimensionally poor households), and A represents the Average Intensity of Poverty (average proportion of deprivations among the poor).
The Headcount Ratio (H) is calculated as [2,33,75]:
H = q n
where q is the number of multidimensionally poor households and n is the total number of households surveyed.
The Average Intensity (A) is expressed as [2,33,75]:
A = 1 q i = 1 q c i d
where ci is the number of weighted deprivations experienced by household i, and d represents the total number of considered indicators.
Thus, the MPI (M0) captures both the breadth (H) and depth (A) of poverty simultaneously, providing a multidimensional perspective that complements traditional income-based measures. The decomposition of MPI at the block level further reveals spatial variations in deprivation, highlighting the contrasting patterns between the western plateau and the eastern alluvial regions of Suri Sadar Sub-Division.

2.4.2. Determination of Poverty Drivers: Binary Logistic Regression Model

To identify the key determinants influencing household poverty status, a Binary Logistic Regression Model was employed [74]. This model is appropriate when the dependent variable is dichotomous here, whether a household is multidimensionally poor (coded as 1) or non-poor (coded as 0). Logistic regression estimates the probability that a household belongs to the poor category based on a set of explanatory variables representing demographic, socio-economic, and spatial factors.
The general form of the logistic regression model is expressed as [73,74,76]:
l o g i t P i = l n P i 1 P i = β 0 + β 1 X 1 i + β 2 X 2 i + + β k X k i + ϵ i
where Pi is the probability that the ith household is multidimensionally poor, β0 is the constant term, β1, β2…, βk are the coefficients of explanatory variables, X1i, X2i…, Xki are the independent variables (household-level and regional-level factors), and ϵi is the error term.
The dependent variable was derived from the AF computation, coded as 1 for multidimensionally poor households and 0 for non-poor. A total of sixteen independent variables were included in the model, five representing household-level characteristics and eleven representing regional or spatial factors. These variables were standardized before regression analysis to minimize scale differences.
The logistic function transforms the linear combination of predictors into probabilities ranging between 0 and 1 [73,74,76]:
P i = 1 1 + e ( β 0 + β 1 X 1 i + β 2 X 2 i + + β k X k i )
The sign of each coefficient (βi) indicates the direction of the relationship between the variable and the probability of being poor. A positive coefficient implies that the variable increases the likelihood of poverty, while a negative coefficient reduces it. The statistical significance of each variable was evaluated using the Wald test and p-values, with a 5% level of significance considered as the acceptance threshold.
The odds ratio (Exp(β)), computed for each variable, was used to interpret the magnitude of influence [74,76]. An odds ratio greater than one implies a higher probability of poverty with an increase in that variable, whereas a value less than one indicates a mitigating effect [73,74,76].
Model performance and goodness-of-fit were assessed through multiple diagnostic statistics, including −2 Log Likelihood to evaluate model fit, Cox & Snell R2 and Nagelkerke R2 to measure explained variance, and Hosmer–Lemeshow Test to assess predictive accuracy.
All computations were carried out using SPSS 25 (evaluated copy), while spatial correlation of residuals and mapping of predicted probabilities were performed in ArcGIS 10.5 (evaluated copy) to visualize spatial clustering of predicted poverty likelihoods across the Suri Sadar Sub-Division.
The integration of the Alkire–Foster method and logistic regression thus provides a two-step analytical design: first, identifying multidimensionally poor households, and second, determining the socio-economic and spatial factors responsible for this condition. This dual framework allows for both quantitative precision and geographical interpretation, making it particularly suitable for regional-level poverty assessment. The results derived from this approach form the empirical foundation for subsequent spatial analysis and policy recommendations aimed at reducing multidimensional deprivation within the study region.

3. Result

3.1. Extent and Intensity of Multidimensional Poverty

The assessment of multidimensional poverty in the Suri Sadar Sub-Division reveals distinct spatial and socio-economic contrasts that mirror the diversity of its physical environment and development pattern. The estimation was conducted using the Alkire–Foster (AF) method, integrating three dimensions, Education, Health, and Standard of Living, through ten indicators, following the structure of the National Multidimensional Poverty Index (NITI Aayog, 2023). The resulting indices, i.e., Headcount Ratio (H), Intensity (A), and the composite Multidimensional Poverty Index (MPI = H × A), provide a nuanced understanding of both the prevalence and the depth of deprivation across the seven Community Development (C.D.) Blocks and three municipalities of the subdivision. This approach enables the simultaneous consideration of the breadth and intensity of deprivation, reflecting the overlapping disadvantages experienced by households across different aspects of well-being.
The percentage distribution of the selected indicators of multidimensional poverty (Table 1) highlights the nature and extent of deprivation across the surveyed 3952 households. Within the Health dimension, the most critical deprivation is found in nutrition, affecting 21.71 per cent of households. This reflects widespread undernourishment among children and adults, particularly in rural western blocks where dietary diversity and access to protein-rich food remain limited. Malnutrition here stems from both economic and environmental constraints, i.e., poor soil fertility, irregular rainfall, and limited irrigation, which collectively undermine food security. Child and adolescent mortality (1.85 per cent) and inadequate antenatal care (6.15 per cent) represent relatively lower deprivations but are important indicators of health system reach. The lower percentages, while numerically modest, indicate persistent pockets of maternal and child health neglect in rural and peri-urban fringes, suggesting that the benefits of government health programs such as Janani Suraksha Yojana or ICDS have not yet fully penetrated remote areas.
Within the Education dimension, deprivation remains substantial, emphasizing the role of human capital in poverty dynamics. Nearly 18.92 per cent of households are deprived in terms of years of schooling, where no household member aged ten years or above has completed six years of education. This is a major impediment to capability development and reflects intergenerational poverty. School attendance deprivation, affecting 3.64 per cent of households, though relatively low, points to educational discontinuity, often due to economic compulsion or gender bias in rural households. Together, these indicators underscore that inadequate education remains a foundational driver of multidimensional poverty in the sub-division, restricting employment diversification and awareness of welfare opportunities.
The Standard of Living dimension shows the highest concentration of deprivation, revealing the infrastructural and environmental deficits of the region. The most widespread deprivation is associated with cooking fuel, where 37.11 per cent of households rely on biomass fuels such as wood, dung, or crop residues. This pattern not only reflects energy poverty but also has direct health implications, particularly for women exposed to indoor air pollution. Sanitation deprivation affects 34.56 per cent of households, indicating inadequate sanitation infrastructure and low access to improved or private toilets. Despite progress under the Swachh Bharat Mission, shared or unimproved facilities remain common in rural blocks. Housing deprivation affects 26.34 per cent of households, primarily those residing in mud or thatched houses with rudimentary flooring and roofing materials, again concentrated in the western plateau zone.
Access to safe drinking water is another significant concern, with 10.73 per cent of households lacking improved water sources within a reasonable distance. This problem intensifies in areas dependent on seasonal ponds and open wells. Electricity deprivation (4.93 per cent) is relatively low, indicating that electrification programs have achieved broad coverage, though service reliability remains uneven. Asset deprivation affects 14.14 per cent of households, implying limited access to essential durable goods, while financial exclusion remains noteworthy; 9.92 per cent of households have no bank or post office account, underscoring gaps in financial inclusion. Collectively, these findings confirm that deficiencies in living standards, rather than in health or education, contribute most significantly to multidimensional poverty in the Suri Sadar Sub-Division. The dominance of living condition deprivations points to the structural nature of infrastructural poverty, linked to settlement type, income level, and locational disadvantage.
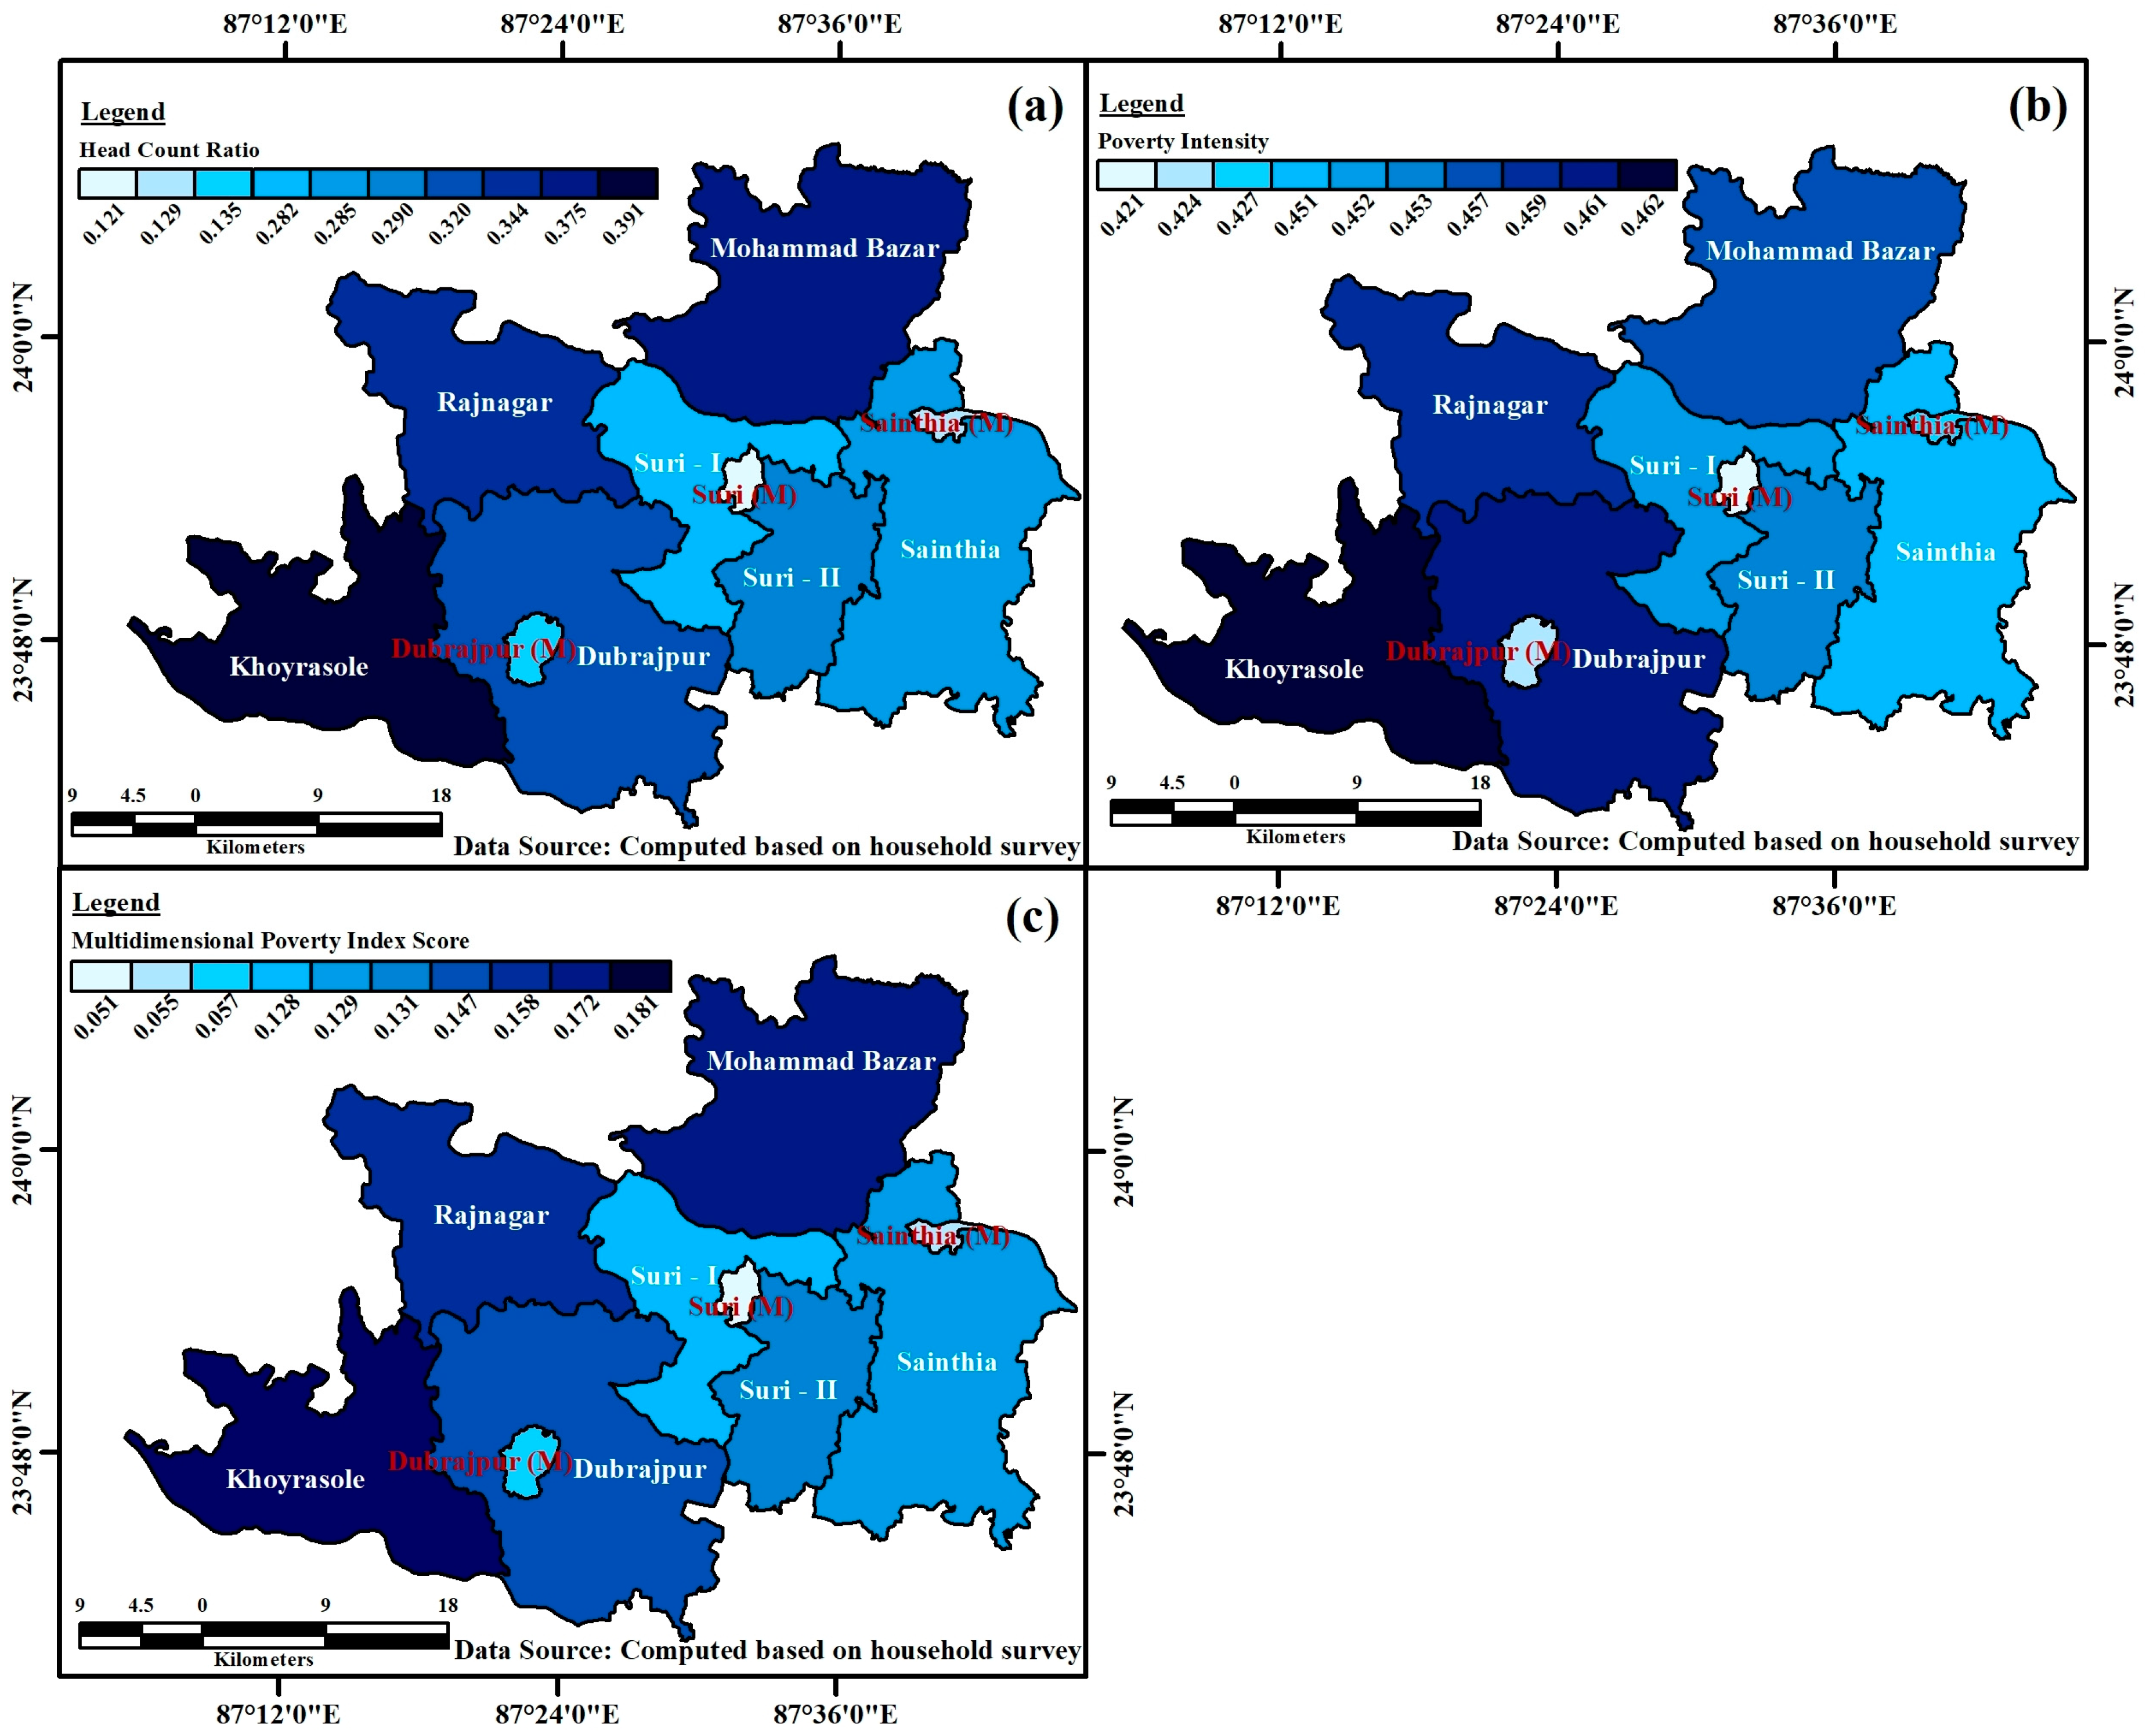
The block- and municipality-wise estimation of multidimensional poverty indices (Table 2 and Figure 3) further highlights the spatial heterogeneity of deprivation across the Suri Sadar Sub-Division. The average headcount ratio (H) for the sub-division stands at 0.268, meaning that about 26.8 per cent of surveyed households are multidimensionally poor. The corresponding intensity of poverty (A) is 0.452, signifying that poor households are, on average, deprived in 45.2 per cent of the weighted indicators. Consequently, the composite MPI for the sub-division is 0.121, which, although lower than the state average for several backward districts of West Bengal, indicates a substantial degree of multidimensional deprivation at the intra-district scale.
At the disaggregated level, clear spatial contrasts emerge. The western plateau blocks, i.e., Rajnagar (MPI = 0.158), Khoyrasole (0.181), and Md. Bazar (0.172) records the highest levels of multidimensional poverty, reflecting the combined effects of low agricultural productivity, poor soil quality, and limited access to social infrastructure. These blocks also exhibit the highest incidence of poverty (H values between 0.34 and 0.39), suggesting both widespread and overlapping deprivations. The elevated intensity of deprivation (A ≈ 0.46) in these blocks points to the chronic and structural nature of poverty, where multiple disadvantages of educational, infrastructural, and environmental nature reinforce one another.
By contrast, the eastern and central blocks, notably Sainthia (MPI = 0.129), Suri-I (0.128), and Suri-II (0.131), exhibit moderate poverty levels, reflecting their more diversified economic base and proximity to major transport and service networks. The availability of better schools, higher literacy, and improved connectivity has contributed to reduced deprivation intensity in these regions. The relatively low MPI scores in municipal areas, i.e., Suri Municipality (0.051), Sainthia Municipality (0.055), and Dubrajpur Municipality (0.057), demonstrate the mitigating effect of urbanization, where access to infrastructure, education, and financial services substantially reduces multidimensional deprivation. However, these municipalities also display internal inequality, as peri-urban households often remain excluded from formal housing and sanitation facilities.
The spatial distribution of MPI values (as shown in Figure 3) reveals a distinct west-to-east declining gradient of multidimensional poverty, shaped by the region’s topographic and agro-ecological divide. The plateau and lateritic zones of the west suffer from environmental fragility and limited agricultural prospects, while the alluvial plains in the east benefit from fertile soils, better irrigation, and denser road networks. Such spatial asymmetry underscores the geographically embedded nature of poverty in the subdivision, where physical constraints amplify socio-economic vulnerabilities.

3.2. Determinants of Multidimensional Poverty

The identification of determinants of multidimensional poverty provides critical insights into the socio-economic and spatial processes that shape deprivation at the micro-regional level. To empirically examine these relationships, a Binary Logistic Regression Model was employed, using the multidimensional poverty status (poor = 1, non-poor = 0) as the dependent variable. Sixteen explanatory variables, comprising both household-level and regional/spatial factors, were incorporated into the model. The analysis aimed to isolate the relative influence of demographic characteristics, educational and economic conditions, and locational attributes on the probability of a household being multidimensionally poor.
Model Performance and Overall Fit
The model performed satisfactorily in explaining the observed pattern of multidimensional poverty across the study area (Table 3, Table 4, Table 5 and Table 6). The −2 Log Likelihood value declined significantly from the null model, indicating an improved model fit after the inclusion of explanatory variables. The Nagelkerke R2 value of 0.838 suggests that approximately 83 per cent of the variation in household poverty status can be explained by the chosen predictors, which is substantial for socio-economic data of this type. The Hosmer–Lemeshow goodness-of-fit test produced a p-value greater than 0.05, confirming that predicted and observed classifications are statistically consistent. Moreover, the classification accuracy of approximately 81 per cent further validates the reliability of the model for identifying significant determinants of poverty.
Conformity of Data Fitness with Model Assumptions
The assumption of multicollinearity holds great significance due to its potential for producing biased or misleading results in regression estimation. To ensure data robustness, a multicollinearity test was performed using the Variance Inflation Factor (VIF) and tolerance values, the latter representing the inverse of VIF (Table 7). As indicated by standard methodological literature (Chan et al., 2025;) [50] multicollinearity is typically considered problematic when the VIF exceeds 5 or the tolerance value falls below 0.2. The computed results, presented in Table 7, show that the VIF values for all explanatory variables range between 1.001 and 2.304, and none of the variables exhibit a tolerance value below 0.2. These results indicate that multicollinearity is not a serious concern in the regression model. However, the possibility of endogeneity cannot be entirely ruled out, as some explanatory variables may be correlated with unobserved socio-economic or institutional factors affecting multidimensional poverty. Due to data limitations, it was not possible to implement instrumental variable techniques to address this issue. Therefore, the estimated coefficients should be interpreted as statistical associations rather than strict causal relationships.
Out of the sixteen variables included in the model, ten were statistically significant at the 5 percent level (p < 0.05). Among these, three were household-level determinants, i.e., household size, educational attainment of the household head, and living area, while seven were regional or spatial factors, namely elevation, physiographic division, crop productivity, cropping intensity, distance from the nearest market, gender gap in literacy, gender gap in workforce participation, and sex ratio. The signs and magnitudes of the regression coefficients (B) and odds ratios (Exp(B)) together illustrate the direction and strength of each variable’s influence on multidimensional poverty in the Suri Sadar Sub-Division (Table 8).
Household-Level Determinants
The household size (B = 1.310, Exp(B) = 1.270, p < 0.001) variable is positively and highly significant, indicating that larger households face a higher probability of multidimensional poverty. The odds ratio of 1.270 implies that, holding all other variables constant, each additional household member increases the odds of being multidimensionally poor by approximately 27 per cent. This result reflects the classic resource dilution effect, where a greater number of dependents reduces the per capita availability of food, education, and income resources, intensifying deprivation. In the rural context of Suri Sadar, where household income is often dependent on agriculture and informal work, a larger family size imposes a greater economic burden and limits investment in human development.
The educational attainment of the household head (B = −2.487, Exp(B) = 0.083, p < 0.001) emerges as the most influential negative determinant of poverty. The odds ratio of 0.083 indicates that households led by more educated heads are nearly 92 per cent less likely to be multidimensionally poor than those with illiterate or less-educated heads. Education enhances employability, improves awareness of health and sanitation practices, and facilitates access to institutional support systems. The significance of this variable underscores the pivotal role of education in breaking the intergenerational transmission of poverty, particularly in the context of rural Eastern India.
The living area variable (B = −1.675, Exp(B) = 0.187, p < 0.001) is also negatively and significantly associated with multidimensional poverty. The odds ratio suggests that urban households are about 81 per cent less likely to be poor compared to rural households. Urban areas within the Suri Sadar Sub-Division, especially Suri and Sainthia municipalities, offer greater access to diversified employment, education, healthcare, and social amenities. In contrast, the peripheral rural blocks face infrastructural deficits, weaker institutional reach, and limited livelihood diversification, which together amplify multidimensional deprivation. Collectively, these household-level determinants show that education, family structure, and settlement type are the most critical demographic drivers influencing multidimensional poverty outcomes.
Regional and Spatial Determinants
Environmental and spatial characteristics exert a strong influence on the spatial distribution of poverty. Elevation (B = 0.029, Exp(B) = 1.172, p < 0.001) shows a positive and highly significant relationship, meaning that the likelihood of poverty increases by about 17 per cent with every unit increase in elevation. Households in higher-altitude areas, particularly in the western plateau blocks like Rajnagar, Khoyrasole, and Md. Bazar, face adverse ecological conditions such as poor soils, low groundwater availability, and erratic rainfall, which reduce agricultural productivity and heighten poverty risks.
The physiographic division (B = −0.756, Exp(B) = 0.469, p < 0.01) further supports this finding. Households in the alluvial plain areas are less than half as likely to be poor as those in the plateau region, illustrating the significant advantage conferred by fertile soils and access to irrigation. These results collectively indicate that natural terrain and agro-ecological settings are structural determinants of spatially entrenched poverty within the subdivision.
Agricultural performance also emerges as a vital determinant. Crop productivity (B = −0.578, Exp(B) = 0.783, p < 0.001) and cropping intensity (B = −0.431, Exp(B) = 0.539, p < 0.01) both exhibit strong and statistically significant negative associations with multidimensional poverty. A one-unit increase in crop productivity reduces the odds of poverty by approximately 22 per cent, while greater cropping intensity lowers it by about 46 per cent. This demonstrates that agricultural dynamism, through improved irrigation, soil management, and multiple cropping practices, directly contributes to poverty reduction. The contrast between the highly productive eastern blocks (Sainthia and Suri-II) and the subsistence-oriented western uplands exemplifies this relationship.
Spatial accessibility also plays a significant role. Distance from the nearest market (B = 0.051, Exp(B) = 1.053, p = 0.012) has a positive and statistically significant relationship with poverty, indicating that for every kilometre increase in distance from a market centre, the odds of being poor rise by about 5 per cent. This highlights the importance of market proximity in facilitating income diversification, access to services, and integration into local and regional economies. Peripheral rural households, particularly in the western and northern margins, remain disadvantaged due to isolation from commercial hubs.
Gender-related variables emerge as critical spatial and social dimensions of poverty. The gender gap in literacy (B = 0.916, Exp(B) = 2.500, p < 0.001) shows that areas with wider educational disparities between men and women are 2.5 times more likely to experience multidimensional poverty. Similarly, the gender gap in workforce participation (B = 0.251, Exp(B) = 1.778, p < 0.001) reveals that where women’s participation in the labour force is limited, the probability of household poverty increases by nearly 78 per cent. These findings highlight the gendered character of deprivation in rural Eastern India, where educational and occupational inequalities reinforce one another, restricting household resilience and economic mobility.
Finally, the sex ratio (B = −0.101, Exp(B) = 0.706, p < 0.001) demonstrates a statistically significant negative relationship with multidimensional poverty. A more balanced or female-favouring sex ratio reduces the odds of multidimensional poverty by nearly 30 per cent, indicating that gender equity, as manifested in demographic balance and women’s social participation, contributes to improved living standards and greater social stability.

4. Discussion

The findings of the present study demonstrate that multidimensional poverty in the Suri Sadar Sub-Division is highly uneven and spatially structured, reflecting the combined influence of socio-economic and environmental factors. The concentration of poverty in the western plateau blocks, namely, Rajnagar, Khoyrasole, and Mohammad Bazar, contrasts sharply with the relatively lower deprivation observed in the eastern alluvial plains and municipal areas. This spatial pattern reinforces the argument advanced in the introduction that poverty is fundamentally a geographically embedded phenomenon shaped by regional inequalities in resource distribution, infrastructure, and ecological conditions [28,29,30].
The observed spatial disparities are consistent with earlier studies that highlight the persistence of multidimensional poverty in rural and ecologically constrained regions [77,78]. Similar findings have been reported in the Indian context, where plateau and upland areas experience higher deprivation due to poor soil quality, limited irrigation, and weak connectivity [1,79]. The results of this study therefore align with national-level assessments [17,18,19,80], which emphasize that despite overall reductions in poverty, significant regional inequalities continue to persist. However, the present study extends these findings by providing micro-level evidence from a geographically heterogeneous region, thereby demonstrating how localized environmental conditions intensify deprivation within a single district.
At the household level, the results confirm the critical role of demographic and educational factors in shaping poverty outcomes, as discussed in earlier literature [26,27]. The positive association between household size and poverty supports the resource dilution hypothesis, which suggests that larger households face greater pressure on limited resources. Similarly, the strong negative relationship between educational attainment and poverty is consistent with the capability approach proposed by Amartya Sen [9,10], which emphasizes education as a key determinant of human well-being. This finding also corroborates previous empirical studies that identify education as a crucial pathway for enhancing livelihood opportunities and reducing vulnerability [51,52,53].
The lower levels of poverty observed in urban areas further validate the argument that access to infrastructure, services, and diversified employment opportunities plays a significant role in reducing multidimensional deprivation [56,57]. This supports the broader theoretical perspective that spatial accessibility and institutional reach are central to regional development processes [28,29]. However, the persistence of rural poverty in the study area suggests that economic growth alone is insufficient without addressing underlying structural and spatial constraints.
Environmental and spatial determinants emerge as equally important in explaining poverty patterns. The positive relationship between elevation and poverty, along with the higher deprivation observed in lateritic plateau regions, confirms the role of ecological constraints highlighted in regional development theory [30]. These findings are in agreement with studies that link adverse environmental conditions, such as poor soil fertility and water scarcity- to limited livelihood opportunities and higher poverty levels [58,59,60,61,62]. In contrast, the relatively lower poverty in alluvial plains underscores the importance of natural resource endowments in shaping economic outcomes.
Agricultural variables such as cropping intensity and productivity show a strong inverse relationship with poverty, reinforcing the argument that agricultural development remains a key driver of rural well-being. This finding aligns with earlier research emphasizing the role of agricultural intensification and irrigation in reducing poverty in rural India [63,64]. However, the results also suggest that improvements in agriculture alone may not be sufficient unless complemented by better market access and infrastructure.
The significance of market accessibility in this study highlights the role of spatial connectivity in shaping livelihood opportunities, consistent with findings in economic geography literature [66]. Households located farther from market centres face higher transaction costs and limited access to services, thereby increasing their vulnerability. This reinforces the need to view poverty not only as a socio-economic condition but also as a function of spatial isolation.
Gender-related variables further reveal the structural dimensions of poverty. The positive association between gender gaps in literacy and workforce participation with poverty supports earlier arguments that gender inequality acts as a critical barrier to development [68,69]. This finding is consistent with the broader literature linking gender disparities to reduced household welfare and limited economic participation. The relatively lower poverty in areas with more balanced sex ratios also suggests that gender equity contributes positively to overall well-being, although this relationship may vary across socio-cultural contexts.
Overall, the findings confirm that multidimensional poverty in the Suri Sadar Sub-Division is not the result of a single factor but arises from the interaction of demographic, socio-economic, environmental, and spatial processes. While the results are broadly consistent with existing literature, the study contributes by demonstrating how these factors operate simultaneously at the micro-regional level. This integrated perspective highlights the importance of place-specific interventions that address both structural and spatial determinants of poverty.
From a policy perspective, the results suggest that reducing multidimensional poverty requires a multi-pronged approach, including improvements in education, promotion of gender equality, enhancement of agricultural productivity, and expansion of infrastructure in ecologically disadvantaged areas. Such interventions must be tailored to local conditions, particularly in plateau regions where environmental constraints and socio-economic disadvantages intersect. Therefore, the study underscores the need for geographically targeted policies that move beyond uniform approaches to poverty reduction.

5. Conclusions

This study examined the nature and determinants of multidimensional poverty in the Suri Sadar Sub-Division of Birbhum District, Eastern India, a region characterized by pronounced ecological diversity and socio-economic contrasts. By integrating the Alkire–Foster methodology with a Binary Logistic Regression framework using household-level primary data, the study provides a micro-level perspective on how demographic characteristics and spatial conditions jointly shape patterns of deprivation. In doing so, it moves beyond a purely methodological application and contributes to a more context-sensitive understanding of multidimensional poverty.
A key contribution of this research lies in demonstrating that multidimensional poverty within the study area is highly localized and spatially differentiated, even within a single administrative unit. The concentration of deprivation in the western plateau blocks, namely Rajnagar, Khoyrasole, and Mohammad Bazar, contrasted with relatively lower poverty in the eastern alluvial plains and urban municipalities, highlights the role of ecological constraints and uneven regional development. This finding reinforces and extends existing literature by showing that intra-regional disparities at the micro scale are critical for understanding poverty dynamics, which are often obscured in macro-level analyses.
At the household level, the study confirms that family size and educational attainment of the household head are significant determinants of poverty, but more importantly, it demonstrates how these factors interact with spatial conditions to produce differentiated outcomes. Larger households experience greater vulnerability due to resource dilution, whereas higher education reduces deprivation by enhancing access to opportunities. The relative advantage of urban households further underscores the importance of infrastructure, service accessibility, and economic diversification in reducing multidimensional poverty. These results contribute to the broader multidimensional poverty literature by empirically illustrating the combined influence of household and locational factors at a micro-regional scale.
The analysis also highlights the critical role of environmental and spatial determinants, including elevation, physiographic variation, agricultural productivity, cropping intensity, and market accessibility. The higher levels of deprivation in plateau regions reflect the constraints imposed by poor soil quality, water scarcity, and limited irrigation. Importantly, the findings suggest that these environmental conditions do not operate in isolation but interact with socio-economic vulnerabilities, thereby intensifying deprivation. Gender-related disparities further reinforce this pattern, as larger gaps in literacy and workforce participation are associated with higher poverty levels, indicating that social inequality remains a key structural driver.
Taken together, the study demonstrates that multidimensional poverty in the Suri Sadar Sub-Division is not simply a reflection of income deficiency or isolated socio-economic factors but a product of interconnected demographic, environmental, and spatial inequalities. This integrated perspective constitutes an important contribution to geographical poverty studies by highlighting the need to analyse poverty as a spatially embedded and context-dependent process.
From a policy perspective, the findings emphasize that uniform poverty alleviation strategies are unlikely to be effective in regions with strong spatial heterogeneity. Instead, targeted and location-specific interventions are required. In plateau areas, priority should be given to improving irrigation, soil management, and livelihood diversification to address ecological constraints. Simultaneously, investments in education, particularly female literacy, along with improvements in infrastructure and market connectivity, are essential for reducing deprivation across both rural and urban areas.
The study has certain limitations. The analysis is based on cross-sectional data collected during 2024–2025 and therefore captures poverty conditions at a single point in time. Future research could incorporate longitudinal data or spatial econometric techniques to better understand temporal dynamics and causal relationships. Comparative analyses across other subdivisions or districts may further enrich the understanding of regional variations in multidimensional poverty.
Overall, this study advances the understanding of multidimensional poverty by demonstrating how local socio-economic characteristics and spatial conditions interact to produce differentiated patterns of deprivation at the micro level. By providing empirically grounded and geographically nuanced insights, it underscores the importance of place-based approaches for designing effective and inclusive poverty reduction strategies in eastern India and similar regions.


Author Contributions

Conceptualization, R.G. and P.M.; Methodology, R.G. and P.M.; Software, R.G.; Validation, R.G. and P.M.; Formal analysis, R.G.; Investigation, R.G.; Resources, P.M.; Data curation, R.G.; Writing—original draft, R.G.; Writing—review & editing, P.M.; Visualization, R.G. and P.M.; Supervision, P.M.; Project administration, P.M. All authors have read and agreed to the published version of the manuscript.

Funding

This research received no external funding.

Institutional Review Board Statement

Not applicable.

Informed Consent Statement

Not applicable.

Data Availability Statement

The original contributions presented in this study are included in the article. Further inquiries can be directed to the corresponding author.

Conflicts of Interest

The authors declare no conflict of interest.

References

  1. Dehury, B.; Mohanty, S.K. Multidimensional Poverty, Household Environment and Short-Term Morbidity in India. Genus 2017, 73, 3. [Google Scholar] [CrossRef] [PubMed]
  2. Zulkifli, F.; Abidin, R.Z.; Zulkifli, F.; Abidin, R.Z. The Multi-Dimensional Nature of Poverty: A Review of Contemporary Research The Multi-Dimensional Nature of Poverty: A Review of Contemporary Research. Int. J. Acad. Res. Econ. Manag. Sci. 2023, 12, 285–303. [Google Scholar] [CrossRef]
  3. Harcourt, W. The Millennium Development Goals: A Missed Opportunity? Development 2005, 48, 1–4. [Google Scholar] [CrossRef]
  4. Ben Haman, O.; Hulse, K.; Jacobs, K. Social Inclusion and the Role of Housing. In Handbook of Social Inclusion; Springer: Cham, Switzerland, 2021; pp. 1–20. ISBN 9783030482770. [Google Scholar]
  5. Alkire, S. Multidimensional Poverty and Its Discontents; OPHI Working Papers 46; Oxford Poverty and Human Development Initiative (OPHI), University of Oxford: Oxford, UK, 2011; Volume 46. [Google Scholar]
  6. Attoma, I.D.; Matteucci, M. Multidimensional Poverty: An Analysis of Definitions, Measurement Tools, Applications and Their Evolution Over Time Through a Systematic Review of the Literature up to 2019; Springer: Dordrecht, The Netherlands, 2024; Volume 58, ISBN 0123456789. [Google Scholar]
  7. Costa, M. A Comparison Between Unidimensional and Multidimensional Approaches to the Measurement of Poverty; IRISS Working Paper Series 2003-02, IRISS at CEPS/INSTEAD; ResearchGate: Berlin, Germany, 2003. [Google Scholar]
  8. Agrawal, S.; Sharma, N.; Dhayal, K.S.; Esposito, L. From Economic Wealth to Well-Being: Exploring the Importance of Happiness Economy for Sustainable Development through Systematic Literature Review. Qual. Quant. 2024, 58, 5503–5530. [Google Scholar] [CrossRef]
  9. Sen, A. Develeopment as Freedom; Anchor Books: New York, NY, USA, 1999; pp. 1–384. [Google Scholar]
  10. Sen, A. Poverty and Famines: An Essay on Entitlement and Deprivation; Oxford University Press: Oxford, UK, 1981; ISBN 0198284268. [Google Scholar]
  11. Ferreira, F.H.G. Poverty is Multidimensional. But What Are We Going to Do about It? J. Econ. Inequal. 2011, 9, 493–495. [Google Scholar] [CrossRef]
  12. Lugo, M.A.; Ferreira, F. Multidimensional Poverty Analysis: Looking for a Middle Ground. World Bank Res. Obs. 2013, 28, 220–235. [Google Scholar]
  13. Meyer, B.D.; Sullivan, J.X. Measuring the Well-Being of the Poor Using Income and Consumption. J. Hum. Resour. 2003, 38, 1180. [Google Scholar] [CrossRef]
  14. Jagadeshwaran, P.; Ashok, K.R.; Vidhyavathi, A.; Devi, M.N.; Santosh, G.P. Multidimensional Poverty in India—A State Wise Analysis. Asian J. Agric. Ext. Econ. Sociol. 2022, 40, 869–877. [Google Scholar] [CrossRef]
  15. Puttitanun, T.; Lerskullawat, A. Human Development and Economic Growth: Who Benefits the Most? Appl. Econ. 2025, 1–18. [Google Scholar] [CrossRef]
  16. Sharma, D.; Vijayabaskar, M.; Menon, A.; Arora, S. Relational Approaches to Poverty in Rural India: Social, Ecological and Technical Dynamics. Contemp. South Asia 2021, 29, 220–235. [Google Scholar] [CrossRef]
  17. Alkire, S.; Kanagaratnam, U.; Suppa, N. The Global Multidimensional Poverty Index (MPI) 2024 Country Results and Methodological Note; OPHI MPI Methodological Note 58; Oxford Poverty and Human Development Initiative (OPHI), University of Oxford: Oxford, UK, 2023; pp. 1–19. [Google Scholar]
  18. UNDP. Global Multidimensional Poverty Index 2023: Unstacking Global Poverty. Bus. Hist. Rev. 2023, 93, 627–630. [Google Scholar]
  19. NITI Aayog. Multidimensional Poverty in India Since 2005-06. A Discussion Paper; 2023; Volume 1, pp. 1–12. Available online: https://www.niti.gov.in/sites/default/files/2024-01/MPI-22_NITI-Aayog20254.pdf (accessed on 21 April 2026).
  20. Mondal, S.; Kumar, S.; Mishra, A.P. Geographical Analysis of Multidimensional Poverty in India from 2005-2006 to 2021: An Emerging Scenario. Forum Geogr. 2023, XXII, 92–108. [Google Scholar] [CrossRef]
  21. Dey, S.; Ray, J.; Majumder, R. Spatial Inequality in Sub-National Human Development Index: A Case Study of West Bengal Districts. Sustain. Futur. 2024, 8, 100330. [Google Scholar] [CrossRef]
  22. Chakraborty, A.; Mukherjee, S. MDG-Based Poverty Reduction Strategy for West Bengal; Institute of Development Studies Kolkata: Kolkata, India, 2009; Volume 91. [Google Scholar]
  23. Ghosh, R.; Das, N.; Mondal, P. Explanation of Major Determinants of Poverty Using Multivariate Statistical Approach and Spatial Technology: A Case Study on Birbhum District, West Bengal, India. GeoJournal 2022, 88, 293–319. [Google Scholar] [CrossRef]
  24. Dodman, D.; Brown, D.; Francis, K. Understanding the Nature and Scale of Urban Risk in Low- and Middle-Income Countries and Its Implications for Humanitarian Preparedness, Planning and Response; International Institute for Environment and Development: London, UK, 2013; ISBN 9781843699156. [Google Scholar]
  25. Seth, S.; Alkire, S. Multidimensional Poverty and Inclusive Growth in India: An Analysis Using Growth Elasticities and Semi-Elasticities; Oxford Poverty & Human Development Initiative: Oxford, UK, 2021. [Google Scholar]
  26. Maket, I. Analysis of Incidence, Intensity, and Gender Perspective of Multidimensional Urban Poverty in Kenya. Heliyon 2024, 10, e30139. [Google Scholar] [CrossRef]
  27. Ghosh, R.; Mondal, P. Unveiling the Complex Facets of Poverty: Unidimensional and Multidimensional Insights from Rural Areas of Suri Sadar Sub-Division, Birbhum District, Eastern India. Societies 2024, 14, 54. [Google Scholar] [CrossRef]
  28. Liu, M.; Ge, Y.; Hu, S.; Hao, H. The Spatial Effects of Regional Poverty: Spatial Dependence, Spatial Heterogeneity and Scale Effects. ISPRS Int. J. Geo-Inf. 2023, 12, 501. [Google Scholar] [CrossRef]
  29. Jackson, R.W.; Hewings, G.J.D.; Rey, S.; Gracia, N.L. Regional Development Overview Challenges, Adopted Strategies, and New Initiatives; World Bank: Washington, DC, USA, 2019. [Google Scholar]
  30. Satpati, S.; Sharma, K.K.; Ghosh, P. Geographical Variations of Livelihood Capital and Associated Effects in Rarh Region of West Bengal, India. Orient. Anthropol. 2023, 23, 168–201. [Google Scholar] [CrossRef]
  31. Ipsum, L.; Sit, D.; Rippin, N.; Alkire, S.; Foster, J.E.; Seth, S.; Santos, M.E.; Roche, J.M.J.M.J.M.; Ballon, P.; Alkire, S.; et al. Overview of Methods for Multidimensional Poverty Assessment; Oxford Poverty and Human Development Initiative (OPHI): Oxford, UK, 2015; Volume 45, ISBN 9781907194276. [Google Scholar]
  32. Alkire, S.; Emma, M. A Multidimensional Approach: Poverty Measurement & Beyond. Soc. Indic. Res. 2013, 112, 239–257. [Google Scholar] [CrossRef]
  33. Kakwani, N.; Son, H.H. Multidimensional Poverty: A New Perspective on Measurement. J. Dev. Stud. 2026, 62, 445–459. [Google Scholar] [CrossRef]
  34. Palmer-Jones, R.; Sen, K. It is Where You Are That Matters: The Spatial Determinants of Rural Poverty in India. Agric. Econ. 2006, 34, 229–242. [Google Scholar] [CrossRef]
  35. Takane, T. Disparities and Diversities among Female-Headed Households in Rural Malawi after 20 Years of Economic Liberalization. Singap. J. Trop. Geogr. 2009, 30, 358–372. [Google Scholar] [CrossRef]
  36. Maolani, D.Y. Policy Innovations in Poverty Reduction: Assessing Government Strategies and Their Impact on Socioeconomic Development. Int. J. Relig. 2024, 5, 5786–5797. [Google Scholar] [CrossRef]
  37. Gweshengwe, B.; Hassan, N.H. Defining the Characteristics of Poverty and Their Implications for Poverty Analysis. Cogent Soc. Sci. 2020, 6, 1768669. [Google Scholar] [CrossRef]
  38. Lignier, P.; Jarvis, D.; Grainger, D.; Chaiechi, T. Spatial Heterogeneity and Subjective Wellbeing: Exploring the Role of Social Capital in Metropolitan Areas Using Multilevel Modelling. J. Happiness Stud. 2024, 25, 52. [Google Scholar] [CrossRef]
  39. Koehler, G. The 2030 Agenda Anderadicating Poverty: Newhorizons for Global Socialpolicy? Glob. Soc. Policy 2017, 17, 210–216. [Google Scholar] [CrossRef]
  40. Malik, A.; Abrar, D.; Khan, N.A.; Alhussami, A.M. Sustainable Development Goals: Students’ Perception on Quality Education, Gender Equality, and Sustainability. Discov. Sustain. 2025, 6, 410. [Google Scholar] [CrossRef]
  41. Liu, Q.; Wang, M.; Wang, Q.; Wei, D. Mitigating Rural Multidimensional Poverty Through Digital Inclusive Finance: Real Improvement and Psychological Empowerment. Agriculture 2025, 15, 954. [Google Scholar] [CrossRef]
  42. Das, N.; Sutradhar, S.; Ghosh, R.; Mondal, P.; Islam, S. The Response of Groundwater to Multiple Concerning Drivers and Its Future: A Study on Birbhum District, West Bengal, India. Appl. Water Sci. 2021, 11, 79. [Google Scholar] [CrossRef]
  43. Sutradhar, S.; Mondal, P.; Das, N. Delineation of Groundwater Potential Zones Using MIF and AHP Models: A Micro-Level Study on Suri Sadar Sub-Division, Birbhum District, West Bengal, India. Groundw. Sustain. Dev. 2021, 12, 100547. [Google Scholar] [CrossRef]
  44. Gouda, K.C.; Sahoo, S.K.; Samantray, P.; Shivappa, H. Comparative Study of Monsoon Rainfall Variability over India and the Odisha State. Climate 2017, 5, 79. [Google Scholar] [CrossRef]
  45. Skinner, C.J. Probability Proportional to Size (PPS) Sampling. Wiley StatsRef Stat. Ref. Online 2016, 1–5. [Google Scholar] [CrossRef]
  46. Abdulla, F.; Hossain, M.M.; Rahman, M.M. On the Selection of Samples in Probability Proportional to Size Sampling: Cumulative Relative Frequency Method. Math. Theory Model. 2014, 4, 2224–5804. [Google Scholar]
  47. Cochran, W.G. Sampling Techniques; John Wiley & Sons: New York, NY, USA, 1977; ISBN 0-471-16240-X. [Google Scholar]
  48. Qureshi, Z.A.; Solangi, M.A.; Shaikh, A.A.; Sahito, J.G.M. Measuring Multidimensional Parameters of Poverty Using Alkire and Foster Methodology in Qasimabad: A Case Study. J. Poverty Invest. Dev. 2018, 44, 112–116. [Google Scholar]
  49. Mare, Y.; Gecho, Y.; Mada, M. Determinants of Multidimensional Rural Poverty in Burji and Konso Area, Southern Ethiopia. Cogent Soc. Sci. 2022, 8, 2068757. [Google Scholar] [CrossRef]
  50. Chan, S.M.; Wong, H.; Chan, S.M. Measurement and Determinants of Multidimensional Poverty: The Case of Hong Kong. J. Asian Public Policy 2025, 18, 611–631. [Google Scholar] [CrossRef]
  51. Bitana, E.B.; Lachore, S.T.; Utallo, A.U. The Influence of Household Size on Socioeconomic Conditions of Rural Farm Households in Damot Woyde District, Wolaita Zone, Southern Ethiopia. Cogent Soc. Sci. 2024, 10, 2358153. [Google Scholar] [CrossRef]
  52. Hegazi, F.; Seyuba, K. Gender, Livelihood Diversification and Food Security: Insights from Rural Communities in Zambia. J. Rural Stud. 2024, 109, 103321. [Google Scholar] [CrossRef]
  53. Giotis, G.; Gogas, T.; Gouda, K. Education and Employment. Encyclopedia 2025, 5, 85. [Google Scholar] [CrossRef]
  54. Sarker, M. Socio-Economic Status and Living Condition of Widows In Rural Bangladesh. Soc. Sci. Humanit. J. 2024, 8, 5046–5061. [Google Scholar] [CrossRef]
  55. Tshaka, A.; Tanga, P.; Ntshongwana, Z. Socio-Economic Challenges Experienced by Widows and Support Provided by Social Workers in Raymond Mhlaba Local Municipality in Eastern. South. Afr. J. Soc. Work Soc. Dev. 2023, 35, 1–21. [Google Scholar] [CrossRef]
  56. Cattaneo, A.; Adukia, A.; Brown, D.L.; Christiaensen, L.; Evans, D.K.; Haakenstad, A.; Mcmenomy, T.; Partridge, M.; Vaz, S.; Weiss, D.J. Economic and Social Development along the Urban—Rural Continuum: New Opportunities to Inform Policy. World Dev. 2022, 157, 105941. [Google Scholar] [CrossRef]
  57. Dagar, H.; Sachdeva, J.; Bhoi, P.B. Impact of Urban Proximity on Social Infrastructure Access in Rural Punjab. J. Agric. Dev. Policy 2024, 33, 203–211. [Google Scholar] [CrossRef]
  58. Arega, E.; Deribew, K.T.; Moisa, M.B.; Obsi, D. Assessment of Soil Erosion and Prioritization of Conservation and Restoration Measures Using RUSLE and Geospatial Techniques: The Case of Upper Bilate Watershed Conservation and Restoration Measures using RUSLE and Watershed. Geomat. Nat. Hazards Risk 2024, 15, 2336016. [Google Scholar] [CrossRef]
  59. Mahala, A. Processes and Status of Land Degradation in a Plateau Fringe Region of Tropical Environment. Environ. Process. 2017, 4, 663–682. [Google Scholar] [CrossRef]
  60. Wan, R.; Yu, H.; Zhang, D.; Yang, B.; Huang, Y. Effects of Comprehensive Land Consolidation on Farmers ’ Livelihood Under Different Terrain Gradients. Land 2025, 14, 871. [Google Scholar] [CrossRef]
  61. Kaliraj, S.; Joe, R.J.J.; Pitchaimani, V.S.; Abishek, S.R.; Karuppannan, S. GIS-Based Assessment of Land Degradation Vulnerability and Environmental Indices as Ecological Indicators in Western Agro-Climatic Zone of Tamil Nadu, India. Sci. Rep. 2026, 16, 4944. [Google Scholar] [CrossRef]
  62. Bhatt, R.; Garg, A.K.; Majumder, D.; Verma, K.K. Review Article Soil Texture: Unlocking Fertility and Productivity for Better Crops. Agric. Assoc. Text. Chem. Crit. Rev. J. 2025, 13, 396–408. [Google Scholar]
  63. Siddiqui, S.H.; Afzal, M.F.; Aktar, N. Levels of Agricultural Development in Dakshin Dinajpur District, West Bengal: A Block Level Analysis. N. Asian Int. Res. J. Soc. Sci. Humanit. 2017, 3, 189–201. [Google Scholar]
  64. Shah, F.; Wu, W. Soil and Crop Management Strategies to Ensure Higher Crop Productivity within Sustainable Environments. Sustainability 2019, 11, 1485. [Google Scholar] [CrossRef]
  65. Ibrahim, L.A.; Abu-Hashim, M.; Shaghaleh, H.; Elsadek, E.; Hamad, A.A.A.; Alhaj Hamoud, Y. A Comprehensive Review of the Multiple Uses of Water in Aquaculture-Integrated Agriculture Based on International and National Experiences. Water 2023, 15, 367. [Google Scholar] [CrossRef]
  66. Iqbal, M.A.; Rizwan, M.; Abbas, A.; Makhdum, M.S.A.; Kousar, R.; Nazam, M.; Samie, A.; Nadeem, N. A Quest for Livelihood Sustainability? Patterns, Motives and Determinants of Non-Farm Income Diversification among Agricultural Households in Punjab, Pakistan. Sustainability 2021, 13, 9084. [Google Scholar] [CrossRef]
  67. Roy, K.; Swargiary, K. Literacy as a Catalyst for Socio-Economic Development: An Analytical Review of 2024 Global Data; ResearchGate: Berlin, Germany, 2024. [Google Scholar] [CrossRef]
  68. Antai, A.S.; Anam, B. Gender Disparity in Education, Employment and Access to Productive Resources as Deterrent to Economic Development. J. Public Adm. Gov. 2016, 6, 59–74. [Google Scholar] [CrossRef]
  69. Alliayah, T.; Michael, N.; Perry, H.; Kaikai, A. Economic Factors Influencing Female Work Participation. SSRN Electron. J. 2021. [Google Scholar] [CrossRef]
  70. Kumar, S.V. Female Sex—Ratio in India—A Review. IJDRSA 2012, 8, 29–44. [Google Scholar]
  71. Jiao, W. Analyzing Multidimensional Measures of Poverty and Their Influences in China’s Qinba Mountains. Chin. J. Popul. Resour. Environ. 2021, 18, 214–221. [Google Scholar] [CrossRef]
  72. Fotros, M.H.; Ghodsi, S.; Alipoor, A. Urban—Rural Multidimensional Poverty by Using Alkire—Foster Method; HDCA: Boston, MA, USA, 2015; pp. 1–11. [Google Scholar]
  73. Abdiwahab, B.; Bobe, M. An Econometric Analysis of the Determinants of Rural Household Poverty in Somalia. Cogent Econ. Financ. 2025, 13, 2515501. [Google Scholar] [CrossRef]
  74. Cherif, H.L.; Badreddine, A.; Sabri, A. Determinants of Household Poverty: Identification Using Logistic Regression. Socioecon. Chall. 2024, 8, 78–89. [Google Scholar] [CrossRef]
  75. Alkire, S.; Foster, J. Understandings and Misunderstandings of Multidimensional Poverty Measurement. J. Econ. Inequal. 2011, 9, 289–314. [Google Scholar] [CrossRef]
  76. Nuhu, D.A.; Yakubu, Y.; Musa, A.Y.; Rufai, A. Use of Multiple Logit Regression Model in the Evaluation of Socioeconomic Variables Influencing Poverty among Households In. Int. J. Res. Publ. Rev. 2023, 4, 4125–4136. [Google Scholar]
  77. Mondal, S.; Kumar, S.; Mishra, A.P. Contextualizing Spatiality of Multidimensional Poverty in Rural and Urban India: A Geographical Perspective. Belgeo 2023, 1. [Google Scholar] [CrossRef]
  78. Tripathi, S.; Yenneti, K. Measurement of Multidimensional Poverty in India: A State-Level Analysis. Indian J. Hum. Dev. 2020, 14, 257–274. [Google Scholar] [CrossRef]
  79. Andrabi, J.A. Spatial Analysis of Multidimensional Poverty in India: An Examination of Regional Disparities. J. Appl. Sci. 2023, 10, 1–8. [Google Scholar] [CrossRef]
  80. NITI Aayog. National Multidimensional Poverty Index: A Progress Review; Government of India: New Delhi, India, 2020.
Figure 1. Location map of study area—(a) India, (b) West Bengal, (c) Suri Sadar Sub-division.
Geographies 06 00049 g001
Figure 2. Spatiality of some employed variables—(a) Elevation, (b) Physiographic Division, (c) Soil Texture, (d) Cropping Intensity, (e) Crop Productivity, (f) Pond Frequency, (g) Literacy Rate, (h) Gender Gap in Literacy, (i) Gender Gap in Workforce Participation, (j) Sex Ratio.
Geographies 06 00049 g002aGeographies 06 00049 g002b
Figure 3. The block- and municipality-wise multidimensional poverty indices—(a) Incidence of Multidimensional Poverty, (b) Intensity of Multidimensional Poverty, (c) Multidimensional Poverty Index (MPI).
Geographies 06 00049 g003
Table 1. Percentage Distribution of the Selected Indicators of Multidimensional Poverty in Suri Sadar Sub-Division (N = 3952).
Dimensions & IndicatorsDeprivation Criteria for the Selected Indicators (Di)Number of Deprived HouseholdsPercentage of Deprived Households
Health Dimension
NutritionA household is considered deprived if any child between the ages of 0 to 59 months, woman between the ages of 15 to 49 years, or male between the ages of 15 to 54 years—for whom nutritional information is available—is found to be undernourished.85821.71
Child & Adolescent MortalityA household is deprived if a child/adolescent under 18 years of age has died in the family in the five-year period preceding the survey.731.85
Antenatal CareA household is deemed deprived if any woman within the household who gave birth within the five years preceding the survey did not undergo at least four antenatal care visits for the latest birth or if she did not receive assistance from trained, skilled medical personnel during the most recent childbirth.2436.15
Education Dimension
Year of SchoolingIf no one in the household who is 10 years old or older has completed six years of schooling.74818.92
School AttendanceIf any school-aged child is not attending school up to the age at which he or she would complete class 8.1443.64
Standard of Living Dimension
Cooking FuelIf a household cooks with dung, agricultural crops, shrubs, wood, charcoal or coal.146737.11
SanitationIf the household has an unimproved or no sanitation facility, or if it is improved but shared with other households.136634.56
HousingIf the household has inadequate housing, i.e., the floor is made of natural materials, or the roof or walls are made of rudimentary materials.104126.34
Drinking WaterIf the household does not have access to improved drinking water or safe drinking water is at least a 30 min walk from home (as a round trip).42410.73
ElectricityIf the household has no electricity connection.1954.93
AssetsIf the household does not own more than one of these assets, radio, TV, telephone, computer, animal cart, bicycle, motorbike, or refrigerator, and does not own a car or truck.55914.14
Bank AccountIf no household member has a bank account or a post office account.3929.92
Source: Computed by the Researcher based on the household survey.
Table 2. Block and Municipality-Wise Multidimensional Poverty Index (MPI).
Sl. No.C.D. Block or Municipality NameIncidence of Multidimensional Poverty (H)Multidimensional Poverty Intensity (A)Multidimensional Poverty Index (MPI)
1Rajnagar0.3440.4590.158
2Md. Bazar0.3750.4570.172
3Suri-I0.2820.4520.128
4Sainthia0.2850.4510.129
5Suri-II0.2900.4530.131
6Khoyrasole0.3910.4620.181
7Dubrajpur0.3200.4610.147
8Suri (M)0.1210.4210.051
9Sainthia (M)0.1290.4270.055
10Dubrajpur (M)0.1350.4240.057
Suri-Sadar Sub Division0.2680.4520.121
Source: Computed by the Researcher based on household survey.
Table 3. Result of Omnibus Tests of Model Coefficients.
Chi-SquaredfSig.
Step 1Step392.239240.000
Block392.239240.000
Model392.239240.000
Source: Computed by the Researcher.
Table 4. Result of Hosmer and Lemeshow Test.
StepChi-SquaredfSig.
12.83080.945
Source: Computed by the Researcher.
Table 5. Model Summary.
Step−2 Log LikelihoodCox & Snell R SquareNagelkerke R Square
173.771 a0.5760.838
Source: Computed by the Researcher. a Estimation terminated at iteration number 8 because parameter estimates changes by less than 0.001.
Table 6. Classification Table.
ObservedPredicted
Multidimensionally Poor HouseholdPercentage Correct
NoYes
Step 1Multidimensionally Poor HouseholdNo28632999.0
Yes27678474.0
Overall Percentage 92.3
a. The cut value is 0.500
Source: Computed by the Researcher.
Table 7. Result of Multicollinearity Test (Collinearity Statistics).
ModelUnstandardized CoefficientsStandardized CoefficientstSig.Collinearity Statistics
BStd. ErrorBetaToleranceVIF
1(Constant)−11.5911.820 −6.3690.000
Households Size−0.1260.008−0.188−16.0700.0000.8331.201
Gender of Households Head−0.0110.027−0.004−0.4170.6770.9991.001
Age of the Households Head0.0000.001−0.003−0.2650.7910.9971.003
Marital Status of the Household Head−0.0700.023−0.033−2.9990.0030.9721.029
Educational Attainment of the Household Head−0.3120.005−0.800−62.9130.0000.7061.416
Living Area0.3120.0150.31821.1520.0000.5061.976
Elevation−0.0030.000−0.152−6.6270.0000.6171.621
Physiographic Division−0.0750.022−0.085−3.3820.0010.4812.079
Soil Texture−0.0030.005−0.007−0.6230.5330.8321.202
Frequency of Ponds−0.0030.003−0.014−0.8740.3820.4602.176
Crop Productivity0.0800.0120.1796.6670.0000.7591.318
Cropping Intensity0.0460.0230.1172.0250.0430.4342.304
Distance from the Market0.0090.0020.0695.1770.0000.6501.539
Gender Gap in Literacy0.1150.0190.3976.1200.0000.7271.376
Gender Gap in the Workforce−0.0260.005−0.101−4.7060.0000.5461.832
Sex Ratio0.0120.0020.2717.4220.0000.7861.272
a. Dependent Variable: Multidimensionally Poor Household
Source: Computed by the Researcher based on household survey.
Table 8. Result of Binary Logistic Regression (Variables in the Equation).
BS.E.WalddfSig.Exp(B)95% C.I. for EXP(B)
LowerUpper
Step 1 aHouseholds Size1.3100.128104.82310.0001.2700.6102.347
Gender of Households Head0.1110.3450.10410.7471.1180.5692.197
Age of the Households Head−0.0030.0060.20810.6480.9970.9861.009
Marital Status of the Household Head0.7640.2578.80510.7032.1471.2963.556
Educational Attainment of the Household Head−2.4870.083899.89210.0000.0830.0710.098
Living Area−1.6750.29332.63510.0000.1870.1050.333
Elevation0.0290.00623.84210.0001.1720.9602.983
Physiographic Division−0.7560.2618.43110.0040.4690.2820.782
Soil Texture−0.0180.0550.10310.7480.9830.8831.094
Frequency of Ponds−0.0080.0380.04310.8350.9920.9201.070
Crop Productivity−0.5780.14116.71410.0000.7830.4511.053
Cropping Intensity−0.4310.26712.60110.0070.5390.3110.960
Distance from the Market0.0510.0206.33810.0121.0531.0111.096
Gender Gap in Literacy0.9160.22017.27310.0002.5001.6233.852
Gender Gap in the Workforce0.2510.06514.72910.0001.7781.3842.584
Sex Ratio−0.1010.02026.67710.0000.7060.5651.150
Constant−92.82620.80719.90310.0512.173
Source: Computed by the Researcher based on the household survey. a Variable(s) entered on step 1: Households Size, Gender of Households Head, Age of the Households Head, Marital Status of the Household Head, Educational Attainment of the Household Head, Living Area, Elevation, Physiographic Division, Soil Texture, Frequency of Ponds, Crop Productivity, Cropping Intensity, Distance from the Market, Gender Gap in Literacy, Gender Gap in the Workforce, Sex Ratio.
Disclaimer/Publisher’s Note: The statements, opinions and data contained in all publications are solely those of the individual author(s) and contributor(s) and not of MDPI and/or the editor(s). MDPI and/or the editor(s) disclaim responsibility for any injury to people or property resulting from any ideas, methods, instructions or products referred to in the content.