


Abstract
This study aims to investigate the relationship between basin hydrology and estuarine processes such as dynamics that influence salinity and water quality in the Shatt Al-Arab River, southern Iraq. Extensive samplings were conducted at 25 sites along the river course over one hydrological year. Runoff estimates were obtained using the soil conservation service–curve number (SCS-CN) model. During winter, peak rainfall (76.8 mm month−1) and runoff (12.38 mm month−1) promote the shortest salt wedge extension (8 km) and the highest water quality (median water quality index (WQI) = 22). In contrast, during fall, minimal rainfall (6.51 mm month−1) and runoff (0.14 mm month−1) result in a salt wedge extension of 109 km and the lowest water quality (median WQI = 250). Strong correlations between rainfall–runoff estimates, salt wedge extension, and water quality parameters demonstrate that water quality status can be predicted using hydrological inputs alone. Thus, this study introduces a novel quantification of the flushing influence required to maintain the Shatt Al-Arab River’s ecological health. A strong (r2 = 0.87) significant (p < 0.05) negative correlation was detected between the runoff coefficient (a proxy indicator of catchment wetness) and the standard deviation of WQI. Such a negative correlation implies that hydrological flushing fosters water quality stability. Principal component analysis (PCA) further revealed how natural and anthropogenic sources contribute to water quality. The findings illustrate how seasonal hydrological variability control mixing processes, salt wedge propagation, and water quality in estuarine-influenced river systems, presenting a framework adaptable to similar systems worldwide.
1. Introduction
The Shatt Al-Arab River, southern Iraq, is the only freshwater body in the surrounding dry lands of Basra Governorate [1]. The Tigris, Euphrates, Karun, and Karkheh Rivers are the main water inputs that enter the Shatt Al-Arab watercourse [2]. The river constitutes a lifeline for millions of people inhabiting its basin and using its water for residential, agricultural, industrial, and transportation purposes [3]. Additionally, the river serves as the primary freshwater supply for the northern part of the Arabian Gulf, making it crucial for supporting aquatic ecosystems in such coastal areas [4]. Nonetheless, the river’s water quality has significantly declined over the past 30 years due to various reasons. First, the river’s water quality has been adversely affected by the rising wastewater from the nearby petroleum production fields [5], agricultural fields [6], and urbanized centers [7]. Second, growing damming projects and diversion of the river’s tributaries by upstream countries have led to substantial reductions in the river’s discharge [8]. Third, the Mesopotamian marshes have never been restored after the intentional draining in the 1990s [9]. Such wetlands that flow into the Shatt Al-Arab were formerly effective filters for pollutants [10]. Fourth, climate change patterns for this region have displayed an overall precipitation decrease and temperature increase (and consequently evaporation increase). Such climate changes were reported to have a strong impact on the discharge of the river and, thereafter, on the contaminate levels in its water [6]. The dominance of seawaters over the river flow has led to seawater intrusion towards the upstream reaches of the river, significantly altering salinity patterns and riverine processes [11].
Lately, questions have arisen over elevating salinity and heavy metals in the river [12,13]. High salinity levels have the potential to compromise drinking and irrigation water supplies, disrupt physiological functions in aquatic habitats, increase pH and nutrient levels, and reduce dissolved oxygen, all of which impose an adverse influence on aquatic life and cause harmful algal blooms [14,15,16,17,18]. Elevated salinity levels also reduce soil fertility and crop production [19], imposing significant economic impacts [20]. Likewise, high levels of heavy metals pose major health and environmental risks owing to their accumulative and persistent characteristics [21]. Heavy metals may displace proteins from their natural places and occupy their sites inside cells. Consequently, there will be a defect in cellular structure that can ultimately cause toxicity [22]. At elevated concentrations, such metals induce chronic illnesses, organ malfunction, and the deterioration of aquatic life [23,24,25]. The river discharge change can even influence the fishing industry. For instance, Qasim [26] found that the discharge decrease in the Shatt al-Arab results in reduced quantities of fish caught. As a result, understanding the processes that govern salinity and contamination along the river is crucial for handling ecological and socio-economic impacts.
Previous studies focused on water contaminant levels and distribution as well as water suitability for drinking and irrigation purposes (e.g., [6,7]). Most other investigations restricted their scope to a specific river stretch or a limited number of sampling locations. Therefore, thorough analyses to identify pollution and salinity sources and distribution in the Shatt Al-Arab are still required. Moreover, pattern changes in weather parameters such as precipitation, temperature, and evaporation can impact the sourcing and transportation of contaminants in rivers [27,28]. For instance, a lack of, or decreased, runoff during dry seasons compared to wet seasons leads to elevated levels of point-source contaminants [29]. However, such low runoff can lead to reduced contamination inputs from land sources. This in turn causes lower levels of some contaminants entering rivers [30]. In contrast, non-point source contamination increases through seepage and runoff during wet seasons [31]. However, higher river flow in wet seasons can also have a diluting effect, reducing the concentrations of some contaminants in the river’s water. In other words, while the total amount of contaminants may increase, the concentration per unit of water may decrease. Thus, the effects of seasonal changes consequently determine the amount and quality of water parameters [29]. Likewise, anthropogenic activities that contribute to water quality degradation can change seasonally. For example, spring planting increases nutrient and pesticide runoff due to tillage and fertilizer application [32,33]. Harvesting, mostly in the fall, can cause soil erosion, sediment mobilization, and nutrient flushing [34]. Conversely, municipal and industrial wastewater effluents are constant pollution sources throughout the year [35]. Investigating pollution seasonal variations can unfold the interactions between environmental factors and pollutant transport mechanisms [36]. Understanding these interactions helps to anticipate the influence of pollution on river systems and how to manage it. Monitoring seasonal changes assists in prioritizing efforts and resources by focusing pollution control measures during peak periods of pollution [37]. Monitoring seasonal variations also reveals the influence of land-use practices on the quantity and quality of water flowing into the river [38,39]. Finally, this monitoring helps to respond to climate change by understanding how shifts in precipitation patterns, temperatures, evaporation, and hydrological cycles control the amount and quality of water reaching the river [40]. However, the role of seasonal changes in controlling salinity and pollution in the Shatt Al-Arab River is not adequately explored.
Thus, the previous work is characterized primarily by the following gaps: (i) deficiency in thorough comprehension of pollution sources and salinity intrusion, (ii) insufficient understanding of how hydrologic parameters such as rainfall and runoff influence pollutant transport dynamics, (iii) lack of adequate insight of how short- and long-term climate changes affect hydrological processes that govern water quality. To address such gaps, it is necessary to shift the research structure toward a more integrated and multidimensional approach. Therefore, the present study applies statistical analysis to identify natural and anthropogenic contributions to the river’s pollution. Moreover, this study integrates GIS-RS-based hydrological modeling with observed physicochemical indicators to examine how seasonal variations in rainfall and runoff control pollutant transport and salt wedge intrusion. Finally, this work distinguishes the relationship between hydrological indicators (e.g., runoff coefficient) and water quality stability which allows the creation of a solid approach for evaluating both short- and long-term hydrochemical variability amid ongoing climatic change. The outputs of this work are useful in the adoption of appropriate management and mitigation strategies such as early warning systems for pollution surges, water allocation scheduling, anthropogenic effluent regulation, and drainage infrastructure design. In short, the work represents an attempt to transfer water quality monitoring schemes into an analytical tool and forecasting mechanism for estuarine-influenced river sustainability.
The soil conservation service–curve number (SCS–CN) method is widely used to estimate surface runoff [19]. Such a method, when applied in conjunction with remote sensing (RS) and geographic information system (GIS), can generate reliable runoff estimation [41]. Moreover, multivariate statistical methods have been broadly applied for evaluation of spatio-temporal variations in water quality and interpretation of large water quality datasets [42]. Such methods assist in understanding the sources of pollution and developing suitable strategies for controlling it. Principal component analysis (PCA) has been used in the present study to interpret large datasets to capture the water quality variations and ecosystem condition of the studied area. Moreover, PCA has been used to identify possible parameters and sources that control water quality. Identifying pollution sources helps in taking mitigation measures to minimize the input of pollutants into the river [43]. Addressing specific sources of contamination, such as agricultural, industrial, and residential effluents, can reduce adverse environmental impacts [44,45]. This process assists to protect the river ecosystems and aquatic life [46,47]. In addition, sharing information about pollution sourcing and transport enhances public environmental awareness and promotes sustainable practices [48]. Therefore, the objective of the present work is (i) to envisage the geographic patterns of salinity intrusion and heavy metals in the Shatt Al-Arab River, and examine how hydrological and estuarine conditions control these patterns, (ii) to calculate surface runoff using the SCS-CN model and explore how it relates to salinity propagation and contamination levels, (iii) to investigate how seasonal hydrological changes in rainfall and runoff modulate the sourcing and transport of salinity and pollution, and (iv) to define the main sources of salinity and contamination in the river using multivariate statistical techniques (PCA).
2. Methods
2.1. Study Framework
The study framework is based on field data and remote sensing data. Field data include measurements of major, minor, and trace elements, and TDS. PCA is used to identify pollution sources. Remote sensing data include input sources used to estimate slope, LULC, soil, and rainfall layers. Such layers were combined to calculate surface runoff applying the SCS-CN model. The links between runoff and WQI, and between runoff and salt wedge intrusion (SWI), were examined (Figure 1).
Figure 1.
Workflow chart for the research phases, data used, analytical procedures, and evaluation structure.
2.2. Sampling
Water samples were compiled from 25 sites (one sample from the Tigris River and another from the Euphrates River right before their confluence, and the remaining 23 samples along the main course of the Shatt al-Arab River from its source to its outlet) (Figure 2). Sampling sites represent major land-use/land-cover (LULC) changes in the river’s floodplain. Sampling spacing ranges between 4 and 20 km to reflect such changes in LULC. A short sampling interval was assigned to areas of high LULC variations, for instance, areas of high anthropogenic activities. On the other hand, a long sampling interval was allocated to homogenous areas. Therefore, these locations accurately represent the major LULC-related characteristics of the areas surrounding the river course. Samples were taken in four field expeditions—October 2018 (fall season), January 2019 (winter season), April 2019 (spring season), and July 2019 (summer season)—to ensure the capture of seasonal patterns in water quality. In the estuaries, in general, the spatial and temporal changes in physicochemical parameters and thus water quality are distinctly influenced by tidal phenomena [49,50]. Therefore, to avoid the impact of monthly tides, that is, spring and neap tides, samples were collected during the periods between the new moon and first quarter; between the first quarter and full moon; between the full moon and third quarter; and between the third quarter and new moon. Moreover, to avoid the influence of diurnal tides, that is, flood and ebb tides, we followed the tide charts [51] to synchronize the measurements across different sites and times. In other words, we consistently followed the same time schedule for each sampling expedition. Total dissolved solids (TDS) and pH were monitored using portable digital meters in situ at the time of sampling. Each sample was collected into 500 mL polyethylene containers that were previously washed with the river’s water to be gathered. Samples were then filtered using a 0.45 µm microfilter and kept in 50 mL HDPE containers that were previously rinsed and leached with ultrapure water and stored at −18 °C. Then, water samples were diluted tenfold using ultrapure deionized water to reduce the high salinity effect. Analyses were performed in an ion chromatograph–mass spectrometer (ICP-MS) (X-Series 2, Thermo Fisher Scientific, Dreieich, Germany) at the College of Pharmacy at Philipps-Universität Marburg in Germany. Each sample was divided into three parts, meaning the device reported three concentration values for each element in each sample. The mean, standard deviation, and relative standard deviation were calculated.
Figure 2.
Study site.
2.3. Water Quality Index (WQI)
We used the “weighted arithmetic index method” to calculate WQI (dimensionless) applying the following formula [52]
where Qn is the quality rating (dimensionless). Wn is the unit weight, and its unit is the inverse of the parameter unit (e.g., L µg−1).
Qn is calculated using the equation
where Vn and Vi represent the observed value and the ideal value of each variable examined, respectively. Vi is zero for all variables except for pH, where Vi equals seven. Vs represents the standard permissible value for the nth water quality variable (Table 1). The units of Vn, Vi, and Vs depend on the parameter unit (e.g., µg L−1, mg L−1, etc.)
Table 1.
National and international standards of water quality.
Wn is the unit weight estimated according to the formula
where k represents the proportionality constant, and it is computed using the equation:
The water quality category is determined according to Table 2.
Table 2.
Water quality index (from [62]).
2.4. Runoff Calculation Using SCS-CN Model
The SCS-CN method was used in Google Earth Engine (GEE) to compute runoff in the basins that feed the Shatt Al-Arab, i.e., Tigris, Euphrates, Karun, and Karkheh basins. The model calculations depend mainly on rainfall, soil, LULC, and the slope of the basin. The required data were obtained for rainfall [63], soil [64], LULC [65], and Digital Elevation Model (DEM) to calculate the basin’s slope [66]. The method applied the following equations [67].
where Q, P, and S are direct runoff, rainfall, and potential maximum retention, respectively. The units of Q, P, and S are mm. λ is the initial abstraction coefficient (dimensionless) that ranges between 0 and ∞. In general, λ of 0.2 is used [68]. λS denotes the initial abstraction, which encompasses infiltration, interception, and storage of surface depression [69]. S is computed as follows [70]:
CN ranges between 0 (when S and Q equal infinity and zero, respectively) and 100 (when S equals zero and when all rainfall becomes runoff). The map of the study site was then categorized into distinct Hydrological Soil Groups (HSGs) based on observations of soil infiltration capability, as described by Subramanya [71]. HSGs are categorized into four types: A, B, C, and D. “A” soils have high rates of infiltration and low potentials of runoff. The infiltration rates and runoff potentials of Group “B” soils are moderate. Group “C” has low infiltration rates and a moderate-to-high potential of runoff. “D” soils have very low infiltration rates and very high potentials of runoff [71]. LULC, HSG, and Antecedent Moisture Condition (AMC) are the factors that determine CN. The LULC map was projected on the HSG map and intersected areas were delineated using GEE. Each area of specific LULC and HSG has a certain CN value that was obtained from Subramanya [71]. Next, each area was converted to its percentage of the basin’s total area. Each area percentage was multiplied by its corresponding CN to obtain a specific value. The sum of such specific values for all areas equals the composite curve number (CNc). The CNc is calculated as follows [72]:
CNi, Ai, and A denote the sub-regional curve number, sub-regional area, and total basin area, respectively. The CN obtained from Equation (7) is considered CNII. CNII is converted to CNI and CNIII for dry (AMCI) and wet (AMCIII) conditions, respectively.
CNI, CNII, and CNIII were used according to Table 3 to compute S in Equation (6). CNc, CNi, CNI, CNII, and CNIII are dimensionless. The units of Ai, and A are km2. The S value is inserted into Equation (5) to estimate Q. Q was calculated for the last three months prior to the sampling time four times (i.e., for the four seasons investigated in the present study). For these four Q values, rainfall and LULC were selected for the same time periods (i.e., for the last three months prior to the sampling time four times for four Q estimations).
Table 3.
AMC classes and their corresponding CN [41].
2.5. Statistical Analysis
To determine the element agglomeration and sourcing in the river, we performed statistical analysis. Statistical techniques such as PCA can effectively lower the dimensionality of a dataset. In PCA, the original variables are transformed into a smaller set of variables while keeping the most significant information in the original data group [73]. PCA was conducted for each season in order to obtain a detailed understanding of seasonal variations and specific parameters influencing the river’s water quality in each season. Such analysis allows us to distinguish specific element clusters and define the root natural and anthropogenic sources of contamination in the river [74]. PCA, when followed by factor analysis (FA), results in further reduction in the contribution of the less important variables and enhancement of the contribution of the more important variables [75]. FA is performed by rotating the axes generated by PCA in line with well-verified criteria. Rotation creates a new factor set, each of which contains a set of the original parameters with the minimal possible amount of intersect [76]. When the components’ Eigenvalues exceeded 1.00, they were regarded as principal components.
3. Study Site
The Iraqi lands have been divided into four primary tectonic zones depending on the rock type, age, and structural development. These four areas are: Inner Platform, Outer Platform, Shalair Zone, and Zagros Suture Zone [77]. The study area is extended within the southeastern parts of the Outer Platform [78], which is covered by Holocene alluvial deposits [79]. The Shatt al-Arab River that extends in Basra Governorate, southern Iraq, is formed by the convergence of the Tigris and Euphrates Rivers at the town of Qurna. The Karkheh River that originates from Iranian territories empties in the Hawiza Marsh near the Iraqi–Iranian border. The Hawiza Marsh waters flow into the Swaib River which empties into the Shatt Al-Arab 6 km from the latter’s origin. At a distance of 106 km from the Shatt Al-Arab origin, the Karun River, which also originates from Iranian territories, flows into it. The river flows southeast with a total length of 192 km until it empties into the Arabian Gulf [80]. The Shatt Al-Arab River is one of the modern geological features in the Middle East, which arose because of the continuous retreat of the coastline. At the beginning of the Holocene, about 12,000 BP, the Euphrates and Tigris Rivers flowed through a marshy area and emptied separately into the Arabian Sea at the Strait of Hormuz [81]. The maximum transgression, at about 6000 BP, extended about 400 km inland from the current coastline. After 6000 years ago, the Shatt Al-Arab delta extended southward to its present location [82]. Eventually, large amounts of alluvial sediment carried by the Tigris and Euphrates Rivers returned the coastline to its present location, although these two rivers continued to drain separately into the gulf. Since before 2000 BP, the Tigris and Euphrates Rivers have been draining into separate streams in the gulf. From 1500 BP on, the Shatt Al-Arab River actually existed [83]. Thus, Shatt Al-Arab’s tributaries are the Tigris, Euphrates, Karun, and Karkheh Rivers [8]. Such tributaries historically contributed to 35%, 24%, 33%, and 8%, respectively, to the river’s discharge [4]. Nonetheless, the Euphrates supplies to the Shatt Al-Arab have significantly declined following the construction of the submersible dam in the Khinzeera area, around 13 km west of Qurna. In addition, the Karun course was diverted to Iranian territories so that it empties directly into the gulf through a channel along the eastern side of the Shatt Al-Arab. Thus, the Karun is no longer of significant supply to the Shatt Al-Arab. Likewise, the Swaib supply has also decreased [84]. Thus, Shatt Al-Arab discharge has enormously declined. Presently, the river is primarily reliant on the Tigris River influx [8,85]. The Shatt Al-Arab discharge at the Maqal city, northern Basra city, reached 919, 758, 334, 682, 724, 626, 151, 300, 312, 246, 60, and 55 m3 s−1 for the years 1978, 1987, 1990, 1994, 1995, 1998, 2001, 2006, 2007, 2008, 2014, and 2017, respectively [86].
The sediments in the area consist mainly of clay and silt with sabkha [87]. Such sediments were originally brought by the Tigris, Euphrates, and Karun Rivers and formed a delta that gradually pushed the coastline towards the southeast to its current position [88]. The river’s depth ranges between 8 and 15 m, taking the tide into consideration [26]. The river’s floodplain is characterized by its flat nature, with an elevation of three meters and zero meters above sea level at the river’s source and mouth, respectively [89]. The width of the river varies along its course from 200 to 500 to 800 m at its origin, near Basra city, and at its mouth, respectively. The hydrological conditions of the river’s basin are influenced by a number of parameters. These parameters include the conditions of the feeding rivers, the seepage of groundwater into the river, the influence of prevailing climate variations in the region, and the tide state [90]. The Shatt al-Arab part situated in Iraq has a hot and dry climate. The summer is exceedingly hot, with average daytime temperatures in the shade reaching approximately 43 °C and dropping at night to approximately 26 °C. During winter, the region is cold, and the average temperature is 18 °C and 2 °C during the day and night, respectively [1]. The annual rainfall rates range from 200 mm in the eastern part of the delta to about 100 mm in the west [91]. The river’s estuary undergoes a tidal cycle every 12 h with flood and ebb tides. Moreover, the biggest total tide of 3 m occurs during spring tide, and the smallest total tide of 1 m occurs during neap tide. Salinity levels fluctuate depending on the tide cycles and freshwater discharge. Salinity intrusion increases during the spring and flood tides and regresses during the neap and ebb tides [92,93].
4. Results
4.1. Spatio-Temporal Patterns of Salinity and Water Quality
During the fall season, TDS readings exhibited a relatively small increase along the first 86 km of the river (i.e., TDS changes from 1170 ppm to 9870 ppm, with an increment of 8700 ppm in 86 km) (Figure 3). From 86 km to 103 km of the river course, TDS sharply increases from 9870 ppm to 24,280 ppm, with an increment of 14,410 ppm in only 17 km (Table S1, Figure 3). On the other hand, during the winter, spring, and summer seasons, there were flat lines with low TDS values along the river course until 183 km, followed by a slight TDS increase towards the gulf. Remarkably, at a distance of 126 km, there were slight declines in TDS. Such declines were at 20 km downstream of the convergence of the Karun River and the Shatt Al-Arab (Figure 2 and Figure 3).
Figure 3.
Total dissolved solids (TDS) distribution along the Shatt Al-Arab River at 25 sites during four seasons.
WQI results showed that during the fall season, there was a sharp WQI increase at site 9. This increase continued to rise until the mouth of the river. The winter season exhibited the lowest WQI values that were nearly consistent throughout the river course. The spring and summer seasons displayed a similar trend to winter, though they experienced relatively higher WQI levels. WQI in 5, 23, 25, and 4 sites in the fall, winter, spring, and summer, respectively, was considered excellent to good (Figure 4, Table 2). WQI in 3, 2, and 20 sites in the fall, winter, and summer, respectively, was considered poor to very poor (Figure 4, Table 2). WQI in 17 sites in the fall and 1 site in the summer was considered unsuitable (Figure 4, Table 2).
Figure 4.
WQI distribution along the Shatt Al-Arab River at 25 sites during four seasons.
4.2. Rainfall–Runoff Influence on Salinity and Water Quality
The SCS-CN model revealed that runoff started to generate at the end of October and continued until the end of April with an average of 0.2 mm day−1 (Figure 5). The rainfall and runoff depth time series displays a synchronized and seasonal hydrological regime in the catchments feeding the Shatt Al-Arab River. During the driest period (August to October), there is almost no rainfall and runoff, indicating substantial water scarcity and high evapotranspiration levels. A gradual rainfall and runoff increase occurred in November, characterized by high-intensity rainfall events with the highest rainfall rate of 16 mm day−1 in early February. The rainfall pulses are reflected in the runoff response. Yet, an abstraction gap is available between rainfall and runoff pulses, where peak runoff depths were evidently less than rainfall depths. Such an abstraction gap is due to the rainfall part intercepted by vegetation, stored in surface depressions, infiltrating into the soil, and lost owing to evapotranspiration [68,94]. The analysis indicated that both rainfall and runoff displayed strong (r2 = 0.99) significant (p < 0.05) negative correlations with salt wedge extension (Figure 6). Salt wedge extension was highest in the fall (109 km), followed by summer (68 km), spring (9 km), and winter (8 km). Rainfall and runoff followed an inverse trend, that is, they were highest in the winter (76.8 and 12.4 mm month−1), followed by spring (74.8 and 11.8 mm month−1), summer (10.8 and 0.47 mm month−1), and fall (6.5 and 0.14 mm month−1) (Table 4). The salt wedge extension decreased steeply with rainfall, following the power-law model:
Figure 5.
Rainfall and runoff of the watersheds of the rivers that feed the Shatt Al-Arab.
Figure 6.
Cumulative rainfall (mm month−1) for the last three months prior to the sampling time for four times (four seasons) versus salt wedge extension (km) upstream of the Shatt Al-Arab. Cumulative runoff (mm month−1) for the last three months prior to the sampling time for four times (four seasons) versus salt wedge extension (km) upstream of the Shatt Al-Arab.
Table 4.
Seasonal variations in rainfall depth, runoff depth, salt wedge extension, median WQI, runoff coefficient, and standard deviation of WQI.
Compared with the rainfall relationship, the salt wedge extension decreased less steeply with runoff, following the power-law model:
Similarly, rainfall and runoff displayed strong (r2 = 0.86 and 0.90, respectively) significant (p < 0.05) negative correlations with median WQI (Figure 7). Median WQI was highest in the fall (250), followed by summer (72), spring (34), and winter (22) (Table 4). In other words, water quality was worst in the fall and best in the winter. Rainfall and runoff followed an opposite trend, that is, they were highest in the winter (76.8 and 12.4 mm month−1), followed by spring (74.8 and 11.8 mm month−1), summer (10.8 and 0.47 mm month−1), and fall (6.5 and 0.14 mm month−1). Median WQI decreased steeply with rainfall, following the power-law model:
Figure 7.
Cumulative rainfall (mm month−1) for the last three months prior to the sampling time for four times (four seasons) versus median WQI in the Shatt Al-Arab. Cumulative runoff (mm month−1) for the last three months prior to the sampling time for four times (four seasons) versus median WQI in the Shatt Al-Arab.
Compared with the rainfall relationship, median WQI decreased less steeply with runoff, following the power-law model:
Median WQI displayed an even stronger (r2 = 0.93) significant (p < 0.05) negative relationship with the runoff coefficient (Figure 8). Median WQI was highest in the fall (250), followed by summer (72), spring (34), and winter (22). The runoff coefficient followed an inverse trend, that is, it was highest in the winter (0.161), followed by spring (0.157), summer (0.044), and fall (0.021) (Table 4). Median WQI decreased steeply with increasing runoff coefficient, following the power-law model:
Figure 8.
Average runoff coefficient for the last three months prior to the sampling time for four times (four seasons) versus median WQI in the Shatt Al-Arab.
There was also a strong (r2 = 0.87) significant (p < 0.05) negative correlation between the runoff coefficient and the standard deviation of WQI (Figure 9; Table 4), which indicated that seasons with higher runoff coefficients experienced more WQI consistency.
Figure 9.
Average runoff coefficient for the last three months prior to the sampling time for four times (four seasons) versus standard deviation of WQI in the Shatt Al-Arab.
4.3. Natural and Anthropogenic Impacts on Water Quality Variability
The criteria of principal component analysis performed to identify the element agglomeration and sourcing (i.e., natural or anthropogenic) were achieved. More specifically, the criteria of three tests (i.e., Kolmogorov–Smirnov, KMO, and Bartlett) required to perform PCA were all met. First, all of the variables under investigation showed a log-normal distribution, according to the Kolmogorov–Smirnov test, with a 95% confidence level or more. Such a confidence level indicated that the examined data do not significantly deviate from the specified distribution (i.e., log-normal). Second, the KMO test values were higher than 0.5. Third, since the present study’s significance level is 0 (< 0.05), which suggests that the correlations among variables are significant. Bartlett’s test showed that the null hypothesis is rejected [95]. For the fall season, PCA and FA extracted four varifactors (Figure 10). VF1 explained approximately 39% of the total variance and was dominated by Ca, K, Li, Mg, Na, Sr, TDS, and B. VF2 interpreted 31% of the total variance and around 70% of the cumulative variance and was dominated by Al, Co, Cr, Ni, V, Mn, and Fe. VF3 interpreted 14% of the total variance and around 84% of the cumulative variance and was dominated by Cd, Cu, Pb, and Zn. VF4 interpreted 8% of the total variance and around 92% of the cumulative variance, and was dominated by Ba, As, and a negative loading of pH. For the winter season, PCA and FA extracted four varifactors. VF1 interpreted approximately 55% of the overall variance and was dominated by Ba, Cr, K, Co, Li, Mg, Na, Ni, and V. VF2 interpreted 12% of the overall variance and around 67% of the cumulative variance and was dominated by Ca, Sr, and a negative loading of Cd. VF3 interpreted 9% of the overall variance and around 77% of the cumulative variance and was dominated by Al and a negative loading of pH. VF4 explained 8% of the total variance and around 84% of the cumulative variance and was dominated by TDS. For the spring season, PCA and FA extracted five varifactors. VF1 explained approximately 36% of the overall variance and was dominated by Ba, Ca, Co, Li, Sr, V, As, and B. VF2 interpreted 16% of the variance and around 52% of the cumulative variance and was dominated by Cd, K, Mg, Na, and TDS. VF3 interpreted 9% of the overall variance and around 61% of the cumulative variance and was dominated by Al and Zn. VF4 interpreted 8% of the total variance and around 69% of the cumulative variance and was dominated by Cr and Ni. VF5 interpreted 7.5% of the overall variance and around 77% of the cumulative variance and was dominated by pH and Fe. For the summer season, PCA and FA extracted four varifactors. VF1 explained approximately 29% of the overall variance and was dominated by Al, Ba, Cr, Ni, and a negative loading of V. VF2 interpreted 25% of the total variance and around 54% of the cumulative variance and was dominated by Ca, Li, Sr, As, and B. VF3 interpreted 17% of the overall variance and around 71% of the cumulative variance and was dominated by K, Mg, Na, and Zn. VF4 interpreted 9% of the overall variance and around 80% of the cumulative variance and was dominated by Co, Fe, a negative loading of TDS, and a negative loading of pH.
Figure 10.
Principal component analysis followed by factor analysis for the water samples of the Shatt Al-Arab River for four seasons.
5. Discussion
5.1. Spatio-Temporal Dynamics of Salinity and Water Quality
The rivers that feed the Shatt Al-Arab (i.e., Tigris, Euphrates, Karun, and Karkheh) have their lowest discharge during the fall months (August, September, and October) (Figure 11). Then, these rivers’ discharge starts to increase, reaching its maximum levels in April (the Euphrates’ highest discharge is in mid-June). Lower discharge during the fall season hampers the river’s capacity to offset tidal power, allowing salt wedge to move further upstream. This phenomenon is typical for estuarine systems worldwide, where low discharge promotes seawater intrusion due to faded hydraulic gradients [96,97]. Therefore, the sharp TDS increase at site 19 (at river length of 90 km) during the fall season can be attributed to salt wedge extension (Figure 3). In other words, the tide is the main driver that controls seawater invasion into the river’s delta during the dry season. During the other three seasons, the higher river discharge pushes the salt wedge further seaward. In these seasons, the discharge force overpowers the tidal force, pushing the salt wedge towards the sea [98,99]. Such dynamics show how freshwater discharge regulates estuarine river transitions, a well-reported phenomenon in global research dealing with salinity propagation under fluctuating hydrologic systems [100,101]. The unusual declines in TDS at a distance of 126 km, 20 km downstream of the confluence of the Karun River and the Shatt Al-Arab, can be attributed to the fresh water supplied by the Karun. Al-Asadi et al. [11] detected that the discharge of the Karun River dilutes the concentration of salts and limits the penetration of seawater in the Shatt Al-Arab. Similar trends of salinity intrusion have been detected in the Shatt al-Arab River and in other estuarine rivers in arid regions during periods of low discharge [92,102]. However, such intrusion levels were lower than those recorded in the present study, particularly in fall, which indicates a substantial increase in salinization pressure downstream of the river. The seasonality effect is clear when comparing fall with other seasons. While TDS decreases significantly in winter, spring, and summer, its values in these three seasons are consistent along the river course due to increased water discharge and increased dilution capacity. Conversely, the sharp rise in TDS levels in fall is due to limited inflow and a greater tidal influence. The spatial identification of a transition zone of 85–100 km provides a deeper understanding of the critical salt intrusion stage, which was not evident in previous studies that were based on limited sampling points.
Figure 11.
Average monthly discharge (m3 s−1) for the four rivers feeding the Shatt Al-Arab. Note: From [13].
Likewise, higher WQI levels in the dry seasons (i.e., fall and to some extent summer) can be attributed to the declining dilution associated with lower flows. On the other hand, during periods of high river discharge, the concentration of pollutants may decrease due to dilution [103]. Similar findings have been detected by many researchers who found that pollutant concentrations are negatively correlated with discharge (e.g., [92,104,105]). High WQI levels downstream during the fall season (>300) imply that salinity is a major factor contributing to water quality deterioration in the lower reaches of the river. This downstream decline in water quality has also been documented in other basins (e.g., [106,107]). By combining intensive spatial sampling with runoff estimation during four seasons, this study exhibits the spatio-temporal interaction that exacerbates water quality deterioration. This integrated approach provides an effective tool for identifying the most susceptible parts along the river, thus enabling better-targeted management strategies to address increasing hydrological pressures in this region.
5.2. Rainfall–Runoff Impact on Salinity and Water Quality
Seasonal variations in hydrological parameters such as rainfall, surface runoff, and discharge drive seawater intrusion and water quality status along the Shatt Al-Arab River course. The strong negative correlations that rainfall and runoff exhibited with salt wedge extension indicate that freshwater discharge highly controls salinity intrusion in the river. The steeper exponent correlation that rainfall exhibited with salt wedge extension (exponent of approximately −1.0) compared to the gentle exponent correlation that runoff displayed with salt wedge extension (exponent of approximately −0.6) demonstrates that the system is more sensitive to reductions in rainfall than reductions in runoff. Such behavior can be attributed to the fact that rainfall affects river hydrology in various ways. Rainfall can produce surface flow, interflow, baseflow, and river discharge. Such pathways can combine to generate a considerable freshwater source that pushes the salt wedge towards the sea. In contrast, runoff merely represents surface flow. These findings are consistent with other estuarine-affected rivers worldwide where declined freshwater discharge promotes tide-salinity propagation [108,109,110]. Such consistency emphasizes that the hydrological processes discerned in the Shatt Al-Arab River are a generalizable behavior rather than an isolated phenomenon. The climate-driven rainfall reduction projected in numerous scenarios (e.g., [111,112,113]) can intensify salinity propagation in estuarine rivers worldwide. Hence, the rainfall, runoff, and salt wedge extension interaction detected in the current study is of global applicability.
Furthermore, the strong inverse power-law relationships that link rainfall and runoff with WQI in the Shatt Al-Arab indicate that even a gentle decline in rainfall or runoff can promote water quality deterioration. During the dry seasons (fall and summer), high WQI suggests high contamination. In such dry periods, land-based contamination from urban and agriculture areas declines due to minimal runoff. As such, non-point source pollution substantially decreases, giving way to point source pollution originating from industrial discharge, wastewater effluent, and seawater intrusion. Low discharge levels in dry seasons lead to contaminant buildup and concentration rise. In wet seasons, higher rainfall and runoff reduce WQI primarily through dilution. Elevated runoff across residential, industrial, and agricultural areas transports non-point source pollutants such as urban contaminants, fertilizers, pesticides, and eroded soil [114,115]. However, high discharge can dilute pollutants. In other words, while the total amount of pollutants may increase, the concentration per unit of water may decrease. This is the case in the current study, that is, the dilution impact overcomes the higher flushing influence in the wet season. The results are consistent with other studies (e.g., [116,117,118]) that concluded that low water quality in dry seasons improves in wet seasons due to runoff dilution.
The steeper decrease in median WQI with rainfall (exponent of approximately −0.77) compared to that with runoff (exponent of approximately −0.44) (Figure 7) is due to the fact that rainfall produces surface flow, interflow, baseflow, and discharge enhancement. Such pathways can combine to generate a considerable freshwater source that improves water quality through the dilution of salts and pollutants. On the other hand, runoff only represents surface flow. These findings emphasize the role of rainfall and runoff in regulating water quality dynamics in coastal rivers. Furthermore, under climate change scenarios that point out increasing droughts and rainfall shortages, the situation of the Shatt al-Arab and analogous estuarine-influenced rivers will be critical. Such climate changes will cause increased pollution in rivers and seawater propagation upstream.
The inverse correlations that runoff coefficient displayed with both median WQI and the spatial variability of WQI (Figure 8 and Figure 9) demonstrate how water quality dynamics are driven by hydrological controls. During periods of low runoff coefficient (fall and summer), the dilution process is weak due to the scarcity of fresh water entering the river. This will lead to the accumulation of pollutants at specific hotspots, which will raise contaminant levels and increase the spatial heterogeneity of these contaminants. Conversely, during periods of high runoff coefficient (winter and spring), higher runoff creates higher discharge that dilutes contaminants and produces better mixing, resulting in better water quality and lower WQI heterogeneity. These findings reveal that not only rainfall but also the watershed’s efficiency to produce runoff manipulates the pollution level and its spatial variability. In fact, Figure 9 advocates that there should be more monitoring stations in the dry season to capture WQI variability. On the other hand, the wet seasons experience more WQI consistency and thus require fewer monitoring stations and less financial costs. Finally, understanding the aforementioned processes provides a feasible tool for predicting the spatio-temporal distribution of contamination, designing monitoring programs, and implementing water quality strategies under projected climate change. It is also noteworthy that the correlations detected in the present study that link rainfall, runoff, and the runoff coefficient with salt wedge extension and WQI (Figure 6, Figure 7 and Figure 8) can be utilized to predict salt wedge extension and WQI by means of rainfall and runoff data.
5.3. Natural and Anthropogenic Controls on Water Quality Variability
For pattern identification, categorization, and decreasing data dimensionality, multivariate statistical techniques such as PCA and FA are often used [119,120,121]. In the present study, PCA and FA were performed on normalized data groups for the four seasons. For the fall season, the elements in VF1 (i.e., Ca, K, Li, Mg, Na, Sr, TDS, and B) exhibited an increasing trend towards the gulf. These elements account for more than 99% of the dissolved solids in the oceans [122] and can be ascribed to seawater intrusion. The elements in VF2 showed relatively high concentrations in the river’s upper and middle reaches and then exhibited a gradual decrease towards the gulf (Table S1). Such elements (i.e., Al, Co, Cr, Ni, V, Mn, and Fe) are most likely related to anthropogenic sources. Co, Ni, V, Mn, and Fe are linked to densely industrialized and urbanized zones that surround the Shatt Al-Arab course in these reaches. These metropolitan areas create considerable amounts of pollution, such as industrial discharge and urban effluents [123]. Aluminum is used in various industries such as metallurgical, construction, and chemical and electrical manufacturing [124]. Main anthropomorphic sources of Cr are alloy production, cement production, sewage sludge, and municipal waste burning [125]. VF3 elements (i.e., Cd, Cu, Zn and Pb) displayed high concentrations in sites 10 and 19 that represent industrial centers with metal welding factories, and thus can be linked to industrial effluents [125]. The correlation of As and Ba with pH in VF4 is because pH can influence As and Ba speciation in water and govern their existence in free-ionic or compound form [126,127]. The As and Ba concentrations in the current study are within their regular levels in global natural water. Moreover, they do not exhibit any association with urban and industrial zones around the river course. Therefore, these elements can be attributed to geologic sourcing [124,128]. For the winter season, VF1 encompassing Na, Mg, K, Ba, Co, Cr, Li, and Ni can be credited to anthropogenic sources. Yet, their low concentration levels are due to the dilution influence in this rainy season. Elements in VF2 (i.e., Ca, Sr, and Cd) that showed an increasing trend towards the gulf indicated the effect of seawater. Aluminum is inversely correlated with pH in VF3 and displayed levels that are much less than those reported by Al-Tawash et al. [7] and can be attributed to natural sourcing. Aluminum displayed decreasing concentrations near the gulf, while pH exhibited increasing levels near the gulf. As pH increases, aluminum tends to precipitate out of solutions [129]. TDS in VF4 displayed a sudden increasing level at the river’s mouth and can be ascribed to seawater impact. For the spring season, elements in VF1 (i.e., V, Co, Li, B, Ca, Sr, As, and Ba) have high levels in the middle reaches of the river where the urban centers concentrated and can be considered of anthropogenic sourcing [123]. Elements in VF2 including Na, Mg, Cd, K, and TDS can be attributed to natural sourcing as they are within low levels and are not linked to any specific activities around the river course. The Al and Zn in VF3 are related to anthropogenic sourcing. Yet, the general low level of these metals refers to the dilution influence in this season. VF4 elements (i.e., Ni and Cr) can be credited to anthropogenic sources. The iron is combined with pH in VF5 because iron solubility in water is influenced by pH [130]. For the summer season, Al, V, Cr, Ba, and Ni in VF1 exhibited relatively high levels at the river source in sites 1, 2, and 3. These elements can be ascribed to the oil industry [131], as the Qurna oil field is situated near the river’s source [132]. Li, B, Ca, As, and Sr in VF2 displayed elevated levels in the middle reaches of the river that are surrounded by heavily urbanized and industrialized areas and can be from industrial sources [133,134,135,136]. The VF3 components (i.e., Na, Mg, K, and Zn) that exhibited high levels in the very lower reaches of the river can be ascribed to seawater influence [122]. Likewise, VF4 elements (i.e., TDS, pH, Fe, and Co) can be attributed to the seawater intrusion. TDS and pH displayed relatively higher levels in the lower reaches and had inverse relationships with Fe and Co. The negative correlation between TDS and Fe is attributed to the fact that Fe agglomerates to form colloids when river water mixes with seawater [137,138]. Daneshvar [139] found that Fe levels in the River Esk and the River Irt decrease once they mix with estuary water. Fe and pH’s inverse correlation is due to the fact that iron becomes more soluble with a lower pH level [140,141]. Likewise, the inverse relationship between cobalt and salinity can be ascribed to rivers representing major sources of cobalt in the ocean [142]. The negative correlation between cobalt and pH is due to the fact that at lower pH levels, Co tends to be more soluble [143,144].
During the wetter seasons (winter and spring), high rainfall, runoff, and discharge levels lead to considerable dilution. Higher water volumes in the river course during these periods reduce the residence time of pollutants, increase mixing capability, and eventually produce more homogenous water quality along the river path. In other words, pollutants originating from residential, industrial, and agricultural areas get rapidly flushed, well mixed, and become less pronounced. For instance, elements in VF1 in the winter season and VF3 in the spring season are often linked to anthropogenic sourcing, yet they display uniform concentration along the river course (Table S1). Therefore, low and homogeneous concentrations in wet seasons do not mean the absence of contamination, rather they demonstrate the dominance of high dilution capacity that suppresses the signature of pollution hotspots.
5.4. Sources of Uncertainty
5.4.1. Uncertainties Associated with Data Analysis
The first source of uncertainty is related to sample dilution. Sample dilution makes the concentration measured by the ICP-MS lower (sometimes less than the detection limits of the device). Therefore, some elements were not detected by the device due to the low concentration levels (Table S1). Second, relative standard deviation should be less than 20% to represent reasonable precision [145]. While, most major ions (e.g., Li, B, Na, Mg, K, Ca, V, Ni, Sr, Ba, and Pb) exhibited excellent precision, with mean relative standard deviation values between 1 and 20%, other elements (e.g., Al, Cr, Mn, Fe, Co, Cu, Zn, As, Cd, and Te) displayed mean relative standard deviation values of more than 20%, reflecting low precision (Table S1).
5.4.2. Uncertainties Associated with Modeling
The observed regressions (Figure 6 and Figure 7) rely on a small sampling size, which limits the robustness of the analysis. The regressions’ primary goal was to display the negative relationships linking rainfall and runoff with both salt wedge extension and WQI rather than to establish a generalized predictive model. These negative relationships are consistent with the expected hydrodynamic response to increased freshwater inflow, which restricts seawater propagation and enhances water quality through dilution. These findings can serve as a reference point for future seasonal monitoring work. Future programs can include a larger sampling size (more sampling campaigns per year over multiple years), which would allow the development of a statistically robust predictive model for water pollution status and salt wedge propagation. Moreover, the PCA, which explained a considerable part of the total variance, still contained several sources of uncertainty. First, Yong and Pearce [146] stated that high communality (≥0.70) demonstrates that the obtained factors explain a significant percentage of the variance of a certain element. However, some communalities were less than 0.70. For example, Cd in the fall has a communality of 0.58; Co, Cd, and pH in the winter have communalities of 0.70, 0.63, and 0.61, respectively; Al, Co, and Ba in the spring have communalities of 0.61, 0.63, and 0.60, respectively; and pH, Fe, and Co in the summer have communalities of 0.41, 0.48, and 0.55, respectively. Such low communalities indicate that the obtained components did not significantly capture their variability (Table S1). Second, several elements exhibited cross-loadings on multiple components (e.g., Ba, Zn, Na), indicating multiple sources. A cross-loading happens when an element exhibits a loading >0.30 on two or more components. For instance, V and As in the fall; Zn and Cd in the spring; and B and Zn in the summer load significantly on one component, but also appreciably on two other components (Table S1). Third, there is a noticeable difference between the rotated and unrotated factor patterns which demonstrates that the model is affected by rotation and thus results in inaccuracy in identifying source groups (Table S1). Finally, approximately 8%, 6%, 23% and 20% of the variance for the fall, winter, spring, and summer, respectively, remained unexplained by the obtained components. Such remaining unexplained percentages indicate that the model did not fully describe the natural variability and processes (Table S1; Figure 10).
5.5. SWOT Matrix
The strengths, weaknesses, opportunities, and threats (SWOT) matrix (Table 5) indicates that the study’s main strength stems from the integrated framework that combine GIS-RS-based hydrological modeling with physicochemical indicators to create process-based linkages between freshwater discharge and pollution levels and distribution patterns. However, small temporal sampling size and lack of interannual monitoring can limit the robustness of the derived relationships. Yet, integrating higher monitoring frequency with nonlinear predictive tools opens new avenues for future work. On the other hand, external stains such as upstream flow regulation, climate-driven runoff variability, sea level rise, and the high costs associated with establishing monitoring plans reveal the vulnerability of a such estuarine river system and restrict efforts toward solid modeling. Nonetheless, the current study offers a preliminary step toward a more coherent and reliable hydrological modeling.
Table 5.
SWOT matrix displays strengths, weaknesses, opportunities, and threats of the study.
Finally, the outcomes of the current analysis exceed the Shatt al-Arab system, as many estuarine ecosystems around the world face similar risks of water quality degradation. This is primarily owing to declining freshwater flow, upstream flow regulations, and climate change influence on hydroclimatic patterns. Remote sensing-based evaluation methods offer practical and widely applicable tools for assessing water quality and salinity dynamics, suitable for data-scares regions. Future work can combine such tools with hydrodynamic models to evaluate long-term water quality scenarios. Such prospective work can assist in the development of adaptive water resource management strategies under rapidly shifting hydroclimatic conditions.
6. Conclusions
This study aims to enhance our understanding of the dynamics of the salt wedge and water quality changes in the Shatt al-Arab by quantitatively linking rainfall and surface runoff, obtained using remote sensing techniques via the Google Earth Engine (GEE) platform, with the salt wedge propagation and fluctuations in the water quality index (WQI). Unlike previous studies that often relied on limited field observations and local hydrological data, this research applies exploratory regression that reflects a preliminary relationship consistent with the expected hydrodynamic response to changes in the dynamics of the saline wedge caused by freshwater inflow. The significance of this work lies in the integration of three key areas: (1) estimating rainfall and surface runoff using cloud-based remote sensing techniques, (2) providing fundamental quantitative relationships that serve as a reference point for future seasonal monitoring efforts, and (3) conducting multivariate water quality analysis using principal component analysis (PCA) within a comprehensive analytical framework. The results demonstrate that seasonal variations in hydrological factors play a crucial role in controlling salinity intrusion and water quality degradation. During wet seasons, high rainfall and runoff levels reduce contaminant concentrations, enhancing water quality and reducing salt wedge extension. On the other hand, during dry seasons, low rainfall and runoff levels promote high contaminant concentrations and high salt wedge propagation. Quantitatively, rainfall and runoff are (76.8 mm month−1) and (12.38 mm month−1), respectively, in the wet season, compared to (6.51 mm month−1) and (0.14 mm month−1) in the dry season, while WQI is 22 and salt wedge extension is 8 km in the wet season, compared to a WQI of 250 and a salt wedge extension of 109 km in the dry season. Statistical analysis assisted in reducing the dimensionality in water quality data by selecting the principal components that gathered most of the variance in the data. In general, four components were able to explain the variance in the data for each season. Such components indicated that some investigated elements were of natural sourcing, while others were of anthropogenic origin. The strong (r2 = 0.87) significant (p < 0.05) negative correlation detected between the runoff coefficient (an indicator of catchment wetness) and the standard deviation of WQI implies that hydrological flushing fosters water quality stability. The stability of water quality during wet periods can result in more efficient monitoring programs. In other words, the number of sampling sites and related expenses can be less for periods of hydrological stability. Furthermore, leveraging the relationship between runoff, measured using remote sensing methods, and salinity intrusion can enhance early warning systems and support seasonal water resource allocation planning, particularly in transboundary river systems lacking sufficient data. Finally, beyond the Shatt al-Arab region, this study has large-scale applicability to other estuarine rivers experiencing increasing salinity intrusion due to climate change and upstream flow reduction. Thus, the present analysis not only provides specific understanding for the study site but also serves as a comprehensive and replicable analytical framework, promoting the integration of remote sensing techniques with hydro-ecological assessments in estuary studies. Permission to reproduce material from other sources: The map in Figure 2 was obtained from our previous paper [147].
Supplementary Materials
The following supporting information can be downloaded at: https://www.mdpi.com/article/10.3390/geographies6010030/s1, Table S1: Element concentrations in the Shatt Al-Arab River at 25 sites during Fall 2018, Winter 2019, Spring 2019, and Summer 2019.
Author Contributions
H.A. and C.O. contributed to the study conception and design. Material preparation, data collection and analysis were performed by H.A. and C.O. The first draft of the manuscript was written by H.A. and C.O. H.A., C.O. and A.J.A.-N. contributed to revising the manuscript and preparing the updated version of it. All authors have read and agreed to the published version of the manuscript.
Funding
No funding was received for conducting this study. Open access funding provided by the Open Access Publishing Fund of Philipps-Universität Marburg.
Institutional Review Board Statement
Not applicable.
Informed Consent Statement
Not applicable.
Data Availability Statement
The data presented in this study are available on request from the corresponding author because they are part of an ongoing study.
Conflicts of Interest
The authors declare no conflicts of interest.
References
- Hussein, N.; Al-Najjar, H.; Al-Saad, H.; Youssef, O.; Al-Sabonji, A. Shatt Al-Arab: Basic Scientific Studies; Marine Science Center, University of Basra: Basra, Iraq, 1991. [Google Scholar]
- Sheppard, C.; Price, A.; Roberts, C. Marine Ecology of the Arabian Region: Patterns and Processes in Extreme Tropical Environments; Academic Press: Toronto, ON, Canada, 1992. [Google Scholar]
- Mohamed, A.; Abood, A. Ecological health assessment of the Shatt Al-Arab River, Iraq. IOSR J. Agric. Vet. Sci. 2017, 10, 1–8. [Google Scholar]
- United Nations Economic and Social Commission for Western Asia. Bundesanstalt für Geowissenschaften und Rohstoffe. In Inventory of Shared Water Resources in Western Asia; UN-ESCWA: Beirut, Lebanon; BGR: Hannover, Germany, 2013. [Google Scholar]
- Al-Saad, H.T.; Salman, N.A. Status of Oil Pollution in the Arabian Gulf and Shatt Al-Arab Estuary: A Review. In Coastal Environments: Focus on Asian Regions; Subramanian, V., Ed.; Springer: Dordrecht, The Netherlands, 2012. [Google Scholar] [CrossRef] [Scilit]
- Moyel, M.; Hussain, N. Water quality assessment of the Shatt Al-Arab River, Southern Iraq. J. Coast. Life Med. 2015, 3, 459–465. [Google Scholar] [CrossRef] [Scilit]
- Al-Tawash, B.; Al-Lafta, H.; Merkel, B. Preliminary assessment of Shatt Al-Arab riverine environment, Basra Governorate, Southern Iraq. J. Nat. Sci. Res. 2013, 3, 120–136. [Google Scholar]
- Al-Asadi, S.A.R. The future of freshwater in Shatt Al-Arab River (Southern Iraq). J. Geogr. Geol. 2017, 9, 24–38. [Google Scholar] [CrossRef] [Scilit]
- Al-Gburi, H.; Al-Tawash, B.; Al-Lafta, H. Environmental assessment of Al-Hammar Marsh, Southern Iraq. Heliyon 2017, 3, e00256. [Google Scholar] [CrossRef] [Scilit]
- Maltby, E. (Ed.) An Environmental and Ecological Study of the Marshlands of Mesopotamia. In Draft Consultative Bulletin; Wetland Ecosystems Research Group, University of Exeter: Exeter, UK; AMAR Appeal Trust: London, UK, 1994. [Google Scholar]
- Al-Asadi, S.; Alhello, A.; Ghalib, H.; Muttashar, R.; Al-Eydawi, H. Seawater intrusion into Shatt Al-Arab River, Northwest Arabian/Persian Gulf. J. Appl. Water Eng. Res. 2022, 11, 289–302. [Google Scholar] [CrossRef] [Scilit]
- Rahi, K.A. Salinity management in the Shatt Al-Arab River. Int. J. Eng. Technol. 2018, 7, 128–133. [Google Scholar] [CrossRef] [Scilit]
- Al-Darraji, J.; Alshami, I.; Ankush, M. Effect of some heavy metals in the industrial flows on Shatt al-Arab River. Egypt. J. Aquat. Biol. Fish. 2023, 27, 801–814. [Google Scholar] [CrossRef] [Scilit]
- Hart, B.T.; Bailey, P.; Edwards, R.; Hortle, K.; James, K.; McMahon, A.; Meredith, C.; Swadling, K. A review of the salt sensitivity of the Australian freshwater biota. Hydrobiologia 1991, 210, 105–144. [Google Scholar] [CrossRef] [Scilit]
- Nielsen, D.L.; Brock, M.A.; Rees, G.N.; Baldwin, D.S. Effects of increasing salinity on freshwater ecosystems in Australia. Aust. J. Bot. 2003, 51, 655–665. [Google Scholar] [CrossRef] [Scilit]
- Cañedo-Argüelles, M.; Kefford, B.J.; Piscart, C.; Prat, N.; Schäfer, R.B.; Schulz, C.J. Salinisation of rivers: An urgent ecological issue. Environ. Pollut. 2013, 173, 157–167. [Google Scholar] [CrossRef] [Scilit]
- Zhong, M.; Liu, S.; Li, K.; Jiang, H.; Jiang, T.; Tang, G. Modeling spatial patterns of dissolved oxygen and the impact mechanisms in a cascade river. Front. Environ. Sci. 2021, 9, 781646. [Google Scholar] [CrossRef] [Scilit]
- Haddout, S.; Priya, K.L.; Hoguane, A.M.; Casila, J.C.C.; Ljubenkov, I. Relationship of salinity, temperature, pH, and transparency to dissolved oxygen in the Bouregreg Estuary (Morocco): First results. Water Pract. Technol. 2022, 17, 2654–2663. [Google Scholar] [CrossRef] [Scilit]
- Romano-Armada, N.; Yañez-Yazlle, M.F.; Irazusta, V.P.; Rajal, V.B.; Moraga, N.B. Potential of bioremediation and plant growth-promoting traits in Streptomyces as strategies for bio-reclamation of salt-affected soils for agriculture. Pathogens 2020, 9, 117. [Google Scholar] [CrossRef] [Scilit]
- Mustafa, G.; Akhtar, M.S.; Abdullah, R. Global concern for salinity on various agro-ecosystems. In Salt Stress, Microbes, and Plant Interactions: Causes and Solutions; Akhtar, M.S., Ed.; Springer: Singapore, 2019; pp. 1–19. [Google Scholar]
- Okuku, E.O.; Peter, H.K. Choose of heavy metals pollution biomonitors: A critique of the method that uses sediments total metals concentration as the benchmark. Int. J. Environ. Res. 2012, 6, 313–322. [Google Scholar]
- Flora, S.J.S.; Mittal, M.; Mehta, A. Heavy metal induced oxidative stress and its possible reversal by chelation therapy. Indian J. Med. Res. 2008, 128, 501–523. [Google Scholar] [PubMed]
- Salem, H.M.; Eweida, E.A.; Farag, A. Heavy metals in drinking water and their environmental impact on human health. In Proceedings of the International Conference for Environmental Hazards Mitigation; ICEHM-2000; Cairo University: Cairo, Egypt, 2000; pp. 542–556. Available online: https://www.virtualacademia.com/pdf/health542_556.pdf (accessed on 6 December 2025).
- Ghosh, L.; Adhikari, S.; Ayyappan, S. Assessment of toxic interactions of heavy metals and their effects on accumulation in tissues of freshwater fish. Res. J. Environ. Toxicol. 2007, 1, 37–44. [Google Scholar] [CrossRef] [Scilit]
- Ayandiran, T.A.; Fawole, O.O.; Adewoye, S.O.; Ogundiran, M.A. Bioconcentration of metals in the body muscle and gut of Clarias gariepinus exposed to sublethal concentrations of soap and detergent effluent. J. Cell Anim. Biol. 2009, 3, 113–118. [Google Scholar]
- Qasim, A. The effect of discharges of Shatt Al-Arab River on the total catch in Iraqi marine waters in the north-west Gulf. J. Kerbala Agric. Sci. 2018, 5, 166–177. [Google Scholar] [CrossRef] [Scilit]
- Whitehead, P.G.; Wilby, R.L.; Battarbee, R.W.; Kernan, M.; Wade, A.J. A review of the potential impacts of climate change on surface water quality. Hydrol. Sci. J. 2009, 54, 101–123. [Google Scholar] [CrossRef] [Scilit]
- Bhurtun, P.; Lesven, L.; Ruckebusch, C.; Halkett, C.; Cornard, J.P.; Billon, G. Understanding the impact of changes in weather conditions on surface water quality. Sci. Total Environ. 2019, 652, 289–297. [Google Scholar] [CrossRef] [Scilit] [PubMed]
- Yunus, A.J.M.; Nakagoshi, N. Effects of seasonality on streamflow and water quality of the Pinang River in Penang Island, Malaysia. Chin. Geogr. Sci. 2004, 14, 153–161. [Google Scholar] [CrossRef] [Scilit]
- Zwolsman, J.J.; van Bokhoven, A.J. Impact of summer droughts on water quality of the Rhine River—A preview of climate change? Water Sci. Technol. 2007, 56, 45–55. [Google Scholar] [CrossRef] [Scilit]
- Jia, Z.; Chang, X.; Duan, T.; Wang, X.; Wei, T.; Li, Y. Water quality responses to rainfall and surrounding land uses in urban lakes. J. Environ. Manag. 2021, 298, 113514. [Google Scholar] [CrossRef] [Scilit]
- Franklin, D.H.; Truman, C.C.; Potter, T.L.; Bosch, D.D.; Strickland, T.C.; Jenkins, M.B.; Nuti, R.C. Nutrient losses in runoff from conventional and no-till pearl millet on pre-wetted Ultisols fertilized with broiler litter. Agric. Water Manag. 2012, 113, 38–44. [Google Scholar] [CrossRef] [Scilit]
- Xu, Z.; Zhang, X.; Xie, J.; Yuan, G.; Tang, X.; Sun, X.; Yu, G. Total nitrogen concentrations in surface water of typical agro- and forest ecosystems in China, 2004–2009. PLoS ONE 2014, 9, e105144. [Google Scholar] [CrossRef] [Scilit]
- Boggs, J.; Sun, G.; McNulty, S. Effects of timber harvest on water quantity and quality in small watersheds in North Carolina. J. For. 2016, 114, 27–40. [Google Scholar] [CrossRef] [Scilit]
- Singh, K.P.; Malik, A.; Mohan, D.; Sinha, S. Multivariate statistical techniques for the evaluation of spatial and temporal variations in water quality of Gomti River (India): A case study. Water Res. 2004, 38, 3980–3992. [Google Scholar] [CrossRef] [Scilit] [PubMed]
- Phlips, E.J.; Badylak, S.; Hart, J.; Haunert, D.; Lockwood, J.; O’Donnell, K.; Sun, D.; Viveros, P.; Yilmaz, M. Climatic influences on autochthonous and allochthonous phytoplankton blooms in a subtropical estuary, St. Lucie Estuary, Florida, USA. Estuaries Coasts 2012, 35, 335–352. [Google Scholar] [CrossRef] [Scilit]
- Ouyang, Y.; Nkedi-Kizza, P.; Wu, Q.T.; Shinde, D.; Huang, C.H. Assessment of seasonal variations in surface water quality. Water Res. 2006, 40, 3800–3810. [Google Scholar] [CrossRef] [Scilit]
- Awadh, S.M.; Al-Sulttani, A.H.; Yaseen, Z.M. Temporal dynamic drought interpretation of Sawa Lake: Case study located at the southern Iraqi region. Nat. Hazards 2022, 112, 619–638. [Google Scholar] [CrossRef] [Scilit]
- Wang, L.; Han, X.; Zhang, Y.; Zhang, Q.; Wan, X.; Liang, T.; Song, H.; Bolan, N.; Shaheen, S.M.; White, J.R.; et al. Impacts of land uses on spatio-temporal variations of seasonal water quality in a regulated river basin, Huai River, China. Sci. Total Environ. 2023, 857, 159584. [Google Scholar] [CrossRef] [Scilit]
- Mahmoodi, N.; Osati, K.; Salajegheh, A.; Saravi, M.M. Trend in river water quality: Tracking the overall impacts of climate change and human activities on water quality in the Dez River Basin. J. Water Health 2021, 19, 159–173. [Google Scholar] [CrossRef] [Scilit]
- Allafta, H.; Opp, C.; Al-Baldawi, B. Rainfall–Surface Runoff Estimation Using SCS-CN Model and Geospatial Techniques: A Case Study of the Shatt Al-Arab Region, Iraq–Iran. Earth 2026, 7, 32. [Google Scholar] [CrossRef] [Scilit]
- Singh, K.P.; Malik, A.; Sinha, S. Water quality assessment and apportionment of pollution sources of Gomti River (India) using multivariate statistical techniques: A case study. Anal. Chim. Acta 2005, 538, 355–374. [Google Scholar] [CrossRef] [Scilit]
- Shiferaw, N.; Kim, J.; Seo, D. Identification of pollutant sources and evaluation of water quality improvement alternatives of a large river. Environ. Sci. Pollut. Res. 2023, 30, 31546–31560. [Google Scholar] [CrossRef] [Scilit] [PubMed]
- Beg, A.A.F.; Awadh, S.M.; Thamer, M.B.; Al-Sulttani, A.H. Assessment of groundwater quality for drinking purposes using water quality index, and identifying the affecting mechanism in Rashdiya, central Iraq. Iraq. Geol. J. 2021, 54, 20–32. [Google Scholar] [CrossRef] [Scilit]
- Li, H.; Ma, H.; Zhang, J.; Chen, X.; Hong, X. Surface water resource accessibility assessment of rural settlements in the Yellow River Basin. Water 2024, 16, 708. [Google Scholar] [CrossRef] [Scilit]
- Allafta, H.; Opp, C.; Kolli, M. Combined impact of land cover, precipitation and catchment area on discharge and phosphorus in the Mississippi basin’s subcatchments. J. Environ. Qual. 2021, 50, 198–214. [Google Scholar] [CrossRef] [Scilit]
- Allafta, H.; Opp, C. Understanding the Combined Effects of Land Cover, Precipitation and Catchment Size on Nitrogen and Discharge—A Case Study of the Mississippi River Basin. Water 2022, 14, 865. [Google Scholar] [CrossRef] [Scilit]
- Sader, W. Transforming Pollution Monitoring in Rivers and Lakes with REAL-Time Sensor Solutions and Streamr. Network. 2023. Available online: https://www.linkedin.com/pulse/transforming-pollution-monitoring-rivers-lakes-real-time-walid-sader (accessed on 6 December 2025).
- Cereja, R.; Brotas, V.; Nunes, S.; Rodrigues, M.; Cruz, J.; Brito, A. Tidal influence on water quality indicators in a mesotidal estuary (Tagus Estuary, Portugal). Ecol. Indic. 2022, 136, 108715. [Google Scholar] [CrossRef] [Scilit]
- Revina, S.; Istiarto, I.; Pratiwi, E. The effect of tides on water salinity and acidity in the main channel of Anjir Serapat Lowland Irrigation Area, Central Kalimantan. In Proceedings of the International Conference on Sustainable Environment, Agriculture and Tourism (ICOSEAT 2022); Atlantis Press: Dordrecht, The Netherlands, 2022. [Google Scholar] [CrossRef] [Scilit]
- Tide-Forecast.com. Tide Times for Basrah. 2024. Available online: https://www.tide-forecast.com/tide/Basrah-Iraq/tide-times (accessed on 26 July 2024).
- Brown, R.M.; McClelland, N.I.; Deininger, R.A.; Tozer, R.G. A water quality index: Do we dare? Water Sew. Work. 1970, 117, 339–343. [Google Scholar]
- World Health Organization (WHO). Guidelines for Drinking-Water Quality, 3rd ed.; Volume 1: Recommendations; WHO: Geneva, Switzerland, 2006.
- Dwivedi, N.; Dwivedi, S.; Adetunji, C.O. Efficacy of Microorganisms in the Removal of Toxic Materials from Industrial Effluents. In Microbial Rejuvenation of Polluted Environment; Microorganisms for Sustainability; Adetunji, C.O., Panpatte, D.G., Jhala, Y.K., Eds.; Springer: Singapore, 2021; Volume 27. [Google Scholar] [CrossRef] [Scilit]
- Environmental Working Group (EWG). Cobalt. In EWG’s Tap Water Database; EWG: Washington, DC, USA, 2024; Available online: https://www.ewg.org/tapwater/contaminant.php?contamcode=1081 (accessed on 6 December 2025).
- Cahilim. İçme ve Kullanma Suyu Analizleri, Containing Annex 3 Chemical LIMITS from 18 October 1997 Resmî Gazete No. 23144. Available online: https://www.cahilim.com/pdf/yemek/icme-ve-kullanma-suyu-analizleri.pdf (accessed on 6 December 2025).
- United States Environmental Protection Agency. Fifth Unregulated Contaminant Monitoring Rule. 2021. Available online: https://www.epa.gov/dwucmr/fifth-unregulated-contaminant-monitoring-rule (accessed on 26 July 2024).
- IQS:417.2001; Drinking Water Standard. Central Organization for Quality Control and Standardization: Baghdad, Iraq, 2001. Available online: https://www.scribd.com/document/340023118/%D8%A7%D9%84%D9%85%D9%88%D8%A7%D8%B5%D9%81%D8%A9-%D8%A7%D9%84%D9%82%D9%8A%D8%A7%D8%B3%D9%8A%D8%A9-%D8%A7%D9%84%D8%B9%D8%B1%D8%A7%D9%82%D9%8A%D8%A9-447-%D9%84%D9%85%D9%8A%D8%A7%D9%87-%D8%A7%D9%84%D8%B4%D8%B1%D8%A8 (accessed on 25 February 2026). (In Arabic)
- Health Canada. Strontium in Drinking Water—Guideline Technical Document for Public Consultation; Health Canada: Ottawa, ON, Canada, 2018. Available online: https://www.canada.ca/en/health-canada/programs/consultation-strontium-drinking-water/document.html (accessed on 26 July 2024).
- U.S. Environmental Protection Agency (EPA). 2018 Edition of the Drinking Water Standards and Health Advisories Tables (EPA 822-F-18-001); Office of Water, U.S. EPA: Washington, DC, USA, 2018. Available online: https://www.epa.gov/system/files/documents/2022-01/dwtable2018.pdf (accessed on 6 December 2025).
- Environmental Working Group (EWG). Vanadium. In EWG’s Tap Water Database; EWG: Washington, DC, USA, 2024; Available online: https://www.ewg.org/tapwater/contaminant.php?contamcode=1088 (accessed on 6 December 2025).
- Yadav, A.K.; Khan, P.; Sharma, S.K. Water quality index assessment of groundwater in Todaraisingh Tehsil of Rajasthan State, India—A greener approach. J. Chem. 2010, 7, S428–S432. [Google Scholar] [CrossRef] [Scilit]
- Climate Hazards Group (CHG). CHIRPS Daily: Climate Hazards Group InfraRed Precipitation with Station Data, Version 2.0; University of California, Santa Barbara (UCSB): Santa Barbara, CA, USA, 2015; Available online: https://www.chc.ucsb.edu/data/chirps (accessed on 6 December 2025).
- OpenGeoHub Foundation. OpenLandMap Global Soil Texture Class (USDA-TT), Version 02; Google Earth Engine; OpenGeoHub Foundation: Wageningen, The Netherlands, 2021; Available online: https://developers.google.com/earth-engine/datasets/catalog/OpenLandMap_SOL_SOL_TEXTURE-CLASS_USDA-TT_M_v02 (accessed on 6 December 2025).
- NASA LP DAAC (Land Processes Distributed Active Archive Center). MODIS/Terra+Aqua Land Cover Type Yearly L3 Global 500 m SIN Grid (MCD12Q1), Version 6.1; NASA EOSDIS Land Processes DAAC: Sioux Falls, SD, USA, 1990. Available online: https://lpdaac.usgs.gov (accessed on 6 December 2025).
- NASA Jet Propulsion Laboratory (JPL). Shuttle Radar Topography Mission (SRTM) Global 1 Arc-Second (30 m) Digital Elevation Model; NASA EOSDIS Land Processes DAAC: Sioux Falls, SD, USA, 1990. Available online: https://www.earthdata.nasa.gov/data/catalog/lpcloud-srtmgl1-003 (accessed on 6 December 2025).
- United States Department of Agriculture. Hydrology. In National Engineering Handbook; U.S. Government Printing Office: Washington, DC, USA, 1972. [Google Scholar]
- United States Department of Agriculture, Natural Resources Conservation Service. Estimation of direct runoff from storm rainfall. In National Engineering Handbook; USA Government Printing Office: Washington, DC, USA, 2004. [Google Scholar]
- Wang, X.; Liu, T.; Yang, W. Development of a robust runoff-prediction model by fusing the rational equation and a modified SCS-CN method. Hydrol. Sci. J. 2012, 57, 1118–1140. [Google Scholar] [CrossRef] [Scilit]
- Mishra, S.K.; Singh, V.P. Another look at SCS-CN method. J. Hydrol. Eng. 1999, 4, 257–264. [Google Scholar] [CrossRef] [Scilit]
- Subramanya, K. Engineering Hydrology, 3rd ed.; McGraw-Hill Education: New Delhi, India, 2009; p. 450. [Google Scholar]
- Hawkins, R.H.; Hjelmfelt, A.T.; Zevenbergen, A.W. Runoff probability, storm depth, and curve numbers. J. Irrig. Drain. E. 1985, 111, 330–340. [Google Scholar] [CrossRef] [Scilit]
- Jolliffe, I.T. Principal component analysis and factor analysis. In Principal Component Analysis; Springer: New York, NY, USA, 1986; pp. 115–128. [Google Scholar] [CrossRef] [Scilit]
- Sojka, M.; Jaskuła, J. Heavy metals in river sediments: Contamination, toxicity, and source identification—A case study from Poland. Int. J. Environ. Res. Public Health 2022, 19, 10502. [Google Scholar] [CrossRef] [Scilit]
- Massart, D.L.; Vandeginste, B.G.M.; Deming, S.N.; Michotte, Y.; Kaufman, L. Chemometrics: A Textbook; Elsevier: Amsterdam, The Netherlands, 1988. [Google Scholar]
- Menke, W. Geophysical Data Analysis: Discrete Inverse Theory, 4th ed.; Academic Press: Amsterdam, The Netherlands, 2018. [Google Scholar]
- Fouad, S.F. Tectonic map of Iraq, scale 1:1000000, 3rd edition. Iraqi Bull. Geol. Min. 2015, 11, 1–7. [Google Scholar]
- Fouad, S.F.; Sissakian, V.K. Tectonic and structural evolution of the Mesopotamia Plain. Iraqi Bull. Geol. Min. 2011, 4, 33–46. [Google Scholar]
- Sissakian, V.; Abdul Ahad, A.; Al-Ansari, N.; Knutsson, S. Geomorphology, geology and tectonics of Jabal Sanam, South Iraq. J. Earth Sci. Geotech. Eng. 2017, 7, 97–113. [Google Scholar]
- Al Asadi, S.; Al Qurnawi, W.; Al Hawash, A.; Ghalib, H.; Alkhlifa, N. Water quality and impacting factors on heavy metals levels in Shatt Al Arab River, Basra, Iraq. Appl. Water Sci. 2020, 10, 103. [Google Scholar] [CrossRef] [Scilit]
- Teller, J.T.; Glennie, K.W.; Lancaster, N.; Singhvi, A.K. Calcareous dunes of the United Arab Emirates and Noah’s flood: The postglacial reflooding of the Persian (Arabian) Gulf. Quat. Int. 2000, 68, 297–308. [Google Scholar] [CrossRef] [Scilit]
- Cooke, G.A. Reconstruction of the Holocene coastline of Mesopotamia. Geoarchaeology 1987, 2, 15–28. [Google Scholar] [CrossRef] [Scilit]
- Al-Hamad, S.S.; Albadran, B.N.; Pournelle, J.R. Geological history of Shatt Al-Arab River, South of Iraq. Int. J. Sci. Res. 2017, 6, 2029–2039. [Google Scholar] [CrossRef] [Scilit]
- Hassan, H.K. The Algal Patch in the Shatt al-Arab is a Red Alert That Portends the Worst; Marine Science Center—University of Basra: Basra, Iraq, 2018; Available online: https://msc.uobasrah.edu.iq/index.php/2017-10-31-08-15-50/9046-2018-01-23-05-00-02.html (accessed on 6 December 2025). (In Arabic)
- Al-Tememi, M.K.; Hussein, M.A.; Khaleefa, U.Q.; Ghalib, H.B.; Al-Mayah, A.M.; Ruhmah, A.J. The salts diffusion between East Hammar marsh area and Shatt Al-Arab River Northern Basra City. Marsh Bull. 2015, 10, 36–45. [Google Scholar]
- Al-Mahmood, H.K. Referential analysis of discharge and salinity data in Shatt Al-Arab River. Iraqi J. Aquacult. 2020, 17, 11–26. [Google Scholar] [CrossRef] [Scilit]
- Sissakian, V.K.; Abdul Ahad, A.D.; Al-Ansari, N.; Knutsson, S. Neotectonic activity from the upper reaches of the Arabian Gulf and possibilities of new oil fields. Geotectonics 2018, 52, 240–250. [Google Scholar] [CrossRef] [Scilit]
- De Morgan, J. La Délégation en Perse du Ministère de L’instruction Publique, 1897 à 1902; E. Leroux: Paris, France, 1902. [Google Scholar]
- Al-Kubaisi, M.; Hussein, M. Morphotectonics of Shatt Al-Arab River Southern Iraq. Iraqi J. Sci. 2014, 55, 1051–1060. [Google Scholar]
- Al-Mahmood, H.K. The monthly variations of discharge and effect that on a total dissolved suspended and salinity in Shatt al-Arab River (South of Iraq). Iraqi J. Sci. 2009, 50, 355–368. [Google Scholar]
- Food and Agriculture Organization of the United Nations (FAO). Towards Sustainable Agricultural Development in Iraq: The Transition from Relief, Rehabilitation and Reconstruction to Development; FAO: Rome, Italy, 2003; p. 222. Available online: https://openknowledge.fao.org/items/fddd36fc-79ba-4e75-91b0-2059bf7e8876 (accessed on 6 December 2025).
- Abdullah, A.; Gisen, J.; van der Zaag, P.; Savenije, H.; Karim, U.F.A.; Masih, I.; Popescu, I. Predicting the salt water intrusion in the Shatt al-Arab estuary using an analytical approach. Hydrol. Earth Syst. Sci. 2016, 20, 4031–4042. [Google Scholar] [CrossRef] [Scilit]
- Zachopoulos, K.; Kokkos, N.; Sylaios, G. Salt wedge intrusion modeling along the lower reaches of a Mediterranean river. Reg. Stud. Mar. Sci. 2020, 39, 101467. [Google Scholar] [CrossRef] [Scilit]
- Chow, V.T.; Maidment, D.R.; Mays, L.W. Applied Hydrology; McGraw-Hill: New York, NY, USA, 1988. [Google Scholar]
- Tabachnick, B.G.; Fidell, L.S. Using Multivariate Statistics, 5th ed.; Pearson Education: Boston, MA, USA, 2007. [Google Scholar]
- Poggioli, A.R.; Horner-Devine, A.R. The sensitivity of salt-wedge estuaries to channel geometry. J. Phys. Oceanogr. 2015, 45, 3169–3183. [Google Scholar] [CrossRef] [Scilit]
- Cordero-Acosta, J.R.; Otero Díaz, L.J.; Higgins Álvarez, A.E. Influence of Fluvial Discharges and Tides on the Salt Wedge Position of a Microtidal Estuary: Magdalena River. Water 2024, 16, 1139. [Google Scholar] [CrossRef] [Scilit]
- Gong, W.; Shen, J.; Jia, L. Salt intrusion during the dry season in the Huangmaohai Estuary, Pearl River Delta, China. J. Mar. Syst. 2013, 111, 235–252. [Google Scholar] [CrossRef] [Scilit]
- Leonardi, N.; Kolker, A.S.; Fagherazzi, S. Interplay between river discharge and tides in a delta distributary. Adv. Water Resour. 2015, 80, 69–78. [Google Scholar] [CrossRef] [Scilit]
- Cai, H.; Li, B.; Gu, J.; Zhao, T.; Garel, E. Extension of the general unit hydrograph theory for the spread of salinity in estuaries. Ocean Sci. 2023, 19, 603–614. [Google Scholar] [CrossRef] [Scilit]
- Wullems, B.J.M.; Brauer, C.C.; Baart, F.; Weerts, A.H. Forecasting estuarine salt intrusion in the Rhine–Meuse delta using an LSTM model. Hydrol. Earth Syst. Sci. 2023, 27, 3823–3850. [Google Scholar] [CrossRef] [Scilit]
- Torres-Bejarano, F.; González-Martínez, J.; Rodríguez-Pérez, J.; Rodríguez-Cuevas, C.; Mathis, T.J.; Tran, D.K. Characterization of salt wedge intrusion process in a geographically complex microtidal deltaic estuarine system. J. South Am. Earth Sci. 2023, 131, 104646. [Google Scholar] [CrossRef] [Scilit]
- Hayder, A.M.; Alikhan, H.A.; Jihad, A.J. Time series analyses for predicting the water quality and river discharge at Al-Kufa River in Iraq. J. Phys. Conf. Ser. 2021, 1973, 012177. [Google Scholar] [CrossRef] [Scilit]
- Chang, H.; Carlson, T.N. Water quality during winter storm events in Spring Creek, Pennsylvania. Hydrobiologia 2005, 544, 321–332. [Google Scholar] [CrossRef] [Scilit]
- Miller, J.D.; Hutchins, M. The impacts of urbanisation and climate change on urban flooding and urban water quality: A review of the evidence concerning the United Kingdom. J. Hydrol. Reg. Stud. 2017, 12, 345–362. [Google Scholar] [CrossRef] [Scilit]
- Wang, J.; Zhang, Z.; Johnson, B. Low flows and downstream decline in phytoplankton contribute to impaired water quality in the lower Minnesota River. Water Res. 2019, 161, 262–273. [Google Scholar] [CrossRef] [Scilit]
- Times of India. Musi River Water Unfit for Drinking Except at Osman Sagar: Study; Times of India: Fort, Mumbai, 2025; Available online: https://timesofindia.indiatimes.com/city/hyderabad/musi-river-water-unfit-for-drinking-except-at-osman-sagar-study/articleshow/121555246.cms (accessed on 26 February 2026).
- Shaha, D.; Cho, Y.K. Salt plug formation caused by decreased river discharge in a multi-channel estuary. Sci. Rep. 2016, 6, 27176. [Google Scholar] [CrossRef] [Scilit] [PubMed]
- Yu, X.; Zhang, W.; Hoitink, A.J.F. Impact of river discharge seasonality change on tidal duration asymmetry in the Yangtze River Estuary. Sci. Rep. 2020, 10, 6304. [Google Scholar] [CrossRef] [Scilit] [PubMed]
- Matsoukis, C.; Amoudry, L.O.; Bricheno, L.; Leonardi, N. Numerical investigation of river discharge and tidal variation impact on salinity intrusion in a generic river delta through idealized modelling. Estuaries Coasts 2023, 46, 57–83. [Google Scholar] [CrossRef] [Scilit]
- Dai, A. Increasing drought under global warming in observations and models. Nat. Clim. Change 2013, 3, 52–58. [Google Scholar] [CrossRef] [Scilit]
- Lelieveld, J.; Proestos, Y.; Hadjinicolaou, P.; Tanarhte, M.; Tyrlis, E.; Zittis, G. Strongly increasing heat extremes in the Middle East and North Africa in the 21st century. Clim. Change 2016, 137, 245–260. [Google Scholar] [CrossRef] [Scilit]
- Waha, K.; Krummenauer, L.; Adams, S.; Aich, V.; Baarsch, F.; Coumou, D.; Robinson, A.; Hare, W. Climate change impacts in the Middle East and Northern Africa region and their implications for vulnerable population groups. Reg. Environ. Change 2017, 17, 1623–1633. [Google Scholar] [CrossRef] [Scilit]
- Mouhamad, R.S.; Al-Gburi, H.F.; Rasheed, A.G.; Razaq, I.; Al-Lafta, H.S. Bioaccumulation and biomagnification study of Al-Chibayish marsh plants, southern Iraq. Iraqi J. Sci. 2019, 60, 1312–1321. [Google Scholar] [CrossRef] [Scilit]
- Aoubid, H.S.; Opp, C. Nitrogen and phosphorus discharge loads assessment using the SWAT model: A case study of the Shatt Al-Arab River Basin. Appl. Sci. 2023, 13, 8376. [Google Scholar] [CrossRef] [Scilit]
- Imbulana, S.; Oguma, K.; Takizawa, S. Seasonal variations in groundwater quality and hydrogeochemistry in the endemic areas of chronic kidney disease of unknown etiology (CKDu) in Sri Lanka. Water 2021, 13, 3356. [Google Scholar] [CrossRef] [Scilit]
- Anh, N.T.; Can, L.D.; Nhan, N.T.; Schmalz, B.; Luu, T.L. Influences of key factors on river water quality in urban and rural areas: A review. Case Stud. Chem. Environ. Eng. 2023, 8, 100424. [Google Scholar] [CrossRef] [Scilit]
- Prasad, S.; Wei, Y.; Chaminda, T.; Ritigala, T.; Yu, L.; Jinadasa, K.B.S.N.; Wasana, H.M.S.; Indika, S.; Yapabandara, I.; Hu, D. Spatiotemporal assessment of water pollution for Beira Lake, Sri Lanka. Water 2024, 16, 1616. [Google Scholar] [CrossRef] [Scilit]
- Filgueiras, A.V.; Lavilla, I.; Bendicho, C. Evaluation of distribution, mobility and binding behaviour of heavy metals in surficial sediments of Louro River (Galicia, Spain) using chemometric analysis: A case study. Sci. Total Environ. 2004, 330, 115–129. [Google Scholar] [CrossRef] [Scilit]
- Glasby, G.P.; Szefer, P.; Geldon, J.; Warzocha, J. Heavy-metal pollution of sediments from Szczecin Lagoon and the Gdansk Basin, Poland. Sci. Total Environ. 2004, 330, 249–269. [Google Scholar] [CrossRef] [Scilit] [PubMed]
- Tang, W.; Shan, B.; Zhang, H.; Mao, Z. Heavy metal sources and associated risk in response to agricultural intensification in the estuarine sediments of Chaohu Lake Valley, East China. J. Hazard. Mater. 2010, 176, 945–951. [Google Scholar] [CrossRef] [Scilit]
- Railsback, L.B. Some Fundamentals of Mineralogy and Geochemistry; UGA Sedimentary Geochemistry Laboratory, University of Georgia: Athens, GA, USA, 2006. [Google Scholar]
- Al-Asadi, S.A.; Al-Hawash, A.B.; Alkhlifa, N.A.; Ghalib, H.B. Factors affecting the levels of toxic metals in the Shatt Al-Arab River, Southern Iraq. Earth Syst. Environ. 2019, 3, 313–325. [Google Scholar] [CrossRef] [Scilit]
- Kabata-Pendias, A.; Pendias, H. Trace Elements in Soils and Plants, 3rd ed.; CRC Press: Boca Raton, FL, USA, 2001. [Google Scholar]
- Weiner, E.R. Applications of Environmental Aquatic Chemistry: A Practical Guide, 2nd ed.; CRC Press, Taylor & Francis Group: Boca Raton, FL, USA, 2008. [Google Scholar]
- Smedley, P.L.; Kinniburgh, D.G. A review of the source, behaviour and distribution of arsenic in natural waters. Appl. Geochem. 2002, 17, 517–568. [Google Scholar] [CrossRef] [Scilit]
- KnowYourH2O. Barium in Drinking Water. 2025. Available online: https://www.knowyourh2o.com/indoor-6/barium (accessed on 6 December 2025).
- Bird, G.; Bell, H.E.G.; Perkins, W.T. Arsenic within the secondary environment from geogenic inputs, Harlech Dome, UK. Environ. Earth Sci. 2014, 72, 3521–3530. [Google Scholar] [CrossRef] [Scilit]
- Driscoll, C.T. Aluminum in Acidic Surface waters: Chemistry, Transport, and Effects. Environ. Health Perspect. 1985, 63, 93–104. [Google Scholar] [CrossRef] [PubMed] [PubMed Central]
- Zhu, K.; Achterberg, E.P.; Bates, N.R.; Gerringa, L.J.A.; Middag, R.; Hopwood, M.J.; Gledhill, M. Influence of changes in pH and temperature on the distribution of apparent iron solubility in the oceans. Glob. Biogeochem. Cycles 2023, 37, e2022GB007617. [Google Scholar] [CrossRef] [Scilit]
- Awadh, S.M.; Al-Mimar, H.S. The effect of nickel, vanadium, asphaltene, NSO and sulfur on crude oil quality. Iraq. Geol. J. 2023, 56, 137–144. [Google Scholar] [CrossRef] [Scilit]
- Al-Saad, H.T.; Karem, D.S.; Kadhim, H.A. Total petroleum hydrocarbons in soil of West Qurna-2 oil field Southern Iraq. Int. J. Mar. Sci. 2017, 7, 51–58. [Google Scholar] [CrossRef] [Scilit]
- Moss, S.A.; Nagpal, N.K. Ambient Water Quality Guidelines for Boron: Full Report; Water, Air and Climate Change Branch, British Columbia Ministry of Environment: Victoria, BC, Canada, 2003. Available online: https://www2.gov.bc.ca/assets/gov/environment/air-land-water/water/waterquality/water-quality-guidelines/approved-wqgs/boron/boron-tech-appnx.pdf (accessed on 6 December 2025).
- Choi, H.B.; Ryu, J.S.; Shin, W.J.; Vigier, N. Impact of anthropogenic inputs on lithium content in river and tap water. Nat. Commun. 2019, 10, 5371. [Google Scholar] [CrossRef] [Scilit] [PubMed]
- Upadhyay, M.K.; Shukla, A.; Yadav, P.; Srivastava, S. Arsenic accumulation in rice (Oryza sativa L.) grown in contaminated soils and its adverse health effects. Food Chem. 2019, 276, 608–618. [Google Scholar] [CrossRef] [Scilit] [PubMed]
- Health Canada. Water Talk: Strontium in Drinking Water. 19 July 2019. Available online: https://www.canada.ca/en/health-canada/services/publications/healthy-living/water-talk-strontium.html#a1 (accessed on 6 December 2025).
- Mayer, L.M. Retention of riverine iron in estuaries. Geochim. Cosmochim. Acta 1982, 46, 1003–1009. [Google Scholar] [CrossRef] [Scilit]
- Gerringa, L.J.A.; Rijkenberg, M.J.A.; Wolterbeek, H.T.; Verburg, T.G.; Boye, M.; De Baar, H.J.W. Kinetic study reveals weak Fe-binding ligand, which affects the solubility of Fe in the Scheldt estuary. Mar. Chem. 2007, 103, 30–45. [Google Scholar] [CrossRef] [Scilit]
- Daneshvar, E. Dissolved Iron Behavior in the Ravenglass Estuary Waters, An Implication on the Early Diagenesis. Universal J. Geosci. 2015, 3, 1–12. [Google Scholar] [CrossRef] [Scilit]
- Lenntech. Iron (Fe) and Water. 2025. Available online: https://www.lenntech.com/periodic/water/iron/iron-and-water.htm (accessed on 6 December 2025).
- National Testing Laboratories. The Relationship Between Iron and pH; National Testing Laboratories: Cleveland, OH, USA, 2020; Available online: https://watercheck.com (accessed on 6 December 2025).
- Saito, M.A.; Moffett, J.W. Temporal and Spatial Variability of Cobalt in the Atlantic Ocean. Geochim. Cosmochim. Acta 2002, 66, 1943–1953. [Google Scholar] [CrossRef] [Scilit]
- Moore, J.W. Inorganic Contaminants of Surface Water: Research and Monitoring Priorities; Springer: New York, NY, USA, 1991. [Google Scholar]
- Narimannejad, S.; Zhang, B.; Lye, L. Adsorption behavior of cobalt onto saline soil with/without a biosurfactant: Kinetic and isotherm studies. Water Air Soil Pollut. 2019, 230, 47. [Google Scholar] [CrossRef] [Scilit]
- Kidder, J.A.; Reid, N.; Noble, R.R.P.; Leybourne, M.I.; Buskard, J.; Bowell, R.J.; Stoltze, A.; Garrett, R.G. A review of hydrogeochemical techniques for mineral exploration: History, present and future. Geochem. Explor. Environ. Anal. 2025, 25, geochem2024-065. [Google Scholar] [CrossRef] [Scilit]
- Yong, A.G.; Pearce, S. A beginner’s guide to factor analysis: Focusing on exploratory factor analysis. Tutor. Quant. Methods Psychol. 2013, 9, 79–94. [Google Scholar] [CrossRef] [Scilit]
- Allafta, H.; Opp, C. Spatio-Temporal Variability and Pollution Sources Identification of the Surface Sediments of Shatt Al-Arab River, Southern Iraq. Sci. Rep. 2020, 10, 6979. [Google Scholar] [CrossRef] [Scilit] [PubMed]
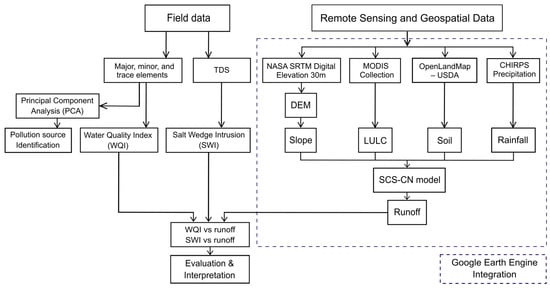
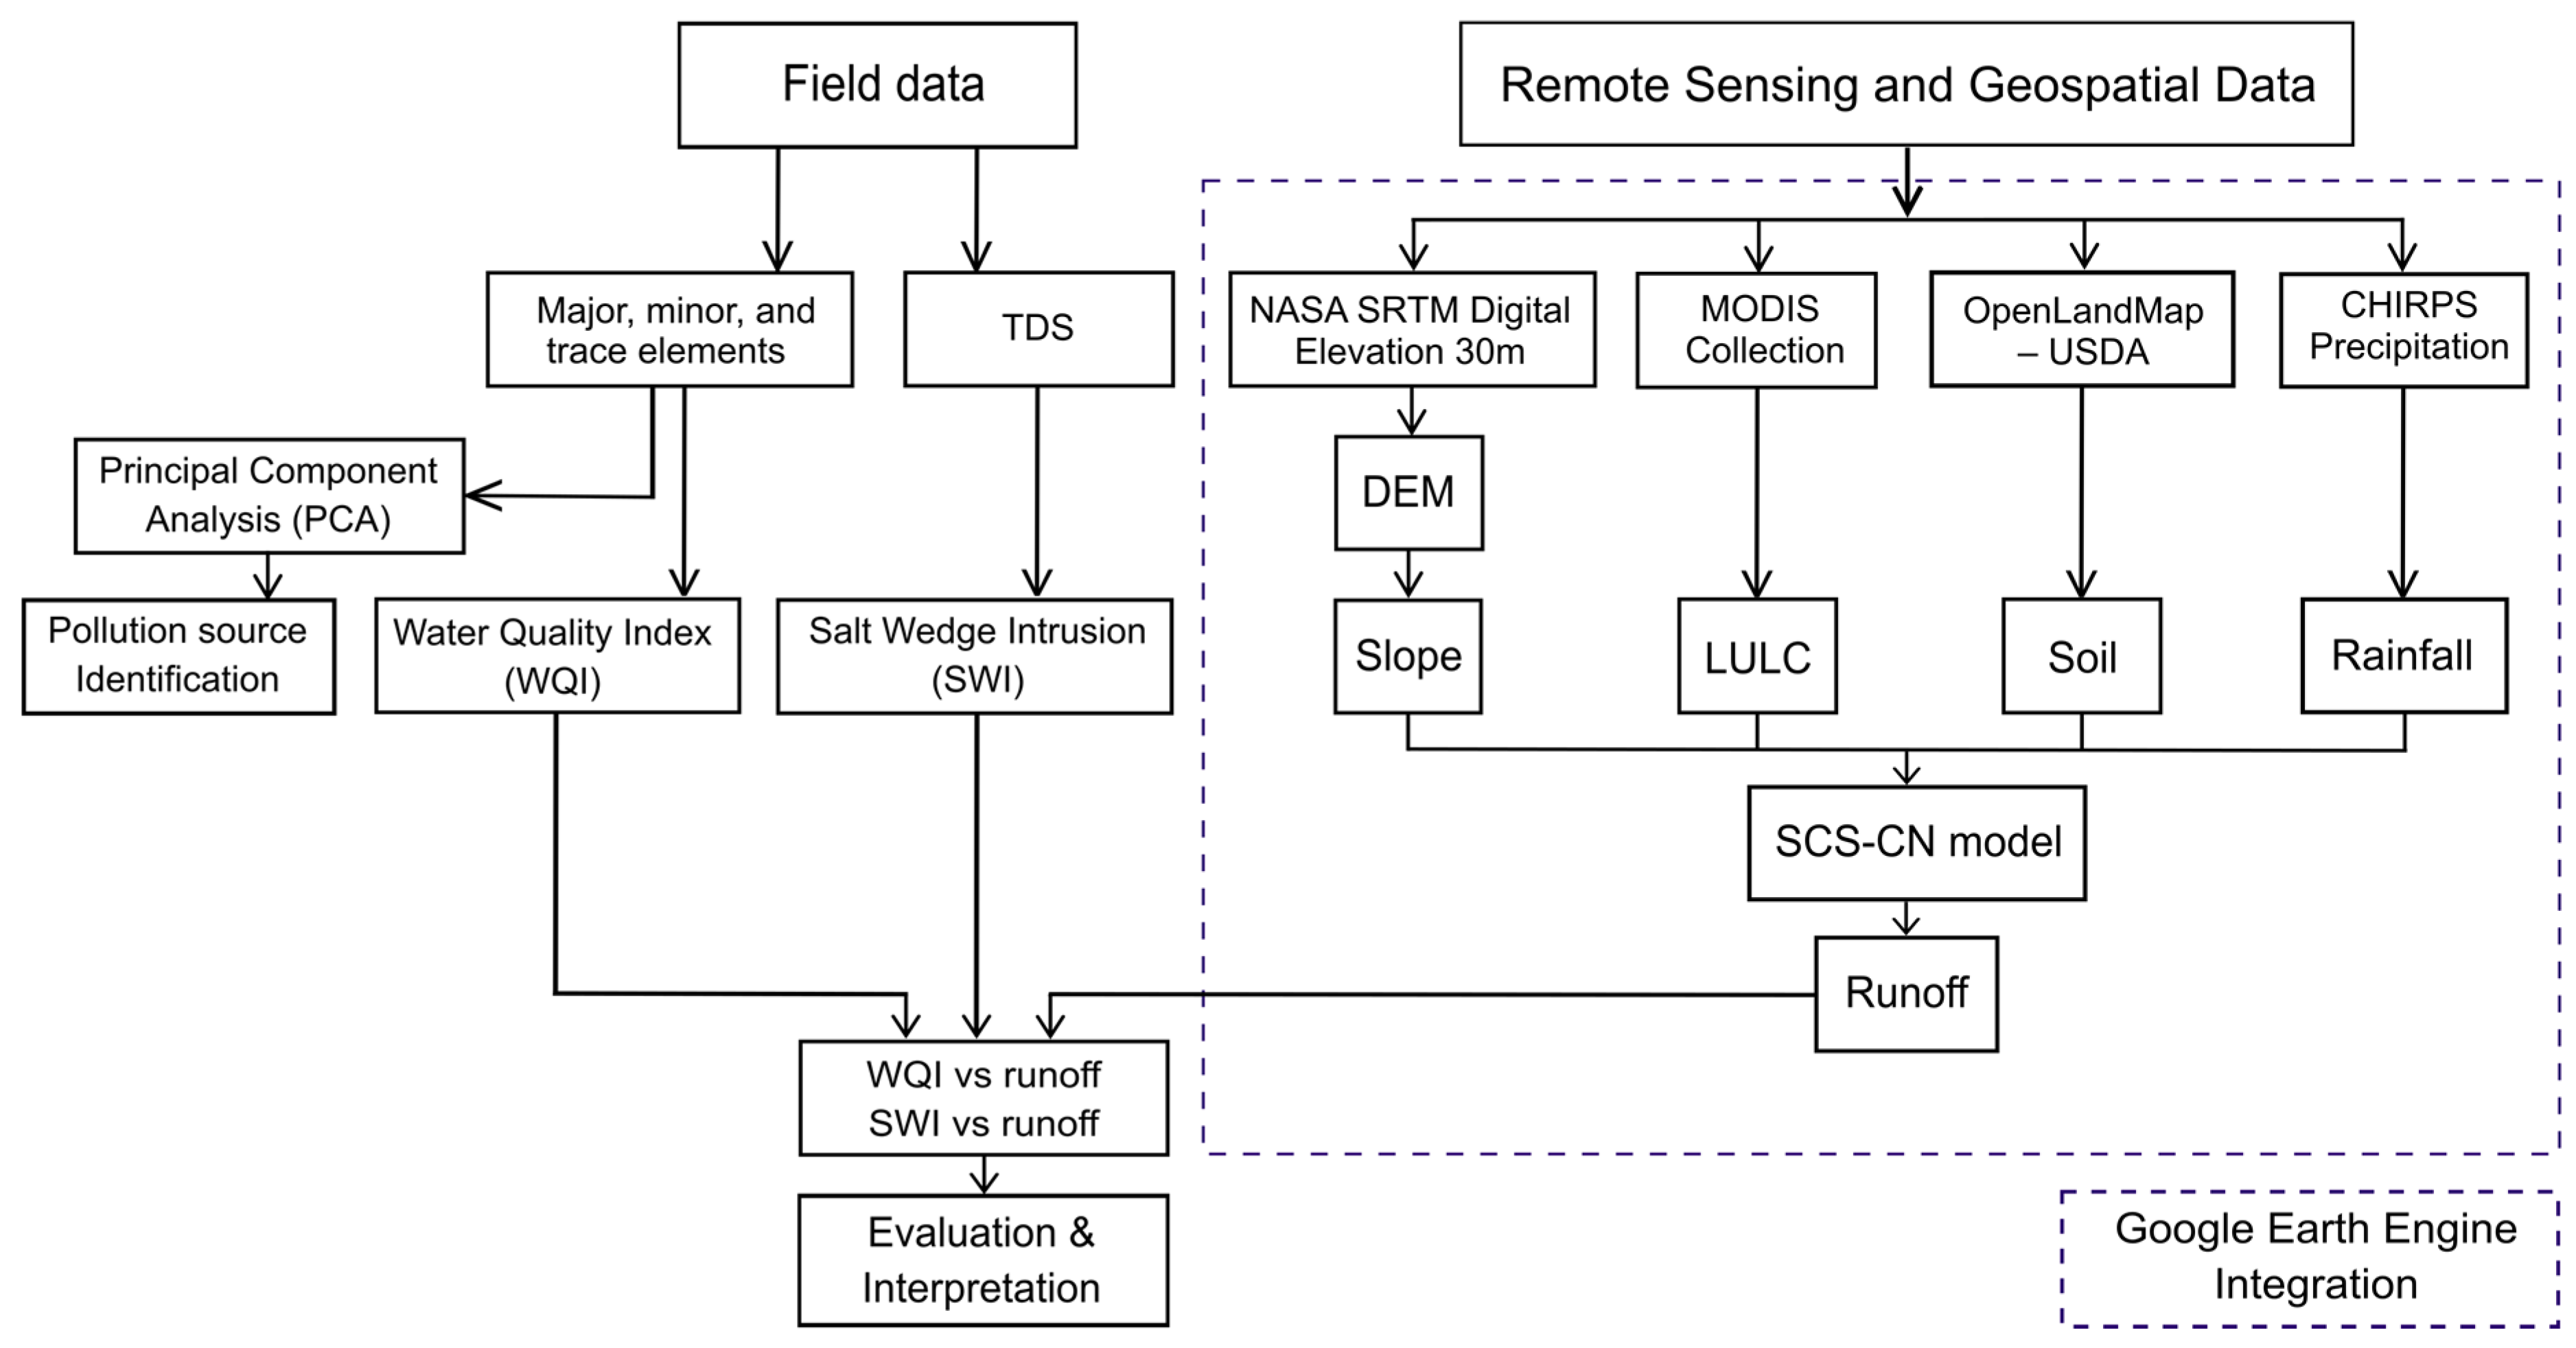
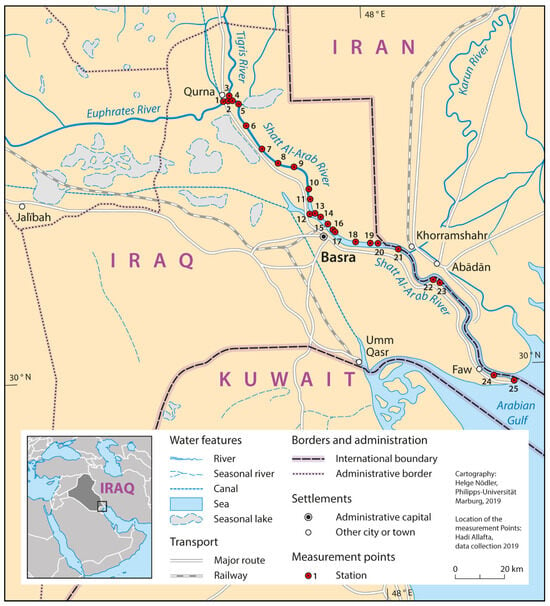
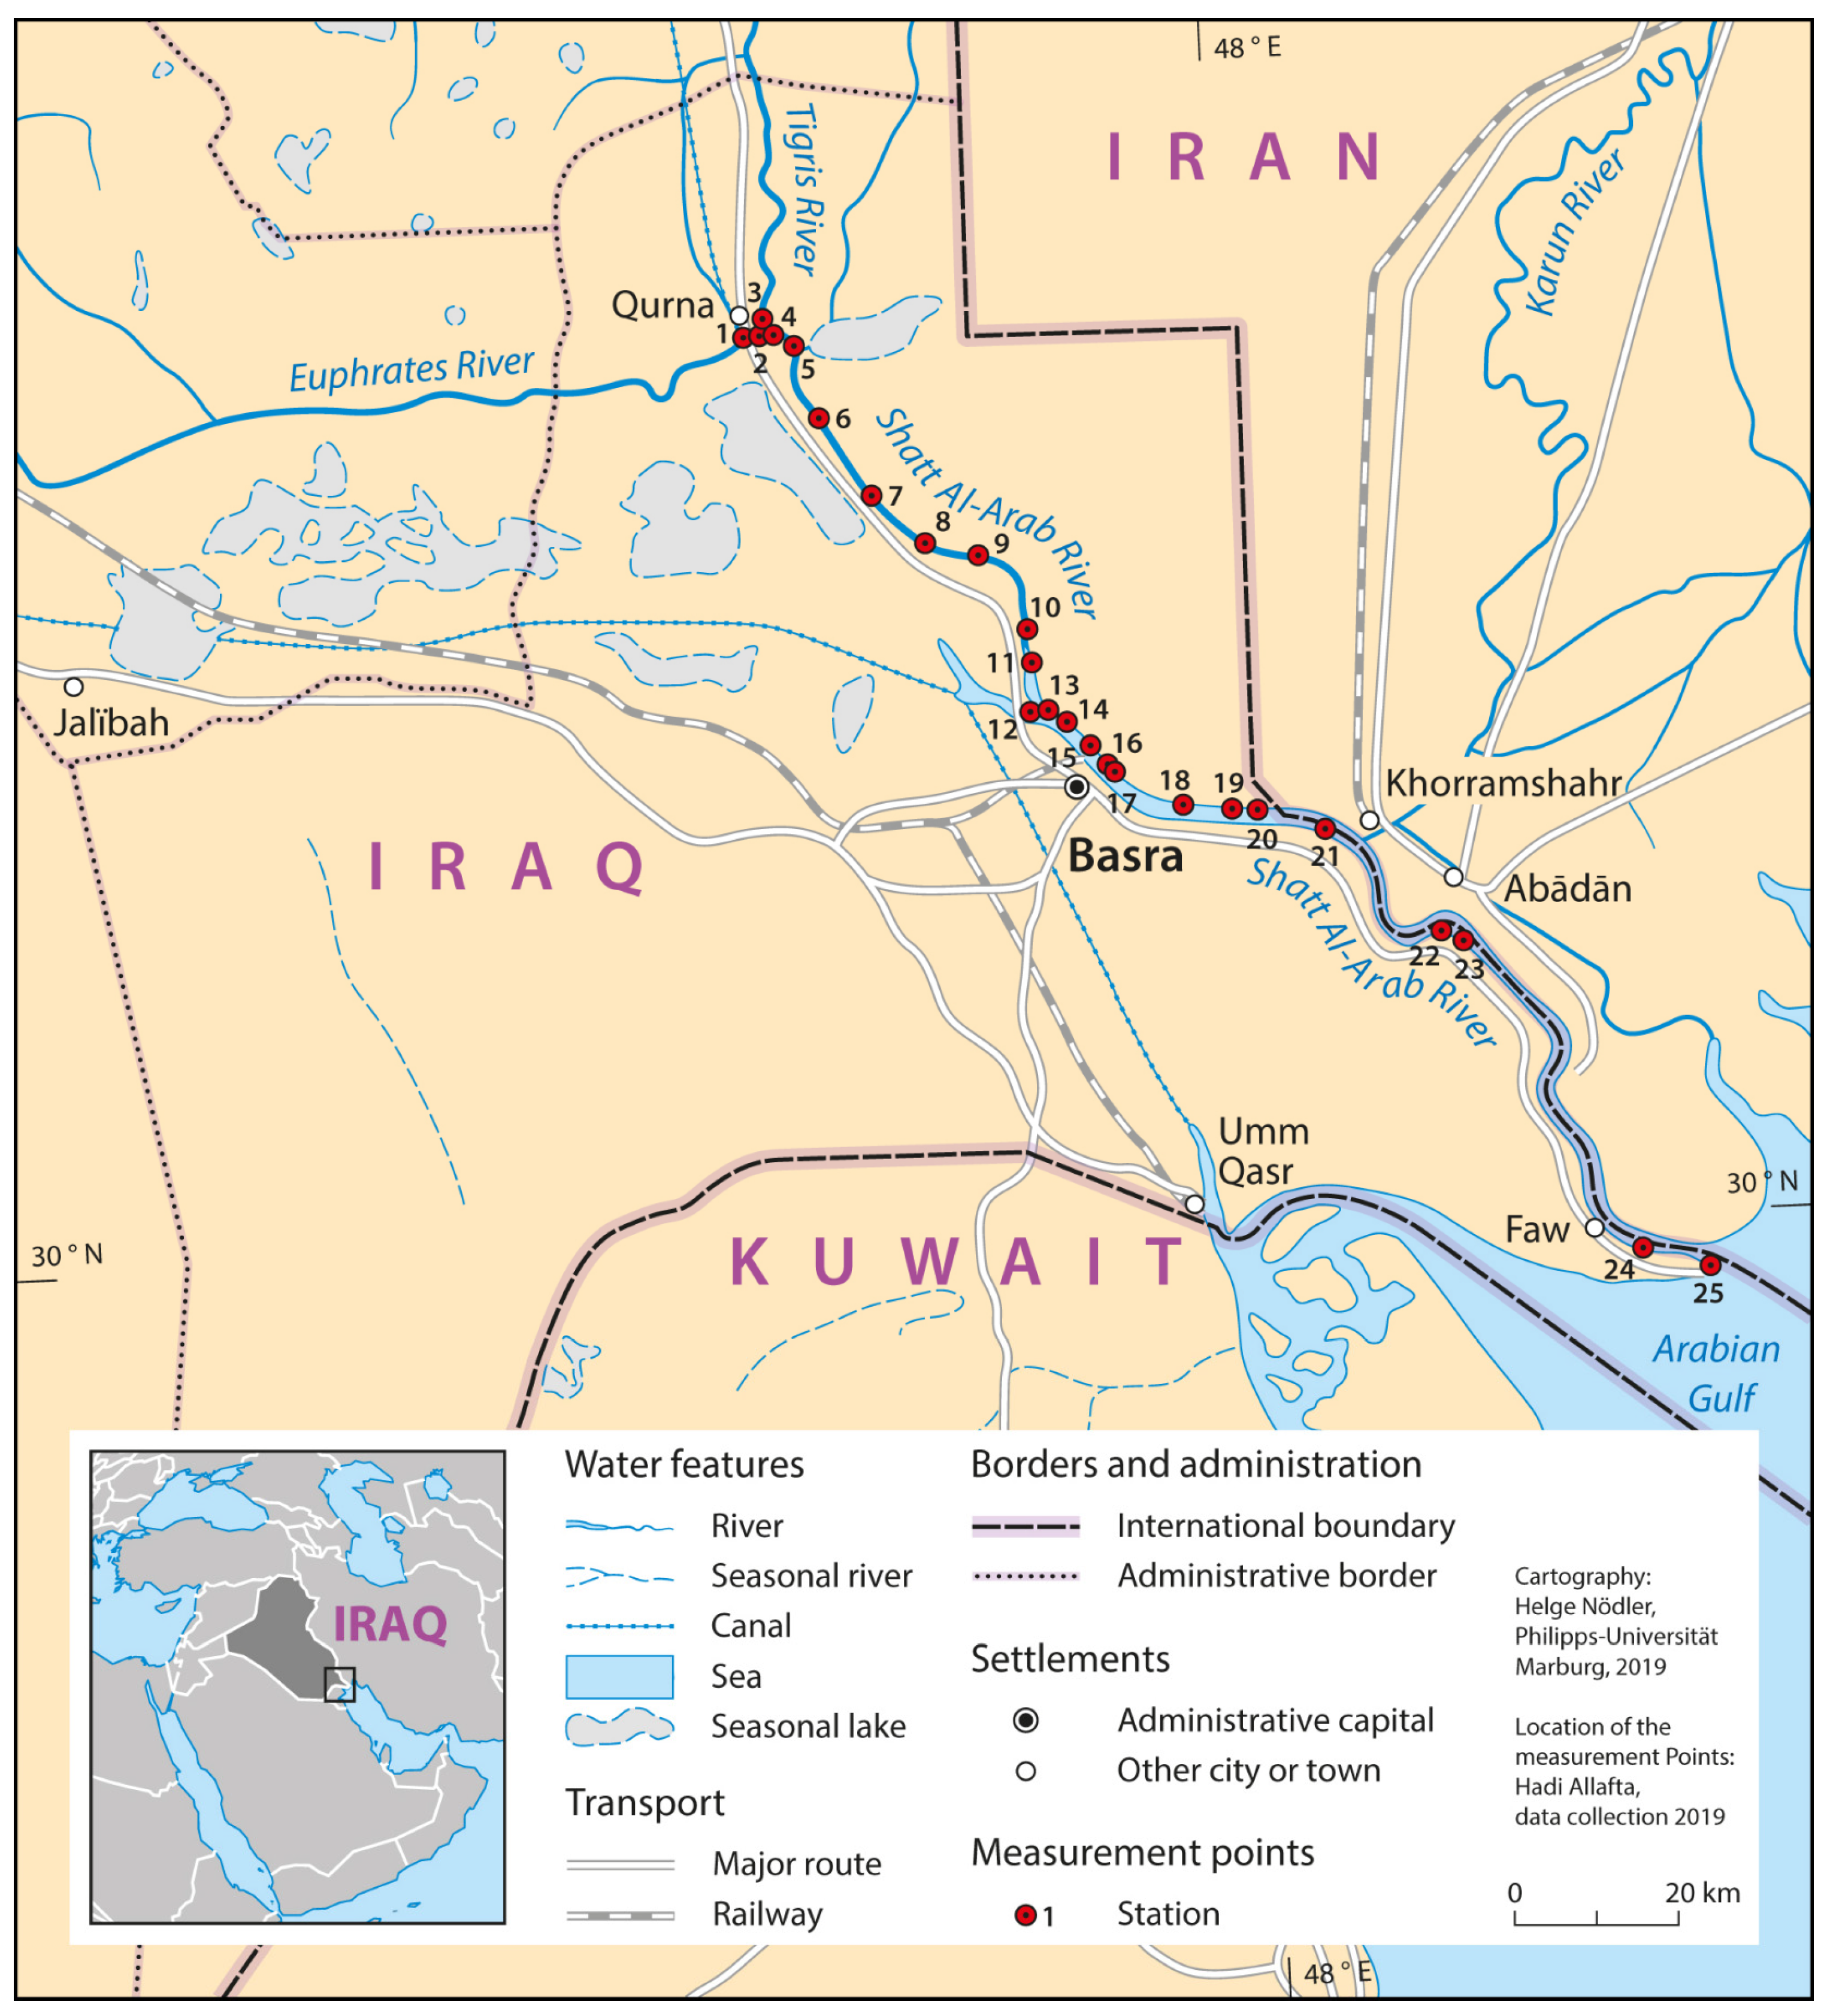
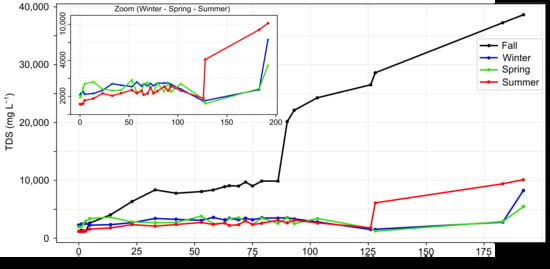
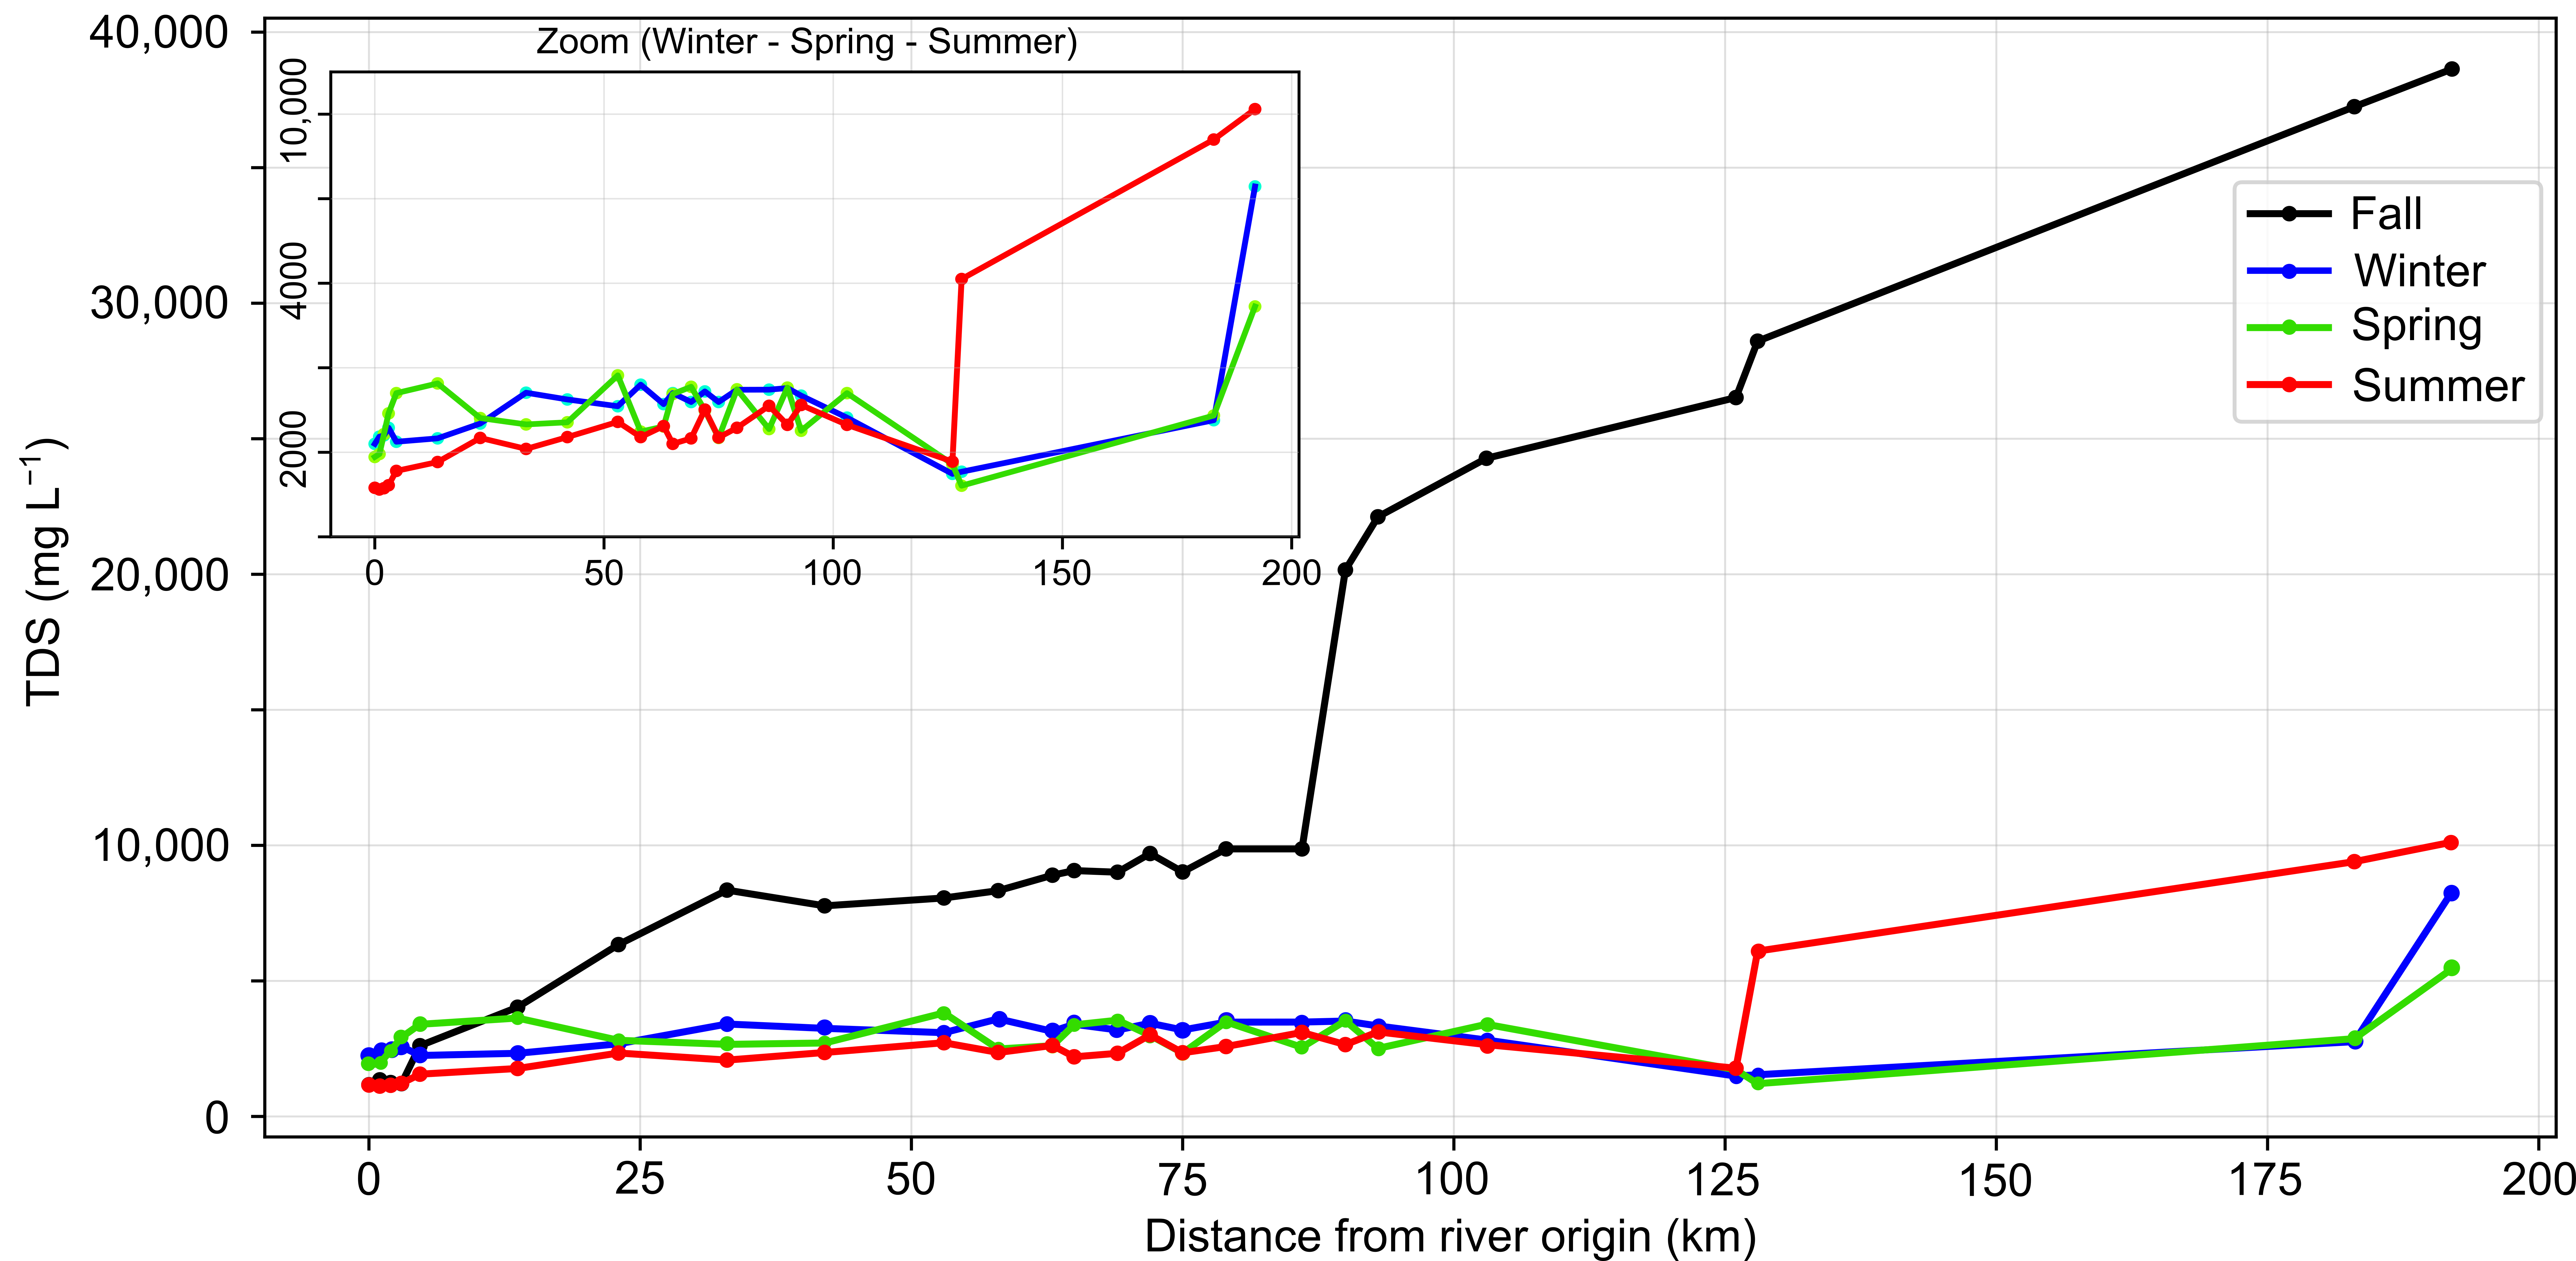
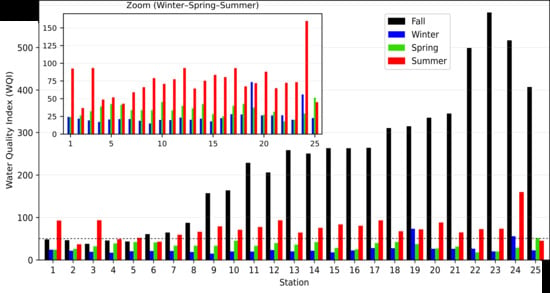
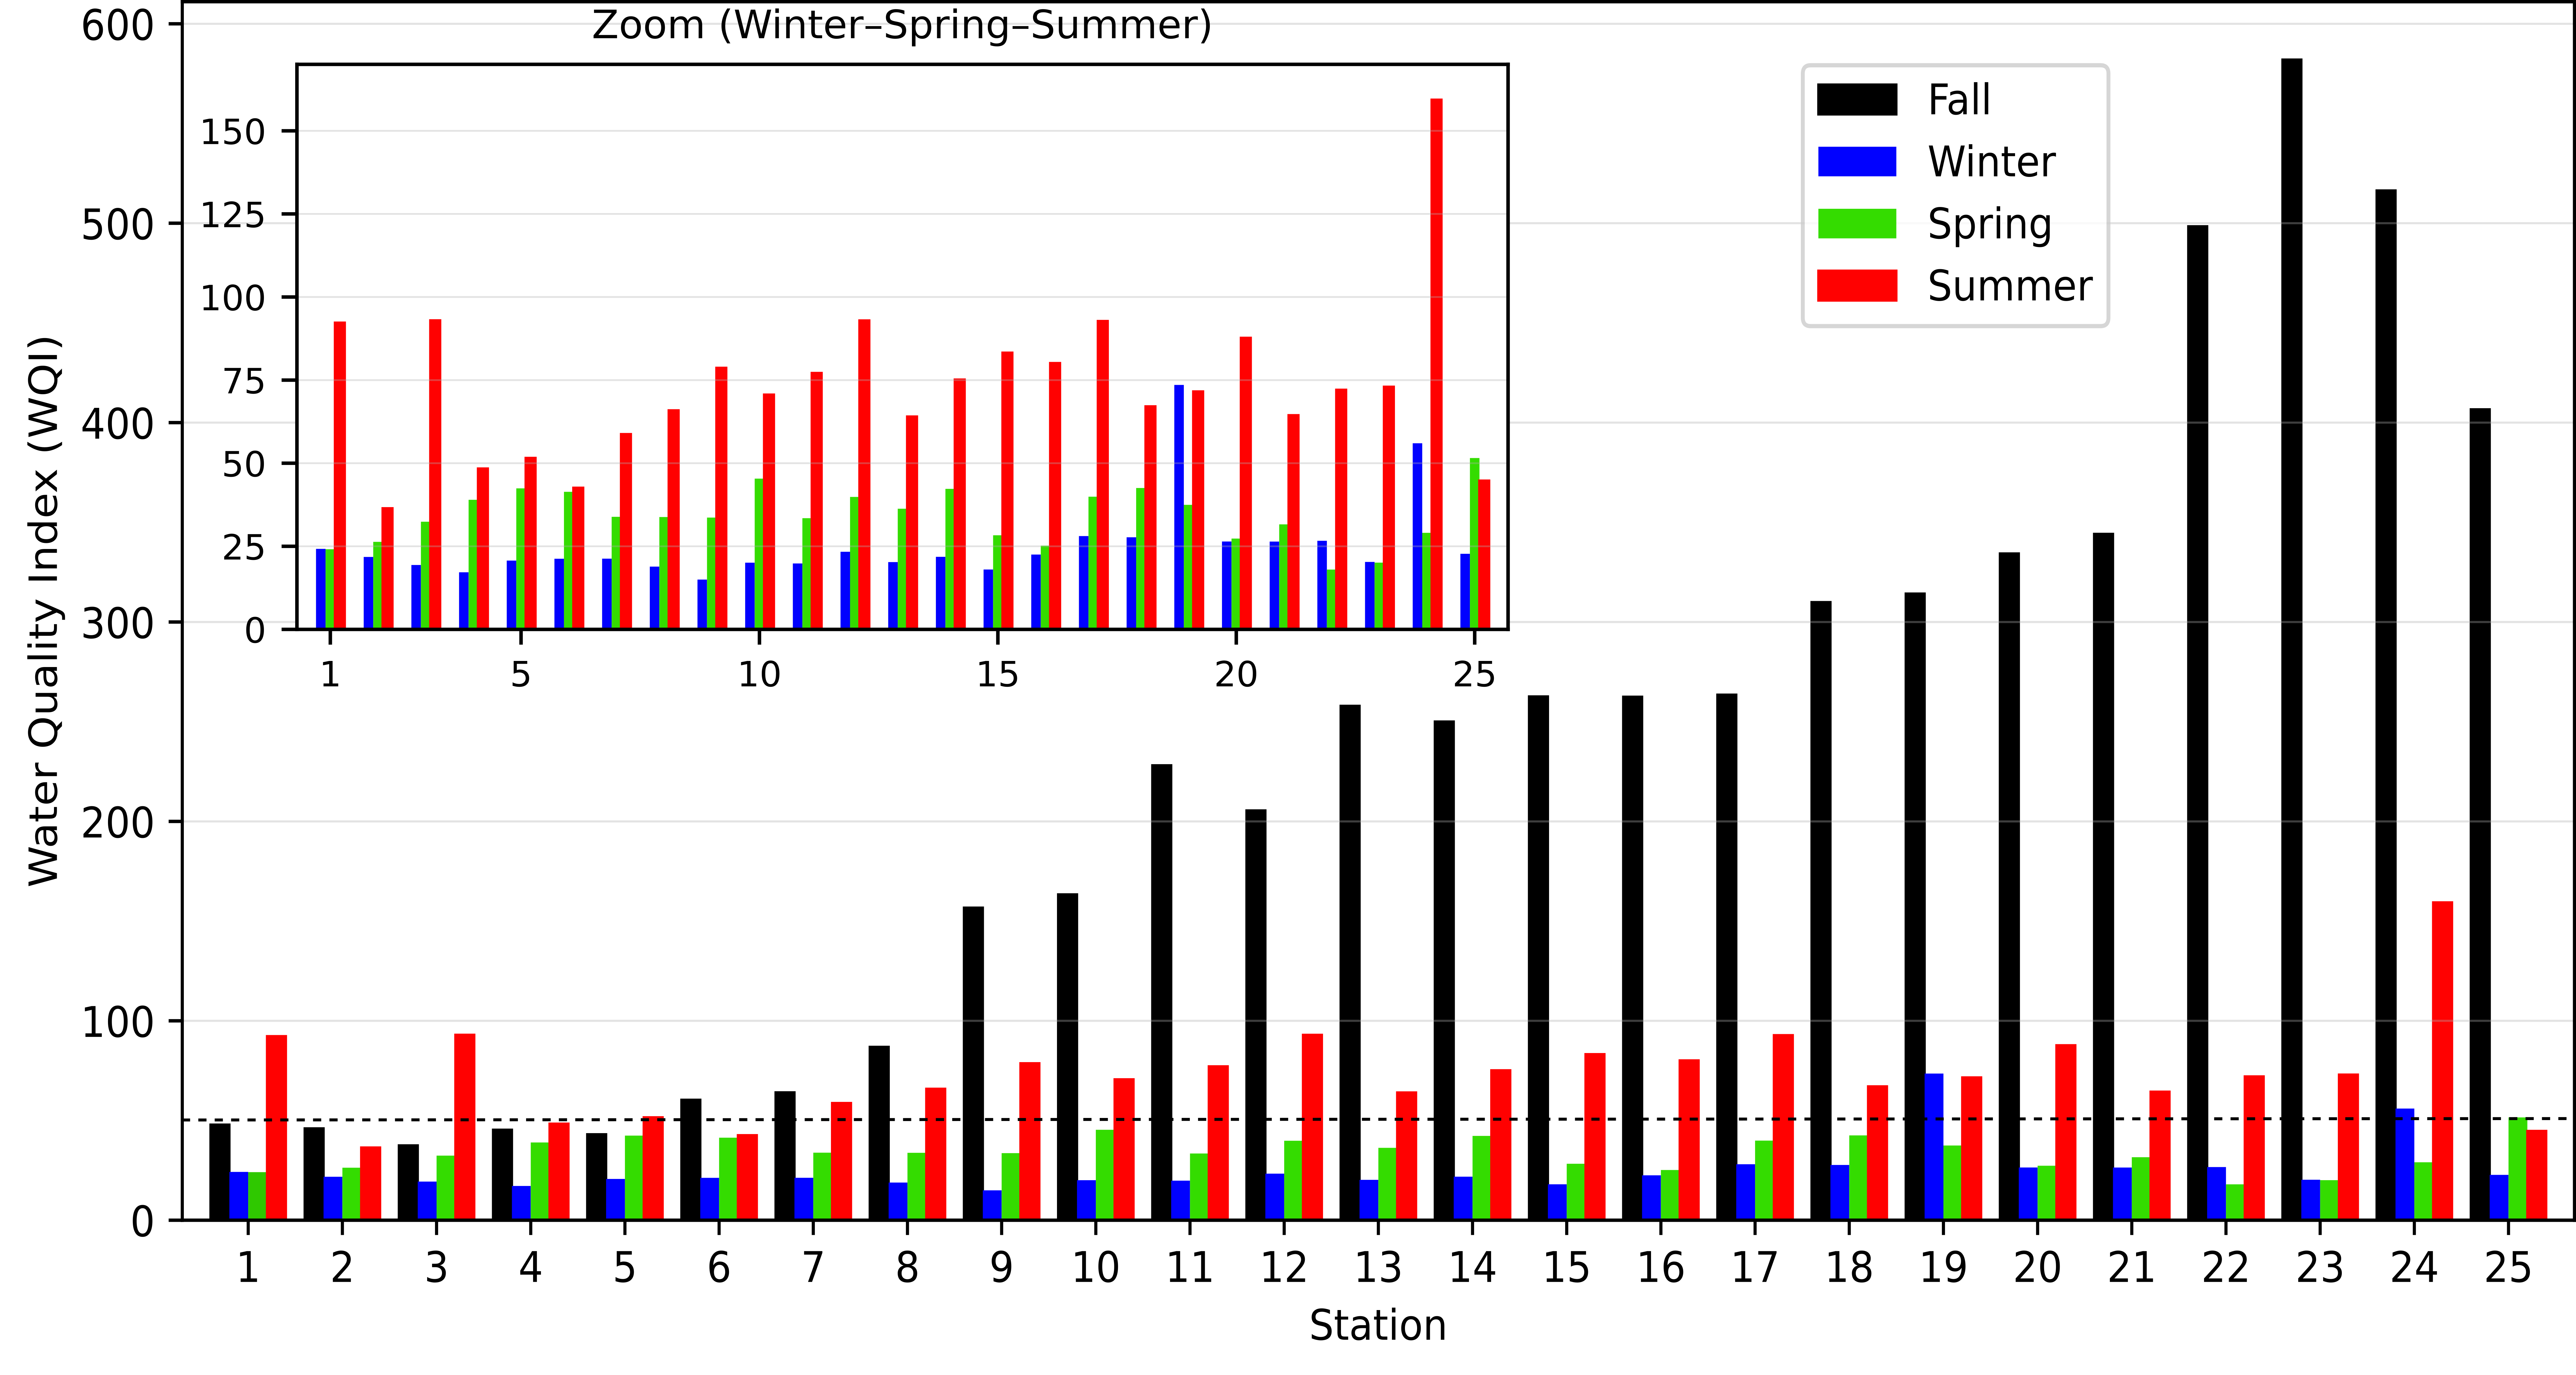
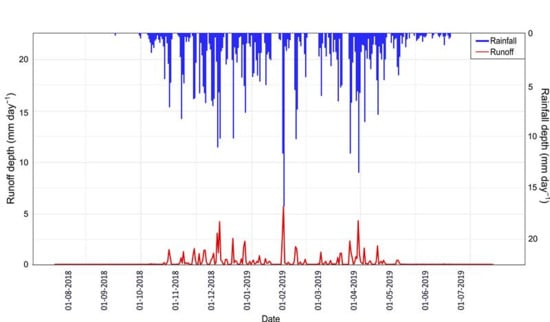
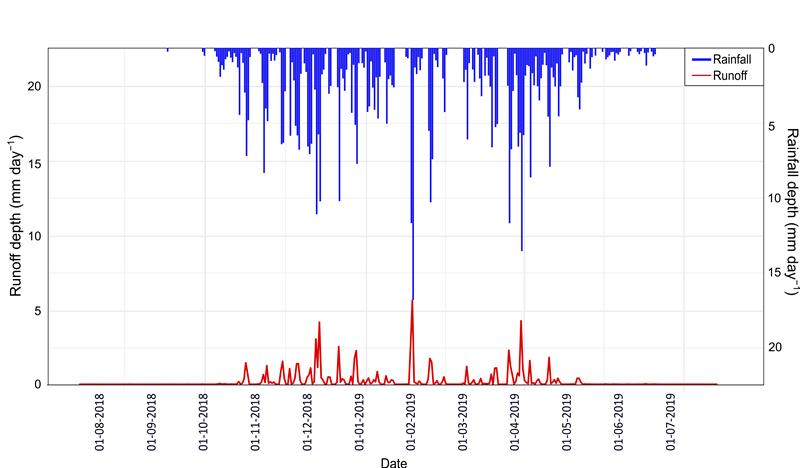
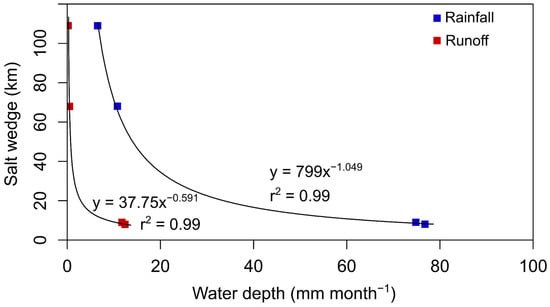
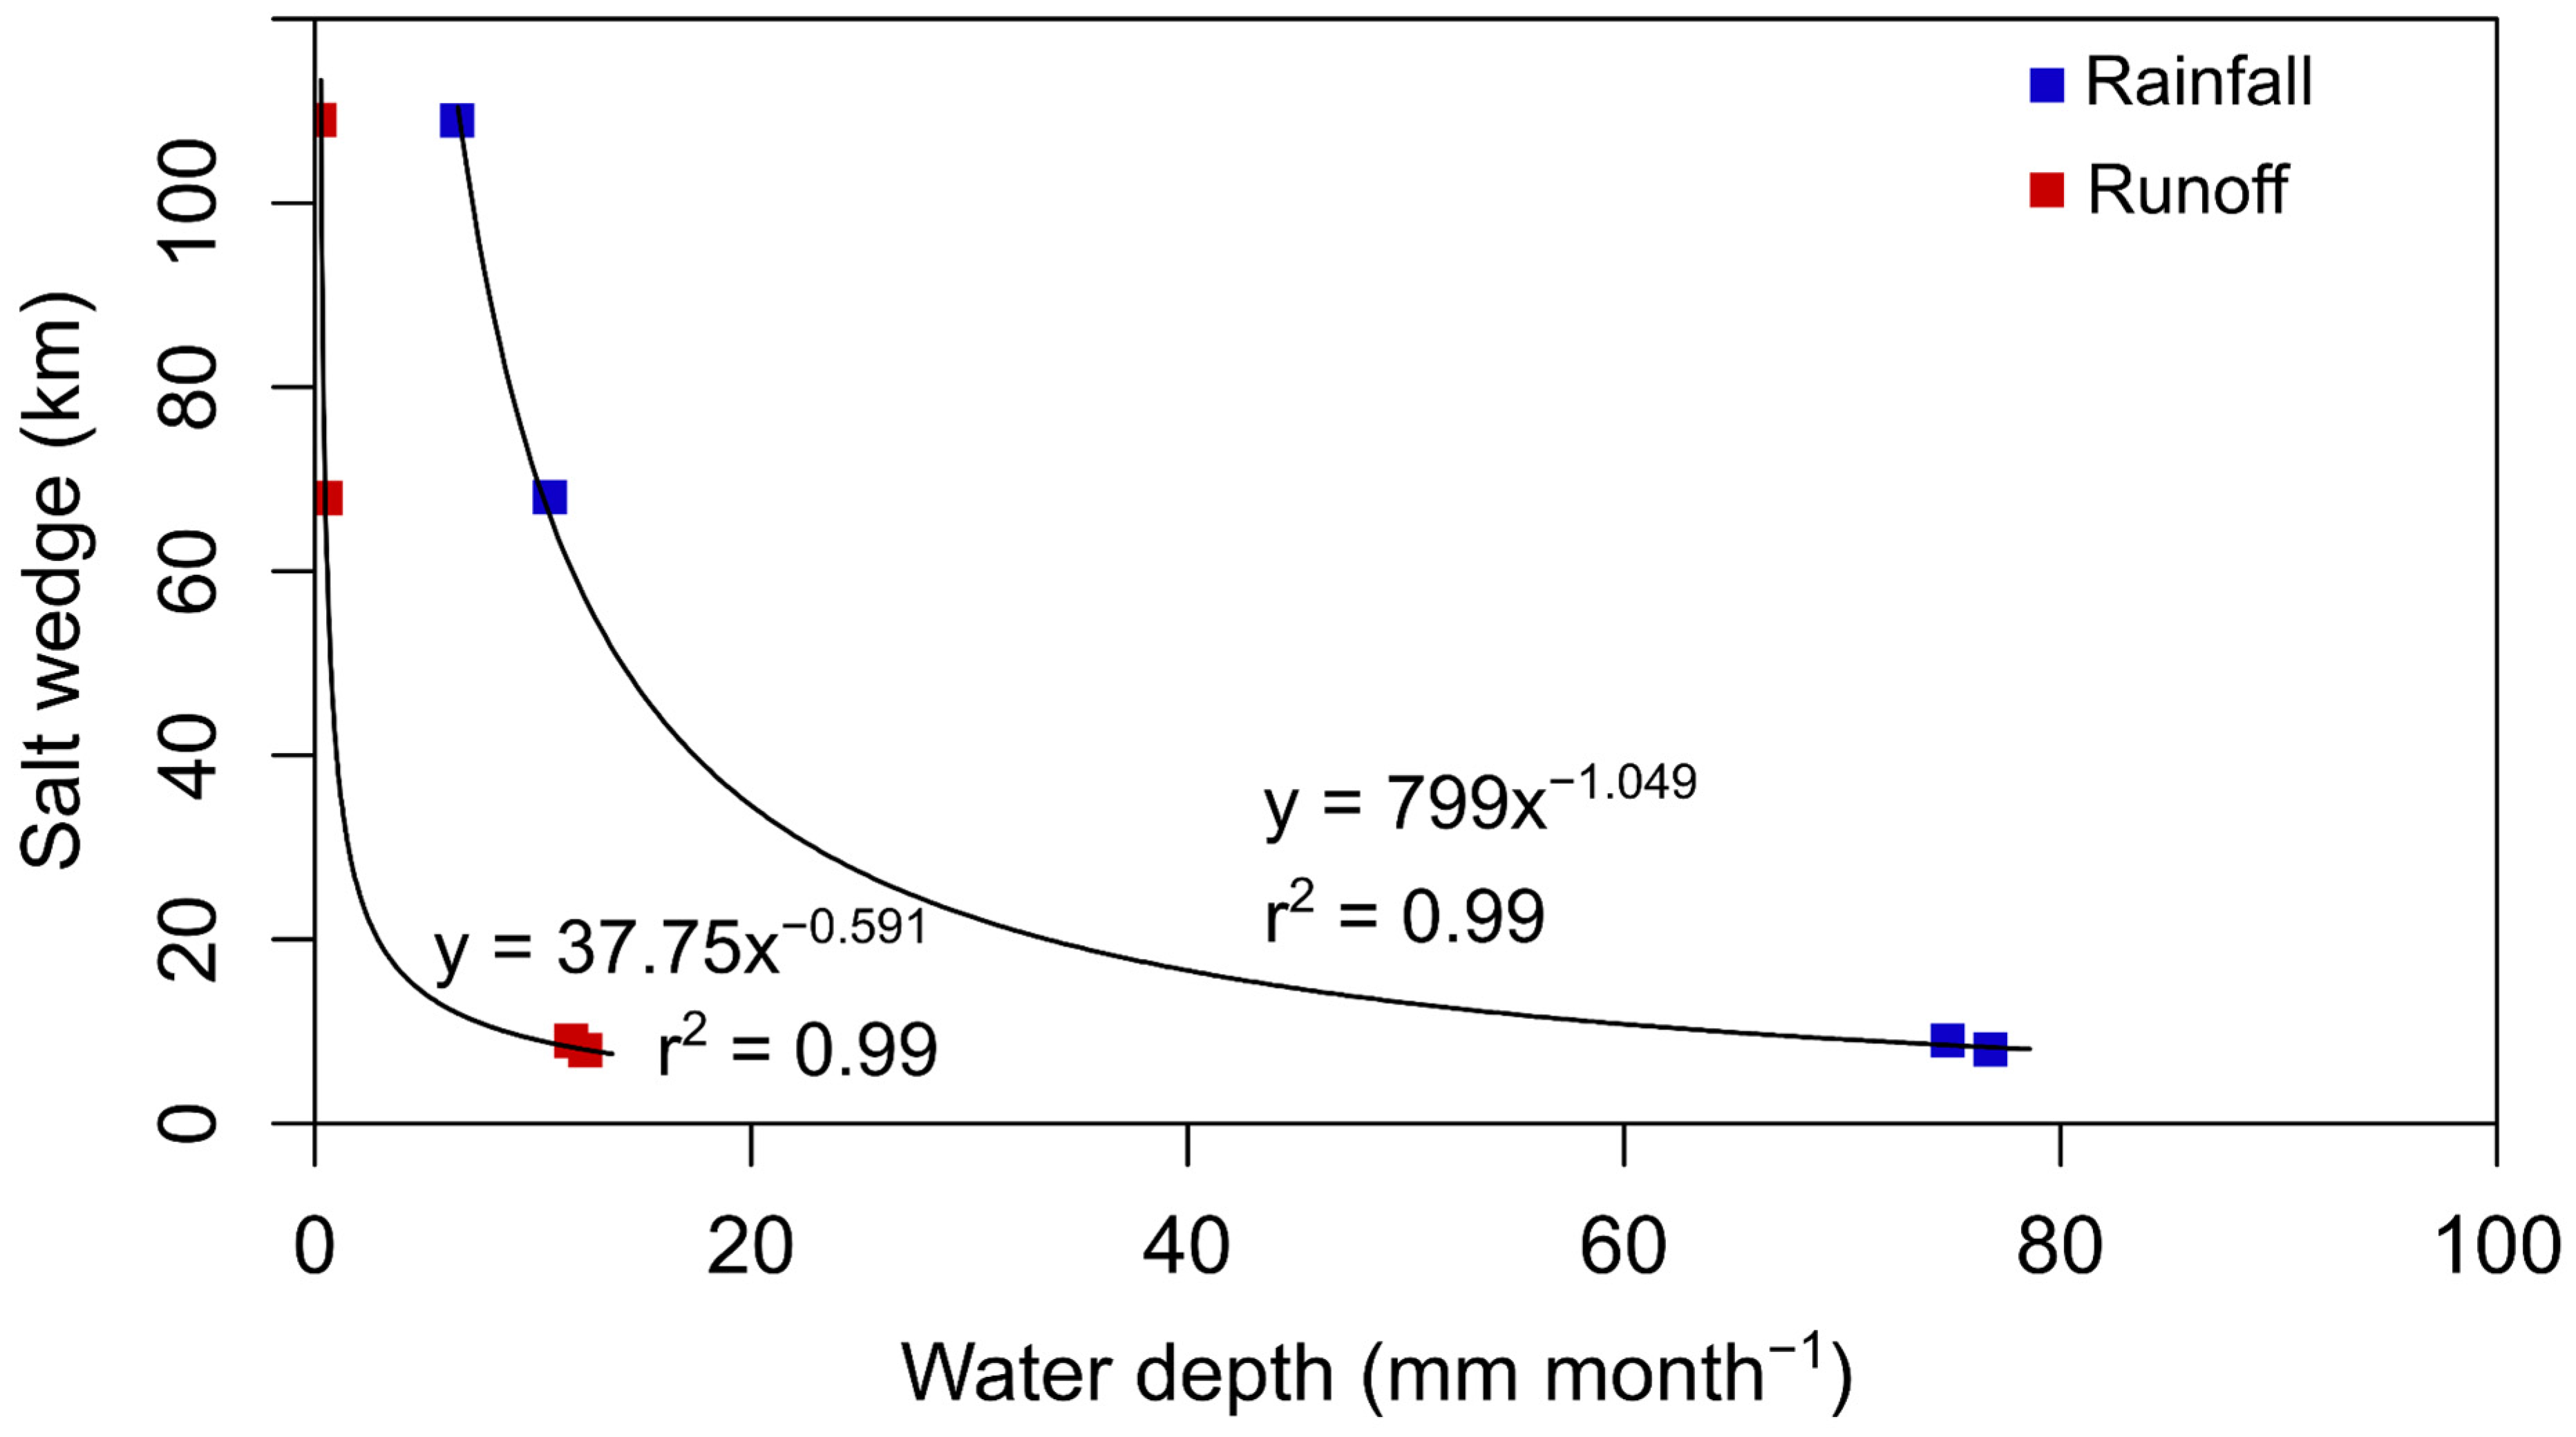
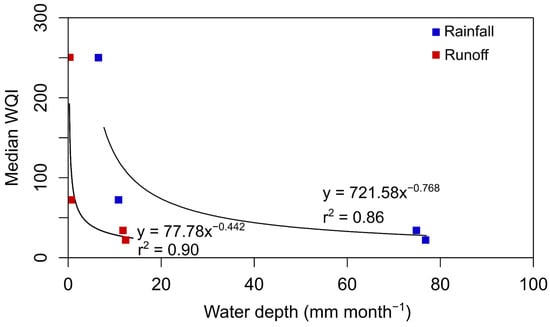
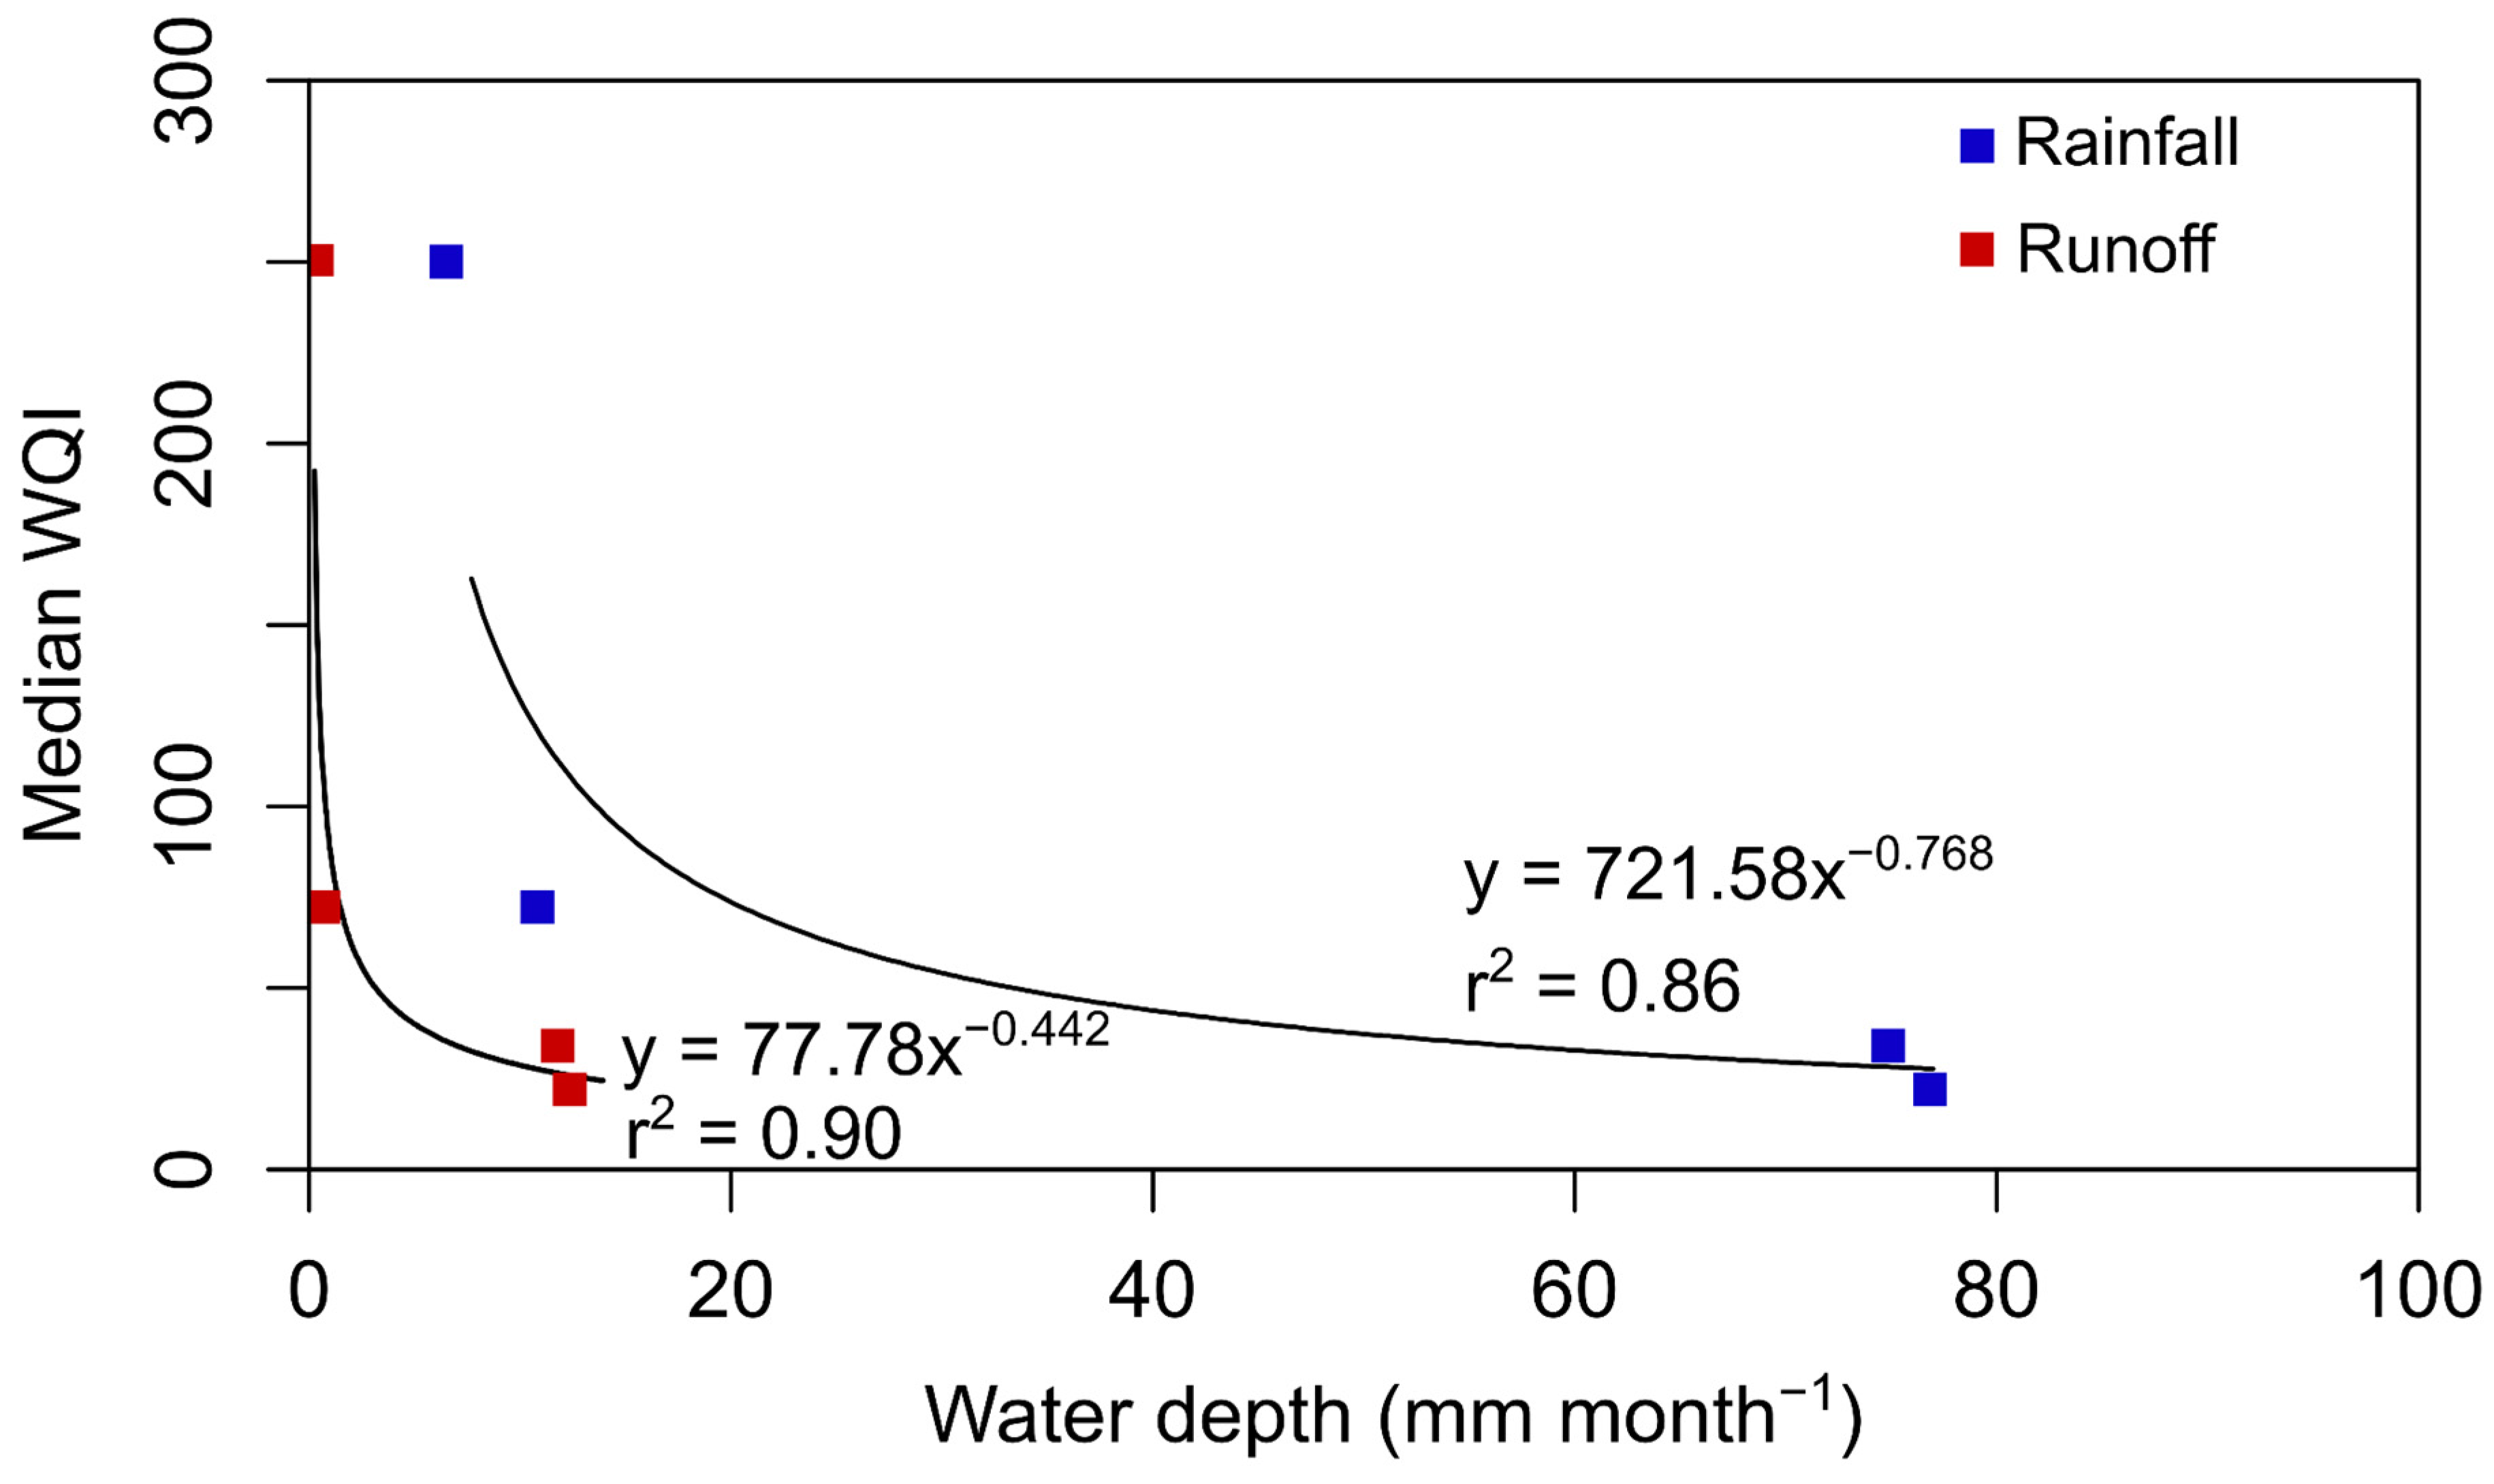
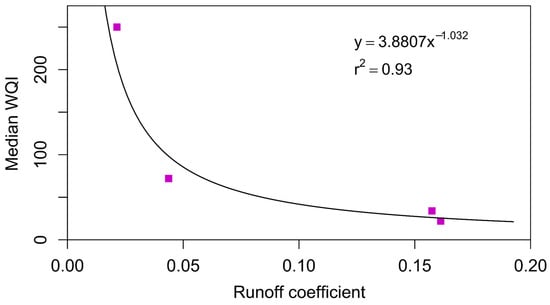
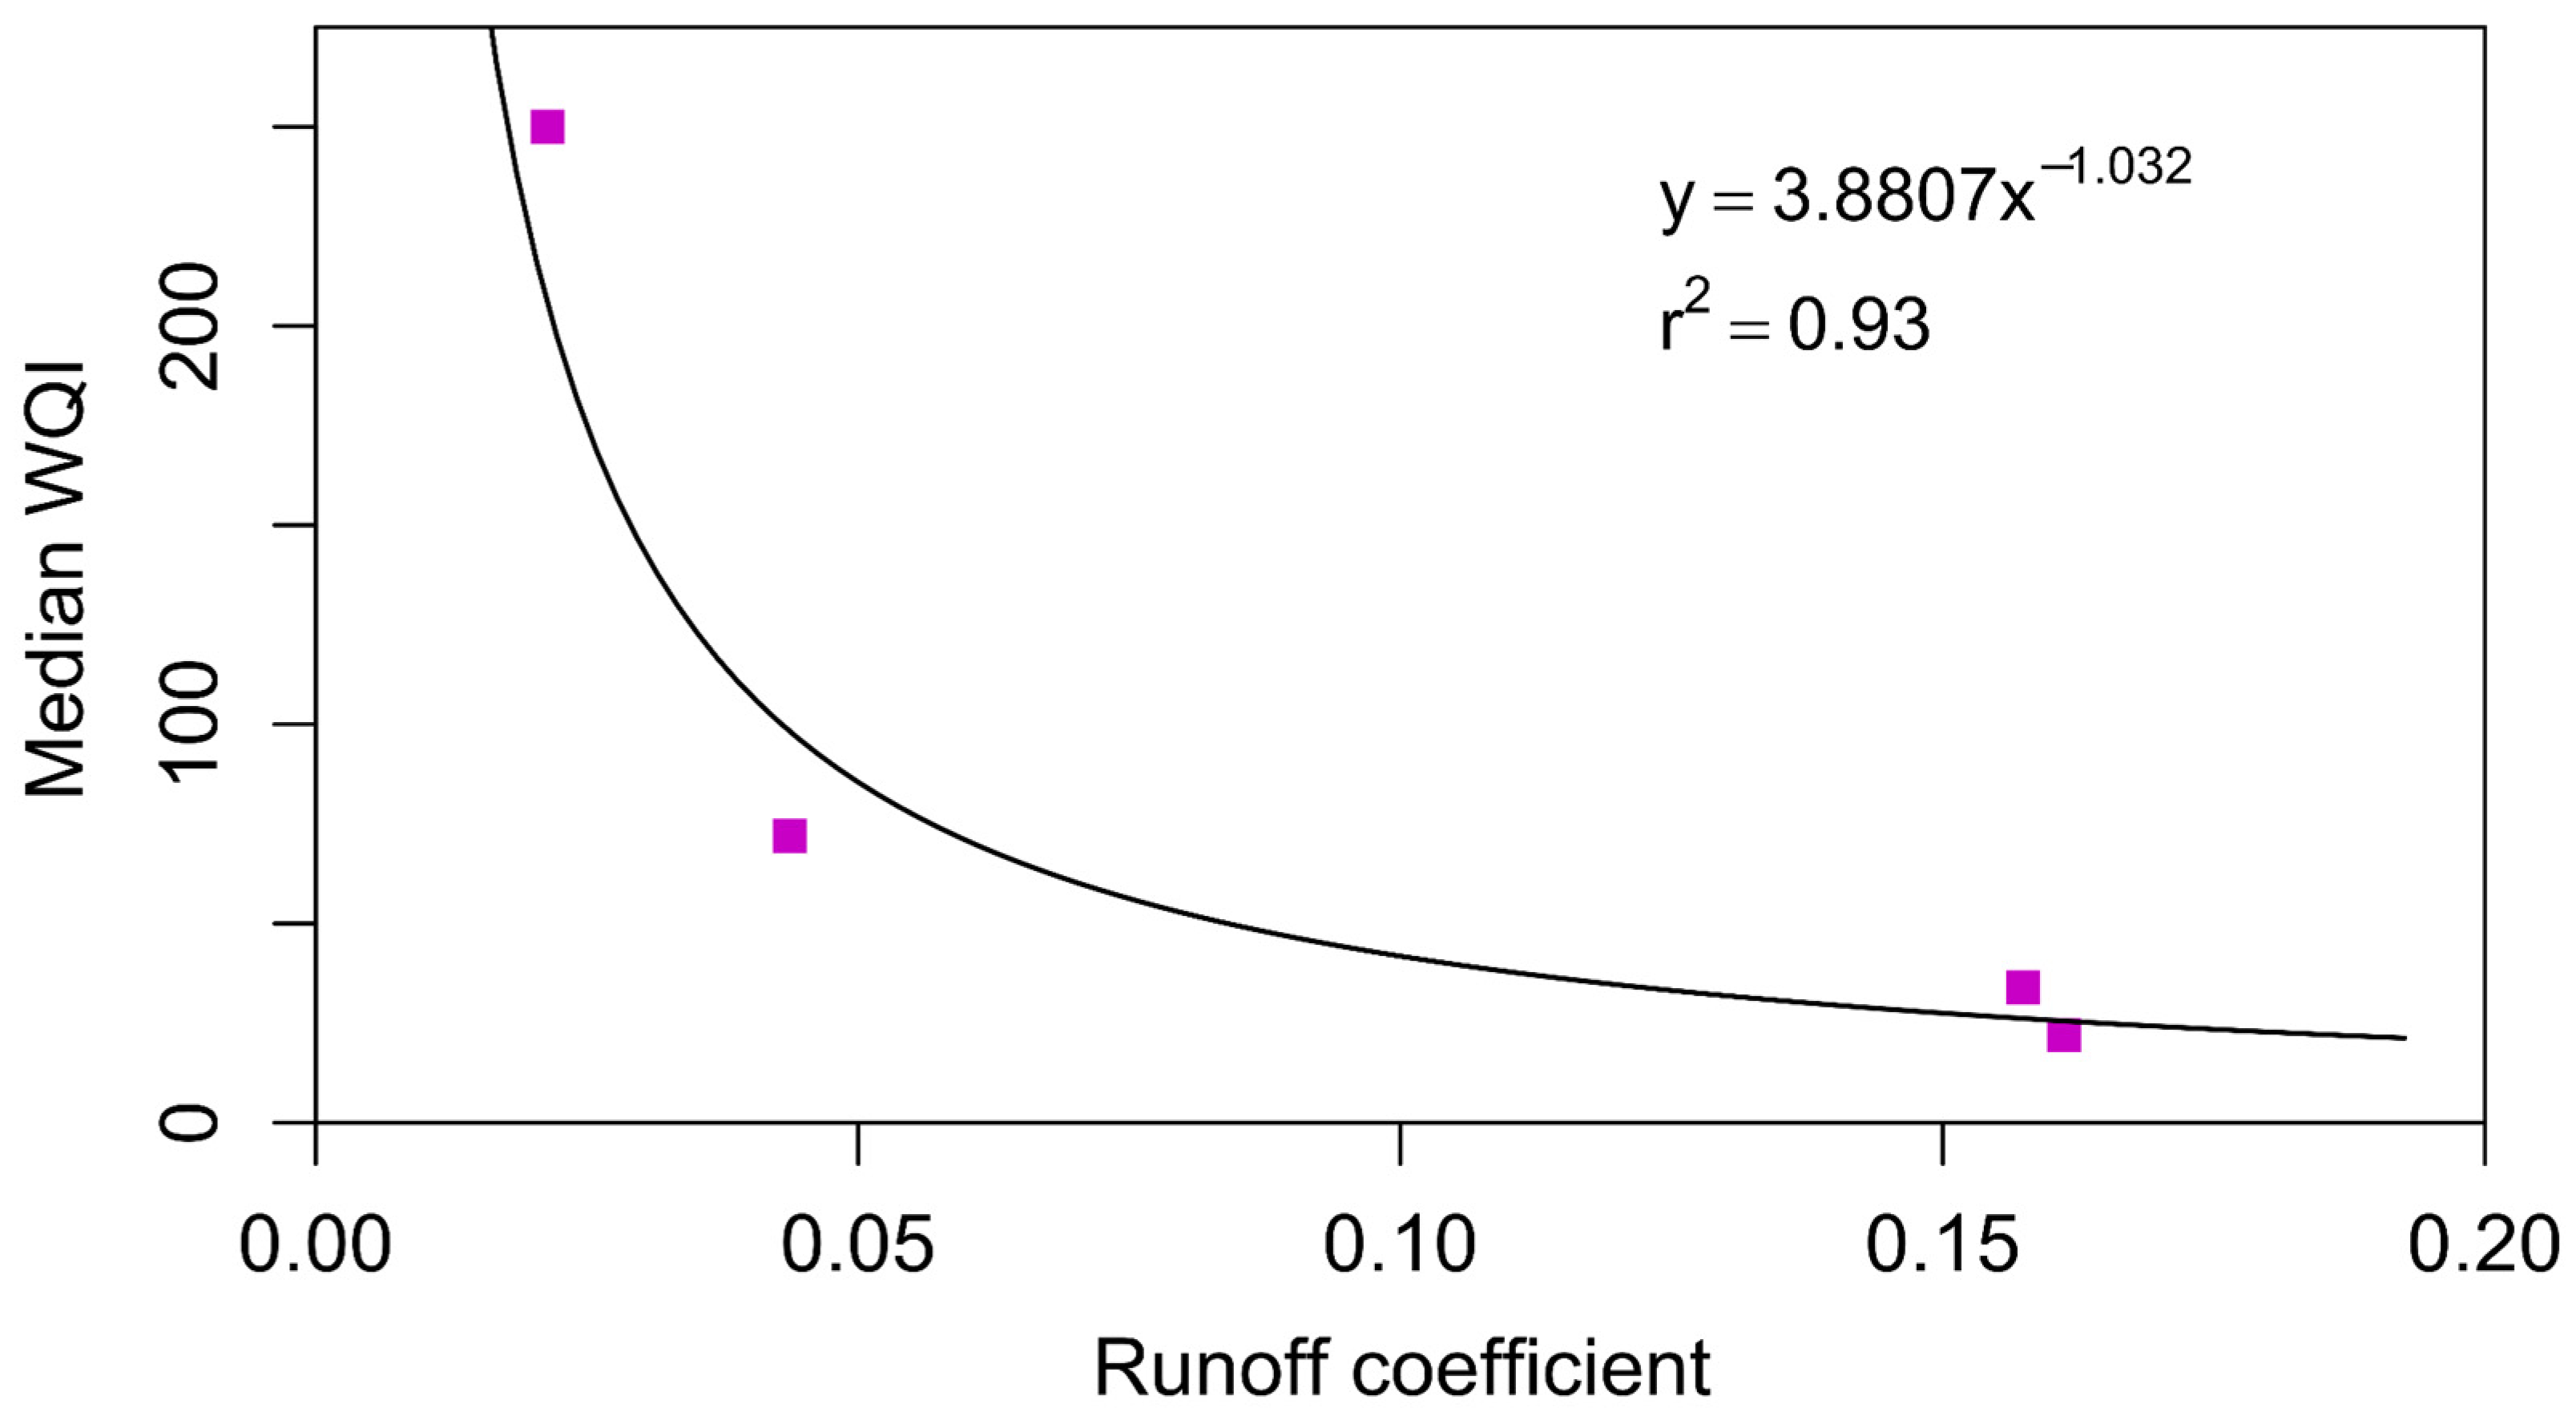
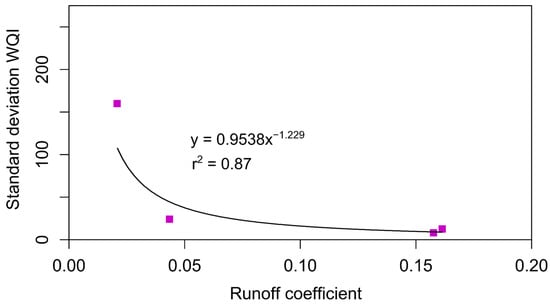
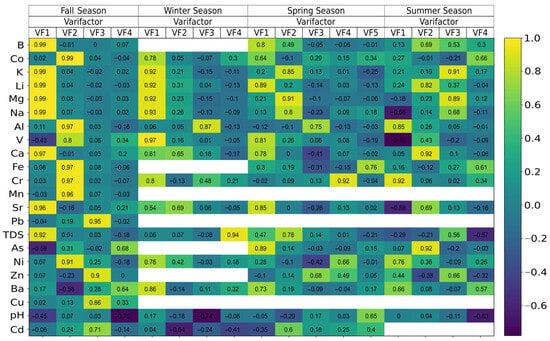
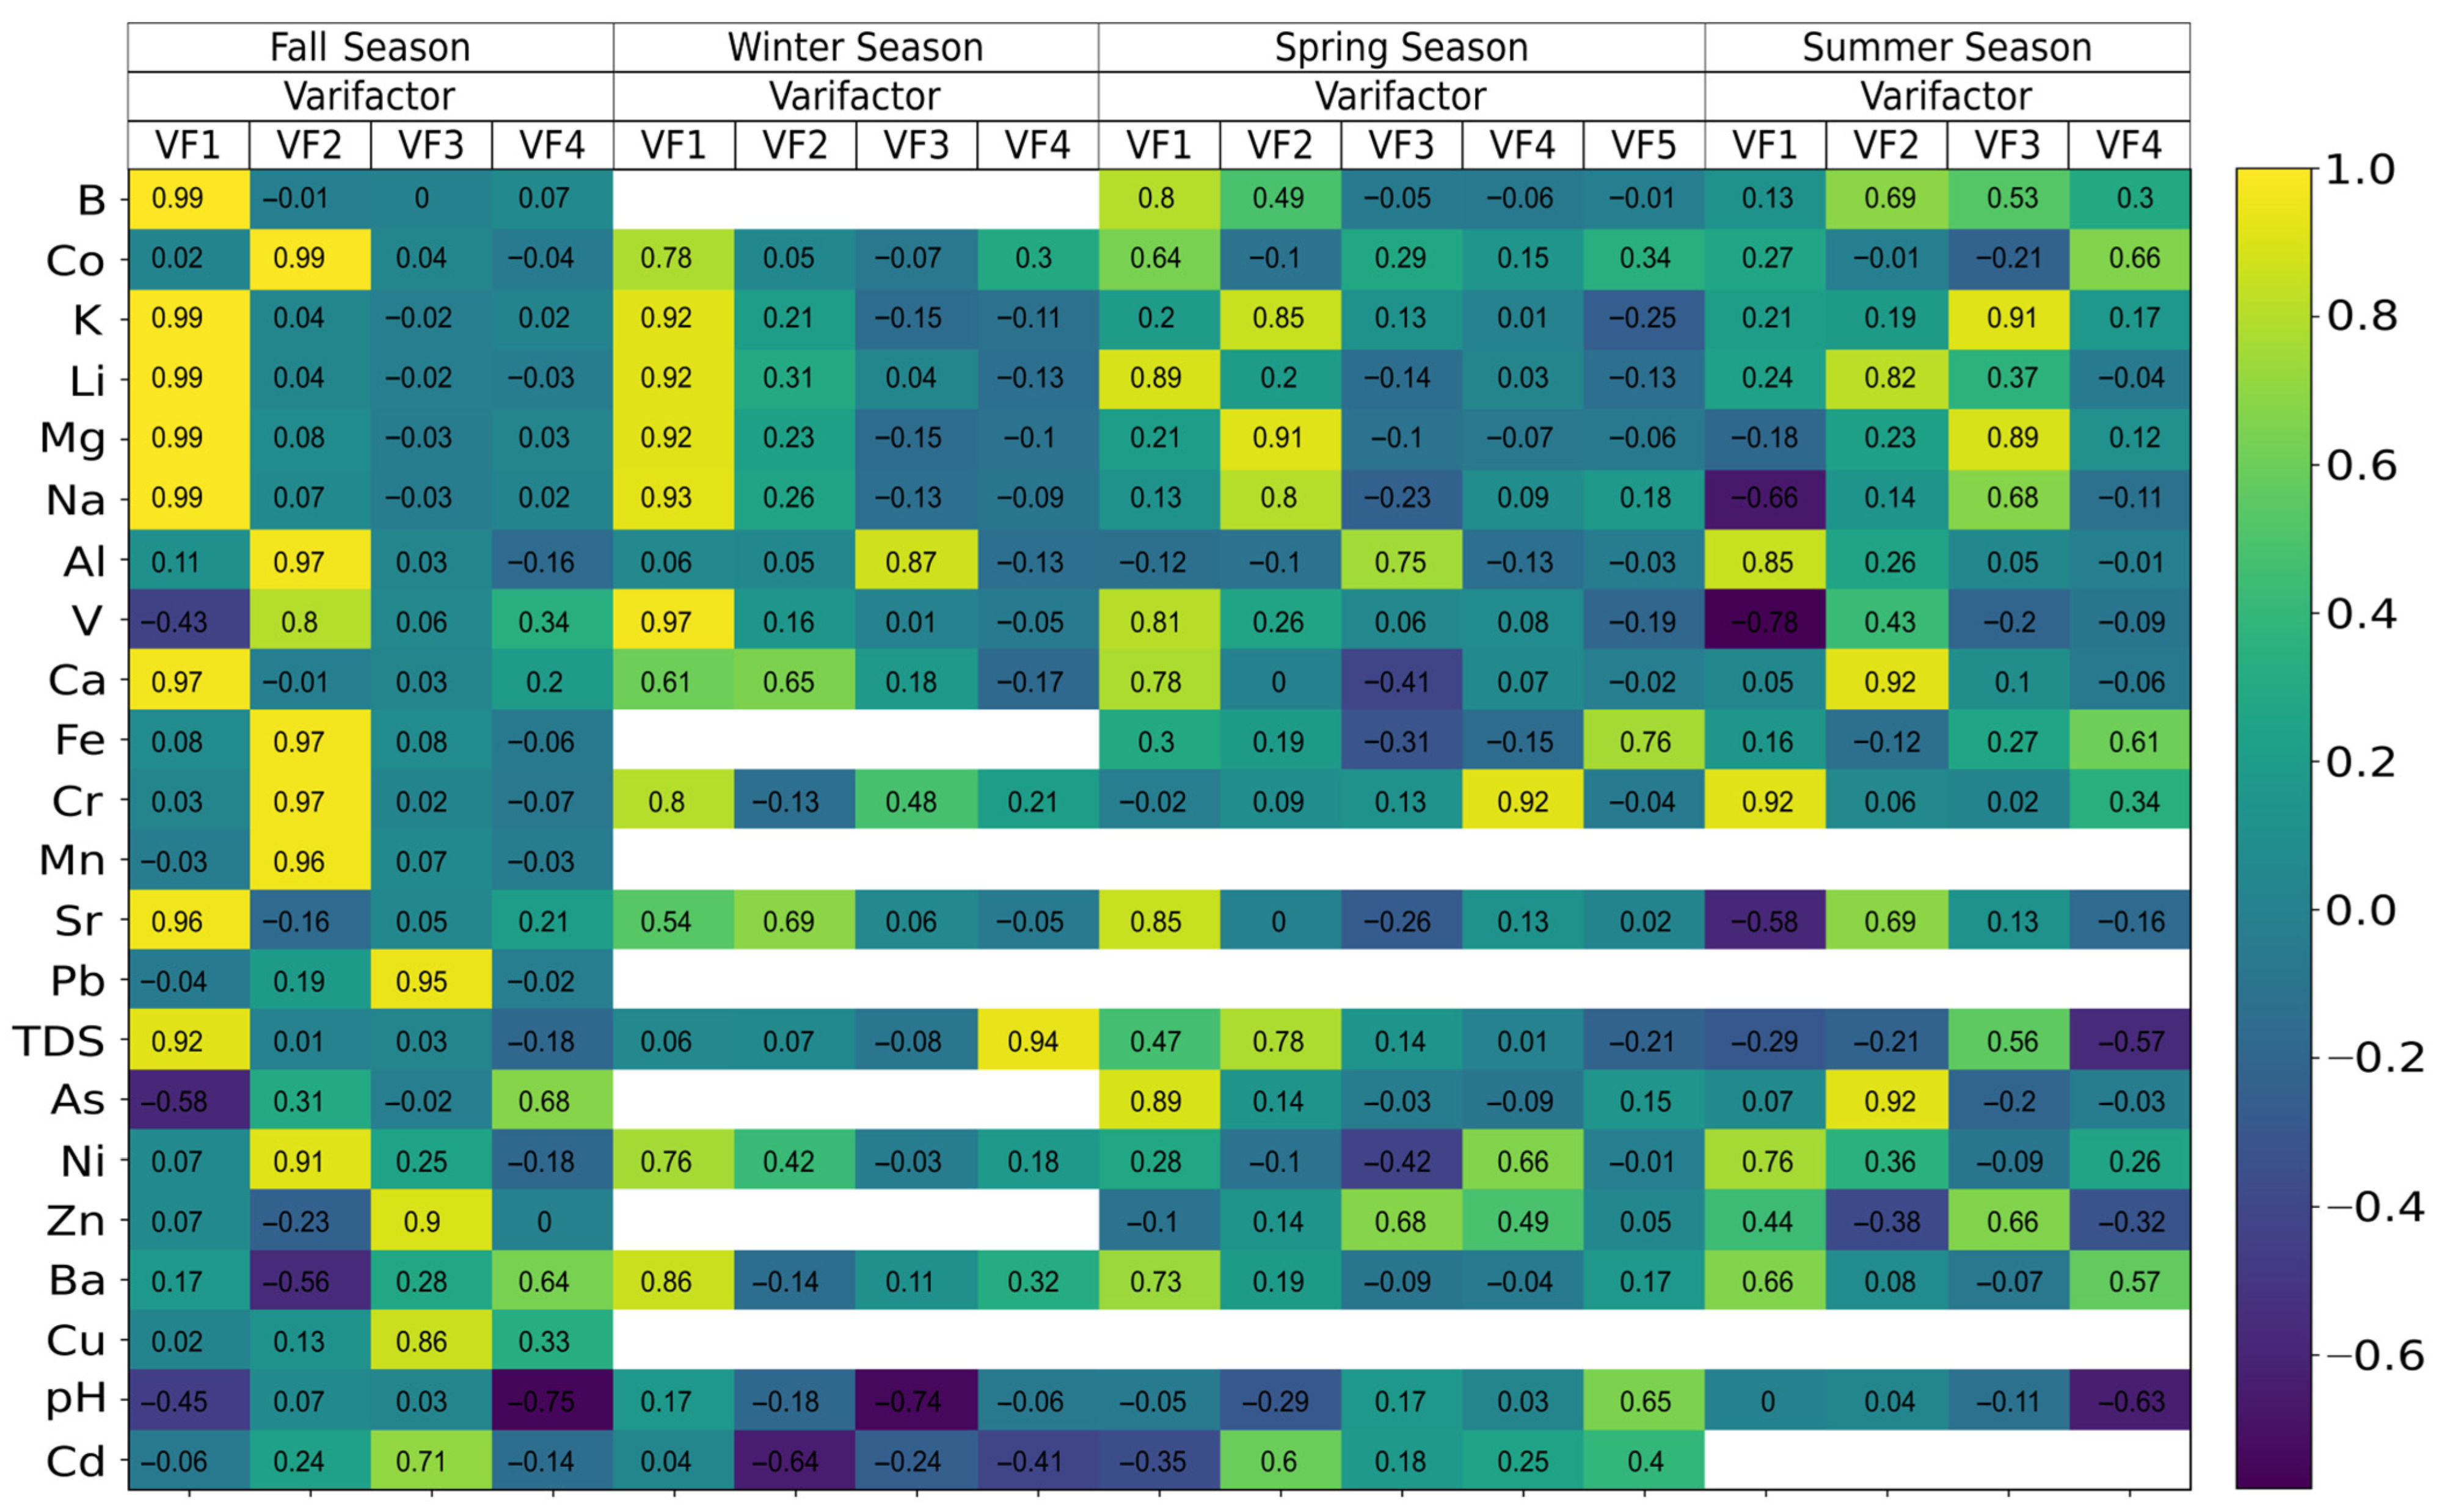
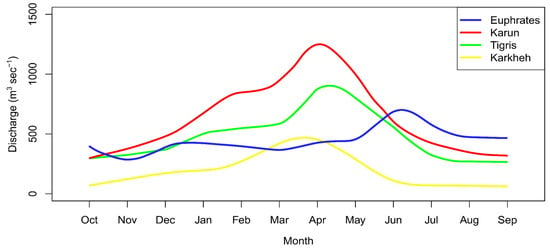
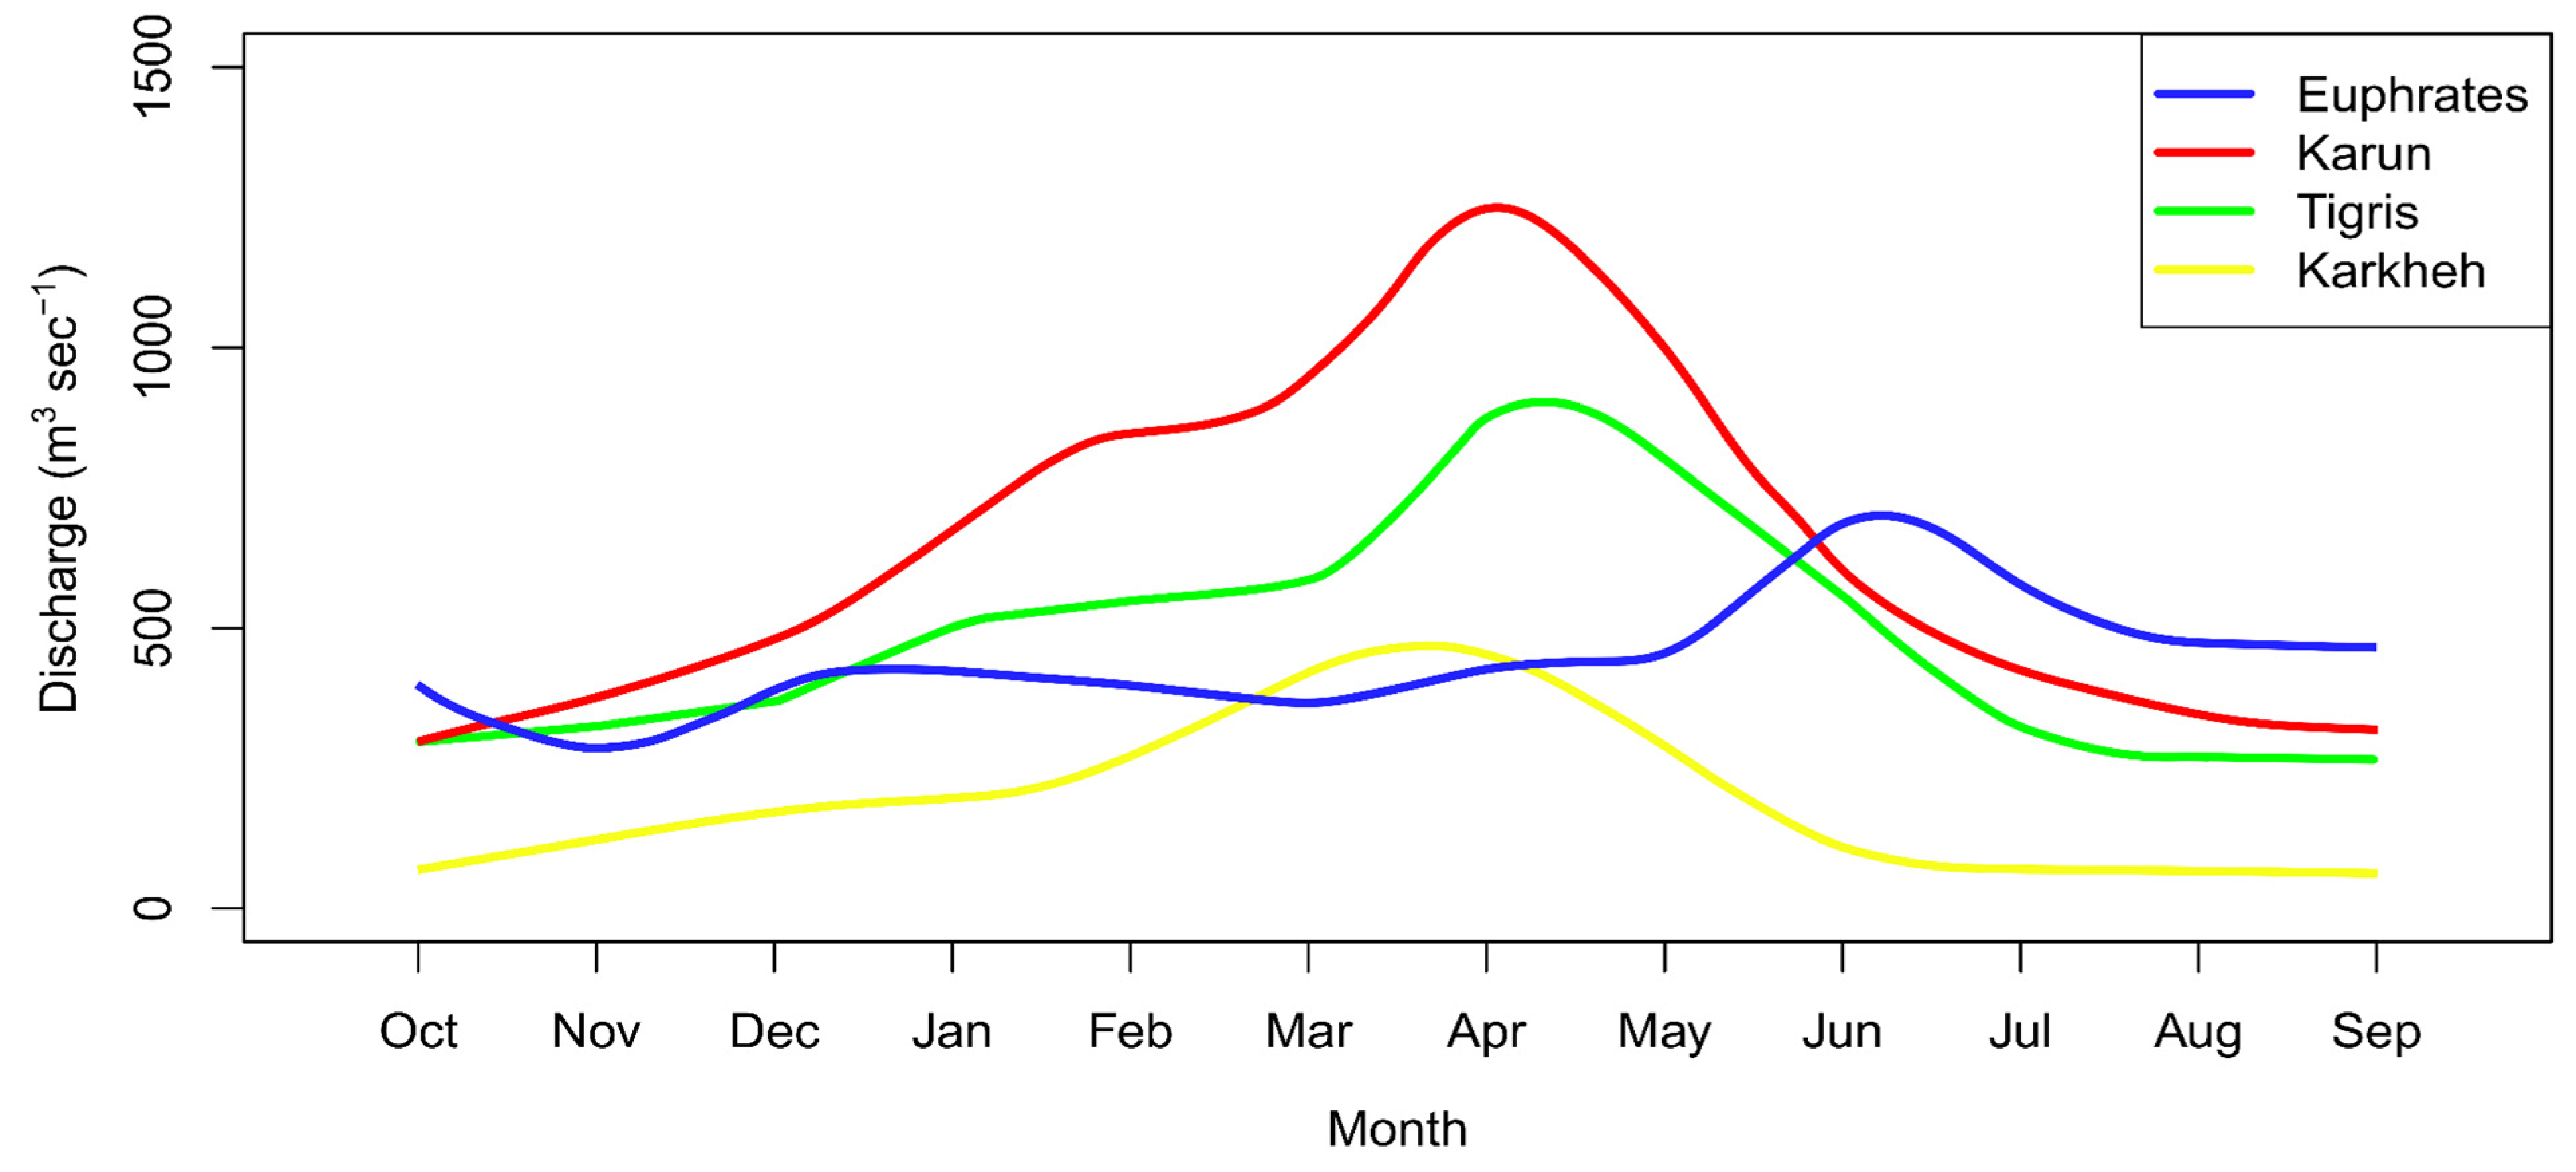

Disclaimer/Publisher’s Note: The statements, opinions and data contained in all publications are solely those of the individual author(s) and contributor(s) and not of MDPI and/or the editor(s). MDPI and/or the editor(s) disclaim responsibility for any injury to people or property resulting from any ideas, methods, instructions or products referred to in the content. |
© 2026 by the authors. Licensee MDPI, Basel, Switzerland. This article is an open access article distributed under the terms and conditions of the Creative Commons Attribution (CC BY) license.