


Abstract
The spatial–temporal impact of the El Niño–Southern Oscillation (ENSO) phenomenon in Peru is characterised by marked regional variability, affecting the economy and general well-being. This study focuses on the Piura region, which is highly sensitive to ENSO events, with the aim of determining the implications for land management and climate adaptation in the Peruvian coastal region, particularly in the context of ENSO events. The objective of the study is to ascertain the correlation between sea surface temperature (SST) anomalies and the Normalised Difference Vegetation Index (NDVI) in the region. The researchers employed a machine learning approach to model and predict monthly NDVI behaviour, incorporating spatial and seasonal variables from the Moderate Resolution Imaging Spectroradiometer (MODIS) during two periods of ENSO occurrence on the Peruvian coast (2017; 2023) and the one-year post-occurrence periods (2018; 2024). The results demonstrated a correlation between NDVI and SST anomalies in coastal provinces such as Sechura and Morropón, indicating sensitivity to oceanic conditions. In contrast, high Andean provinces such as Ayabaca and Huancabamba exhibited more moderate values, indicating a weaker dependence on SST variability. The study also found that the NDVI exhibited a marked monthly variation associated with altitudinal gradients and climatic conditions. This research demonstrates the potential of remote sensing and GIS technologies in capturing climate-sensitive land-use dynamics and provides a framework for operational monitoring and decision support.
1. Introduction
The El Niño–Southern Oscillation (ENSO) phenomenon is responsible for warming in the Pacific Ocean. This phenomenon has been demonstrated to be capable of precipitating arid conditions in specific geographical areas, such as South America, Southern Africa, and the Asian region, which in turn leads to a decline in the NDVI due to degradation and subsequent loss of vegetation [1,2,3,4]. Furthermore, the ENSO phenomenon disturbs the weather, environment, economy, and human lives worldwide [3,5,6]. Therefore, changes in sea temperature caused by the atmospheric circulation associated with the ENSO phenomenon may also affect water availability and agricultural productivity in the affected regions.
Furthermore, monitoring land-cover dynamics and extreme weather occurrences is important for land management planning and risk mitigation practices. In this regard, Jin et al. [7] pointed out that ENSO exerts a pivotal role in the configuration of global temperature and precipitation patterns, consequently affecting vegetation. Qian et al. [8] revealed that during ENSO events, the relationship between average temperatures and ENSO-induced climate anomalies in the southeastern Asian region experienced a decrease in gross primary productivity. In line with this, remote sensing and GIS technologies allow the analysis of changes in land use/land cover in urban and rural development [9]. Although Alvarez and Poveda [6] also found that soil moisture exhibited longer temporal persistence and stronger memory than the NDVI, and that ENSO indices had stronger correlations with soil moisture than with the NDVI in the South American region. Nevertheless, despite the growing body of literature examining the impacts of ENSO on vegetation dynamics and the spatiotemporal consequences of ENSO, there remain validation studies needed to assess its representativeness at the relevant spatiotemporal scales.
Regarding the reliability and effectiveness of remote sensing information in analysing land-cover changes in the agricultural sector, Leroux et al. [10] pointed out that activities such as remote sensing through the MODIS land-cover product remain difficult and a significant challenge for planning and decision support. Frimpong et al. [11] demonstrated that remote sensing monitoring tools, such as MODIS Land Surface Temperature, can provide farmers with practical information that enables them to manage natural landscapes in a manner that is conducive to weather variability in Ghana. Understanding spatiotemporal changes in land use and vegetation dynamics is crucial for sustainable environmental management and planning. Bojago et al. [12] pointed out that MODIS datasets are valuable for environmental monitoring, offering insights into land management and climate adaptation. Therefore, issues pertaining to spatial resolution, classification uncertainty, and the difficulty of capturing heterogeneous agricultural landscapes using MODIS require validation in context-specific situations to facilitate adaptive land management when it is aligned with end-user needs and local environmental conditions.
Consistent with these findings, Liu and Negrón Juárez [13] showed that satellite-derived NDVI exhibits stronger correlations with ENSO indices than rainfall records, and that combining ENSO indices with NDVI-based drought indicators improves the performance of ENSO-related drought onset prediction models in other regions. Likewise, Álvarez and Poveda [6] identified bidirectional nonlinear causal relationships between NDVI and ENSO indices, highlighting their joint influence on ecosystem dynamics and associated socioeconomic impacts across tropical South America. These results underscore the need for regionalised analyses to better capture the complex interactions between land surface processes and extreme climate variability in South America.
Remote sensing data and GIS are integrated using explicit spatial analysis procedures that establish a methodological link between satellite observations and machine learning modelling [14]. Satellite-derived NDVI and SST anomaly data are initially processed using GIS-based operations, including spatial alignment, zonal aggregation at the provincial level, and stratification along the coastal–Andean gradient [15,16,17]. Furthermore, these analyses convert pixel-level observations into territorially coherent units, facilitating the examination of spatial heterogeneity in vegetation responses to ENSO-related oceanic variability [18,19,20]. Subsequently, a Random Forest (RF) model is employed as a non-spatial statistical learning algorithm to model and project monthly NDVI values at the provincial scale [1]. In this study, “forecasting” denotes short-term, intra-annual projections of the NDVI conditioned on SST anomalies, seasonal effects, and historical vegetation patterns, rather than predictions of land-use change. The NDVI is interpreted as an empirical indicator of vegetation condition and land-cover dynamics; when analysed spatially, it provides evidence of differentiated land system responses relevant to climate-sensitive land management and agricultural planning in coastal and Andean regions. Therefore, the integration of satellite data, GIS, and RF modelling elucidates differentiated land system responses relevant to climate-sensitive land management rather than long-term land-use change trajectories.
In addition, the RF model offers a substantial advantage by allowing the identification of nonlinear and complex relationships between environmental variables [14,21,22,23]. Although the direct link between the SST and NDVI may be weak in some contexts [3], the RF approach can integrate multiple factors (such as the month of the year, geographic location, and historical NDVI values) to generate more robust and accurate estimates [13,24]. This capability is especially useful for projecting vegetation scenarios under extreme climatic conditions, such as the ENSO phenomenon events. In this sense, the model not only serves to improve NDVI prediction but also serves as a strategic tool for land management, agricultural planning, and climate change adaptation in vulnerable regions in developing countries.
This study aims to model and quantify the spatiotemporal relationship between SST anomalies associated with ENSO and terrestrial vegetation dynamics along the Peruvian coastal–Andean gradient. A Random Forest-based modelling framework is employed, integrating satellite-derived SST anomalies, seasonal indicators, and spatially aggregated NDVI data at the provincial scale. The research objectives are to (i) characterise spatial heterogeneity in NDVI sensitivity to oceanic thermal variability, (ii) capture nonlinear and seasonally modulated SST–NDVI interactions, and (iii) generate short-term, intra-annual NDVI projections relevant to climate-sensitive land management. This research is novel in its integration of ensemble machine learning with GIS-based spatial analysis to explicitly link ocean–atmosphere dynamics with land surface vegetation responses in a data-limited, developing-country context.
2. Materials and Methods
2.1. Location of the Study Area
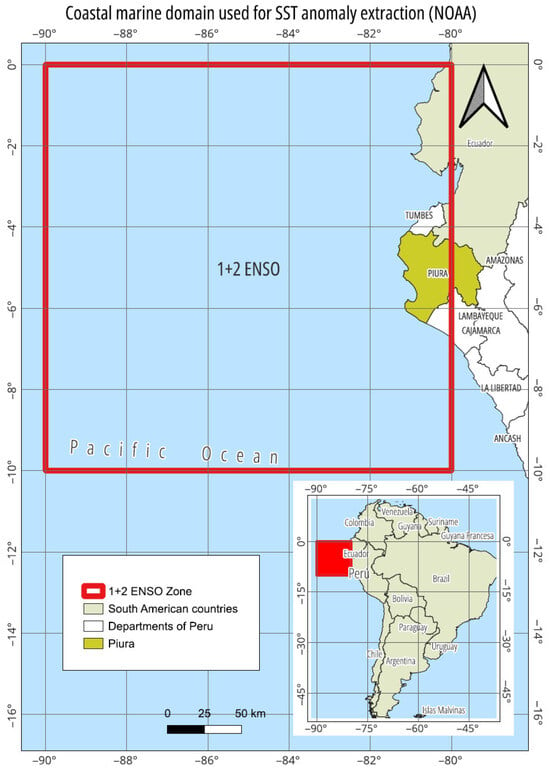
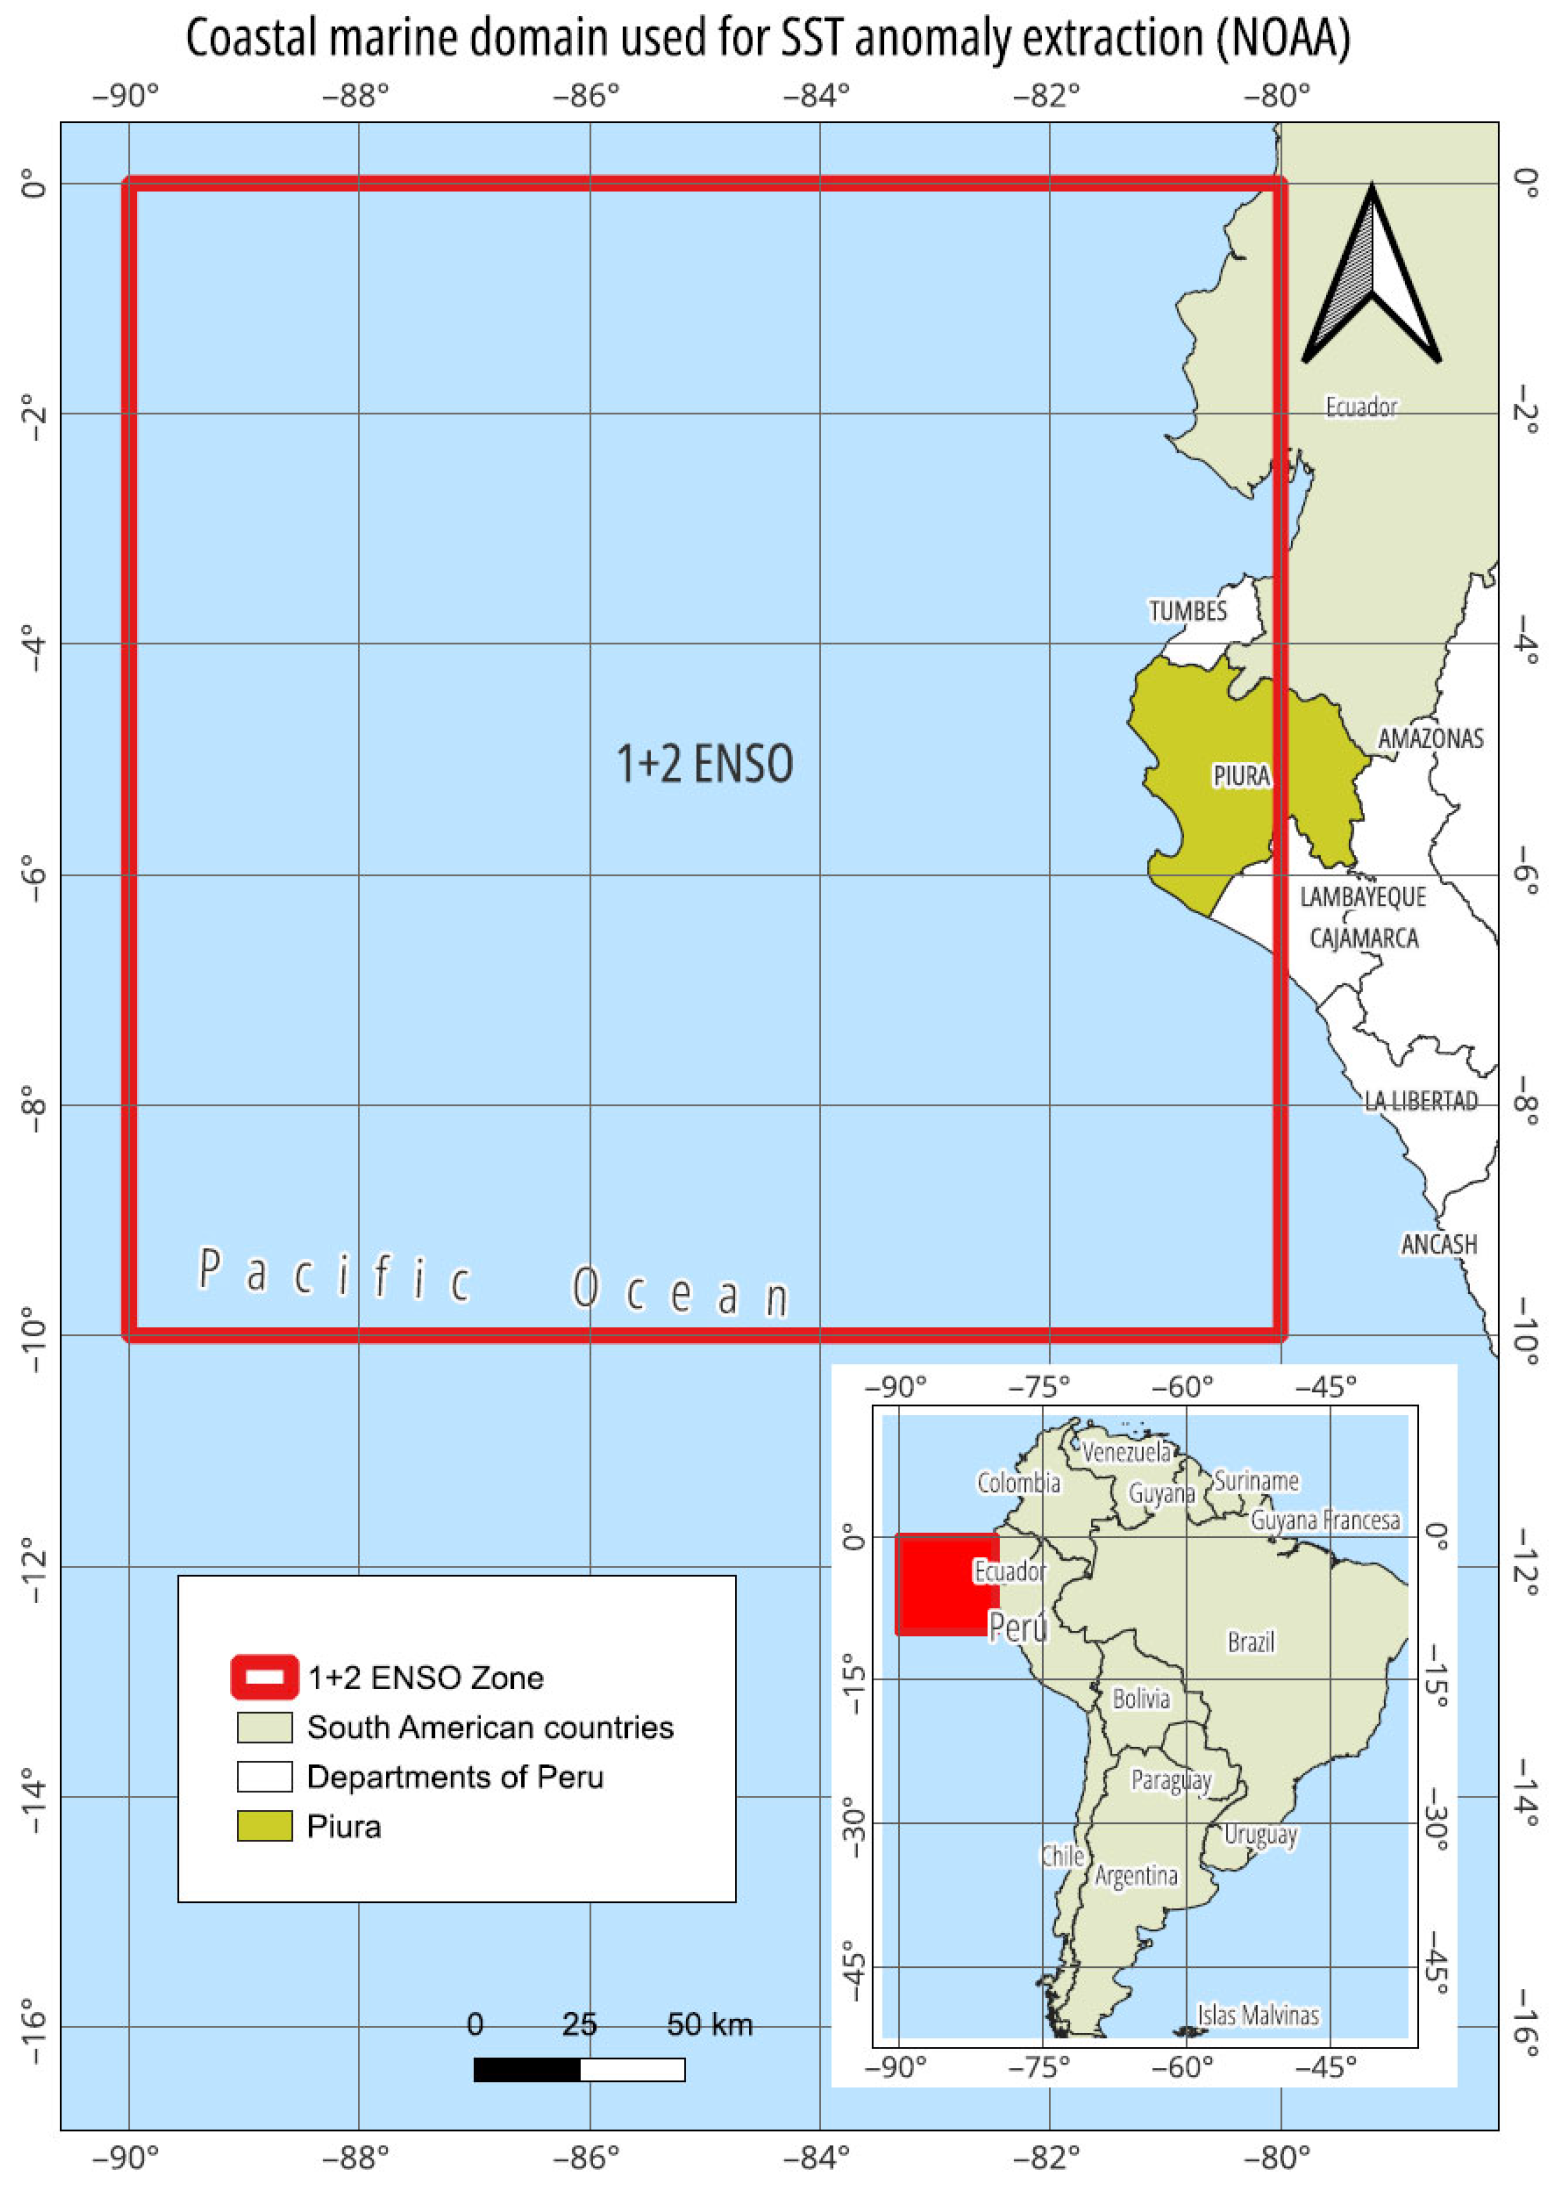
For this study, a spatiotemporal approach was employed in the Piura region, situated on the northern coast of Peru, between the coordinates 3°30′ and 6°00′ south latitude and 79°30′ and 81°00′ west longitude (Figure 1). This region comprises eight provinces (see Figure S1): Piura, Sullana, Talara, Paita, Sechura, Morropón, Ayabaca, and Huancabamba, which have marked climatic, topographic, and ecological heterogeneity [25]. The study area is defined as a coastal–Andean system, encompassing both coastal provinces adjacent to the Pacific Ocean and inland Andean provinces affected by ocean–atmosphere interactions associated with ENSO. Provinces such as Ayabaca and Huancabamba, although not directly bordering the coastline, are included due to their hydrological and climatic connectivity with ENSO-driven precipitation and moisture transport. The oceanic component of the analysis consisted of a coastal marine domain adjacent to the Piura region, from which sea surface temperature (SST) anomalies were extracted using NOAA datasets. These SST anomalies were spatially associated with terrestrial provinces using GIS methods, facilitating analysis of oceanic thermal variability as a climatic driver of terrestrial vegetation dynamics.
Figure 1.
The geographical location of the study area on the northern coast of Peru. The adjacent Pacific Ocean represents the marine domain from which sea surface temperature (SST) anomalies associated with ENSO were extracted and spatially linked to terrestrial vegetation dynamics.
Provincial-level NDVI behaviour was estimated by spatially aggregating pixel-level NDVI values derived from MODIS imagery within each provincial boundary using zonal statistics. Monthly mean NDVI values were then calculated for each province, enabling comparative analysis of vegetation responses across coastal, transitional, and high Andean territories. In order to estimate the behaviour of the NDVI at the provincial level in the Piura region, a prediction model based on the RF algorithm was implemented. This machine learning technique was selected due to its high capacity to capture nonlinear relationships and handle complex multivariate datasets, which is particularly useful in high spatiotemporal variability environmental contexts. The model was trained using available historical data from two periods of ENSO occurrence on the Peruvian coast (2017; 2023) and one year after the occurrence of the meteorological phenomenon (2018; 2024). The monthly and annual sea surface temperature anomalies, the month of the year, the province (as a categorical variable), and the historical average monthly NDVI value were incorporated as predictor variables. These variables allowed robust modelling of vegetation responses to oceanic thermal fluctuations, such as those induced by the ENSO.
The modelling procedure followed the steps described by Breiman [21], including the generation of multiple decision trees trained on random samples of the training set (bootstrap) and the random selection of variables in each tree partition. The model was evaluated using cross-validation techniques, employing metrics such as the coefficient of determination (R2), root mean square error (RMSE), and mean absolute error (MAE). The relative importance of the variables was analysed using the mean decrease in impurity method, which enabled the identification of predictors with the most significant influence on NDVI dynamics. This approach enabled the creation of reliable monthly NDVI estimates for each province, revealing spatial differences in the response of vegetation cover to extreme climatic conditions.
2.2. Historical Background of ENSO Impacts in the Piura Region
Table 1 shows historical records of the presence of the ENSO phenomenon along the Peruvian coast, particularly in the north coast, such as in the Piura region [26]. The ENSO phenomenon manifests itself mainly through heavy rains, flash floods, increased river flows, deterioration of agricultural infrastructure, and loss of vegetation cover in the provinces of Sechura, Paita, Talara, and Piura. These areas are highly sensitive to increases in SST, which may lead to reductions in NDVI associated with water stress and ecological disturbances in agricultural areas [26]. Conversely, in the high Andean provinces, such as Ayabaca and Huancabamba, the impact of the ENSO could be more variable. In some cases, temporary improvements in water availability can favour plant productivity and increase the NDVI; however, the persistence of extreme rainfall can trigger landslides, soil loss, and damage to traditional agroforestry systems [13]. The provinces of Morropón and Sullana, which are located in transition zones, have mixed dynamics: they are vulnerable to both drought and excessive precipitation, depending on the intensity and duration of the Niño event. These spatial differences in the impact of the ENSO justify a disaggregated evaluation by province, given that the response mechanisms of vegetation and production systems are not homogeneous along Piura’s coastal–Andean gradient.
Table 1.
Documented historical ENSO occurrences affecting the Piura region, presented for contextual background only. These events are not part of the satellite-based NDVI analysis.
The subsequent description of historical ENSO manifestations in the Piura region serves exclusively to provide climatic and territorial context (Table 1). These events demonstrate the long-term recurrence and severity of ENSO-related impacts on precipitation, flooding, infrastructure, and vegetation in northern Peru. However, these historical occurrences are not included in the quantitative analysis of vegetation dynamics. All empirical analyses of NDVI rely exclusively on satellite-derived data from the MODIS era, specifically 2017, 2018, 2023, and 2024, for which consistent spatial and temporal observations are available.
2.3. Sea Temperature Anomaly Dataset
Historical average sea-level temperature data for the coastal zone of the Piura region were obtained from the National Oceanic and Atmospheric Administration (NOAA). The NOAA/OISST/V2.1 product available on the Google Earth Engine provides global, interpolated information derived from satellite observations and ocean buoys at a resolution of 0.25°. It is one of the most widely used sources for analysing sea surface temperature anomalies (TSM). The “Piura coastal zone” refers to an oceanic strip in the eastern tropical Pacific adjacent to the Piura coast, approximately bounded by 3°30′ to 6°00′ south latitude and 79°30′ to 81°00′ west longitude. This marine domain encompasses multiple cells of the NOAA/OISST grid, rather than a single pixel. Although the NOAA/OISST dataset provides continuous SST anomaly records over multiple decades, this study restricts the analytical period to four specific years: 2017 and 2023 (ENSO occurrence years) and 2018 and 2024 (one-year post-ENSO periods). These years were selected to ensure consistency with the availability of satellite-derived NDVI data and to focus the analysis on recent ENSO events relevant for contemporary land management. Monthly sea surface temperature (SST) anomaly values were determined by averaging all grid cells within the predefined coastal polygon. MODIS MOD13Q1 NDVI data are provided at a 16-day temporal resolution. To derive monthly NDVI values, all NDVI composites intersecting each calendar month were averaged. This temporal aggregation yielded a single monthly NDVI value per pixel. Subsequently, pixel-level monthly NDVI values were aggregated within each provincial boundary using zonal statistics to compute provincial-scale mean monthly NDVI values. This approach yielded a spatially aggregated SST anomaly that characterises ocean conditions affecting the Piura region. For the anomaly value, we applied Equation (1):
where
SST Anomaly = T observed − T climatological
T observed = Sea surface temperature measured for a given month;
T climatological = Long-term monthly mean SST calculated over a standard 30-year reference period.
In this study, SST anomalies are interpreted as departures from the expected seasonal climatological conditions. Although mathematically expressed as a difference, these anomalies indicate atypical thermal conditions relative to the normal variability of the ocean–atmosphere system and are widely used to characterise ENSO-related oceanic disturbances.
2.4. Dataset for NDVI in the Piura Region Provinces
Data available for NDVI was obtained from the GEE platform [27]. Data from the Moderate Resolution Imaging Spectroradiometer (MODIS) version 6 Terra sensor (MOD13Q1) with a temporal resolution of 16 days, a spatial resolution of 250 metres, and classified as a level 3 product, were used in the NDVI Formula (2). NDVI values are expressed from −1 to 1, hence the term “normalised.” The values associated with vegetation provide an approximation of plant health, depending on the resolution of the input images:
where
NDVI = Normalised Difference Vegetation Index;
NIR = Near-Infrared Band;
RED = Red Band.
2.5. Generation of the Monthly and Provincial NDVI Response Model to SST Anomalies
The RF model was used to estimate the monthly NDVI values by province for the Piura region. Provinces were chosen as the spatial unit of analysis to maintain alignment with administrative boundaries and decision-making levels pertinent to land management and climate adaptation planning. The following monthly and annual sea surface temperature anomaly (SST anomaly) variables were used in addition to the monthly historical values, grouped by province in the two periods of ENSO occurrence on the Peruvian coast (2017; 2023) and one year after the occurrence of the meteorological phenomenon (2018; 2024), resulting in a total of 384 province–month records (8 provinces × 12 months × 4 years), to capture previous vegetation patterns. Monthly NDVI values were derived as spatial averages of MODIS NDVI at the pixel level within provincial boundaries. While provinces may encompass heterogeneous biophysical regions such as coastal plains, foothills, and Andean environments, aggregating at the provincial scale provides an integrative indicator of vegetation status. This approach is appropriate for inter-territorial comparisons in the context of ENSO-driven climate variability.
Months of the year and provinces represented categorical variables in the RF model, which, unlike linear regression, can model nonlinear interactions between NDVI and variables such as temperature, precipitation, or seasonal anomalies. By averaging multiple trees built on random subsets of the dataset, the risk of overfitting is reduced, and the generalisation of the model is improved. For data training, 70% (n = 269) of the historical data were used, and the remaining 30% (n = 115) was used for validation/testing. The analysis considered metrics such as R2, RMSE (root mean square error), and mean absolute error (MAE).
The Random Forest model functions as both a predictive and descriptive tool in this study. The R2 metric quantifies the proportion of variance in NDVI, SST anomalies, seasonality, and spatial units that the model explains. However, these metrics do not establish causal ecological or climatic mechanisms. Because the Random Forest approach does not isolate individual physical drivers, the observed associations should be regarded as statistical relationships rather than direct evidence of causation.
Omitting key terrestrial drivers such as precipitation, air temperature, soil moisture, land cover, and human land use limits the model’s interpretability because these drivers directly affect NDVI values. Aggregating data at the provincial level reduces local variability and eases regional comparison, but it cannot replace the explanatory insight offered by these proximate drivers, which causally influence NDVI outcomes. As a result, the unexplained NDVI variance reflects both random noise and unmodeled terrestrial processes, potentially obscuring SST signals at the local scale.
Model-Based Extrapolation of Monthly NDVI Patterns for the Year 2025
A consolidated database that integrates monthly NDVI records from the MODIS sensor and SST anomalies was used. The database contains disaggregated information at the district and province levels of the department of Piura (Peru) for the two ENSO evaluation periods. To generate trends, NDVI values were aggregated by province, month, and year using the simple average. A grouping by province, month, and year was performed: NDVI values were averaged monthly for each province. For each month of the year, the mean and range (minimum and maximum) of the NDVI observed in the years analysed were calculated. The 2025 NDVI values are model-based extrapolations that rely on historical patterns observed during ENSO and post-ENSO years. This approach differs from forecasts that rely on independent future climate scenarios.
A multiple-line graph with shaded bands was used to show the monthly mean NDVI by province and the range of interannual variability (shade) by month. The graphs were generated in Python using pandas, matplotlib, and seaborn libraries. Each line represents the monthly mean NDVI in a province, and the shading indicates the observed variability over the four years.
3. Results
3.1. Monthly Behaviour of the Sea Surface Temperature Anomalies
The monthly SST anomaly values presented in Table 2 reveal clear interannual and seasonal variability across the analysed years. Higher positive anomalies are observed during the first quarter of 2017, while in 2023, elevated SST anomalies persist across a broader portion of the annual cycle. These patterns indicate differences in the temporal distribution and magnitude of SST anomalies among years affected by ENSO events and post-event conditions.
Table 2.
Average SST measured by month in years of ENSO occurrence on the Peruvian coast (2017; 2023) and one year after the occurrence (2018; 2024).
In this study, references to ENSO types (e.g., coastal ENSO in 2017 and global ENSO in 2023) serve as an interpretative framework to contextualise observed SST anomaly patterns, based on classifications reported in the literature. No formal statistical analysis was conducted to isolate the influence of ENSO type from other potential drivers of SST variability. Therefore, the differences in anomaly magnitude, seasonal persistence, and range should be interpreted as descriptive patterns rather than as statistically tested causal effects.
This increase corresponds with the most intense 2017 and 2023 ENSO activity periods in the southeastern Pacific region, which have historically affected the coastal areas of northern Peru. Regarding the elevated mean values, the range of observed anomalies (represented by the minimum-to-maximum spread) was notably wider during the ENSO occurrence year, indicating a higher frequency of thermal extremes. The observed variations in SST anomaly patterns are consistent with differences reported in the literature between ENSO event types. The phenomenon in 2017 was designated “Coastal ENSO”, while that experienced in 2023 was “Global ENSO”. Takahashi [28] defines the “Global ENSO” phase as being characterised by a warm ENSO, which may coincide with the characteristics of an ENSO but does not necessarily conform to them. Furthermore, the data under evaluation includes SST anomaly measurements from one year after the occurrence of ENSO 2017 and 2023. In this regard, Table 2 shows the monthly average SST anomaly data for the years 2018 and 2024, represented by the minimum-to-maximum spread in 2018 [−0.70–0.87 °C] and 2024 [−0.54–1.21 °C], respectively.
These results underscore the significance of ocean–atmosphere interactions, particularly sea surface temperature anomalies, influencing the variability of terrestrial climate. Therefore, the evidence supports the integration of such variables into ecological models and regional land management strategies.
3.2. Seasonal Variability of NDVI Across Provinces
The temporal pattern of vegetation activity, expressed as the monthly NDVI, exhibited an average seasonality across all provinces in the Piura region during the two periods of ENSO occurrence and the following year (Table 3). Transitional provinces, such as Morropón and Piura, exhibited greater inter-annual NDVI variability, possibly influenced by mixed land use and intermediate elevations. Overall, the inclusion of post-2018 observations (2023–2024) supports the robustness of these patterns across different ENSO-influenced years, reinforcing the sensitivity of vegetation productivity to ocean–atmosphere interactions in the northern Peruvian landscape.
Table 3.
Provincial-level monthly NDVI statistics derived from MODIS data for ENSO occurrence years (2017, 2023) and post-ENSO years (2018, 2024), including mean values, interannual variability, and sample size.
According to Table 3, highland provinces such as Huancabamba and Ayabaca consistently recorded the highest NDVI values throughout the year, with peaks between April and June, likely due to persistent soil moisture and dense vegetative cover. Mid-elevation provinces, such as Morropón and Sullana, exhibited intermediate NDVI values with moderate seasonality. In contrast, coastal provinces, including Sechura, Paita, and Talara, displayed the lowest NDVI levels, reflecting more arid conditions and sparse vegetation. In March, the NDVI minimum was consistently observed across all provinces, corresponding to periods of intense rainfall and possible vegetation stress due to waterlogging or cloud cover interference in satellite imagery. In contrast, the values tended to increase from April through July, indicating vegetative recovery after rainfall. The spread between minimum and maximum NDVI per province also varied, being wider in transition zones (e.g., Piura and Morropón) where land use is more heterogeneous and climatic gradients are sharper. These results underscore the importance of spatial disaggregation when evaluating vegetation dynamics in regions influenced by both altitudinal and oceanic climatic factors. Moreover, across provinces, the NDVI exhibited a marked monthly variation associated with altitudinal gradients and climatic conditions. Highland areas, such as Huancabamba and Ayabaca, consistently maintained high NDVI values throughout the year, peaking between April and July, likely due to persistent soil moisture and dense forest cover. In contrast, coastal provinces, including Sechura, Paita, and Talara, showed markedly lower NDVI levels and reduced seasonal amplitude, consistent with more arid conditions and sparser vegetation.
The data also highlights a recurrent decline in NDVI in March, coinciding with periods of intense precipitation related to warm oceanic anomalies. This decline may be attributed to either water-induced vegetation stress or cloud contamination in satellite imagery.
3.3. Model Response of NDVI Provinces to Sea Surface Temperature Anomalies Using the Random Forest Approach
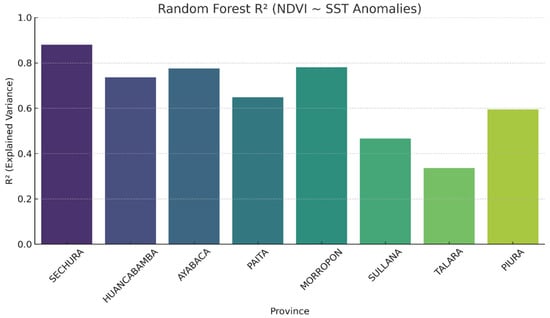
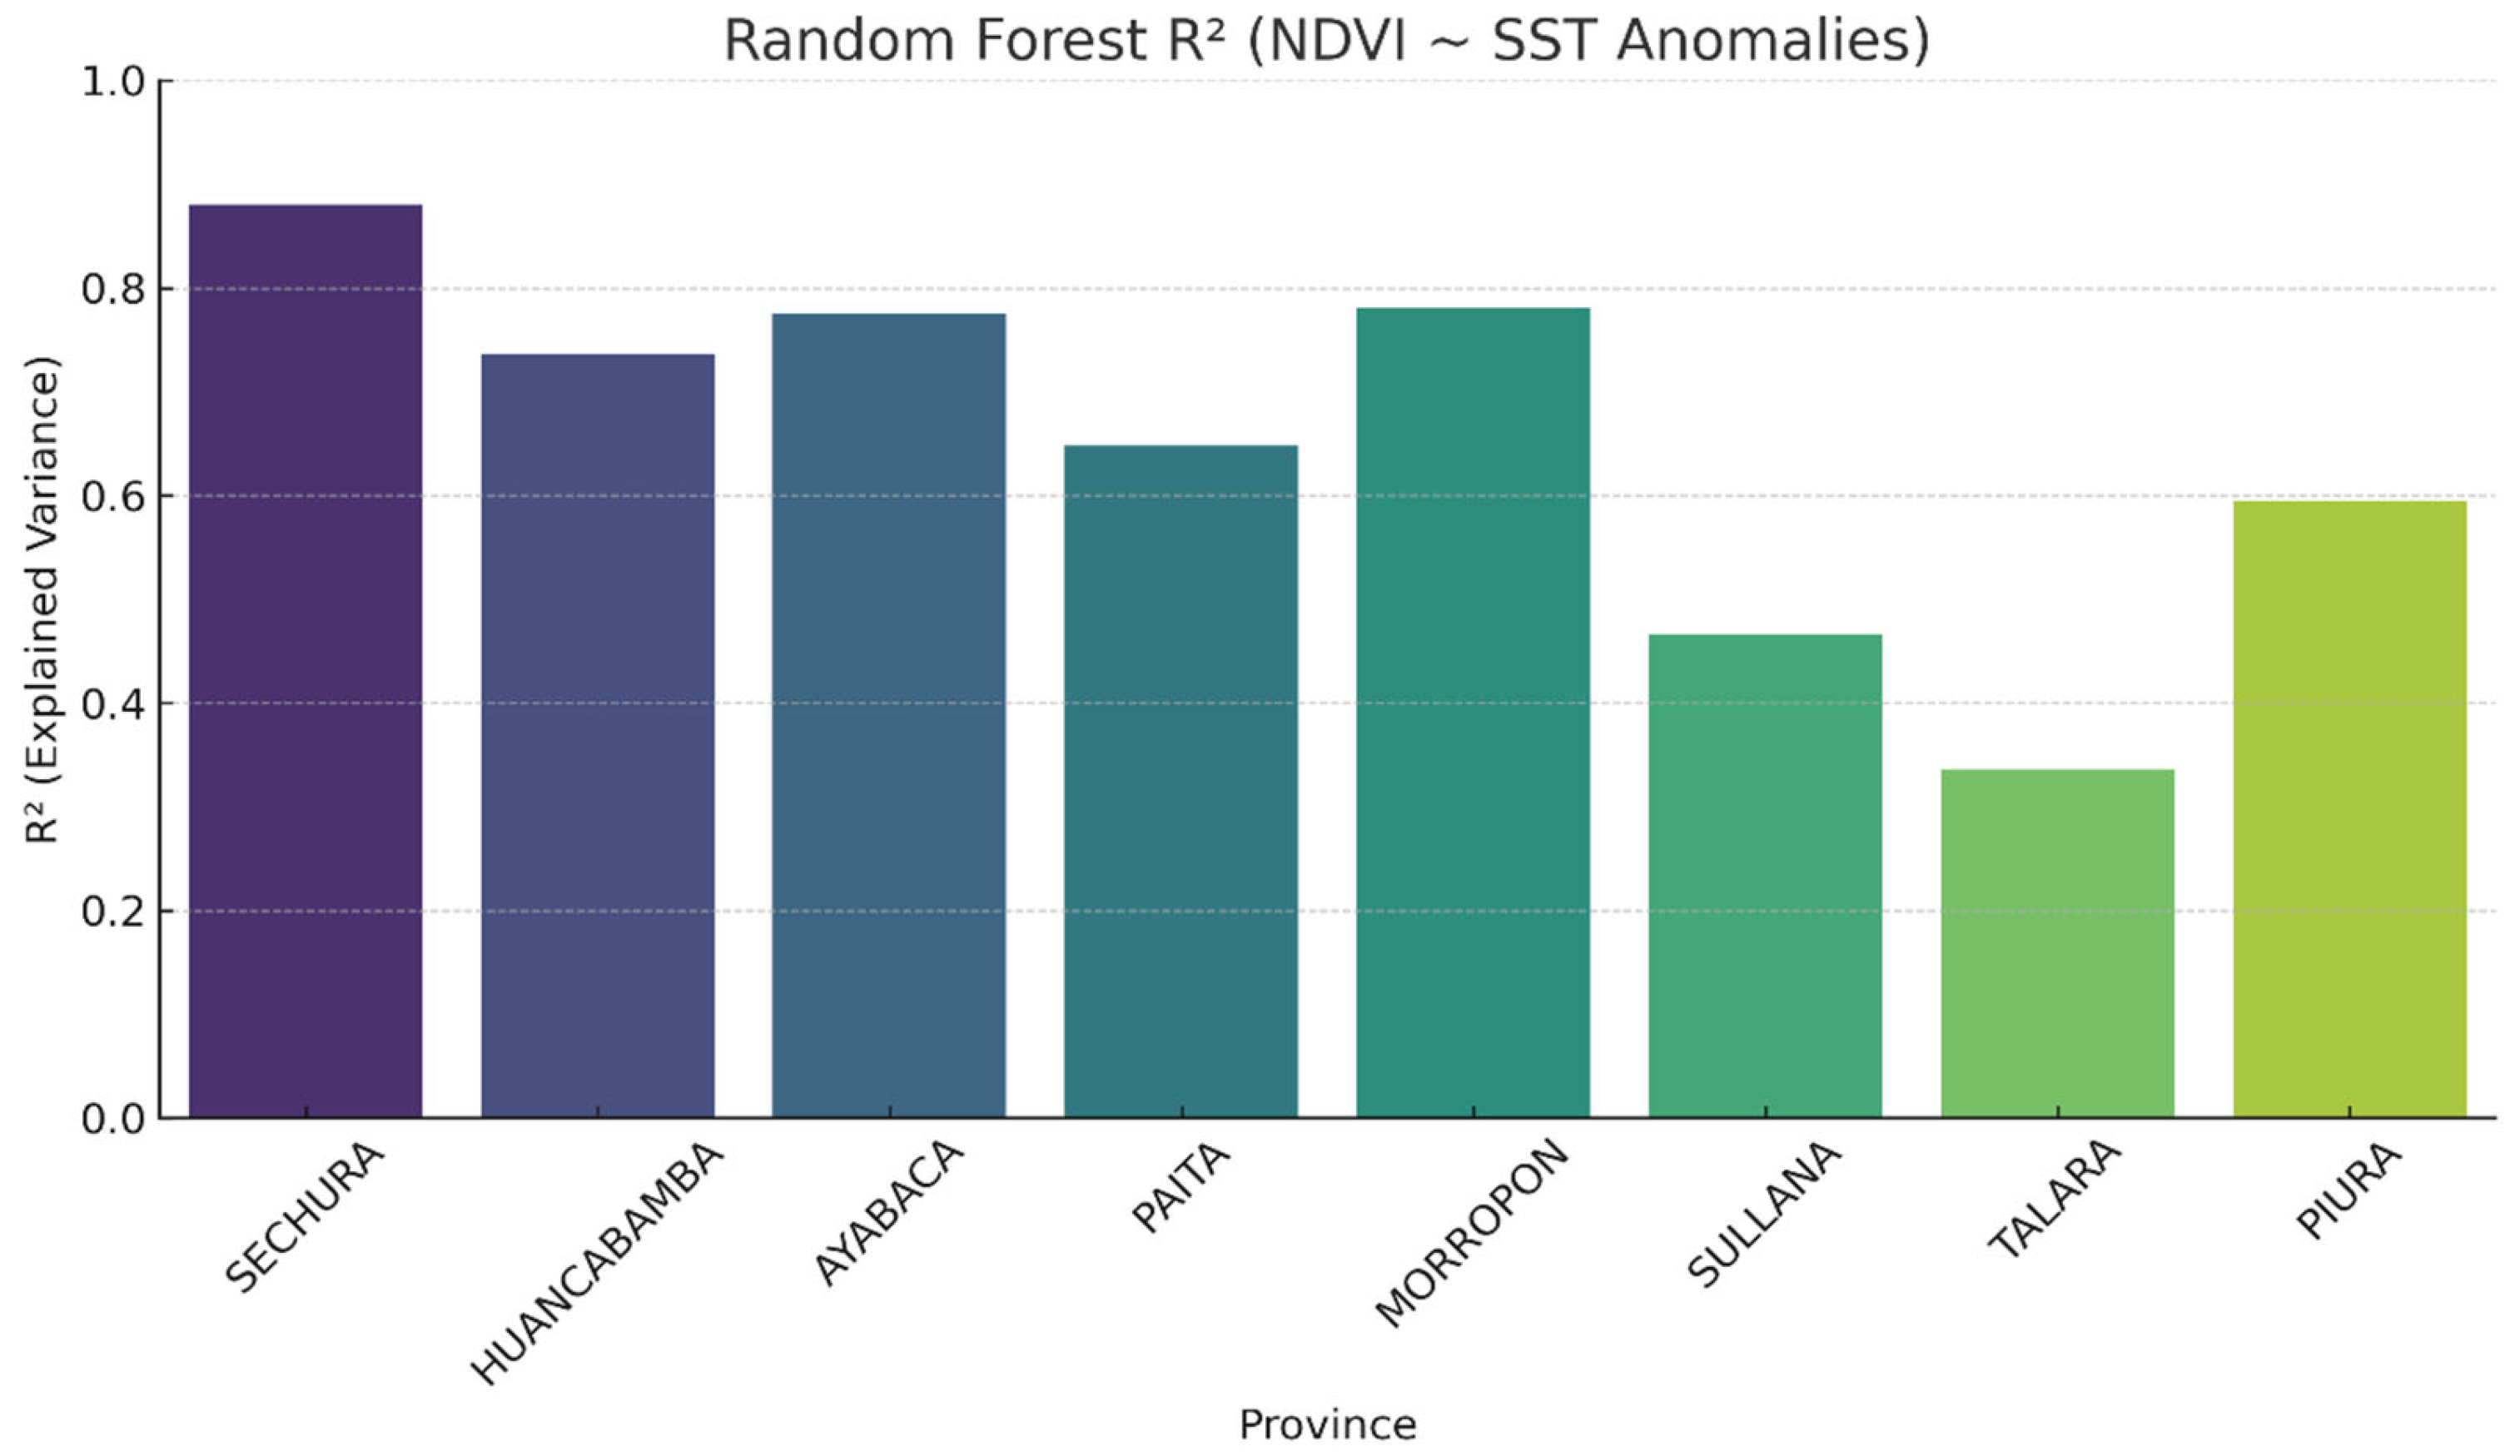
With respect to the model, predictor variables included monthly sea surface temperature (SST) anomaly values and seasonal indicators, while the response variable was the monthly mean NDVI aggregated at the provincial level. Given the strong seasonal structure shared by NDVI and SST, the model is interpreted as a descriptive tool for exploring ENSO-informed variability within the seasonal cycle, rather than as a framework for isolating causal ENSO effects. Figure 2 shows the Random Forest R2 (NDVI ~ SST Anomalies), representing the coefficient of determination (R2) obtained by applying the Random Forest model to predict monthly NDVI by province, using SST thermal anomalies as explanatory variables. Table 4 shows the R2 value indicating the proportion of the variance in the dependent variable (NDVI) that can be explained by the SST anomalies. In this context, R2 values indicate the extent to which NDVI explains variation in sea surface temperature (SST). These values do not demonstrate direct ecological control by oceanic conditions.
Figure 2.
Coefficient of determination (R2) obtained using Random Forest models that predict monthly NDVI from sea surface temperature (SST) anomalies, by province in the department of Piura (Peru). Sechura: ~0.87 (Maximum predictive capacity). NDVI is very sensitive to SST anomalies. Morropón: ~0.78 (high SST–NDVI ratio, strong climatic effect). Ayabaca: ~0.77 (robust model, possible influence of Andean microclimates). Huancabamba: ~0.73 (robust model, possible influence of Andean microclimates). Paita: ~0.65 (solid ratio, although slightly lower than Ayabaca). Piura: ~0.59 (medium prediction level, moderate marine influence). Sullana: ~0.48 (reasonable model, but with a higher prediction error). Talara: ~0.35 (weak relationships, possibly anthropogenic influences or other factors).
Table 4.
Monthly summary of the coefficient of determination (R2) of Random Forest models predicting NDVI from SST anomalies, together with their interpretation in the Piura region (Peru).
Sechura is the closest value to 1, indicating the best fit of the model among the rest of the provinces, while Talara would have the lowest predictive capacity of the model. Significant spatial variability exists in the model’s predictive capacity for all provinces.
Thus, coastal areas such as Sechura and Morropón show a strong correlation between NDVI and ocean thermal anomalies, which is consistent with their higher exposure to ENSO-related climatic variability, as well as their dependence on water availability, which is modulated by oceanic conditions. High Andean regions such as Ayabaca and Huancabamba also show a considerable response (R2 > 0.70), suggesting a statistical association between SST variability and NDVI patterns, even in high-altitude systems, and that oceanic disturbances can influence even high-altitude ecological systems, possibly through changes in precipitation or cloudiness linked to the ENSO phenomenon.
Paita (R2 ~0.65) is in an intermediate zone: although it is coastal and receives direct influence from the sea, additional factors such as urban cover or the dominant vegetation type seem to mediate the NDVI response. The relationship with the SST anomalies is moderate but stable. Piura (R2 ~0.59) reflects a moderately low relationship, which could be attributed to greater urbanisation, intensive use of water resources, or the influence of technified crops that are less dependent on oceanic climatic factors. Although NDVI responds in part to changes in SST, other elements introduce noise or complexity in the detected signal. Talara, with the lowest value (R2 ~0.35), represents a particular case: its low value may be due to sparse vegetation, arid soils, the presence of industrial areas, or energy infrastructure (oil), despite its coastal location, which reduces the sensitivity of NDVI to oceanic climatic changes. In addition, extremely low precipitation limits the ability of the NDVI to reflect climate-induced variations.
3.4. Monthly NDVI Response Model to Sea Surface Temperature Anomalies: Random Forest Approach
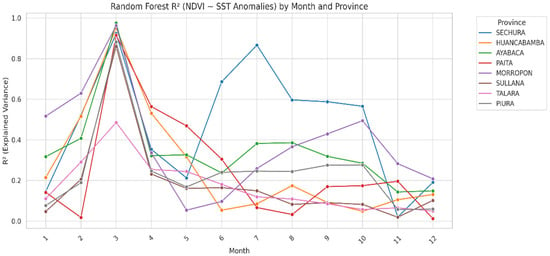
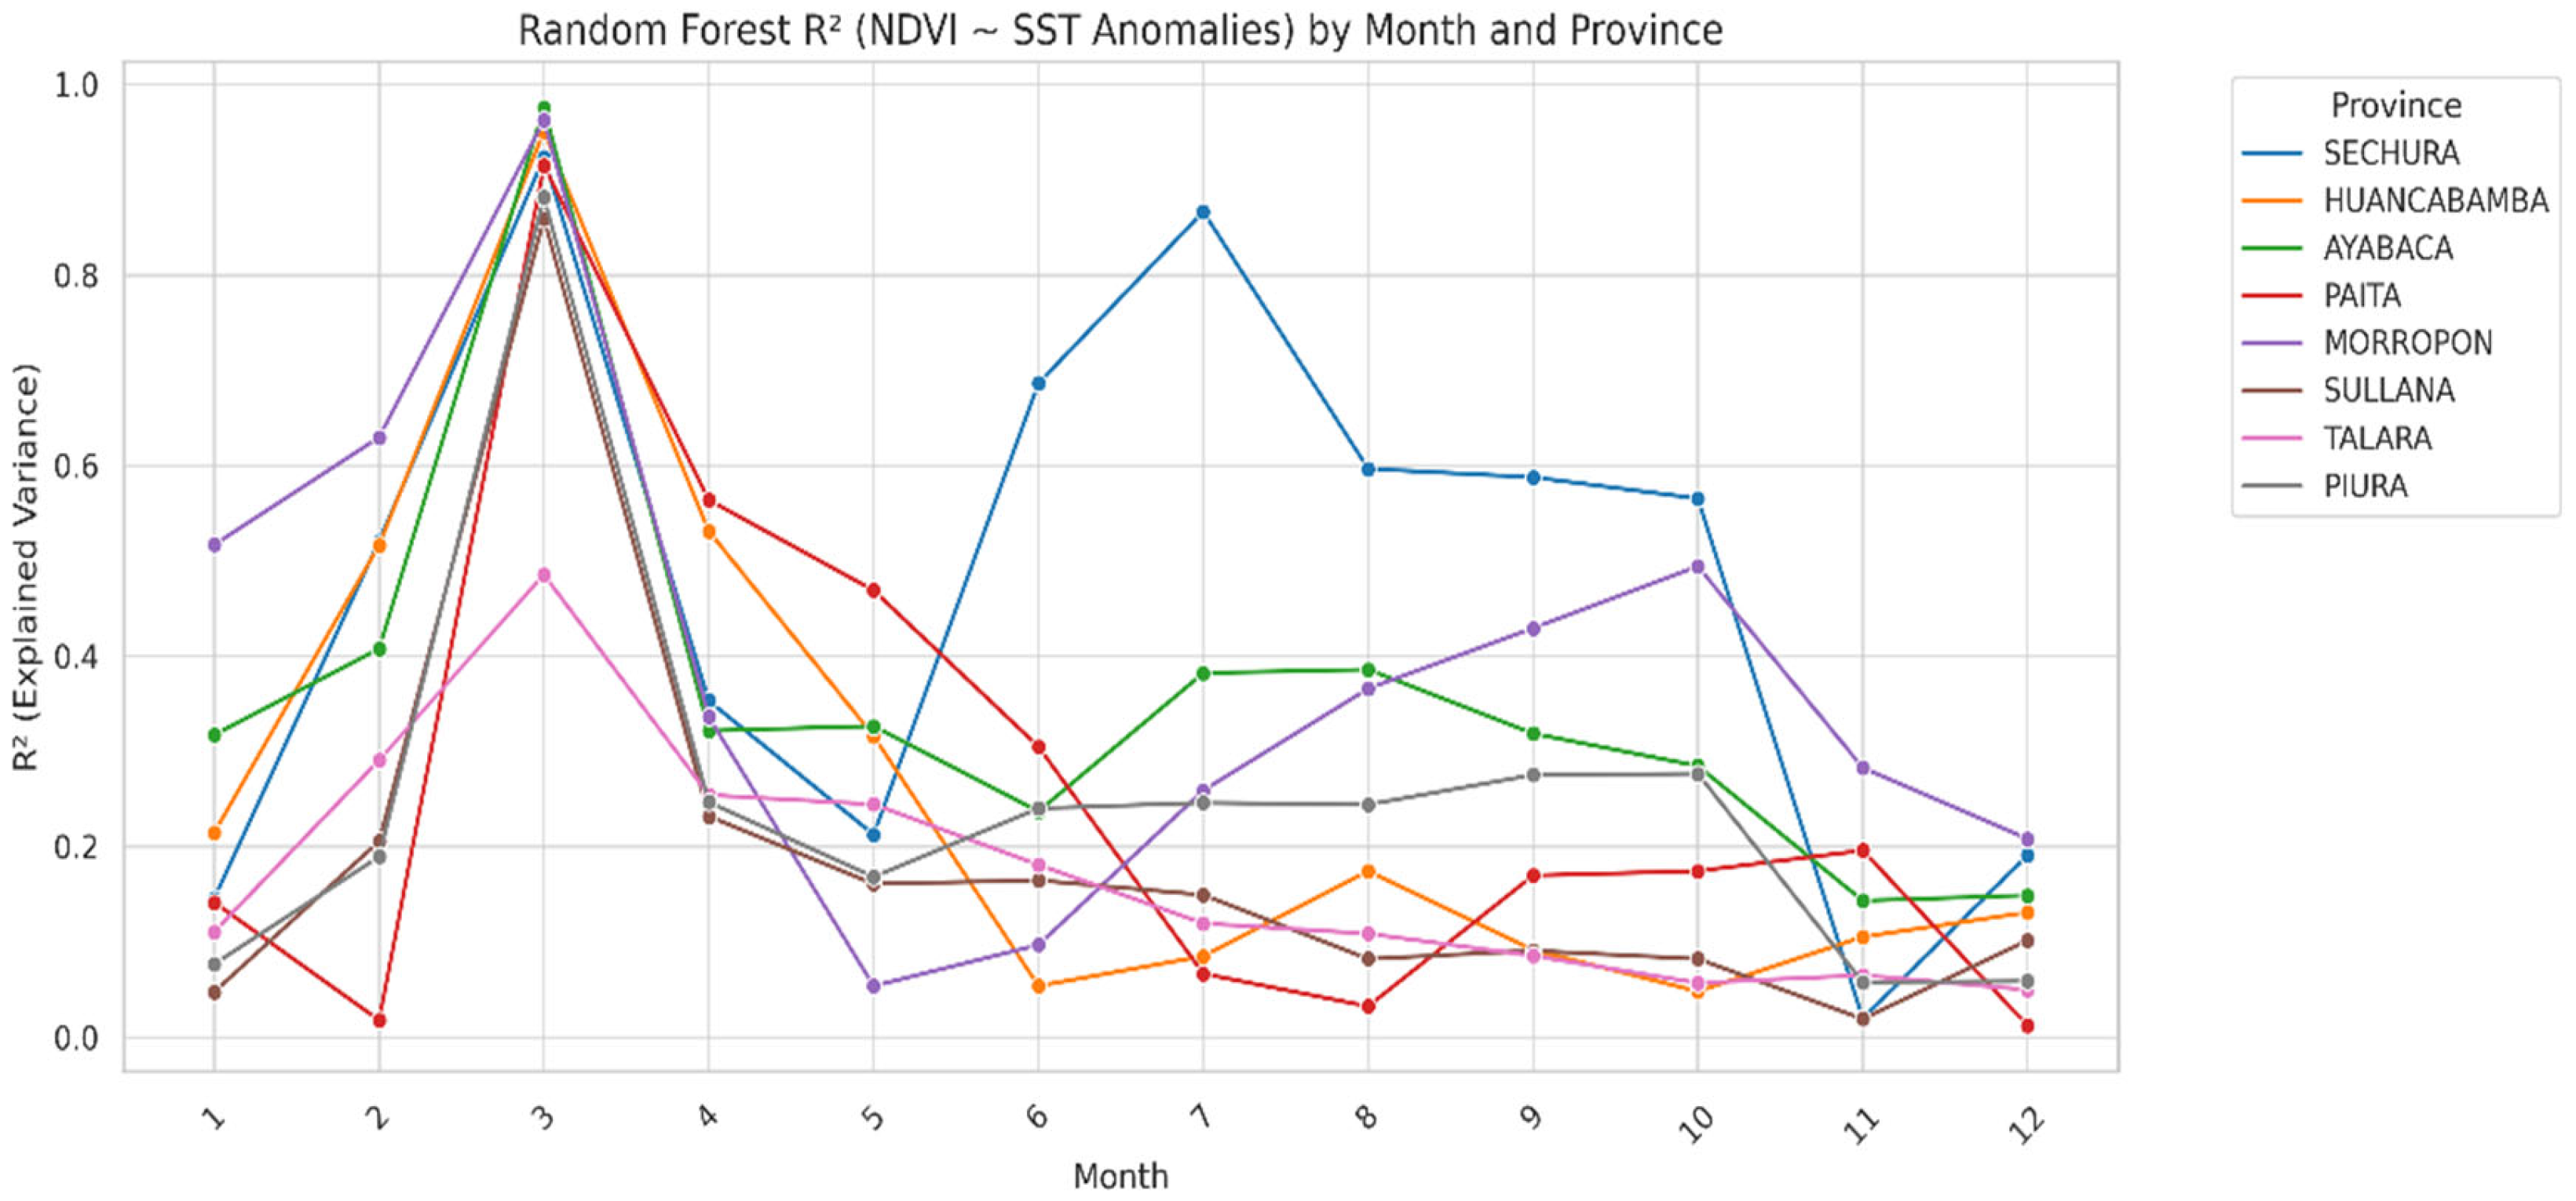
Figure 3 shows the monthly performance of an RF model quantifying the relationships between sea SST anomalies and the NDVI in the eight provinces of the Piura region, Peru. The coefficient of determination (R2) was used to evaluate the model’s explanatory power in each month and province. Monthly changes in R2 indicate how well the model predicts across seasons. Do not interpret these changes as proof that the influence of sea surface temperature (SST) on vegetation changes over time. Table 4 shows that the coastal provinces, especially Sechura, Paita, and Talara, showed high R2 values (>0.80) during the first quarter of the year (January–March), coinciding with the austral summer and the season of the most significant ENSO impact. This indicates an intense and rapid response of NDVI to SST variability, suggesting that vegetation dynamics in coastal areas are closely linked to oceanic–atmospheric conditions, probably through rainfall anomalies and moisture availability. In contrast, intermediate provinces, such as Sullana and Morropón, showed moderate model performance (R2 = 0.50–0.70), with slight increases in the middle months of the year (June–August). This pattern may reflect attenuated or delayed vegetative responses resulting from the combined influence of coastal climate systems and Andean topoclimatic conditions. High Andean provinces, such as Ayabaca and Huancabamba, consistently showed the lowest R2 values (≤0.40), with slight monthly variation. This result underscores the relative independence of NDVI in mountainous areas concerning SST anomalies, highlighting the dominant role of local factors such as orographic precipitation, altitudinal gradients, and land-use practices.
Figure 3.
Monthly variation in the coefficient of determination (R2) of RF models that predict NDVI from SST anomalies by province in the Piura region.
In summary, the monthly analysis reveals spatial heterogeneity in the NDVI response to SST anomalies, which is influenced by the topographic and climatic gradients in the Piura region. The results support the importance of incorporating oceanic variables in vegetation models for coastal ecosystems, while underscoring the need to improve model performance by integrating additional terrestrial variables (precipitation, air temperature, and land cover) in high Andean environments.
3.5. Estimated Monthly NDVI by Province for the Year 2025
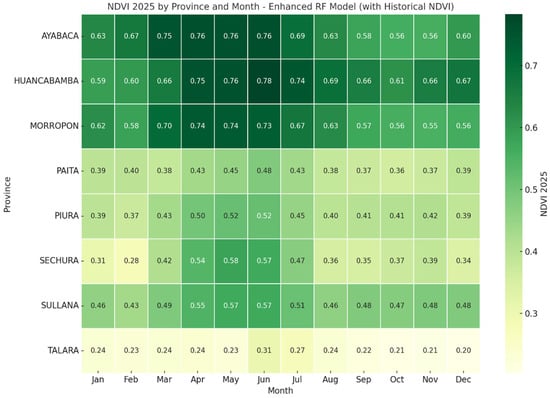
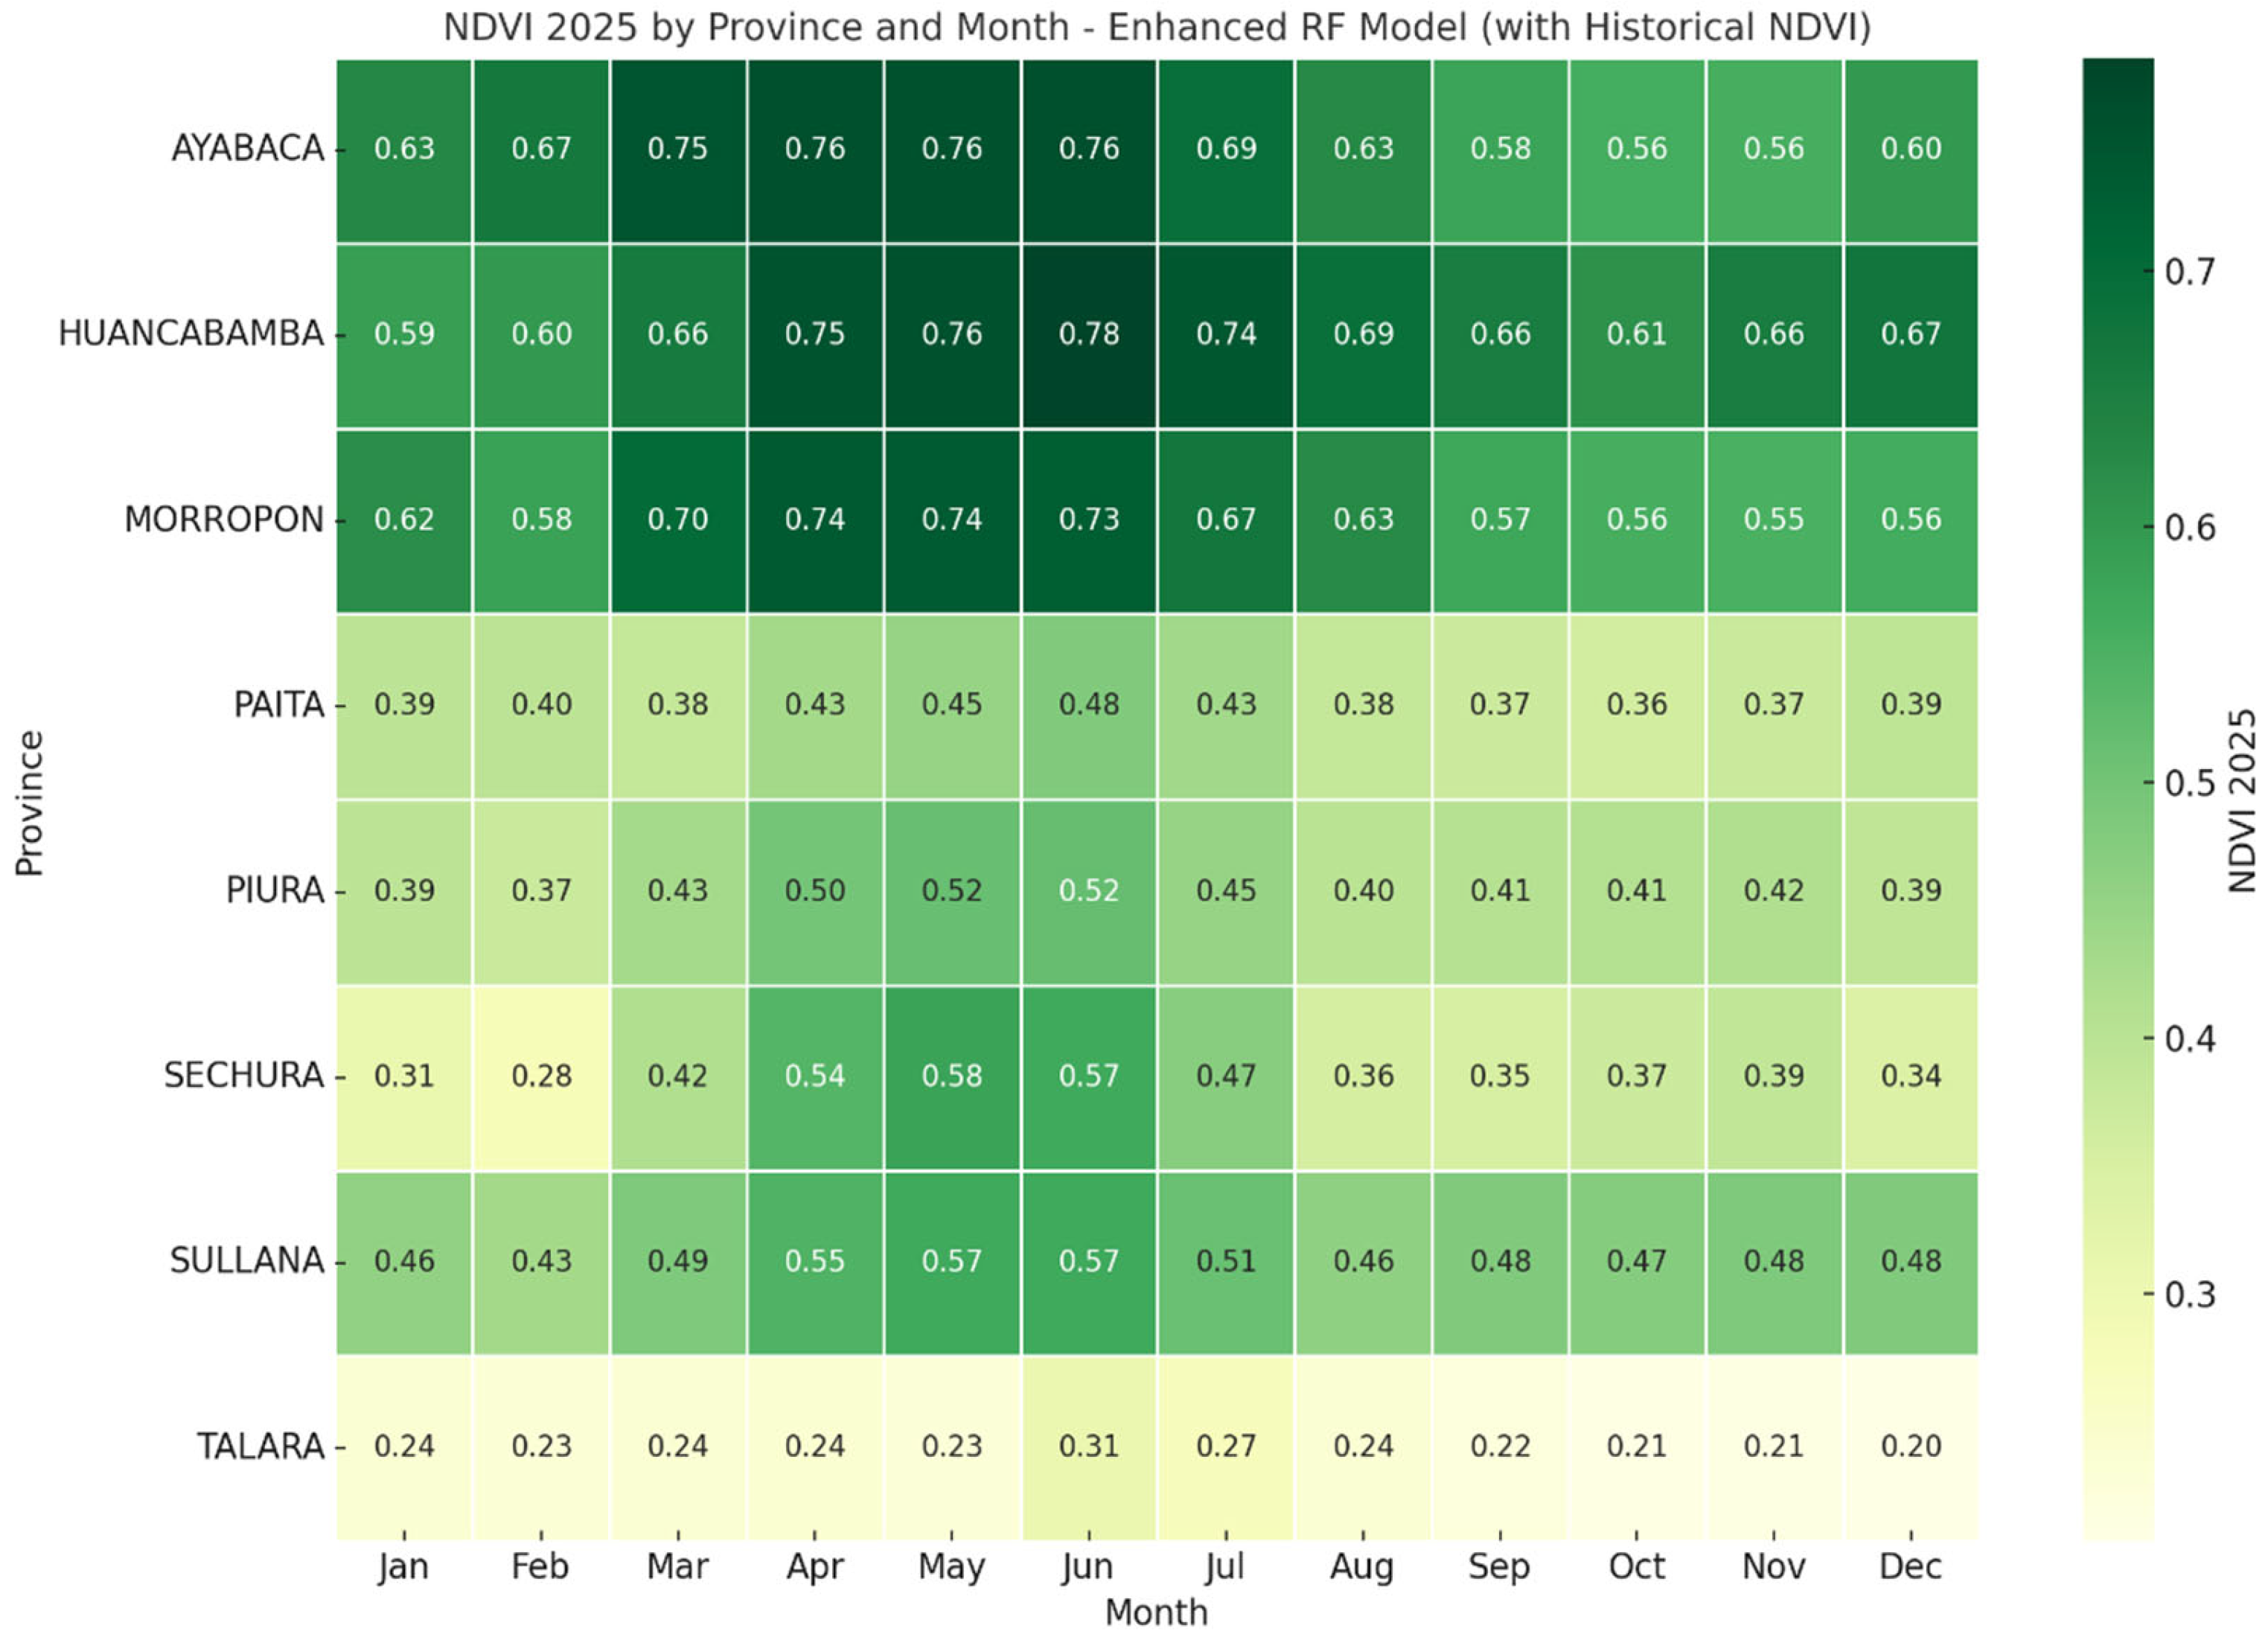
Figure 4 displays a heat map of model-based extrapolated NDVI values for 2025 by province and month, derived from the Random Forest relationships calibrated using historical ENSO and post-ENSO observations.
Figure 4.
Projected NDVI for 2025 by province and month using an enhanced RF model.
Ayabaca and Huancabamba have the highest NDVI values throughout the year (0.63–0.78). The maximum value in June and July indicates a vegetative peak during the high-humidity season. These are the high Andean zones with the highest vegetation cover. In Morropón, there is a high NDVI (0.62–0.74), similar to Ayabaca/Huancabamba, which also shows a peak in May–July. This is due to the combination of a favourable climate and forest cover in the Andean–coastal transition.
In the provinces of Sechura and Sullana, an average NDVI value is estimated (0.28–0.58 and 0.43–0.57, respectively). Additionally, there is improved behaviour between April and June, indicating a greater dependence on positive anomalies of the ENSO phenomenon to stimulate vegetation growth. Similarly, in Paita and Piura, the NDVI value is in the moderate range (between 0.37 and 0.52), with the best months being April to June. Compared with other provinces, there are more arid and urban ecosystems in these areas. However, Talara exhibits the lowest NDVI values year-round (0.20–0.31), showing a slight increase in June but remaining low. It is an extremely arid coastal zone with sparse vegetation even in humid years.
4. Discussion
The results indicate that the Normalised Difference Vegetation Index (NDVI) responds differently to sea surface temperature (SST) anomalies in the provinces of the Piura region. This confirms the ecological sensitivity of coastal and Andean ecosystems to oceanic phenomena [6,29,30]. Although high R2 values indicate strong predictive associations between SST anomalies and NDVI in several provinces, these results do not establish causation. The observed NDVI responses likely result from multiple interacting processes, including precipitation anomalies, cloud cover, soil moisture dynamics, land use, and management practices, which are not directly incorporated as variables in the current model framework. Omitting key terrestrial drivers such as precipitation, air temperature, soil moisture, land cover, and human land use limits the model’s interpretability because these drivers directly affect NDVI values. Aggregating data at the provincial level reduces local variability and eases regional comparison, but it cannot replace the explanatory insight offered by these proximate drivers, which causally influence NDVI outcomes. As a result, the unexplained NDVI variance reflects both random noise and unmodeled terrestrial processes, potentially obscuring SST signals at the local scale.
A strong relationship between NDVI and positive SST anomalies was observed during the summer months (January–March), which coincides with the 2017 ENSO peaks [31]. This relationship highlights the ability of the RF model to capture the nonlinear interactions between ocean variability and vegetation dynamics [32,33,34], despite the relatively short analysis periods [35]. Similar patterns have been documented in other studies across South America [6,14,36], where thermal disturbances in the tropical Pacific significantly impact coastal vegetation productivity [37,38]. The RF model exhibited R2 values greater than 0.75 in provinces like Sechura and Morropón, indicating the NDVI’s strong dependence on oceanic conditions in these areas [39]. This can be attributed to their geographical proximity to the coast and the presence of semi-arid vegetation that quickly responds to moisture variations caused by extreme ENSO rains [5,40,41,42]. Similar results have been reported in studies focused on northern Peru, where the correlation between SST and NDVI intensifies during warm episodes in the eastern Pacific [15,16,43]. In contrast, high Andean provinces such as Ayabaca and Huancabamba displayed more moderate R2 values, suggesting that orographic precipitation and permanent vegetation cover indirectly influence the ocean [17,44].
Montane ecosystems are more resilient to oceanic thermal changes due to the Andean forest’s water stability and structural diversity. The decrease in NDVI observed in March across almost all provinces coincides with increases in positive SST anomalies and intense rainfall (as noted by Bendix and Morales). This pattern indicates potential vegetative stress related to excess moisture or cloud cover, which affects satellite reflectance [5,42]. Studies in tropical regions indicate that excessive rainfall during ENSO events can temporarily reduce the NDVI due to soil saturation and decreased photosynthetically active radiation [45]. In this context, NDVI sensitivity reflects not only drought conditions but also responses to over-wetting phenomena [46], which can disrupt physiological processes in tropical and subtropical plants [47]. The varying predictive capacity of the NDVI and SST across provinces confirms that their relationship is not homogeneous; rather, it is influenced by the interaction of local and regional factors [48]. In Piura and Sullana, urbanisation and agricultural intensification have likely introduced noise into the NDVI time series [49,50,51]. Recent studies support this view, pointing out that changes in land use, advanced irrigation techniques, and urban development tend to distort the spectral response of vegetation to climatic influences [52,53]. Therefore, while the RF model is robust, it could be enhanced by incorporating additional variables, such as precipitation, air temperature, and ground cover, to more accurately reflect local microclimatic conditions [5,54,55]. The monthly analysis of model performance reveals that the maximum predictability occurs in March (R2 ≈ 0.95), aligning with the peak of the ENSO phenomenon. This finding emphasises the importance of integrating seasonality and oceanic synchrony into vegetation prediction models [18,19,20]. The model’s low explanatory power between June and October (R2 < 0.3) suggests a diminished oceanic influence and increased stability of vegetation. This transition may represent a recovery phase for ecosystems following seasonal water stress, consistent with observations in arid systems in South America [45].
Regarding the RF model suitability, the results showed a strong ability to predict the NDVI based on SST anomalies [1]. However, several methodological and data limitations must be addressed. First, the dataset analysed covers only a limited number of years (2017, 2018, 2023, and 2024), which restricts the representation of the ENSO-associated interannual variability [5,42]. Second, the model mainly relies on oceanic and spatial variables (SST, month, and province) and does not explicitly account for local meteorological and biophysical factors, such as precipitation, air temperature, evapotranspiration, or drought indices, similar to other proposed climate models [45,46]. Including these factors could significantly enhance the explanatory power of the model. Looking ahead, this research recommends integrating new sources of satellite and climate data [47], such as CHIRPS (precipitation) [48], ERA5 (atmospheric reanalysis), and MOD16 (evapotranspiration) [44] products. Additionally, using variables derived from optical sensors with higher temporal and spatial resolution (e.g., Sentinel-2 and VIIRS) [5,45] would enrich the analysis. By combining these inputs within machine learning frameworks or hybrid models (such as RF–LSTM or XGBoost), we could more comprehensively explore spatiotemporal interactions and better anticipate vegetative responses to climate change scenarios [52,53]. Incorporating information on land use and local agricultural practices would lead to the development of more contextualised and functional prediction models for land management and climate adaptation in the Piura region and other vulnerable areas of northern Peru.
Implications for Land Management and Climate Adaptation Through Remote Sensing and Geographic Information Systems
From a remote sensing and GIS perspective, the results underscore the strategic value of integrating multi-source satellite data to capture climate-sensitive land-use dynamics in the Peruvian coastal region. The strong responsiveness of the NDVI to SST anomalies associated with ENSO events demonstrates that the terrestrial vegetation patterns along the coast are driven not only by local climatic conditions but also by ocean–atmosphere interactions.
Future research should incorporate continuous precipitation records, standardised drought indices, and higher-temporal-resolution satellite products (e.g., MODIS 8-day composites and Sentinel-2 imagery) to better resolve intra-annual vegetation dynamics. Such enhancements would strengthen the capacity to anticipate climate impacts on agricultural systems and support the development of spatially explicit, climate-resilient agricultural policies in coastal–Andean regions such as Piura.
5. Conclusions
This study provides quantitative evidence of how ENSO-related sea surface temperature (SST) anomalies influence vegetation dynamics along the coastal–Andean gradient of the Piura region, one of the areas most exposed to climate variability in Peru. Using MODIS-derived NDVI and a Random Forest modelling framework, clear spatial differences in vegetation sensitivity to oceanic forcing were identified.
Coastal provinces (Sechura, Paita, and Talara) exhibited high sensitivity and low vegetation stability, with the NDVI strongly coupled to SST anomalies, indicating elevated exposure of agroecosystems to ENSO-driven climate stress. Intermediate provinces (Morropón, Sullana, and Piura) showed mixed and spatially heterogeneous responses, reflecting the interaction between oceanic influence, topography, and land-use intensity. In contrast, high Andean provinces (Ayabaca and Huancabamba) maintained consistently high NDVI values and a weaker dependence on SST variability, highlighting their relative ecological stability.
Methodologically, the Random Forest approach proved effective in capturing nonlinear SST–NDVI relationships and seasonal modulation, supporting its applicability for short-term, intra-annual vegetation monitoring in climate-sensitive regions. By explicitly linking oceanic thermal anomalies with terrestrial vegetation responses at the provincial scale, this study offers an operational framework to support climate-informed land management, agricultural planning, and early-warning strategies in ENSO-affected coastal regions of Peru.
These findings illustrate model-based extrapolative relationships rather than true forecasts or scenario-based predictions, demonstrating how machine learning can extend observed vegetation patterns under ENSO-influenced climate variability.
Supplementary Materials
The following supporting information can be downloaded at https://www.mdpi.com/article/10.3390/geographies6010022/s1, Figure S1. Geographical Location of the Study Area on the Northern Coast of Peru in South America.
Author Contributions
Conceptualisation, R.R.-S. and L.G.; Methodology, R.R.-S. and L.G.; Software, L.H.-S. and L.G.; Validation, R.R.-S. and L.G.; Formal analysis, L.G.; Investigation, R.R.-S. and L.G.; Data curation, L.H.-S. and D.C.-H.; Writing—original draft preparation, R.R.-S., L.G., J.A.C.-T., L.H.-S., D.C.-H. and M.d.P.B.C.; Visualisation, L.H.-S., M.d.P.B.C. and L.G.; Project administration, R.R.-S.; Funding acquisition, R.R.-S. and J.A.C.-T.; Writing—review and editing, R.R.-S. and L.G. All authors have read and agreed to the published version of the manuscript.
Funding
This project received funding from the National Council for Science, Technology, and Technological Innovation (CONCYTEC), the National Program for Scientific Research and Advanced Studies (PROCIENCIA), and Universidad Tecnológica del Perú (UTP), within the framework of the competition E041-2024-04 Research Projects in Social Sciences, grant number PE501088121-2024.
Institutional Review Board Statement
Not applicable.
Informed Consent Statement
Not applicable.
Data Availability Statement
The present study utilised open data. The utilisation of publicly obtainable data is exempt from the requirement for Institutional Review Board approval, given that the data does not encompass any private, identifiable information. The original data presented in the study are openly available at https://www.noaa.gov/ and https://www.earthdata.nasa.gov/.
Conflicts of Interest
The authors declare that the research was conducted in the absence of any commercial or financial relationships that could be construed as a potential conflict of interest.
Abbreviations
The following abbreviations are used in this manuscript:
| SST | Sea Surface Temperature |
| ENSO | El Niño–Southern Oscillation |
| NDVI | Normalised Difference Vegetation Index |
| RF | Random Forest |
| NOAA | National Oceanic and Atmospheric Administration |
| TSM | Sea Surface Temperature Anomalies |
| MODIS | Moderate Resolution Imaging Spectroradiometer |
References
- Meshesha, K.S.; Shifaw, E.; Kassaye, A.Y.; Tsehayu, M.A.; Eshetu, A.A.; Agegnehu, H.W. Evaluating the Relationship of Vegetation Dynamics with Rainfall and Land Surface Temperature Using Geospatial Techniques in South Wollo Zone, Ethiopia. Environ. Chall. 2024, 15, 100895. [Google Scholar] [CrossRef] [Scilit]
- Suud, H.M.; Kusbianto, D.E. Exploring El Nino Effects on Agricultural Area Using Landsat Images Analysis: A Case Study in Bondowoso Regency, Indonesia. SAINS TANAH-J. Soil Sci. Agroclimatol. 2024, 21, 126. [Google Scholar] [CrossRef] [Scilit]
- Di Leo, N.; Barbona, I.; Beltrán, C.; Forgioni, F.P.; Coronel, A.; Jozami, E. Temporal Variability of Spatial Patterns of Correlations between Summer Rainfall and the Oceanic Niño Index in the Pampean Region. Sci. Total Environ. 2024, 955, 176849. [Google Scholar] [CrossRef] [Scilit]
- Kane, R.P. El Niño Effects on Rainfall in South America: Comparison with rainfalls in India and Other Parts of the World. Adv. Geosci. 2006, 6, 35–41. [Google Scholar] [CrossRef] [Scilit]
- Kogan, F. Satellite-Observed Sensitivity of World Land Ecosystems to El Niño/La Niña. Remote Sens. Environ. 2000, 74, 445–462. [Google Scholar] [CrossRef] [Scilit]
- Álvarez, D.M.; Poveda, G. Spatiotemporal Dynamics of NDVI, Soil Moisture and ENSO in Tropical South America. Remote Sens. 2022, 14, 2521. [Google Scholar] [CrossRef] [Scilit]
- Jin, J.; Jian, D.; Zhou, X.; Chen, Q.; Li, Y. Impact of El Niño–Southern Oscillation on Global Vegetation. Atmosphere 2025, 16, 701. [Google Scholar] [CrossRef] [Scilit]
- Qian, Z. The Response of Vegetation Productivity to the El Niño-Southern Oscillation in Southeast Asia. J. Geophys. Res. Biogeosci. 2025, 130, e2024JG008606. [Google Scholar] [CrossRef] [Scilit]
- Khrisrachmansyah, R.; Brindley, P.; Dempsey, N.; Wild, T. Tracking Land-Use and Land-Cover Change Through Fragmentation Dynamics in the Ciliwung River Watershed, Indonesia: A Remote-Sensing and GIS Approach. Land 2025, 14, 2127. [Google Scholar] [CrossRef] [Scilit]
- Leroux, L.; Jolivot, A.; Bégué, A.; Seen, D.L.; Zoungrana, B. How Reliable is the MODIS Land Cover Product for Crop Mapping Sub-Saharan Agricultural Landscapes? Remote Sens. 2014, 6, 8541–8564. [Google Scholar] [CrossRef] [Scilit]
- Frimpong, A.; Kwabena, E.; Matthew, E. The effect of land use land cover types on MODIS land surface temperature in Ghana. Cogent Eng. 2024, 11, 2411865. [Google Scholar] [CrossRef] [Scilit]
- Bojago, E.; Tadila, G.; Masha, M. Monitoring spatio-temporal changes in land use, land cover, and NDVI using MODIS data in Ethiopia’s Gambela region. Discov. Appl. Sci. 2025, 7, 1361. [Google Scholar] [CrossRef] [Scilit]
- Liu, W.T.; Juárez, R.I.N. ENSO drought onset prediction in northeast Brazil using NDVI. Int. J. Remote Sens. 2001, 22, 3483–3501. [Google Scholar] [CrossRef] [Scilit]
- Veneros, J.; García, L. Application of the Standardized Vegetation Index (SVI) and Google Earth Engine (GEE) for Drought Management in Peru. Trop. Subtrop. Agroecosyst. 2021, 25, 1–13. [Google Scholar] [CrossRef] [Scilit]
- Espinoza, J.C.; Segura, H.; Ronchail, J.; Drapeau, G.; Gutierrez-Cori, O. Evolution of Wet-day and Dry-day Frequency in the Western Amazon Basin: Relationship with Atmospheric Circulation and Impacts on Vegetation. Water Resour. Res. 2016, 52, 8546–8560. [Google Scholar] [CrossRef] [Scilit]
- Jiménez-Muñoz, J.C.; Mattar, C.; Barichivich, J.; Santamaría-Artigas, A.; Takahashi, K.; Malhi, Y.; Sobrino, J.A.; van der Schrier, G. Record-Breaking Warming and Extreme Drought in the Amazon Rainforest during the Course of El Niño 2015–2016. Sci. Rep. 2016, 6, 33130. [Google Scholar] [CrossRef] [Scilit]
- Manrique Paredes, R.S. El Niño Southern Oscillation and Its Effect on Fog Oases along the Peruvian and Chilean Coastal Deserts. Doctoral Dissertation, Department of Biological, Geological, and Environmental Sciences, University of Bologna, Bologna, Italy, 9 May 2011. [Google Scholar]
- Nooteboom, P.D.; Feng, Q.Y.; López, C.; Hernández-García, E.; Dijkstra, H.A. Using Network Theory and Machine Learning to Predict El Niño. Earth Syst. Dyn. 2018, 9, 969–983. [Google Scholar] [CrossRef] [Scilit]
- Holmgren, M.; Stapp, P.; Dickman, C.R.; Gracia, C.; Graham, S.; Gutiérrez, J.R.; Hice, C.; Jaksic, F.; Kelt, D.A.; Letnic, M.; et al. Extreme Climatic Events Shape Arid and Semiarid Ecosystems. Front. Ecol. Environ. 2006, 4, 87–95. [Google Scholar] [CrossRef] [Scilit]
- Holmgren, M.; Mohren, G.M.; Scheffer, M.; Ezcurra, E.; Gutiérrez, J.R. El Niño Effects on the Dynamics of terrestrial Ecosystems. Trends Ecol. Evol. 2001, 16, 89–94. [Google Scholar] [CrossRef] [Scilit]
- Breiman, L. Random Forests. Mach. Learn. 2001, 45, 5–32. [Google Scholar] [CrossRef] [Scilit]
- Da Silva Chagas, C.; de Carvalho Junior, W.; Bhering, S.B.; Calderano Filho, B. Spatial Prediction of Soil Surface Texture in a Semiarid Region Using Random Forest and Multiple Linear Regressions. Catena 2016, 139, 232–240. [Google Scholar] [CrossRef] [Scilit]
- Pouyan, S.; Rahmanian, S.; Amindin, A.; Pourghasemi, H.R. Chapter 15—Spatial and Seasonal Modeling of the Land Surface Temperature Using Random Forest. In Computers in Earth and Environmental Sciences; Elsevier: Amsterdam, The Netherlands, 2022; pp. 221–234. [Google Scholar]
- Frankignoul, C.; Chouaib, N.; Liu, Z. Estimating the Observed Atmospheric Response to SST Anomalies: Maximum Covariance Analysis, Generalized Equilibrium Feedback Assessment, and Maximum Response Estimation. J. Clim. 2011, 24, 2523–2539. [Google Scholar] [CrossRef] [Scilit]
- Gamero, D.A.T.; Ramirez, G.A.R.; Huaynalaya, C.E.H. Nuevas herramientas para analizar la ocupación del territorio peruano: Hacia un cambio de paradigma en la gestión pública. Espac. Desarro. 2021, 29–60. [Google Scholar] [CrossRef] [Scilit]
- Takahashi, K. The atmospheric circulation associated with extreme rainfall events in Piura, Peru, during the 1997-1998 and 2002 El Niño events. Ann. Geophys. 2004, 22, 3917–3926. [Google Scholar] [CrossRef] [Scilit]
- Gorelick, N.; Hancher, M.; Dixon, M.; Ilyushchenko, S.; Thau, D.; Moore, R. Google Earth Engine: Planetary-Scale Geospatial Analysis for Everyone. Remote Sens. Environ. 2017, 202, 18–27. [Google Scholar] [CrossRef] [Scilit]
- Takahashi, K. Fenómeno El Niño: “Global” vs “Costero”. In Generación de Información y Monitoreo del Fenómeno El Niño; Boletín Técnico; Instituto Geofísico del Perú: Lima, Peru, 2017; Volume 4, pp. 1–7. [Google Scholar]
- Acha, E.M.; Mianzan, H.W.; Guerrero, R.A.; Favero, M.; Bava, J. Marine Fronts at the Continental Shelves of Austral South America: Physical and Ecological Processes. J. Mar. Syst. 2004, 44, 83–105. [Google Scholar] [CrossRef] [Scilit]
- Vallarino Castillo, R.; Negro Valdecantos, V.; Del Campo, J.M. Understanding the Impact of Hydrodynamics on Coastal Erosion in Latin America: A Systematic Review. Front. Environ. Sci. 2023, 11, 1267402. [Google Scholar] [CrossRef] [Scilit]
- Morales, M.S.; Villalba, R.; Grau, H.R.; Paolini, L. Rainfall-Controlled Tree Growth in High-Elevation Subtropical Treelines. Ecology 2004, 85, 3080–3089. [Google Scholar] [CrossRef] [Scilit]
- Braham, N.; Valeria, O.; Imbeau, L. Characterization of Vegetation Dynamics on Linear Features Using Airborne Laser Scanning and Ensemble Learning. Forests 2023, 14, 511. [Google Scholar] [CrossRef] [Scilit]
- Ma, X.; Zhang, J.; Wang, P.; Zhou, L.; Sun, Y. Estimating the Nonlinear Response of Landscape Patterns to Ecological Resilience Using a Random Forest Algorithm: Evidence from the Yangtze River Delta. Ecol. Indic. 2023, 153, 110409. [Google Scholar] [CrossRef] [Scilit]
- Wu, H.; Wang, L.; Ling, X.; Cui, L.; Sun, R.; Jiang, N. Spatiotemporal Reconstruction of Global Ocean Surface PCO2 Based on Optimized Random Forest. Sci. Total Environ. 2024, 912, 169209. [Google Scholar] [CrossRef] [Scilit] [PubMed]
- Ganguly, S.; Samanta, A.; Schull, M.A.; Shabanov, N.V.; Milesi, C.; Nemani, R.R.; Knyazikhin, Y.; Myneni, R.B. Generating Vegetation Leaf Area Index Earth System Data Record from Multiple Sensors. Part 2: Implementation, Analysis and Validation. Remote Sens. Environ. 2008, 112, 4318–4332. [Google Scholar] [CrossRef] [Scilit]
- Barbosa, H.A.; Huete, A.R.; Baethgen, W.E. A 20-Year Study of NDVI Variability over the Northeast Region of Brazil. J. Arid Environ. 2006, 67, 288–307. [Google Scholar] [CrossRef] [Scilit]
- Chang, C.-T.; Wang, H.-C.; Huang, C. Impacts of Vegetation Onset Time on the Net Primary Productivity in a Mountainous Island in Pacific Asia. Environ. Res. Lett. 2013, 8, 045030. [Google Scholar] [CrossRef] [Scilit]
- Altemus Cullen, K. A Review of Applications of Remote Sensing for Drought Studies in the Andes Region. J. Hydrol. Reg. Stud. 2023, 49, 101483. [Google Scholar] [CrossRef] [Scilit]
- Hou, X.; Li, M.; Gao, M.; Yu, L.; Bi, X. Spatial–Temporal Dynamics of NDVI and Chl-a Concentration from 1998 to 2009 in the East Coastal Zone of China: Integrating Terrestrial and Oceanic Components. Environ. Monit. Assess. 2013, 185, 267–277. [Google Scholar] [CrossRef] [Scilit]
- Anyamba, A.; Eastman, J.R. Interannual Variability of NDVI over Africa and Its Relation to El Niño/Southern Oscillation. Int. J. Remote Sens. 1996, 17, 2533–2548. [Google Scholar] [CrossRef] [Scilit]
- Martiny, N.; Philippon, N.; Richard, Y.; Camberlin, P.; Reason, C. Predictability of NDVI in Semi-Arid African Regions. Theor. Appl. Climatol. 2010, 100, 467–484. [Google Scholar] [CrossRef] [Scilit]
- Kogan, F.; Guo, W. Strong 2015–2016 El Niño and Implication to Global Ecosystems from Space Data. Int. J. Remote Sens. 2017, 38, 161–178. [Google Scholar] [CrossRef] [Scilit]
- Fernandes, K.; Baethgen, W.; Bernardes, S.; DeFries, R.; DeWitt, D.G.; Goddard, L.; Lavado, W.; Lee, D.E.; Padoch, C.; Pinedo-Vasquez, M.; et al. North Tropical Atlantic Influence on Western Amazon Fire Season Variability. Geophys. Res. Lett. 2011, 38, 1–5. [Google Scholar] [CrossRef] [Scilit]
- Salinas, N.; Cosio, E.G.; Silman, M.; Meir, P.; Nottingham, A.T.; Roman-Cuesta, R.M.; Malhi, Y. Editorial: Tropical Montane Forests in a Changing Environment. Front. Plant Sci. 2021, 12, 712748. [Google Scholar] [CrossRef] [Scilit]
- Barbosa, H.A.; Setzer, A.W. Spatial-Temporal Analysis of NOAA/AVHRR Vegetation Index and Rainfall in the Northeast Region of Brazil in 1982-85. In Proceedings Volume 3499, Remote Sensing for Agriculture, Ecosystems, and Hydrology; SPIE: Bellingham, WA, USA, 1998. [Google Scholar] [CrossRef] [Scilit]
- Barichivich, J.; Briffa, K.; Myneni, R.; Schrier, G.; Dorigo, W.; Tucker, C.; Osborn, T.; Melvin, T. Temperature and Snow-Mediated Moisture Controls of Summer Photosynthetic Activity in Northern Terrestrial Ecosystems between 1982 and 2011. Remote Sens. 2014, 6, 1390–1431. [Google Scholar] [CrossRef] [Scilit]
- Kemarau, R.A.; Eboy, O.V. Eboy Application of Remote Sensing on El Niño Extreme Effect in Normalized Difference Vegetation Index (NDVI) and Normalized Difference Water Index (NDWI). Malays. J. Appl. Sci. 2021, 6, 46–56. [Google Scholar] [CrossRef] [Scilit]
- Rahimi, E.; Dong, P.; Jung, C. Global NDVI-LST Correlation: Temporal and Spatial Patterns from 2000 to 2024. Environments 2025, 12, 67. [Google Scholar] [CrossRef] [Scilit]
- Bellón, B.; Bégué, A.; Lo Seen, D.; De Almeida, C.; Simões, M. A Remote Sensing Approach for Regional-Scale Mapping of Agricultural Land-Use Systems Based on NDVI Time Series. Remote Sens. 2017, 9, 600. [Google Scholar] [CrossRef] [Scilit]
- Hird, J.N.; McDermid, G.J. Noise Reduction of NDVI Time Series: An Empirical Comparison of Selected Techniques. Remote Sens. Environ. 2009, 113, 248–258. [Google Scholar] [CrossRef] [Scilit]
- Michishita, R.; Jin, Z.; Chen, J.; Xu, B. Empirical Comparison of Noise Reduction Techniques for NDVI Time-Series Based on a New Measure. ISPRS J. Photogramm. Remote Sens. 2014, 91, 17–28. [Google Scholar] [CrossRef] [Scilit]
- Xing, J.; Sanim, B.; Gauhar, R. Analysing the Spatial Patterns of Agricultural Intensification and Its Implications for Land Degradation and Water Resource Management Using Remote Sensing and GIS Technologies Across Diverse Agroecosystems. AgBioForum 2024, 1, 95–113. [Google Scholar]
- Mashala, M.J.; Dube, T.; Mudereri, B.T.; Ayisi, K.K.; Ramudzuli, M.R. A Systematic Review on Advancements in Remote Sensing for Assessing and Monitoring Land Use and Land Cover Changes Impacts on Surface Water Resources in Semi-Arid Tropical Environments. Remote Sens. 2023, 15, 3926. [Google Scholar] [CrossRef] [Scilit]
- Alonso, L.; Renard, F. A New Approach for Understanding Urban Microclimate by Integrating Complementary Predictors at Different Scales in Regression and Machine Learning Models. Remote Sens. 2020, 12, 2434. [Google Scholar] [CrossRef] [Scilit]
- Habeeb, H.N.; Mustafa, Y.T. Analyzing the Impact of Geoenvironmental Factors on the Spatiotemporal Dynamics of Forest Cover via Random Forest. Earth 2025, 6, 3. [Google Scholar] [CrossRef] [Scilit]

Disclaimer/Publisher’s Note: The statements, opinions and data contained in all publications are solely those of the individual author(s) and contributor(s) and not of MDPI and/or the editor(s). MDPI and/or the editor(s) disclaim responsibility for any injury to people or property resulting from any ideas, methods, instructions or products referred to in the content. |
© 2026 by the authors. Licensee MDPI, Basel, Switzerland. This article is an open access article distributed under the terms and conditions of the Creative Commons Attribution (CC BY) license.