


Abstract
The growing recognition of the need for systemic approaches to urban climate transitions calls for comprehensive monitoring and evaluation frameworks that extend beyond Greenhouse Gas emissions to include measures that impact human behaviours, as well as process indicators that enable timely adjustments to climate action pathways. The extant literature offers limited insights into EU regional patterns and differences in the assessment of actions toward climate neutrality. This study examines indicators of process and co-benefit selected for the pilot projects of cities that aim to be climate neutral by 2030 in 21 European countries, and it aligns the indicators set utilised in the NetZeroCities pilot projects with the international frameworks of United Nations Sustainable Development Goals and New European Bauhaus. The findings highlight the relevance accorded by cities in all European regions to learning, awareness and participation, and inform on potential regional differences in the prioritisation of specific sustainability goals across North, West, South and East Europe. The methodology contributes to the sustainability science and transdisciplinary literature by aligning cities’ indicators with the SDG and NEB frameworks. Findings suggest that the EU focus on engagement, participation and social learning is being taken up by cities; furthermore, they contribute insights for a potentially more geographically and culturally aware design of European urban climate transitions.
1. Introduction
Cities are a pivotal context of action for the climate transition: they represent the source of approximately 70% of global Greenhouse Gas (GHG) emissions that cause climate change, due to the concentrated populations, consumption patterns and infrastructure [1]. The complexity encountered in traditional urban transition efforts has clarified that technological innovations and infrastructure upgrades alone are important but insufficient to completely mitigate emissions and thus call for deep socio-technical transformations that foster widespread change in consumption patterns and use behaviours. Effective transition requires a societal and cultural shift that needs to be addressed through innovations in governance that balance top-down direction with bottom-up participatory inclusion [2]. However, the challenge lies in navigating the complex entanglement of different elements within the urban transitions, which cannot be sufficiently addressed through conventional linear approaches. Hence, in recent years, systemic approaches have been getting traction both in policy and academic research as a response to the complex and interconnected nature of the climate crisis [3]. In Europe, systemic approaches to the transition have been adopted by both EU institutions as part of the new Mission-oriented innovation approach of the EU Missions. Mission-oriented innovation is a policy approach that posits the need to set time-bound societal goals by public authorities, to mobilise societal actors and drive systemic transformation through innovation [4,5]. Based on those principles, systemic approaches are adopted in EU Missions to achieve deep sustainability beyond mere technical innovation [6].
Such promising systemic approaches posit, however, a further challenge to European municipalities, concerning the planning, monitoring and evaluation of their transition pathways from a systemic perspective; the latter could enable holistic understanding of the progress made on climate actions and iterative course corrections necessary to remain on track to reach climate-neutral targets [7]. Conventional approaches to the monitoring and evaluation of climate actions primarily focus on measuring quantitative GHG emissions but offer limited insights on the societal aspects of climate transitions, which are crucial for long-lasting and meaningful change. In Europe, ambitious cities aiming to be climate-neutral by 2030 are already adopting a systemic approach tracking co-benefits, which are defined as the additional and beneficial impacts that arise from implementing climate mitigation strategies beyond GHG emissions reduction. However, this area of research is still relatively fragmented, and best practices are still to be formalised from ongoing implementation experiences across varied geographic and cultural contexts. The present paper addresses this gap by analysing indicators selected by 53 cities that are part of the EU-funded Horizon Europe project NetZeroCities, to monitor the co-benefits of their pilot actions. The innovation proposed by the paper is to integrate the indicators selected by cities with two international frameworks, namely the United Nations Sustainable Development Goals (SDGs) and the New European Bauhaus (NEB), in order to provide insights into the societal and cultural elements in the transition planning of the examined cities. The integration of SDG and NEB frameworks aims at increasing systemic understanding and comparability of climate planning across EU cities, which should manage to integrate the evaluation of technical and geographical governance, and societal and cultural dynamics, as a single whole.
The SDGs [8], formally adopted by the United Nations General Assembly in 2015 as part of the 2030 Agenda for Sustainable Development, represent a comprehensive global framework that synthesises ecological transition needs in seventeen objectives and one hundred sixty-nine specific targets. The latter are designed to address barriers to sustainable development in a systemic way: the framework operationalises the premise that sustainable development necessitates an integrated balancing of three distinct sustainability dimensions—the economic, social, and environmental—while simultaneously fostering inclusive, peaceful, and equal societies through multi-stakeholder partnerships. The SDGs operate on a fifteen-year implementation timeline concluding in 2030 and provide a transformative policy architecture that integrates poverty alleviation and health provisioning with gender equality, sustainable energy systems, climate action, and institutional governance. As legally non-binding but widely adopted normatively prescriptive international policy objectives, the SDGs articulate concrete, measurable targets addressing critical global challenges, including poverty eradication, the complete overcoming of hunger, quality education, energy security, economic productivity, technological innovation, infrastructure resilience, and ecosystem conservation, grounded in universal human rights principles and guided by five foundational dimensions. However, while SDGs have been widely adopted as an overarching lens for cross-contextual evaluations of global challenges, their scope is broader than systemic climate transitions and suited for developed and developing contexts.
In the European context, other initiatives that align with SDGs have been introduced, especially within the frame of the European Green Deal. An attempt to integrate human well-being with environmental sustainability, parallel to SDGs, is represented by the New European Bauhaus (NEB) [9], which constitutes a comprehensive initiative launched by the European Commission to articulate an integrated approach to the regeneration and transformation of the European built environment. The NEB is directly linked to the European Green Deal’s overarching climate neutrality objectives [10], which entail emissions reduction to the lowest feasible level, resulting in zero net contribution to atmospheric CO2. The European Green Deal aims at developing collaboration across conventional sectoral compartmentalisation. The specific approach of the NEB aims at the simultaneous achievement of climate mitigation, circular resource utilisation, social cohesion, and qualitative enhancement of human experience beyond functional utility [11]. Such ambition is implemented through a multi-annual funding mechanism administered via Horizon Europe and further EU financing instruments, with an estimated €120 million annual allocation from 2025 to 2027 [12]. Through these means, the NEB initiative channels investments in parallel with research and innovation, on the one hand, and local urban transformation projects, on the other. Such integration of knowledge and impact production is designed to generate impact, as well as data and learning on how to carry out further scalable interventions in European territories. The NEB framework prioritises place-based, context-sensitive design solutions to incorporate stakeholder engagement and co-creation with local cultural conceptions of aesthetics. The same principle has been applied to the evaluation of NEB projects through the self-assessment method published by the European Commission [13].
1.1. The NEB Compass
The NEB approach has been operationalised by the EU Commission through the NEB Compass [14], which is a strategic policy document developed to translate the objectives of the NEB into guidance for projects. The Compass synthesises sustainability imperatives with aesthetic and cultural considerations through three values, namely Beautiful, Sustainable and Together. Each NEB value is constituted by three cumulative levels of ambition, representing increasingly advanced implementations of the value itself.
- The value Beautiful is based on the assumption that the perceived aesthetic of places activates citizens and fosters connections; art and culture are considered fundamental elements of human well-being and cultural flourishing. This value is also meant to explicitly reconnect the NEB to the historical Bauhaus experience. The three entailed levels of ambition are:
- (i)
- To activate: activating the cultural and social qualities of each specific context to contribute to the well-being of inhabitants;
- (ii)
- To connect: fostering a shared sense of belonging and connecting different places and people through collective experiences;
- (iii)
- To integrate: integrating and bringing forth creative endeavours to establish new cultural and social values that reshape how people see themselves and their environments.
- The value Sustainable focuses on environmental goals, aligning the NEB with the European Green Deal. The consequent ambition levels are:
- (i)
- To repurpose: extending the lifecycle of products and reducing their impact through repurposing, repair, re-use, and recycling.
- (ii)
- To close the loop: reducing linear processes and integrating different actors in value chains through circular economy and systemic approaches to zero-pollution.
- (iii)
- To regenerate: inverting projects’ output from impact on biodiversity to its regeneration, in parallel to fostering shifts in human behaviour and worldviews.
- The value Together focuses on inclusion of all elements of society, thus entailing equality, accessibility and affordability.
- (i)
- To include: aiming at ensuring equal access and affordability regardless of gender, age, ability, or background.
- (ii)
- To consolidate: aiming at consolidating inclusion through structural mechanisms that secure social justice over time.
- (iii)
- To transform: aiming at transforming society through new social models and creating new ways of living together based on solidarity and cooperation.
For the purpose of comparison, each NEB value and corresponding levels of ambition are further disaggregated in the Compass in sub-categories, which are provided in Table 1.
Table 1.
New European Bauhaus (NEB) Compass structure.
While the NEB framework was not conceived as normative, a growing number of projects and publications are utilising the NEB self-assessment methodology, integrating it into projects’ analytical frameworks [15,16,17,18]. This small but growing quantitative evaluation of NEB projects complements the more extensive scholarly qualitative inquiry on NEB implementation pathways, which addresses the operationalisation of NEB values in specific innovation projects [16].
1.2. Research Questions
This study aims to examine indicators of climate actions beyond GHG emissions, detecting regional patterns across European cities. To identify indicators selected by cities, this study draws on data from the first cohort of 53 cities that are part of the Horizon Europe project NetZeroCities (NZCs). The project provides a platform to support 112 cities belonging to the EU Mission “100 Climate-Neutral and Smart Cities”, to achieve climate neutrality by 2030 [19] through resources, dedicated support and funding. Mission Cities participating in the NetZeroCities project can participate in the Pilot City Programme to receive support and funding for specific pilot projects. In the application form, municipalities need to formulate the expected impacts using the NetZeroCities theory of change framework [20]—which was designed within the project as a planning method to align all dimensions of climate transformation in a single impact pathway—and related standardised indicators. The NetZeroCities theory of change has been designed to enable cities to map short-, medium- and long-term impacts of planned climate actions across a matrix of six systemic levers and six emission domains [20], thereby enabling cities to visualise interconnections within their systemic portfolio of actions. The NetZeroCities pilot projects evaluation framework provided participating cities with a set of 24 standardised (non-GHG) co-benefit indicators to measure effects across five impact domains (which are listed later in Section 2.2).
In the existing literature, comparative analyses of systemic climate planning approaches and strategies across European regions [21] beyond technological solutions are limited, due to the lack of comparable data across countries beyond GHG emissions (i.e., through the Covenant of Mayors initiative) and technical domains. This gap is theoretically and pragmatically relevant because of the recognition that urban planning is constrained by historical and localised processes of path dependency [22,23] and policies. The present study leverages the NEB framework to add a further layer of analysis that can grasp cultural elements, represented in the NEB value Beautiful, and set the stage to understand the latter as geographically located, rather than leaving its evaluation to the discretion of each evaluation project [13].
This study sets to investigate regional differences within Europe in the planning and assessment of climate action of pilot projects within systemic transitions, through a comparative analysis of pilot projects of 53 EU Mission Cities, to answer the following research questions:
- (1)
- What is the distribution of cities’ indicator selections across impact domains?
- (2)
- What are the differences across European regions based on cities’ indicator selections?
- (3)
- What are the most prevalent NEB values and ambition levels selected by European cities, in relation with the NZC indicators?
- (4)
- What are the differences across European regions based on NEB values and ambition levels?
- (5)
- Aligning the available indicators with UNSDGs, which are the most prevalent SDGs selected by European cities?
2. Data and Methodology
This section provides details on the data used in the study and its source, as well as the methodology adopted. The section thus clarifies the boundaries of the analysis, which are consequential for Section 4 and Section 5.
2.1. Data Sources
Cities submitted their plans as part of their pilot funding proposals using a standardised format known as Proposal Refinement Documents (PRDs), provided by the NetZeroCities Pilot City Programme. These documents capture the proposed climate actions, together with both standardised and customised indicators selected by the cities to monitor and evaluate progress. This study analyses all standardised indicators selected by the first cohort of 53 cities which were awarded funding for implementing their pilot proposals in March 2023 under the NetZeroCities Pilot City Programme, focusing on how these indicators are used to monitor proposed climate actions.
The NetZeroCities pilot programme categorises the first cohort of cities into:
- (1)
- Single-city pilots comprising 19 cities: Bristol (UK), Budapest (Hungary), Cluj-Napoca (Romania), Dijon (France), Drammen (Norway), Galway (Ireland), Guimarães, (Portugal), Istanbul (Türkiye), Kozan (Greece), Lahti (Finland), Leuven (Belgium), Liberec (Czech Republic), Limassol (Cyprus), Malmö (Sweden), Nantes (France), Rivne (Ukraine), Turku (Finland), Umea (Sweden) and Upsala (Sweden).
- (2)
- Multi-city pilots comprising 7 Dutch cities: (Amsterdam, Eindhoven, Groningen, Helmond, Rotterdam, The Hague, and Utrecht), 3 German cities (Aachen, Mannheim, and Muenster), 9 Italian cities (Bologna, Bergamo, Florence, Milan, Padova, Parma, Prato, Rome, and Turin), 7 Spanish cities (Barcelona, Madrid, Seville, Valencia, Valladolid, Vitoria-Gasteiz and Zaragoza), 3 Slovenian cities (Kranj, Ljubljana, and Velenje), and 5 Polish cities (Krakow, Łódź, Rzeszów, Warsaw and Wrocław). Information on these specific pilot projects is available online at https://netzerocities.eu/pilot-cities-cohort-1-2022/ (accessed on 24 January 2026).
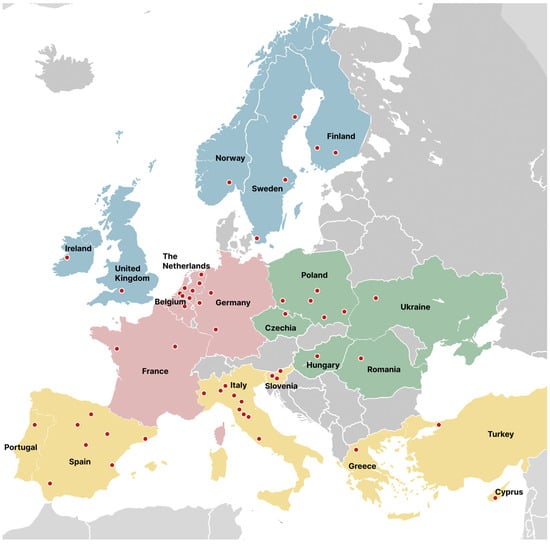
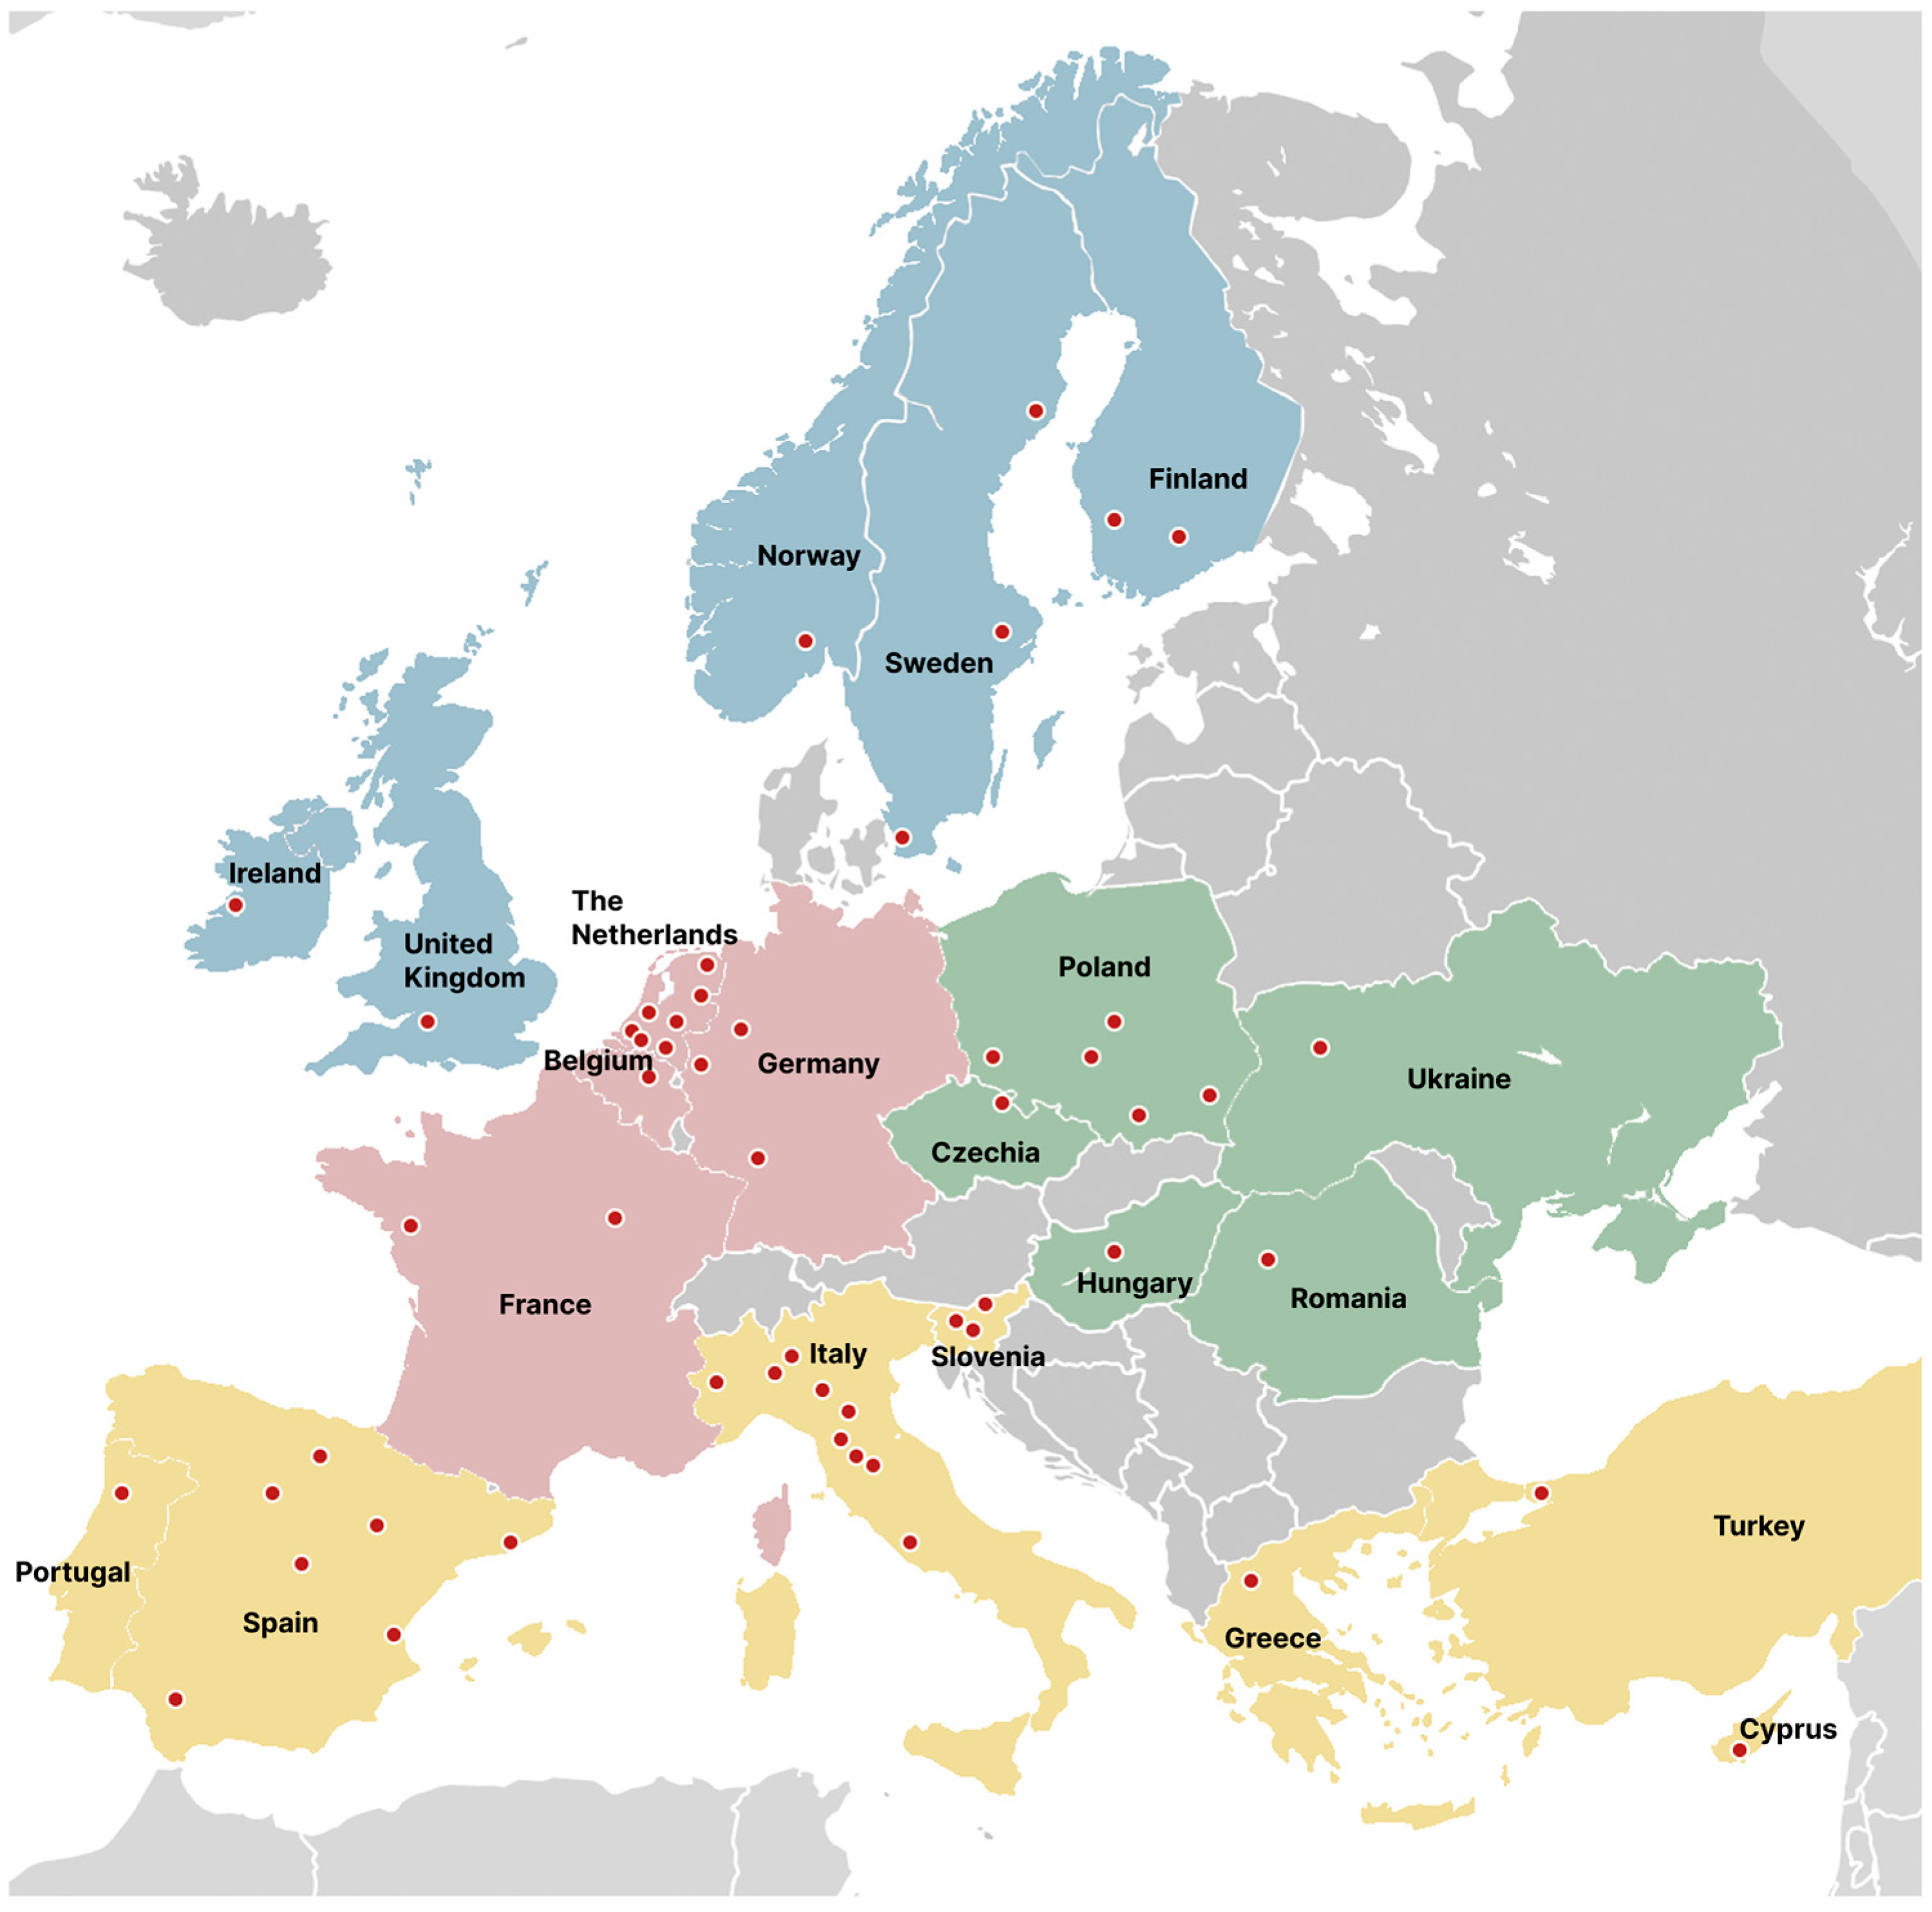
Figure 1 visually illustrates the distribution of the cities across European Regions, which are differentiated according to the United Nations Geoscheme for Europe, available online at https://unstats.un.org/unsd/methodology/m49/ (accessed on 24 January 2026).
Figure 1.
Map of cities analysed (the red dots visually indicate the cities which have been analysed).
In order to submit their pilot project proposals, cities had to select their actions’ impact assessment based on GHG emissions, as well as a set of 24 standardised non-GHG indicators [24], listed in Section 2.2. The indicators available to the cities are categorised into impact domains and subdomains that highlight the broad sector each indicator influences. Cities were free to use one or more indicators to measure multi-dimensional impacts of their climate actions or define their own customised indicators to measure the impact of their actions. This study focuses on the standardised indicator selections made by the cities and does not include the customised indicators. In total, the 53 cities for their pilot projects submitted 445 climate actions and related indicators for their assessment. It is important to note that, in order to meet the mandatory requirements of the NetZeroCities Pilot City Programme funding call, cities were required to select standardised indicators for each proposed action using the prescribed format. As a result, no missing indicator data were reported, and the same was extracted and compiled for this study.
2.2. Research Methodology
The study is conducted in 3 steps:
- (1)
- Data extraction and compilation: Firstly, a dataset was created with indicators extracted from the Proposal Refinement Documents (PRDs) submitted by the 53 participating cities, in which the actions and related indicators proposed by each pilot project and city are mapped. Then, the number of times cities selected each standardised indicator was computed.
- (2)
- Classification of Indicators in terms of SDG and NEB: This part of the study extends the findings of a previous study [25], which coded and analysed the standardised indicator selections made by 40 cities in relation to SDGs. The frequency of occurrence of each indicator was computed based on the number of times it was selected by each city, highlighting emerging trends of the most prioritised SDGs for European cities in systemic climate transitions.
The current study first extends this SDG-related analysis of the 24 standardised indicator selections with newly available data from 13 more cities belonging to different European regions, including Dijon (France), 7 Dutch cities (Amsterdam, Eindhoven, Groningen, Helmond, Rotterdam, The Hague, and Utrecht), and 5 Polish cities (Krakow, Łódź, Rzeszów, Warsaw and Wrocław). The inclusion of the 13 new cities in the analysis shows minor variations in terms of the top 10 ranking SDGs in comparison to the previous study. It further analyses all cities’ input in terms of regional differences and NEB categorisation.
The processes to codify NEB and SDGs followed a triangulation approach [26], whereby three authors independently classified each indicator according to the most relevant SDGs and NEB values and ambition levels. In the NEB Compass, each value comprises 3 ambition levels, and each ambition level is characterised by three to four dimensions. Three authors individually coded the 24 standardised indicators (available as Supplementary Material) of the NetZeroCities Pilot City Programme, in relation to NEB granular dimensions. To support coding, all three authors consistently referred to the descriptions, guiding questions, and keywords defined for each ambition level within the NEB Compass. While coding inherently involves a degree of interpretive judgement, the use of a shared analytical rationale facilitated structured consensus-building discussions among the three authors following the initial coding process. After the independent coding, the three authors engaged in a consensus-building discussion to resolve discrepancies and arrive at a final set of coded indicators unanimously agreed upon. Finally, ambition levels were assigned to each indicator based on the ambition levels associated with its corresponding dimensions, following the criteria described in Table 2.
Table 2.
Criteria for assigning indicator ambition level per NEB value.
Assigning an Indicator Ambition Level to NEB values was conducted with the criteria outlined in Table 2. For instance, the indicator “Improved citizen participation” corresponds to the dimensions (i) fostering shared social values, (ii) societal development and collective growth and (iii) new ways of living (together) under the NEB Value “Together”. Since all three corresponding dimensions belong to Ambition Level 3 (“To Transform”), the indicator is also coded with Ambition Level 3 for the Value “Together”, although there are other coded dimensions for this indicator within the same NEB value corresponding to a lower ambition level. Table 3 illustrates the coding of the indicators according to SDGs and NEB values (ambition levels). Nevertheless, as with any qualitative coding process, the potential for individual interpretive bias cannot be fully eliminated and is therefore acknowledged as a limitation of this study.
Table 3.
NetZeroCities standardised non-GHG indicators for pilot projects, coded according to SDGs and NEB values.
- (3)
- Analysis: The frequency of selection of each of the 24 indicators of the NetZeroCities Pilot City Programme, aligned with the corresponding SDG and NEB value-ambition domains, was computed to analyse data according to the five research questions reported in Section 1.2:
- The distribution of cities’ indicator selections across impact domains (Section 3.1): Based on the impact domains defined in the NetZeroCities standardised indicator framework for pilot projects, the distribution of indicator selections was analysed to determine the most selected impact domains.
- Regional patterns based on cities’ indicator selections (Section 3.2): The regional trends per indicator and impact domain were derived by adding the number of selections of each indicator by cities for each European region of North, South, East and West as per the United Nations Geoscheme for Europe (https://unstats.un.org/unsd/methodology/m49/) (accessed on 24 January 2026).
- Relation between the 24 NetZeroCities (non-GHG) standardised indicators with the New European Bauhaus Compass (Section 3.3): Following the coding of the NEB values and ambition domains with indicators, the emerging patterns of NEB were derived, to establish a broad-level understanding of the most prevalent values and ambition levels across Europe
- Emerging patterns of NEB values across European regions (Section 3.4) using a weighted score method: Using the coding of each of the 24 non-GHG indicators against the NEB Compass.
- Alignment of indicators with SDGs (Section 3.5).
3. Results
This section discloses the results of the analysis, which answer the research questions presented in Section 1.2. To aid the reader, each answer to a research question is organised as a sub-section, with the second number aligned with the number of the corresponding research question.
3.1. Distribution of Cities’ Indicator Selections Across Impact Domains
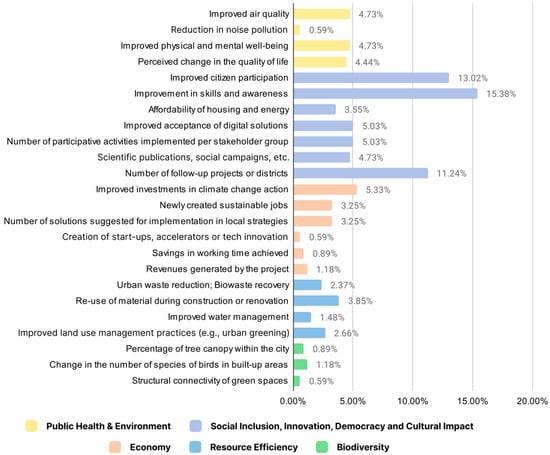
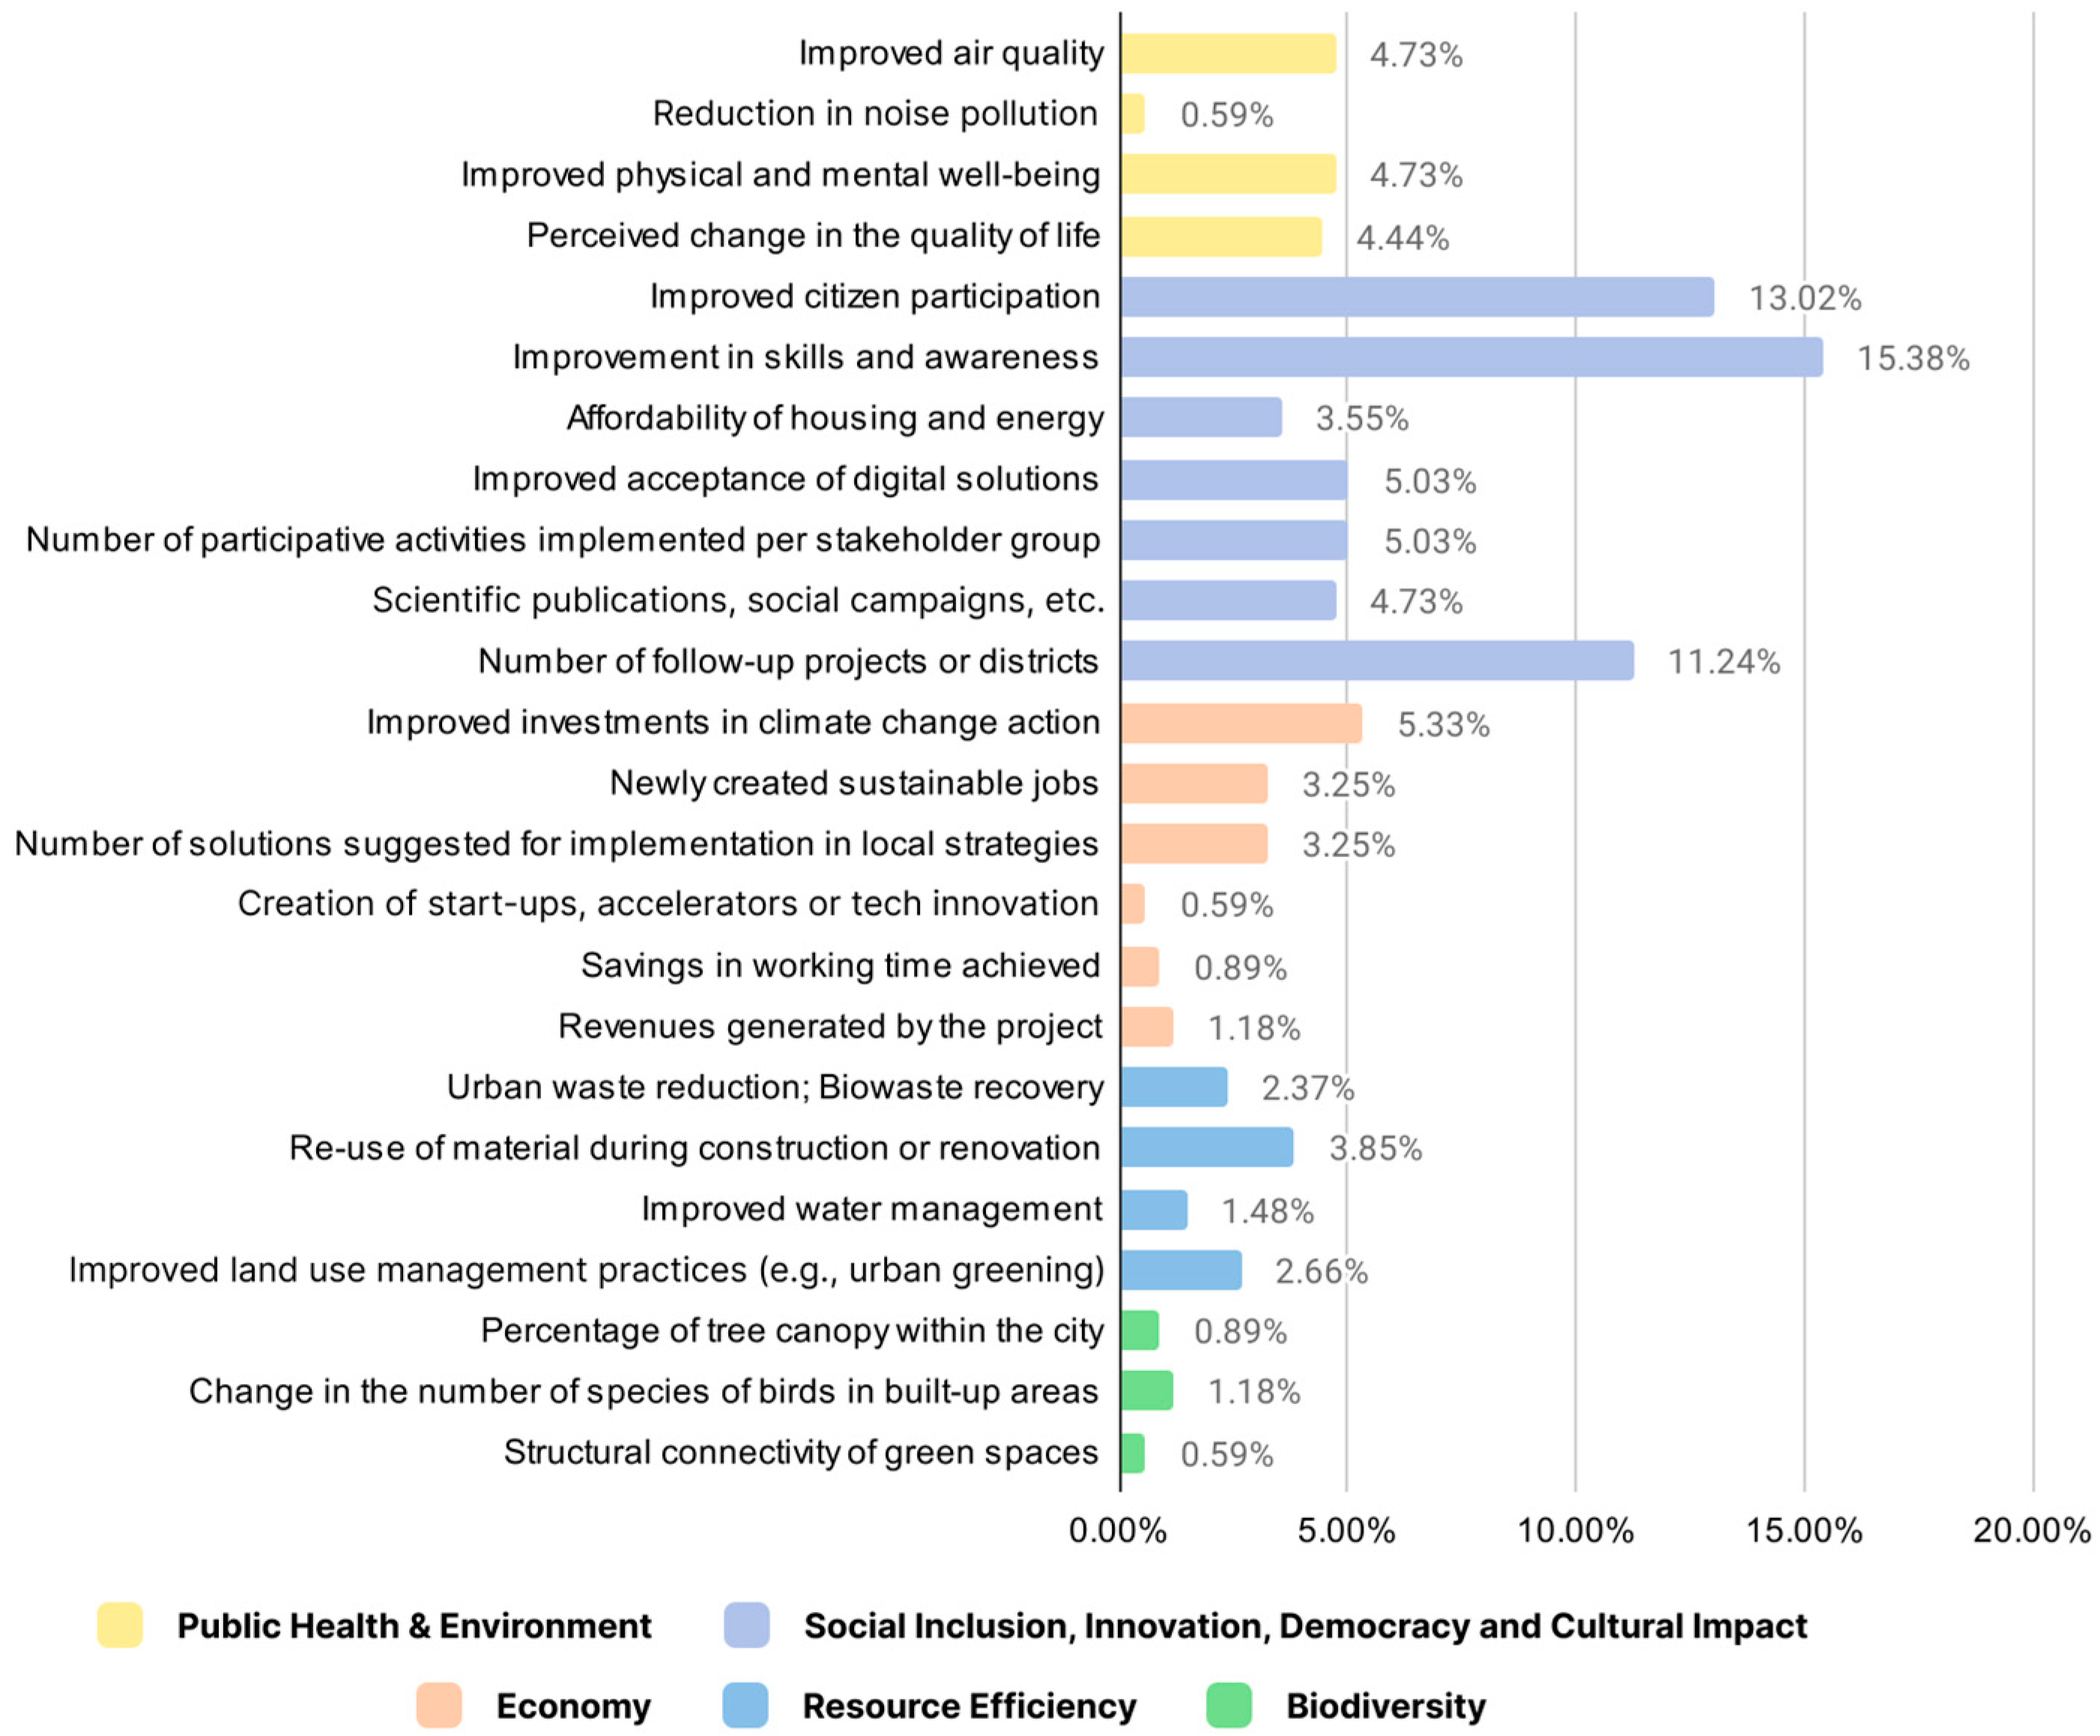
The frequency distribution of standardised NetZeroCities Pilot City Programme indicator selections by cities (Figure 2) shows a strong concentration in the impact domains of Social Inclusion, Innovation, Democracy and Cultural Impact, which accounts for 196 out of 338 selected indicators (57.99%). Within this domain, the most frequently selected indicators are “Improvement in skills and awareness” (capacity of the public administration; 52 selections, 15.38%) and “Improved citizen participation” (citizen and communities’ participation; 44 selections, 13.02%), followed by “Number of follow-up projects or districts” (upscaling and replication; 38 selections, 11.24%). Indicators related to social innovation and digitalisation—“Improved acceptance of digital solutions” and “Number of participative activities implemented per stakeholder group”—each receive 17 selections (5.03%), while “Scientific publications, social campaigns, etc.” (scientific/communication outreach) is selected 16 times (4.73%).
Figure 2.
Indicator and impact domain distribution based on the cities’ indicator selections.
By contrast, the Public Health and Environment and Economy domains each account for 49 selections (≈14.5% each), with more moderate but still notable levels of interest. In Public Health and Environment, “Improved air quality” and “Improved physical and mental well-being” are both selected 16 times (4.73%), and “Perceived change in the quality of life” appears 15 times (4.44%), indicating that cities do recognise health and quality-of-life outcomes as important co-benefits of climate-neutral actions. In the Economy domain, the most selected indicator is “Improved investments in climate change action” (investment in R&I; 18 selections, 5.33%), whereas other economic indicators such as “Newly created sustainable jobs” and “Number of solutions suggested for implementation in local strategies” each receive 11 selections (3.25%), and more market-oriented or efficiency indicators—“Creation of start-ups, accelerators or tech innovation” (2 selections, 0.59%), “Savings in working time achieved” (3 selections, 0.89%), and “Revenues generated by the project” (4 selections, 1.18%)—remain comparatively marginal.
Environmental performance beyond health is less frequently prioritised. The Resource Efficiency domain represents 35 selections (10.36%), with “Re-use of material during construction or renovation” (circular economy; 13 selections, 3.85%) and “Urban waste reduction; Biowaste recovery” (waste management and efficiency; 8 selections, 2.37%) leading within this group. “Improved water management” (five selections, 1.48%) and “Improved land use management practices (e.g., urban greening)” (nine selections, 2.66%) are selected less often. The Biodiversity domain is the least represented overall, with only nine selections (2.66%) across all three indicators: “Percentage of tree canopy within the city” (three selections, 0.89%), “Change in the number of species of birds in built-up areas” (four selections, 1.18%), and “Structural connectivity of green spaces” (two selections, 0.59%). Taken together, the results indicate that non-GHG priorities of sample cities cluster most strongly around governance, participation, capacity building and scaling, while biodiversity and specific resource efficiency outcomes are comparatively underrepresented in indicator selection.
3.2. Differences Across European Regions Based on Cities’ Indicator Selections
By comparing the distribution of indicators across the five impact domains, the analysis highlights distinct regional patterns across sample cities from Eastern, Northern, Southern and Western Europe.
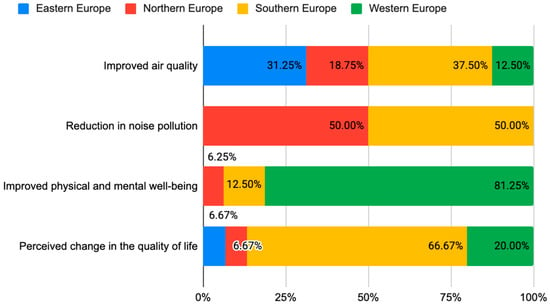
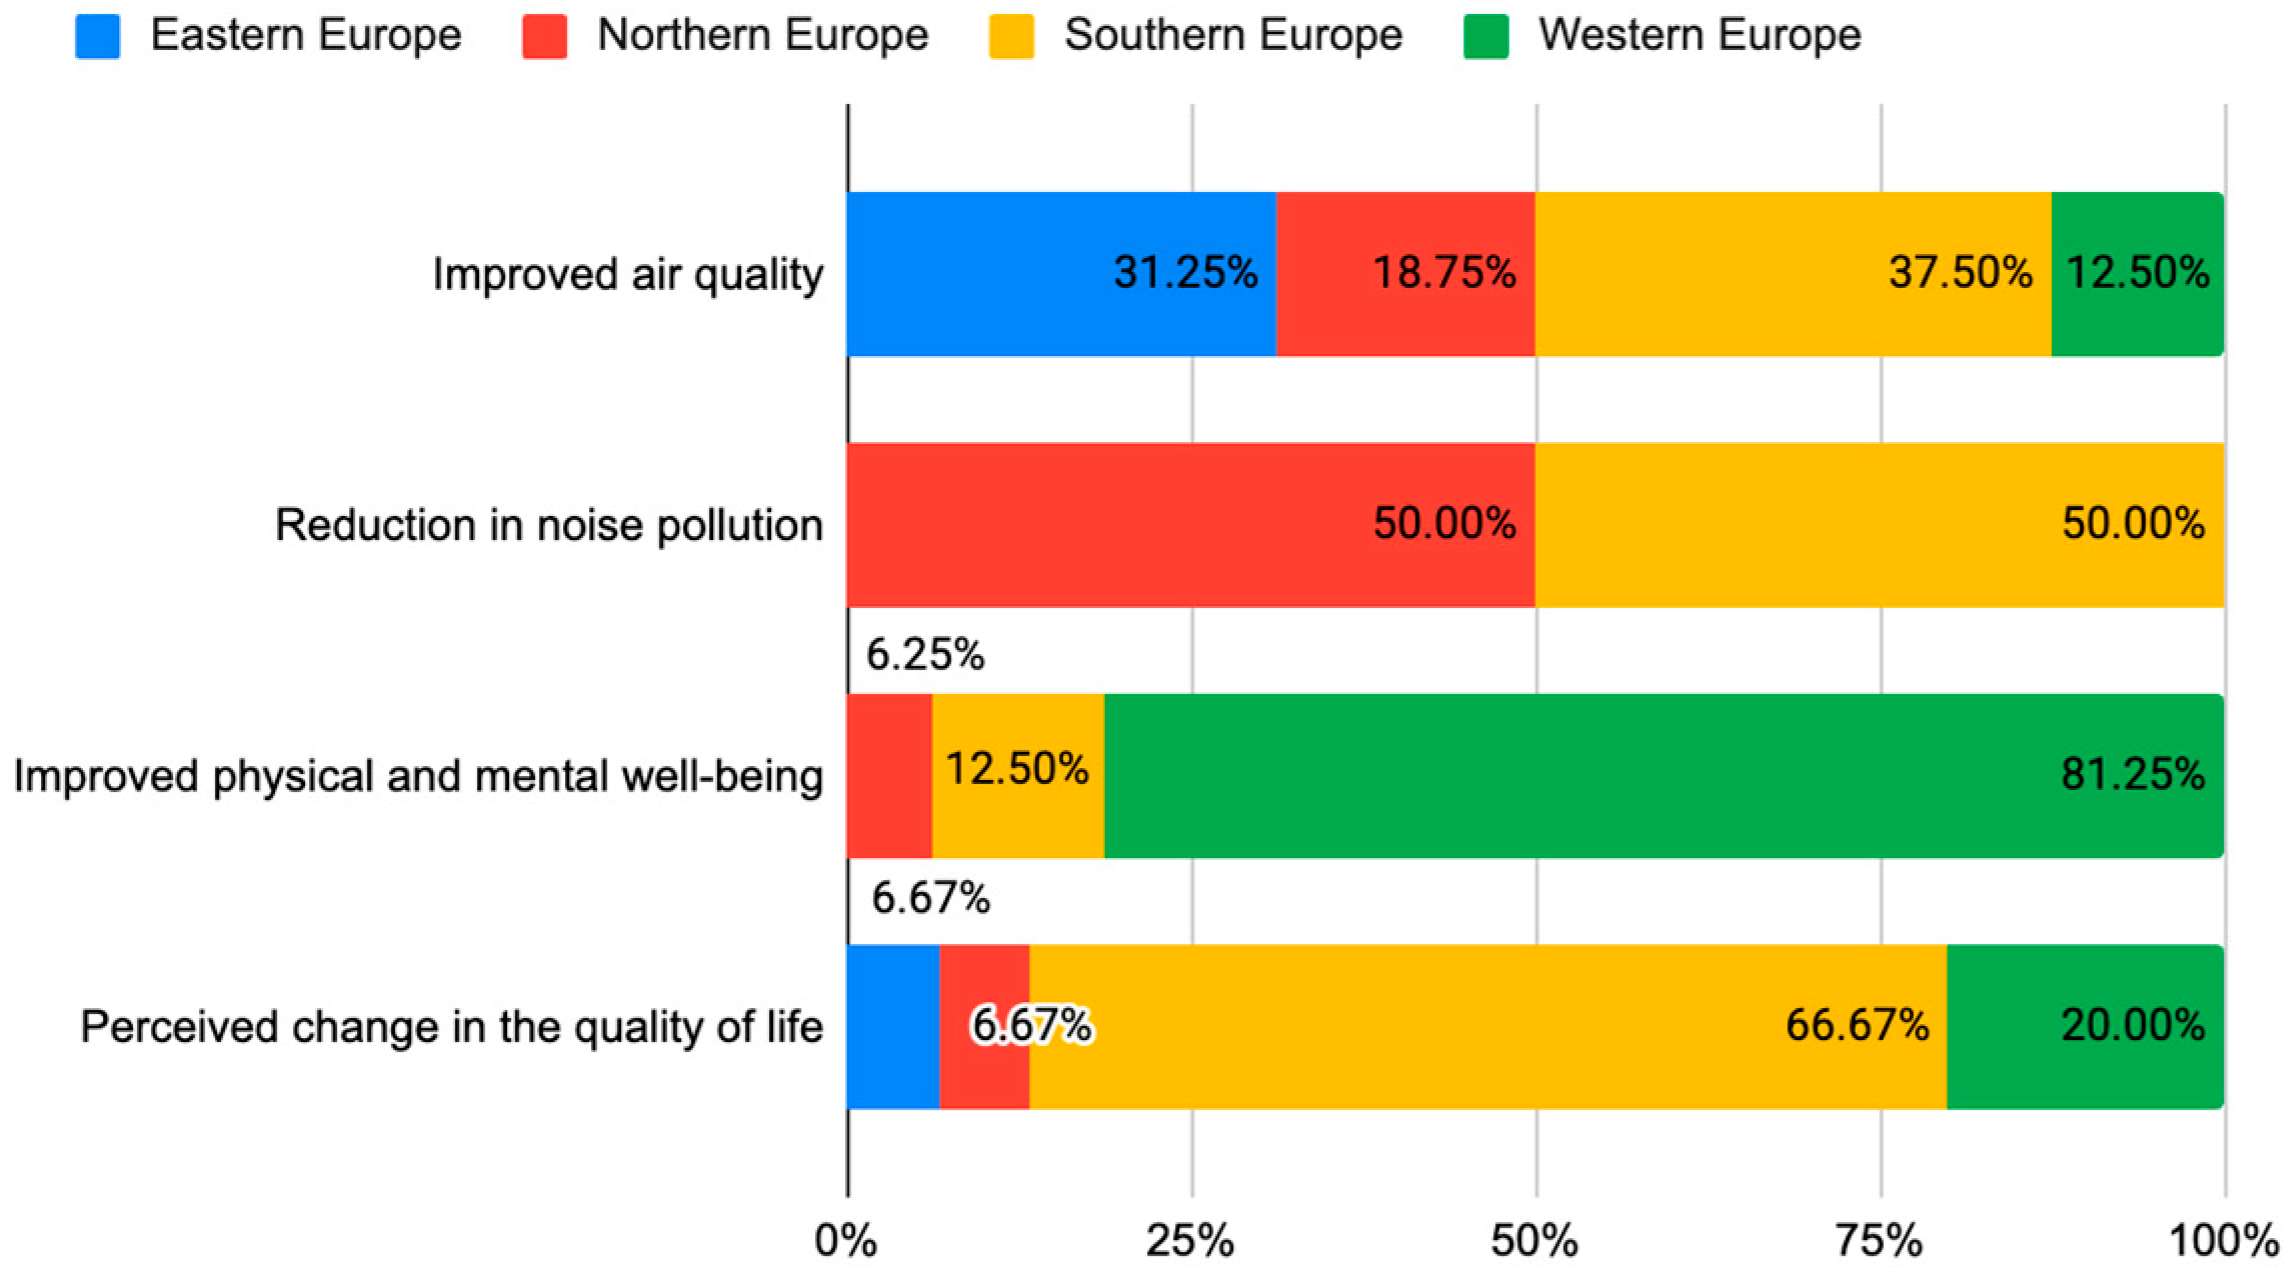
Across the Public Health and Environment domain (Figure 3), regions show clear differences. Eastern Europe focuses mainly on Improved air quality (31.25%), with limited attention to other indicators. Northern Europe prioritises Reduction in noise pollution (50.00%), whereas Southern Europe displays the highest intensities overall, particularly for Perceived change in the quality of life (66.67%) and Reduction in noise pollution (50.00%). Western Europe is strongly oriented toward Improved physical and mental well-being (81.25%), the highest share for any indicator in this domain.
Figure 3.
Regional distribution of the Public Health and Environment impact domain.
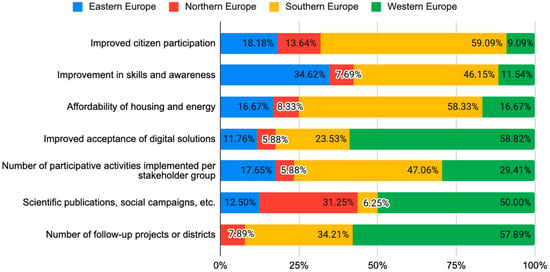
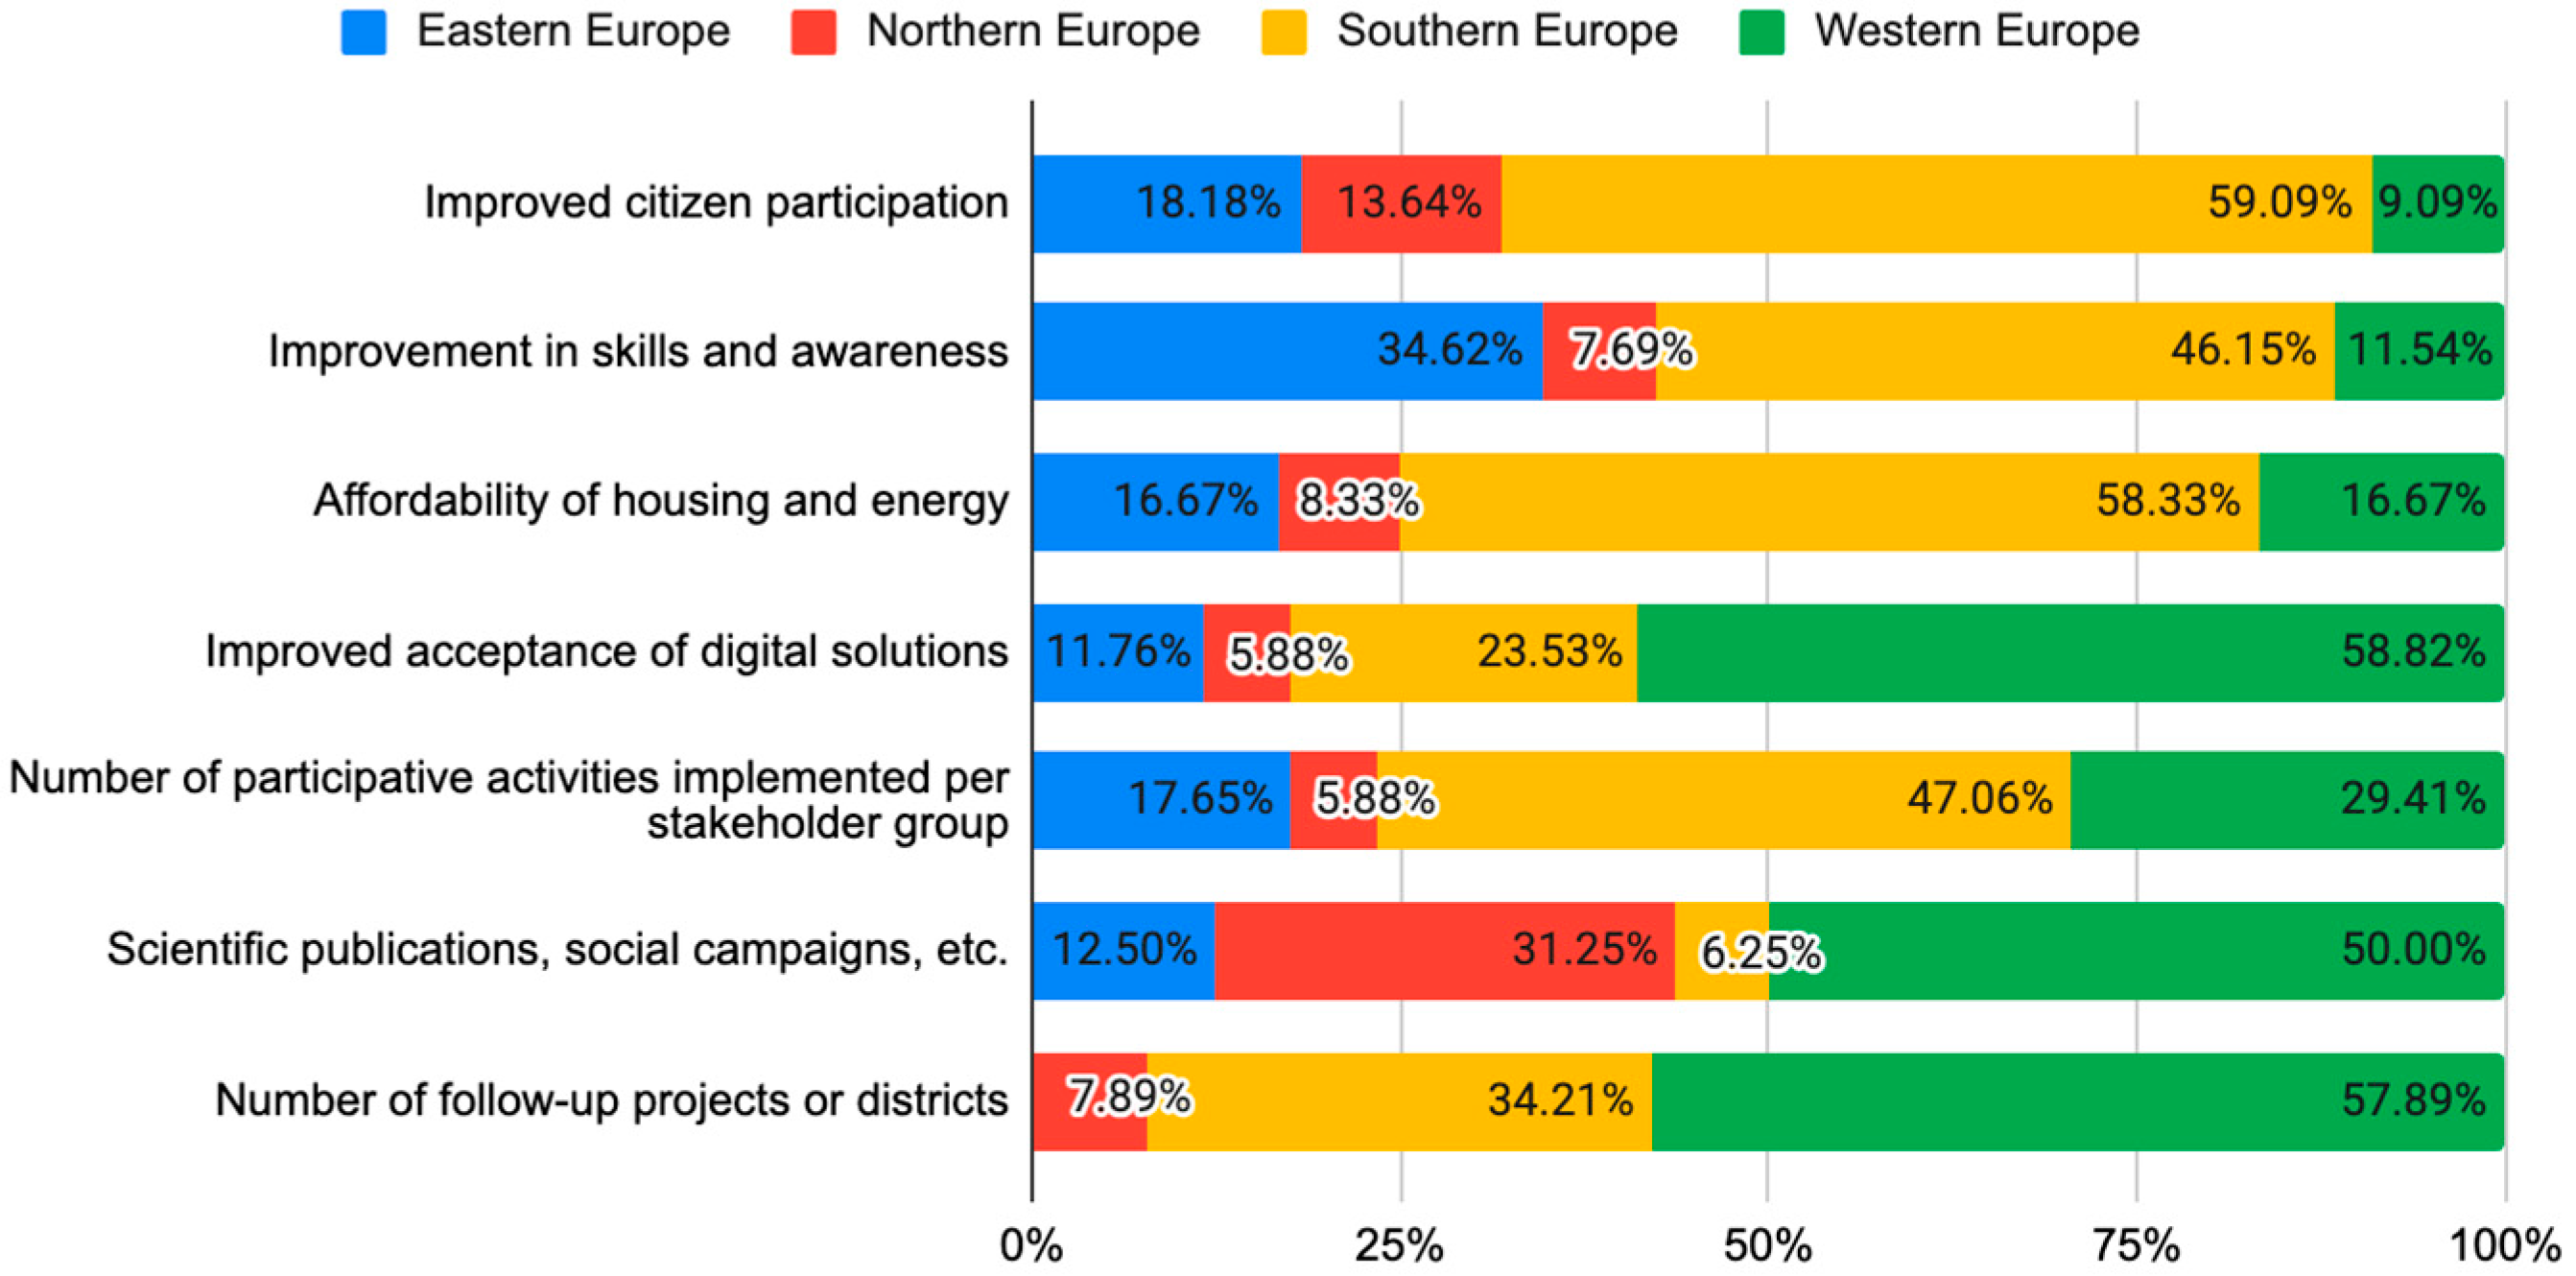
In the Social Inclusion, Innovation, Democracy and Cultural Impact domain (Figure 4), variation is even more pronounced. Eastern Europe emphasises Improvement in skills and awareness (34.62%) and Improved citizen participation (18.18%). Northern Europe’s strongest focus is on Scientific publications, social campaigns, etc., (31.25%). Southern Europe shows the most intensive selections across the domain, including Improved citizen participation (59.09%), Affordability of housing and energy (58.33%), and Number of participative activities implemented per stakeholder group (47.06%). Western Europe concentrates on innovation diffusion and scaling, evident in Improved acceptance of digital solutions (58.82%), Scientific publications, social campaigns etc (50.00%), and Number of follow-up projects or districts (57.89%).
Figure 4.
Regional distribution of the Social Inclusion, Innovation, Democracy and Cultural Impact domain.
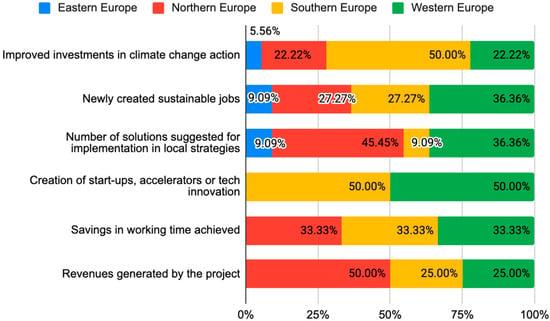
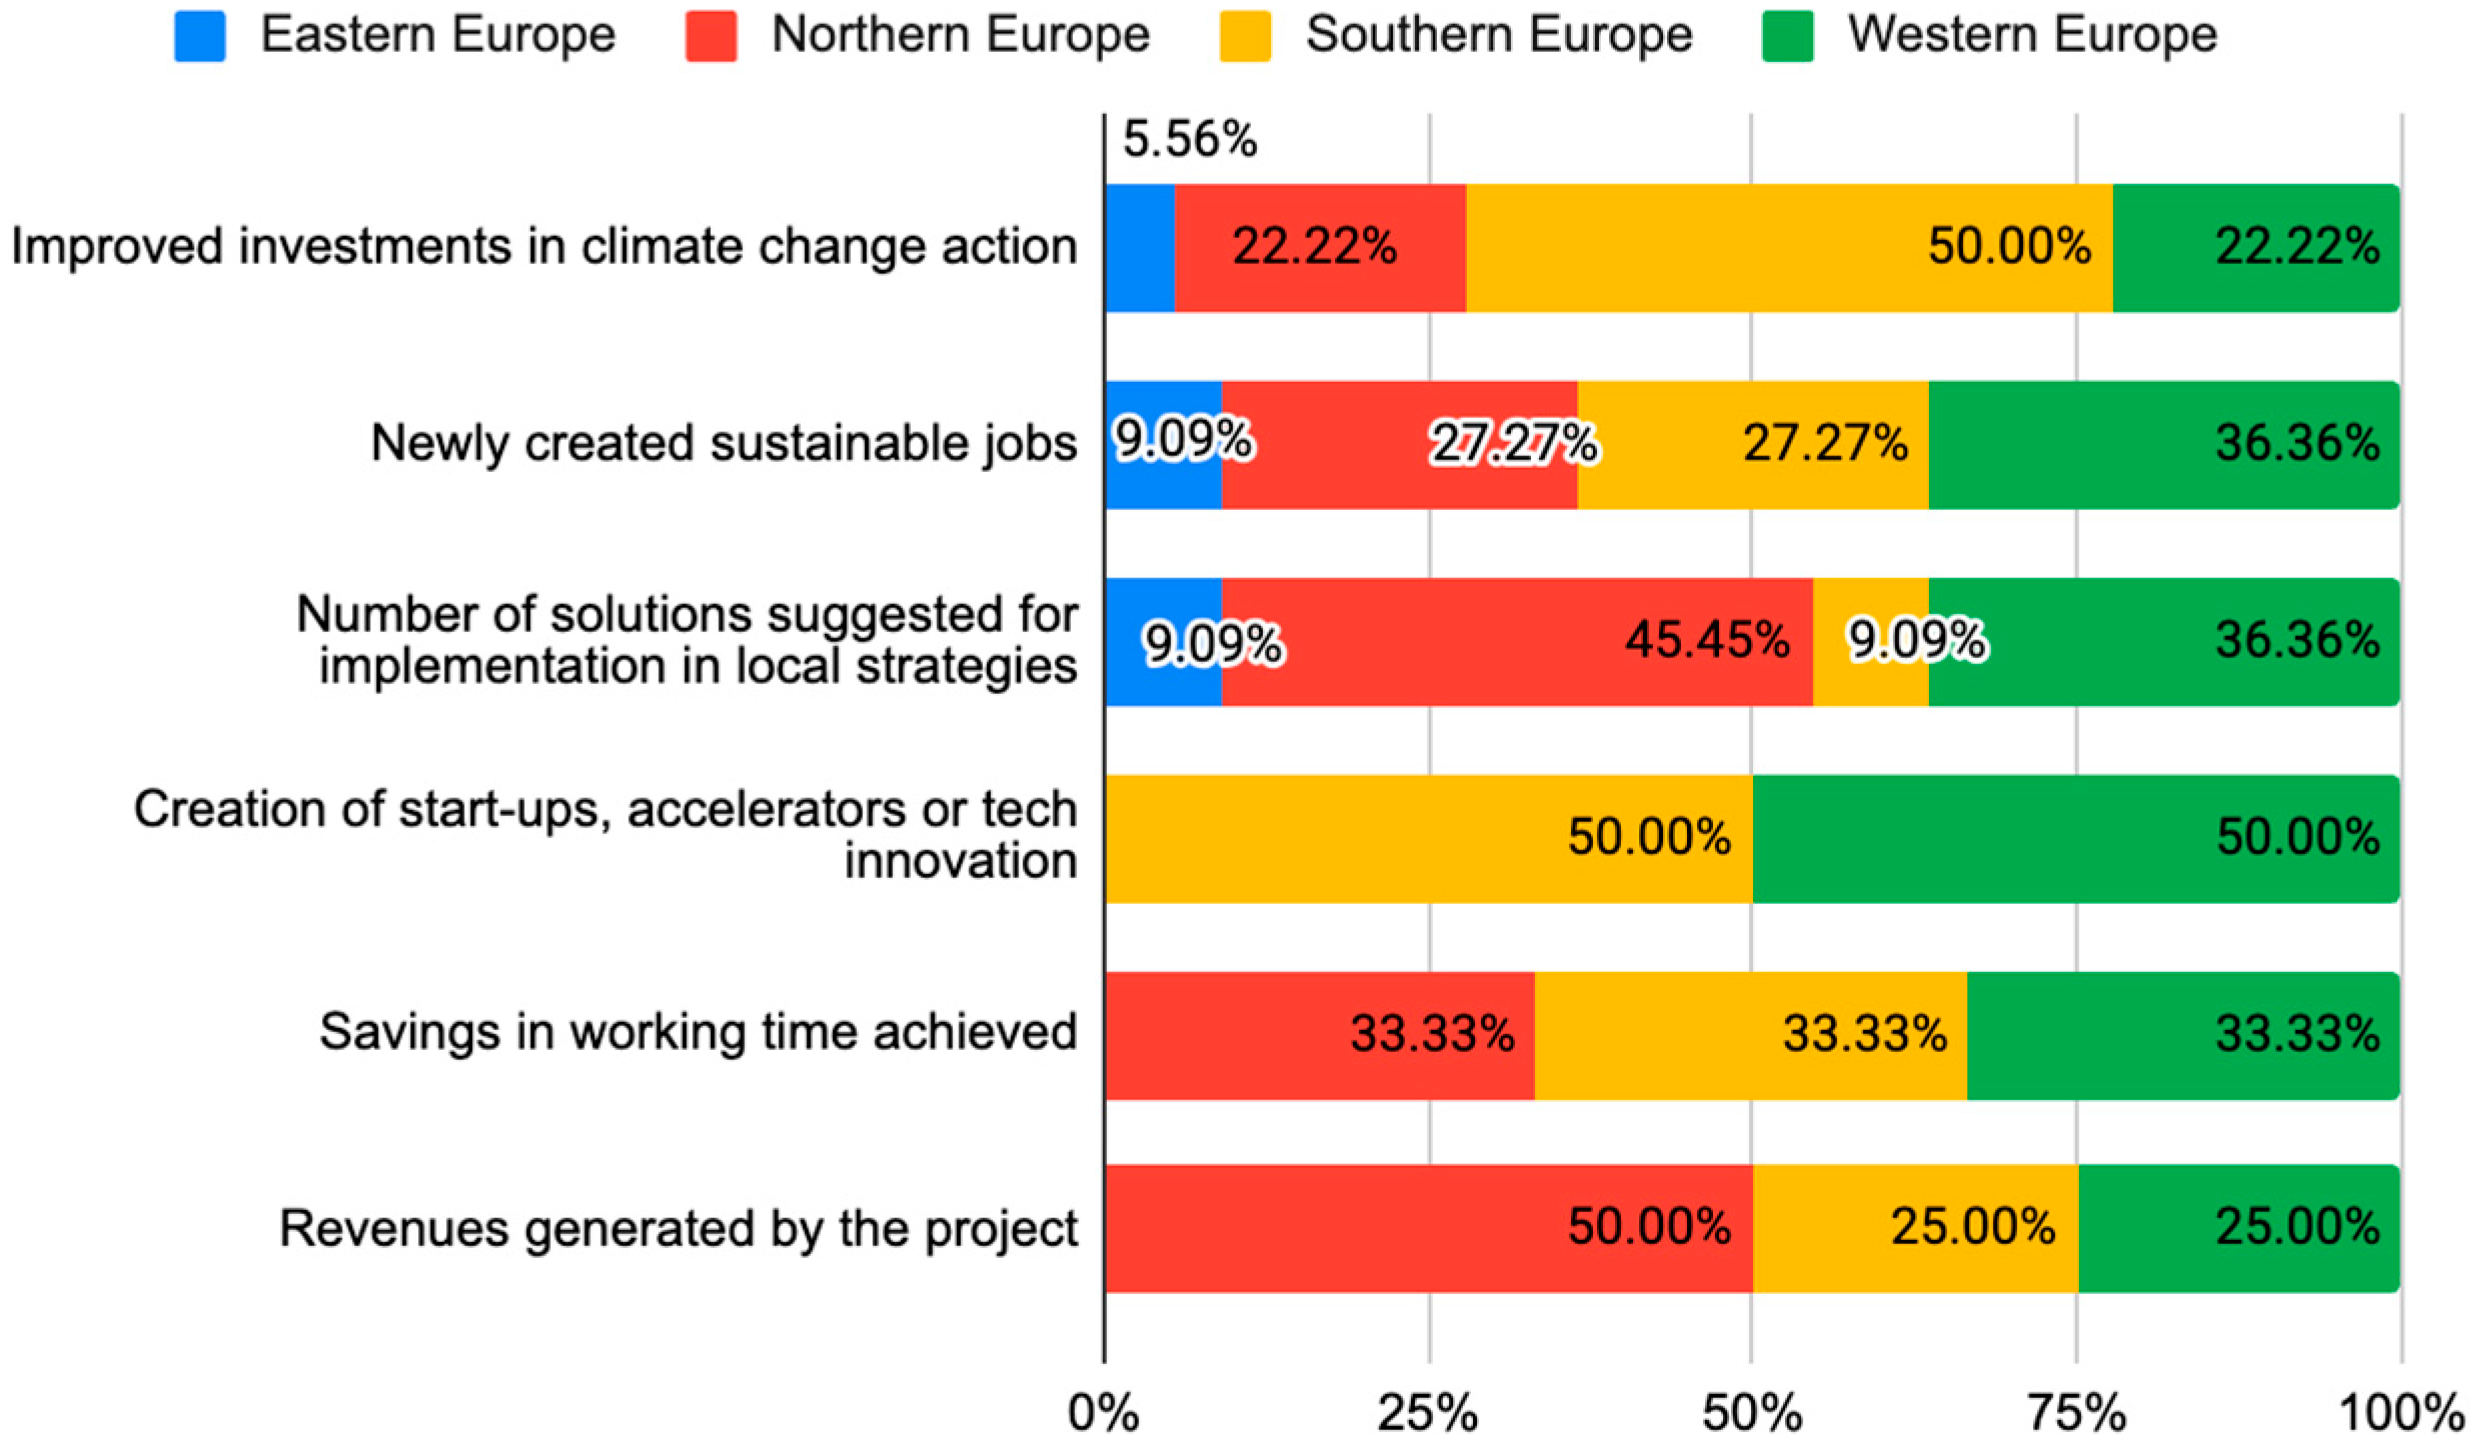
The Economy domain (Figure 5) shows further differentiation. Eastern Europe displays low and broadly distributed values, with modest engagement in Newly created sustainable jobs and Number of solutions suggested for implementation in local strategies (both 9.09%). Northern Europe displays stronger economic ambition, particularly in Number of solutions suggested for implementation in local strategies (45.45%) and Newly created sustainable jobs (27.27%). Southern Europe is dominated by Improved investments in climate change action (50.00%). Western Europe shows a diverse innovation-led profile, with high proportions for Creation of start-ups, accelerators or tech innovation (50.00%) and Newly created sustainable jobs (36.36%).
Figure 5.
Regional distribution of the Economy impact domain.
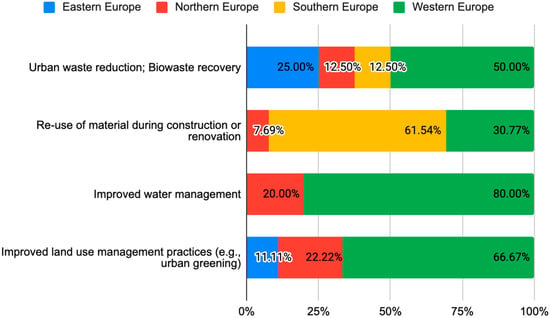
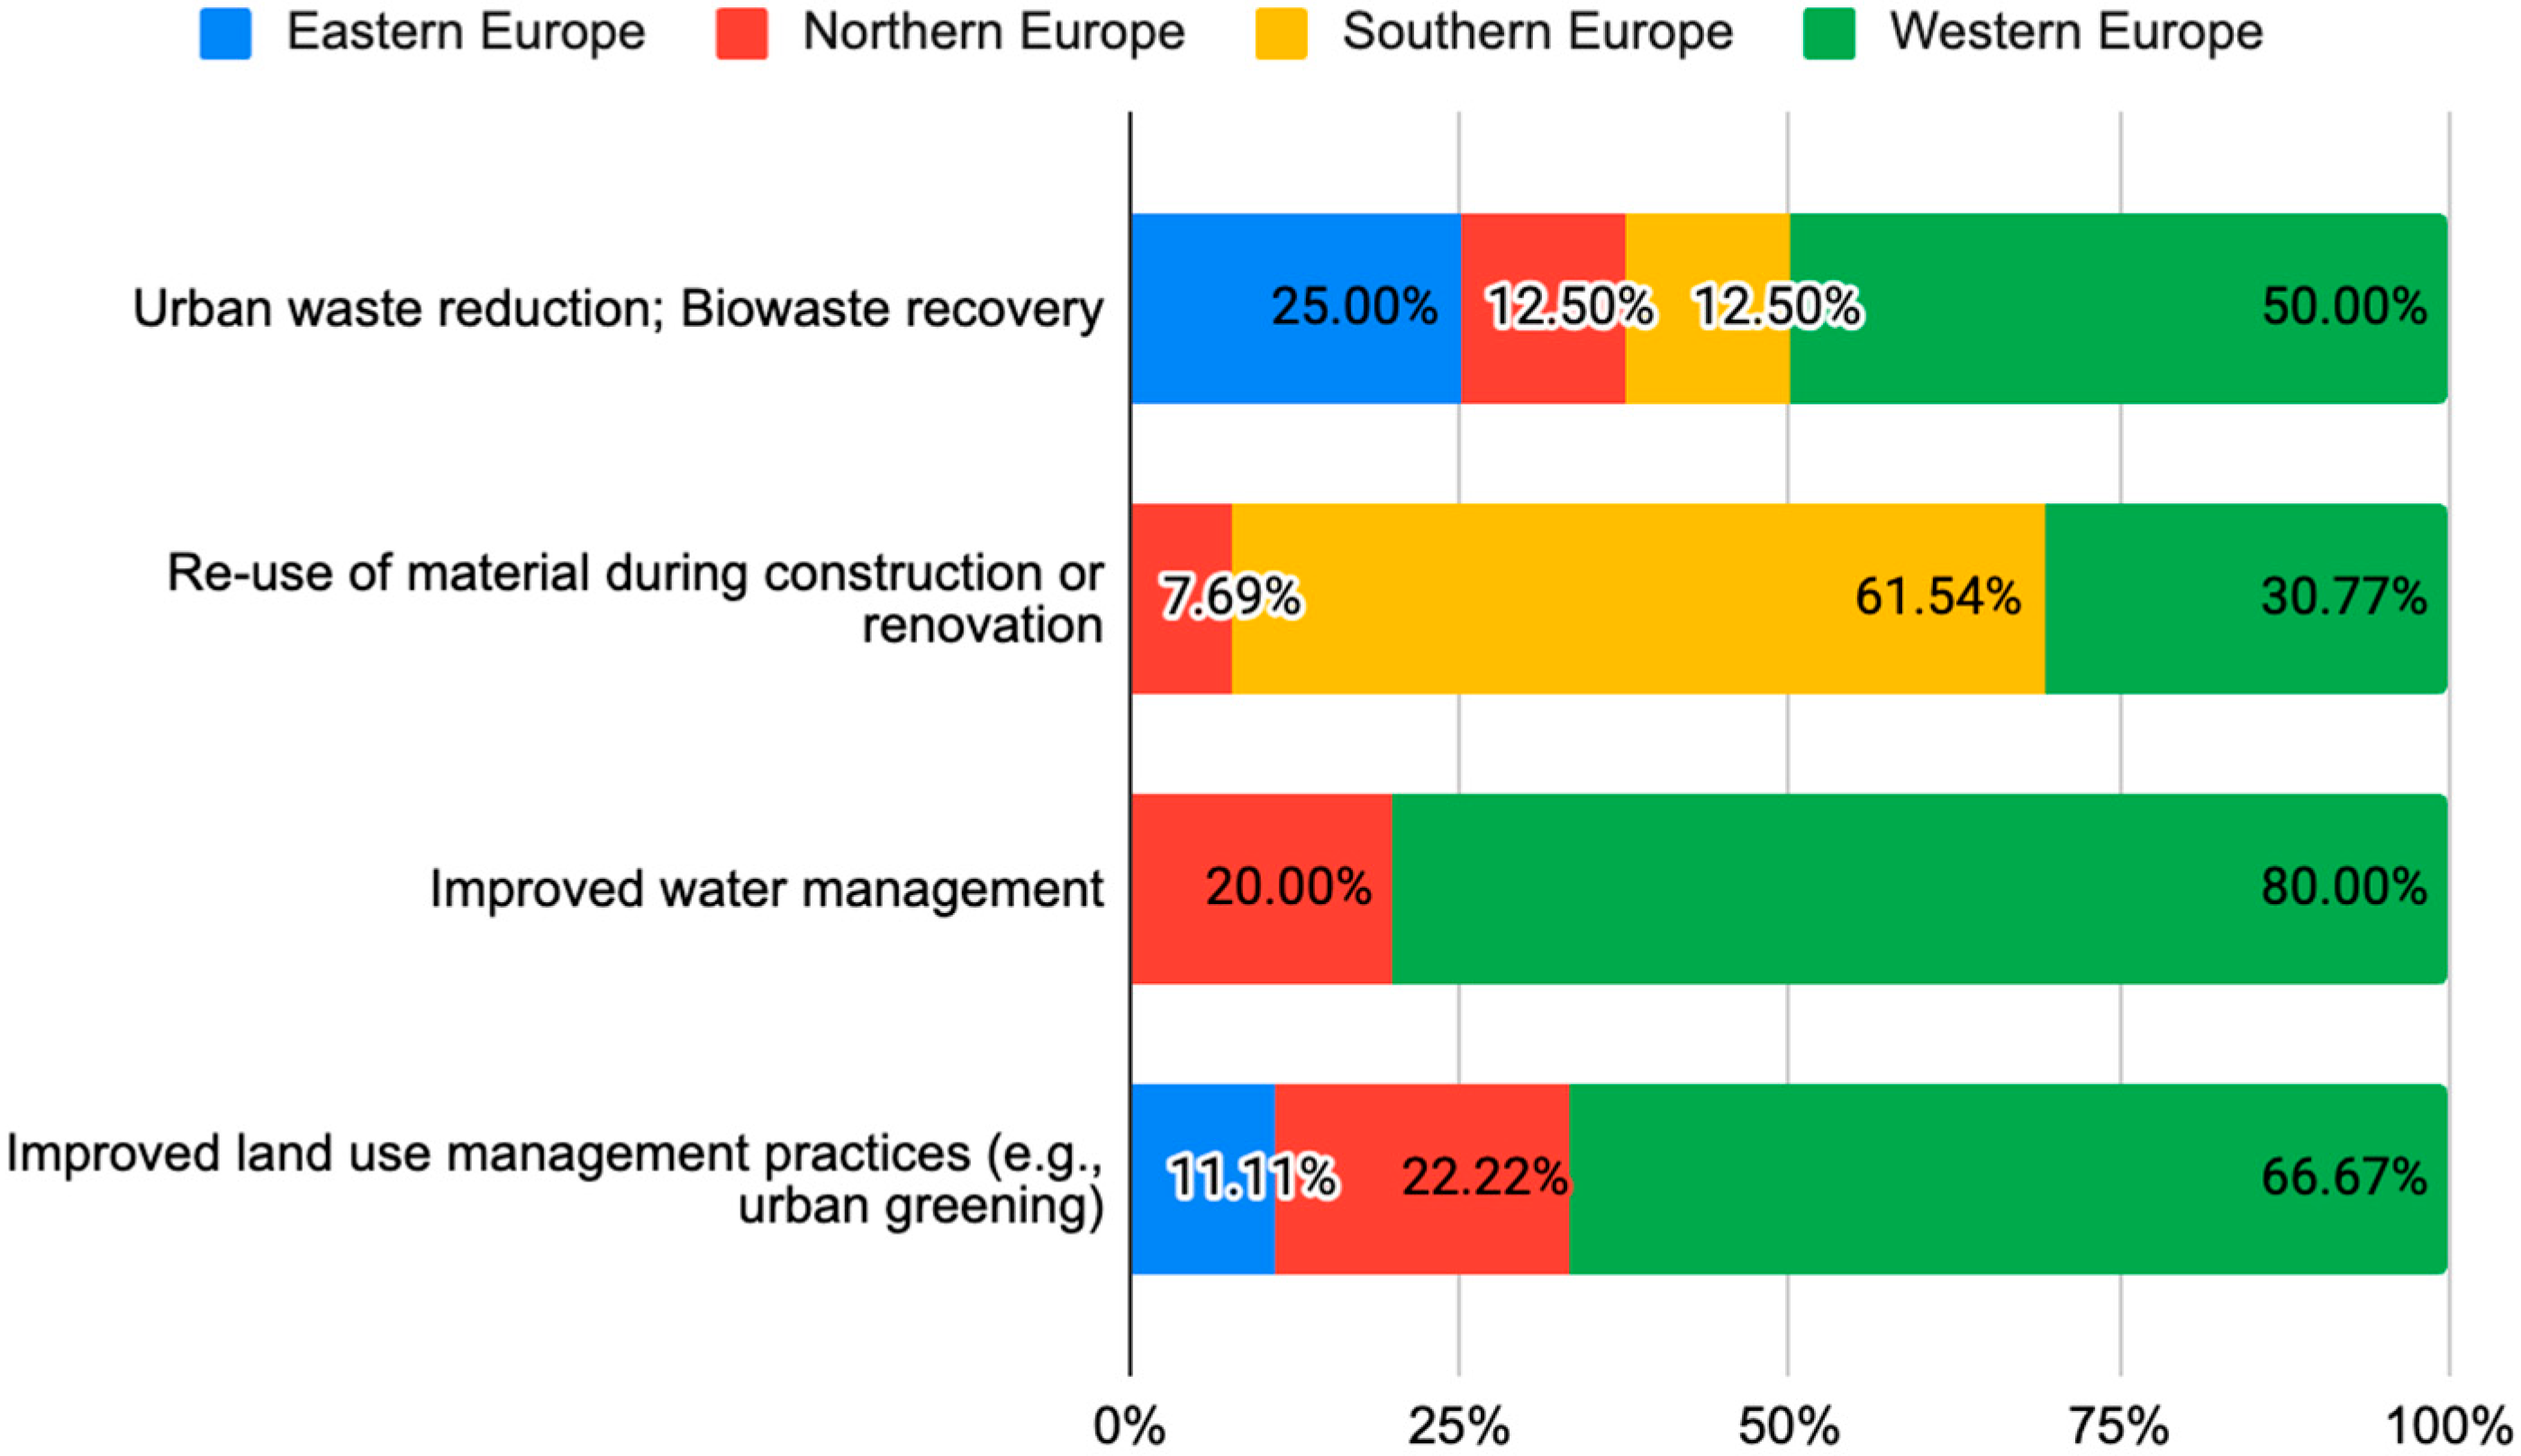
In the Resource Efficiency domain (Figure 6), Eastern Europe prioritises only Urban waste reduction; Biowaste recovery (25.00%). Northern Europe adopts a balanced approach across waste reduction, re-use, water and land use management. Southern Europe concentrates heavily on Re-use of material during construction or renovation (61.54%), showing minimal engagement with other indicators. Western Europe demonstrates the strongest and most comprehensive performance, with high proportions across Urban waste reduction; Biowaste recovery (50.00%), Improved water management (80.00%), and Improved land use management practices (66.67%).
Figure 6.
Regional distribution of the Resource Efficiency impact domain.
Finally, biodiversity remains the least selected domain overall. Eastern Europe records 0% across all biodiversity indicators. Northern Europe engages moderately with Change in the number of species of birds in built-up areas (accounting for two selections) and Percentage of tree canopy within the city (one selection). Southern and Western Europe show a similar degree of commitment to Structural connectivity of green spaces, alongside moderate tree canopy and species indicators (one selection each).
Overall, the analysis reveals distinct regional patterns, which may signal potential differences in contextual conditions, policies and planning strategies: acknowledging the boundaries of the analysis of this study, it is possible to observe selective focus of Eastern Europe cities, on capacity, participation and air quality; emphasis on noise reduction, scientific outreach and innovation readiness in Northern Europe cities; strong engagement with social inclusion, quality of life, climate investments and materials re-use in Southern Europe cities; and a broad, high-intensity approach spanning well-being, digitalisation, replication, resource efficiency and biodiversity in Western Europe cities. Even though these patterns do not reflect the actual strategic planning of the sample cities, as explored more in detail in Section 4.2, the finding of regional patterns indicates a potential correlation between European geographical areas and climate transition strategies.
3.3. Most Prevalent NEB Values and Ambition Levels Selected by European Cities, in Relation with the NetZeroCities Indicators
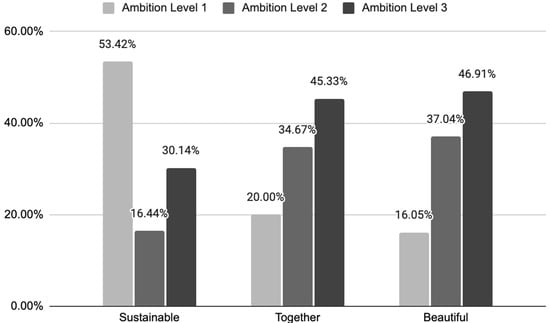
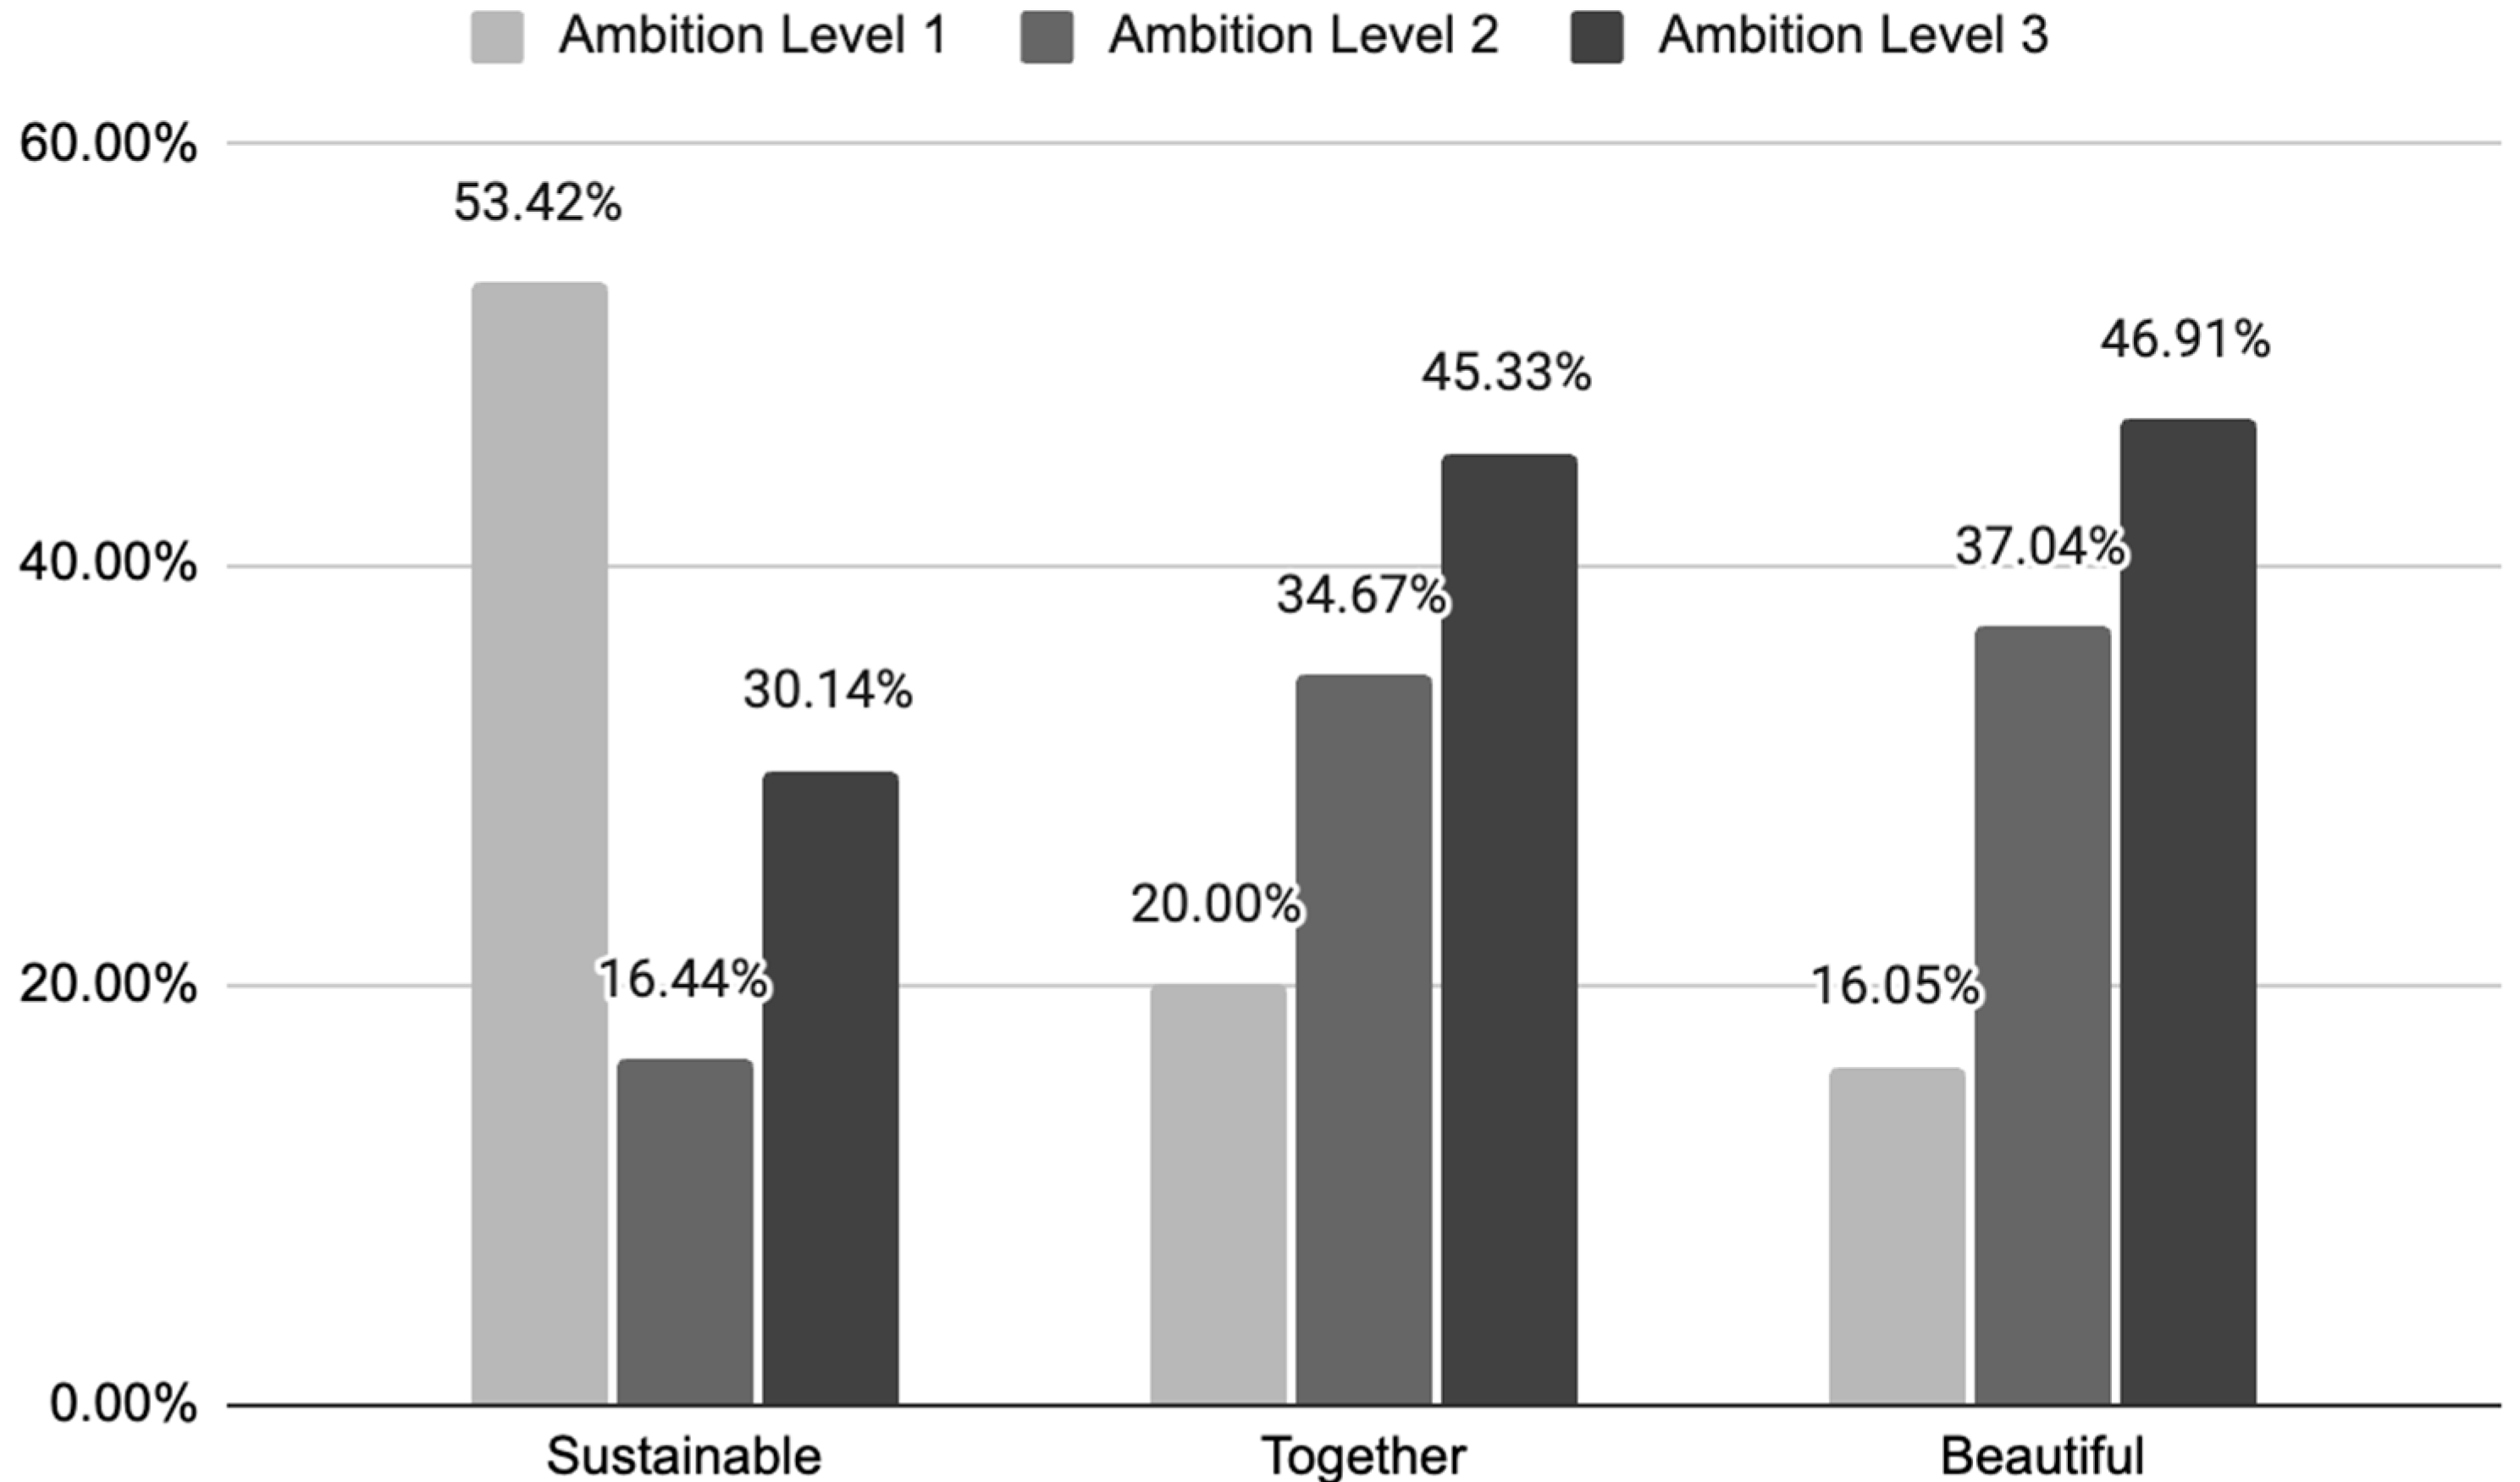
The alignment of the 24 NetZeroCities standardised non-GHG indicators (belonging to five impact domains) with the NEB Compass ambition levels shows how the NetZeroCities indicators framework used by cities to monitor their climate pilot projects relates to all three NEB values: Sustainable, Together and Beautiful (Figure 7). It is found that the Sustainable value has the largest share of indicators at Ambition Level 1 (53.42%), reflecting actions aligned with the Compass’s first level of sustainability requirement, such as resource efficiency and basic re-use. Only 16.44% fall under Level 2, while 30.14% reach Level 3, which corresponds to regenerative or nature-positive ambitions.
Figure 7.
Frequency of indicators per value and ambition levels.
In contrast, the Together value shows a much higher ambition profile, with only 20% at Level 1 and the majority at Level 2 (34.67%) and Level 3 (45.33%), indicating stronger emphasis on inclusive, socially cohesive and transformative community outcomes. The Beautiful value displays a similar pattern: just 16.05% of indicators are at Level 1, while 37.04% are at Level 2 and 46.91% at Level 3, reflecting a predominant alignment with higher ambition related to shared experiences, and long-term positive socio-cultural impact.
The distribution shows that Together and Beautiful values are more often associated with the intermediate (i.e., level 2) or high ambition level (i.e., level 3), while those linked with the Sustainable value of the NEB Compass remain more concentrated at the foundational level (i.e., level 1) for this standardised indicator framework used by the cities. With this understanding, the next sections show the distribution of NEB values and ambition levels across Europe, based on the indicator selections made by the 53 cities considered in this study.
3.4. Differences Across European Regions Based on NEB Values and Ambition Levels
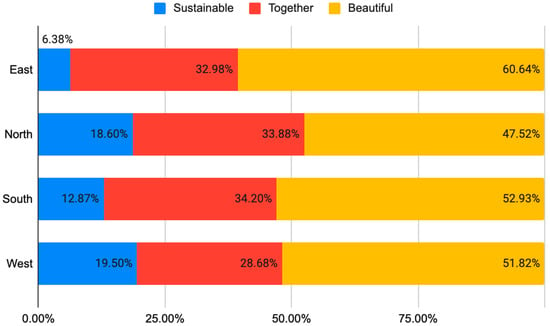
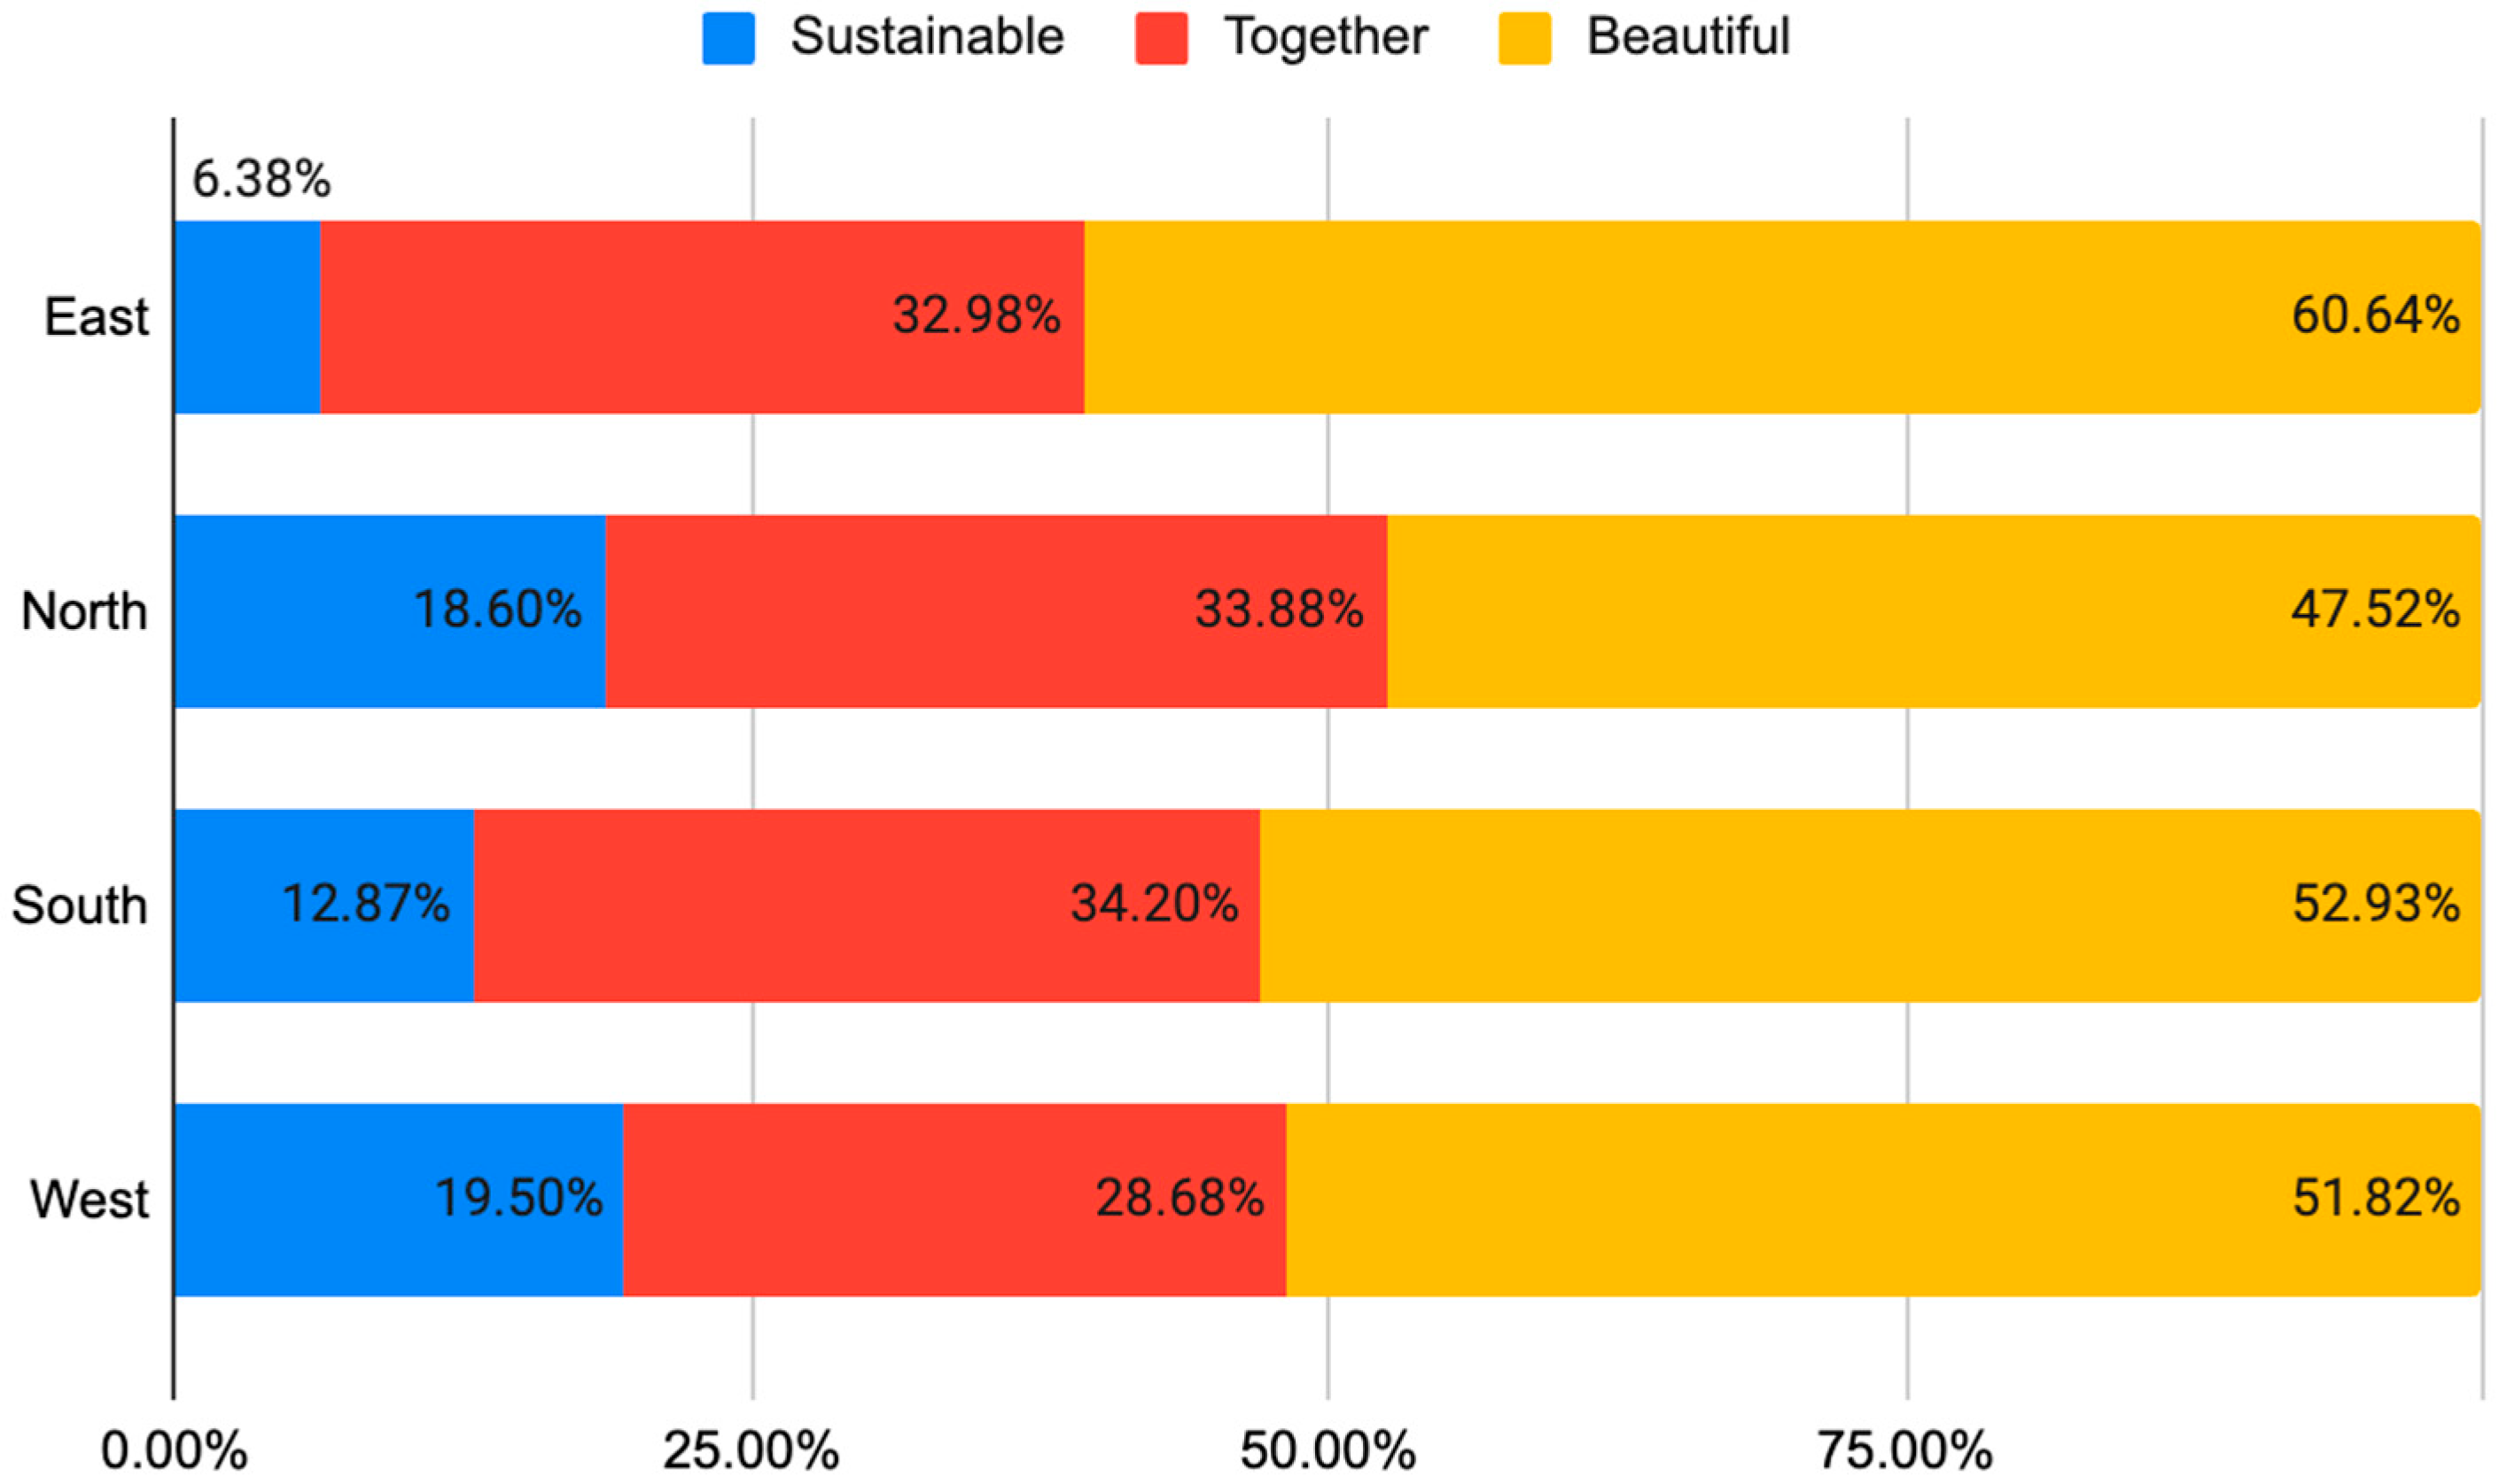
A weighted score was calculated for every value (Sustainable, Together, Beautiful) in each region by multiplying the number of city selections by the corresponding ambition level (1–3) and summing over all indicators (Appendix A). This means that a high score reflects both frequent selection and higher NEB ambition. Results are summarised in Figure 8.
Figure 8.
Distribution of NEB values across European regions.
Based on the coding of weighted scores (Appendix A), across all regions, the Beautiful value is most selected. It represents 60.64% of all indicator selections in Eastern Europe, 47.52% in Northern Europe, 52.93% in Southern Europe and 51.82% in Western Europe. In Eastern Europe, almost half of the Beautiful score comes from Improvement in skills and awareness (coded Beautiful Level 3), complemented by Improved citizen participation and Number of participative activities implemented per stakeholder group (Levels 2–3). In Southern and Western Europe, and some parts of Northern Europe, Beautiful value scores are also strongly driven by Level 3 ambition-related indicators such as Improvement in skills and awareness, Number of participative activities implemented per stakeholder group, Number of follow-up projects or districts, and Improved acceptance of digital solutions, all coded mainly at Beautiful Level 3.
The Together value has relatively similar shares: 32.98% in Eastern Europe, 33.88% in Northern Europe, 34.20% in Southern Europe and 28.68% in Western Europe. Here, high scores largely arise from indicators coded at Together Ambition Level 3, such as Improved citizen participation, Affordability of housing and energy, especially in Southern Europe, Improved acceptance of digital solutions (Western Europe) and Number of participative activities implemented per stakeholder group (Southern and Western Europe). For example, Improved citizen participation alone accounts for around 39% of the Together score in Southern Europe, while Eastern Europe’s Together profile is led by Improved citizen participation and participative activity indicators. Northern and Western Europe combine these Level 3 indicators with a set of Level 2 indicators, such as Scientific publications and social campaigns and Newly created sustainable jobs and Number of solutions suggested for implementation in local strategies, so their Together value scores are composed of both Level 2 and 3 ambitions. This shows a strong orientation in all whole sample of cities towards inclusive and participatory transformation, going beyond the minimum NEB requirements for access and affordability.
By comparison, the Sustainable value contributes a smaller share of the regional scores: 6.38% in Eastern Europe, 18.60% in Northern Europe, 12.87% in Southern Europe and 19.50% in Western Europe. In Eastern Europe, the Sustainable score is contributed by Level 1 indicators such as Improved air quality, with relatively limited contributions from higher-ambition Sustainable indicators. In the other regions, however, a significant part of the Sustainable score comes from indicators coded at Sustainable Level 3, including Improved investments in climate change action, Re-use of material during construction or renovation, Improved water management and Improved land use management practices (e.g., urban greening). Western Europe, in particular, attains the highest Sustainable share, reflecting substantial selections for Number of follow-up projects or districts, Improved land use management practices and Improved water management, all at the highest Sustainable ambition level.
It should be noted that this result can be due to the choice of analysing in this study only non-GHG-related indicators, while the sustainable value for what it relates to GHG emissions reduction is covered at 100% by all cities, as GHG reduction is a requirement for the proposed projects to be funded.
In summary, the scores show a consistent pattern: Beautiful and Together account for the majority of NEB-related ambition indicators selected by cities in every European region, and are largely expressed at higher ambition levels (2–3), while Sustainable is less prominent for the considered non-GHG indicators and is unevenly distributed, with higher environmental ambition concentrated mainly in Northern and especially Western Europe.
3.5. Most Prevalent SDGs Selected by European Cities
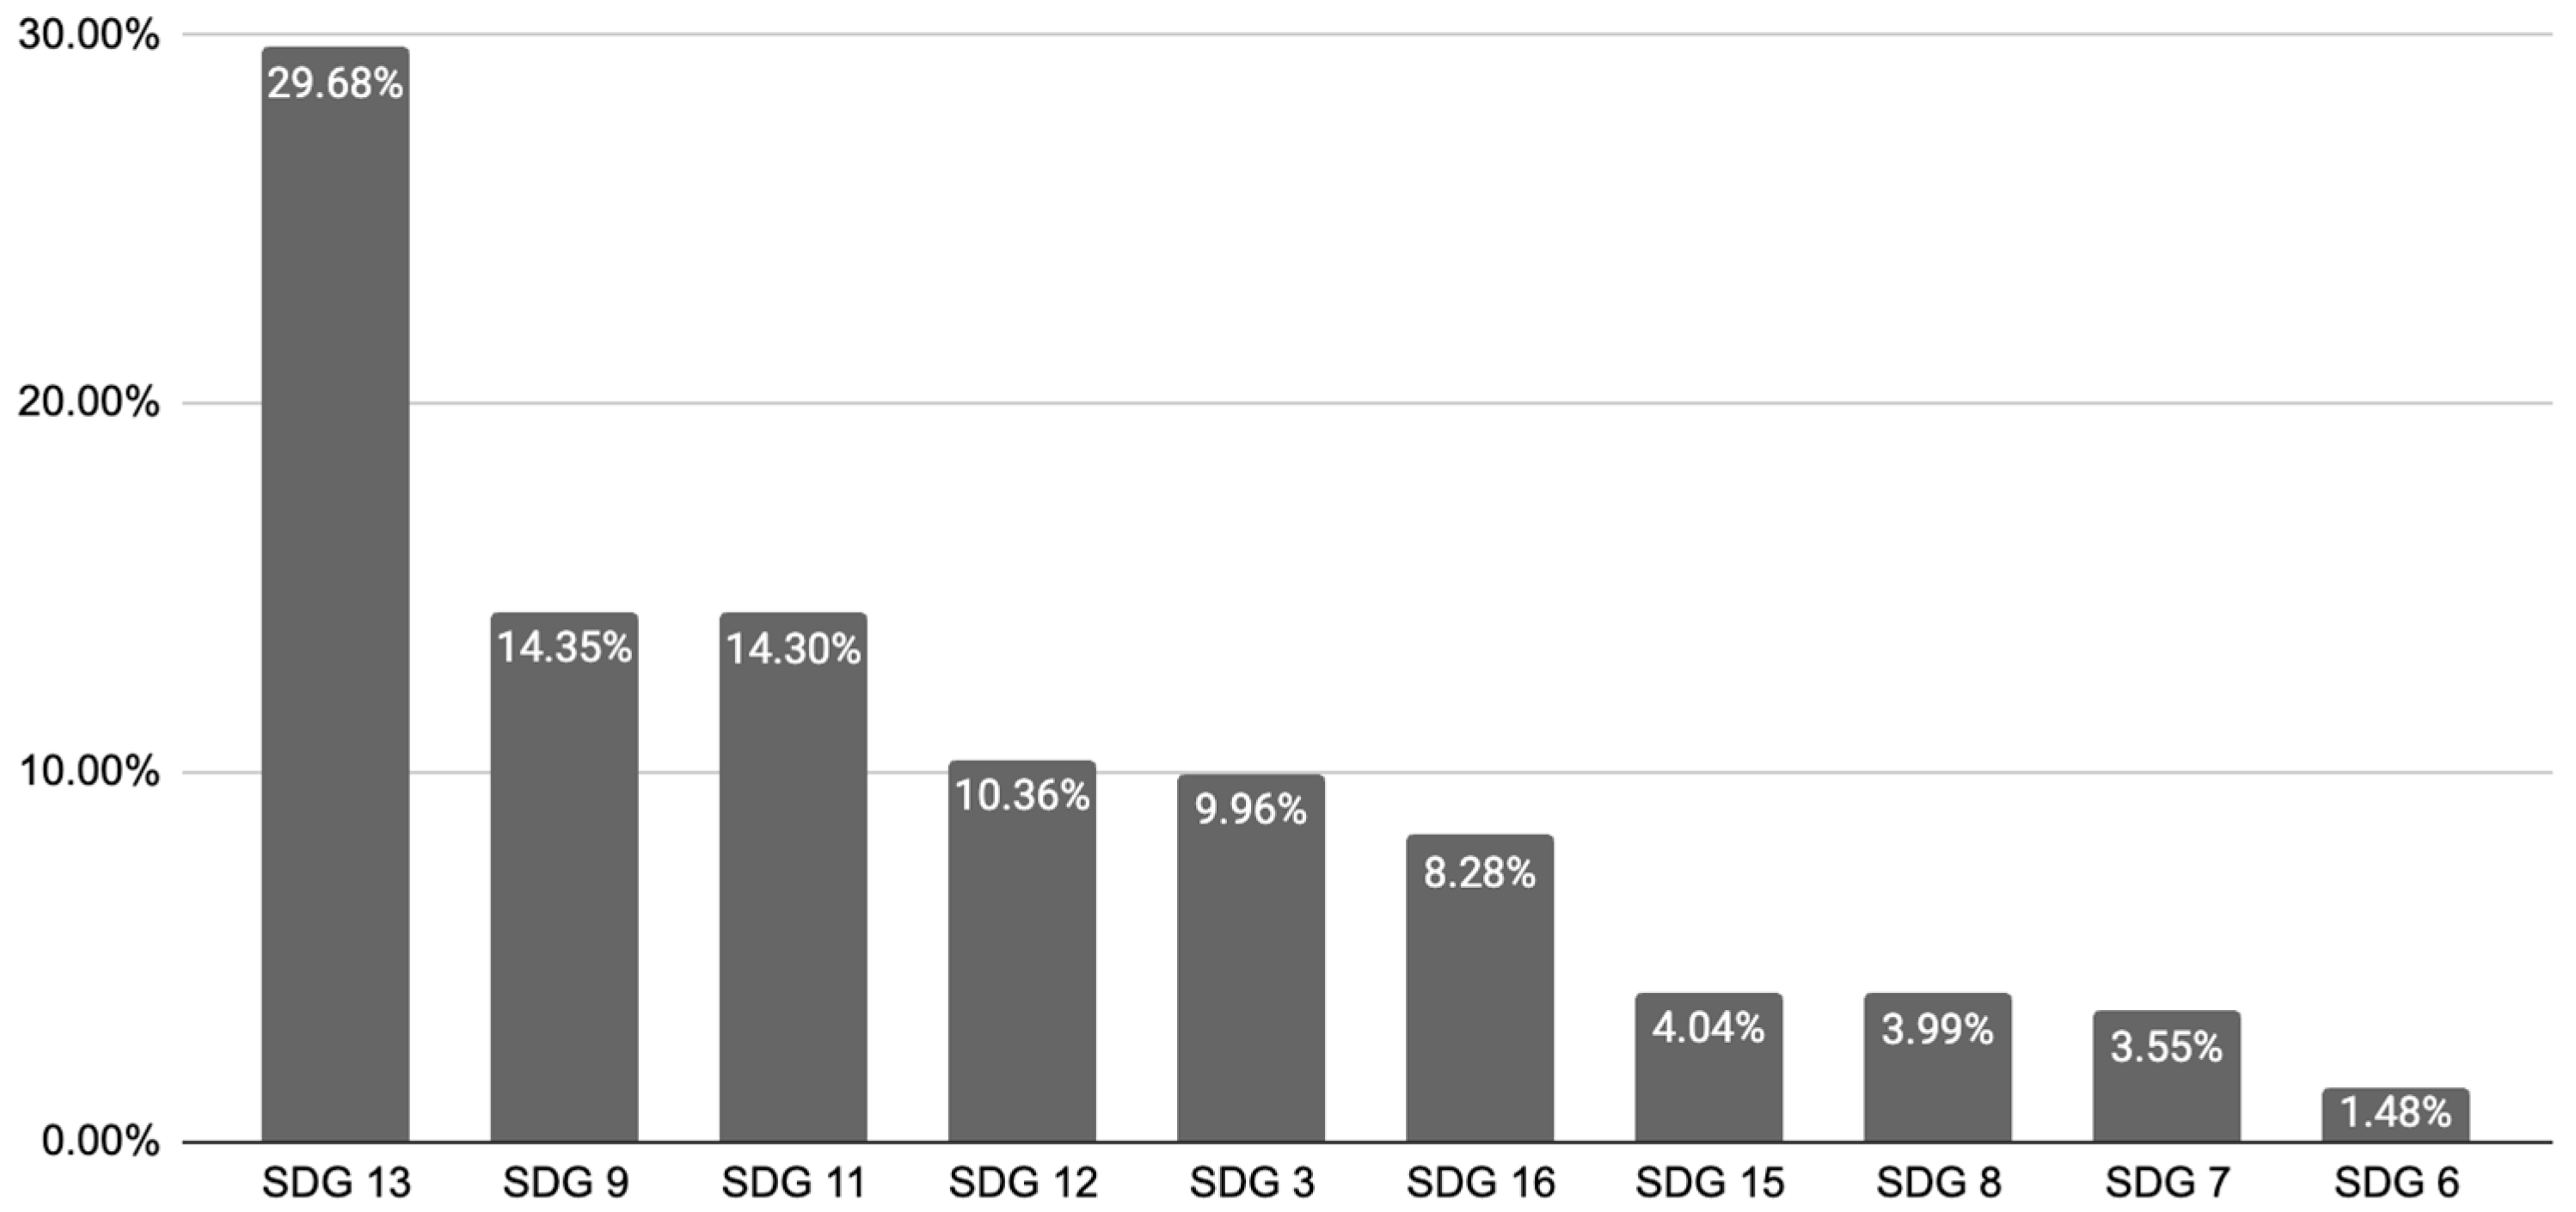
The analysis of indicators coded according to SDGs builds on a previous study [25] and expands the latter by showing how SDGs can be utilised in alignment with NEB values. Figure 9 shows the results of the analysis concerning SDG coding and computation of cities’ indicators.
Figure 9.
Percentage of each SDG resulting from the analysis of cities’ indicators selection.
The most evident result is a relative balance between, on the one hand, SDGs focused on material elements of the climate transition, such as SDG 13 (Climate Action), SDG 9 (Industry, Innovation and Infrastructure), SDG 15 (Life on Land), SDG 7 (Affordable and Clean Energy), and SDG 6 (Clean Water and Sanitation). On the other hand, SDGs focused on human health, well-being and behaviours gained a comparable level of prioritisation; namely SDG 11 (Sustainable Cities and Communities), SDG 12 (Responsible Consumption and Production), SDG 3 (Good Health and Well-being), and SDG 8 (Decent Work and Economic Growth). To the former SDGs could be added SDG 16 (Peace, Justice and Strong Institutions), as definitely related to human well-being, even from the perspective of governance.
Such results show how the prioritisation of climate actions planned by cities’ pilot projects, evaluated through the SDG lens, are aligned with the NEB results disclosed: the material sustainability priorities reach a total of 53.1%, and SDGs focused on human elements reach 46.9% of the total. Furthermore, the analysis of SDGs allows us to notice that a low level of indicators related to NEB value Sustainable, as reported in the previous section, does not entail a lack of prioritisation among sample cities of the material dimension of climate transition.
4. Discussions
While the previous section provided the analysis related to the five research questions of this study, this section summarises the results, which allows us to highlight most relevant new insights and still presents limitations and gaps in the study.
4.1. Insights and Inferences
The analysis of the indicators selected by 53 EU Mission Cities for their Pilot City Programme through the combined lens of SDG and NEB allows us to identify a consistent pattern in how the transition and planning to climate neutrality is being enacted in different European regions. Across all regions, in addition to GHG emissions, indicators selected by the cities included in this study strongly prioritise actions and related assessment associated with the impact domain of “Social inclusion, innovation, democracy and cultural impact”. In particular, of all the 24 indicators, the most highly selected indicators resulted in “Improvement in skills and awareness”, “Improved citizen participation” and “Number of follow-up projects or districts”. Framing the comparative analysis across European regions allows us to conclude that “Improvement in skills and awareness” is highly selected by all European regions, although less so by Northern European cities. The indicator of “Improved citizen participation” is very often selected by cities of all European regions, in particular cities from Southern Europe.
In terms of the impact domain of “Public Health and Environment”, results show that cities in Western Europe are more focused on assessing “Improved physical and mental well-being” while Southern Europe is more focused on “Perceived change in quality of life”. Indicators related to the impact domain of “Economy” are rarely selected by sample cities for assessing their pilot projects: about 5% of cities have selected the indicator “Improved investments in climate change action”, mostly in Southern Europe. Indicators related to the impact domain of “Resource efficiency” and “Biodiversity” have been selected by fewer than 3% of cities, thus not allowing for computing regional differences. Only the indicator of “Re-use of material during construction or renovation” is selected by 3.85% of sample cities.
Analysing indicators coded according to the NEB Compass, the comparative analysis shows that the value of Beautiful prevails in the NEB scores in sample cities across all European regions (60.64% in Eastern Europe, 47.52% in Northern Europe, 52.93% in Southern Europe, and 51.82% in Western Europe). This prevalence is signalled also by the frequent recurrence of high-ambition NEB Beautiful sub-domains at Ambition Level 3, such as with the indicators Improvement in skills and awareness, Improved acceptance of digital solutions, and Number of participative activities implemented per stakeholder group. These results seem to suggest that climate-neutral strategies of cities in the EU Cities Mission are leaning strongly toward the social and cultural dimensions of the transition. These latter elements are indeed key in the Mission-oriented innovation approach of the Mission Cities, where focus is on providing support and capacity building to cities for implementing bottom-up approaches such as social innovation, participatory practices and co-design [5]. The Together value ranges from 28.68% to 34.20% across European regions. Such a high score of the value Together further corroborates the hypothesis of a widespread focus among Mission Cities about social transformation and inclusion, particularly through the association of sub-domains at Ambition Level 3 with indicators such as Improved citizen participation, Affordability of housing and energy, and Number of participative activities implemented per stakeholder group. The Sustainable NEB value, in addition to being related to GHG emission reduction monitoring, is also found in non-GHG indicators ranging from 6.38% in Eastern Europe cities to 19.50% in Western Europe cities. Western and Northern Europe cities show substantial contributions from NEB-Ambition Level 3 in this thematic area, associated with indicators such as Improved investments in climate change action, Improved water management, Re-use of materials, and Improved land use management practices. In Eastern Europe cities, the indicators associated with the Sustainable value are dominated by Level 1 indicators such as air quality, whereas Southern Europe shows a mixed share of NEB Sustainable sub-domains.
Relating the NEB findings to the SDG analysis reveals thematic consistencies, corroborating the methodological hypothesis that both frameworks are aligned and suitable for standardised assessment. The SDGs that emerge as prevalent are SDG 11 “Sustainable Cities and Communities”, SDG 3 “Good Health and Well-being”, SDG 8 “Decent Work and Economic Growth”, and SDG 15 “Life on Land”. The prevalence of these SDGs closely mirrors the indicators selected most often by cities; however, the association with NEB values allows us to frame sample cities’ selections from a more detailed and multi-dimensional perspective. For example, SDG 11 (Sustainable Cities and Communities) is associated with high-ambition Together and Beautiful value indicators related to participation, skills, and digitalisation. SDG 3 (Good Health and Well-being) aligns with high-ambition NEB Beautiful sub-domains. SDG 8 (Decent Work and Economic Growth) links to NEB-aligned innovation, skills, and follow-up activity indicators. The association between SDG and NEB indicators thus allows us to strengthen the preliminary result of this study, which points out a prioritisation of cultural and social dimensions of climate transition among the sample cities from the EU Cities Mission.
4.2. Implications, Limitations, and Future Research
The results of this study suggest that systemic climate-neutral strategies of ambitious European cities in the Mission Cities are being articulated in a way that also prioritises social and cultural aspects of the transition, in addition to technical and infrastructural actions.
The alignment of indicators with NEB and SDGs and their comparative assessment is meant to further support the understanding of an important shift: the climate neutrality transition is increasingly being recognised not only as a technological and infrastructural challenge but as a social, cultural and organisational transformation. A systemic approach to the transition associates urban transformation with shifts in collective meanings and self-identity [27,28]. Such results are aligned with growing scholarly interest on the social change entailed by the systemic approach to the climate transition, which possibly also implies radical cultural shifts [29].
Yet, the present study has the following limitations that future research could address:
First, the analysis includes only the standardised NetZeroCities indicators and not the customised indicators proposed by the cities. This is because the customised indicators are unique to each individual city and therefore too extensive to be systematically coded and analysed in terms of frequency of selection. While such categorisation is beyond the scope of this study, it represents a valuable avenue for future research to extend the analysis to customised indicator selections in order to capture a more comprehensive and context-sensitive understanding of cities’ priorities and approaches.
Second, the selection of indicators by cities does not necessarily reflect the full scope or ambition of actions being implemented. Indicator choices may be influenced by cities’ reporting capacity, data availability, or the focus of the pilot project, rather than by the breadth or intensity of their actions. In addition, the standardised indicator set may omit certain categories of action that are locally significant but not formally recognised within the framework. Future research could address these limitations by triangulating indicator selections with input from other urban plans, city strategy documents, implementation reports, and qualitative data such as interviews with city officials, as well as by mapping reported indicators against actual actions, policy measures and investments. Such approaches would enable a more accurate assessment of cities’ substantive climate action and allow for a more robust tracing of their impacts across New European Bauhaus (NEB) values and dimensions, as well as the Sustainable Development Goals (SDGs), while also helping to identify systematic gaps between reported indicators and realised implementation.
Third, the type of data used and the methodology we carried out allow only for a comparative analysis. The results may thus highlight correlations between data, but further confirmation of the analysis presented would need the data on monitoring of planning implementation, which is not available at present.
Fourth, inter-coder reliability statistics were not applied in this study. Although these measures are widely used in deductive content analysis, the qualitative methods literature suggests that they may be of limited suitability for interpretive coding processes involving conceptually complex and context-dependent categories [30,31]. To enhance reliability and minimise individual interpretive bias, the study instead adopted investigator triangulation and a structured, consensus-based coding approach [32]. All indicators were coded independently by the three authors, followed by consensus-building discussions to reach a unanimous agreement on the final coded data set. This approach is therefore acknowledged as a methodological limitation, and future research could usefully complement consensus-based coding with formal inter-coder reliability statistics where appropriate.
Fifth, a limitation of this study lies in the nature of the quantitative analysis, which is restricted to frequency counts across the full sample and predefined European subregions. While this approach supports comparability, it does not capture patterns of similarity among cities, nor does it assess the influence of city-specific characteristics beyond regional grouping. Future research could build on this foundation by applying hierarchical cluster analysis or other unsupervised learning methods, to identify groups of cities with similar indicator selection profiles and to examine whether these clusters align with, or cut across, established European subregions. Integrating additional contextual variables, such as demographic, climatic, economic, and financial characteristics, would further enable an assessment of the relative importance of local conditions compared to regional affiliation in shaping indicator selection patterns, thereby providing a more nuanced understanding of variation in cities’ climate action priorities in terms of SDGs and NEB values.
Sixth, the analysis is based on the first cohort of 53 cities (out of 112) participating in the NetZeroCities Project, as pilot proposals were available only for these cities at the time of analysis. While this constrains the empirical scope of the dataset, the findings offer initial insights into emerging patterns in indicator selection among climate-ambitious cities. Future research can build on this baseline by extending the analysis as additional pilot proposals become available, thereby enabling an assessment of whether the observed patterns are specific to the early cohort or indicative of more generalisable trends across the wider programme. Specifically concerning comparison, the sample of cities is not homogeneous, since the number of cities varies between regions and multi-city pilots are included.
Acknowledging both the results and the constraints of the present study, future research could focus on the following three promising research directions: Firstly, it would be informative to examine the qualitative interpretations of NEB values made by cities. It would deepen the understanding of regional differences from a cultural perspective, inquiring into potential differences across EU regions in understanding the NEB value Beauty, and the cultural context of such understandings. Such research would, in turn, be consequential in understanding the interweaving of geographically different cultures with the transition planning process; this latter constitutes a research hypothesis that may build upon and bring forth the present study. Secondly, it would be informative to apply the methodology proposed here to a broader, standardised set of indicators that differentiate processes from outcomes (i.e., DIN SPEC 91637 [33]) aligning with SDGs and NEB values. Thirdly, future studies should explore longitudinal changes, testing which sub-domains acquire more prominence in implementation phases.
5. Conclusions
By analysing indicators utilised by 53 cities taking part in the NetZeroCities Pilot City Programme, and aligning them to NEB values and SDGs, this study suggests an EU-wide context of climate transition planning in which social and cultural transformation receives a high level of attention from urban planners.
Specifically, the study highlights that the most selected impact domain, accounting for 58% of indicators selected, is “Social Inclusion, Innovation, Democracy and Cultural Impact domain”. The indicators most frequently selected by cities are “Improvement in skills and awareness” and “Improved citizen participation”. These results, consistent across European regions, show that the cities in the sample gave consistent attention to increasing participatory and systemic approaches to the transition, as well as the need to improve skills and awareness of municipalities and stakeholders. This finding is aligned with the European Commission priorities defined in the EU Agenda for Cities [34] and further corroborates previous findings on cities’ transitions as learning journeys [35] and municipalities’ interest in collaboration and engagement for climate action [36]. In other words, the study allows us to preliminarily highlight that an effort to extend the climate transition to social and cultural change is most likely already taking place in many of the most ambitious EU cities piloting the transition.
In conclusion, the present study provides a first outline of a methodological approach for the evaluation of systemic urban actions with the alignment of the SDG and NEB frameworks that allows for a complementary and standardised assessment approach: It shows its applicability by analysing EU cities and European regional differences. This methodology contributes to providing means through which researchers and policymakers could further differentiate between European regional differences when addressing transition co-benefits.
Supplementary Materials
The following supporting information can be downloaded at: https://www.mdpi.com/article/10.3390/geographies6010016/s1. Table S1. Coding of Indicators with NEB Ambition Levels and dimensions.
Author Contributions
Conceptualisation, R.M., S.B. and F.R.; methodology, R.M.; software, R.M.; validation, R.M., S.B. and F.M.N.; formal analysis, R.M.; data curation, R.M.; writing—original draft preparation, R.M., F.M.N. and S.B.; writing—review and editing, R.M., F.M.N. and S.B.; visualisation, R.M.; supervision, S.B.; project administration, S.B. and F.R.; funding acquisition, F.R. All authors have read and agreed to the published version of the manuscript.
Funding
This research was funded by the European Commission, SGA-NZC grant number 101121530 and SGA2-NZC 101139652.
Data Availability Statement
Data are provided in the appendix and in the supplementary document. The documents from which data are coded are not publicly available and only accessible to project partners.
Acknowledgments
Authors are thankful to Nikhil Chaudhary for his guidance in the Pilot City Programme assessment.
Conflicts of Interest
The authors declare no conflicts of interest.
Abbreviations
The following abbreviations are used in this manuscript:
| NEB | New European Bauhaus |
| SDGs | Sustainable Development Goals |
| GHG | Greenhouse Gas |
Appendix A
| Indicator | Coded Indicator Ambition Levels | East | Weighted Score | North | Weighted Score | South | Weighted Score | West | Weighted Score | ||||||||||
| Sustainable | Together | Beautiful | Total | Sustainable | Together | Beautiful | Total | Sustainable | Together | Beautiful | Total | Sustainable | Together | Beautiful | Total | Sustainable | Together | Beautiful | |
| Improved air quality | 1 | 0 | 0 | 5 | 5 | 0 | 0 | 3 | 3 | 0 | 0 | 6 | 6 | 0 | 0 | 2 | 2 | 0 | 0 |
| Reduction in noise pollution | 1 | 0 | 0 | 0 | 0 | 0 | 0 | 1 | 1 | 0 | 0 | 1 | 1 | 0 | 0 | 0 | 0 | 0 | 0 |
| Improved physical and mental well-being | 1 | 0 | 0 | 0 | 0 | 0 | 0 | 1 | 1 | 0 | 0 | 2 | 2 | 0 | 0 | 13 | 13 | 0 | 0 |
| Perceived change in the quality of life | 0 | 3 | 3 | 1 | 0 | 3 | 3 | 1 | 0 | 3 | 3 | 10 | 0 | 30 | 30 | 3 | 0 | 9 | 9 |
| Improved citizen participation | 0 | 3 | 2 | 8 | 0 | 24 | 16 | 6 | 0 | 18 | 12 | 26 | 0 | 78 | 52 | 4 | 0 | 12 | 8 |
| Improvement in skills and awareness | 0 | 0 | 3 | 18 | 0 | 0 | 54 | 4 | 0 | 0 | 12 | 24 | 0 | 0 | 72 | 6 | 0 | 0 | 18 |
| Affordability of housing and energy | 0 | 3 | 2 | 2 | 0 | 6 | 4 | 1 | 0 | 3 | 2 | 7 | 0 | 21 | 14 | 2 | 0 | 6 | 4 |
| Improved acceptance of digital solutions | 0 | 3 | 3 | 2 | 0 | 6 | 6 | 1 | 0 | 3 | 3 | 4 | 0 | 12 | 12 | 10 | 0 | 30 | 30 |
| Number of participative activities implemented per stakeholder group | 0 | 3 | 3 | 3 | 0 | 9 | 9 | 1 | 0 | 3 | 3 | 8 | 0 | 24 | 24 | 5 | 0 | 15 | 15 |
| Scientific publications, social campaigns, etc. | 0 | 2 | 3 | 2 | 0 | 4 | 6 | 5 | 0 | 10 | 15 | 1 | 0 | 2 | 3 | 8 | 0 | 16 | 24 |
| Number of follow-up projects or districts | 1 | 0 | 3 | 0 | 0 | 0 | 0 | 3 | 3 | 0 | 9 | 13 | 13 | 0 | 39 | 22 | 22 | 0 | 66 |
| Improved investments in climate change action | 3 | 3 | 3 | 1 | 3 | 3 | 3 | 4 | 12 | 12 | 12 | 9 | 27 | 27 | 27 | 4 | 12 | 12 | 12 |
| Newly created sustainable jobs | 1 | 2 | 3 | 1 | 1 | 2 | 3 | 3 | 3 | 6 | 9 | 3 | 3 | 6 | 9 | 4 | 4 | 8 | 12 |
| Number of solutions suggested for implementation in local strategies | 0 | 2 | 1 | 1 | 0 | 2 | 1 | 5 | 0 | 10 | 5 | 1 | 0 | 2 | 1 | 4 | 0 | 8 | 4 |
| Creation of start-ups, accelerators or tech innovation | 1 | 2 | 3 | 0 | 0 | 0 | 0 | 0 | 0 | 0 | 0 | 1 | 1 | 2 | 3 | 1 | 1 | 2 | 3 |
| Savings in working time achieved | 0 | 3 | 3 | 0 | 0 | 0 | 0 | 1 | 0 | 3 | 3 | 1 | 0 | 3 | 3 | 1 | 0 | 3 | 3 |
| Revenues generated by the project | 2 | 0 | 3 | 0 | 0 | 0 | 0 | 2 | 4 | 0 | 6 | 1 | 2 | 0 | 3 | 1 | 2 | 0 | 3 |
| Urban waste reduction; Biowaste recovery | 0 | 0 | 3 | 2 | 0 | 0 | 6 | 1 | 0 | 0 | 3 | 1 | 0 | 0 | 3 | 4 | 0 | 0 | 12 |
| Re-use of material during construction or renovation | 2 | 0 | 3 | 0 | 0 | 0 | 0 | 1 | 2 | 0 | 3 | 8 | 16 | 0 | 24 | 4 | 8 | 0 | 12 |
| Improved water management | 3 | 2 | 3 | 0 | 0 | 0 | 0 | 1 | 3 | 2 | 3 | 0 | 0 | 0 | 0 | 4 | 12 | 8 | 12 |
| Improved land use management practices (e.g., urban greening) | 3 | 3 | 3 | 1 | 3 | 3 | 3 | 2 | 6 | 6 | 6 | 0 | 0 | 0 | 0 | 6 | 18 | 18 | 18 |
| Percentage of tree canopy within the city | 3 | 3 | 2 | 0 | 0 | 0 | 0 | 1 | 3 | 3 | 2 | 1 | 3 | 3 | 2 | 1 | 3 | 3 | 2 |
| Change in the number of species of birds in built-up areas | 2 | 0 | 2 | 0 | 0 | 0 | 0 | 2 | 4 | 0 | 4 | 1 | 2 | 0 | 2 | 1 | 2 | 0 | 2 |
| Structural connectivity of green spaces | 3 | 0 | 2 | 0 | 0 | 0 | 0 | 0 | 0 | 0 | 0 | 1 | 3 | 0 | 2 | 1 | 3 | 0 | 2 |
| 47 | 12 | 62 | 114 | 50 | 45 | 82 | 115 | 130 | 79 | 210 | 325 | 111 | 102 | 150 | 271 | ||||
References
- United Nations. World Cities Report 2024: Cities and Climate Action|UN-Habitat. Available online: https://unhabitat.org/world-cities-report-2024-cities-and-climate-action (accessed on 2 May 2025).
- Turnheim, B.; Kivimaa, P.; Berkhout, F. (Eds.) Innovating Climate Governance: Moving Beyond Experiments, 1st ed.; Cambridge University Press: Cambridge, UK, 2018. [Google Scholar] [CrossRef] [Scilit]
- Matsumoto, T.; Bohorquez, M.L. Building systemic climate resilience in cities. In OECD Regional Development Papers 56; OECD: Paris, France, 2023. [Google Scholar] [CrossRef] [Scilit]
- Mazzucato, M. Mission-oriented innovation policies: Challenges and opportunities. Ind. Corp. Change 2018, 27, 803–815. [Google Scholar] [CrossRef] [Scilit]
- Mazzucato, M. Governing Missions in the European Union—Research and Innovation. 2021. Available online: https://research-and-innovation.ec.europa.eu/knowledge-publications-tools-and-data/publications/all-publications/governing-missions-european-union_en (accessed on 14 November 2025).
- Bason, C.; Conway, R.; Hill, D.; Mazzucato, M. A New Bauhaus for a Green Deal. 2020. Available online: https://www.ucl.ac.uk/bartlett/public-purpose/sites/public-purpose/files/new_bauhaus_cb_rc_dh_mm.pdf (accessed on 24 January 2026).
- Ulpiani, G.; Vetters, N.; Thiel, C.; Florio, P. Cities towards zero emissions: A reality check on the assessment of co-benefits and trade-offs. Sustain. Cities Soc. 2025, 133, 106835. [Google Scholar] [CrossRef] [Scilit]
- United Nations. THE 17 GOALS|Sustainable Development. Available online: https://sdgs.un.org/goals (accessed on 4 December 2025).
- Joint Research Centre. New European Bauhaus: Beautiful, Sustainable, Together. Available online: https://new-european-bauhaus.europa.eu/index_en (accessed on 4 December 2025).
- European Commission. The European Green Deal. 2019. Available online: https://eur-lex.europa.eu/legal-content/EN/TXT/?uri=COM%3A2019%3A640%3AFIN (accessed on 20 November 2025).
- Rosado-García, M.J.; Kubus, R.; Argüelles-Bustillo, R.; García-García, M.J. A New European Bauhaus for a Culture of Transversality and Sustainability. Sustainability 2021, 13, 11844. [Google Scholar] [CrossRef] [Scilit]
- European Union. The New European Bauhaus Facility. Available online: https://new-european-bauhaus.europa.eu/funding/new-european-bauhaus-facility_en (accessed on 30 December 2025).
- Joint Research Centre and European Commission. A Practical Guide to the New European Bauhaus Self-Assessment Method and Tool; Publications Office: Luxembourg, 2024; Available online: https://data.europa.eu/doi/10.2760/9581060 (accessed on 2 December 2025).
- New European Bauhaus. The New European Bauhaus Compass. European Commission. 2022. Available online: https://new-european-bauhaus.europa.eu/document/download/405245f4-6859-4090-b145-1db88f91596d_en?filename=NEB_Compass_V_4.pdf (accessed on 24 January 2026).
- Ciampa, F.; Marchiano, G.; Girard, L.F.; Angrisano, M. The Rural Village Regeneration for the European Built Environment: From Good Practices Towards a Conceptual Model. Sustainability 2025, 17, 2787. [Google Scholar] [CrossRef] [Scilit]
- Deserti, A.; Puerari, E. (Eds.) Experimenting with the New European Bauhaus Values and Principles in Urban Transformation. In SpringerBriefs in Applied Sciences and Technology; Springer Nature: Cham, Switzerland, 2025. [Google Scholar] [CrossRef] [Scilit]
- Evaggelou, C.; Margaritis, N.; Grammelis, P. Regeneration of an Urban Area in Kozani Following the Methodology of New European Bauhaus. Sustainability 2025, 17, 10482. [Google Scholar] [CrossRef] [Scilit]
- Irvansyah, R.; Rossetto, T.; Idris, Y.; Nisa, N. Towards Sustainable Schools: Applying New European Bauhaus Principles in Banda Aceh’s Educational Infrastructure. In Proceedings of the E3S Web of Conferences; EDP Sciences: Les Ulis, France, 2025; Volume 651, p. 01009. [Google Scholar] [CrossRef] [Scilit]
- European Commission. Climate-Neutral and Smart Cities—Research and Innovation. Available online: https://tinyurl.com/ywdhd6pm (accessed on 14 November 2025).
- Chaudhary, N.; Hawkins, P.; Palavicino, C.A. NetZeroCities Theory of Change; Deliverable 2.14. NetZeroCities EU H2020 Grant Agreement n°101036519; European Union: Brussels, Belgium, 2022. [Google Scholar]
- Buzási, A.; Simoes, S.G.; Salvia, M.; Eckersley, P.; Geneletti, D.; Pietrapertosa, F.; Olazabal, M.; Wejs, A.; De Gregorio Hurtado, S.; Spyridaki , N.A.; et al. European patterns of local adaptation planning—A regional analysis. Reg. Environ. Change 2024, 24, 59. [Google Scholar] [CrossRef] [Scilit]
- Abram, S. Culture and Planning; Routledge: Oxfordshire, UK, 2016. [Google Scholar] [CrossRef] [Scilit]
- Eckersley, P. Cities and climate change: How historical legacies shape policy-making in English and German municipalities. Politics 2017, 37, 151–166. [Google Scholar] [CrossRef] [Scilit]
- Pilot Cities Programme Guidebook. Available online: https://netzerocities.app/ (accessed on 31 December 2025).
- Mondal, R.; Bresciani, S.; Rizzo, F. What Cities Want to Measure: Bottom-Up Selection of Indicators for Systemic Change toward Climate Neutrality Aligned with Sustainable Development Goals (SDGs) in 40 European Cities. Climate 2024, 12, 41. [Google Scholar] [CrossRef] [Scilit]
- Carter, N.; Bryant-Lukosius, D.; DiCenso, A.; Blythe, J.; Neville, A.J. The Use of Triangulation in Qualitative Research. Oncol. Nurs. Forum 2014, 41, 545–547. [Google Scholar] [CrossRef] [Scilit] [PubMed]
- Barrett, B.F.D.; Trencher, G.P.; Truong, N.; Ohta, H. How can cities achieve accelerated systemic decarbonization? Analysis of six frontrunner cities. Sustain. Cities Soc. 2024, 100, 105000. [Google Scholar] [CrossRef] [Scilit]
- Braun, K.; Könninger, S. From experiments to ecosystems? Reviewing public participation, scientific governance and the systemic turn. Public Underst. Sci. Bristol Engl. 2018, 27, 674–689. [Google Scholar] [CrossRef] [Scilit] [PubMed]
- Costanzo, E.; Alderuccio, D. Culture and heritage for a just transition to climate-neutral and smart cities. Text mining supporting New European Bauhaus elements detection. Front. Sustain. Energy Policy 2025, 4, 1613079. [Google Scholar] [CrossRef] [Scilit]
- Lincoln, Y.S.; Guba, E.G. Naturalistic Inquiry; Sage Publications: Beverly Hills, CA, USA, 1985. [Google Scholar]
- Saldaña, J. The Coding Manual for Qualitative Researchers, 3rd ed.; Sage Publications: London, UK, 2016. [Google Scholar]
- Denzin, N.K. The Research Act: A Theoretical Introduction to Sociological Methods, 2nd ed.; McGraw-Hill: New York, NY, USA, 1978. [Google Scholar]
- DIN SPEC 91637. Available online: https://www.dinmedia.de/en/technical-rule/din-spec-91637/393817040 (accessed on 24 January 2026).
- European Commission. EU Agenda for Cities 2025. 2025. Available online: https://ec.europa.eu/regional_policy/information-sources/publications/communications/2025/eu-agenda-for-cities-2025_en (accessed on 31 December 2025).
- Ulpiani, G.; Vetters, N.; Shtjefni, D.; Kozarev, V.; Dunlop, T.; Pereira, A.G. Do ambitious cities value collaboration in climate action? Insights from the first group of cities pursuing climate neutrality. Cities 2025, 162, 105945. [Google Scholar] [CrossRef] [Scilit]
- Ribeiro, V.; Proença, S.; Santos, L.; Gonçalves, J. Co-creation as a driver of geo-environmental learning approach to adapt cities to climate changes. Soils Rocks 2024, 47, e2024004823. [Google Scholar] [CrossRef] [Scilit]

Disclaimer/Publisher’s Note: The statements, opinions and data contained in all publications are solely those of the individual author(s) and contributor(s) and not of MDPI and/or the editor(s). MDPI and/or the editor(s) disclaim responsibility for any injury to people or property resulting from any ideas, methods, instructions or products referred to in the content. |
© 2026 by the authors. Licensee MDPI, Basel, Switzerland. This article is an open access article distributed under the terms and conditions of the Creative Commons Attribution (CC BY) license.