


Abstract
Background: Asymmetrical gait refers to an unequal weight-bearing and movement pattern between the two sides of the lower limbs, commonly seen in patients with stroke or cerebral palsy. There is little research exploring how to identify asymmetrical gait using neural network (NN) models. This study aimed to investigate whether NN models would detect asymmetrical gait using marker coordinates around the pelvis. Methods: Twenty healthy volunteers aged between 23 and 35 participated in the study and performed a simulated hemiplegic gait with one leg supported and the other leg straight and swinging laterally; they also walked as normal as a control gait. The four markers around the pelvis were collected via a motion capture system. The movements in the centre of the pelvis (CPL) were calculated as the ranges of motion in 3D space. An NN model was constructed to identify gait modes using CPL moving ranges. Results: The NN model identified gait modes quickly and efficiently with correction rates of approximately 99.56% and 97.61% for asymmetrical and normal gait modes, respectively. The area under the Relative Operating Characteristic curves was approximately 0.992. The movements in the sagittal plane were the most important features contributing to NN modelling. The ratio of the CPL’s moving area in the transverse plane to the product of stride length and step width was higher in the asymmetrical gait than in normal gait. Conclusions: This study showed that the NN models can identify gait modes using a few of the markers in the pelvis. The study highlights NN application in gait recognition and indicates that the NN models could be applied in motion analysis, especially gait analysis for people with asymmetrical conditions.
1. Introduction
In recent decades, asymmetrical gait analysis has received increasing attention. Asymmetrical gait, marked by unequal weight-bearing and movement between the two sides of the lower limbs, is a complex walking pattern [1]. It is commonly observed in patients with hemiplegia following a stroke or with cerebral palsy (CP) [2,3]. In fact, Seo et al. (2018) reported that 60–80% of patients with stroke develop asymmetrical gait [3]. This gait has been described in many ways, but its key features are widely recognized. For instance, Seo et al. (2020) noted differences between the unaffected and affected sides, where the affected side typically shows a longer stance phase, shorter swing phase, reduced hip and knee flexion, and increased ankle plantar flexion [4]. Trabassi et al. used Inertial Measurement Unit-based gait data and machine learning to classify people with Parkinson’s disease from speed-matched healthy subjects (HSs) [5]. Additionally, gait asymmetry can lead to decreased stability and a higher risk of falls [1,6].
Recent studies have explored several types of asymmetrical gait. For example, Ito and Capin et al. (2022) examined the impact of quadriceps neuromuscular deficits on gait asymmetry in patients after anterior cruciate ligament reconstruction [7]. Other research has revealed that quiet standing balance correlates significantly with asymmetrical gait patterns in post-stroke individuals, alongside the kinematic parameters of the paretic lower limb [8,9,10]. Di Nardo et al. (2019) used electromyography (EMG) and foot-floor contact analysis to study gait asymmetry in children with mild cerebral palsy, identifying significant differences in muscle activation between the affected and unaffected sides [11]. Studies have also investigated the factors influencing gait asymmetry, such as foot positioning during ambulation in individuals with hemiparesis post-stroke [12]. Other findings suggest that spasticity, reduced proprioception, and muscle weakness are linked to changes in walking speed, step length, and symmetry in time parameters like single and double support times between the feet [12,13,14]. A study used machine learning to check marker placement during gait [15]. Allen and Kesar (2019) observed that stroke survivors have impaired generalization of motor control across walking and balance, leading to reduced walking performance and more pronounced gait abnormalities [6].
As one of the AI applications, NNs have potential in gait analysis, specifically in the detection of gait classification, e.g., dementia, Parkinson’s disease, and stroke [16,17,18,19]. A study used a deep Convolutional Neural Network (CNN) composed of multiple layers for gait recognition [20]. Yu et al. employed Long Short-Term Memory (LSTM) models to deal with gait data using wearable sensors, enabling accurate classification of motor modes in patients with Parkinson’s [16]. Other studies integrated NNs with upper-extremity movement and cognitive reaction times to improve detection accuracy for people with dementia [21]. In addition, Lu and Tan used gait energy images (GEIs) for age estimation, achieving a mean absolute error (MAE) of only 4.28 years, indicating the possibility of deep learning in gait prediction [22,23]. Some studies reported that the frequency-domain gait signature based on micro-Doppler radar combined with the Transformer-like network structure can give reliable support for dementia diagnosis, and its detection accuracy is up to 94.93% in frequency-domain processing [24]. Recently, NN modelling has been used to identify gait modes for age groups, but there were too many variables involved [25].
Despite substantial research on the biomechanics of asymmetrical gait, most studies focus on pathological conditions or obvious gait abnormalities. There is little research on identifying asymmetric gait using AI tools and reflective markers only. Also, there is a lack of research on the movements of the pelvis during asymmetric gait in comparison to normal gait. These gaps limit our understanding of how asymmetric gait affects the pelvis or the centre of mass.
This study aimed (1) to investigate whether neural network (NN) models could identify gait modes, e.g., asymmetrical, using a few markers around the pelvis, and (2) to investigate the movements of the pelvis during asymmetrical gait, in comparison to normal gait. This was an observational cross-sectional study. Healthy participants were recruited to perform a simulated hemiplegic/asymmetrical gait as well as a normal gait as a control line. This approach would provide valuable insights into the pelvis during different modes of gait. This study hypothesized that (1) an NN model would be able to identify the gait modes with a few markers around the pelvis and (2) the movements of the pelvis would be increased during asymmetric gait. The outcomes could provide a potential tool to identify asymmetric gait and then develop effective exercise plans for clinicians and researchers.
2. Materials and Methods
This study was conducted in the Movement Biomechanics Laboratory at the Institute of Motion Analysis and Research (IMAR), located at Ninewells Hospital and the Tayside Orthopaedics and Rehabilitation Technology (TORT) Centre, University of Dundee. Ethical approval for human experimentation was obtained from the School of Medicine and Life Sciences Research Ethics Committee (UOD-SMED-SLS-TPG-2023-23-117) and conformed to the Helsinki Declaration. Each participant signed a consent form before data collection commenced.
2.1. Participant Recruitment
The inclusion criteria were: (1) age between 18 and 40 years; (2) able to walk independently over the ground without assistive devices; (3) able to consent; (4) able to follow instructions. The exclusion criteria were as follows: (1) with recent severe lower limb or back injuries or in the post-surgery recovery period; (2) with severe lower limb or systemic diseases, neurological or musculoskeletal disorders, and chronic conditions that significantly affect gait (e.g., Parkinson’s disease, diabetes-related complications, peripheral neuropathy); and (3) pregnant woman. The recruitment was done on the university campus via posters and thus most participants were students.
The reason for using healthy participants was that (1) this was a master’s project spanning one year, a duration that does not allow researchers to obtain ethical approval for collecting data on patients; (2) this study was mainly used to test a new neural network (NN) model rather than to analyze patient gait biomechanically; (3) when the healthy participants simulated a hemiplegia gait, they gave different postures and walking patterns individually: a diversity of walking methods was needed for testing NN models.
2.2. Laboratory and Instrumentation
The laboratory has a length and width of 15 m and 9 m, respectively. The Vicon® motion capture system (Oxford Metrics plc, Yarnton, UK) used in this study consisted of 15 high-resolution optical infrared cameras and retro-reflective markers to capture motion data in three-dimensional space at a sampling speed of 200 Hz. The role of Vicon Nexus® was in collecting all marker data. Additionally, four AMTI force plates (600 mm × 400 mm; Advanced Mechanical Technology Inc., Watertown, MA, USA) were embedded on the floor to capture ground reaction forces at 1000 Hz to define foot contact and gait cycle.
2.3. Data Collection
Four reflective markers were attached to the pelvis at LASI, RASI, LPSI and RPSI, according to the Vicon Clinical Management System. The centre of the four markers was assumed as the centre of the pelvis (CPL). Though the CPL was considered the centre of mass [26,27], this study considered CPL as a critical position during gait.
Data were collected as follows: (1) Vicon markers were attached to key anatomical locations on the subject for a T-pose test; (2) the participant practiced a simulated hemiplegic gait by watching a video of a patient where the supporting leg walked as ‘normal’ and the other leg walked as straight as possible and swung laterally. Participants were required to walk either at their comfortable gait in daily life or at a simulated hemiplegia gait at least 3 times for each mode of gait. The order of performing each mode was randomly decided by the researcher. If the participant did not walk well, e.g., the foot missed the force platforms or the markers were missed by the cameras, they were required to repeat the walking trials until 3 good trials were obtained.
2.4. Data Analysis
Marker labelling was processed using Vicon Nexus®. Three gait cycle events, i.e., foot strike, foot off and foot strike again, were manually defined according to force platform information. Participant measurements, e.g., body mass, height and leg length, were collected.
CPL was considered the critical position during walking [14,15,16]. Using this position, the ranges of motion (RoMs) in the CPL were calculated in the defined gait cycle. The calculated values included (1) the maximum RoMs in the anterior–posterior (X), medial–lateral (Y) and vertical (Z) directions; (2) the moving area of the CPL in the transverse plane, i.e., the product of maximum X and Y RoMs; and (3) the moving volume of CPL in 3D space, i.e., the product of X, Y and Z RoMs: the higher the latter two values, the larger the range of motion in the CPL during gait. Therefore, the analysis of the CPL could provide useful information on gait modes. Considering that previous studies used the moving area of the body and the area of the supporting area of the foot on the ground to analyze walking stability [28,29], this study defined stability as an index of the ratio of the moving area to the supporting area, which was defined as the product of stride length and step width. The proposed coefficient was abbreviated as IRMS and was as follows:
where the moving area is the product of the maximum ranges of CPL in the anterior–posterior and medial–lateral directions in a gait cycle.
All calculations were performed via an in-house programme in MATLAB® v25.
Finally, each participant had 3 gait trials in normal walking, 3 gait trials for the left side as asymmetrical walking, and 3 for the right side. Using each side of a gait cycle as a trial, 120 normal trials and 240 abnormal trials were available in statistical analysis and NN modelling.
2.5. Neural Network Modelling
NN modelling was conducted using SPSS® version 31 (SPSS® Inc., Chicago, IL, USA) and the multilayer perceptron (MLP) was employed to classify gait into normal or asymmetrical modes. In SPSS, the menu path was Analysis to Neural Network to Multilayer Perceptron. Group (i.e., gait mode) was set as the dependent variable, with the other variables, including RoMs in X, Y, and Z, moving base, and volume, as covariates.
After data collection, 120 normal trials and 240 abnormal trials were available in NN modelling, i.e., 360 trials available. It should be noted that every trial was a “side-specific observation”.
Two kinds of NN models were tested: (1) in the primary model, the trials in 70% of subjects, i.e., 14, and 30% of subjects, i.e., 6, were randomly used for training and testing; (2) in the second model, all trials were randomly used at approximately 70% for training and 30% for testing, respectively.
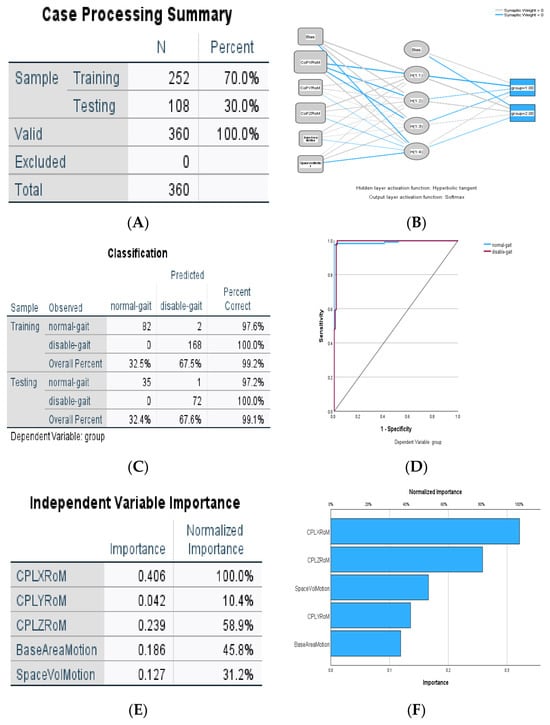
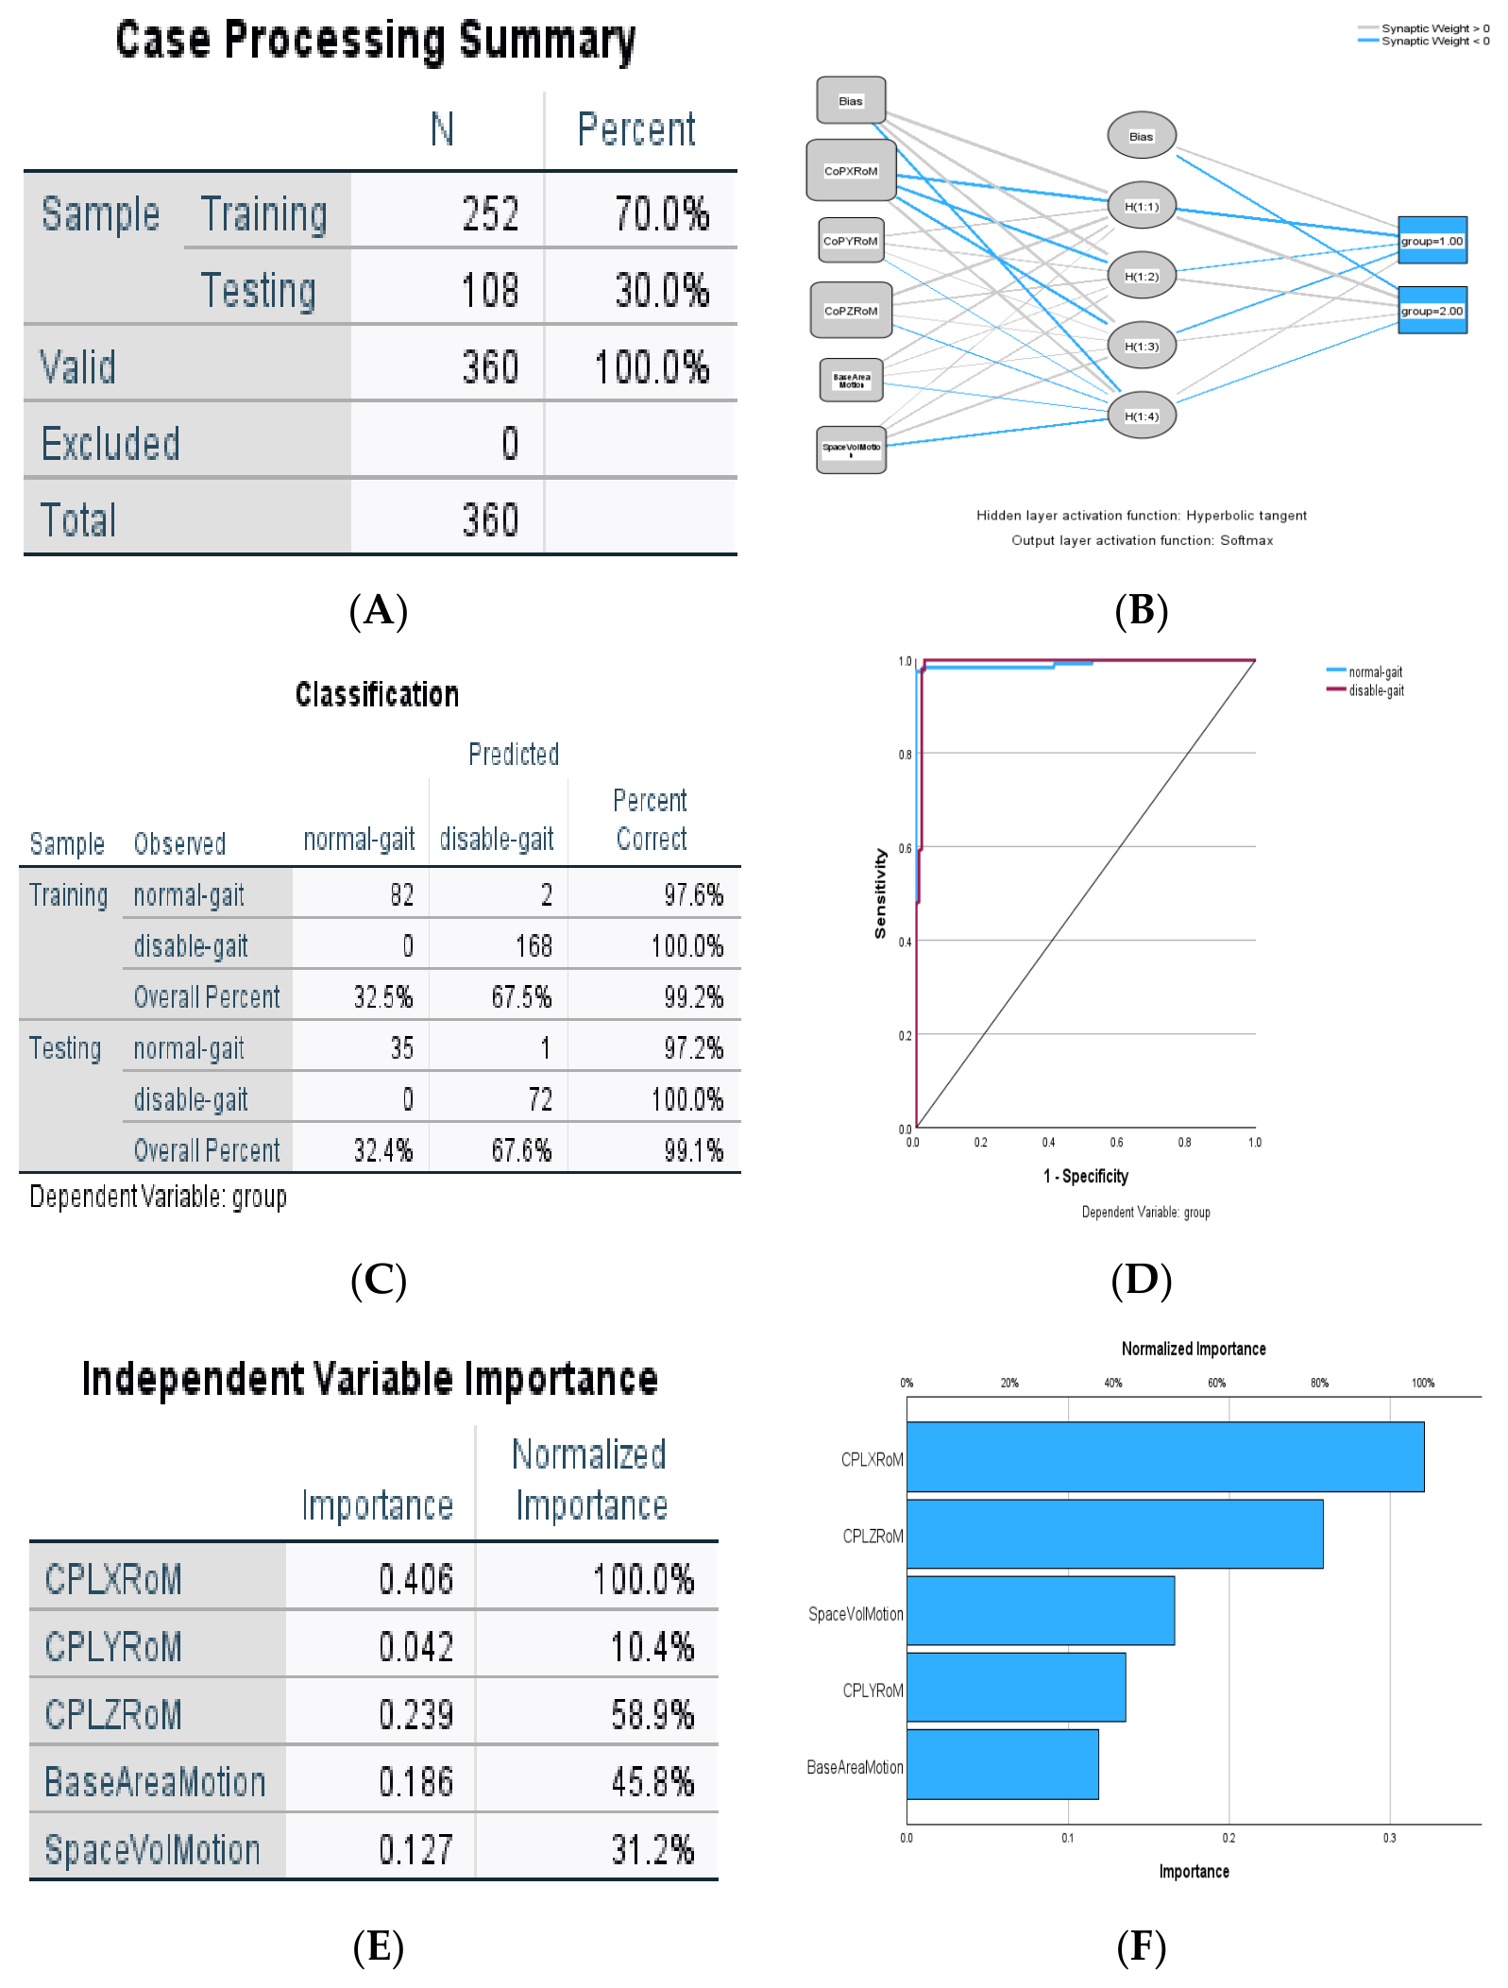
For the primary modelling, there were 10 models constructed, each of which had 14 random subjects for training and other 6 for testing. For each model, using a MATLAB-specific function, 14 and 6 numbers (i.e., 70% and 30% of 20 participants) were randomly produced from 1 to 20, and these numbers were not repeated. The balance for male and female in training and testing was not considered. Then, SPSS partitioned the 14 and 6 allocated participants for training and testing, respectively. No subjects or trials were leaked and the gait trials used in training and testing were not repeated. As a typical example in Figure 1A, 252 trials in training and 108 in testing were selected. Of the 252 trials, the normal trial had 84 and the abnormal trial had 168 in training; of the 108 trials, the normal trial had 36 and the abnormal trial had 72 in testing as in Figure 1C.
Figure 1.
Neural network modelling procedure for a typical primary model. Notes: (A) Summary: what are the percentages of gait trials used in training and testing? (B) Modelling structure: input layer including variables or features, hidden layer with NN units, and output layer for two modes of gait. (C) Classification: the correct and incorrect rates in training and testing. (D) ROC: Relative Operating Characteristic curve/area: the higher, the better. (E) Importance and contributions from different features to the NN model. (F) Importance analysis: the higher it is, the greater the contribution to the model. Disable-gait is asymmetrical gait or abnormal gait.
During MLP modelling, Automatic Architecture was selected, i.e., the minimum and maximum numbers of units in the hidden layer were 1 and 50. Other numbers of units like 2 and 40 were tested, but the outcomes were similar [25]. The type of training was batch. The optimization algorithm was scaled conjugate gradient. User-missing data was excluded. The maximum training time was 15 min. The maximum number of training epochs was automatically set by the computer. The maximum relative change in training error and ratio was 0.0001.
For the second modelling, SPSS randomly partitioned approximately 70% and 30% of 360 trials for training and testing an NN model. The other setting used the same parameters as in primary modelling.
In output, the Relative Operating Characteristic (ROC) curve and Importance analysis were added. Independent-variable importance analysis is the calculation of independent variable importance with increasing time consumption in both the number of predictors and the number of cases. Importance Analysis tells us how much each input/predictor variable contributes to the model’s ability to predict the outcome. The MLP structure consisted of three main components: an input layer for the CPL’s variables, one or more hidden layers comprising latent processing nodes, and an output layer corresponding to the classification labels. The output was categorized into two groups: normal and abnormal (i.e., asymmetrical) gait (Figure 1B).
2.6. Validation of NN Modelling
Modelling was assessed using the correction rates of classifications in the training and testing stages as in Figure 1C, i.e., the higher the correction rate percentage, the better, with 100% meaning full accuracy.
To further evaluate the correction rates, this study used key performance metrics as introduced in the previous study [25,30].
Recall (Sensitivity): The rate of correct to incorrect identified by the model. It was defined as
where true positive (TP) means the correctly identified cases for a group, and false negative (FN) means the cases for that group that were misclassified. The recall values were calculated using the output; e.g., in Figure 1C, TP and FN are 82 and 2; thus, the recall for NG was 97.6% and that for was AG 100%.
Precision: The rate of positive identifications that were correct, defined as
where FP (False Positive) means the cases that were negative but incorrectly predicted as positive; e.g., in Figure 1C, the TP for NG was 82 and its FP was 0. Thus, the precision for NG is 82/(82 + 0).
F1 score is defined as follows using the recall and precision:
A higher F1 score (closer to 1) means a stronger classification performance, especially in situations where precision and recall have significant values.
2.7. Statistical Analysis
SPSS (v28) was used. The means and standard deviations (SDs) or standard errors of the mean (SR) were calculated and reported. Two modes of gait were compared using the Repeated Measures method, based on the general linear model in SPSS, which is suitable for analysis of within-subject factors. Gender was included as a fixed factor, while BMI and age were incorporated as covariate factors. The parameters being compared were set as dependent variables. As the comparison of gait modes was carried out for the within-subject factor as the main factor and the BMI and age of participants were input as between-subject factors, it is unnecessary to normalize parameters further. This method has been widely used in previous studies [25,31]. Normal distribution was checked using the S-K test, and the non-parametric test was used when necessary. This approach allowed for the examination of biomechanical differences across the two gait modes and the presentation of means according to the selected factors [32]. The adjustment option was Bonferroni. A significance level of p < 0.05 was adopted.
3. Results
3.1. Demography
A total of 20 healthy participants, 10 males and 10 females, were recruited. The average age of the participants was 27.1 years, with a range from 23 to 35 years. The mean body mass index (BMI) was 22.61 (SD 3.77), ranging from 18 to 32; the mean body mass was 64.03 kg, ranging from 46.4 to 107.6 kg; and the average height was 167.4 cm (SD 7.72), ranging from 154.0 to 184.3 cm.
3.2. Spatiotemporal Parameters
The spatiotemporal parameters revealed significant differences between the normal gait (NG) and abnormal gait groups (AG). In Table 1, the cadence in NG averaged 109.56 steps/min on the right side, whereas AG showed significantly reduced cadence at 62 step/min. Walking speed in NG was much faster than that in AG. Stride length was significantly shorter in AG (0.87–0.88 m) compared to NG (1.28–1.29 m). Also, step width was wider in the AG group compared to the NG group. These results indicate the significant impact of asymmetrical gait on walking patterns, with reduced cadence, slower walking speed, and shorter stride length.
Table 1.
Spatiotemporal parameters for two modes of gait.
3.3. Analysis of CPL
The results showed significant differences between the two modes of gait as shown in Table 2. The moving areas of the CPL in the horizontal plane were significantly smaller in NG than in AG, and so were the moving volume of the CPL in 3D space. The moving area and volume of CPL in asymmetrical gait were roughly double that in normal gait, while the walking distances (X) in asymmetrical gait were approximately 60% that in normal gait, indicating that asymmetrical gait has a poor stability of body and a low efficiency during gait.
Table 2.
Comparison of CPL movements between two modes of gait.
3.4. NN Model Performance
As shown in Table 3, the primary NN models used 70% and 30% of subjects for training and testing, and the models for AG achieved an overall accuracy of 99.56% ranging between 98.6 and 100%, which is better than the NG of 97.61%, ranging between 91.71 and 100%. Some details of data are shown in Table S1 in Supplemental Materials.
Table 3.
Comparison of the correction rates (%) between the primary NN models using 70% and 30% of subjects for training and testing.
As shown in Table 4, the second NN models used approximately 70% and 30% of trials for training and testing, and the models for AG achieved an overall accuracy of 99.51%, ranging between 97.3 and 100%, which is better than the NG of 97.7%, ranging between 90.6 and 100%.
Table 4.
Comparison of the correction rates (%) between the second NN models using 70% and 30% of trials for training and testing.
All models reached an area under the Relative Operating Characteristic curve (ROC) of approximately 0.992. This meant that NN models are able to identify abnormal gait accurately. When comparing the models in terms of gait, the correction rates in AG were slightly higher than in NG.
This study compared the performances of NN models between different stages and gait modes, as shown in Table 5 and Table 6. As a whole, all models showed quite high rates for Recall, Precision and F1 in training and testing stages. Interestingly, AG patterns produced slightly higher Recall and F1 than NG did. This initial result should be explored further for unknown reasons.
Table 5.
Comparison of F1 scores and other parameters for the primary NN models between gait modes.
Table 6.
Comparison of F1 scores and other parameters for the second NN models between NG and AG.
3.5. Analysis of Feature Importance
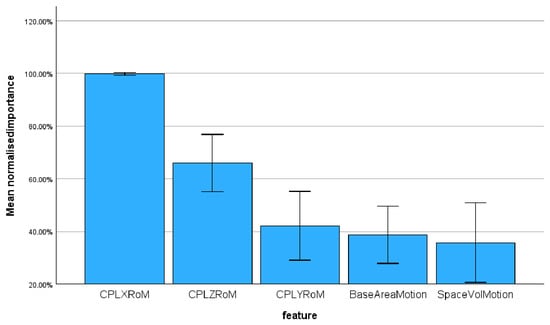
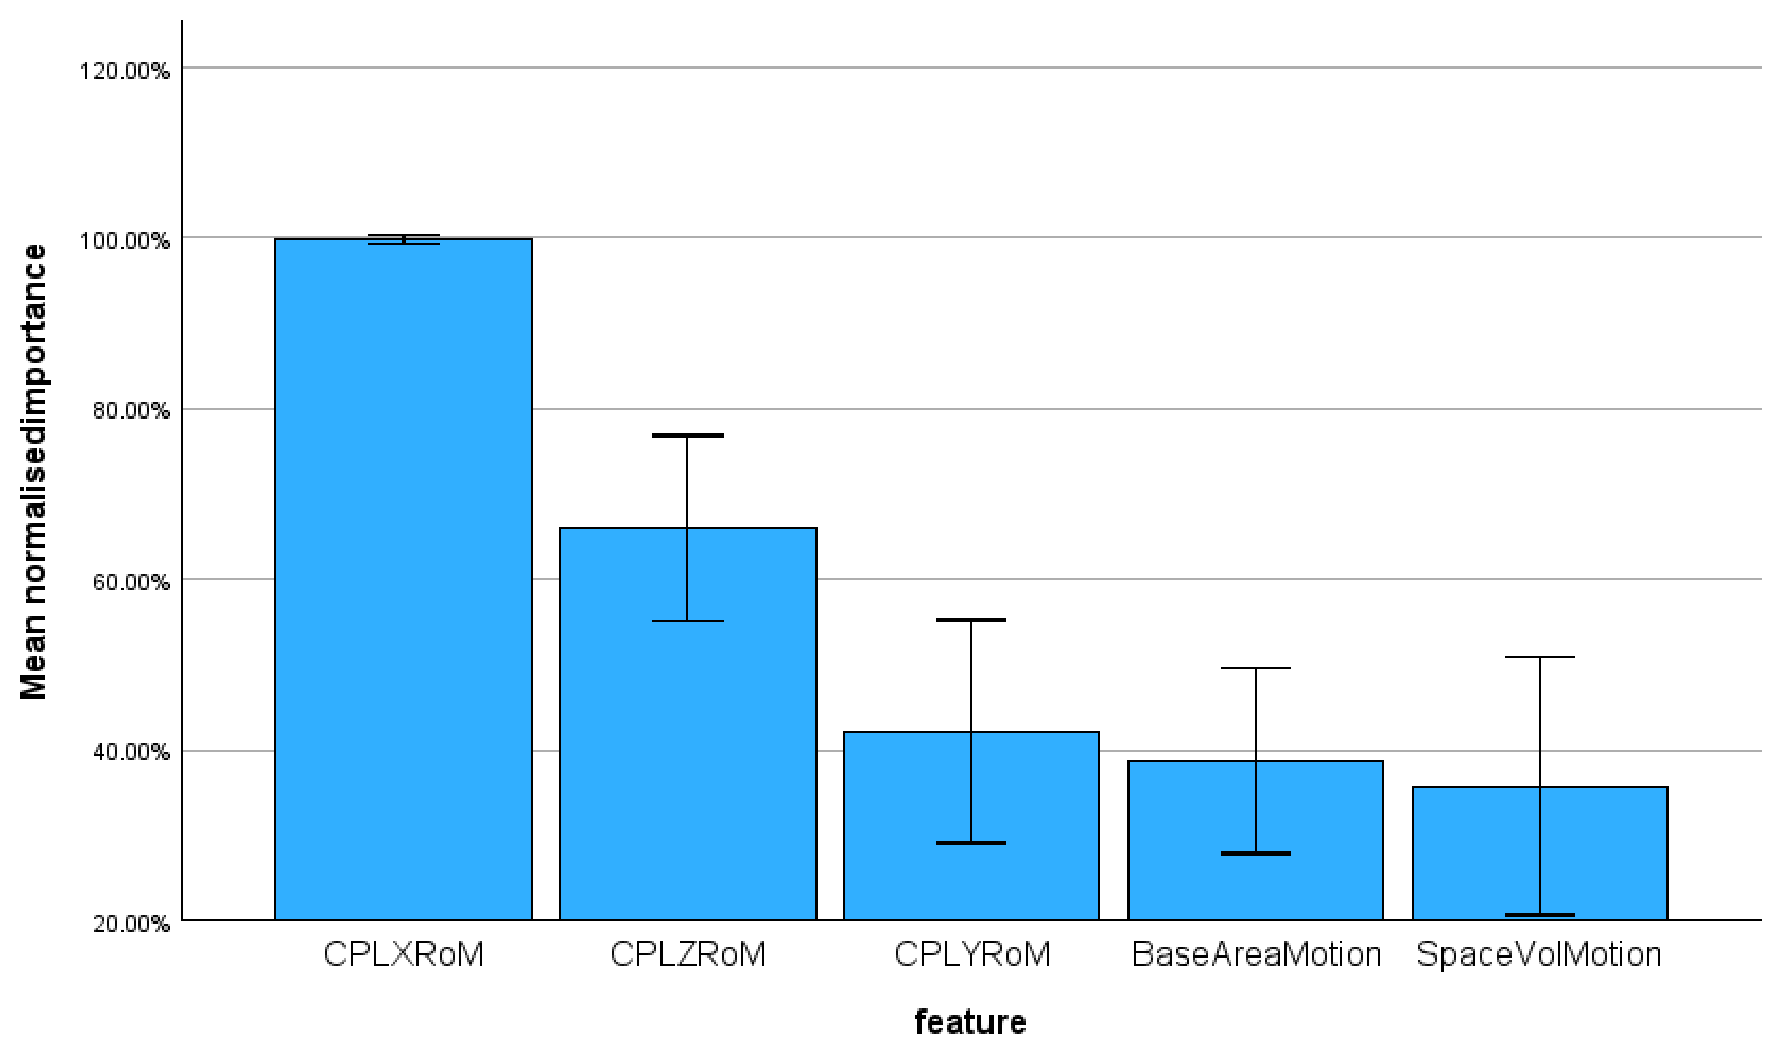
As shown in Figure 2, the importance analysis showed that the order of contributions to the NN modelling from highest to lowest was RoM X (97%), RoM Z (73%), moving area (44%), RoM Y (43%), and moving volume (24%). The normalized importances were significantly different among the features (p < 0.001 using ANOVA).
Figure 2.
Importance analysis for the features in NN modelling. Note: the bar height is the mean and the error bar is ±2 SEM (the standard error of the mean).
4. Discussion
4.1. Highlights of the Findings
Testing NN models with four markers around the pelvis, this study showed that the NN models can identify different modes of gait with high correction rates (approximately 97–100%). The study also showed that the movements in the anterior–posterior and vertical directions would affect the centre of the pelvis relatively strongly compared to other directions. The moving area/base and volume of CPL in AG are 2 times that of that in NG.
4.2. Spatiotemporal Parameter
The results of this study demonstrate significant reductions in cadence, walking speed, and stride length in the AG group compared to the NG group. Specifically, the AG group exhibited markedly lower walking speeds, which is consistent with findings from Schmid-Zalaudek et al. [33], who reported similar decreases in walking speed and stride length in individuals with unilateral impairments when compared to healthy controls. Additionally, the increase in the step width observed in the AG group suggests a compensatory mechanism aimed at enhancing stability during asymmetric gait. This compensatory strategy may help maintain balance while walking, thereby potentially reducing the risk of falls.
Furthermore, the foot-off percentage was significantly elevated in the AG group, indicating a prolonged stance phase. This may reflect an increased burden on the normal side during asymmetric gait, which could further impact the coordination of that limb. These findings support previous studies that indicated that gait asymmetry can lead to decreased stability and increased fall risk [12,34].
4.3. Centre of Pelvis
Except in the anterior–posterior directions, all ranges of motion and moved area/base and volumes in AG were larger than those in NG during gait. The results showed that the simulated asymmetric gait has a larger RoM in the CPL than normal gait does. To the best of our knowledge, this study is the first to discover that the walking area and volume in normal gait are smaller than those in asymmetric gait. Further, IRMS in abnormal gait is significantly higher than in normal gait. The walking stability in asymmetrical walking should be confirmed by using traditional methods in the future.
4.4. NN Modelling
The NN models showed the potential to identify gait modes between AG and NG. All outcomes from NN modelling gave the application reliability, e.g., 99.56% and 97.61% correction rates for AG and NG. ROC areas reached approximately 0.992. To the best of our knowledge, this is the first study to use NN modelling with a few pelvic markers to identify the gait modes. This method might have potential applications in clinical practice, e.g., gait analysis for patients with stroke and cerebral palsy.
It should be noted that the NN models employed four markers around the pelvis only, while most NN models used many markers in the upper and lower limbs with a substantial number of joint parameters in the literature [25,34,35,36,37]. In gait analysis, researchers prefer to use a few biomarkers to identify pathological gait rather than a vast number of markers and variables. In clinical practice, clinicians often feel confused with many variables from gait parameters and kinematical and kinetic variables in multiple joints and planes. This study has explored a simple but effective way to identify gait modes.
4.5. Limitations
One limitation of this study is the use of healthy participants simulating asymmetric gait, which might not fully capture the complexities of true clinical populations, such as individuals with stroke or cerebral palsy.
Regarding NN modelling, the provided method could quickly identify whether walking is normal or abnormal but could not identify which side would be abnormal. Therefore, routine gait analysis is still recommended.
Another shortcoming is that the sample size was small and thus the number of gait trials used was small. Future research should consider larger sample sizes.
4.6. Motion Analysis Relevance
From this study, though the routine gait analysis found significant differences in gait parameters between two modes of gait, none of these parameters could directly be used to recognize a specific gait patten. Therefore, NN modelling is needed to identify the gait patterns directly.
This study provides a simple and effective way to identify abnormal gait. NN models could be used in motion analysis. For example, NN models could be used to test a mode of gait before and after treatment: if the gait mode falls to normal after treatment, it would indicate that the gait has improved; otherwise, new treatment or rehabilitation is still needed. Also, NN models could be potentially used in detecting a specific gait mode if the gait mode has a large database. As the NN models do not require many markers, nor heavy analysis of a vast number of biomechanical parameters, it would be easy to use in motion analysis, especially for the subjects who showed asymmetrical gait. The NN models could give an earlier warning for people with serious asymmetrical gait and clinicians could consider earlier intervention, including further gait analysis and initial treatment.
5. Conclusions
This study provides an NN model with a few markers in the pelvis to identify abnormal or normal modes of gait, and its correction rates were approximately 99.56% and 97.61% for abnormal and normal modes of gait, respectively. ROC reached approximately 0.992. This means that the NN models may have potential application in motion analysis where a gait mode with asymmetry would be identified without using gait parameters and joint kinematics. This study also analyzed the motion differences between normal and asymmetrical gait patterns in the pelvis and showed that the ratio of the moving area to the supporting area in the CPL was significantly higher during asymmetric gait than normal gait. These results emphasize the importance of NN modelling in motion analysis regarding movement changes.
Supplementary Materials
The following supporting information can be downloaded at https://www.mdpi.com/article/10.3390/biomechanics6040090/s1, Table S1: The results of the classifications from the ten primary models.
Author Contributions
Conceptualization: W.W. and K.F.; methodology: Y.Z., K.F. and W.W.; software: W.W.; formal analysis: K.F., Y.Z. and W.W.; data curation: K.F., Z.Y. and Y.G.; writing—original draft preparation: K.F. and Y.Z.; writing—review and editing: W.W.; supervision and project administration: W.W. All authors have read and agreed to the published version of the manuscript.
Funding
This research received no external funding.
Institutional Review Board Statement
The study was conducted in accordance with the Declaration of Helsinki and approved by the University of Dundee, School of Medicine and Life Sciences Research Ethics Committee (UOD-SMED-SLS-TPG-2023-23-117).
Informed Consent Statement
Informed consent was obtained from all subjects involved in the study.
Data Availability Statement
Data is unavailable due to privacy or ethical restrictions but can be obtained by sending a request to the corresponding author.
Acknowledgments
The authors are grateful to all the volunteers who participated in this study and to Sadiq Nasir and Alan Duncan for their help in data collection.
Conflicts of Interest
The authors declare no conflicts of interest.
References
- Hill, A.; Nantel, J. The effects of arm swing amplitude and lower-limb asymmetry on gait stability. PLoS ONE 2019, 14, e0218644. [Google Scholar] [CrossRef] [Scilit]
- Koller, W.; Baca, A.; Kainz, H. The gait pattern and not the femoral morphology is the main contributor to asymmetric hip joint loading. PLoS ONE 2023, 18, e0291789. [Google Scholar] [CrossRef] [Scilit]
- Seo, J.S.; Yang, H.S.; Jung, S.; Kang, C.S.; Jang, S.; Kim, D.H. Effect of reducing assistance during robot-assisted gait training on step length asymmetry in patients with hemiplegic stroke: A randomized controlled pilot trial. Medicine 2018, 97, e11792. [Google Scholar]
- Seo, J.W.; Kim, S.G.; Kim, J.I.; Ku, B.; Kim, K.; Lee, S.; Kim, J.U. Principal Characteristics of Affected and Unaffected Side Trunk Movement and Gait Event Parameters during Hemiplegic Stroke Gait with IMU Sensor. Sensors 2020, 20, 7338. [Google Scholar] [CrossRef] [Scilit]
- Trabassi, D.; Serrao, M.; Varrecchia, T.; Ranavolo, A.; Coppola, G.; De Icco, R.; Tassorelli, C.; Castiglia, S.F. Machine Learning Approach to Support the Detection of Parkinson’s Disease in IMU-Based Gait Analysis. Sensors 2022, 22, 3700. [Google Scholar] [CrossRef] [Scilit]
- Allen, J.L.; Kesar, T.M.; Ting, L.H. Motor module generalization across balance and walking is impaired after stroke. J. Neurophysiol. 2019, 122, 277–289. [Google Scholar] [CrossRef] [Scilit]
- Ito, N.; Capin, J.J.; Khandha, A.; Buchanan, T.S.; Snyder-Mackler, L. Identifying Gait Pathology after ACL Reconstruction Using Temporal Characteristics of Kinetics and Electromyography. Med. Sci. Sports Exerc. 2022, 54, 923–930. [Google Scholar] [CrossRef] [Scilit]
- Hendrickson, J.; Patterson, K.K.; Inness, E.L.; McIlroy, W.E.; Mansfield, A. Relationship between asymmetry of quiet standing balance control and walking post-stroke. Gait Posture 2014, 39, 177–181. [Google Scholar] [CrossRef] [Scilit]
- Nardone, A.; Godi, M.; Grasso, M.; Guglielmetti, S.; Schieppati, M. Stabilometry is a predictor of gait performance in chronic hemiparetic stroke patients. Gait Posture 2009, 30, 5–10. [Google Scholar] [CrossRef] [Scilit]
- Lewek, M.D.; Bradley, C.E.; Wutzke, C.J.; Zinder, S.M. The relationship between spatiotemporal gait asymmetry and balance in individuals with chronic stroke. J. Appl. Biomech. 2014, 30, 31–36. [Google Scholar] [CrossRef] [Scilit]
- Di Nardo, F.; Strazza, A.; Mengarelli, A.; Cardarelli, S.; Tigrini, A.; Verdini, F.; Nascimbeni, A.; Agostini, V.; Knaflitz, M.; Fioretti, S. EMG-Based Characterization of Walking Asymmetry in Children with Mild Hemiplegic Cerebral Palsy. Biosensors 2019, 9, 82. [Google Scholar] [CrossRef] [Scilit]
- Balasubramanian, C.K.; Neptune, R.R.; Kautz, S.A. Foot placement in a body reference frame during walking and its relationship to hemiparetic walking performance. Clin. Biomech. 2010, 25, 483–490. [Google Scholar] [CrossRef] [Scilit]
- Hsu, A.L.; Tang, P.F.; Jan, M.H. Analysis of impairments influencing gait velocity and asymmetry of hemiplegic patients after mild to moderate stroke. Arch. Phys. Med. Rehabil. 2003, 84, 1185–1193. [Google Scholar] [CrossRef] [Scilit]
- Lin, P.Y.; Yang, Y.R.; Cheng, S.J.; Wang, R.Y. The relation between ankle impairments and gait velocity and symmetry in people with stroke. Arch. Phys. Med. Rehabil. 2006, 87, 562–568. [Google Scholar] [CrossRef] [Scilit]
- Zhou, H.; Xu, D.; Ugbolue, U.C.; Zhou, Z.; Jie, T.; Yuan, Y.; Gu, Y. Optimizing knee biomechanical parameters during the stance phase of running using the DFIS system: A pilot study. Measurement 2026, 271, 120956. [Google Scholar] [CrossRef] [Scilit]
- Yu, J.; Park, S.; Ho, C.M.B.; Kwon, S.-H.; Cho, K.-H.; Lee, Y.S. AI-based stroke prediction system using body motion biosignals during walking. J. Supercomput. 2022, 78, 8867–8889. [Google Scholar] [CrossRef] [Scilit]
- Wang, W.; Hsu, Y.-L.; Chung, P.-C.; Pai, M.-C. Predictive Models for Evaluating Cognitive Ability in Dementia Diagnosis Applications Based on Inertia- and Gait-Related Parameters. IEEE Sens. J. 2018, 18, 3338–3350. [Google Scholar] [CrossRef]
- Varrecchia, T.; Castiglia, S.F.; Ranavolo, A.; Conte, C.; Tatarelli, A.; Coppola, G.; Di Lorenzo, C.; Draicchio, F.; Pierelli, F.; Serrao, M. An artificial neural network approach to detect presence and severity of Parkinson’s disease via gait parameters. PLoS ONE 2021, 16, e0244396. [Google Scholar] [CrossRef] [Scilit]
- Yu, J.; Park, S.; Kwon, S.-H.; Cho, K.-H.; Lee, H. AI-Based Stroke Disease Prediction System Using ECG and PPG Bio-Signals. IEEE Access 2022, 10, 43623–43638. [Google Scholar] [CrossRef] [Scilit]
- Vora, C.; Katkar, V.; Lunagaria, M. GAIT analysis based on GENDER detection using pre-trained models and tune parameters. Discov. Artif. Intell. 2024, 4, 19. [Google Scholar] [CrossRef] [Scilit]
- Liu, Z.; Wang, C.; Liu, G.; Najafi, B. Deep Neural Network-Based Video Processing to Obtain Dual-Task Upper-Extremity Motor Performance Toward Assessment of Cognitive and Motor Function. IEEE Trans. Neural Syst. Rehabil. Eng. 2023, 31, 574–580. [Google Scholar] [CrossRef] [Scilit]
- Sakata, A.; Takemura, N.; Yagi, Y. Gait-based age estimation using multi-stage convolutional neural network. IPSJ Trans. Comput. Vis. Appl. 2019, 11, 4. [Google Scholar] [CrossRef] [Scilit]
- Lau, L.K.; Chan, K. Tree structure convolutional neural networks for gait-based gender and age classification. Multimed. Tools Appl. 2023, 82, 2145–2164. [Google Scholar] [CrossRef] [Scilit]
- Ren, J.; Li, H.; Wang, A.; Saho, K.; Meng, L. Radar-based gait analysis by Transformer-liked network for dementia diagnosis. Biomed. Signal Process. Control 2024, 91, 105986. [Google Scholar] [CrossRef] [Scilit]
- Zhang, Y.; Xu, J.; Nicholas, A.; Arnold, G.; Wang, W. A preliminary analysis of relationship between dual-task gait and age-related cognitive ability using neural network models. Technol. Health Care, 2026; online ahead of print.
- Saunders, J.B.D.M.; Inman, V.T.; Eberhart, H.D. The Major Determinants in Normal and Pathological Gait. J. Bone Jt. Surg. 1953, 35, 543–558. [Google Scholar] [CrossRef] [Scilit]
- Yang, F.; Pai, Y.C. Can sacral marker approximate center of mass during gait and slip-fall recovery among community-dwelling older adults? J. Biomech. 2014, 47, 3807–3812. [Google Scholar] [CrossRef] [Scilit]
- Bruijn, S.M.; Meijer, O.; Beek, P.J.; van Dieën, J.H. Assessing the stability of human locomotion: A review of current measures. J. R. Soc. Interface 2013, 10, 20120999. [Google Scholar] [CrossRef] [Scilit]
- Hof, A.G.; Gazendam, M.G.J.; Sinke, W.E. The condition for dynamic stability. J. Biomech. 2005, 38, 1–8. [Google Scholar] [CrossRef] [Scilit]
- Van Rijsbergen, C.J. A theoretical basis for the use of co-occurrence data in information retrieval. J. Doc. 1977, 33, 106–119. [Google Scholar] [CrossRef] [Scilit]
- Anwar, S.F.Z.; Wang, Y.; Raza, W.; Arnold, G.; Wang, W. Mechanical energy fluctuation in lower limbs during walking in participants with and without total hip replacement. R. Soc. Open Sci. 2023, 10, 230041. [Google Scholar] [CrossRef] [Scilit]
- Zhang, Y.; Duncan, A.; Nicholas, A.; Wang, W. A pilot study of cross-sectional design assessing gait kinetics during dual task in different age groups. Sci. Prog. 2025, 108, 00368504251384880. [Google Scholar] [CrossRef] [Scilit]
- Schmid-Zalaudek, K.; Fischer, T.; Száva, Z.; Lackner, H.K.; Kropiunig, U.; Bittner, C.; Höcker, K.; Winkler, G.; Peternell, G. Kinetic Gait Parameters in Unilateral Lower Limb Amputations and Normal Gait in Able-Bodied: Reference Values for Clinical Application. J. Clin. Med. 2022, 11, 2683. [Google Scholar] [CrossRef] [Scilit]
- Didevara, R.; Aminian, G.; Daryabor, A. The Effect of Ankle Angle and Foot-plate Length of Ankle-Foot Orthoses on Spatiotemporal Parameters and Knee Joint Angle in Post-Stroke Hemiplegic Gait. Funct. Disabil. J. 2019, 2, 37–45. [Google Scholar] [CrossRef] [Scilit]
- Lawson, M.; Naemi, R.; Needham, R.A.; Chockalingam, N. Can Machine Learning Predict Running Kinematics Based on Upper Trunk GPS-Based IMU Acceleration? A Novel Method of Conducting Biomechanical Analysis in the Field Using Artificial Neural Networks. Appl. Sci. 2024, 14, 1730. [Google Scholar] [CrossRef] [Scilit]
- Kumano, Y.; Kanoga, S.; Yamamoto, M.; Takemura, H.; Tada, M. Estimating Whole-Body Walking Motion from Inertial Measurement Units at Wrist and Heels Using Deep Learning. Int. J. Autom. Technol. 2023, 17, 217–225. [Google Scholar] [CrossRef] [Scilit]
- Jlassi, O.; Emmerzaal, J.; Vinco, G.; Garcia, F.; Ley, C.; Grimm, B.; Dixon, P.C. Outdoor Walking Classification Based on Inertial Measurement Unit and Foot Pressure Sensor Data. Sensors 2025, 26, 232. [Google Scholar] [CrossRef] [Scilit]

Disclaimer/Publisher’s Note: The statements, opinions and data contained in all publications are solely those of the individual author(s) and contributor(s) and not of MDPI and/or the editor(s). MDPI and/or the editor(s) disclaim responsibility for any injury to people or property resulting from any ideas, methods, instructions or products referred to in the content. |
© 2026 by the authors. Licensee MDPI, Basel, Switzerland. This article is an open access article distributed under the terms and conditions of the Creative Commons Attribution (CC BY) license.