


Abstract
Background: Adjusting walking speed on demand is fundamental to daily mobility and is achieved by modulating the anterior–posterior ground reaction force. However, kinetic control at the onset of a velocity change has not been isolated from control during an ongoing change or from the confounding influence of instantaneous speed. This study characterized step-by-step modulation of peak braking force (BF) and peak propulsive force (PF) during externally imposed velocity transitions and continuous velocity change. Methods: Nineteen healthy young adults walked on an instrumented dual-belt treadmill while belt speed was modulated sinusoidally. Transitions from constant speed to acceleration (CtoA) or deceleration (CtoD) were compared with continuous acceleration and deceleration. Each outcome was analyzed with a linear mixed-effects model with stepwise belt speed as a covariate. Results: The condition × step interaction was significant for both BF and PF in each condition pair (all PFDR < 0.001; η2p = 0.042–0.223). PF changed at the transition step in both CtoA and CtoD, whereas BF changed at the transition step in CtoA but one step later in CtoD. These changes differed from the continuous conditions and were not explained by instantaneous belt speed. Vertical ground reaction force and spatiotemporal parameters did not parallel these changes. Conclusions: Treadmill-imposed velocity transitions elicited the step-by-step modulation of braking and propulsive forces corresponding to transition onset. However, these findings cannot be directly generalized to self-initiated speed changes during overground walking.
1. Introduction
In daily life, walking rarely occurs at a constant speed. Community ambulation consists of short walking bouts punctuated by frequent starts, stops, and changes in pace [1]. Inconsistent speed profiles, including acceleration and deceleration, have been identified in both computational models and human participants, particularly during shorter bouts [2]. Therefore, adjusting walking speed on demand is a basic requirement for functional mobility and underpins assessment of gait adaptability [3]. Adjusting speed is mechanically more demanding than maintaining a steady pace [4]. This adjustment is achieved by modulating the anterior–posterior ground reaction force (GRF): propulsive and braking forces increase during acceleration and deceleration, respectively [4,5]. Understanding how this kinetic modulation is organized is essential for understanding the control of gait in daily life.
Walking speed is a primary determinant of the GRF. During steady walking at different speeds, the vertical and anterior–posterior force peaks increase systematically with speed [6,7]. During acceleration and deceleration, anterior–posterior force impulses are positively related to speed [4]. Across the steps surrounding voluntary acceleration or deceleration, spatiotemporal parameters, lower-limb joint kinematics, and muscle activity are adjusted [8,9,10]. During voluntary overground transitions, the transition to acceleration reduced braking force, whereas the transition to deceleration increased it [11]. Functional changes in lower-limb joint kinetics have also been implicated in acceleration and deceleration [12,13].
Despite this body of work, kinetic control specific to changes in walking speed has not been elucidated for three main reasons. First, the transition from steady walking to a speed change has already been reported [11] but has not been compared with an ongoing change under the same experimental conditions. The control of the state transition may be distinct, as illustrated by a well-established example: gait initiation differs from either the standing or steady walking state [14,15]. Indeed, kinetic control around the transition from constant speed to acceleration or deceleration may differ from that during continuous acceleration or deceleration. Second, because force scales with speed, a change in braking or propulsive force during a speed change may simply reflect the instantaneous speed at that step rather than condition-specific modulation, unless the instantaneous speed is accounted for. Third, although the timing of a self-generated speed change can be cued, its magnitude and acceleration rate may be only loosely specified and may therefore vary across participants and trials. In a speed-change walking task, the coefficient of variation of the velocity of the center of mass nearly doubled in both older and younger adults from the pre-transition step to the transition and post-transition steps [10]. Therefore, previous findings may include kinetic adjustments confounded by the uncontrolled variability inherent in voluntary speed changes.
To isolate transition-specific control, we combined all three elements. First, each velocity transition was compared with a continuous velocity change in the same direction. Second, the instantaneous belt speed at each step was entered as a covariate. Use of a linear mixed model can distinguish effects of speed from those of interindividual variation [16]. Third, the velocity change was imposed externally on an instrumented treadmill with fixed timing, magnitude, and acceleration rate so that the response reflected the imposed change rather than a self-generated one.
This design was used to characterize how peak braking and propulsive forces are modulated step-by-step during externally imposed velocity transitions in healthy young adults and to determine whether this modulation differs from that during continuous velocity change. We expected that transitions to acceleration would elicit an immediate decrease in peak braking force and an immediate increase in peak propulsive force, whereas transitions to deceleration would elicit the opposite changes [4,11]. We further hypothesized that these changes at the transition step would be different from those during continuous velocity change and would not be explained by instantaneous speed.
2. Materials and Methods
2.1. Participants
Twenty-one healthy young adults were recruited. The inclusion criteria were (1) age 18–40 years and (2) the ability to complete a 3.5-min continuous walk without fatigue. The exclusion criteria were (1) a body mass index exceeding 30 kg/m2 and (2) any orthopedic or neurological condition that could affect gait. After data collection, two participants who stepped beyond the treadmill midline were excluded from the analysis because ground reaction forces of each foot could not be separated between the two belts. Thus, finally, 19 healthy young adults (13 women and 6 men) were included in the analysis. Participants were 24.5 ± 1.8 years of age, 164.4 ± 7.4 cm in height, and 59.8 ± 12.1 kg in body weight. The baseline belt speed was 1.09 ± 0.12 m/s, corresponding to 50% of the maximum overground walking speed calculated from the 10-m walk time (4.60 ± 0.53 s). Characteristics of women and men are presented separately in Table S1.
This study was approved by the Institutional Review Board of Kanagawa Rehabilitation Hospital (approval number: krh-2024-019) and conducted in accordance with the Declaration of Helsinki. Written informed consent was obtained from all participants before enrollment.
2.2. Instrumentation and Walking Program
GRF and belt speed were recorded using an instrumented dual-belt treadmill with embedded force plates (M-Gait, Motek Force Link, Houten, Netherlands). Before the treadmill protocol, participants walked overground at maximum speed (Vmax) along a 16 m straight track; the middle 10 m section was timed to determine each participant’s maximum walking speed. They then stood on a stationary treadmill for at least 5 s and subsequently walked for 30 s at a constant speed set to 50% of each participant’s maximum walking speed. The final 10 steps of this 30 s constant-speed period constituted the baseline period and served as the reference.
The subsequent 3 min walking program incorporated five positive and five negative sinusoidal velocity modulation cycles applied intermittently and irregularly within a constant-speed background. The positive and negative sinusoidal patterns were defined as follows:
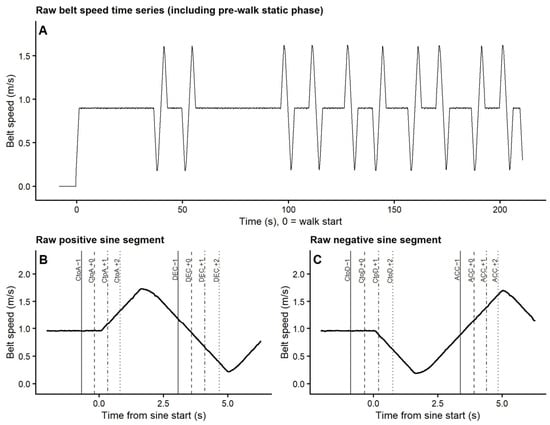
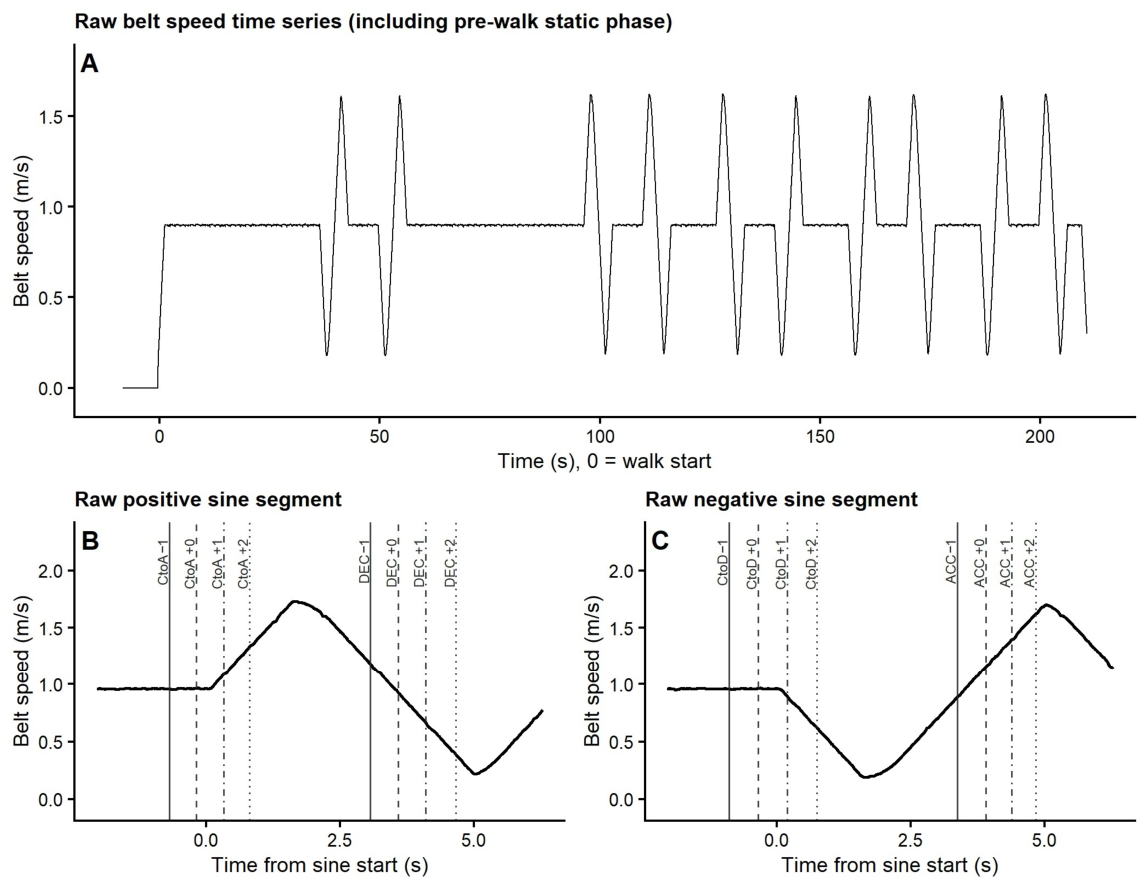
where t represents the time in seconds. Each sinusoidal cycle had a peak-to-peak amplitude of 80% of Vmax and a period of 2π s. The order and timing of the 10 cycles differed among the three predefined program versions, which were randomly assigned to the participants. Only three program versions were used; thus, the order of conditions was not fully counterbalanced across participants (6, 7, and 6 participants were assigned to versions 1, 2, and 3, respectively). Fatigue was not formally assessed; however, no participant reported fatigue, and the experimenter observed no signs of fatigue during the protocol. A representative belt-speed profile of the entire program is shown (Figure 1A). For safety, all participants were verbally instructed to lightly grip handrails throughout the walking program; the experimenter visually confirmed that all participants did so. Handrail forces were not measured. The GRF and belt speed were sampled at 300 Hz from both belts. GRF values below 15 N were set to zero, and the signals were low-pass filtered at 15 Hz. The belt-speed data were smoothed using a 50 ms moving average to remove high-frequency noise.
vt = (4/5)Vmax sin (t) + (1/2)Vmax
vt = −(4/5)Vmax sin (t) + (1/2)Vmax
Figure 1.
Protocol schematic of belt-speed modulation and phase definitions. Panel (A) shows the raw belt-speed time series for a representative participant across the full program. Panels (B,C) illustrate a positive and a negative sinusoidal cycle, respectively, used to define the ACC, CtoA, DEC, and CtoD conditions and the step-labeling scheme. In Panels (B,C), vertical lines indicate the initial contacts corresponding to each step: solid lines indicate step −1, dashed lines indicate step 0, dash-dotted lines indicate step +1, and dotted lines indicate step +2. Step 0 denotes the transition step in CtoA and CtoD or the reference step in ACC and DEC. ACC, acceleration condition; DEC, deceleration condition; CtoA, constant speed to acceleration; CtoD, constant speed to deceleration.
2.3. Walking Intervals and Step Labeling
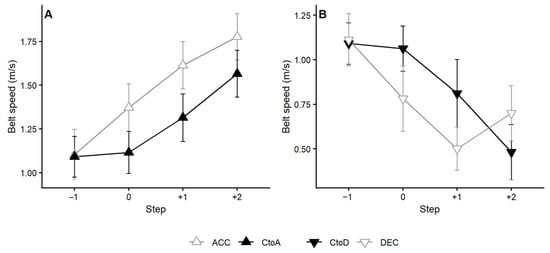
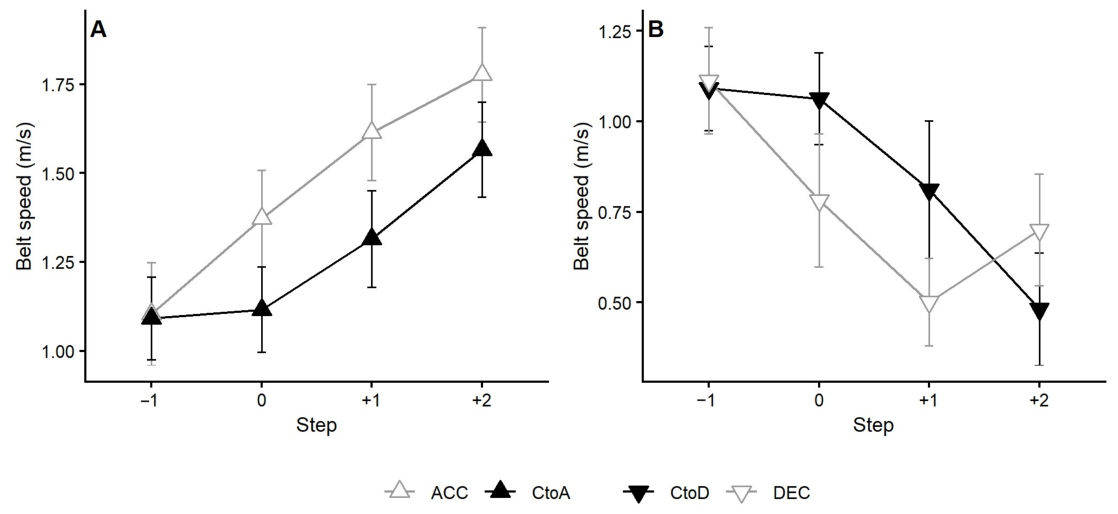
Four experimental conditions were identified using the sinusoidal velocity-modulation program (Figure 1B,C). For the velocity transition conditions, constant-to-acceleration (CtoA) was defined as the interval surrounding the onset of a positive sinusoidal cycle, and constant-to-deceleration (CtoD) as the interval surrounding the onset of a negative sinusoidal cycle. In both cases, Step 0 was defined as the step initiated by the final initial contact immediately before the belt speed transition, with the subsequent step labeled Step +1 and the preceding step labeled Step −1. For continuous velocity-change conditions, the acceleration condition (ACC) was identified within each negative sinusoidal cycle, and the deceleration condition (DEC) within each positive sinusoidal cycle. In ACC and DEC, Step −1 was assigned to the step with a mean belt speed closest to the baseline mean within each sinusoidal cycle; Step 0 was defined as the next step and Step +1 as the subsequent step. In DEC, the belt-speed trough was near the boundary of Steps +1 and +2; therefore, the mean belt speed at Step +2 increased (Figure 2). Consequently, increases in Peak PF and Peak vGRF 2nd at Step +1 in DEC were interpreted as an artifact of the analysis window rather than a response to deceleration and were therefore not interpreted as deceleration responses in the subsequent sections. Within each cycle, steps at which the mean belt speed changed relative to the preceding step in the direction opposite to that expected for the condition (a decrease in ACC and CtoA; an increase in DEC and CtoD) were excluded from the analysis. For stride-level variables, strides beginning at an excluded step were excluded. This criterion was applied to Steps 0 and +1 in ACC and DEC, and to Step +1 in CtoA and CtoD, because Step 0 in transition conditions belonged to the constant-speed period.
Figure 2.
Belt-speed profile. Mean ± SD belt speed (m/s) across Steps −1, 0, +1, and +2 for ACC, CtoA, DEC, and CtoD. Step +2 represents the velocity context sampled within the Step +1 stride window. SD, standard deviation; ACC, acceleration condition; DEC, deceleration condition; CtoA, constant speed to acceleration; CtoD, constant speed to deceleration.
2.4. Outcome Variables
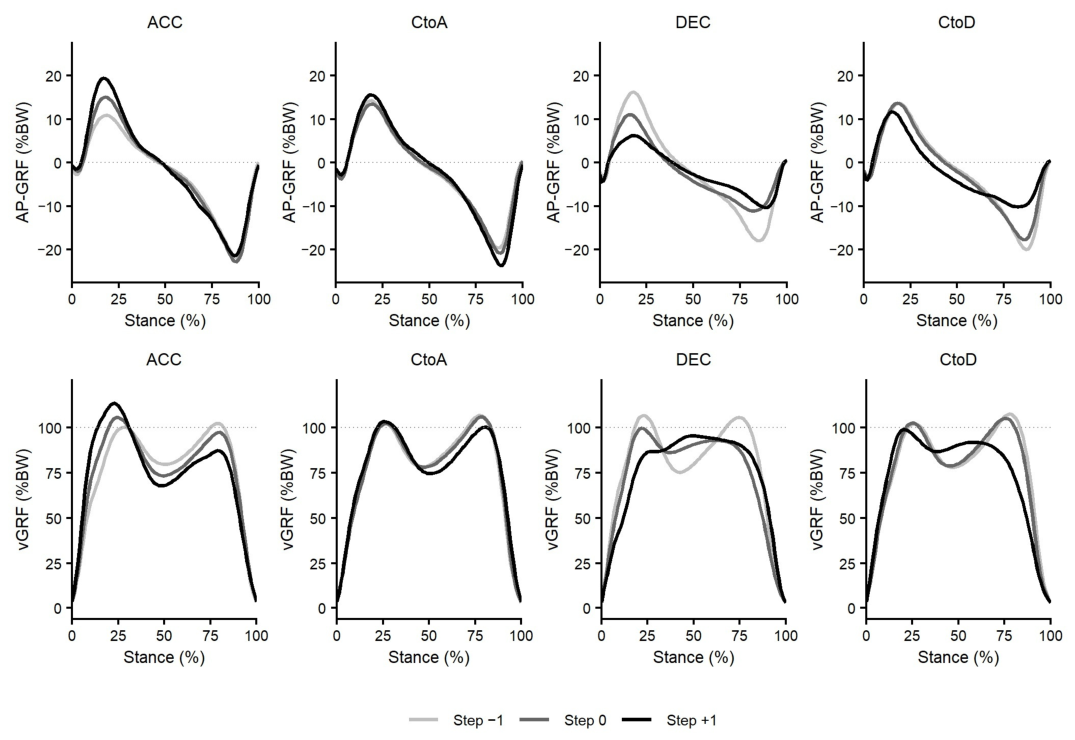
Two primary outcome variables were derived from the anterior–posterior GRF: peak braking force (Peak BF), defined as the maximum posteriorly directed GRF, and peak propulsive force (Peak PF), defined as the maximum anteriorly directed GRF within the stride (Figure 3).
Figure 3.
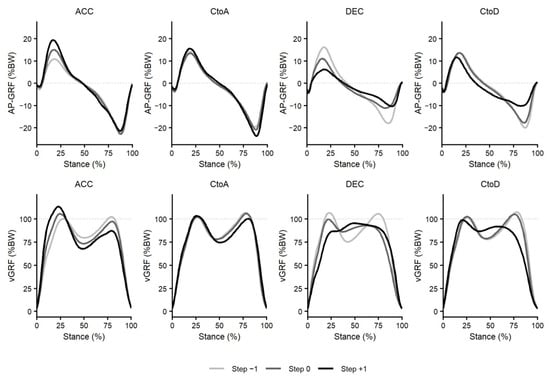
Anterior–posterior and vertical GRF waveforms normalized to stance by condition. Group-mean GRF waveforms (normalized to 0–100% stance) at Steps −1, 0, and +1 for each condition (ACC, CtoA, DEC, CtoD). The top row shows anterior–posterior GRF (AP-GRF); the bottom row shows vertical GRF (vGRF). AP-GRF, anterior–posterior ground reaction force; vGRF, vertical ground reaction force; ACC, acceleration condition; DEC, deceleration condition; CtoA, constant speed to acceleration; CtoD, constant speed to deceleration.
Secondary outcome variables included two vertical GRF peaks and two spatiotemporal parameters (step time and step length). First and second vertical GRF peaks (Peak vGRF 1st and Peak vGRF 2nd) were defined as the maximum vertical GRF within the first and second halves of the stance phase, respectively.
All GRF-derived variables were normalized to the mean vertical force recorded during the initial stationary standing period on the treadmill, during which participants did not hold handrails, and are expressed as a percentage of body weight (%BW).
2.5. Statistical Analysis
All analyses were conducted using R software (version 4.5.0; R Foundation for Statistical Computing, Vienna, Austria).
Primary (Peak BF and Peak PF) and secondary outcomes (Peak vGRF 1st, Peak vGRF 2nd, step time, and step length) were analyzed using a linear mixed-effects (LME) model. Separate models were fitted for each outcome variable and condition pair (CtoA vs. ACC, and CtoD vs. DEC). The mean belt speed of each step and cycle number within each condition (1–5) were included as continuous covariates to consider velocity-related confounders across conditions and to control for practice and fatigue effects, respectively. Belt speed was entered as a linear covariate, following previous work that modeled anterior–posterior GRF impulses as a linear function of walking speed during non-steady-state treadmill walking [4]. Condition was a two-level fixed factor, and the step was an ordered factor with three levels (−1, 0, +1). Participant was included as a random intercept. The condition × step interaction was the primary term of interest. Each participant contributed five cycles per condition, yielding 95 observations (19 participants × 5 cycles) per condition × step cell. The exclusion criterion (Section 2.3) removed only eight observations at Step +1 in DEC (three to five observations retained per participant; all 19 participants retained), and no other cell was affected. Consequently, each model included 570 observations for the CtoA–ACC pair and 562 for the CtoD–DEC pair, irrespective of outcome. To characterize between-participant variability, variances of the participant random intercept and residual were extracted from each model; the intraclass correlation coefficient (ICC) was calculated as the random-intercept variance divided by the sum of the random-intercept and residual variances. Model convergence was verified by confirming the absence of convergence warnings and singular fits.
Fixed effects were tested with Type III sums of squares, with denominator degrees of freedom estimated using Satterthwaite’s approximation. Post hoc contrasts between consecutive steps (Step 0 versus Step −1; Step +1 versus Step 0) were computed using the Kenward–Roger approximation, with Bonferroni correction applied to the two comparisons within each condition. To control for the false discovery rate (FDR) across models, raw p values for the condition × step interaction were adjusted using the Benjamini–Hochberg (BH) procedure applied separately across the four primary models and eight secondary models.
Belt speeds are summarized descriptively. The similarity of Step −1 belt speed to the constant-speed baseline was evaluated by calculating the 95% confidence interval (CI) for the within-participant mean difference (Methods S1; Table S2).
Residual normality and power simulations are reported in Table S3. To assess the robustness of the interaction tests to non-normal residuals, a participant-level cluster bootstrap (2000 replicates) was performed as a sensitivity analysis (Methods S2).
3. Results
The imposed belt speed program dissociated walking velocity from the step label within each condition pair (Figure 2). In the continuous conditions, belt speed changed markedly between Step −1 and Step 0 (ACC: 1.10 → 1.37 m/s; DEC: 1.11 → 0.78 m/s). In the transition conditions, belt speed also changed in the expected direction from Step −1 to Step 0, but by a smaller amount (CtoA: 1.09 → 1.12 m/s; CtoD: 1.09 → 1.06 m/s), with the larger change occurring at Step +1 (CtoA: 1.31 m/s; CtoD: 0.81 m/s). Because the same step label corresponded to different instantaneous velocities across the two conditions of a pair, the stepwise belt speed was entered as a covariate in all outcome models. Nonetheless, ranges of belt speed overlapped between the two conditions of each pair at every step (Table S4 and Figure S1).
The stride labeled Step +1 partially sampled the Step +2 interval; therefore, belt speed is reported through Step +2 (Figure 2). In the DEC, the belt speed reached its nadir near Step +1 and began to re-accelerate in Step +2 (Figure 2). Within-participant comparisons showed that Step −1 belt speed closely matched the constant-speed baseline in all four conditions (mean differences ≤ 0.021 m/s) (Table S2).
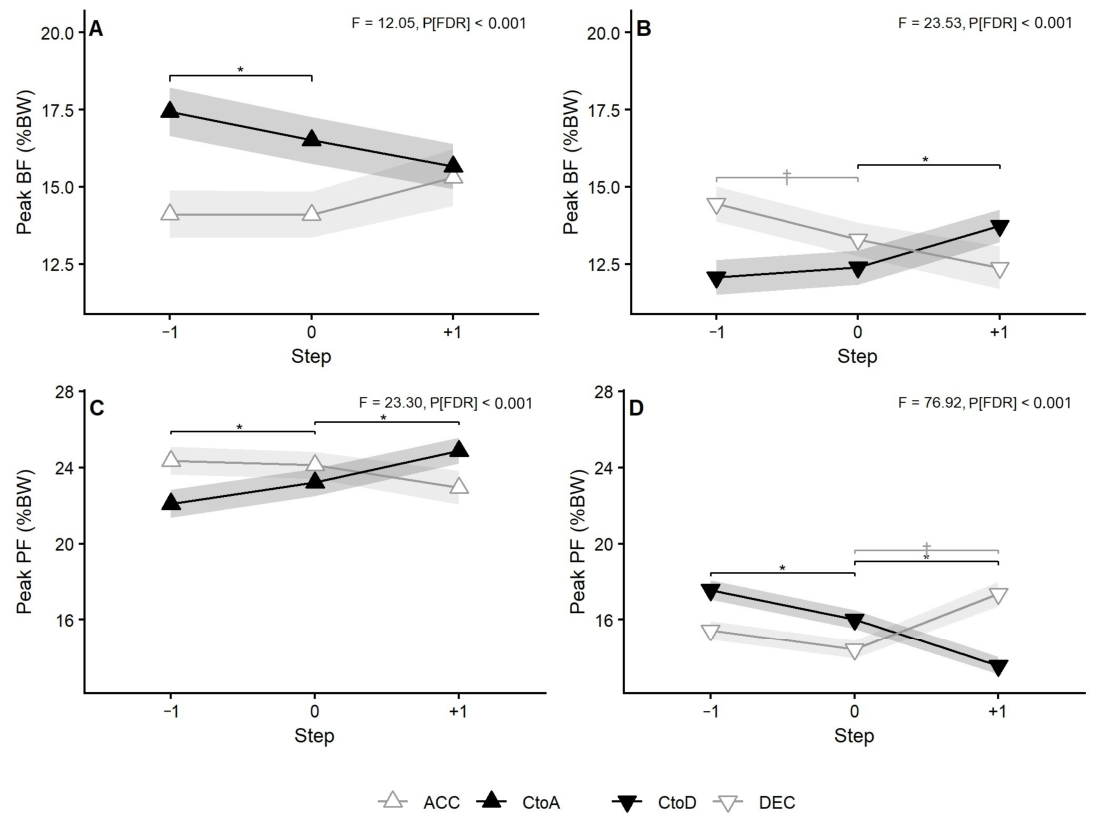
The condition × step interaction was significant for both primary outcomes (peak BF and PF) in both condition pairs, CtoA–ACC and CtoD–DEC, indicating that the step-by-step trajectories of the braking and propulsive forces in each transition condition diverged from those in the corresponding continuous condition (all p FDR < 0.001; Table 1, Figure 4). Interaction effect sizes ranged from η2p = 0.042 (Peak BF, CtoA–ACC) to η2p = 0.223 (Peak PF, CtoD–DEC).
Table 1.
Step-by-step estimates of the primary anterior–posterior GRF outcomes (Peak BF, Peak PF) with the corresponding LME results.
Figure 4.
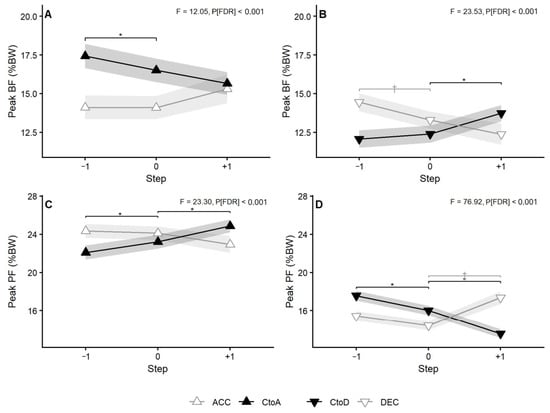
Peak BF and Peak PF across condition pairs. Estimated marginal means ± SE for Peak BF (%BW; panels (A,B)) and Peak PF (%BW; panels (C,D)) at Steps −1, 0, and +1, shown separately for CtoA versus ACC (A,C) and CtoD versus DEC (B,D). Shaded bands around the lines represent ±1 standard error (SE) of the mean. Panel annotations report the condition × step interaction F statistic and false discovery rate-corrected p value. An asterisk (*) denotes a significant (p < 0.05) within-condition step comparison for CtoA or CtoD; a dagger (†) denotes the corresponding significant (p < 0.05) comparison for ACC or DEC. BF, braking force; PF, propulsive force; SE, standard error; %BW, percentage of body weight; ACC, acceleration condition; DEC, deceleration condition; CtoA, constant speed to acceleration; CtoD, constant speed to deceleration.
The transition to acceleration decreased Peak BF at the transition step, as hypothesized, whereas the transition to deceleration elicited no significant change at the transition step but increased it at the next step (Figure 4A,B). Peak BF in CtoA was elevated at Step −1 (17.43%BW) and decreased significantly to Step 0 (16.51%BW; p = 0.020), with no significant change to Step +1 (15.66%BW; p = 0.156); in ACC, Peak BF did not change significantly from Step −1 to Step 0 (14.12 and 14.10%BW; p > 0.999) and to Step +1 (15.31%BW; p = 0.051). Peak BF in DEC decreased significantly from Step −1 to Step 0 (14.45 to 13.30%BW; p = 0.036), with no further significant change to Step +1 (12.38%BW; p = 0.086); in CtoD, Peak BF did not differ between Step −1 and Step 0 (12.07 and 12.39%BW; p = 0.617) but increased significantly at Step +1 (13.74%BW; p = 0.003). Thus, the CtoD–DEC interaction for Peak BF reflected opposite step-wise trajectories in the two conditions—a decrease from Step −1 to Step 0 in DEC and an increase from Step 0 to Step +1 in CtoD—rather than reflecting a change in CtoD alone.
For Peak PF, significant changes in both transition conditions occurred at the transition step as hypothesized (Figure 4C,D). Peak PF in CtoA increased significantly at each consecutive step (22.10 to 23.21%BW at Step 0, p = 0.004; to 24.88%BW at Step +1, p = 0.001); in ACC, Peak PF did not differ between Step −1 and Step 0 (24.36 and 24.12%BW; p > 0.999) or between Step 0 and Step +1 (22.94%BW; p = 0.060). Peak PF in CtoD decreased significantly at each consecutive step (17.57 to 16.01%BW, p < 0.001; to 13.56%BW, p < 0.001); in DEC, Peak PF did not differ between Step −1 and Step 0 (15.43 and 14.42%BW; p = 0.096) but increased significantly at Step +1 (17.36%BW; p < 0.001). This Step +1 increase in DEC coincided with the re-acceleration of the belt speed toward Step +2, sampled within the Step +1 stride (Figure 2).
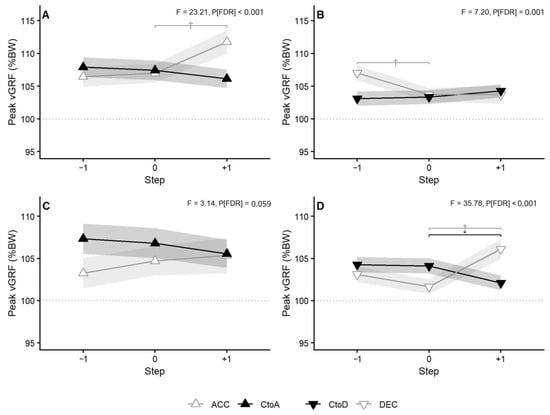
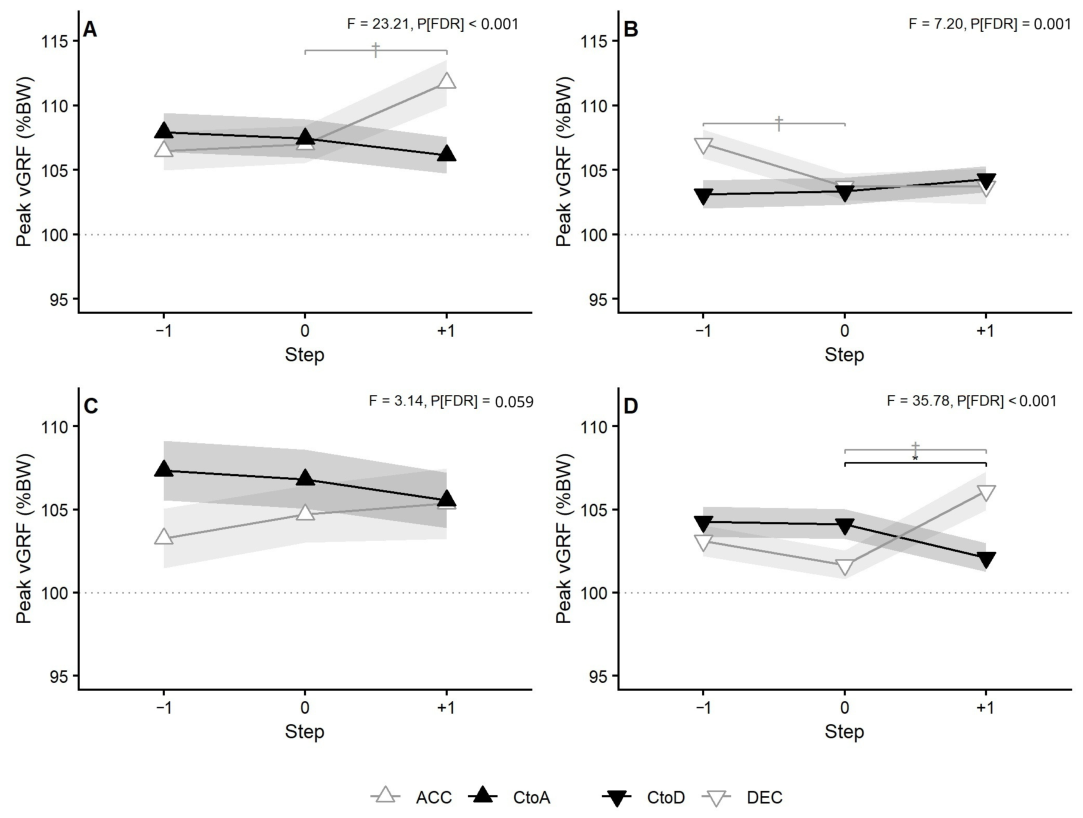
Significant changes in the vGRF peaks occurred only in the continuous conditions, except for a decrease in Peak vGRF 2nd at Step +1 in CtoD (Table 2, Figure 5). Peak vGRF 1st increased significantly in ACC at Step +1 (106.46 and 106.97%BW at Steps −1 and 0 [p > 0.99], rising to 111.76%BW; p < 0.001); it decreased significantly in DEC from Step −1 to Step 0 (107.02 to 103.71%BW; p = 0.002) and did not change significantly in CtoA or CtoD. For Peak vGRF 2nd, the CtoA–ACC interaction was not significant after FDR correction (p FDR = 0.059). The CtoD–DEC interaction reflected a significant increase in DEC at Step +1 (101.67 to 106.13%BW; p < 0.001) and a significant decrease in CtoD at Step +1 (104.12 to 102.11%BW; p = 0.012).
Table 2.
Step-by-step estimates of the secondary outcomes (Peak vGRF 1st, Peak vGRF 2nd, step length, step time) with the corresponding LME results.
Figure 5.
First and second vertical GRF peaks across condition pairs. Estimated marginal means ± SE for Peak vGRF 1st (%BW; panels (A,B)) and Peak vGRF 2nd (%BW; panels (C,D)) at Steps −1, 0, and +1, for CtoA versus ACC (A,C) and for CtoD versus DEC (B,D). Shaded bands around the lines represent ±1 standard error (SE) of the mean. Each panel includes a horizontal reference line at 100% body weight. Panel annotations report the condition × step interaction F statistic and false discovery rate-corrected p value. Consecutive-step contrasts are marked only for condition pairs with a significant interaction after FDR correction. An asterisk (*) denotes a significant (p < 0.05) within-condition step comparison for CtoA or CtoD; a dagger (†) denotes the corresponding significant (p < 0.05) comparison for ACC or DEC. vGRF, vertical ground reaction force; SE, standard error; %BW, percentage of body weight; ACC, acceleration condition; DEC, deceleration condition; CtoA, constant speed to acceleration; CtoD, constant speed to deceleration.
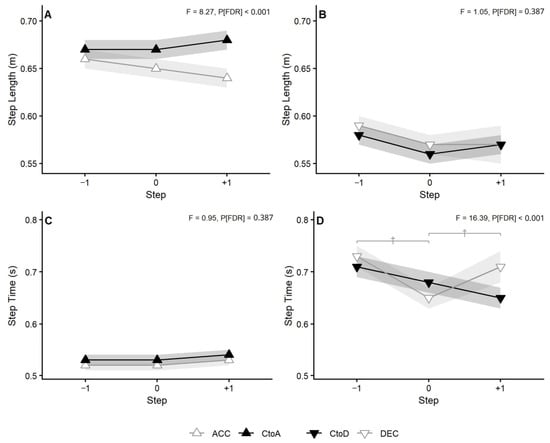
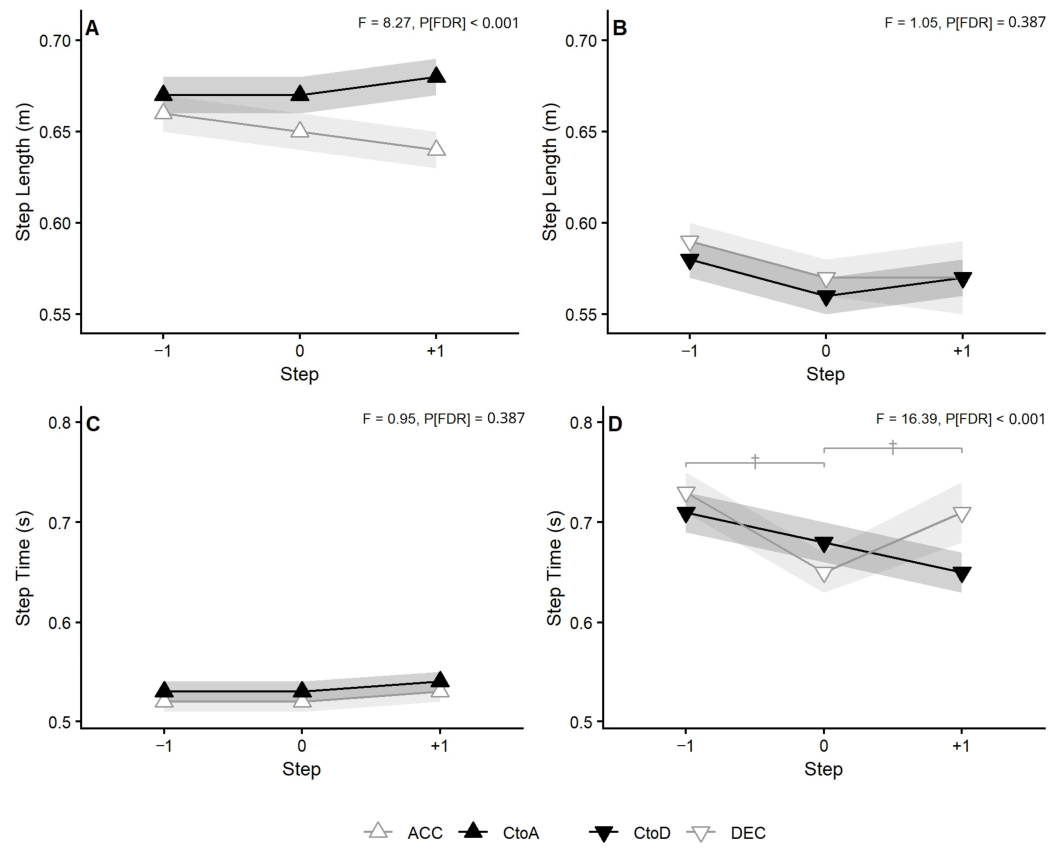
Step length and step time each showed a significant interaction in only one condition pair; consecutive-step comparisons detected significant changes only in step time in DEC (Table 2, Figure 6). Step length showed a significant interaction in the CtoA–ACC pair (p FDR < 0.001), reflecting divergent trajectories: a gradual decline in ACC compared to a gradual rise in CtoA, although no adjacent step contrast was significant in either condition. In the CtoD–DEC pair, the interaction was not significant (p FDR = 0.387). Step time showed a significant interaction only in the CtoD–DEC pair (p FDR < 0.001); the interaction in the CtoA–ACC pair was not significant (p FDR = 0.387). In DEC, step time decreased significantly from Step −1 to Step 0 (0.73 to 0.65 s; p < 0.001) and increased significantly from Step 0 to Step +1 (0.65 to 0.71 s; p < 0.001); however, no consecutive-step change was significant in CtoD.
Figure 6.
Spatiotemporal outcomes across condition pairs. Estimated marginal means ± SE for step length (m; panels (A,B)) and step time (s; panels (C,D)) at Steps −1, 0, and +1, for CtoA versus ACC (A,C) and for CtoD versus DEC (B,D). Shaded bands around the lines represent ±1 standard error (SE) of the mean. Panel annotations report the condition × step interaction F statistic and false discovery rate-corrected p value. Consecutive-step contrasts are marked only for condition pairs with a significant interaction after FDR correction. An asterisk (*) denotes a significant (p < 0.05) within-condition step comparison for CtoA or CtoD; a dagger (†) denotes the corresponding significant (p < 0.05) comparison for ACC or DEC. SE, standard error; ACC, acceleration condition; DEC, deceleration condition; CtoA, constant speed to acceleration; CtoD, constant speed to deceleration.
Although residuals from each LME deviated from normality (W = 0.921–0.993), the participant-level cluster bootstrap confirmed all four primary interactions (p FDR < 0.001; Table S3). ICCs ranged from 0.35 to 0.71, indicating that 35–71% of the variance not explained by fixed effects was attributable to differences between participants (Table S3). All models converged without warnings, and none yielded a singular fit. A simulation-based power analysis confirmed that the power was ≥99.5% at α = 0.05 and ≥97.7% at the multiplicity-adjusted α = 0.0125 in all four primary models. Peak BF was higher in the late than in the early cycles in all four conditions (ACC: p FDR = 0.004, CtoA: p FDR < 0.001, DEC: p FDR = 0.002, CtoD: p FDR < 0.001). For Peak PF, a significant increase from early to late cycles occurred only in ACC. The cycle number within each condition (1–5) was included as a continuous covariate in all primary and secondary models to adjust for the systematic early-to-late changes (Tables S3 and S5).
4. Discussion
This study characterized how braking and propulsive forces are modulated step-by-step during velocity transitions from constant speed relative to continuous velocity changes, with the belt speed controlled at each step. The condition × step interactions were significant for both forces in both condition pairs and supported the hypotheses. In transition conditions, modulation of the anterior–posterior force began at the step at which the transition occurred. The propulsive force changed at the transition step in both acceleration and deceleration, whereas the braking force changed at different steps: at the transition step in the acceleration transition and at the following step in the deceleration transition. The present results show the step-by-step modulation of braking and propulsive forces in response to externally driven velocity changes in treadmill walking after adjustment for velocity.
In CtoA, the braking force decreased significantly, and the propulsive force increased significantly at the transition step. In CtoD, the propulsive force declined immediately at the step at which the transition from constant speed to deceleration occurred and continued to decline at the next step. In both transition conditions, given that the mean belt speed of Step 0 increased or decreased only marginally from Step −1, and that the analysis was conducted with belt speed as a covariate, these kinetic responses were not fully explained by instantaneous velocity. Thus, this kinetic modulation was temporally associated with transition onset rather than being explained by the accompanying change in velocity. The lower Peak BF at Step −1 in ACC relative to CtoA and the higher Peak BF at Step −1 in DEC relative to CtoD were consistent with the continuous acceleration and deceleration context of that step in the sinusoidal cycle, compared with constant speed.
However, the steps at which braking force was modulated differed between CtoA and CtoD. Modulation at the transition step was detected in CtoA, whereas it was not significant in CtoD; modulation at the following step was significant. The absence of a significant change at Step 0 in CtoD does not demonstrate that braking force was unaffected at the transition step; the CtoD–DEC interaction also reflected the decrease at Step 0 in DEC. Hence, the delayed change in CtoD should be interpreted as indicating the step at which the first significant change in braking force was detected. Accordingly, in the decelerating transition, the reduction in late-stance propulsive force was the first significant response, although late-stance propulsion in Step 0 and early-stance braking in Step +1 occurred within the same double-support phase.
Compared with previous findings, braking and propulsive forces showed distinct patterns. The present decreases and increases in braking force during transitions to acceleration and deceleration, respectively, were broadly consistent with the findings from overground velocity-transition gait [11], but differed from patterns during continuous acceleration or deceleration in the present study and a previous study [4]. Although neither previous study included speed as a covariate, the comparison of these studies with the present results suggests a difference in the control of braking force between continuous acceleration or deceleration and the transition. Propulsive-force modulation was consistent with previous studies [4,11]. Despite this apparent consistency, the present results also highlight an important difference. The increase and decrease in the propulsive force during the transitions to acceleration and deceleration, respectively, remained significant after adjustment for speed but were not significant during continuous acceleration or deceleration. Moreover, the first kinetic response in CtoD—a decline in propulsive force at Step 0—differed from previous findings that reported an elevated posterior force in the early stance during the cued transition to deceleration [11]. This difference may reflect when the imposed speed change occurred within the gait cycle, whereas spontaneous deceleration may be initiated at the beginning of the gait cycle.
Changes in the anterior–posterior GRF were not consistent with changes in the vertical GRF and spatiotemporal variables. No significant change in either the first or second vGRF peak was detected in CtoA, indicating that the vGRF changed in line with the instantaneous belt speed. The decline in Peak PF was accompanied by a decline in Peak vGRF 2nd during the same late-stance phase at Step +1 in CtoD. Peak BF and Peak vGRF 1st decreased at Step 0 in DEC. Given the established coupling of larger peak vertical and anterior–posterior GRFs with higher speed [7], the first responses to the decelerating transition—Peak PF at Step 0 and Peak BF at Step +1—were uncoupled from the vertical force change and appeared specific to the transition.
In the comparison between CtoA and ACC, the condition × step interaction in step length was significant, whereas step-by-step comparisons were not; furthermore, the interaction in step time was not significant. The gradual increase in step length in CtoA may have been associated with increasing Peak PF. The trailing limb angle, the angle between the laboratory’s vertical axis and the vector joining the greater trochanter with the fifth metatarsal head, is a major contributor to the increase in propulsive force [17] and is significantly correlated with step length [18]. Temporal acceleration within the gait cycle on a treadmill increases trailing limb angle, step length, and propulsive force [19]. In the context of overground cued acceleration, reported changes in step length were inconsistent: a significant decrease at the transition step relative to the pre- and post-transition steps [10], and a significant increase at the transition and the next step [9].
Step time in DEC shortened at Step 0 and lengthened again at Step +1; no significant consecutive-step change was detected in CtoD. The shortening at Step 0 in DEC differed from findings in other studies. Step time was longer during the overground transition to deceleration [9] and continuous deceleration on a treadmill [4]. Longer step times have also been reported during other overground transitions to deceleration [10]. Externally imposed treadmill deceleration could move the body forward relative to the belts, creating a need to reduce forward relative velocity to maintain position on the treadmill. The shorter step time at Step 0 in DEC may reflect earlier foot contact in response to this demand. The subsequent lengthening at Step +1 may suggest that this shortening was transient. However, the present study did not measure the position of the center of mass or other body segments on the treadmill to confirm this interpretation.
This study had a few limitations. First, the velocity change was externally imposed by a treadmill belt and was distinct from participants’ volitional speed control. Therefore, the present results should not be generalized directly to typical overground gait because prior evidence indicates differences between treadmill and overground walking [20,21,22]. The results were derived solely from the embedded force plates, and thus, the findings cannot identify sources of force generation or characterize other kinematic changes. The present data also cannot distinguish whether the observed modulation reflects active neural control or a passive mechanical response. Moreover, a potential learning effect of the gait program should be considered. Peak BF increased in all conditions in later cycles, indicating possible adaptation to repeated sinusoidal velocity changes. Although the analysis was adjusted using the cycle number as a covariate, the potential learning effect could not be fully excluded, particularly because the order of conditions was not fully counterbalanced.
Second, in the analysis, the belt speed varied continuously within the step, whereas the mean belt speed of the step was applied as a covariate, so the effect of within-step velocity change could not be adjusted for. For the same reason, the reference step (Step −1) was matched to the constant-speed baseline based only on mean belt speed and was not completely equivalent across the conditions. Furthermore, because belt speed was entered as a linear covariate, residual confounding arising from nonlinear relationships between speed and the outcomes cannot be excluded. Although belt speed at the same step differed between the paired conditions, speed ranges partially overlapped at every step (Table S4). In addition, all participants lightly gripped handrails during walking, whereas the body weight used for normalization was measured without handrail support. Because handrail forces were not measured, partial unloading through the handrails may have reduced the GRF values expressed as %BW. Although the same instruction applied to all conditions, the possibility that the degree of unloading varied with belt speed or condition cannot be excluded.
Third, the participants were young, able-bodied adults. Lower propulsive GRF during normal walking has been reported in older adults [23]. Propulsive force has also been identified as a potential rehabilitation target in patients with stroke [24]. Therefore, older adults and clinical populations may exhibit different responses. Further investigations are needed to establish the applicability of the present findings to these populations. Given the sex imbalance among participants (13 women and 6 men) and the limitations on sample size, we did not conduct analyses with sex as a factor; therefore, sex differences in force adjustment during speed transitions have not been examined.
5. Conclusions
The present study compared the peak braking force and peak propulsive force during gait-speed transitions to acceleration or deceleration with those during continuous acceleration or deceleration, with the mean belt speed as a covariate. In both the acceleration and deceleration contexts, the braking force and propulsive force showed a significant condition × step interaction, meaning that the stepwise kinetic modulation around each transition differed from that under continuous conditions. The propulsive force was modulated at the transition step in both acceleration and deceleration. The first significant change in braking force occurred at the transition step for acceleration and at the following step for deceleration. Thus, the externally imposed belt speed change elicited step-by-step responses of braking and propulsive forces, even post-adjustment for mean belt speed. These findings suggest that treadmill-imposed velocity transitions elicit kinetic modulation corresponding to transition onset, distinct from that during continuous velocity change.
Supplementary Materials
The following supporting information can be downloaded at: https://www.mdpi.com/article/10.3390/biomechanics6040101/s1. Methods S1: Validity of the Step −1 reference; Methods S2: Model adequacy; Methods S3: Statistical power; Methods S4: Learning effects; Results S1: Validity of the Step −1 reference; Results S2: Model adequacy and sensitivity; Results S3: Statistical power; Results S4: Learning effects; Results S5: Belt speed by condition and step; Results S6: Participant characteristics by sex; Table S1: Participant characteristics for the whole sample and by sex; Table S2: Belt speed at the Step −1 reference compared with the constant-speed baseline (N = 19); Table S3: Model adequacy, variance components, and statistical power for the linear mixed-effects models; Table S4: Belt speed by condition and step; Table S5: Learning effects; Figure S1: Distribution of belt speed by condition and step.
Author Contributions
Conceptualization, N.A.; methodology, N.A. and S.A.; software, N.A.; validation, N.A., M.F. and S.T.; formal analysis, N.A.; investigation, N.A., M.F. and S.T.; resources, S.A.; data curation, M.F. and S.T.; writing—original draft preparation, N.A.; writing—review and editing, M.F., S.T. and S.A.; visualization, N.A.; supervision, S.A.; project administration, N.A.; funding acquisition, N.A. All authors have read and agreed to the published version of the manuscript.
Funding
This research was funded by the Japan Society for the Promotion of Science (JSPS) KAKENHI, grant number 26K20834.
Institutional Review Board Statement
The study was conducted in accordance with the Declaration of Helsinki and approved by the Institutional Review Board of Kanagawa Rehabilitation Hospital (protocol code krh-2024-019, approved on 11 December 2024).
Informed Consent Statement
Informed consent was obtained from all subjects involved in the study.
Data Availability Statement
The data presented in this study are not available. The participants did not provide written consent for their data to be shared outside the research team, and the study protocol approved by the Institutional Review Board does not permit data sharing.
Acknowledgments
The authors thank the engineering staff of the Kanagawa Rehabilitation Center for their assistance with data collection.
Conflicts of Interest
The authors declare no conflicts of interest. The funders had no role in the design of the study; in the collection, analyses, or interpretation of data; in the writing of the manuscript; or in the decision to publish the results.
Abbreviations
The following abbreviations are used in this manuscript:
| BH | Benjamini–Hochberg |
| BF | braking force |
| CI | confidence interval |
| CtoA | constant-to-acceleration transition |
| CtoD | constant-to-deceleration transition |
| ACC | continuous acceleration |
| DEC | continuous deceleration |
| FDR | false discovery rate |
| GRF | ground reaction force |
| ICC | intraclass correlation coefficient |
| LME | linear mixed-effects |
| PF | propulsive force |
| SE | standard error |
| vGRF | vertical ground reaction force |
References
- Orendurff, M.S.; Schoen, J.A.; Bernatz, G.C.; Segal, A.D.; Klute, G.K. How Humans Walk: Bout Duration, Steps per Bout, and Rest Duration. J. Rehabil. Res. Dev. 2008, 45, 1077–1089. [Google Scholar] [CrossRef] [Scilit]
- Carlisle, R.E.; Kuo, A.D. Optimization of Energy and Time Predicts Dynamic Speeds for Human Walking. eLife 2023, 12, e81939. [Google Scholar] [CrossRef] [Scilit]
- Shumway-Cook, A.; Taylor, C.S.; Matsuda, P.N.; Studer, M.T.; Whetten, B.K. Expanding the Scoring System for the Dynamic Gait Index. Phys. Ther. 2013, 93, 1493–1506. [Google Scholar] [CrossRef] [Scilit]
- Peterson, C.L.; Kautz, S.A.; Neptune, R.R. Braking and Propulsive Impulses Increase with Speed During Accelerated and Decelerated Walking. Gait Posture 2011, 33, 562–567. [Google Scholar] [CrossRef] [Scilit]
- Orendurff, M.S.; Bernatz, G.C.; Schoen, J.A.; Klute, G.K. Kinetic Mechanisms to Alter Walking Speed. Gait Posture 2008, 27, 603–610. [Google Scholar] [CrossRef] [Scilit]
- Masani, K.; Kouzaki, M.; Fukunaga, T. Variability of Ground Reaction Forces During Treadmill Walking. J. Appl. Physiol. 2002, 92, 1885–1890. [Google Scholar] [CrossRef] [Scilit]
- Nilsson, J.; Thorstensson, A. Ground Reaction Forces at Different Speeds of Human Walking and Running. Acta Physiol. Scand. 1989, 136, 217–227. [Google Scholar] [CrossRef] [Scilit]
- Kokue, T.; Takenaka, Y.; Matsue, Y.; Tsuchida, M.; Sugawara, K. Changes in Acceleration and Deceleration Factors Associated with Active Gait Speed Adjustment. J. Phys. Ther. Sci. 2024, 36, 226–233. [Google Scholar] [CrossRef] [Scilit]
- Kokue, T.; Takenaka, Y.; Sugawara, K. Kinematic Control Differs in Walking Speed Adjustment to Different Velocities. J. Phys. Ther. Sci. 2025, 37, 415–421. [Google Scholar] [CrossRef] [Scilit]
- Wade, F.E.; Kellaher, G.K.; Pesquera, S.; Baudendistel, S.T.; Roy, A.; Clark, D.J.; Seidler, R.D.; Ferris, D.P.; Manini, T.M.; Hass, C.J. Kinematic Analysis of Speed Transitions Within Walking in Younger and Older Adults. J. Biomech. 2022, 138, 111130. [Google Scholar] [CrossRef] [Scilit]
- Hida, N.; Kokue, T.; Sugawara, K. Propulsive and Braking Mechanisms During Acceleration and Deceleration in Human Gait. Hum. Mov. Sci. 2025, 104, 103420. [Google Scholar] [CrossRef] [Scilit]
- Farris, D.J.; Raiteri, B.J. Modulation of Leg Joint Function to Produce Emulated Acceleration During Walking and Running in Humans. R. Soc. Open Sci. 2017, 4, 160901. [Google Scholar] [CrossRef] [Scilit]
- Qiao, M.; Jindrich, D.L. Leg Joint Function During Walking Acceleration and Deceleration. J. Biomech. 2016, 49, 66–72. [Google Scholar] [CrossRef] [Scilit]
- Crenna, P.; Frigo, C. A Motor Programme for the Initiation of Forward-Oriented Movements in Humans. J. Physiol. 1991, 437, 635–653. [Google Scholar] [CrossRef] [Scilit]
- Jian, Y.; Winter, D.; Ishac, M.; Gilchrist, L. Trajectory of the Body COG and COP During Initiation and Termination of Gait. Gait Posture 1993, 1, 9–22. [Google Scholar] [CrossRef] [Scilit]
- Stansfield, B.; Hawkins, K.; Adams, S.; Bhatt, H. A Mixed Linear Modelling Characterisation of Gender and Speed Related Changes in Spatiotemporal and Kinematic Characteristics of Gait Across a Wide Speed Range in Healthy Adults. Med. Eng. Phys. 2018, 60, 94–102. [Google Scholar] [CrossRef] [Scilit]
- Hsiao, H.; Knarr, B.A.; Higginson, J.S.; Binder-Macleod, S.A. The Relative Contribution of Ankle Moment and Trailing Limb Angle to Propulsive Force During Gait. Hum. Mov. Sci. 2015, 39, 212–221. [Google Scholar] [CrossRef] [Scilit]
- McGrath, R.L.; Ziegler, M.L.; Pires-Fernandes, M.; Knarr, B.A.; Higginson, J.S.; Sergi, F. The Effect of Stride Length on Lower Extremity Joint Kinetics at Various Gait Speeds. PLoS ONE 2019, 14, e0200862. [Google Scholar] [CrossRef] [Scilit]
- Browne, M.G.; Stenum, J.; Padmanabhan, P.; Roemmich, R.T. Simple Within-Stride Changes in Treadmill Speed Can Drive Selective Changes in Human Gait Symmetry. PLoS ONE 2023, 18, e0287568. [Google Scholar] [CrossRef] [Scilit]
- Hollman, J.H.; Watkins, M.K.; Imhoff, A.C.; Braun, C.E.; Akervik, K.A.; Ness, D.K. A Comparison of Variability in Spatiotemporal Gait Parameters Between Treadmill and Overground Walking Conditions. Gait Posture 2016, 43, 204–209. [Google Scholar] [CrossRef] [Scilit]
- Riley, P.O.; Paolini, G.; Della Croce, U.; Paylo, K.W.; Kerrigan, D.C. A Kinematic and Kinetic Comparison of Overground and Treadmill Walking in Healthy Subjects. Gait Posture 2007, 26, 17–24. [Google Scholar] [CrossRef] [Scilit]
- Row Lazzarini, B.S.; Kataras, T.J. Treadmill Walking Is Not Equivalent to Overground Walking for the Study of Walking Smoothness and Rhythmicity in Older Adults. Gait Posture 2016, 46, 42–46. [Google Scholar] [CrossRef] [Scilit]
- Franz, J.R.; Maletis, M.; Kram, R. Real-Time Feedback Enhances Forward Propulsion During Walking in Old Adults. Clin. Biomech. 2014, 29, 68–74. [Google Scholar] [CrossRef] [Scilit]
- Lewek, M.D.; Raiti, C.; Doty, A. The Presence of a Paretic Propulsion Reserve During Gait in Individuals Following Stroke. Neurorehabilit. Neural Repair 2018, 32, 1011–1019. [Google Scholar] [CrossRef] [Scilit]

Disclaimer/Publisher’s Note: The statements, opinions and data contained in all publications are solely those of the individual author(s) and contributor(s) and not of MDPI and/or the editor(s). MDPI and/or the editor(s) disclaim responsibility for any injury to people or property resulting from any ideas, methods, instructions or products referred to in the content. |
© 2026 by the authors. Licensee MDPI, Basel, Switzerland. This article is an open access article distributed under the terms and conditions of the Creative Commons Attribution (CC BY) license.