


Abstract
Background/Objectives: This study investigated the effect of sprint intensity on spatiotemporal variables and joint kinematics during the maximal-velocity phase at each intensity level in experienced sprinters. Methods: Twenty experienced master sprinters (18 men and two women, age: 38.2 ± 12.1 years, height: 1.80 ± 0.06 m, body mass: 81.8 ± 8.8 kg, 100 m PB: 12.65 ± 1.06) performed nine 50 m sprints with increasing intensity each time (60–100%), during which step-by-step spatiotemporal parameters and joint kinematics during the maximal-velocity phase of each sprint were measured. Results: The main findings were that sprint times decreased significantly with each increase in intensity, together with a significant increase in maximal sprint velocity. The spatiotemporal parameters contact and flight times decreased, step frequency increased, while step length increased until 75% and decreased again after 90%. Joint angles of the ankle and knee changed, while those of the hip joint did not change at touchdown and toe-off with increasing intensity. All peak step-by-step angular joint velocities during the maximal-velocity phases increased with increasing sprint intensity. However, the changes in joint kinematics across joints did not occur at the same time between intensity levels. Conclusions: These findings highlight that spatiotemporal variables and joint kinematics do not follow a linear development as intensity increases; rather, they adopt distinct mechanical strategies at very high intensities to accommodate reduced time for force application and limb repositioning. Based on the findings it is suggested that training targeting rapid hip-extension mechanics, efficient limb repositioning, and the ability to maintain effective propulsion under shortened contact times may be particularly beneficial.
1. Introduction
Sprinting is important in many different sports such as soccer, athletics, and rugby. To prepare for sprints, many athletes perform runs at varying intensities as part of their preparation for maximal sprint efforts [1,2,3,4]. Much is known about the physiological adaptations that occur with increasing sprint intensity, such as elevated heart rate and higher ratings of perceived exertion. Furthermore, improved psychological readiness, defined as a subjective physical and psychological state that reflects an athlete’s preparedness to undertake a maximal sprint effort, has also been reported with increasing sprint intensity [5,6]. However, little is known about the kinematic changes that occur at different sprint intensities, specifically, whether increases in intensity are primarily achieved through changes in step length, step frequency, or both, and how these changes are produced by joint kinematics.
Sprinting consists of an acceleration, maximal velocity and deceleration phase [7]. Many studies have investigated what changes with increasing sprint performance during the acceleration phase [8,9,10] and found that the hip and ankle represent key sources of positive work during the stance phase of maximum acceleration sprinting [11]. Furthermore, larger knee extension and plantar-flexion velocity result in larger propulsion [12]. During the maximal-velocity phase, there is a greater equilibrium between propulsion and friction forces [13] and vertical forces are more important in this phase [14]. Nevertheless, little is known about the spatiotemporal and joint-kinematic parameters during the maximal-velocity phase at different sprint intensities.
In running, increasing velocity is associated with decreased contact time and increased flight time, step frequency, and step length [6,15]. However, Castro et al. [6] and Roche-Seruendo et al. [15] examined running velocities up to only 5.5 m/s, which do not reflect true sprinting. Dorn and colleagues [16,17] found that increases in steady-state running velocity below 7 m/s are achieved through increases in both step frequency and step length, whereas above 7 m/s, further increases in velocity are achieved primarily through increases in step frequency. Similar findings have been reported in treadmill sprinting [18].
However, the mechanisms underlying changes in spatiotemporal parameters with increasing sprint velocity remain unclear. Weyand et al. [18] concluded that higher peak velocities are achieved not by repositioning the limbs more rapidly in the air, but by applying greater support forces to the ground, while the sprints were performed on a treadmill. Yet, they did not measure joint kinematics, leaving open the question of which joint movements contribute to these greater support forces. During maximal 30 m sprints, Struzik et al. [19] found that a full range of dorsiflexion–plantar-flexion motion may be beneficial due to its contribution to elastic energy use during the stride cycle. Martín-Fuentes and Van den Tillaar [20] reported that faster sprinters exhibit higher plantar-flexion velocities than slower sprinters during the maximal-velocity phase. These changes resulted in higher leg and joint stiffness [21], especially during the maximal-velocity phase [22,23,24], which is related to faster sprinting performance [22,24]. However, these studies did not compare different sprint intensities within athletes, nor did they analyze other sagittal-plane joint movements that could help explain how higher sprinting velocities are produced.
Therefore, the purpose of the present study was to investigate the effect of sprint intensity on step kinematics during the maximal-velocity phase in experienced sprinters. It was hypothesized that increasing sprint intensity would decrease contact time while increasing step frequency and step length [6,15], and that these changes would be associated with higher plantar-flexion velocity and reduced dorsiflexion [21,25], together with greater ranges of motion at the ankle, knee, and hip [26], and higher angular hip and knee flexion and extension velocity movements to enhance horizontal propulsion. This information will provide coaches, researchers, and athletes with insight into which joint movements are most important for increasing sprinting velocity and how these can be targeted in training.
2. Materials and Methods
A repeated-measures design was performed to investigate the effect of sprinting intensity on spatiotemporal and joint kinematics during the maximal-velocity phase (velocity plateau) at sprinting intensities varying from around 60 to 100% of participant’s self-estimated maximal sprinting velocity/effort. Dependent variables were the average step-by-step spatiotemporal variables (step velocity, length and frequency, contact and flight times) together with the joint kinematics (joint angles at touchdown, toe-off, maximal joint angles and angular velocities of ankle, knee and hip joint around sagittal axis), whereas independent variables were sprinting intensity/effort.
2.1. Subjects
A priori power analysis using G*Power (v3.1.9.6, Heinrich Heine University Dusseldorf, Germany) for a repeated measures ANOVA (α = 0.05; power = 0.80; f = 0.25; correlation: 0.7) based on a previous study of Tillaar et al. [5] indicated a required total sample of 10. Twenty participants (18 men and 2 women, age: 38.2 ± 12.1 yrs., height: 1.80 ± 0.06 m, body mass: 81.8 ± 8.8 kg, 100 m PB: 12.65 ± 1.06) participated in the present study. All participants were experienced athletes, and some were competing at international master athletics championships. Master athletes were primarily recruited because of their extensive experience performing sprints at different intensities. Written informed consent was obtained from all participants. The study was approved by the University of Canberra Ethics Committee (HREC-1772) and complied with the current ethical standards in sports and exercise science research and the latest revision of the Helsinki Declaration.
2.2. Procedures
Each participant was asked to avoid heavy resistance or sprint training for 24 h prior to the test session and to maintain the same routine in the 24 h period prior to the test. The test was conducted on an indoor tartan running track (75 m in length) with a temperature of 23–25 °C. The test session consisted of nine 50 m sprints with ~3 min rest in between as part of a warm-up strategy. During the rest, subjects completed a dynamic mobility exercise. The first 50 m was performed at a self-estimated intensity of around 60% of estimated maximal sprinting intensity, according to the instruction to sprint at around 60% of your maximal intensity/effort [5]. Following this, each subsequent 50 m intensity was increased by 5% until it reached 95% of maximal self-estimated intensity on the 8th repetition ending with a 50 m sprint at full intensity at the ninth sprint. In each rest period, one of the seven dynamic exercises for the shoulders (arm swing), hip (internal/external, hip rotations, extension/flexion and abduction/adduction), knee (rotations), and ankle joints (joint rotations) were administered by the research leader in accordance with prior protocols by van den Tillaar et al. [4] and for further details. These dynamic exercises were performed ten times each to increase the range of motion in each joint and to avoid the heart rate decreasing greatly in this period. Most of the participants did not have any previous experience with this exact warm-up protocol, but almost all participants were familiar with warm-up sprints with increasing intensity as part of their warm-up for competitions, and participants were allowed to wear their spikes during each sprint. Tillaar et al. [5] showed that athletes from this level were pretty accurate in estimating their sprinting intensity.
2.3. Measurements
Each 50 m sprint intensity was measured by two pairs of double-beam electronic photocell timing gates (Swift Performance Equipment, Wacol, Australia). Each participant started in a 2-point split stance behind a line 0.3 m behind the first beams, which were placed at heights of 92.5 cm (top beam) and 68 cm (bottom beam). The last pairs of beams were placed at the 50 m mark. Time on each sprint was measured.
Step-by-step spatiotemporal parameter (step velocity, length, frequency, contact and flight times) measurements were recorded continuously during each attempt using a CMP3 Distance Sensor laser gun (Noptel Oy, Oulu, Finland), with sampling at 2.56 KHz together with two wireless 16 g inertial measuring units (IMUs): 9 degrees of freedom, and IMUs integrated with a 3-axis gyroscope attached on top of the shoelaces of the spikes of each foot. Sampling rate of the IMU was 1000 Hz with maximal measuring range of 2000°/s ± 3% (Ergotest Technology AS, Langesund, Norway). All recordings of the IMUs and the laser were synchronized with the MUSCLAB software v10.57 (Ergotest Technology AS, Langesund, Norway). By attaching two IMUs on top of the shoes at the metatarsal II-IV, it was possible to identify touchdown and toe-off events (contact time) for each step based on the pattern of angular velocity of ankle plantar-flexion/extension together with acceleration data from the IMUs, which showed at maximal velocity a very strong positive correlation (r > 0.92) compared with force plates [27]. Flight time was calculated (toe-off to touchdown with same foot) together with the step frequency per stride. Step length was based on the distance of the COM traveled for each step, which was measured with the laser gun together with the step velocity per step.
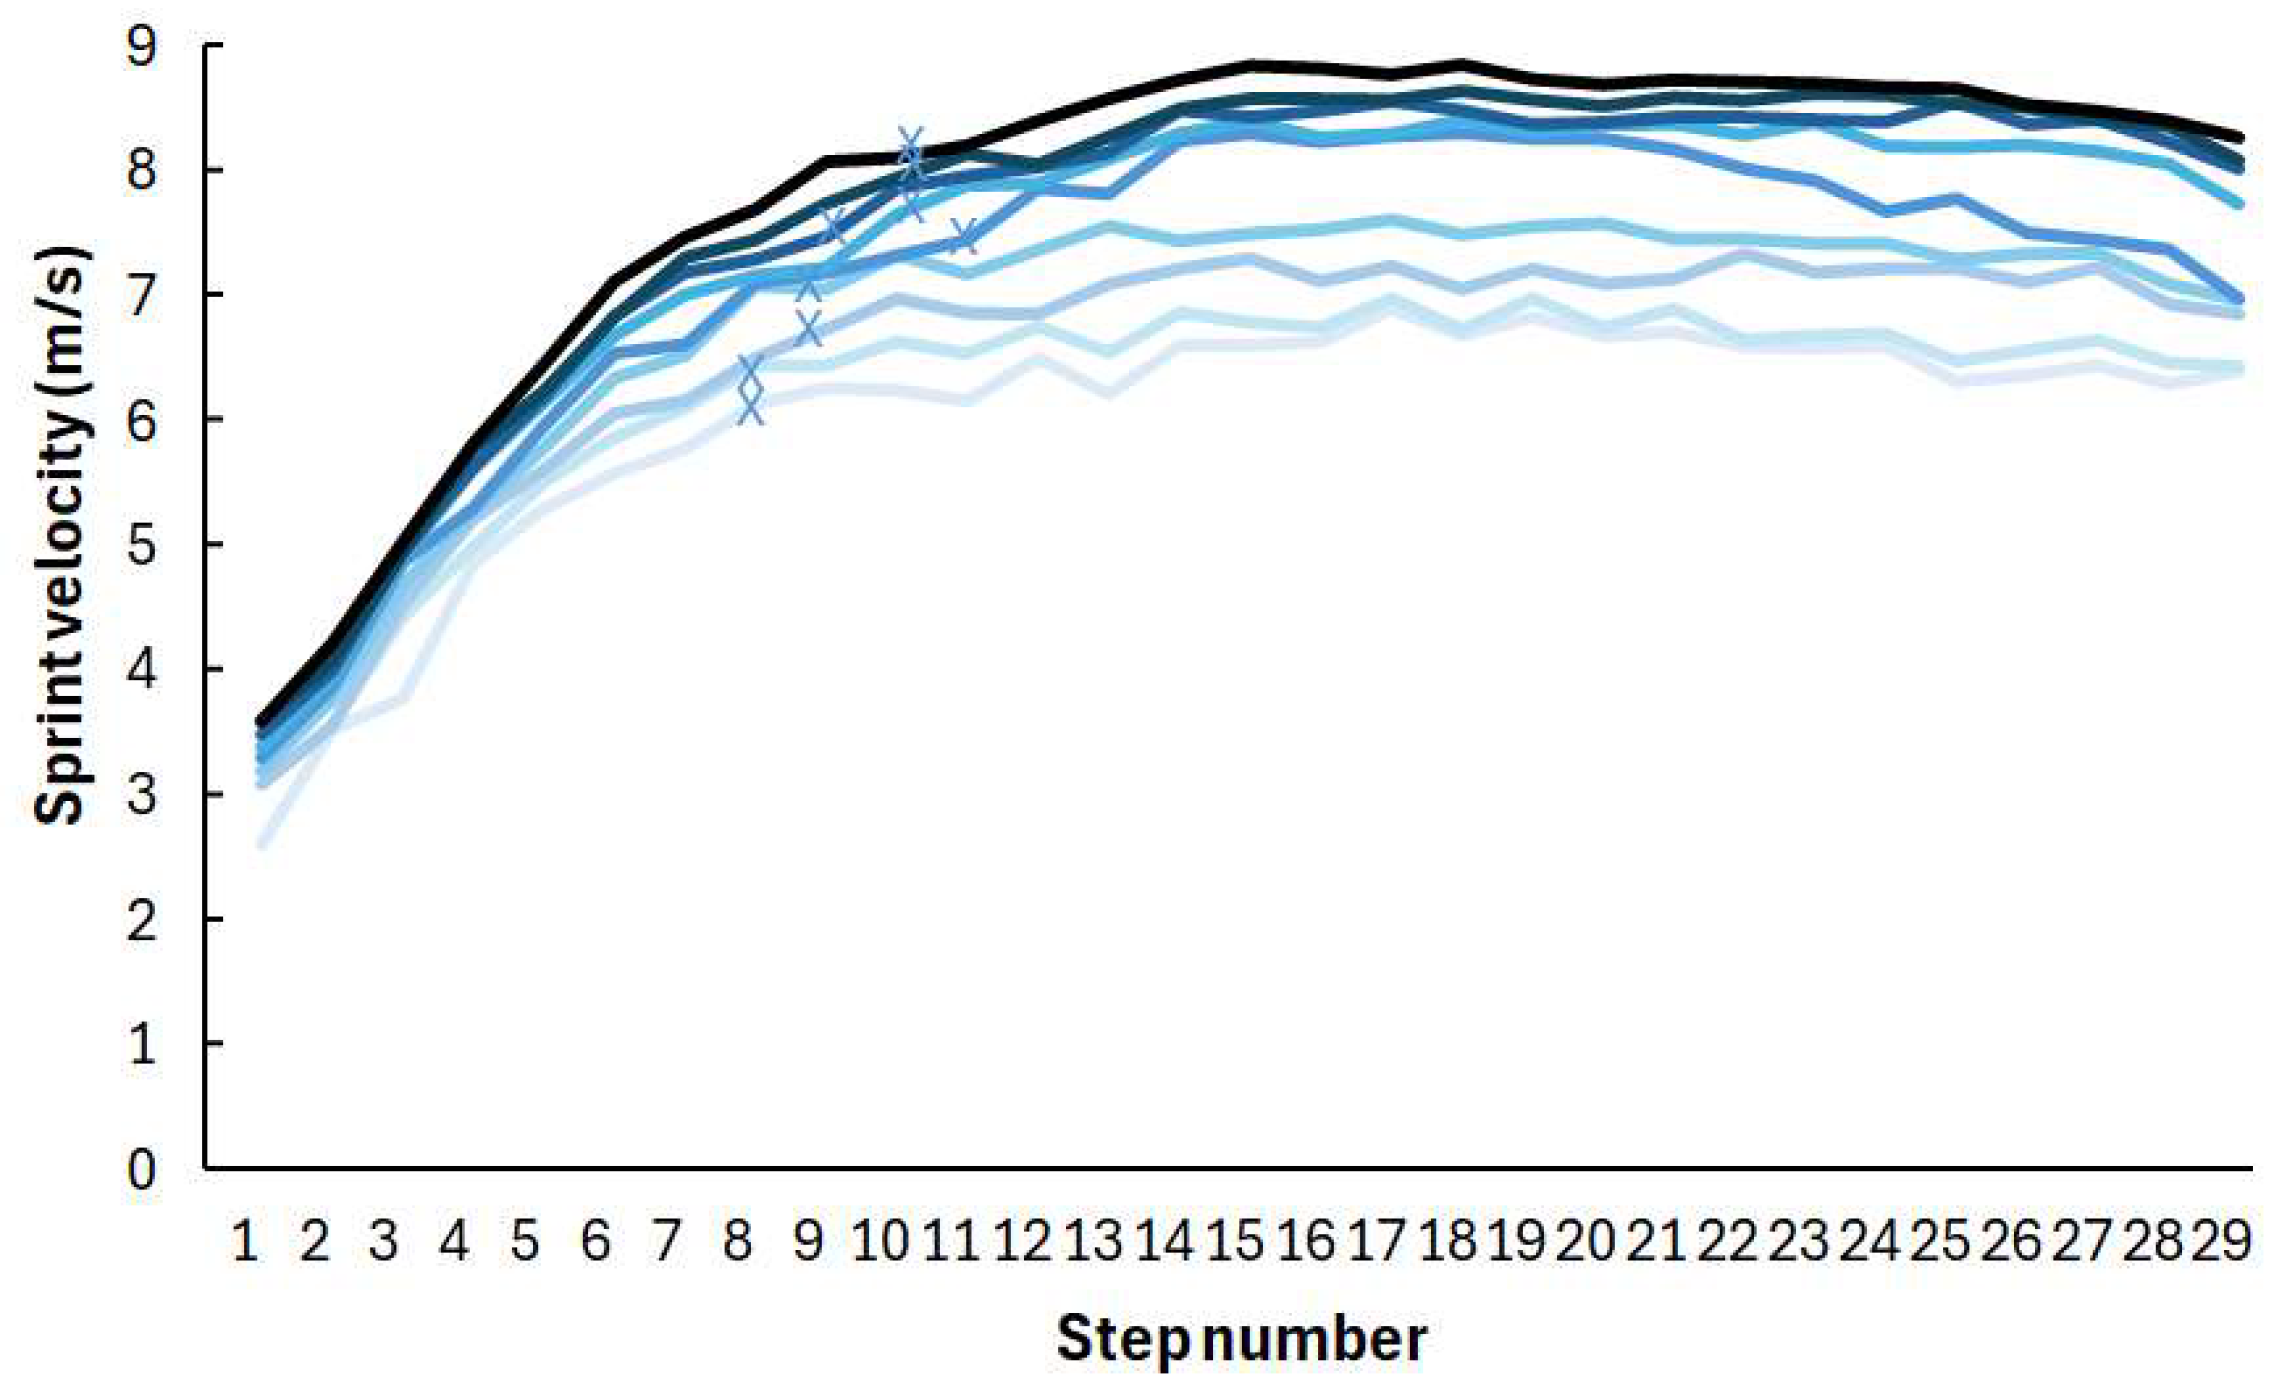
To measure joint kinematics per step, each participant wore an Xsens lycra suit (Movella, Enschede, The Netherlands), which consisted of 17 IMUs (240 Hz) attached to the athletes’ spikes, shanks, thighs, pelvis, sternum, head, upper arms, forearms, and hands. The IMUs for the feet were fixed by tape over the spikes exactly under the IMUs of the Musclelab system, which allowed both systems to identify touchdown and toe-off events (abrupt dip in angular velocity and increase in acceleration of IMUs [20]) synchronically as both IMUs showed the same signals which could recognize these events [27]. After calibration (posing in N-pose and walking around), the software Xsens MVN v. 2024.2 (Movella, Enschede, The Netherlands) automatically calculated joint angles and joint velocities over time. Absolute joint angles in the sagittal plane (ankle, knee, and hip) at touchdown and toe-off, maximal angles during flight and contact phase (Figure 1) and peak joint angular velocities during these phases were identified per step. The hip angle was defined as the angle between the trunk and thigh, with 0° representing upright standing, while knee angle 0° = full extension. The ankle angle 0° = neutral when the foot was perpendicular to tibia (Figure 1). Sensor fusion for IMU data was performed using the patented algorithms (Xsens Kalman Filter) and filtered using the LXsolver (minimize soft tissue artifact) in MVN Biomech Studio. The measured angles in the sagittal plane by the system showed high concurrent validity and excellent waveform agreement (coefficients of multiple correlation > 0.90) when compared to optical motion capture systems [28,29]. From each sprint, the mean step-by-step spatiotemporal and joint kinematics were calculated from the step at which the participant’s sprint velocity plateaued (>85% of maximal-velocity for that sprint intensity), also called the second breakpoint or transition point [30,31], until the end of the distance, as maximal velocity did not decrease during the remainder of the sprint (Figure 2).
2.4. Statistical Analyses
Normality of data distribution was assessed and confirmed using the Shapiro–Wilk test. To compare the sprint times, and spatiotemporal and joint kinematical parameters between the different intensities, a one-way ANOVA with repeated measures (intensity: 60–100%) was used on these parameters. Post hoc comparisons with Holm–Bonferroni corrections were conducted to locate differences. Where sphericity assumptions were violated, Greenhouse–Geisser adjustments of the p-values were reported. Effect size was evaluated with eta squared (η2) where 0.01 < η2 < 0.06 constituted a small effect, 0.06 < η2 < 0.14 a medium effect, and η2 > 0.14 a large effect [32]. Cohen’s d was used for pairwise comparisons with following interpretation: trivial (<0.2), small (0.2–0.5), moderate (0.5–0.8), and large (≥0.8). The level of significance was set at p < 0.05, and all data are expressed as mean ± standard deviation (SD). Statistical analysis was performed in JASP 0.98 (University of Amsterdam, Amsterdam, The Netherlands).
Figure 1.
Definition of the joint angles of the ankle, knee and hip during the sprints.
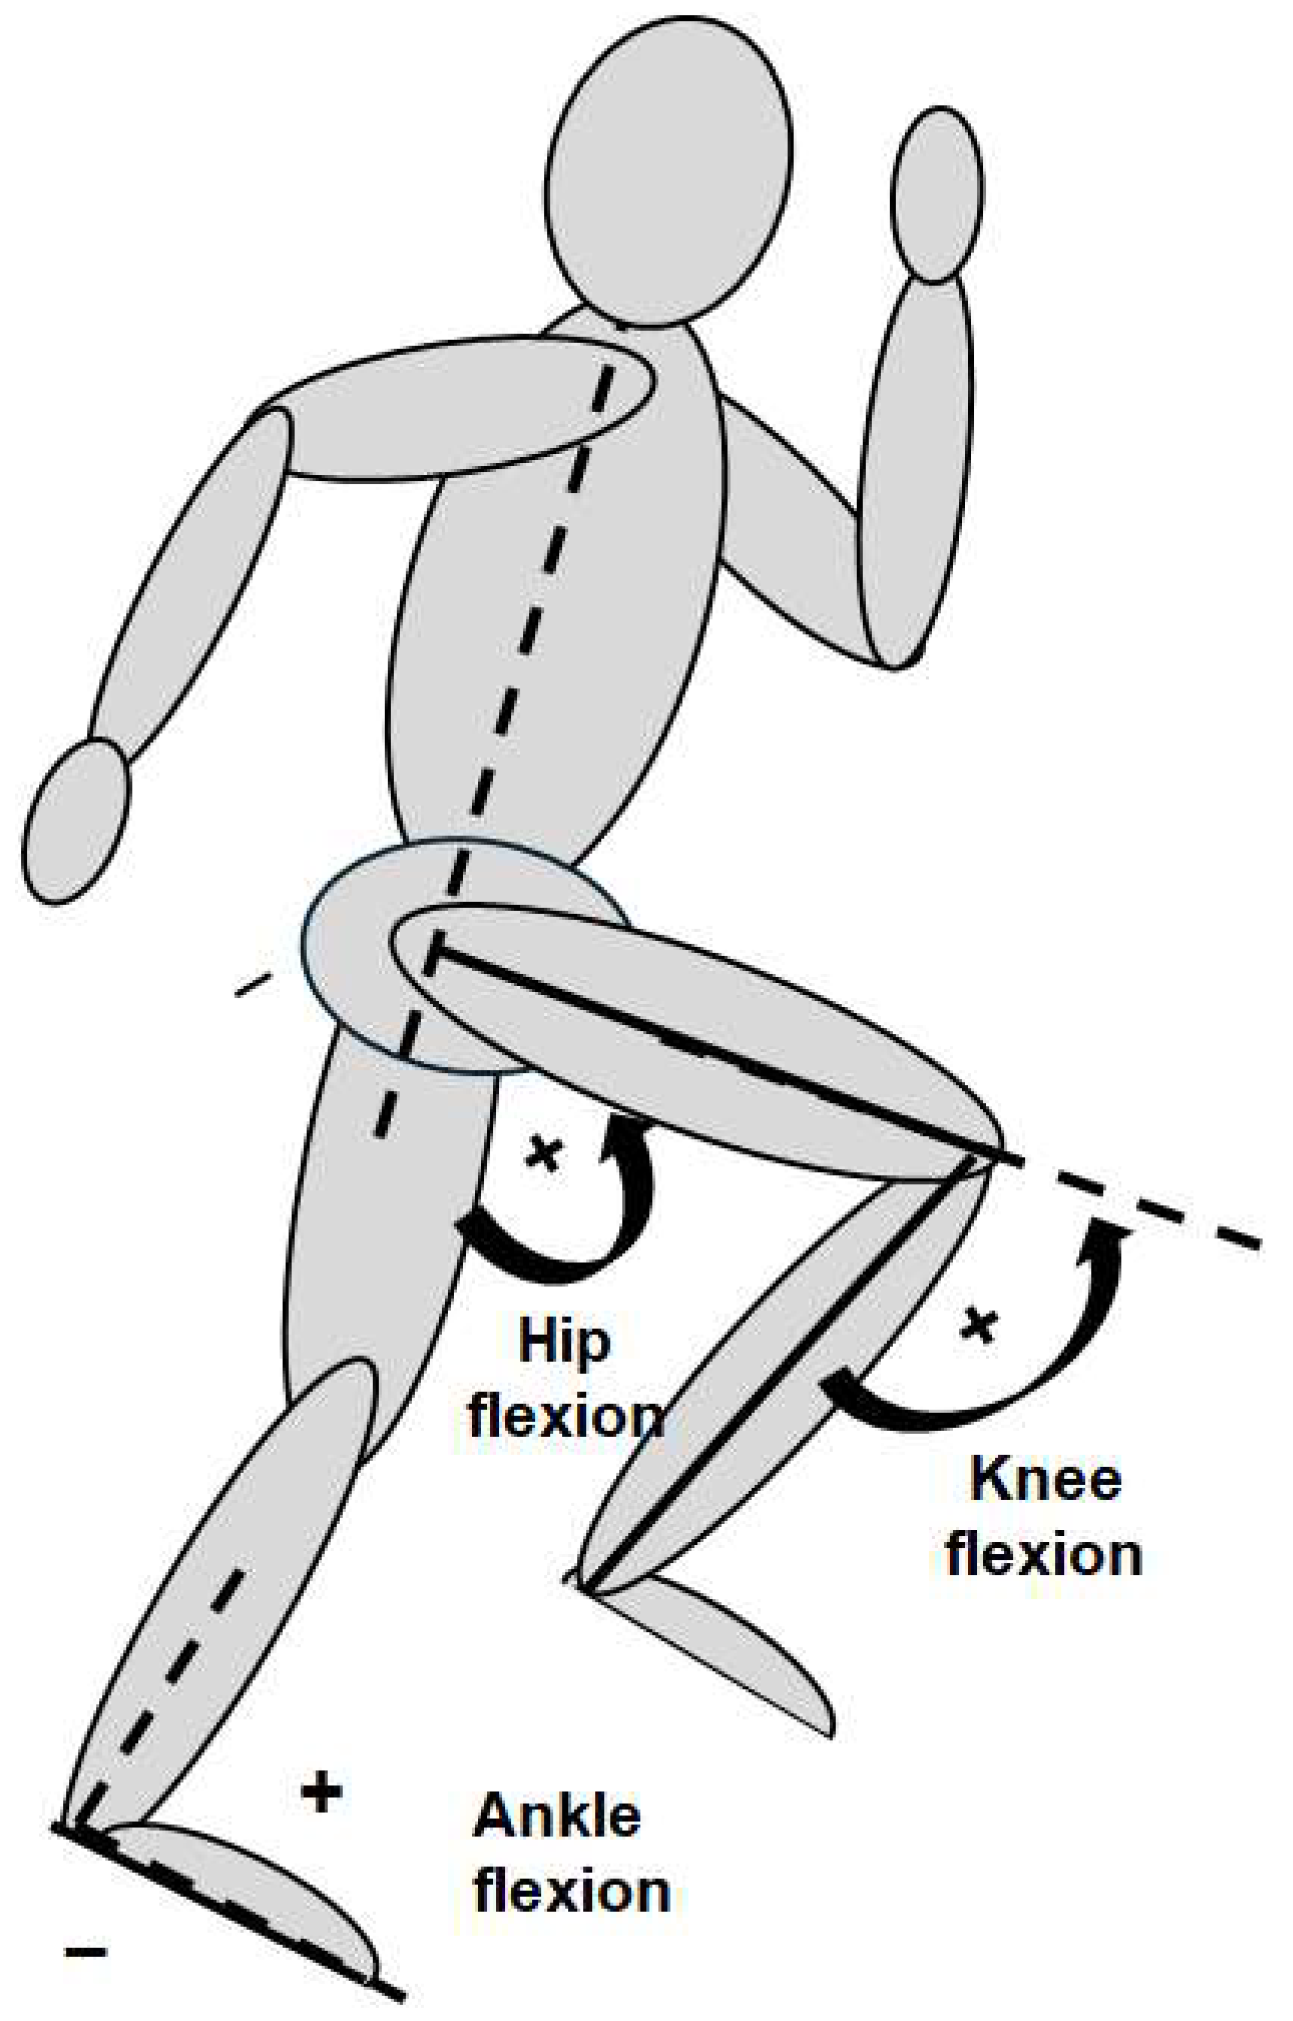
Figure 2.
Typical example of development of sprint velocity per step with >85% step (X) as start of velocity plateau. Darker color means higher perceived intensity.
3. Results
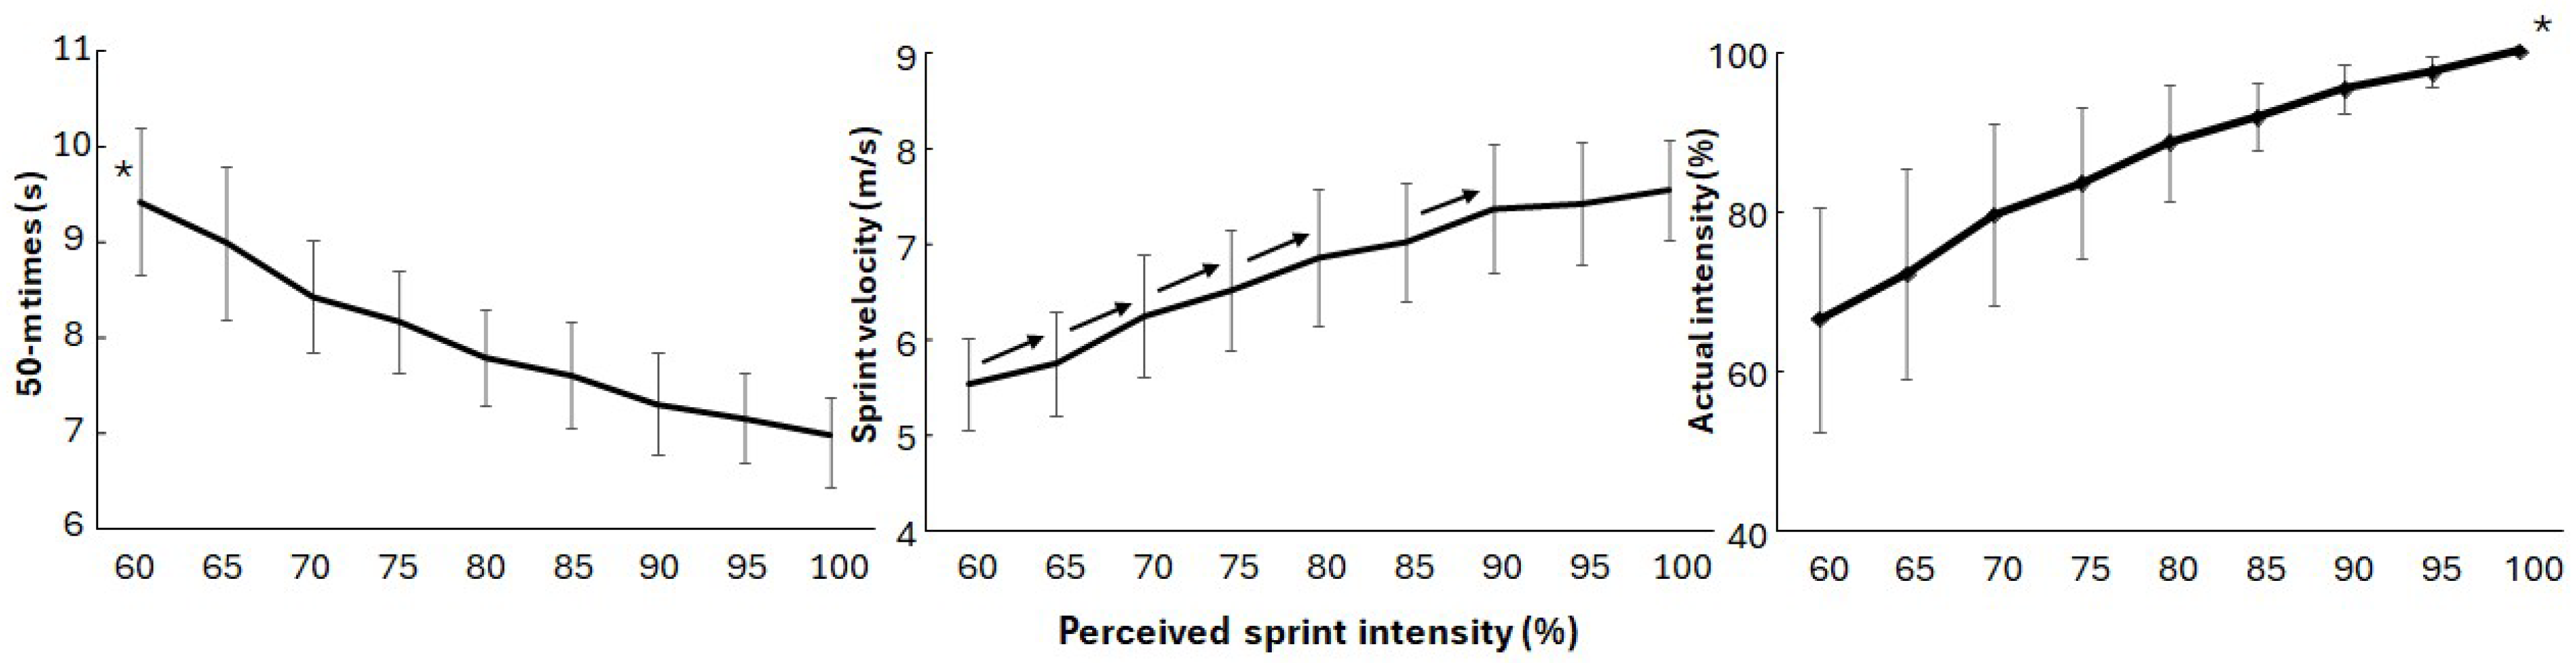
Actual intensity increased, while sprint times decreased significantly with each increase in intensity together with a significant increase in maximal sprint velocity (F ≥ 60.6, p ≤ 0.001, η2 ≥ 0.87, Figure 3). The actual intensity was higher than the perceived intensity (66% vs. 60%) but increased significantly at each successive intensity level. The distance at which the maximal-velocity plateau was reached varied from 8.13 ± 1.73 m (65%) to 9.57 ± 1.21 m (100%) and was significantly affected by intensity (F = 2.61, p = 0.042, η2 = 0.12). However, post hoc comparisons with the Holm–Bonferroni correction revealed no significant difference between the intensities (0.08 ≤ d ≤ 0.97).
Figure 3.
Mean (±SD) sprint times, sprint velocity and actual intensity for each sprint against perceived sprint intensity. → indicates a significant difference between these two intensities and all values to the right of the arrow. * indicates a significant difference between each intensity for this variable.
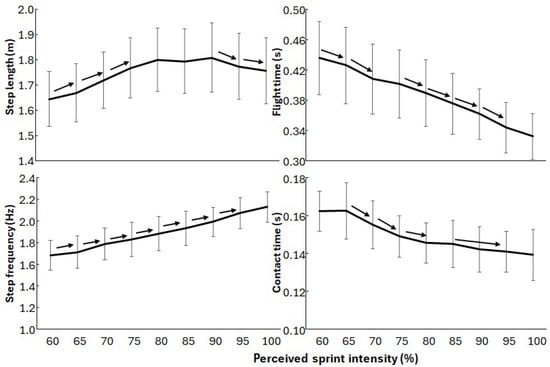
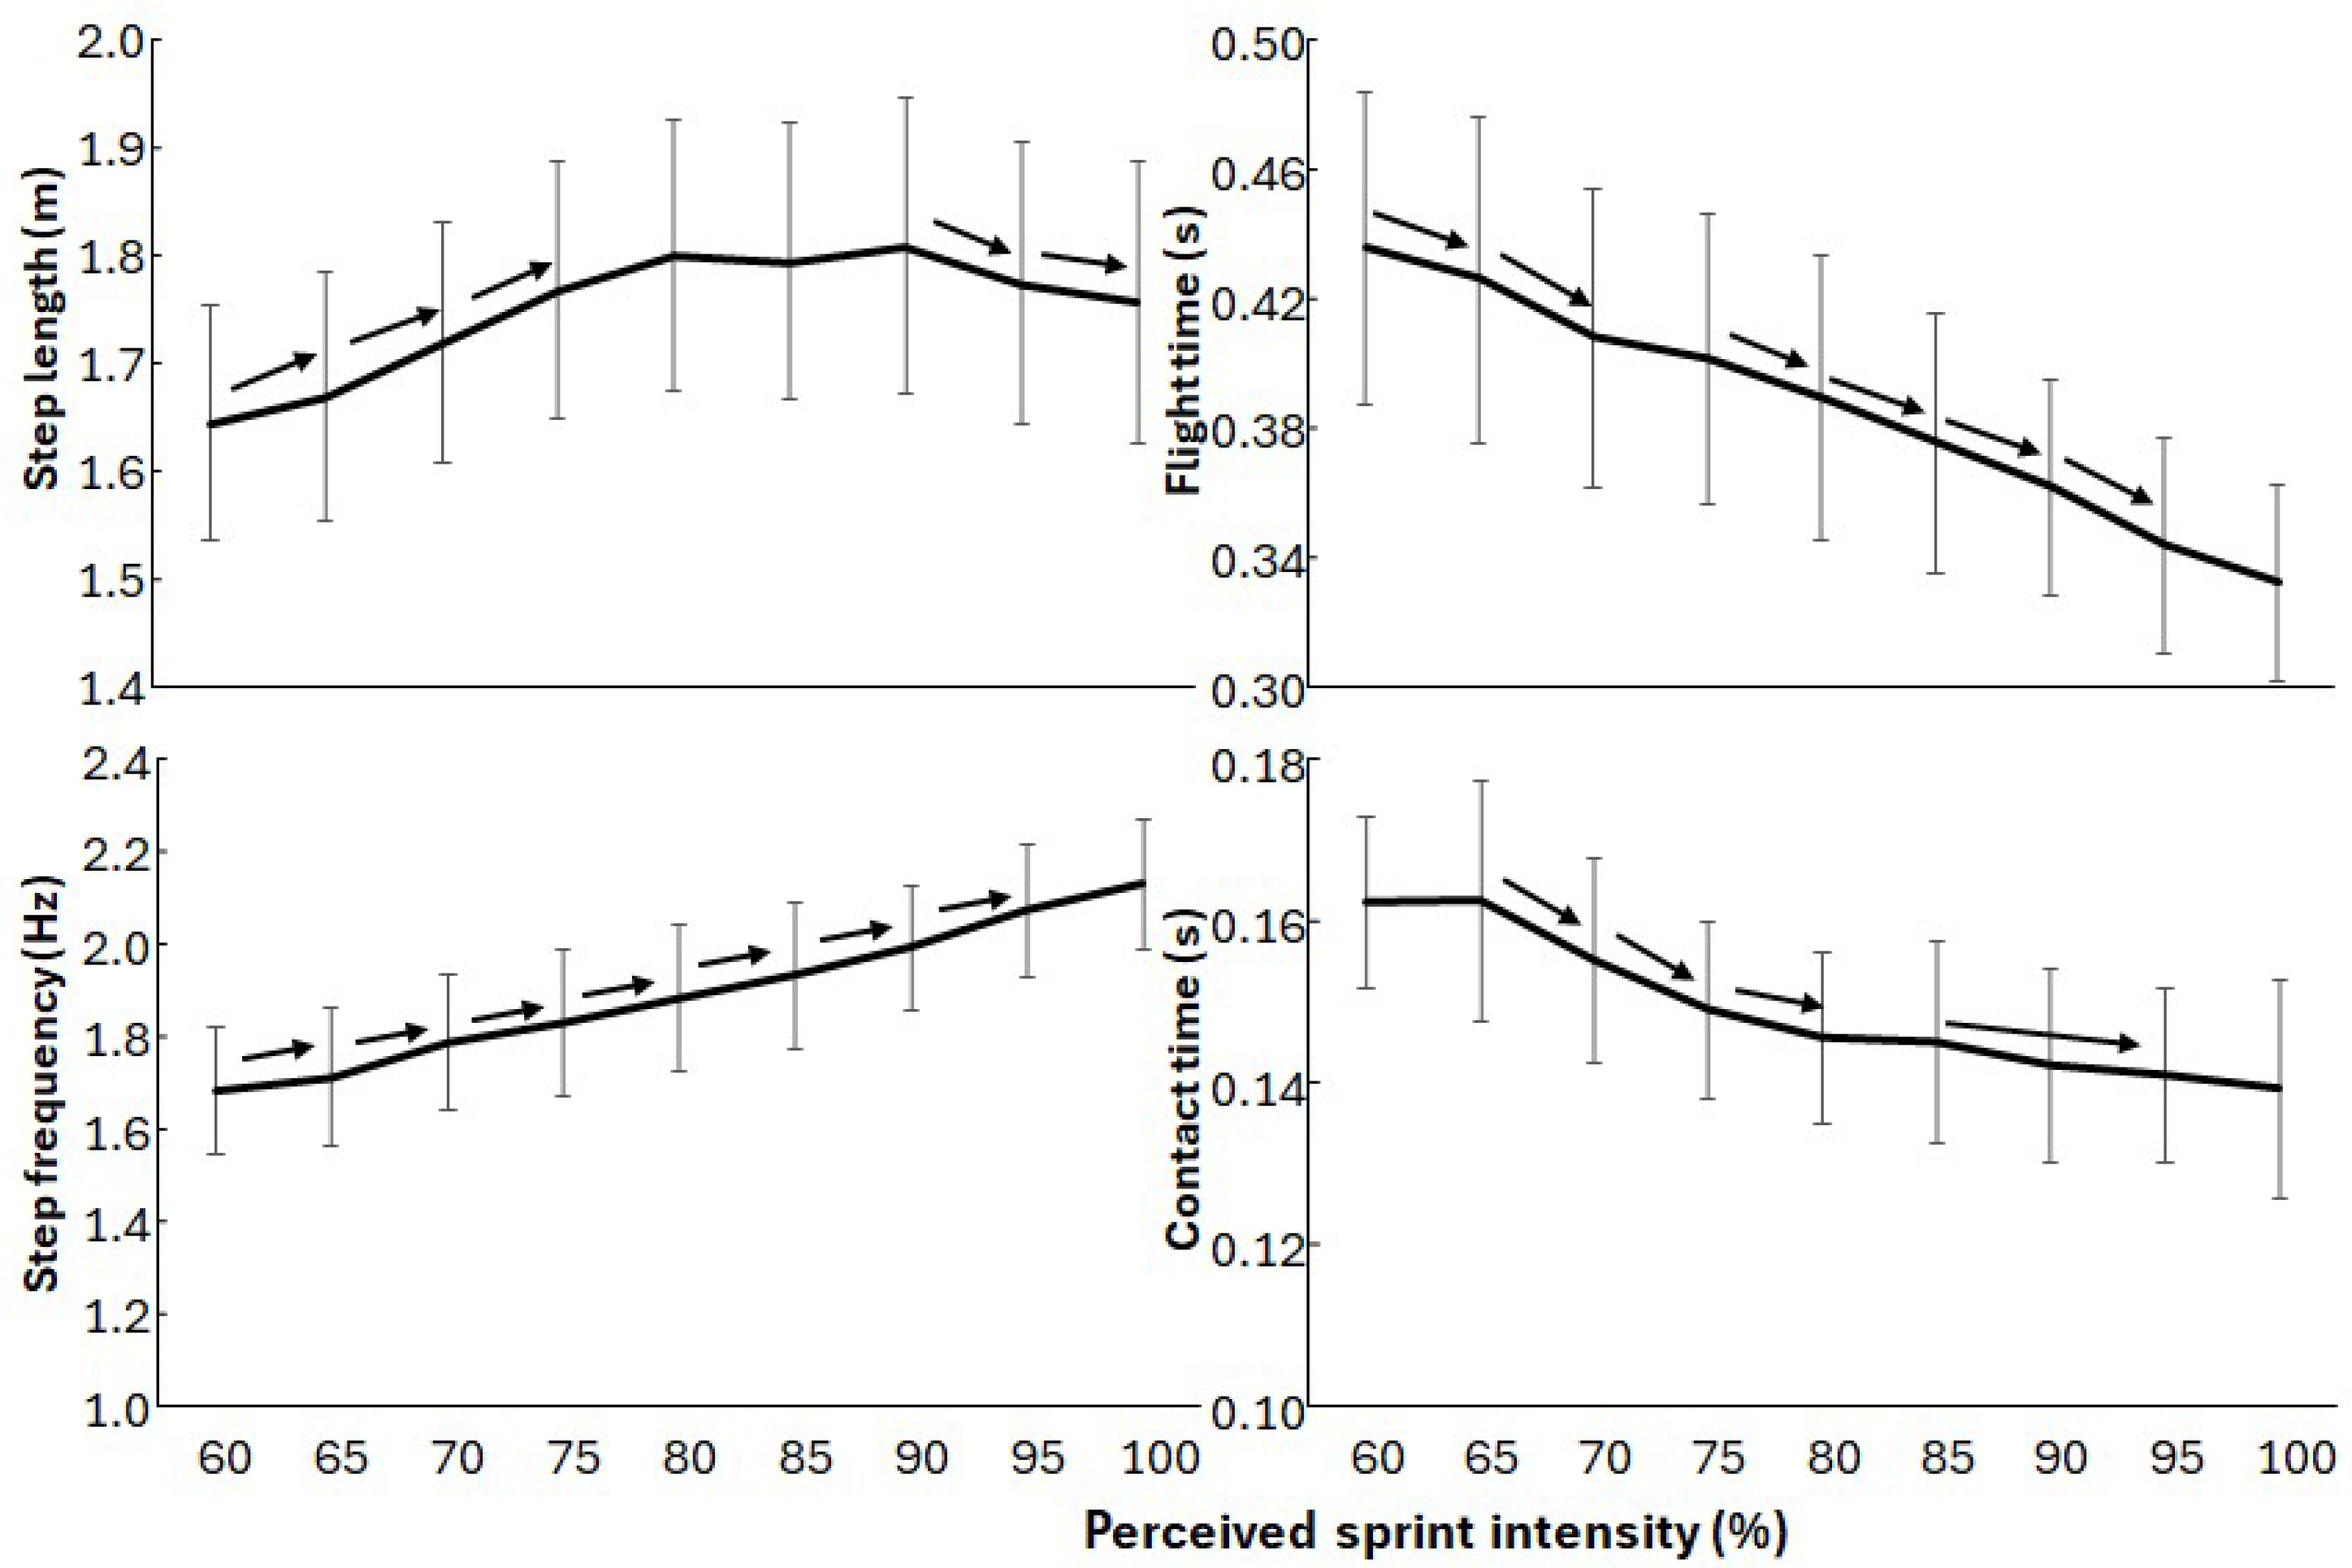
All the studied spatiotemporal parameters were significantly affected by intensity (F ≥ 2.52, p ≤ 0.013, η2 ≥ 0.12). Post hoc comparison showed that both contact and flight time decreased, while step frequency increased with almost every increase in intensity (0.68 ≤ d ≤ 1.86). Step length increased with every intensity from 60 to 75% (d = 0.99) and decreased again from 90% intensity (d = 0.48, Figure 4, Table S1 in Supplementary File).
Figure 4.
Mean (±SD) step length, frequency, contact and flight times for each sprint intensity. → indicates a significant difference between these two intensities and all values to the right of the arrow.
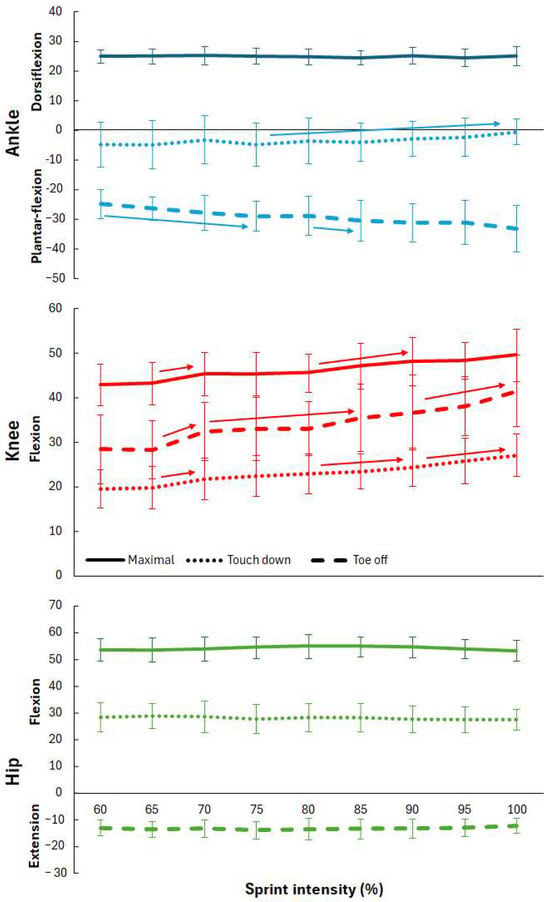
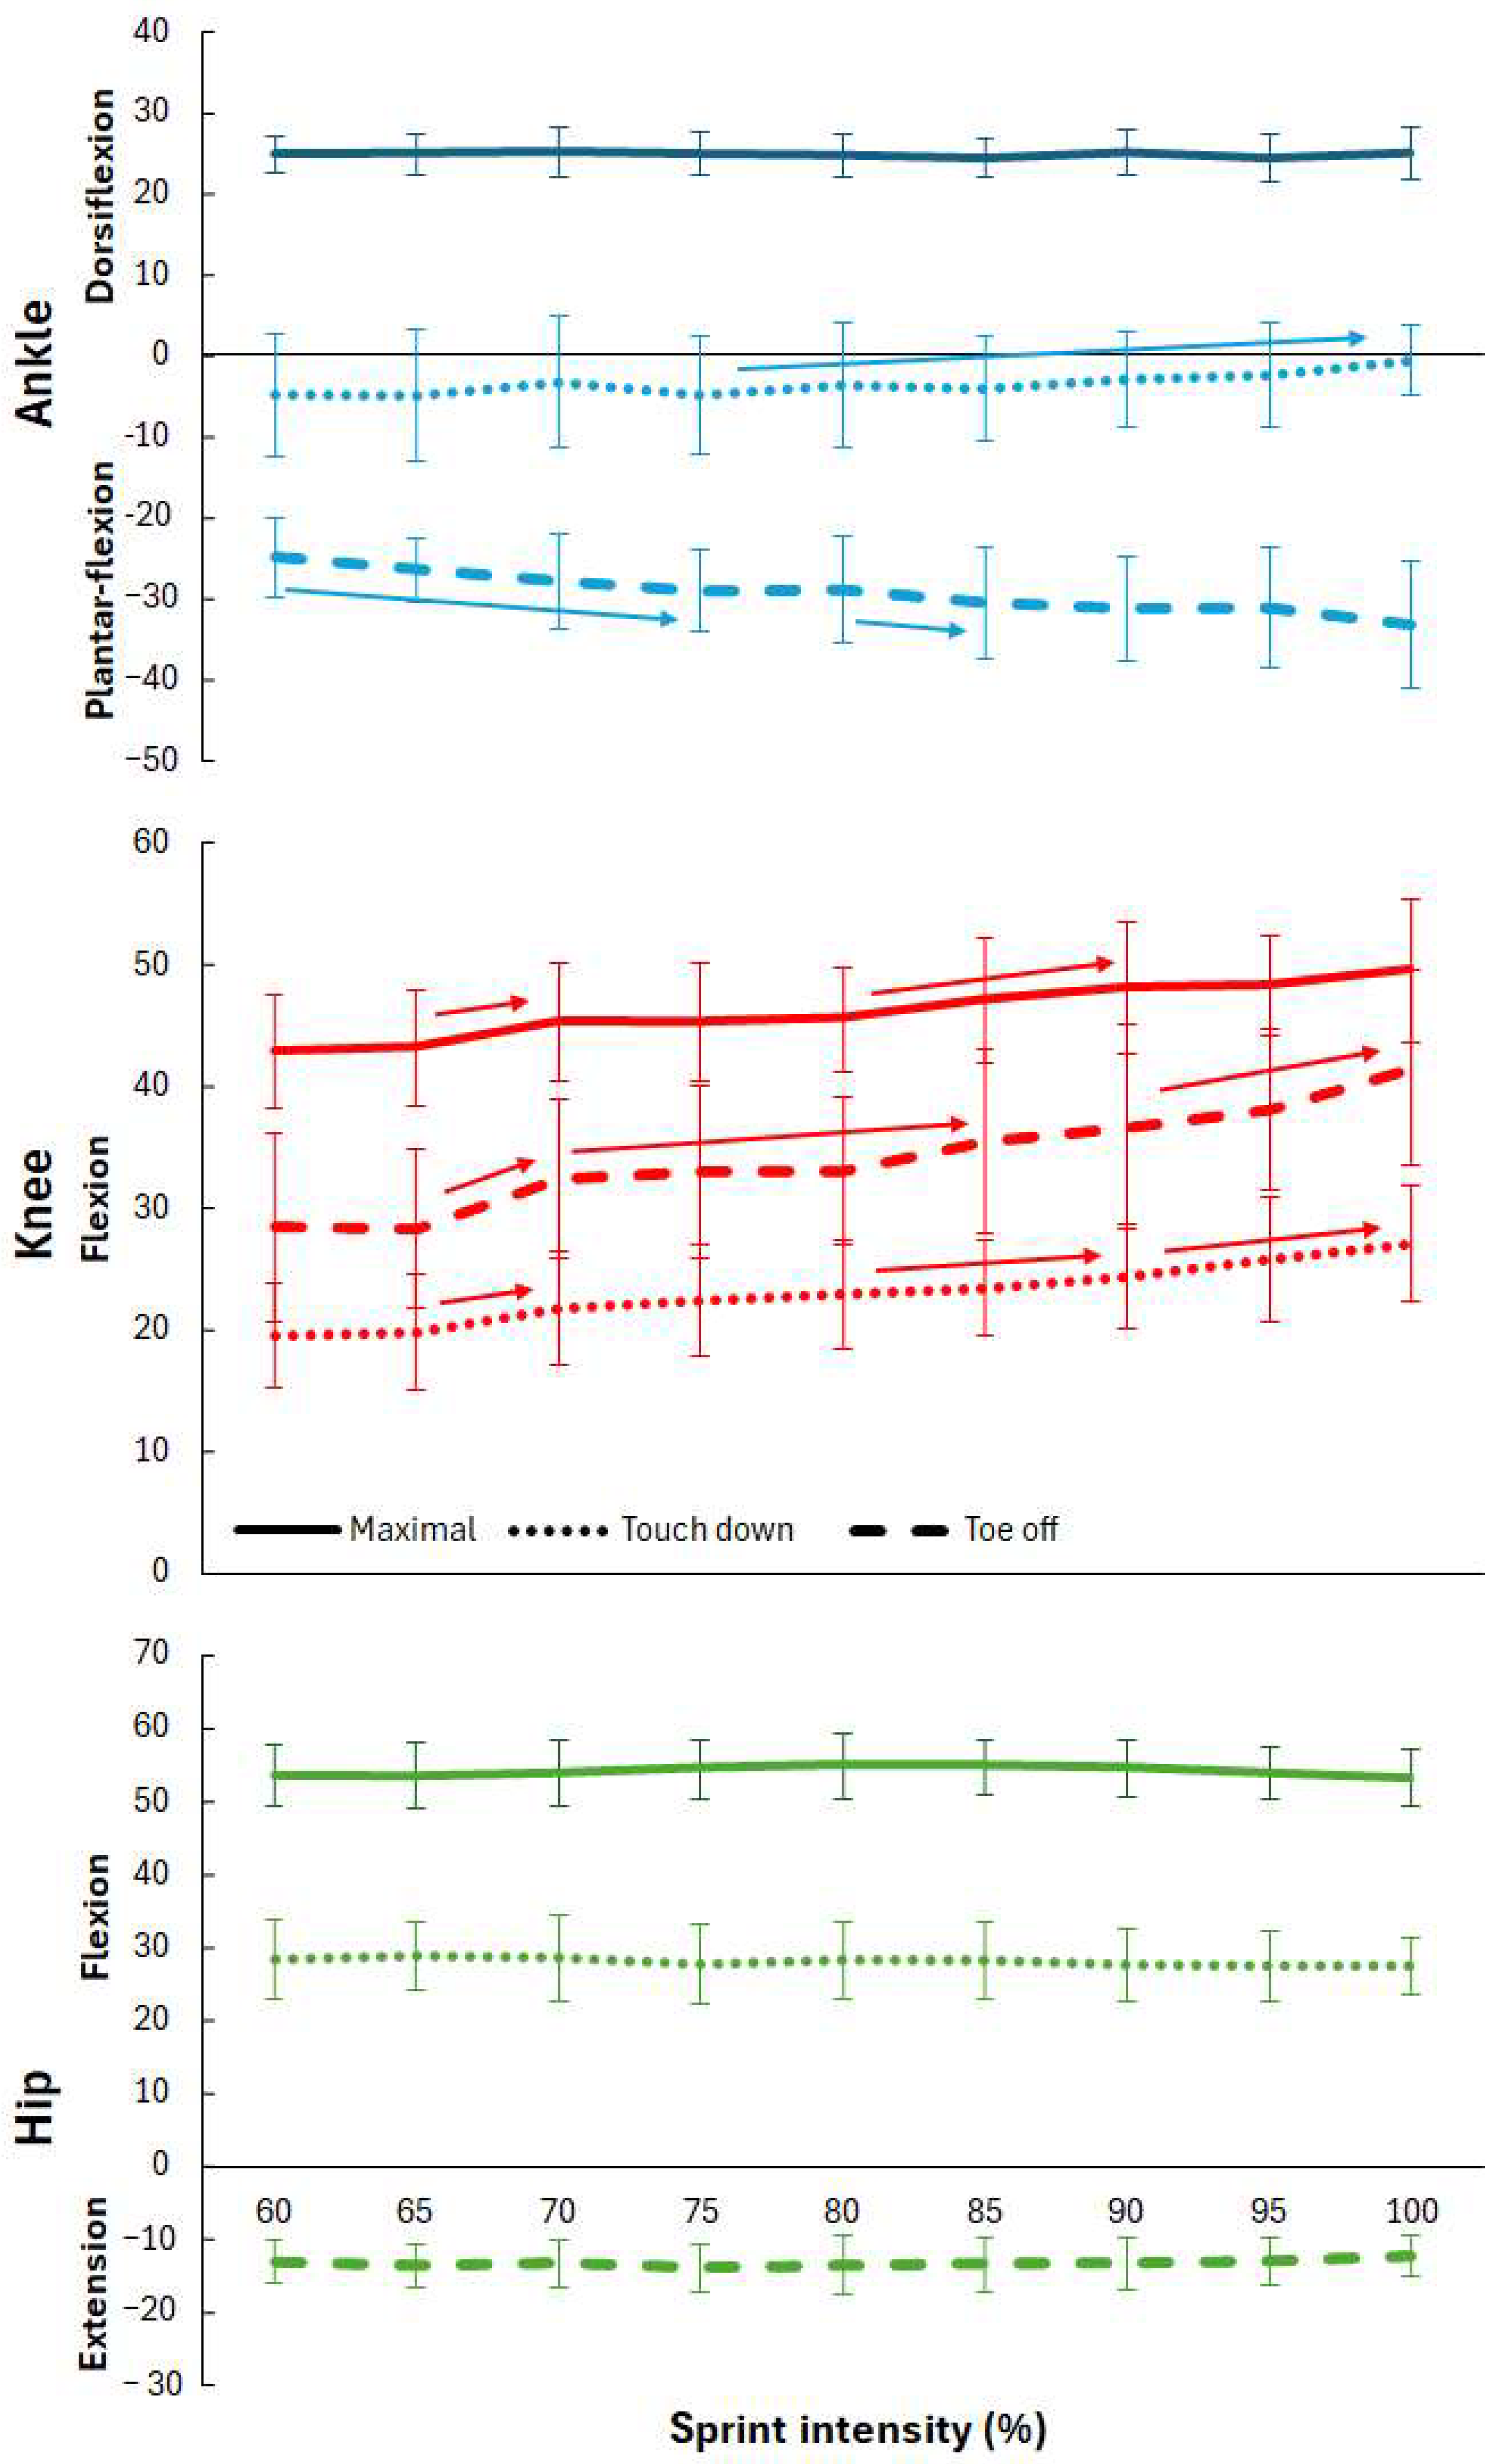
Only knee and ankle joint angles at touchdown and toe-off were significantly affected by sprint intensity (F ≥ 3.8, p ≤ 0.001, η2 ≥ 0.17), while hip angles did not significantly change with sprint intensity (F ≤ 1.2, p ≥ 0.30, η2 ≤ 0.06). Knee flexion angle at touchdown and toe-off and plantar-flexion angle at toe-off increased with increased intensity, while at touchdown plantar-flexion angle decreased (Figure 5). Increasing sprint intensity did not significantly (F ≤ 1.9, p ≥ 0.067, η2 ≤ 0.09) affect the maximal hip flexion (54.2 ± 0.6°) and knee flexion (133.5 ± 1.3°) during the flight phase, and maximal ankle dorsiflexion (24.7 ± 0.3°) during the contact phase. However, during the contact phase, maximal knee flexion angle increased significantly between 65% and 70% (d = 0.33) and between 80% and 90% (d = 0.50) (F = 3.1, p = 0.006, η2 = 0.31, Figure 5, Table S2 in Supplementary File).
Figure 5.
Mean (±SD) joint angles at touchdown and toe-off and maximal joint angles during contact and flight phase for each sprinting intensity. → indicates a significant difference between these two intensities and all values to the right of the arrow.
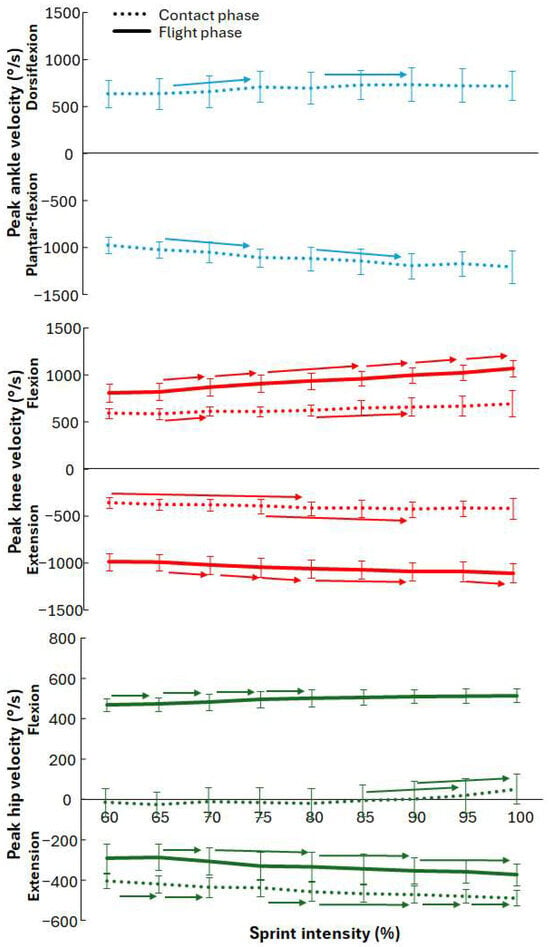
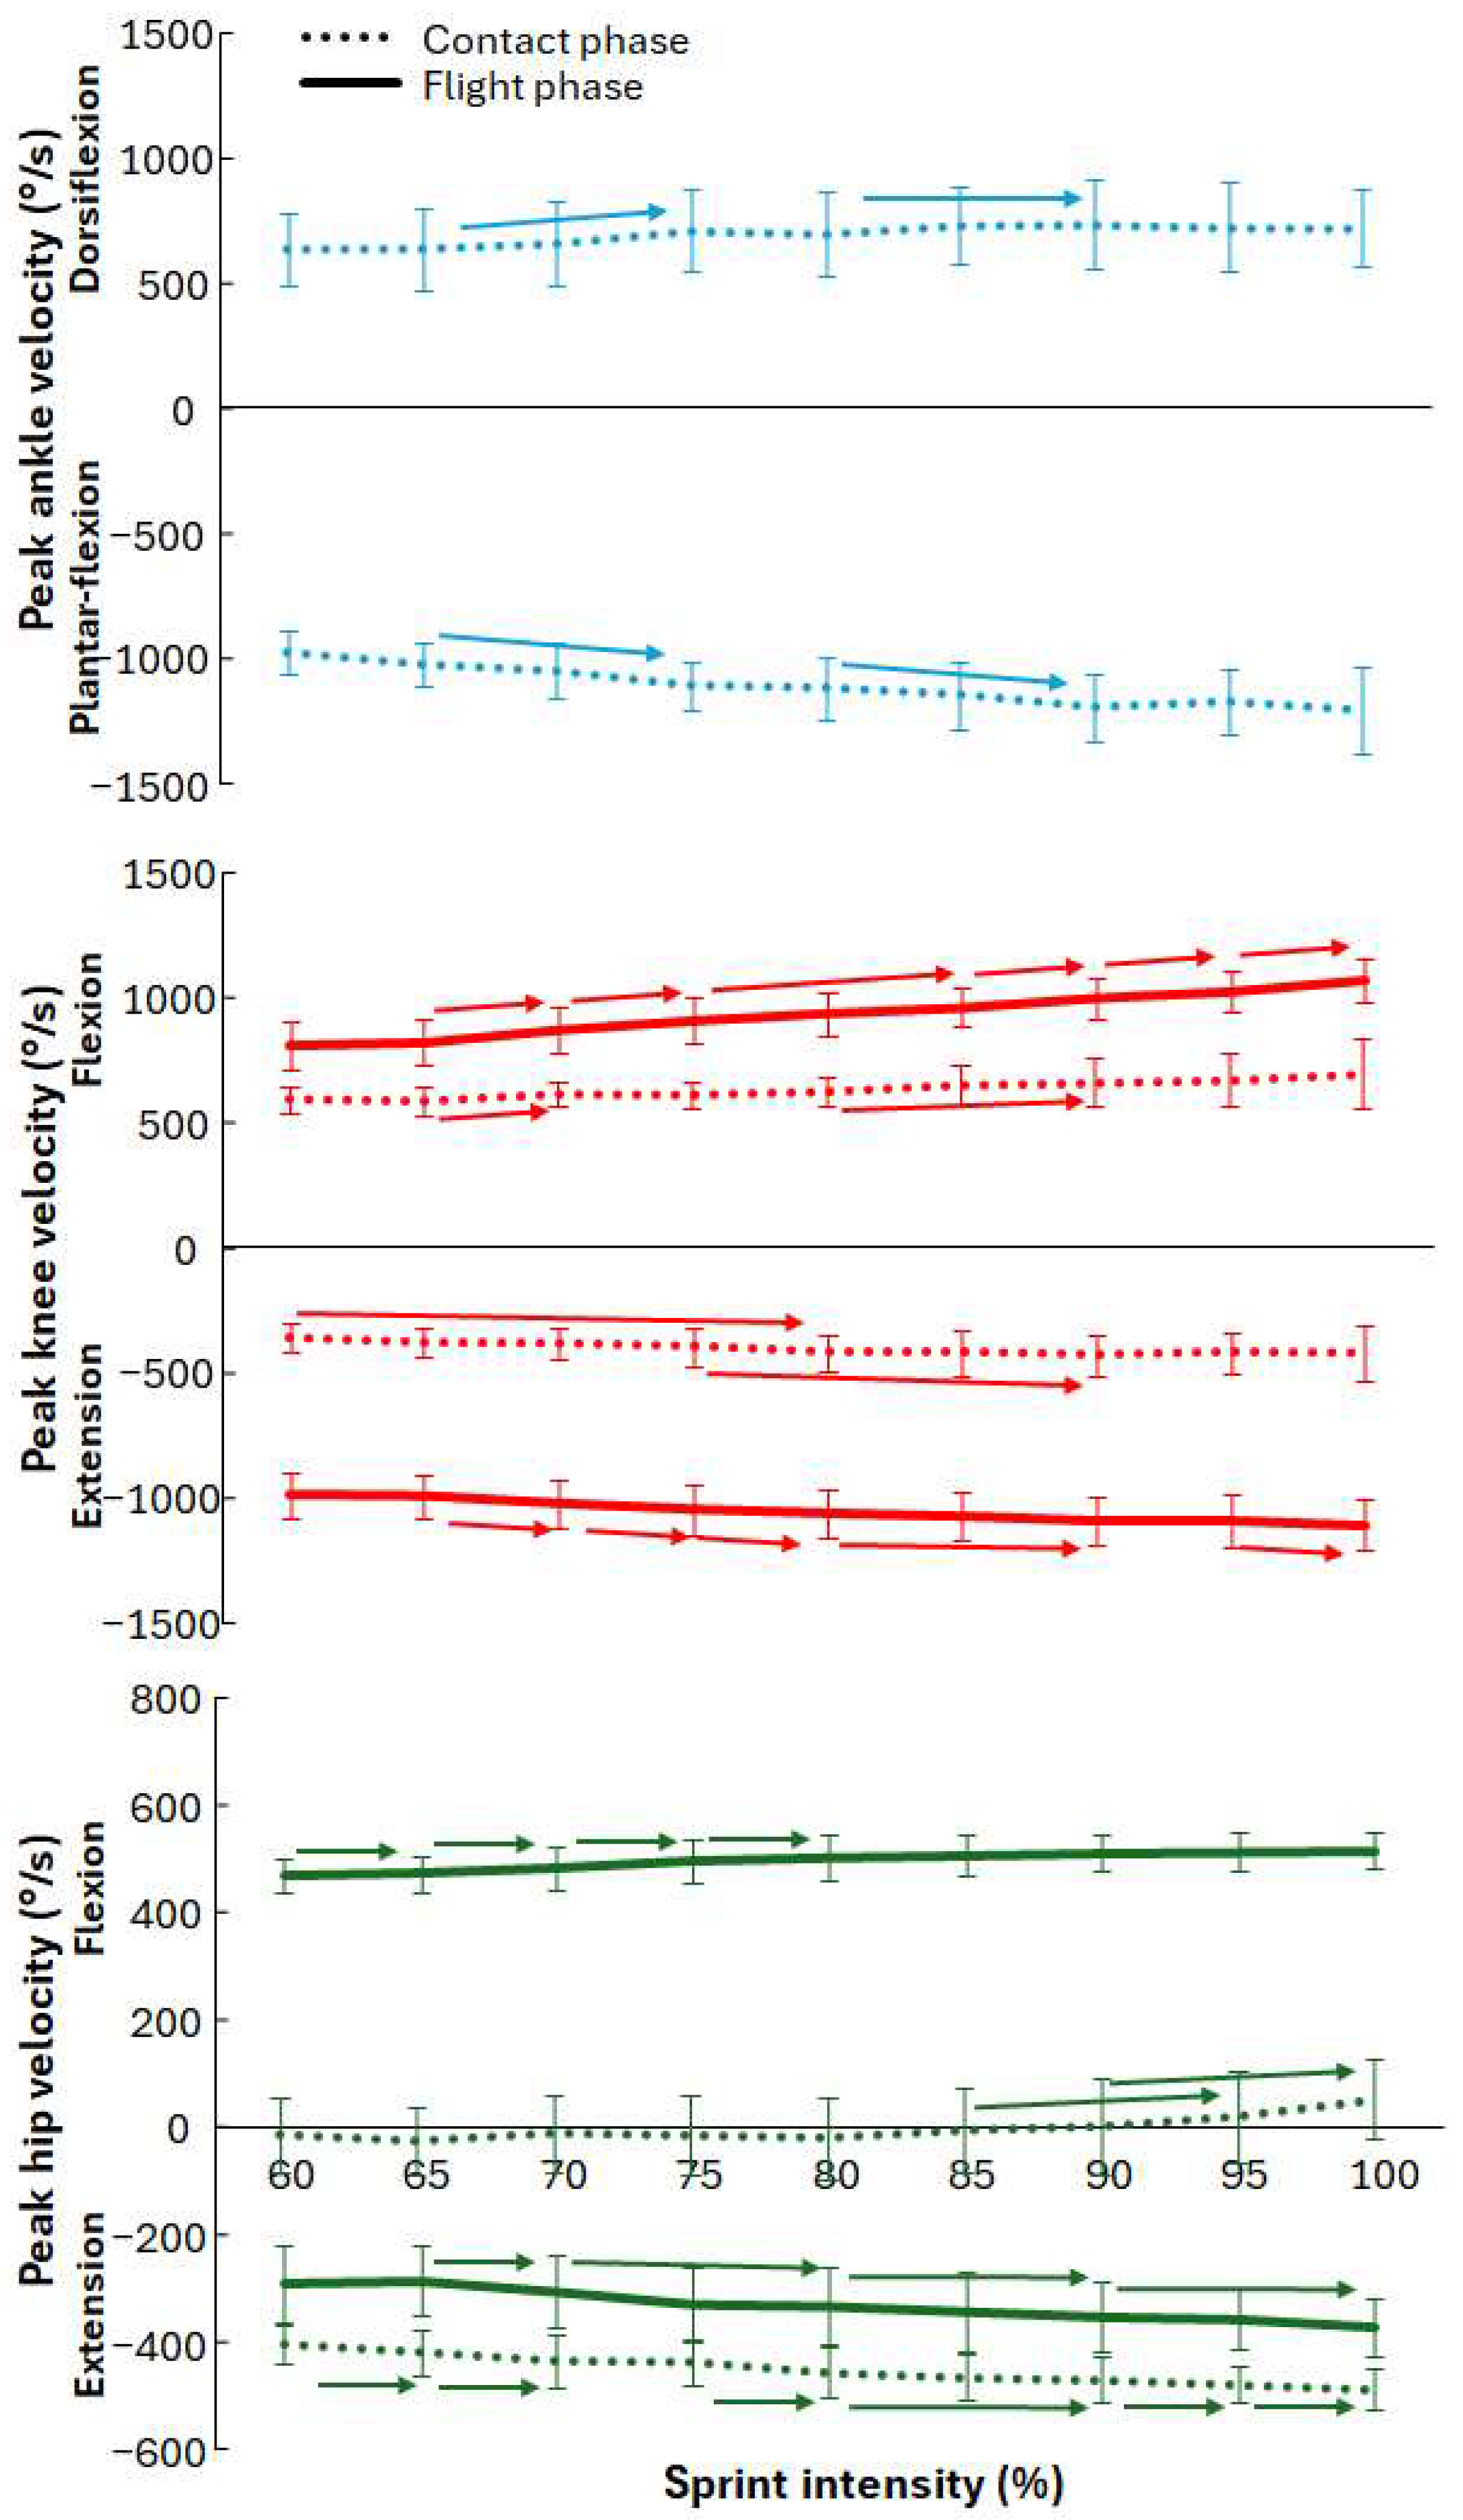
All investigated peak joint angular velocities were significantly affected by sprint intensity (F ≥ 5.96, p ≤ 0.001, ηp2 ≥ 0.34). Post hoc comparisons showed that peak hip-extension velocities during the contact and flight phases and knee flexion and extension velocities during the flight phase increased with almost each increase intensity from 65% onward (0.27 ≤ d ≤ 1.27), while peak dorsiflexion and plantar-flexion velocities only increased between 65 and 75% (d = 0.68) and between 80 and 90% (d = 0.62). Peak hip-flexion velocity during the flight phase only increased significantly with each successive intensity from 60 to 80% (d = 0.96), while during the contact phase, a significant increase was only found from 85 to 95% (d = 0.53) and from 90 to 100% (d = 0.67), where the angular velocity changed from hip-extension motion to hip-flexion motion (Figure 4). During the contact phase, peak knee extension only increased significantly from 60 to 80% (d = 0.73) and between 70 and 90% (d = 0.59), while peak knee flexion increased significantly between 65 and 70% (d = 0.33) and between 80 and 90% (d = 0.40, Figure 6, Table S3 in Supplementary File).
Figure 6.
Mean ± SD maximal angular joint movements during contact and flight phase for each sprinting intensity. → indicates a significant difference between these two intensities and all values to the right of the arrow.
4. Discussion
This study investigated the effect of sprint intensity on spatiotemporal and joint kinematics during the maximal-velocity phase across intensities ranging from 60 to 100% in experienced sprinters. The main findings were that sprint times decreased significantly with each increase in intensity, accompanied by a significant increase in maximal sprint velocity. Contact and flight times decreased, step frequency increased, and step length increased up to 75% intensity before decreasing again at intensities above 90%. Joint angles at the ankle and knee changed with intensity at touchdown and toe-off, whereas hip joint angles did not. All peak step-by-step angular joint velocities during the maximal-velocity phase increased with increasing sprint intensity, although the intensities at which these increases occurred varied.
With each increase in sprint intensity, sprint time decreased (Figure 2). However, at the two highest intensities, maximal sprint velocity during the maximal-velocity phase did not increase further. This observation was probably the result of some participants reaching their individual maximal-velocity at lower intensities, and the reduced 50 m times observed at higher intensities being primarily the result of greater acceleration rather than increases in peak velocity.
Although maximal velocity did not increase at the highest intensities, spatiotemporal parameters continued to change. Both contact and flight times decreased with increasing intensity, resulting in higher step frequencies, thereby confirming the hypothesis and being consistent with previous findings [14,18,33]. More surprising was the pattern of step length: it increased initially but decreased at the highest intensities, which did not agree with the hypothesis. Step length was expected to increase with intensity due to greater propulsive effort, which occurred up to 75%, after which it plateaued until 90%. At the highest two intensities, the average step length then decreased. This reduction may be explained by the need for faster joint repositioning at high intensities. Shorter flight times reduce the time available for full limb extension, causing the foot to contact the ground earlier and limiting the use of the full propulsive range. Supporting this interpretation, knee flexion angles at touchdown and toe-off were higher at 100% compared with 90%, and the plantar-flexion angle was reduced (Figure 3).
Another indication of altered mechanics at the highest intensities is the shift from minimal hip-extension velocity to a hip-flexion velocity during the early contact phase at intensities above 90% (Figure 4). This suggests that the center of mass may be moving downward more rapidly, contributing to a larger knee flexion angle during stance. This pattern contrasts with the concept of leg stiffness, where the leg deforms minimally and recoils quickly to maximize forward propulsion [22,23,24,34,35]. However, maximal hip-extension velocity later in stance increased substantially, suggesting a strong recoil-like action (Figure 4). At the highest intensities, little additional recoil appeared to originate from ankle or knee stiffness, as their maximal angular velocities did not increase further, thereby rejecting the hypothesis at the highest intensities. In contrast, at intensities up to 90%, increases in maximal angular velocity at these joints were evident (Figure 4). This suggests that hip-extension angular velocity during stance could be the most important contributor to horizontal propulsion, as this increases with almost every intensity. This is not surprising as the hip joint has the longest lever for creating propulsion [11,33]. However, kinetic analyses are needed to confirm this statement.
During the flight phase, increased sprint intensity requires faster limb repositioning, which was evident in the increased hip and knee flexion and extension velocities. These faster movements prepare the athlete for rapid ground contact. However, these increases in angular velocity did not translate into greater joint range of motion (Figure 3), thereby also rejecting the hypothesis that joint ranges of motion would increase, as maximal hip flexion (54.2 ± 0.6°) and knee flexion (133.5 ± 1.3°) remained relatively constant across intensities.
This study has several limitations. First, most participants were master athletes who did not reach the sprint velocities typical of elite sprinters, which may influence the generalizability of the spatiotemporal and kinematic findings to other levels and age groups. Second, sprint intensities were not randomized, as it was designed as part of a warm-up strategy [5]. This may introduce potentiation, fatigue, and repeated-exposure effects. Therefore, some observed differences may reflect accumulated warm-up/fatigue effects or altered acceleration strategies rather than pure intensity effects. However, randomizing intensities could also compromise performance at the highest intensities if they occurred later in the sequence. Additionally, sprinters typically increase intensity progressively in training, making the chosen protocol ecologically valid. Finally, no electromyography or kinetic measurements were collected, limiting insight into the muscular contributions to joint-kinematic differences and the distribution of mechanical work across joints. Future studies should incorporate EMG and kinetic analyses to determine which muscles drive changes in spatiotemporal parameters and joint kinematics, how horizontal and vertical forces work, and how impulses evolve with increasing sprint intensity.
5. Conclusions
This study demonstrates that in a cohort consisting primarily of master athletes, increasing sprint intensity produces systematic changes in spatiotemporal and joint-kinematic variables during the maximal-velocity phase, even when maximal sprint velocity itself plateaus at the highest intensities. As intensity increased, these athletes shortened both contact and flight times and increased step frequency, while step length increased only up to moderate–high intensities before declining at maximal effort. These adjustments reflect a shift toward faster limb repositioning and more compact joint configurations when time constraints become extreme. Joint-kinematic analyses further revealed that ankle and knee angles at touchdown and toe-off, as well as angular velocities across all major lower-limb joints, were sensitive to changes in intensity, whereas hip joint angles remained relatively stable. Notably, hip-extension angular velocity emerged as a consistent contributor to sprint velocity across intensities, underscoring its central role in sprint performance.
Together, these findings highlight that spatiotemporal and joint kinematics do not follow a linear development as intensity increases; rather, athletes adopt distinct mechanical strategies at very high intensities to accommodate reduced time for force application and limb repositioning. Understanding these adjustments provides valuable insight for coaches and practitioners seeking to optimize sprint-training prescriptions. Training that targets rapid hip-extension mechanics, efficient limb repositioning, and the ability to maintain effective propulsion under shortened contact times may be particularly beneficial, but this should be investigated in intervention studies to confirm these statements. Future research incorporating electromyography and kinetic analyses could help clarify the muscular and mechanical sources of these adaptations and further refine our understanding of how sprinting technique evolves with intensity.
Supplementary Materials
The following supporting information can be downloaded at: https://www.mdpi.com/article/10.3390/biomechanics6030074/s1, Table S1–S3 spatiotemporal and kinematic data from study; Table S1: Spatiotemporal parameters at different intensities; Table S2: Mean (SD) joint angle at the different intensities; Table S3: Mean (SD) angular velocities at the different intensities.
Funding
This research received no external funding.
Institutional Review Board Statement
The study was conducted according to the ethical regulations for research and approved by the University of Canberra Ethics Committee (HREC-1772 on 20 March 2019).
Informed Consent Statement
Informed consent was obtained from all subjects involved in the study.
Data Availability Statement
The data presented in this study are available upon request from the corresponding author. The data are not publicly available due to the national laws of the Norwegian government regarding privacy.
Acknowledgments
I want to acknowledge Nick Ball and Håvard Guldteig Rædergård for helping with the data collection.
Conflicts of Interest
The author declares no conflicts of interest.
References
- Wittekind, A.; Beneke, R. Metabolic and performance effects of warm-up intensity on sprint cycling. Scand. J. Med. Sci. Sports 2011, 21, e201–e207. [Google Scholar]
- González-Mohíno, F.; Martín, R.; Santos-García, D.J.; Fidel, P.A.; de Asis Fernandez, F.; Yustres, I.; González-Ravé, J.M. Effects of high-intensity warm-ups on running performance. Int. J. Sports Med. 2018, 39, 426–432. [Google Scholar] [CrossRef] [Scilit]
- van den Tillaar, R.; von Heimburg, E. Comparison of two types of warm-up upon repeated-sprint performance in experienced soccer players. J. Strength Cond. Res. 2016, 30, 2258–2265. [Google Scholar] [CrossRef] [Scilit] [PubMed]
- van den Tillaar, R.; Lerberg, E.; von Heimburg, E. Comparison of three types of warm-up upon sprint ability in experienced soccer players. J. Sport Health Sci. 2019, 8, 574–578. [Google Scholar] [CrossRef] [Scilit] [PubMed]
- Tillaar, R.V.D.; Ball, N.; Torvik, P.Ø. Relationships Between Effort, Rate of Perceived Exertion, and Readiness During a Warm-Up for High-Speed Sprinting. J. Funct. Morphol. Kinesiol. 2025, 10, 155. [Google Scholar] [CrossRef] [Scilit] [PubMed]
- Castro, A.; LaRoche, D.; Fraga, C.; Gonçalves, M. Relationship between running intensity, muscle activation, and stride kinematics during an incremental protocol. Sci. Sports 2013, 28, e85–e92. [Google Scholar] [CrossRef] [Scilit]
- Mero, A.; Komi, P.; Gregor, R. Biomechanics of sprint running: A review. Sports Med. 1992, 13, 376–392. [Google Scholar] [CrossRef] [Scilit] [PubMed]
- Hicks, D.S.; Schuster, J.G.; Samozino, P.; Morin, J.-B. Improving mechanical effectiveness during sprint acceleration: Practical recommendations and guidelines. Strength Cond. J. 2020, 42, 45–62. [Google Scholar]
- Kawamori, N.; Nosaka, K.; Newton, R.U. Relationships between ground reaction impulse and sprint acceleration performance in team sport athletes. J. Strength Cond. Res. 2013, 27, 568–573. [Google Scholar] [CrossRef] [Scilit] [PubMed]
- Lockie, R.G.; Murphy, A.J.; Schultz, A.B.; Knight, T.J.; de Jonge, X.A.J. The effects of different speed training protocols on sprint acceleration kinematics and muscle strength and power in field sport athletes. J. Strength Cond. Res. 2012, 26, 1539–1550. [Google Scholar] [CrossRef] [Scilit] [PubMed]
- Schache, A.G.; Lai, A.K.; Brown, N.A.; Crossley, K.M.; Pandy, M.G. Lower-limb joint mechanics during maximum acceleration sprinting. J. Exp. Biol. 2019, 222, jeb209460. [Google Scholar] [PubMed]
- Van Caekenberghe, I.; Segers, V.; Aerts, P.; Willems, P.; De Clercq, D. Joint kinematics and kinetics of overground accelerated running versus running on an accelerated treadmill. J. R. Soc. Interface 2013, 10, 20130222. [Google Scholar] [CrossRef] [Scilit] [PubMed]
- Young, M.; Choice, C. Maximal velocity sprint mechanics. Track Coach. 2007, 179, 5723–5730. [Google Scholar]
- Mann, R. The Mechanics of Sprinting and Hurdling; CreateSpace Independent Publishing Platform: Scotts Valley, CA, USA, 2011. [Google Scholar]
- Roche-Seruendo, L.E.; García-Pinillos, F.; Haicaguerre, J.; Bataller-Cervero, A.V.; Soto-Hermoso, V.M.; Latorre-Román, P.Á. Lack of influence of muscular performance parameters on spatiotemporal adaptations with increased running velocity. J. Strength Cond. Res. 2018, 32, 409–415. [Google Scholar] [CrossRef] [Scilit] [PubMed]
- Dorn, T.W.; Schache, A.G.; Pandy, M.G. Muscular strategy shift in human running: Dependence of running speed on hip and ankle muscle performance. J. Exp. Biol. 2012, 215, 1944–1956. [Google Scholar] [CrossRef] [Scilit] [PubMed]
- Schache, A.G.; Dorn, T.W.; Williams, G.P.; Brown, N.A.; Pandy, M.G. Lower-limb muscular strategies for increasing running speed. J. Orthop. Sports Phys. Ther. 2014, 44, 813–824. [Google Scholar] [CrossRef] [Scilit] [PubMed]
- Weyand, P.G.; Sternlight, D.B.; Bellizzi, M.J.; Wright, S. Faster top running speeds are achieved with greater ground forces not more rapid leg movements. J. Appl. Physiol. 2000, 89, 1991–1999. [Google Scholar] [CrossRef] [Scilit] [PubMed]
- Struzik, A.; Konieczny, G.; Grzesik, K.; Stawarz, M.; Winiarski, S.; Rokita, A. Relationship between lower limbs kinematic variables and effectiveness of sprint during maximum velocity phase. Acta Bioeng. Biomech. 2015, 17, 131–138. [Google Scholar] [PubMed]
- Martín-Fuentes, I.; Van den Tillaar, R. Relationship between step-by-step foot kinematics and sprint performance. Int. J. Environ. Res. Public Health 2022, 19, 6786. [Google Scholar] [CrossRef] [Scilit] [PubMed]
- Struzik, A.; Karamanidis, K.; Lorimer, A.; Keogh, J.W.; Gajewski, J. Application of leg, vertical, and joint stiffness in running performance: A literature overview. Appl. Bionics Biomech. 2021, 2021, 9914278. [Google Scholar] [CrossRef] [Scilit] [PubMed]
- Paradisis, G.P.; Bissas, A.; Pappas, P.; Zacharogiannis, E.; Theodorou, A.; Girard, O. Sprint mechanical differences at maximal running speed: Effects of performance level. J. Sports Sci. 2019, 37, 2026–2036. [Google Scholar] [CrossRef] [Scilit] [PubMed]
- Bret, C.; Rahmani, A.; Dufour, A.; Messonnier, L.; Lacour, J. Leg strength and stiffness as ability factors in 100 m sprint running. J. Sports Med. Phys. Fit. 2002, 42, 274. [Google Scholar]
- Nagahara, R.; Zushi, K. Development of maximal speed sprinting performance with changes in vertical, leg and joint stiffness. J. Sports Med. Phys. Fit. 2016, 57, 1572–1578. [Google Scholar] [CrossRef] [Scilit] [PubMed]
- Arampatzis, A.; Brüggemann, G.-P.; Metzler, V. The effect of speed on leg stiffness and joint kinetics in human running. J. Biomech. 1999, 32, 1349–1353. [Google Scholar] [CrossRef] [Scilit] [PubMed]
- Mann, R.A.; Hagy, J. Biomechanics of walking, running, and sprinting. Am. J. Sports Med. 1980, 8, 345–350. [Google Scholar] [CrossRef] [Scilit] [PubMed]
- van den Tillaar, R.; Nagahara, R.; Gleadhill, S.; Jiménez-Reyes, P. Step-to-step kinematic validation between an Inertial Measurement Unit (IMU) 3D system, a combined Laser+ IMU system and force plates during a 50 M sprint in a cohort of sprinters. Sensors 2021, 21, 6560. [Google Scholar] [CrossRef] [Scilit] [PubMed]
- Nijmeijer, E.M.; Heuvelmans, P.; Bolt, R.; Gokeler, A.; Otten, E.; Benjaminse, A. Concurrent validation of the Xsens IMU system of lower-body kinematics in jump-landing and change-of-direction tasks. J. Biomech. 2023, 154, 111637. [Google Scholar] [CrossRef] [Scilit] [PubMed]
- Debertin, D.; Wargel, A.; Mohr, M. Reliability of Xsens IMU-based lower extremity joint angles during in-field running. Sensors 2024, 24, 871. [Google Scholar] [CrossRef] [Scilit] [PubMed]
- Nagahara, R.; Matsubayashi, T.; Matsuo, A.; Zushi, K. Kinematics of transition during human accelerated sprinting. Biol. Open 2014, 3, 689–699. [Google Scholar] [CrossRef] [Scilit] [PubMed]
- Nagahara, R.; Kanehisa, H.; Fukunaga, T. Ground reaction force across the transition during sprint acceleration. Scand. J. Med. Sci. Sports 2020, 30, 450–461. [Google Scholar] [CrossRef] [Scilit] [PubMed]
- Cohen, J. Statistical Power Analysis for the Behavioral Sciences; Lawrence Erlbaum Associates: Hillsdale, NJ, USA; London, UK, 1988; p. 174. [Google Scholar]
- Haugen, T.A.; Breitschädel, F.; Seiler, S. Sprint mechanical variables in elite athletes: Are force-velocity profiles sport specific or individual? PLoS ONE 2019, 14, e0215551. [Google Scholar] [CrossRef] [Scilit] [PubMed]
- Blickhan, R. The spring-mass model for running and hopping. J. Biomech. 1989, 22, 1217–1227. [Google Scholar] [CrossRef] [Scilit] [PubMed]
- McMahon, T.A.; Cheng, G.C. The mechanics of running: How does stiffness couple with speed? J. Biomech. 1990, 23, 65–78. [Google Scholar] [CrossRef] [Scilit] [PubMed]
Disclaimer/Publisher’s Note: The statements, opinions and data contained in all publications are solely those of the individual author(s) and contributor(s) and not of MDPI and/or the editor(s). MDPI and/or the editor(s) disclaim responsibility for any injury to people or property resulting from any ideas, methods, instructions or products referred to in the content. |
© 2026 by the author. Licensee MDPI, Basel, Switzerland. This article is an open access article distributed under the terms and conditions of the Creative Commons Attribution (CC BY) license.