


Abstract
Background: Glenoid loosening is the primary cause of failure in anatomic Total Shoulder Arthroplasty (aTSA). Current ASTM standards evaluate loosening via standard orthogonal vectors using non-continuous monitoring, which offer limited insight into the temporal evolution of loosening along physiological, off-axis wear vectors. This study demonstrates the feasibility and utility of a novel video-based system for continuous monitoring of glenoid loosening under clinically relevant, off-axis wear vectors and subluxation translation (ST) distances. Methods: A custom electromechanical apparatus cyclically displaced a humeral head against 18 cemented 5-peg glenoids over 150,000 cycles across three orientations: superior-inferior (SI), anterior–posterior (AP), and 45-degree angle (45°), and two ST distances (75% and 105% of maximum translation). Each condition had n = 3 glenoids. A video-based motion tracking system continuously monitored micromotion and relative motion at the bone-implant interface against a 150 µm loosening threshold. Differences were analyzed using Kruskal–Wallis tests and non-parametric effect sizes (η2). Results: The system successfully captured non-linear loosening behaviors. Final relative motion at 105% ST was SI (2476.0 ± 1882.3 µm), 45° (239.6 ± 51.9 µm), and AP (265.2 ± 99.7 µm), with all groups exceeding the 150 µm threshold. At 75% ST, relative motion was SI (175.7 ± 140.7 µm), 45° (24.3 ± 69.3 µm), and AP (33.1 ± 18.4 µm). While Kruskal–Wallis tests showed non-significant differences across orientations due to small sample sizes (p = 0.11), large effect sizes (η2 = 0.393) indicated practically meaningful differences, with SI showing the greatest motion. Conclusions: This study demonstrated the feasibility of a novel method of using a video-based system for the continuous monitoring of glenoid loosening under varying mechanical conditions, provides a comprehensive platform for evaluating the biomechanics of implant loosening, and suggests that testing along intermediate axes and at higher subluxation levels may be necessary to accurately predict in vivo performance.
1. Introduction
Anatomic Total Shoulder Arthroplasty (aTSA) is typically used to treat end-stage shoulder arthritis in patients with intact rotator cuff [1,2]. The prevalence of total shoulder arthroplasty has increased by approximately 210% since 2005, and as of 2025, more than 50,000 total shoulder arthroplasties are performed in the United States annually [1,2]. However, patients frequently outlast their implants, with Kaplan–Meier survivorship rates with revision as the endpoint at 5, 10, 15, and 20 years being 98%, 93%, 88%, and 85%, respectively [3]. The cause of failure, typically due to pain or non-function of the implant, is most commonly attributed to glenoid loosening [4,5,6]. Reported revision rates are 4.2–5.6%, with glenoid loosening being reported as the reason for 19–44% of these cases, making it a common cause of aTSA failure [3,4,7,8,9]. Osteolysis, which can be caused or exacerbated by polyethylene wear particles, is another possible contributor to glenoid loosening [5]. If this loosening is above a certain threshold, fibrous tissue may form around the implant, limiting osseointegration and requiring premature revision [10].
Furthermore, loosening may be exacerbated by a “rocking horse” phenomenon associated with forces related to translation of the humeral head away from the center of the polymer bearing due to unbalanced rotator cuff forces, particularly superior translation caused by dominant deltoid muscle action in the setting of supraspinatus muscle insufficiency [11,12,13]. This translational motion is intrinsic in normal shoulders, but it becomes augmented in the presence of rotator cuff disease. The literature disagrees regarding the amplitude and direction of this motion.
Previous studies have identified theoretical ranges of translational motion within the shoulder joint. Harryman’s study of non-diseased cadaver shoulders under passive motion displayed a mean anterior translation of 1.01 mm on passive internal rotation, a posterior translation of 1.68 mm on passive external rotation, a mean anterior translation of 3.79 mm on passive flexion, and a 4.92 mm posterior translation on passive flexion [14]. In a study of active motion in non-diseased cadaver shoulders with simulated muscle forces, translations in three axes with 1.1 mm in the lateral-medial axis, 3.5 mm in the superior-inferior axis, and 2.4 mm in the posterior–anterior axis were found [15].
ASTM F2028-17 is the current standard for testing glenoid component loosening by cyclically displacing a humeral head component under axial load against a glenoid component to 90 percent of the subluxation translation (ST) distance of the tested glenoid [16]. This standard states that translation of the humeral head can occur along multiple axes including the superior-inferior (SI), anterior–posterior (AP), or an alternative angle, but does not require testing along these multiple axes or specify any alternative angles [16]. Anglin’s work, which tested glenoid resistance to loosening in the superior-inferior direction, is the basis of ASTM F2028-17 [17,18,19]. Accordingly, and consistent with the premise that a maximum lever arm may be developed through testing along the major axis of an oblate glenoid, many investigators have tested their devices in the superior-inferior direction [20,21,22,23,24]. Other investigators chose to only test translation of the humeral head in the superior direction by loading the superior edge and then returning to center [25,26,27,28]. Notably, Wirth tested devices along an axis 45 degrees from SI, citing previous work of Kelkar to justify translating at 45 degrees from the long axis of the glenoid, and additionally added rolling motion to mimic the complex motion of the shoulder [29]. To our knowledge, however, no publications compare device testing along multiple axes.
To achieve this, a method must be developed that allows for comparison of testing an intermediate angle with both SI and AP axes. Guarino et al. evaluated the wear and wear vectors of a library of extracted shoulder implants. They found that the mean physiological wear vector was 47.3 degrees, an intermediate angle, in these retrievals [28]. This data establishes that Wirth and Kelkar’s 45-degree orientation tests follow a clinically relevant wear vector that needs further testing [15,29]. Additionally, though wear does not necessarily always correlate to loosening, the Guarino study found that implants with greater dimensional changes showed a significantly shorter time in vivo [28]. This suggests that there may be a relationship between loosening and the motion or loading patterns resulting in increased wear.
Clinically, relative motion of an aTSA implant within the supporting bone can lead to pain, instability, and impaired shoulder function, and may lead to potential instability, causing mechanical dysfunction [7,10]. The exact definition of “loose” varies by observer and clinical sequelae but has been determined to be as small as 100 microns (µm) of relative motion. In particular, Pilliar et al. identified that 150 µm of motion could cause fibrous tissue formation adjacent to the implant [10]. Though this threshold is typically for cementless implants, relative motion greater than 150 µm was defined as clinically relevant in this work as a conservative benchmark for cemented debonding. In our in vitro model, we measure loosening by identifying an increase in motion at the periphery of the glenoid relative to an as-implanted baseline, which takes loosening and the deformation of the polymer and polyurethane bone substitute into account.
Motions leading to loosening must be standardized, and ASTM recommends using subluxation translation distance. Subluxation translation distance is the distance between the deepest point of the glenoid and the point where the humeral head is subluxated from the glenoid. 100% Subluxation translation distance (100% ST) is the point at which there is the maximum shear force on the implant, perpendicular to the axial load applied to the joint. This value is a function of implant size and orientation and thus varies for every construct. One of the proposed approaches in this study is testing at two different distances, one above and one below the ASTM standard 90% ST, with the rationale that this allows for the simulation of a stable shoulder in relation to a loose shoulder under the same conditions.
A chief limitation of the rocking horse test is that the assessment of loosening, as commonly performed in the past, utilizes a non-continuous method of monitoring the loosening of the glenoid component across many cycles of articulation. Current in vitro studies have used several approaches to quantify glenoid loosening and to monitor motion over time. One approach is to periodically take manual measurements of distraction [25,30,31]. Many studies achieve this with checks with dial gauges after a fixed number of cycles. This method provides macroscopic, permanent edge displacement data, but cannot give any information regarding the evolution of micromotion during individual load cycles. Another method measures loosening with Linear Variable Differential Transformer (LVDT) sensors and load cells [32,33,34]. Data can be logged continuously, though often at lower sampling rates, to quantify displacement and forces. Torkan et al. report LVDT system errors and Mean Absolute Percentage Errors (MAPE) near 9.5% to capture sub-100 μm motions [35]. As LVDTs are contact-based transducers, they are subject to slipping and often force researchers to rely on quasi-static measurements rather than capturing the dynamic, non-linear behavior of the interface during active articulation. Melvani et al. used a MATLAB R2024b script and optics to monitor the macroscopic motion of the glenoid implantation process but used LVDTs to conduct their subluxation and rocking horse tests [34]. Geary et al. implemented continuous electronic logging in a shoulder simulator with displacement sensors on three orthogonal faces of the glenoid holder and custom LabVIEW FieldPoint software connected to force and displacement channels [32]. This approach does well to measure the overall motion of the glenoid holder but is not designed to specifically detect the micromotion at the bone-implant interface.
Therefore, to the authors’ knowledge, no published method exists that can continuously monitor micromotion of glenoid loosening with sufficient precision during cyclic articulation in a simulated shoulder. Continuous monitoring can further advance an understanding of loosening patterns by providing insight into the rate of loosening over smaller periods of time. This can expose the loosening behavior as non-linear, which would affect the treatment plan in a clinical setting.
A method that can continuously monitor the measurement of loosening at different orientations and ST distances will enable greater understanding of the mechanism of loosening for device manufacturers and doctors alike. It would provide device manufacturers with a more thorough evaluation of an implant’s loosening characteristics before it is deployed in vivo. The method would also assist physicians’ understanding of the complex biomechanics behind shoulder implant loosening, particularly how different directional forces and translation vectors contribute to implant instability. This is particularly important for patients who require increased joint laxity to maintain proper shoulder function. Overall, it would provide a platform to test specific implant designs or modifications as they arise, supporting ongoing improvements in implant durability and patient outcomes.
This motivates a method that is capable of (1) measuring loosening at multiple different glenoid orientations and (2) varying ST distances. Additionally, this method will utilize continuous monitoring to allow the observation of clinically relevant differences across these variables. The first main objective of this paper is to develop a method of cyclically displacing a humeral head component against a glenoid component under an axial load along clinically relevant wear vectors at varying ST distances with a rocking horse test. The second main objective is to develop this method as one capable of continuous monitoring. Clinically relevant wear vectors were derived from a library of shoulder retrievals that were tested by Guarino et al. [28]. The vectors being tested are along the superior-inferior axis (SI), the anterior–posterior axis (AP), and an intermediate angle of 45 degrees (45°). The ST distances being tested are 75% and 105% (i.e., ASTM recommended 90% ± 15%).
From these tests, we aim to measure two primary types of movement: the total motion caused by joint articulation, referred to as “micromotion,” and the increase in this motion over baseline following loosening, referred to as “relative motion,” to characterize loosening behavior. Micromotion shows how much the specific articulation vector affects the loosening of the glenoid. Relative motion is the measurement to compare to Pilliar’s threshold to evaluate if the observed motion is physiologically relevant. Loosening behavior is the dynamic progression and pattern of implant displacement over time.
We hypothesize that loading along the SI axis will produce the greatest micromotion and relative motion of the glenoid component, followed by loading at 45°, and then along the anterior–posterior (AP) axis. This is expected due to increased torsional forces associated with greater effective lever arms as the humeral head translates across the glenoid. Additionally, we hypothesize that both micromotion and relative motion will be greater at 105% of the ST distance than at 75% ST.
2. Materials and Methods
2.1. Glenoid Loosening Simulator
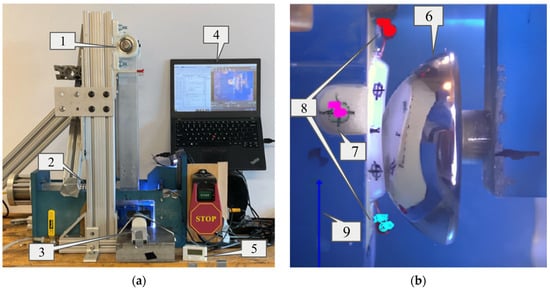
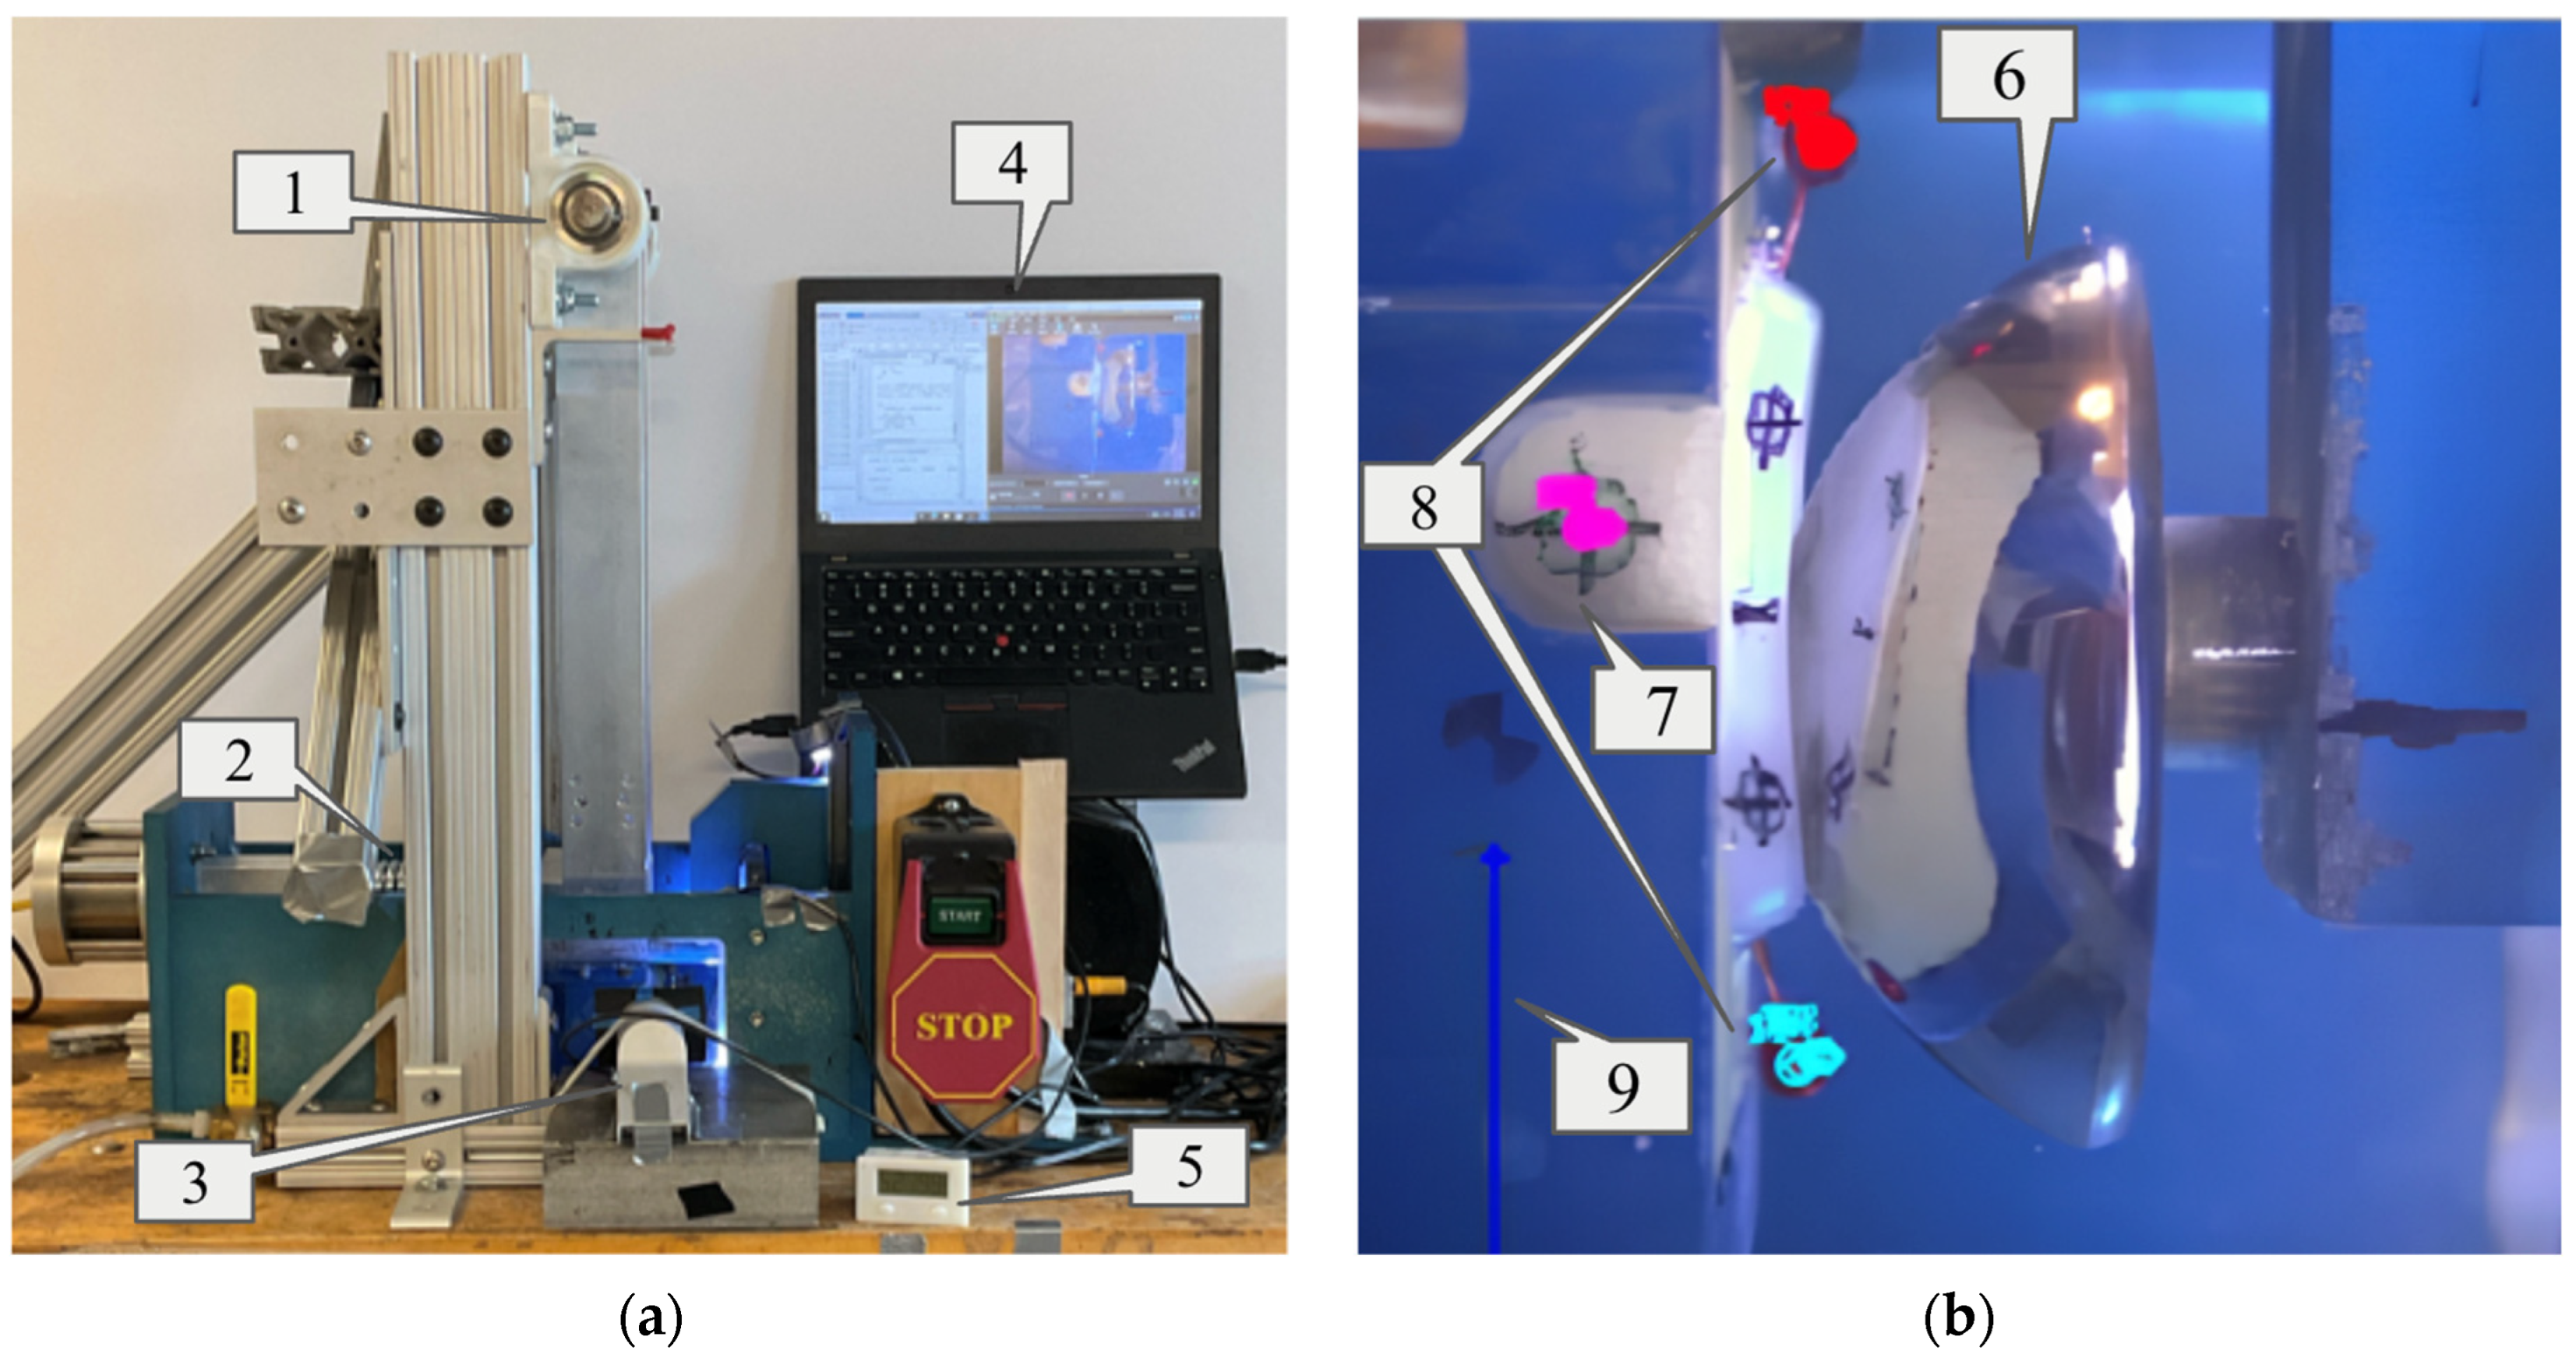
ASTM F2028-17 describes a method for measuring prosthetic glenoid component loosening following dynamic, loaded rocking tests. To address the first objective, a custom machine was built to displace a submerged glenoid testing assembly under high loads (Figure 1). The traditional linear-displacement system for the glenoid assembly commonly used in other designs was replaced by a long pivoting arm (Figure 1). A high-stiffness industrial spring was used to apply a consistent horizontal load to the rigid arm above water height (Figure 1). This design achieves near-linear displacement of the glenoid while mitigating the corrosion or friction challenges associated with submerging linear bearings or subjecting them to offset loads. With a 470 mm pivoting arm and a typical large glenoid with an SI height of 26 mm, top and bottom x-displacement and force are different by less than 6%. This was considered negligible given the magnitude of differences in consideration for other variables. The linkage was driven by a Leeson AC Gearmotor (Model C4C17FZ39C) that displaced a humeral head at 1.5 Hz to a translation distance of interest (i.e., ST distance) and a digital video camera was positioned to allow continuous capture of the submerged glenoid component and humeral head through a window.
Figure 1.
Diagram of the Glenoid Loosening Simulator and corresponding software (a), and the data analysis view (b). (a) The Glenoid Loosening Simulator is operated by using the pendular arm (1) to hold the glenoid assembly, while the 750 N load is applied through the spring (2). The video camera (3) captured articulation through the viewing window. Its display is on the laptop (4) along with the custom MATLAB code used for continuous monitoring. The cycle counter (5) recorded the number of cycles of articulation. (b) The camera captured cycles of articulation, which were processed using the software Tracker. As the glenoid articulated on the humeral head (6), the fiducial reference mark (7) was tracked, along with the top and bottom pins (8) per frame, in which Tracker created a mark for each of these respective points (note the different colored marks on each tracked entity). The calibration marker (9) gives Tracker the proper scale to evaluate the motion of the pins. Post-processing used the pin motion data to evaluate the distraction at the bone-implant interface.
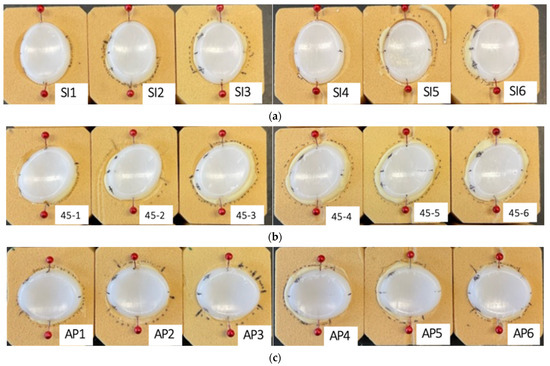
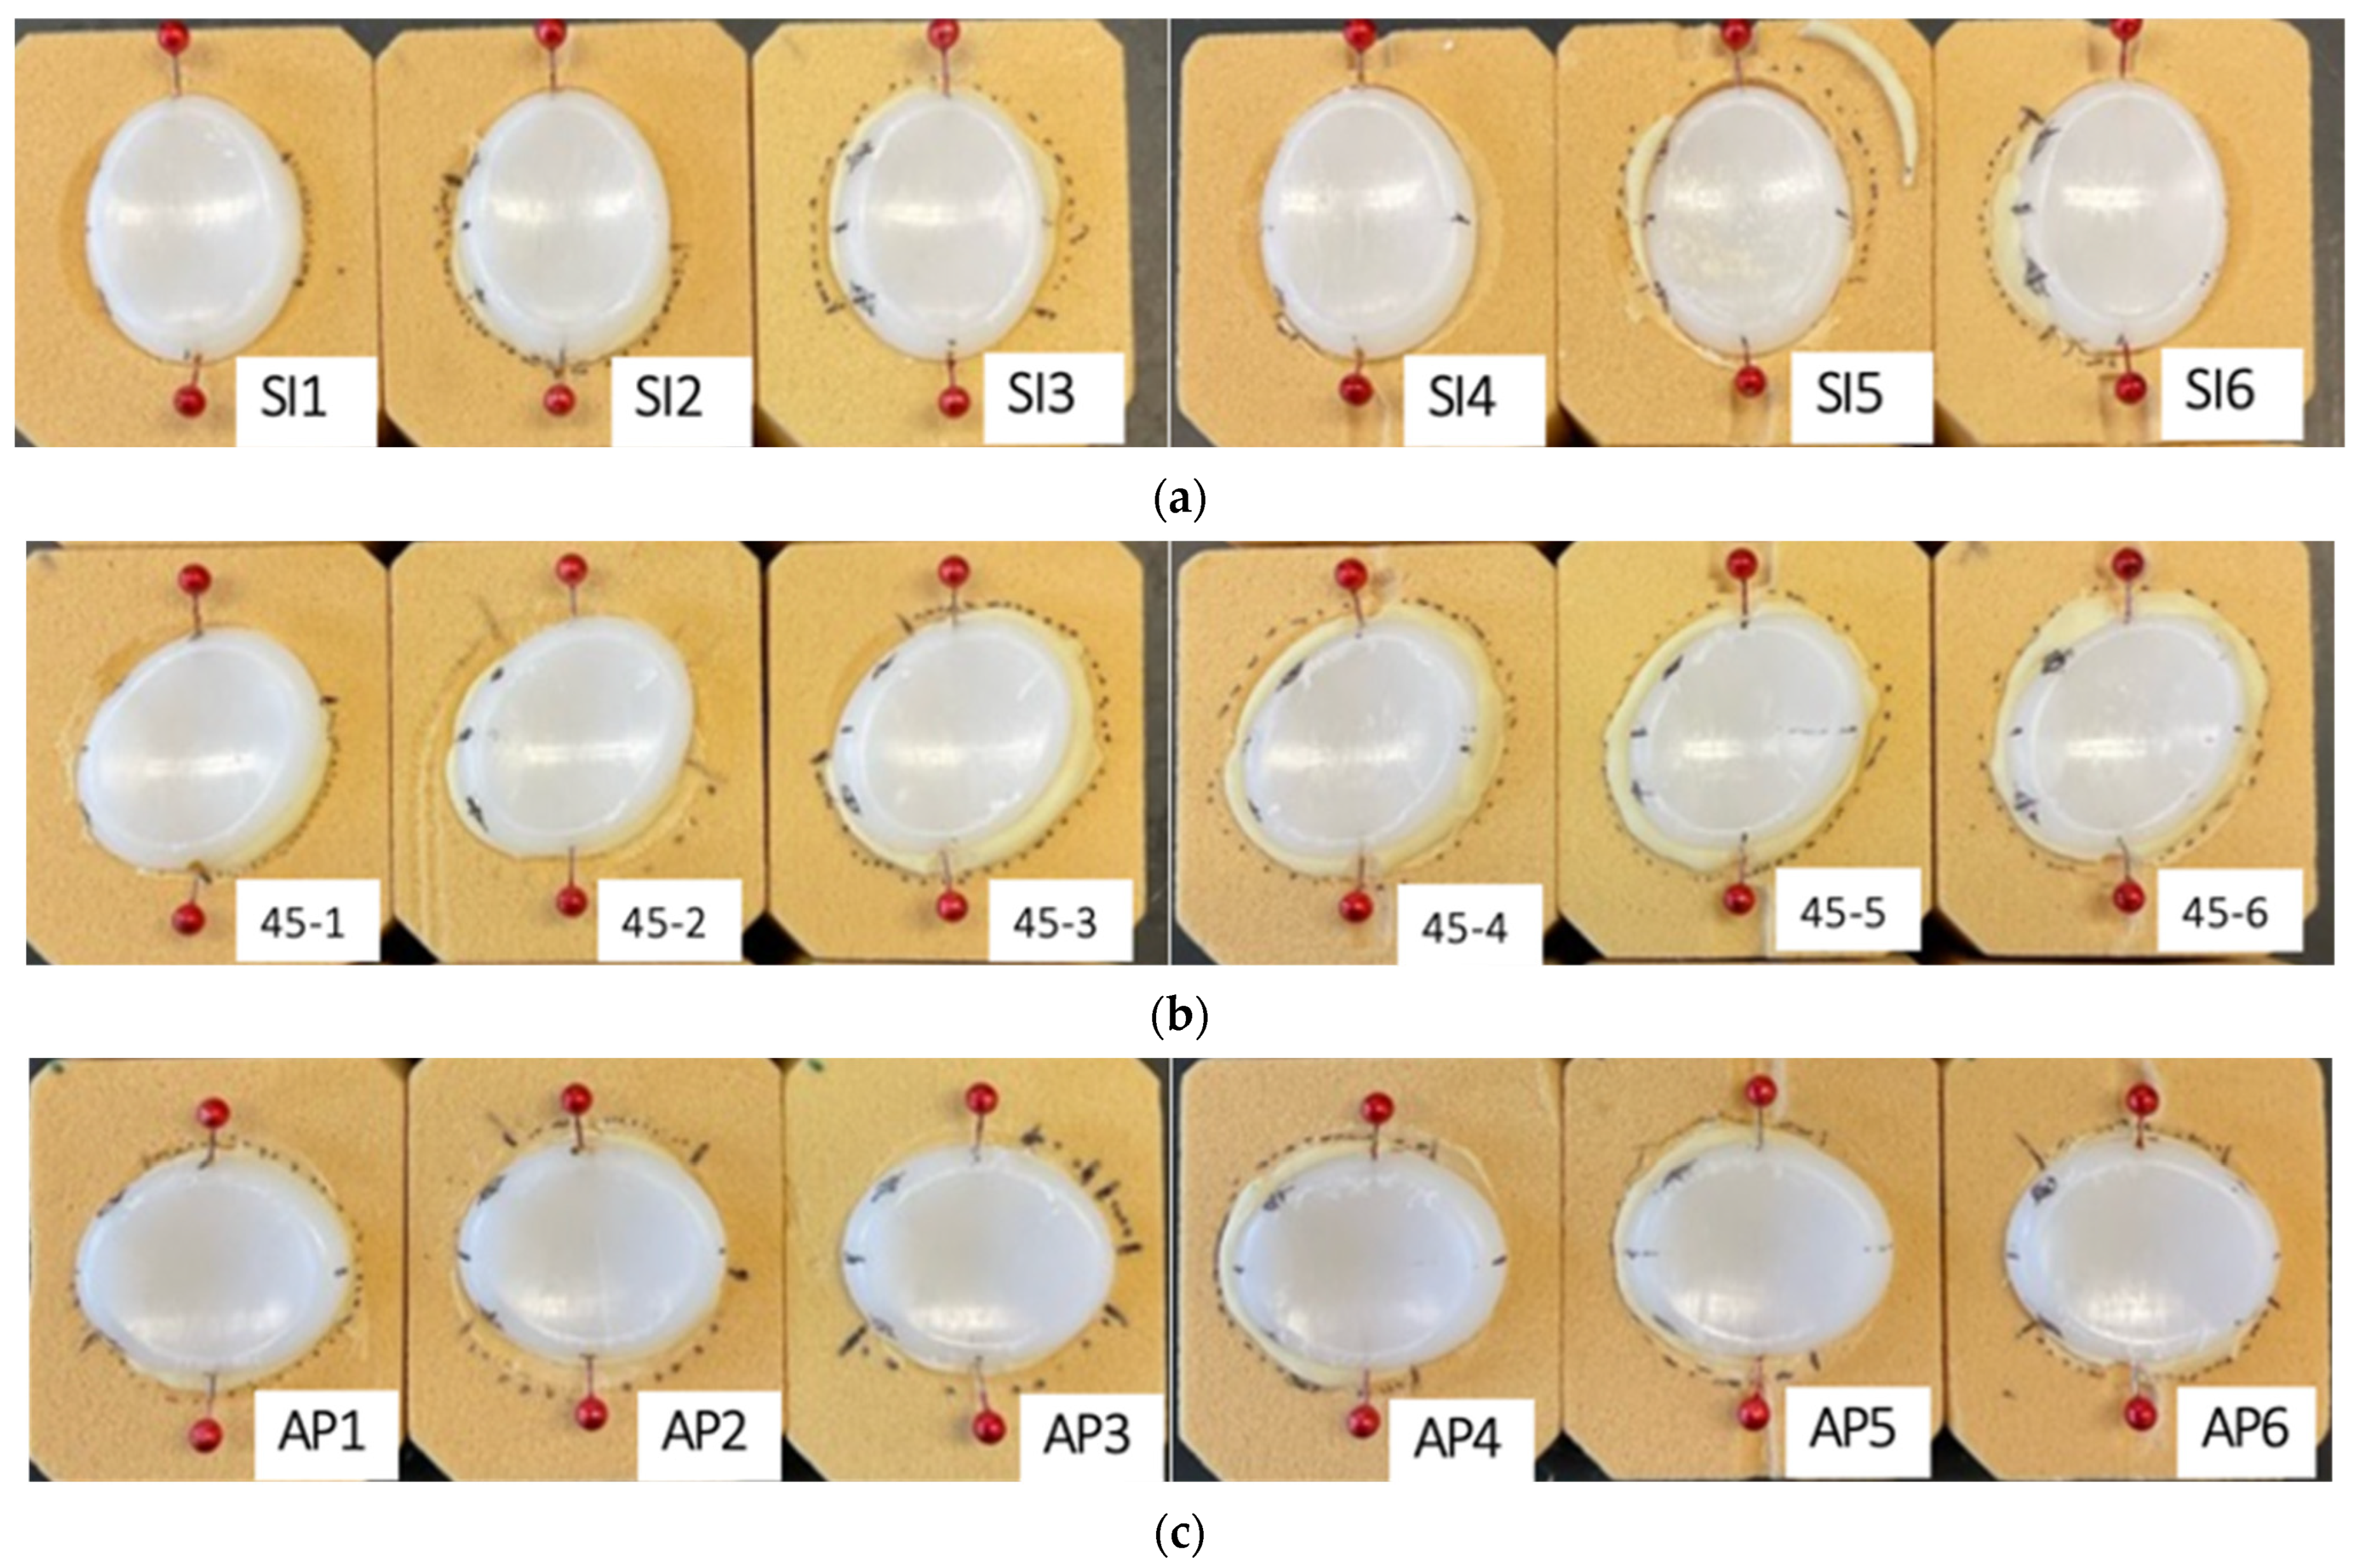
Eighteen samples of 20 PCF SawBones (polyurethane bone substitute) were cut to fit inside the cavity of the pivoting arm (Figure 2). A 3-axis CNC mill was programmed to repeatedly prepare the bone substitute for implantation in different orientations: six in SI orientation, six in 45-degree orientation, and six in AP orientation. Eighteen five-peg, symmetrical, all polyethylene glenoid components, from a single manufacturer, were cemented (Zimmer Biomet Bone Cement R) into these bone substitutes by an experienced clinician to make six samples in the SI, AP and 45° orientations each. Once the glenoid samples were fixed, the centerline was marked on the glenoid as a reference to align the humeral head with the glenoid. A reference fiducial mark was made on the camera-facing side of the polyurethane bone block to track the position of the block in the plane of the displacement (Figure 1b). All marks were made on the side facing the camera. To improve visibility, red, bulbous sewing pins were cut to 12 mm in length and were inserted into the top center ridge and bottom center ridge of each glenoid sample to evaluate the loosening of the glenoid via the video monitoring system. The pins extended 6–8 mm vertically and 6–7 mm horizontally away from the polyurethane bone substitute to ensure that there was no contact or impediment to the pins’ motion by the surrounding objects. This glenoid assembly was inserted into a pendular component, secured with screws on a metal plate above the assembly to stabilize the sample. The center of the glenoid was aligned with the center of a matched cobalt chrome humeral head. A load of 750 N, determined by ASTM F2028-17, was applied to the glenoid assembly onto the humeral head by means of a spring pressing on the back of the pendular component just above the waterline.
Figure 2.
Glenoid samples cemented in polyurethane bone substitute at various orientations. (a) SI orientation. (b) 45° orientation. (c) AP orientation. The red bulbous aspects of the pins are 6–8 mm vertically and 6–7 mm horizontally away from their point of insertion in the glenoid. Bone cement protrusion between the glenoid and polyurethane bone substitute was noted. Additional marks were added 9 mm above and below the centerline during preliminary testing, but were not used in the method as described, as the red pin heads were more effective for pixel-based tracking.
ST distance for the glenoid components was determined experimentally as described in ASTM F2028-17, wherein this refers to the distance from the glenoid center at which the maximum vertical load occurs during humeral head translation [16]. Three components were tested at each orientation by applying an axial load perpendicular to the glenoid and slowly translating the humeral head parallel to the glenoid plane until a peak vertical load was indicated by a strain gauge apparatus affixed to the humeral head assembly. The results were averaged at each orientation to establish the ST distance for each orientation. The resulting values were 5.1 mm for the SI orientation, 4.1 mm for the 45° orientation, and 3.35 mm for the AP orientation. An n = 3 was used for each ST distance and orientation condition in this experiment (Figure 2).
2.2. Video System Capable of Continuous Monitoring
To address the continuous monitoring objective, a video-based system was developed to track glenoid loosening at regular intervals so glenoid loosening intervals could be ascertained with greater temporal resolution. A transparent viewing window allows a view of the glenoid assembly submerged in distilled water with fiducial marks on the glenoid, bone substitute, and mounting box (Figure 1). A distance was marked on the submerged aspect of the pendular component for calibration near the plane of the glenoid. Custom MATLAB code commands a video software (Debut, NCH Software Inc., Greenwood Village, CO, USA) to automatically gather five-second videos of the glenoid at user-specified intervals, e.g., every 1000 cycles. As a note, this method would allow nonstop data collection to occur, but this is generally not necessary. Then, a spatially calibrated video analysis software (Tracker, Open Source Physics) was used to determine glenoid loosening in multiple dimensions by tracking the motion of the marks on the top and bottom of the glenoid relative to the bone substitute (Figure 1). Positions of the reference fiducial mark and the red bulbous pins were tracked over 150,000 cycles for each sample unless gross failure occurred, defined as dissociation between the glenoid and the polyurethane bone. The X and Y locations of the pixel set were recorded by the software for further analysis.
2.3. Data Collection and Processing
Data points were collected at each frame from periodic 10 second videos at fully customizable cycle checkpoints to create each data group. These data groups were collected three times, 1000 cycles apart, centered on each checkpoint to enhance data quality and reliability. For example, to take a data point at 5000 cycles, data would be collected at 4000, 5000, and 6000 cycles. Data groups were gathered more frequently in earlier cycles (<30,000) to capture small initial changes. These data groups were collected, averaged and graphed for each orientation at each ST distance. Tests were run to 150,000 cycles but were stopped earlier if gross failure occurred.
Specifically, all video capture files were uploaded into Tracker, a Java-based software that was used to track loosening at the edge of the glenoid via the movement of the red pins. Each video was spatially calibrated using the calibration marker (see Figure 1b, mark #9). This distance accounted for the optics of the camera. The average spatial resolution is 0.12 mm/pixel. To quantify system accuracy, dynamic noise, and repeatability under baseline conditions, a static calibration test was performed, yielding a maximum system noise range of 0.23 mm with a range of 0.206 ± 0.020 mm. Then, the two red pins and the reference mark on the polyurethane bone were manually identified by using the pre-made center of mass feature and circling the pixels of each pin and reference mark. The x and y positions were tracked automatically in each frame by the software by identifying the initial pattern of pixels and matching them through each subsequent frame across multiple cycles, reporting per cycle. If the pixel match is not sufficient, the manual marking process was redone, or an adjacent 1000-cycle data group was used in its place. Of critical note, this process isolated glenoid motion relative to the adjacent bone substitute, which itself was deforming and moving laterally. The data was then uploaded into a separate custom MATLAB program, where relative motion, as defined previously as an increase in motion over baseline, was evaluated. In this method, the x positions of the upper and lower tracking pins are used to find the total amount of movement about the center of the glenoid component. For each video segment analyzed, the motion of the upper and lower pin positions was found relative to each other as a function of time. The amplitude of this relative motion vector was determined using a native peak-finding algorithm in MATLAB. In the calculation, we adjusted the relative motion value to represent the edge of the glenoid, not the pins that we tracked. The optical distortion of the glenoid and pins was accounted for by multiplying the distortion by the proportion of the actual glenoid length and the video-measured glenoid length for each orientation. The mean amplitude can thus be reported as a measure of the relative motion of the top and bottom edges of the glenoid component, as viewed from the camera position, as shown in Figure 1. This metric will effectively show the amount and the rate of loosening across cycles of articulation.
2.4. Evaluation of the Proposed Method
To evaluate the above method of continuous monitoring of glenoid loosening across multiple glenoid orientations and two ST distances, a group of 5-peg anatomic total shoulder glenoid components was prepared as described above (Medacta Shoulder System, Size 48). The 5-peg glenoid design represents a design that was hypothesized to be most difficult to loosen, as compared to typical 4-peg or other shoulder glenoid designs. Thus, this was selected for use in this method evaluation study as a worst-case scenario for the detection of clinically relevant loosening behaviors across the variables of interest (glenoid orientation, ST distance). One glenoid size was used so the matched humeral head could be mounted to the opposing fixture, and the tests could be run without interchanging the humeral head. This simulates an accurate glenoid-humeral head pair that would be used in vivo. The variance of loosening among various sizes was not in the scope of our testing. This method will be considered successful if the continuous monitoring system reliably detects differences in micromotion and loosening behavior through relative motion for the 5-peg worst-case components across orientations/ST distances that are consistent with expectations from mechanical loading (e.g., greater micromotion at 105% ST), and if these detected differences are repeatable across replicate specimens.
A Tandberg camera and the software Tracker were used to evaluate micromotion. Specifically, Tracker uses a pixel-matching algorithm per frame to detect motion. Thus, the quality of the data was dependent on the focus and resolution of the camera, the frames per second (fps), and the opacity of the medium in which the articulation occurs are all factors in the quality of the data. The Tandberg camera operates at 30 fps. To optimize the image in the proposed setup, water was drained, the tank was scrubbed and vacuumed for debris, and replaced with distilled water after each test; lighting, including submerged light, was added to the tank, and the camera’s focus was manually set to produce the highest resolution image for each test. This method will be considered successful if the image and the tracking quality are maintained throughout a run and across each run, and the automatic tracking algorithm can be run without human override for the entirety of a video in 3 of 5 videos surrounding a checkpoint.
The ST distances were chosen to bracket the current ASTM standard and to test the method across clinically meaningful stability conditions for each orientation. Thus, we tested at 75% ST and 105% ST to span a range from relatively stable to marginally unstable articulations. The 75% ST condition models a well-centered shoulder with lower shear loading and a reduced propensity for micromotion, while the 105% ST condition models a borderline or loose shoulder with increased edge loading and a higher risk of loosening and failure. Testing these ST distances lets us determine whether the measurement system can detect small, clinically relevant differences in micromotion across stability states, how loosening behavior changes with increasing subluxation, and whether the method remains sensitive and reproducible under both conservative (stable) and challenging (near-failure) conditions. This method will be considered successful if measurements at 75% and 105% ST and at each of the three orientations show variability among each group is low enough to allow confident discrimination of real micromotion from measurement noise, and if relative motion is measured to be greater in the 105% ST case.
As previously stated, this method is capable of continuous monitoring, so any combination of points can be taken to evaluate the nature of loosening. Notably, we chose to have nine groups of three consecutive points, with points concentrated during the start of the test and tapered off by the end, which was determined to be sufficient to describe the nature of loosening while minimizing the amount of data processing needed per test. We chose to have three consecutive points to assess the variability between very similar states and chose to concentrate the points near the start of the test to detect sudden increases in loosening or errors within the testing setup. This method will be considered successful if intra-group variability is low enough to allow confident discrimination of real micromotion from measurement noise.
3. Results
The method allowed continuous monitoring to occur throughout the tests and for clinically relevant differences to be observed between the different orientations and ST distances. Among the continuous data available for assessment, various checkpoints were selected to demonstrate the ability of the method to capture loosening behavior in a clinically relevant manner.
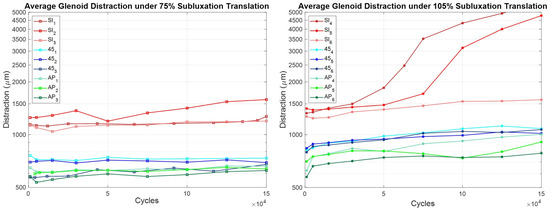
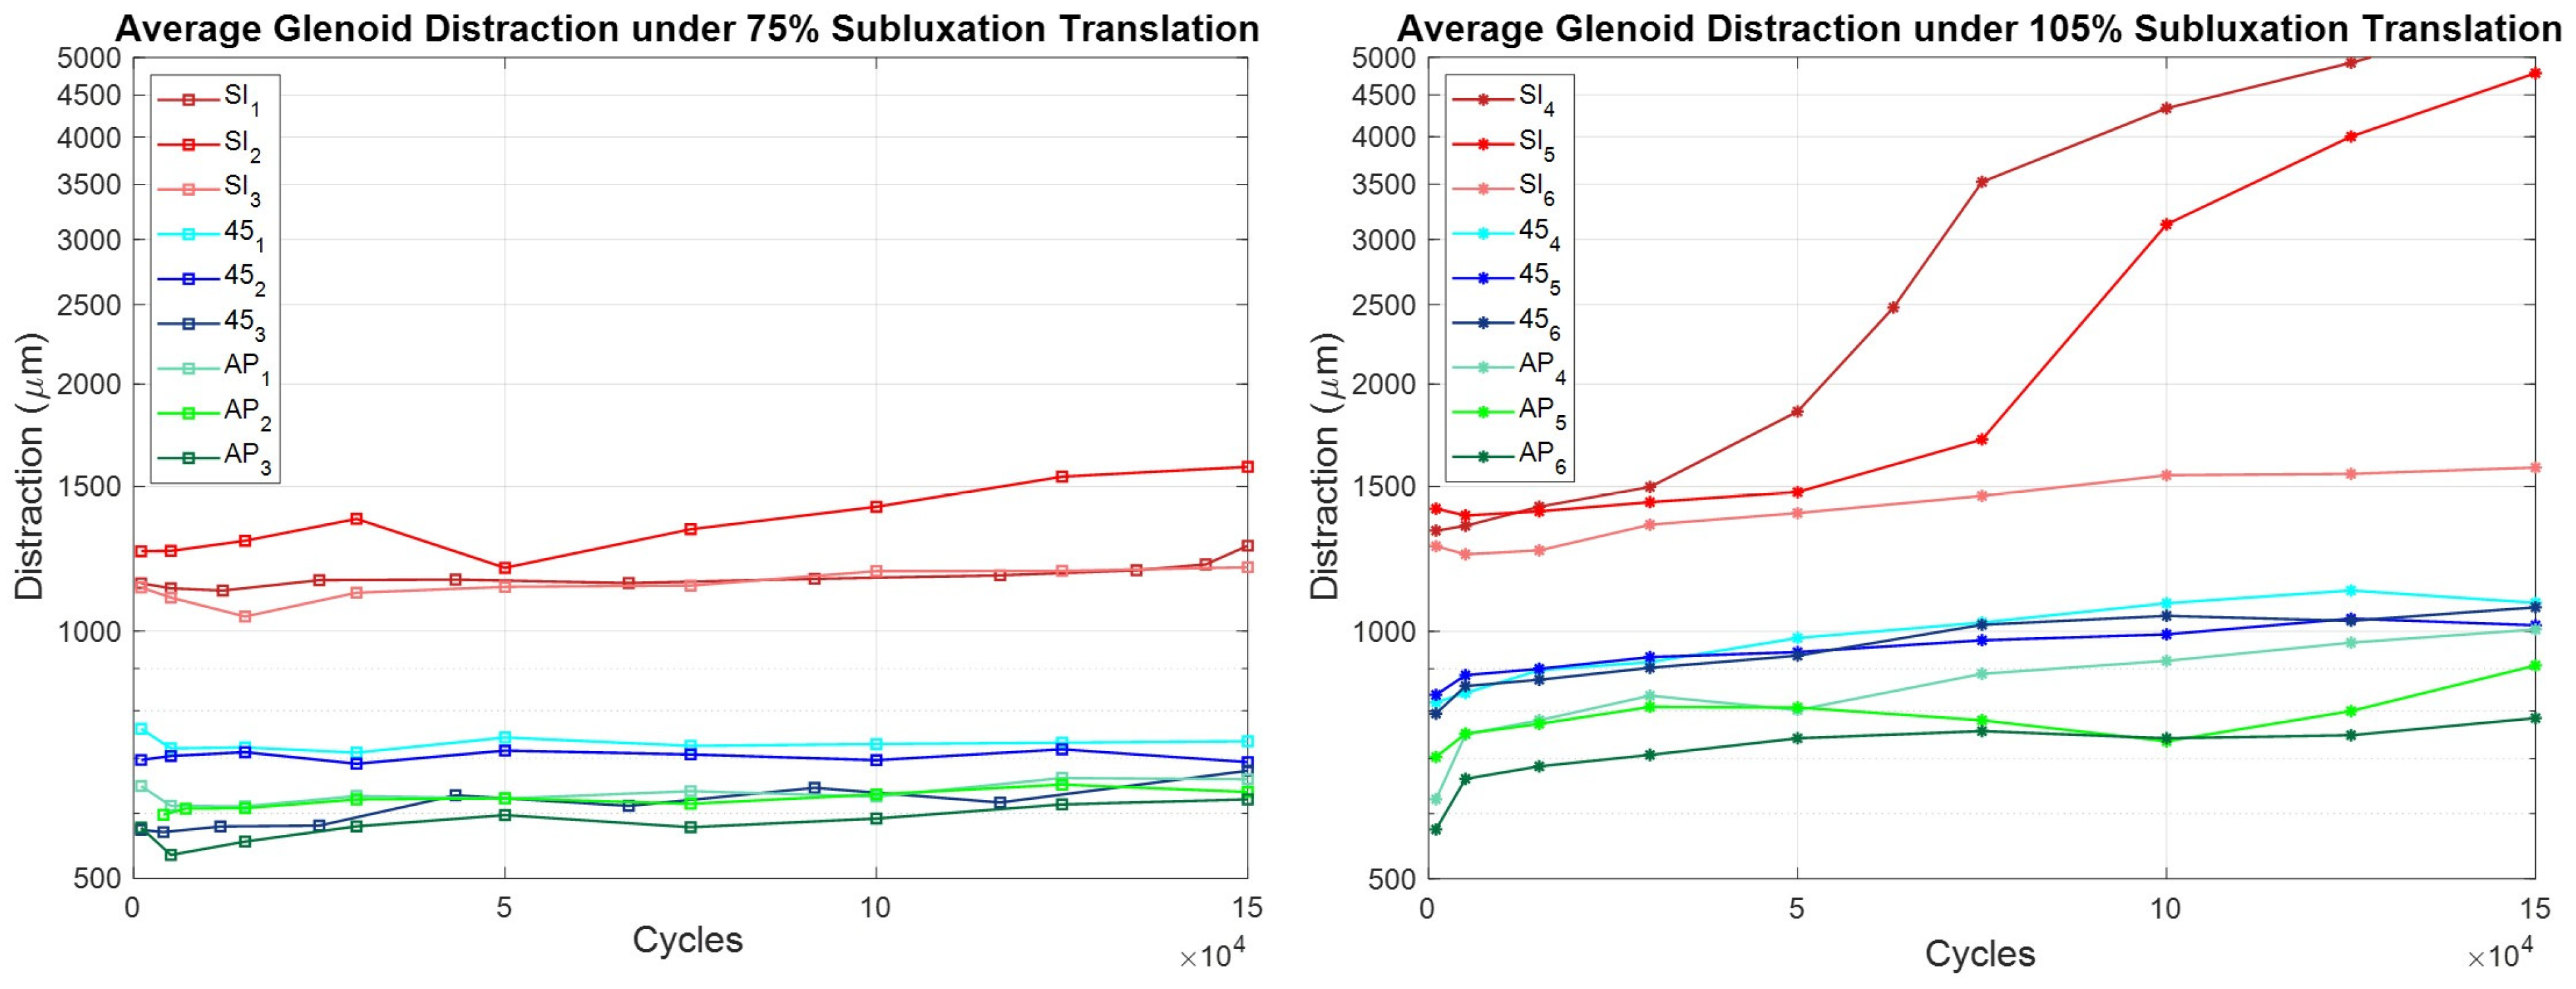
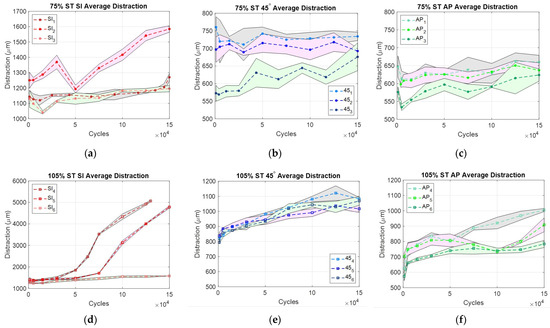
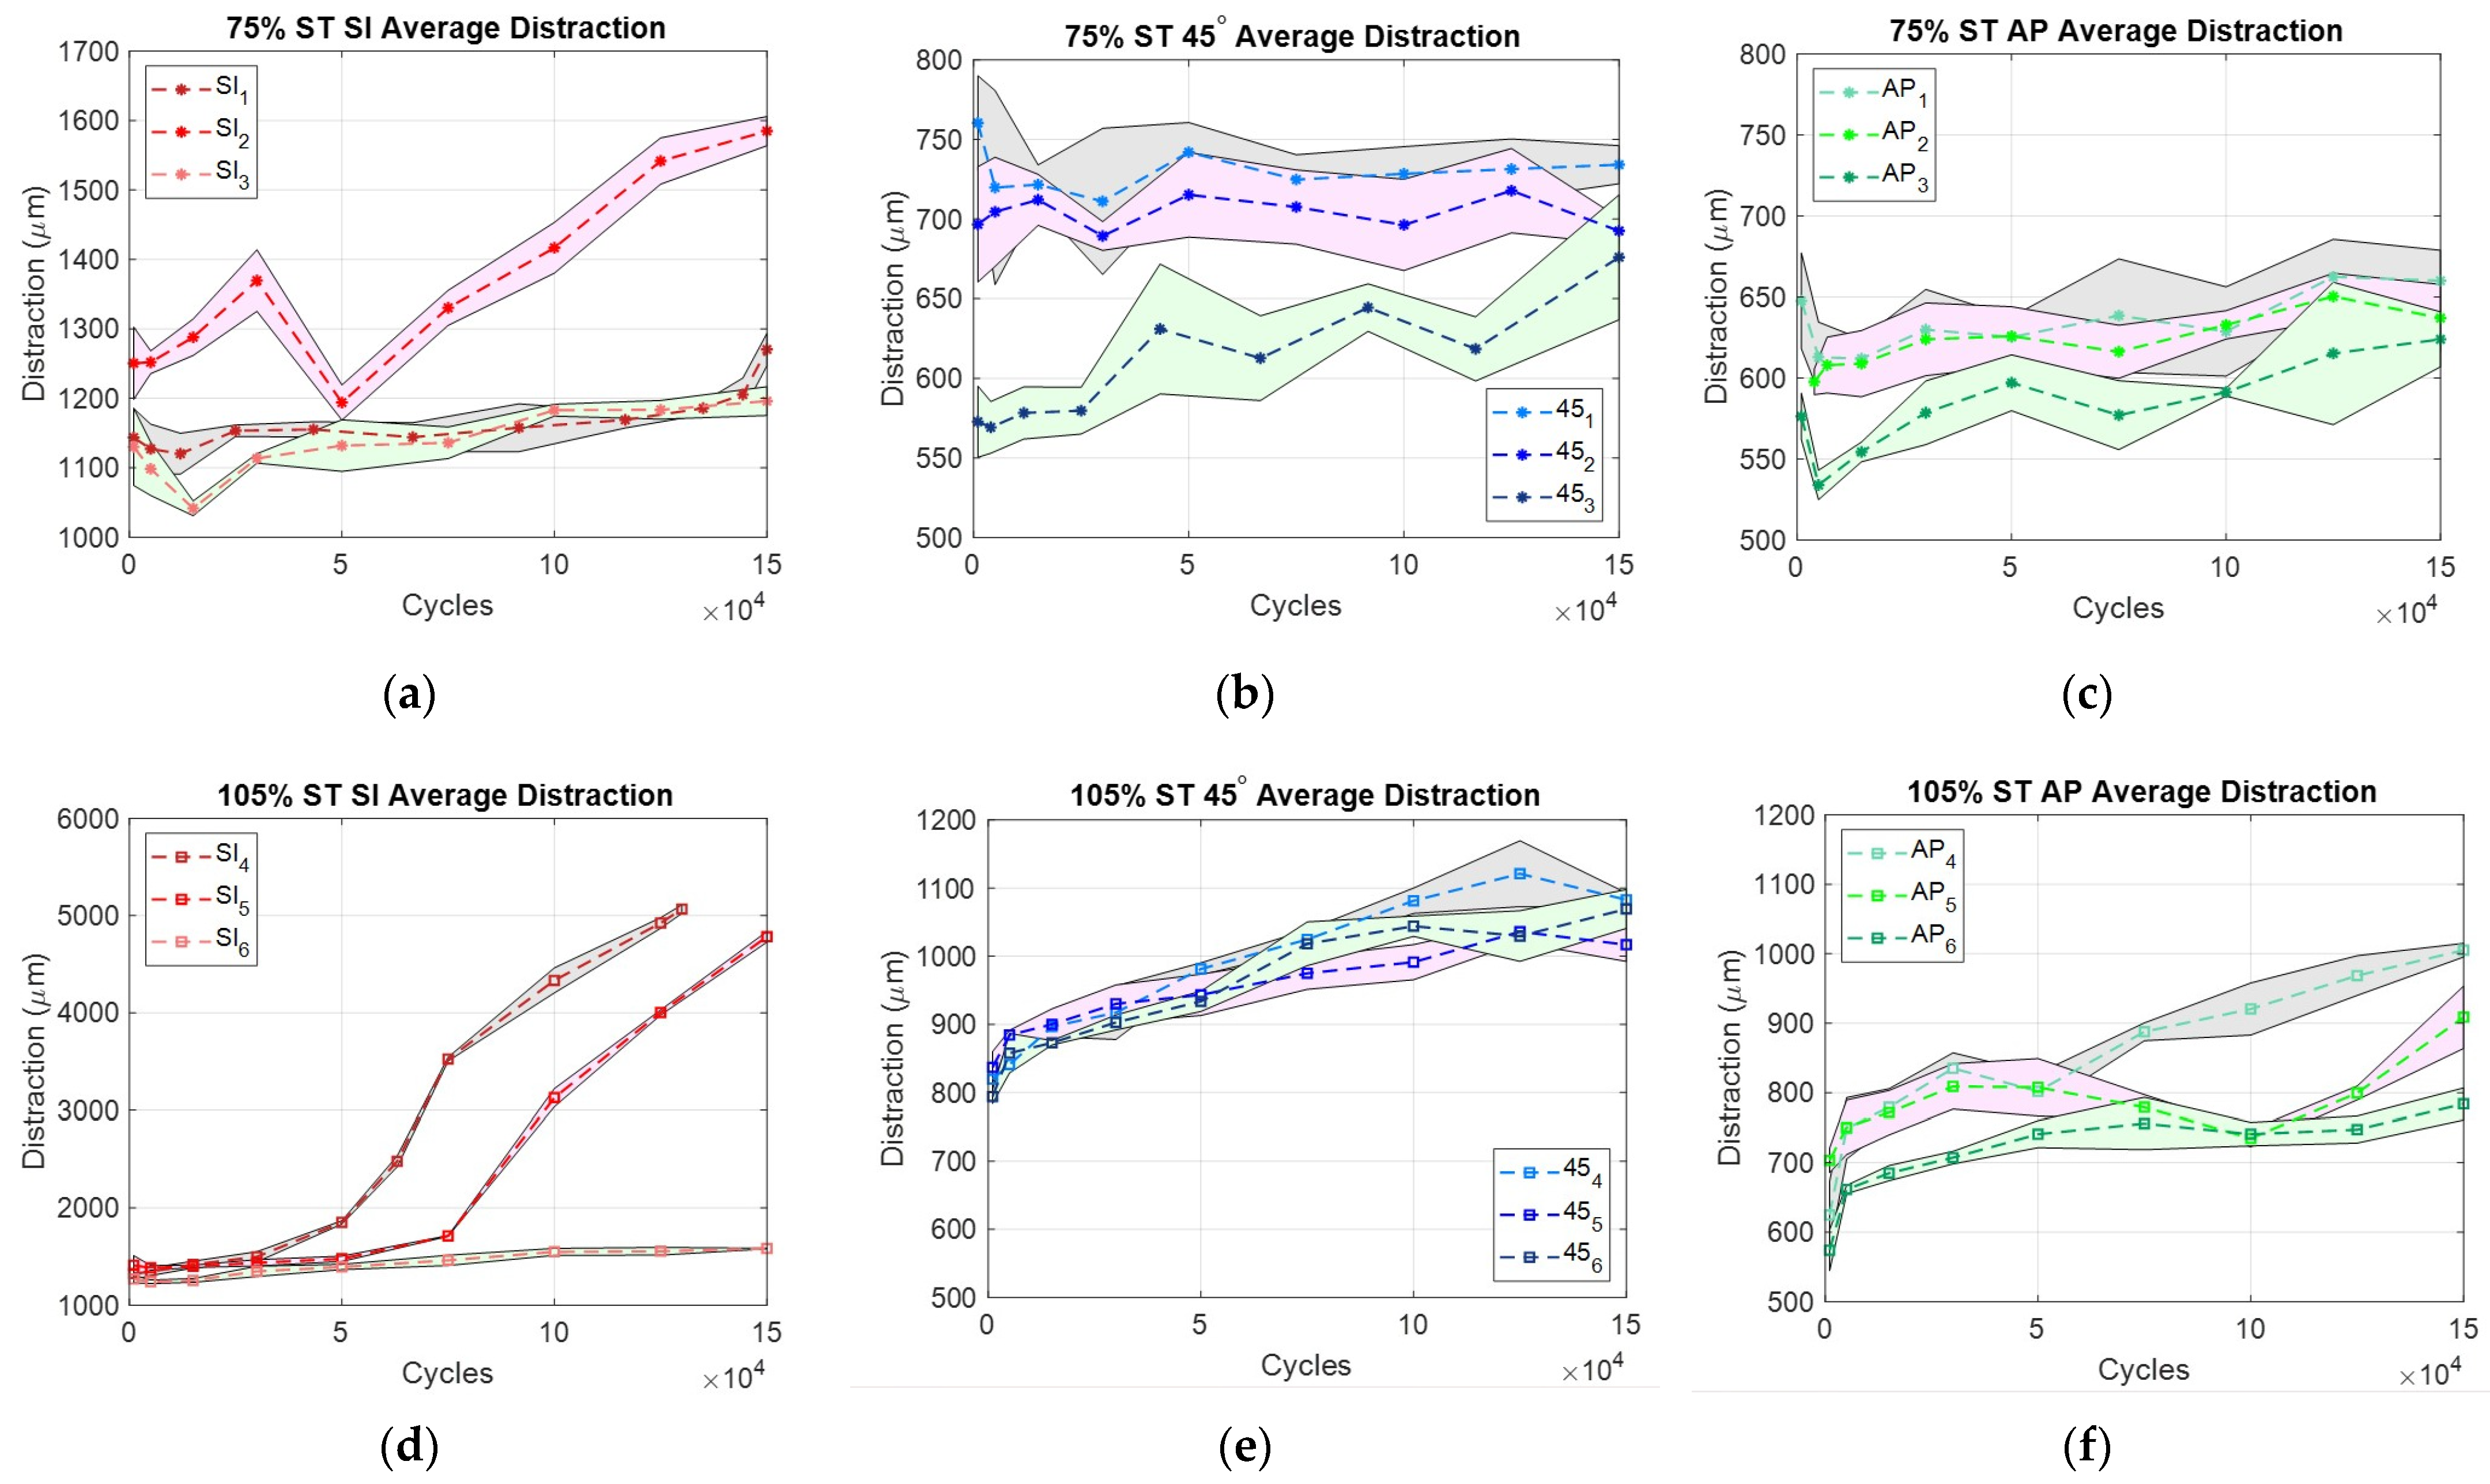
On average, over 150,000 cycles of articulation, the micromotion of SI samples at 75% ST increased by 147 µm (12.6%), 45° samples increased by 24 µm (3.6%), and AP samples increased by 33 µm (5.5%). One SI sample demonstrated a sharp increase after 140,000 cycles. The micromotion of SI samples at 105% ST increased by 2428 µm (181.9%), 45° samples increased by 239 µm (29.3%), and AP samples increased by 265 µm (41.8%). One SI sample oscillating at 105% ST was stopped short of the 150,000-cycle mark due to dissociation, which, as previously mentioned, indicates gross failure. Data were organized by ST distance in Figure 3 and by orientation in Figure 4. The graphs below compare micromotion per cycle across both variables, ST distance (Figure 3) and orientation (Figure 4).
Figure 3.
Comparison of Glenoid Distraction by ST distance. Note: Graphs are on a semi-log scale.
Figure 4.
Glenoid Distraction per sample, per orientation, and ST distance. (a–c): 75 ST, (d–f): 105 ST. Note: SI is on a different scale from 45 and AP. Bands indicate the standard deviation (SD) of motion analysis.
Two SI samples at 105% ST exhibited a steeper increase in relative motion between 50,000 and 100,000 cycles. Relative motion values at 105% ST were greater than those at 75% ST across all orientations. At 75% ST, relative motion did not exceed the clinically significant loosening threshold of 150 µm, with the SI orientation averaging 147 µm. At 105% ST, all three orientations surpassed the clinically significant threshold.
In Figure 4, it can be observed that there are clear differences in the amount of relative motion across different orientations. Across orientations, SI had the greatest percent increase in relative motion (Figure 4a,d), then AP (Figure 4c,f), then 45 (Figure 4b,e).
Final relative motion (mean ± SD), 95% CI at 105% ST was SI (2476.0 ± 1882.3 µm), [346.0–4606.0 µm]; 45 (239.6 ± 51.9 µm), [180.9–298.3 µm]; and AP (265.2 ± 99.7 µm), [152.4–378.0 µm], while 75% ST was SI (175.7 ± 140.7 µm), [16.5–334.9 µm]; 45° (24.3 ± 69.3 µm), [−54.1–102.7 µm]; and AP (33.1 ± 18.4 µm), [12.3–53.9 µm]. Relative motion demonstrated substantial variability and did not satisfy normality assumptions; therefore, non-parametric statistical testing was performed. Differences in final relative motion among the tested loading orientations were evaluated separately at 75% and 105% of the ST distance using Kruskal–Wallis tests.
No statistically significant differences in relative motion were detected among loading orientations at either 75% ST (p = 0.113) or 105% ST (p = 0.113). However, non-parametric effect size estimates indicated substantial practical differences between orientations (η2 = 0.393). Pairwise rank-biserial correlations demonstrated large effect sizes between groups (|r| = 0.78), with SI loading consistently associated with greater relative motion than both 45° and AP loading.
4. Discussion
The goal of this work was to design and test a novel style of measuring and monitoring simulated glenoid loosening. We therefore designed a rocking horse-style test that cyclically displaces a humeral head component against a glenoid component under an axial load along clinically relevant wear vectors at varying ST distances, which is capable of continuous monitoring to improve that understanding.
Continuous monitoring allowed for the comprehensive capture of the behavior of the in vitro aTSA system throughout testing. It showed that loosening over time is not linear and that there is sometimes a steep increase in loosening before subluxation or dislocation. Additionally, this method includes 27 points per test, but it is capable of taking an infinite number of points to further increase the resolution of loosening behavior. This will allow future work like mixed-effects models, repeated-measures approaches or nonlinear growth models to quantify how and when the glenoid-cement-bone interface begins to degrade.
The method was considered successful given the criteria listed above to evaluate the method that was proposed. There were notable differences among the 75% and 105% ST distance tests as well as among each orientation for the 5-peg worst-case components across orientations/ST distances that are consistent with expectations from mechanical loading (e.g., greater micromotion at 105% ST). Further, the detected differences were largely repeatable across replicate specimens, though some differences were observed—notably, for the 105% ST SI orientation, where two of the three samples had much higher loosening by the end of the test. This high variability may indicate the coexistence of different failure mechanisms, such as the physical variations in the glenoid-cement-bone interface, which are clinically representative variations and are thus considered acceptable in terms of evaluating this test method. Lastly, the image and the tracking quality were maintained throughout a run and across each run, and the automatic tracking algorithm can be run without human override for the majority of the videos, with simple manual overrides possible for the few unsuccessful video frames that were encountered.
This novel method will allow the comparison of different orientations and ST distances with a method of continuous monitoring. It allows unique, targeted evaluations of sets of wear vectors and ST distances, enabling the ability to test not only the clinically grounded vectors chosen in this study, but also any other recognized clinically relevant wear vectors or ST distances. When combined with continuous, high-precision monitoring, the proposed method is capable of describing the evolution of loosening behavior as a function of cycles of use at a more granular level.
We tested the hypotheses that SI loading would induce the most micromotion and relative motion, followed by 45°, then AP. As shown in the results, the SI orientation underwent the most micromotion over 150,000 cycles, then 45°, then AP. However, the hypothesis that SI orientation would experience the greatest amount of relative motion, then 45°, then AP, was incorrect, as there was the lowest overall increase in relative motion in the 45° intermediate angle. Additionally, the hypothesis that both micromotion and relative motion would be greater when testing at 105% ST distance than at 75% ST distance was correct.
To evaluate if there were statistically significant differences between orientations at each ST distance, a Kruskal–Wallis test was used to account for the natural variability in the small sample size. Using an α < 0.05, no statistically significant differences between orientations were detected at either 75% ST (p = 0.11) or 105% ST (p = 0.11). However, the large effect size (η2 = 0.39) and strong rank-biserial correlations (|r| ≈ 0.78) suggest that orientation creates notable differences in how the implant behaves, with the SI orientation consistently demonstrating the greatest relative motion. Though larger sample sizes are needed for statistical significance, these results indicate that implant stability is likely sensitive to both articulation direction and ST magnitude.
The amount of relative motion that the glenoids experience is largely subject to the amount and orientation of the backside pegs that stabilize the construct to the bone [36]. One possibility why the 45° intermediate angle had less overall relative motion was that the glenoid that was tested had 5 pegs, which may increase stability along intermediate axes. However, 4-peg glenoids, keeled glenoids, and other designs are also used in vivo [36]. These other designs, particularly designs with asymmetry, may be more susceptible to loosening at intermediate wear vectors. This method may be especially of importance for those other designs, which are even more likely to reach clinically relevant levels of loosening as a result of loading along intermediate directions.
Additionally, the differences in relative motion observed across the different ST distances can be helpful in comparing a healthy versus loose shoulder implant. At 75% ST distance, the shoulder did not experience significant loosening in any orientation. However, at 105% ST distance, there was clinically relevant loosening in all orientations. This extreme case may represent a patient with an improperly tensioned shoulder implant who may experience more than a 90% ST on average. High ST articulations may augment and/or accelerate the loosening process, which would lead to earlier revision [37]. One potential outcome of this work is a reevaluation of the 90% ASTM standard to determine whether it accurately reflects the mechanical forces experienced by the shoulder.
This method shows that continuously monitoring a glenoid’s simulated articulation in various orientations and ST distances can provide a more thorough evaluation of an implant’s loosening characteristics before it is deployed in vivo. The modified technique highlights behaviors that single-axis, fixed-distance testing cannot capture, and it does so with a temporal resolution showing the progression to failure. It enables device manufacturers and designers to conduct a more comprehensive evaluation of the glenoid components they develop for market introduction. Ultimately, this technique offers a powerful tool to more accurately characterize loosening patterns in anatomic shoulder implants and serves as a versatile platform to test specific implant designs or modifications as they arise, thereby supporting ongoing improvements in implant durability and patient outcomes. This work supports design-specific evaluation of glenoid components before market introduction and provides an evidence base for reexamining the single-axis, 90% ST assumptions embedded in ASTM F2028-17.
Limitations
Several limitations were identified in this work, encompassing both challenges with the setup and addressable issues that could be explored in future research.
There are certain possible errors within the testing system that are of note. There is potential side-to-side motion of the lever arm as the humeral head articulates against the glenoid. Though the lever arm is braced on both sides at the top, there may be small side-to-side motion at the site of articulation. This was measured with a dial gauge to remain below 0.3 mm. This side-to-side motion was more prominent in the 45° tests, due to the asymmetric curvature of the glenoid along the path of humeral head articulation. However, the top and bottom displacements are combined into a single metric through the data processing method, effectively averaging out these differences.
There may also have been variation in the load applied to the site of articulation. The load will exceed the 750 N setpoint as more compression of the spring occurs at the top and bottom of the translation path. Based on spring length, spring constant, and spring compression, the maximum change in force due to dynamic compression of the spring is a function of the displacement multiplied by 30 N/mm. Observed travel of the system places the absolute change in force at no more than 45 N, or 6%. This effect will decrease in magnitude as loosening occurs, and we acknowledge this as a limitation of the approach.
This method does not allow for an opaque medium, such as bovine serum or blood, to be used as the system relies on optics to track motion. The composition of the lubricating and cooling fluid can have a significant effect on surface-originated wear of polyethylene, but water has been shown to have a negligible effect on the subsurface failure rate when compared to tests run in serum [38,39]. Since this test is designed to challenge the non-articular surface, the choice of fluid reasonably prioritizes optical clarity over protein content. Additionally, Tracker needs human input to find and track the correct set of pixels for each tracked entity for each video data set. We also acknowledge that human bias is a limitation in this tracking approach.
There are a few addressable issues that can be explored further. Because this study was designed to test three orientations at each of two ST distances, three repetitions for each condition balanced repeated measures and a full factorial experiment. However, to have greater power in statistical assertions, more repetitions of each condition need to be tested.
Finally, the cement technique is of note. While the glenoids were cemented by an expert physician in production line fashion, it was observed that variable amounts of cement squeezed from the interface. While this cementing variability may be clinically relevant, this method did not quantify this variable nor how it contributed to the observed results. Future development of this method could integrate an analysis to incorporate the level of cementation.
Author Contributions
Conceptualization, D.W.V.C. and J.-E.B.; methodology, D.V.W.III and P.C.S.; software, D.V.W.III and P.C.S.; validation, D.V.W.III, P.C.S. and D.W.V.C.; formal analysis, D.V.W.III; investigation, D.V.W.III and P.C.S.; resources, D.W.V.C. and J.-E.B.; data curation, D.V.W.III; writing—original draft preparation, D.V.W.III; writing—review and editing, D.V.W.III, P.C.S., J.-E.B., G.M.L. and D.W.V.C.; visualization, D.V.W.III; supervision, D.W.V.C.; project administration, D.W.V.C. All authors have read and agreed to the published version of the manuscript.
Funding
This research was not externally funded.
Institutional Review Board Statement
Not applicable.
Informed Consent Statement
Not applicable.
Data Availability Statement
The data that support the findings of this study are available upon reasonable request from the authors: D.V.W.III, D.W.V.C.
Acknowledgments
The authors would like to thank Medacta International for their generous contribution of the glenoid components for this research, and Peter Shaughnessy of Dartmouth College for his valuable discussions and assistance with cementing the glenoids.
Conflicts of Interest
The senior author declares laboratory funding as Principal Investigator from DePuy Synthes Joint Reconstruction and Medacta International. These funders had no role in the design, execution, interpretation, or writing of the study.
Abbreviations
The following abbreviations are used in this manuscript:
| aTSA | Anatomic Total Shoulder Arthroplasty |
| AVN | Avascular Necrosis |
| SI | Superior Inferior Axis |
| 45° | Intermediate 45-degree angle Axis |
| AP | Anterior–Posterior Axis |
| ST | Subluxation Translation (Distance) |
| fps | Frames per second |
References
- Dragonas, C.G.; Mamarelis, G.; Dott, C.; Waseem, S.; Bajracharya, A.; Leivadiotou, D. Anatomic Total Shoulder Arthroplasty Versus Reverse Total Shoulder Arthroplasty in Patients Aged Over 70 Without a Full-Thickness Rotator Cuff Tear: A Systematic Review and Meta-Analysis. J. Shoulder Elb. Arthroplast. 2023, 7, 24715492231206685. [Google Scholar] [CrossRef] [Scilit] [PubMed]
- AAOS Shoulder Joint Replacement—OrthoInfo—AAOS. Available online: https://www.orthoinfo.org/en/treatment/shoulder-joint-replacement/ (accessed on 23 October 2024).
- Deshmukh, A.V.; Koris, M.; Zurakowski, D.; Thornhill, T.S. Total Shoulder Arthroplasty: Long-Term Survivorship, Functional Outcome, and Quality of Life. J. Shoulder Elb. Surg. 2005, 14, 471–479. [Google Scholar] [CrossRef] [Scilit] [PubMed]
- Papadonikolakis, A.; Neradilek, M.B.; Matsen, F.A. Failure of the Glenoid Component in Anatomic Total Shoulder Arthroplasty: A Systematic Review of the English-Language Literature between 2006 and 2012. J. Bone Jt. Surg. Am. 2013, 95, 2205–2212. [Google Scholar] [CrossRef] [Scilit] [PubMed]
- Pinkas, D.; Wiater, B.; Wiater, J.M. The Glenoid Component in Anatomic Shoulder Arthroplasty. J. Am. Acad. Orthop. Surg. 2015, 23, 317–326. [Google Scholar] [CrossRef] [Scilit]
- Strauss, E.J.; Roche, C.; Flurin, P.-H.; Wright, T.; Zuckerman, J.D. The Glenoid in Shoulder Arthroplasty. J. Shoulder Elb. Surg. 2009, 18, 819–833. [Google Scholar] [CrossRef] [Scilit] [PubMed]
- Matsen, F.A.; Clinton, J.; Lynch, J.; Bertelsen, A.; Richardson, M.L. Glenoid Component Failure in Total Shoulder Arthroplasty. J. Bone Jt. Surg. Am. 2008, 90, 885–896. [Google Scholar] [CrossRef] [Scilit] [PubMed]
- Polisetty, T.S.; Swanson, D.P.; Hart, P.-A.J.; Cannon, D.J.; Glass, E.A.; Jawa, A.; Levy, J.C.; Kirsch, J.M. Anatomic and Reverse Shoulder Arthroplasty for Management of Type B2 and B3 Glenoids: A Matched-Cohort Analysis. J. Shoulder Elb. Surg. 2023, 32, 1629–1637. [Google Scholar] [CrossRef] [Scilit] [PubMed]
- Valencia-Ramon, E.A.; Pasache-Lozano, R.; Bishop, A.L.; Johnston, D.G.; Trenholm, J.A.I. Analysis on Revision Rates of Shoulder Arthroplasty at a Single Referral Center in Canada. Semin. Arthroplast. JSES 2023, 33, 535–541. [Google Scholar] [CrossRef] [Scilit]
- Pilliar, R.M.; Lee, J.M.; Maniatopoulos, C. Observations on the Effect of Movement on Bone Ingrowth into Porous-Surfaced Implants. Clin. Orthop. 1986, 208, 108–113. [Google Scholar] [CrossRef] [Scilit]
- Franklin, J.L.; Barrett, W.P.; Jackins, S.E.; Matsen, F.A. Glenoid Loosening in Total Shoulder Arthroplasty. Association with Rotator Cuff Deficiency. J. Arthroplast. 1988, 3, 39–46. [Google Scholar] [CrossRef] [Scilit] [PubMed]
- Karelse, A.; Van Tongel, A.; Verstraeten, T.; Poncet, D.; De Wilde, L.F. Rocking-Horse Phenomenon of the Glenoid Component: The Importance of Inclination. J. Shoulder Elb. Surg. 2015, 24, 1142–1148. [Google Scholar] [CrossRef] [Scilit] [PubMed]
- Chen, Z.; Fan, X.; Gao, Y.; Zhang, J.; Guo, L.; Chen, S.; Jin, Z. Effect of Rotator Cuff Deficiencies on Muscle Forces and Glenohumeral Contact Force After Anatomic Total Shoulder Arthroplasty Using Musculoskeletal Multibody Dynamics Simulation. Front. Bioeng. Biotechnol. 2021, 9, 691450. [Google Scholar] [CrossRef] [Scilit] [PubMed]
- Harryman, D.T.; Sidles, J.A.; Clark, J.M.; McQuade, K.J.; Gibb, T.D.; Matsen, F.A. Translation of the Humeral Head on the Glenoid with Passive Glenohumeral Motion. J. Bone Jt. Surg. Am. 1990, 72, 1334–1343. [Google Scholar] [CrossRef] [Scilit]
- Kelkar, R.; Wang, V.M.; Flatow, E.L.; Newton, P.M.; Ateshian, G.A.; Bigliani, L.U.; Pawluk, R.J.; Mow, V.C. Glenohumeral Mechanics: A Study of Articular Geometry, Contact, and Kinematics. J. Shoulder Elb. Surg. 2001, 10, 73–84. [Google Scholar] [CrossRef] [Scilit] [PubMed]
- ASTM F2028-17; Standard Test Methods for Dynamic Evaluation of Glenoid Loosening or Disassociation. ASTM International: West Conshohocken, PA, USA, 2017. Available online: https://www.astm.org/f2028-02.html (accessed on 24 October 2024).
- Anglin, C.; Wyss, U.P.; Pichora, D.R. Mechanical Testing of Shoulder Prostheses and Recommendations for Glenoid Design. J. Shoulder Elb. Surg. 2000, 9, 323–331. [Google Scholar] [CrossRef] [Scilit] [PubMed]
- Anglin, C.; Wyss, U.P.; Pichora, D.R. Shoulder Prosthesis Subluxation: Theory and Experiment. J. Shoulder Elb. Surg. 2000, 9, 104–114. [Google Scholar] [CrossRef]
- Anglin, C.; Wyss, U.P.; Pichora, D.R. Glenohumeral Contact Forces. Proc. Inst. Mech. Eng. Part H J. Eng. Med. 2000, 214, 637–644. [Google Scholar] [CrossRef] [Scilit] [PubMed]
- Budge, M.D.; Kurdziel, M.D.; Baker, K.C.; Wiater, J.M. A Biomechanical Analysis of Initial Fixation Options for Porous-Tantalum-Backed Glenoid Components. J. Shoulder Elb. Surg. 2013, 22, 709–715. [Google Scholar] [CrossRef] [Scilit] [PubMed]
- Cioffi, M.; Necchi, S.; Villa, T.; Pennati, G. Experimental Evaluation of the Testing Conditions Influence on Shoulder Prostheses Subluxation and Edge Displacement during Astm F2028-05 Testing. J. Mech. Med. Biol. 2010, 10, 341–352. [Google Scholar] [CrossRef] [Scilit]
- Junaid, S.; Gregory, T.; Fetherston, S.; Emery, R.; Amis, A.A.; Hansen, U. Cadaveric Study Validating in Vitro Monitoring Techniques to Measure the Failure Mechanism of Glenoid Implants against Clinical CT. J. Orthop. Res. 2018, 36, 2524. [Google Scholar] [CrossRef] [Scilit] [PubMed]
- Stautberg, E.F.; Jupiter, D.C.; Amin, A.; Qadeer, A.A.; Ilahi, O.A. Stability of Two versus Three Peripheral Pegs of the Glenoid Component in Modern Total Shoulder Arthroplasty. Int. Orthop. 2017, 41, 2345–2351. [Google Scholar] [CrossRef] [Scilit] [PubMed]
- Wang, T.; Abrams, G.D.; Behn, A.W.; Lindsey, D.; Giori, N.; Cheung, E.V. Posterior Glenoid Wear in Total Shoulder Arthroplasty: Eccentric Anterior Reaming Is Superior to Posterior Augment. Clin. Orthop. 2015, 473, 3928. [Google Scholar] [CrossRef] [Scilit] [PubMed]
- Roche, C.P.; Staunch, C.; Hahn, W.; Grey, S.G.; Flurin, P.-H.; Wright, T.W.; Zuckerman, J.D. Analysis of Glenoid Fixation with Anatomic Total Shoulder Arthroplasty in an Extreme Cyclic Loading Scenario. Bull. Hosp. Jt. Dis. 2015, 73, S57–S62. [Google Scholar]
- Gregory, T.; Hansen, U.; Taillieu, F.; Baring, T.; Brassart, N.; Mutchler, C.; Amis, A.; Augereau, B.; Emery, R. Glenoid Loosening after Total Shoulder Arthroplasty: An in Vitro CT-Scan Study. J. Orthop. Res. Off. Publ. Orthop. Res. Soc. 2009, 27, 1589–1595. [Google Scholar] [CrossRef] [Scilit] [PubMed]
- Sarah, J.; Sanjay, G.; Sanjay, S.; Carolyn, A.; Emery, R.; Andrew, A.; Ulrich, H. Failure Mechanism of the All-Polyethylene Glenoid Implant. J. Biomech. 2010, 43, 714. [Google Scholar] [CrossRef] [Scilit] [PubMed]
- Guarino, I.D.; Shaughnessy, P.J.; Torrey, J.S.; Bell, J.-E.; Van Citters, D.W. Rate of Polyethylene Wear Correlates with Earlier Glenoid Implant Failure in Anatomic Total Shoulder Arthroplasty with Cemented All-Polyethylene Glenoid Components. Semin. Arthroplast. JSES 2024, 34, 893–899. [Google Scholar] [CrossRef] [Scilit]
- Wirth, M.A.; Klotz, C.; Deffenbaugh, D.L.; McNulty, D.; Richards, L.; Tipper, J.L. Cross-Linked Glenoid Prosthesis: A Wear Comparison to Conventional Glenoid Prosthesis with Wear Particulate Analysis. J. Shoulder Elb. Surg. 2009, 18, 130–137. [Google Scholar] [CrossRef] [Scilit] [PubMed]
- Anglin, C.; Wyss, U.P.; Nyffeler, R.W.; Gerber, C. Loosening Performance of Cemented Glenoid Prosthesis Design Pairs. Clin. Biomech. 2001, 16, 144–150. [Google Scholar] [CrossRef] [Scilit]
- Roche, C.; Angibaud, L.; Flurin, P.H.; Wright, T.; Zuckerman, J. Glenoid Loosening in Response to Dynamic Multi-Axis Eccentric Loading: A Comparison between Keeled and Pegged Designs with an Equivalent Radial Mismatch. Bull. Hosp. Jt. Dis. 2006, 63, 88–92. [Google Scholar] [PubMed]
- Geary, C.; Jones, E.; Fitzpatrick, D.; Kelly, C.P.; Birkinshaw, C. In-Vitro Evaluation of a Polyurethane Compliant-Layer Glenoid for Use in Shoulder Arthroplasty. Proc. Inst. Mech. Eng. Part H J. Eng. Med. 2010, 224, 551–563. [Google Scholar] [CrossRef] [Scilit] [PubMed]
- Geary, C.; O’Donnell, G.E.; Jones, E.; FitzPatrick, D.; Birkinshaw, C. Automated In-Vitro Testing of Orthopaedic Implants: A Case Study in Shoulder Joint Replacement. Proc. Inst. Mech. Eng. Part H J. Eng. Med. 2010, 224, 1297–1309. [Google Scholar] [CrossRef] [Scilit] [PubMed]
- Melvani, R.; Diaz, M.A.; Wilder, L.; Christmas, K.N.; Simon, P.; Cronin, K.J.; Mighell, M.A.; Frankle, M.A. Improved Mechanical Fixation of an All-Polyethylene Glenoid Reduces Postoperative Radiolucent Lines. J. Shoulder Elb. Surg. 2022, 31, e386–e398. [Google Scholar] [CrossRef] [Scilit] [PubMed]
- Torkan, L.F.; Bryant, J.T.; Bicknell, R.T.; Ploeg, H.-L. Accuracy of an Apparatus for Measuring Glenoid Baseplate Micromotion in Reverse Shoulder Arthroplasty. J. Med. Devices 2022, 16, 041008. [Google Scholar] [CrossRef] [Scilit]
- Liu, C.; Shi, L.; Amirouche, F. Glenoid Prosthesis Design Considerations in Anatomic Total Shoulder Arthroplasty. J. Shoulder Elb. Arthroplast. 2022, 6, 24715492221142856. [Google Scholar] [CrossRef] [Scilit] [PubMed]
- Gerber, C.; Costouros, J.G.; Sukthankar, A.; Fucentese, S.F. Static Posterior Humeral Head Subluxation and Total Shoulder Arthroplasty. J. Shoulder Elb. Surg. 2009, 18, 505–510. [Google Scholar] [CrossRef] [Scilit] [PubMed]
- Kennedy, F.E.; Currier, J.H.; Plumet, S.; Duda, J.L.; Gestwick, D.P.; Collier, J.P.; Currier, B.H.; Dubourg, M.-C. Contact Fatigue Failure of Ultra-High Molecular Weight Polyethylene Bearing Components of Knee Prostheses. J. Tribol. 2000, 122, 332–339. [Google Scholar] [CrossRef] [Scilit]
- Van Citters, D.W.; Kennedy, F.E.; Currier, J.H.; Collier, J.P.; Nichols, T.D. A Multi-Station Rolling/Sliding Tribotester for Knee Bearing Materials. J. Tribol. 2004, 126, 380–385. [Google Scholar] [CrossRef] [Scilit]
Disclaimer/Publisher’s Note: The statements, opinions and data contained in all publications are solely those of the individual author(s) and contributor(s) and not of MDPI and/or the editor(s). MDPI and/or the editor(s) disclaim responsibility for any injury to people or property resulting from any ideas, methods, instructions or products referred to in the content. |
© 2026 by the authors. Licensee MDPI, Basel, Switzerland. This article is an open access article distributed under the terms and conditions of the Creative Commons Attribution (CC BY) license.