


Abstract
The mechanical sensitivity of energetic materials is closely linked to the stability of their microstructures; however, in situ observation of their dynamic response under external mechanical stimuli at the atomic scale remains challenging. Here, we propose a deep-learning-based intelligent analysis method for scanning tunneling microscopy (STM) images of a next-generation insensitive energetic material 3-nitro-1,2,4-triazol-5-one (NTO). We design SpecMol, a lightweight segmentation network with frequency-domain awareness, which achieves high-precision segmentation and orientation recognition of individual NTO molecules in adsorption images. Building upon this, we apply localized external forces to one-dimensional NTO nanochains via in situ STM tip manipulation and quantitatively analyze the geometric evolution of their fundamental building blocks—dimers. Experimental results reveal that, following mechanical perturbation, the relative orientation angle within the dimer (averaging approximately 14.55°) remains highly stable (CCC = 0.834), confirming the remarkable structural rigidity of NTO dimers. This study provides, for the first time, direct microscopic evidence at real-space atomic resolution for the low mechanical sensitivity of NTO, elucidating that its exceptional local structural stability originates from rigid dimeric units stabilized by an extensive hydrogen-bonding network. Our findings not only deepen the fundamental understanding of the safety performance of energetic materials but also demonstrate the powerful potential of integrating artificial intelligence with advanced characterization techniques for molecular-scale functional materials research.
1. Introduction
Energetic materials hold irreplaceable strategic value and research potential in defense technology, aerospace engineering, and civil blasting applications. In contrast to conventional energetic materials—such as RDX and HMX—the performance of which is limited by energy density constraints, a new generation of energetic materials, exemplified by 3-nitro-1,2,4-triazol-5-one (NTO), aims to simultaneously maintain high energy density and significantly reduce sensitivity to mechanical stimuli (e.g., impact and friction), thereby enhancing operational safety [1,2]. Although the macroscopic safety performance of NTO has been well established, experimental evidence at the atomic scale regarding the response of its microstructure to localized mechanical perturbations remains lacking [3,4].
Scanning tunneling microscopy (STM) is widely recognized as a premier tool for investigating molecular orientation, intermolecular interactions, and conformational evolution in surface self-assembled systems, owing to its submolecular spatial resolution. Recently, STM has been effectively employed to elucidate the microscopic behavior of various surface-adsorbed energetic molecular thin films, including DOATF and NBM [5,6]. Notably, studies by Türker et al. have confirmed that NTO molecules exhibit excellent imaging stability on metal substrates [7]. Consequently, in situ STM observation offers a viable pathway to uncover the structural response and energy dissipation mechanisms of NTO molecules under nanoscale mechanical manipulation.
In current research, systematic and quantitative analysis of the surface assembly patterns—particularly the local conformational tunability—of molecules such as NTO, which possess multiple hydrogen-bonding sites and complex dipolar characteristics, remains lacking. This gap is primarily attributed to the limitations of conventional image analysis methods in accurately extracting single-molecule orientation information from STM images [8].
Meanwhile, artificial intelligence—particularly deep learning—has demonstrated tremendous potential in image processing, prompting researchers to integrate advanced computer vision techniques into the analysis of high-resolution scanning tunneling microscopy (STM) images, with remarkable success. Beyond high-level interpretation, deep learning has also revolutionized low-level STM image enhancement; for example, Lingtao Zhan et al. recently developed a deep denoising network that effectively suppresses quantum noise and thermal drift artifacts while preserving atomic-scale features [9]. In STM image analysis, the most direct and widespread application of deep learning lies in the intelligent recognition and classification of microscopic structures. For instance, Ziatdinov et al. have employed convolutional neural networks (CNNs) to automatically identify fundamental structural units (e.g., molecules, atoms, or defects) in STM images and perform fine-grained classification of their complex states—including conformation, orientation, chirality, and dopant type. These approaches significantly surpass conventional image processing methods (such as Fourier transform or threshold-based segmentation) and enable full-information decoding of aperiodic, multi-degree-of-freedom microscopic system [10,11,12,13].
Moreover, some studies have focused on STM image preprocessing and enhancement. For example, F. Joucken et al. applied a supervised CNN to denoise STM images of low signal-to-noise systems such as graphene, substantially improving image quality while preserving atomic-scale details [14].
As AI technologies continue to advance, research efforts have further expanded toward the intelligent interpretation of structure—function relationships. Notably, T. Fu, L. Kurki, and others have explored the use of neural networks to infer electronic properties or chemical reactivity of sample surfaces directly from STM data, establishing a novel paradigm for uncovering physicochemical mechanisms at the nanoscale [15,16].
While manual analysis is feasible for small datasets, it lacks the objectivity, throughput, and sub-pixel precision required here. Detecting subtle mechanical deformations (<2°) across thousands of molecules demands a statistical rigor and noise robustness that human observation and conventional thresholding cannot achieve [17,18]. Thus, AI is essential to eliminate observer bias and enable the quantitative reliability of our findings.
In this work, we employ a deep-learning-based image segmentation neural network to achieve high-precision segmentation of NTO molecular adsorption images acquired by scanning tunneling microscopy (STM), enabling the extraction of orientation information for individual molecules. Building on this capability, we quantitatively analyze the relative intermolecular angle within NTO dimers in one-dimensional nanochains before and after applying localized mechanical perturbations via the STM tip. The results reveal that this dimeric angle remains essentially unchanged following external disturbance, demonstrating that the NTO dimeric unit possesses remarkable structural rigidity and can preserve its internal geometric configuration under mechanical stress. This atomic-scale experimental evidence elucidates the exceptional local structural stability of NTO molecular assemblies and provides direct microscopic insight into the origin of its low mechanical sensitivity as a high-energy, insensitive energetic material.
2. Materials and Methods
In this study, single-crystal Au(111) was used as the substrate. Under ultrahigh vacuum (UHV) conditions (base pressure better than 1 × 10⁻¹⁰ mbar), the surface contaminants were first removed by Ar+ ion sputtering (1 keV energy, grazing incidence), followed by annealing at 700 K to obtain an atomically flat and clean Au(111) surface exhibiting the characteristic herringbone reconstruction [19]. Subsequently, thermally purified NTO molecules were loaded into a Knudsen cell and thermally deposited onto the room-temperature Au(111).
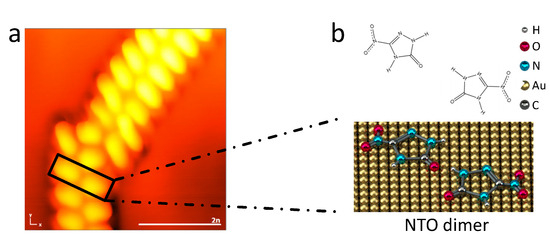
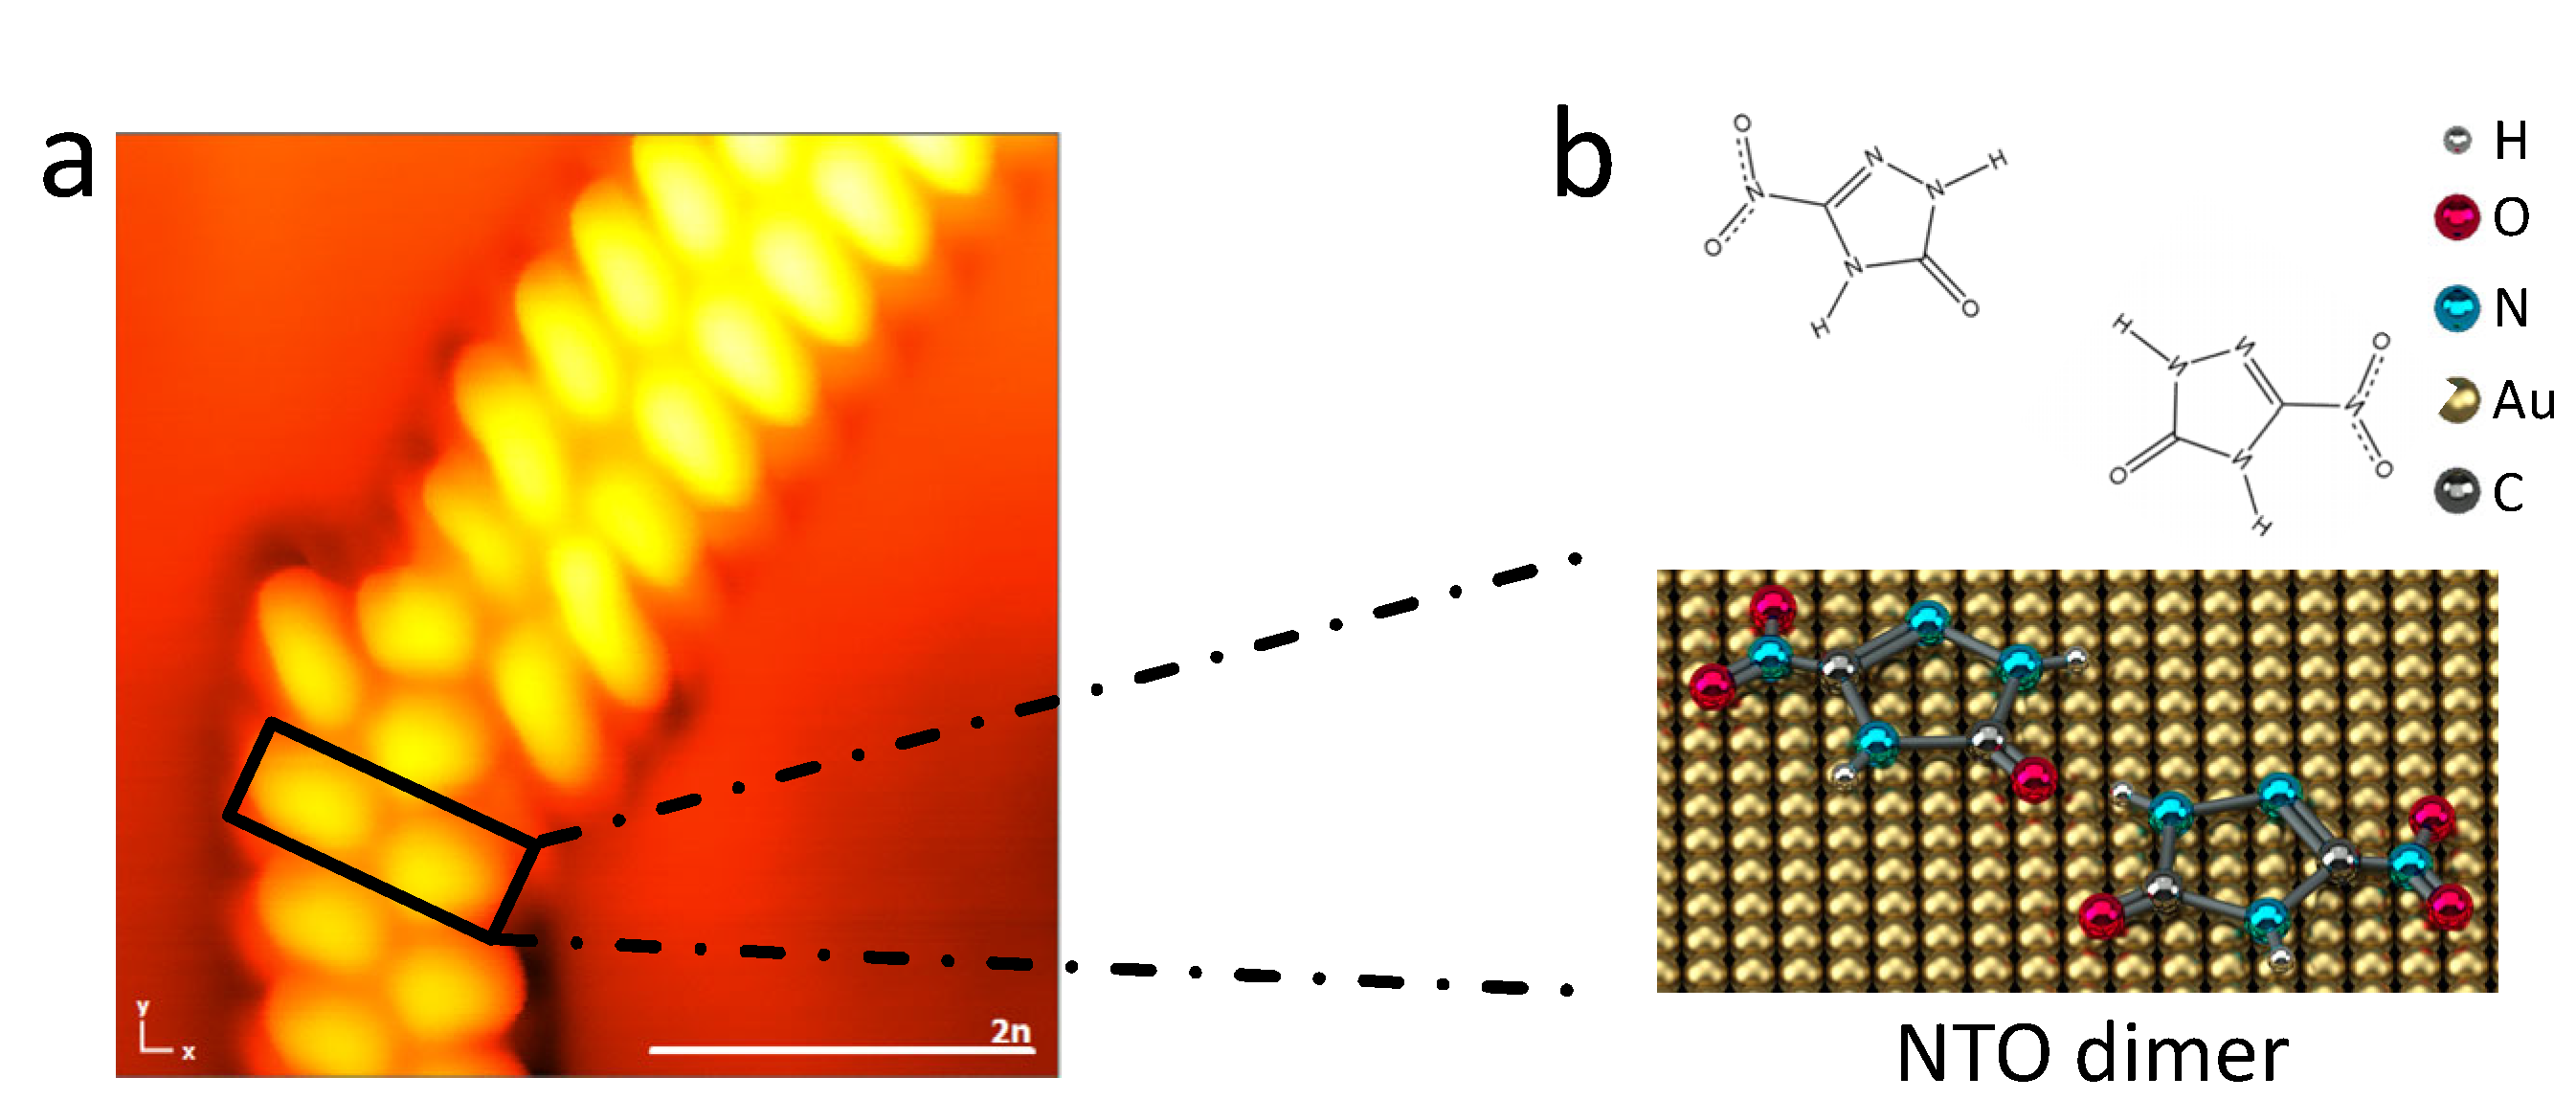
Subsequently, the sample surface morphology and molecular assembly structures were characterized in situ using an ultrahigh vacuum scanning tunneling microscope (STM, Createc GmbH & Co. KG, Dortmund, Germany) operating at 5 K with a base pressure better than 1 × 10⁻¹⁰ mbar. As shown in Figure 1a, NTO molecules self-assemble into highly ordered one-dimensional double-chain superstructures via a cooperative network of directional hydrogen bonds, with well-defined dimers serving as the fundamental building blocks. Based on previous studies, NTO molecules exhibit a distinct one-dimensional double-chain architecture stabilized by a cooperative network of directional hydrogen bonds—specifically, strong O···H interactions coupling the two parallel molecular rows and O···H/N···H bonds internally stabilizing each row. Within this double-chain structure, we define the funda-mental repeating unit as a dimer, as illustrated in Figure 1b [20,21,22,23].
Figure 1.
STM imaging of NTO molecules on Au(111) surface. (a) An exemplary STM image showing NTO molecules self-assembled into one-dimensional chain-like structures. The image was acquired at a bias voltage of 0.04 V. (b) Schematic representation of the basic building unit within the NTO chains, highlighting the dimeric configuration.
The scanning bias voltage in this study covers a range from −2.5 V to +3.8 V. To clearly illustrate the geometric features of the chain-like arrangement of NTO molecules, we selected STM images acquired at approximately 0.04 V within this range for detailed analysis, as low bias ensures high spatial resolution of molecular frontier orbitals. Under this bias condition, the NTO molecules exhibit a strong tunneling current response with clear boundary contrast, which facilitates subsequent image segmentation and precise extraction of structural parameters.
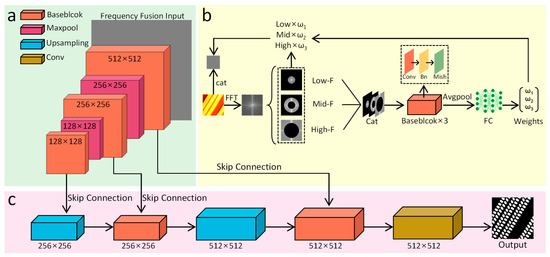
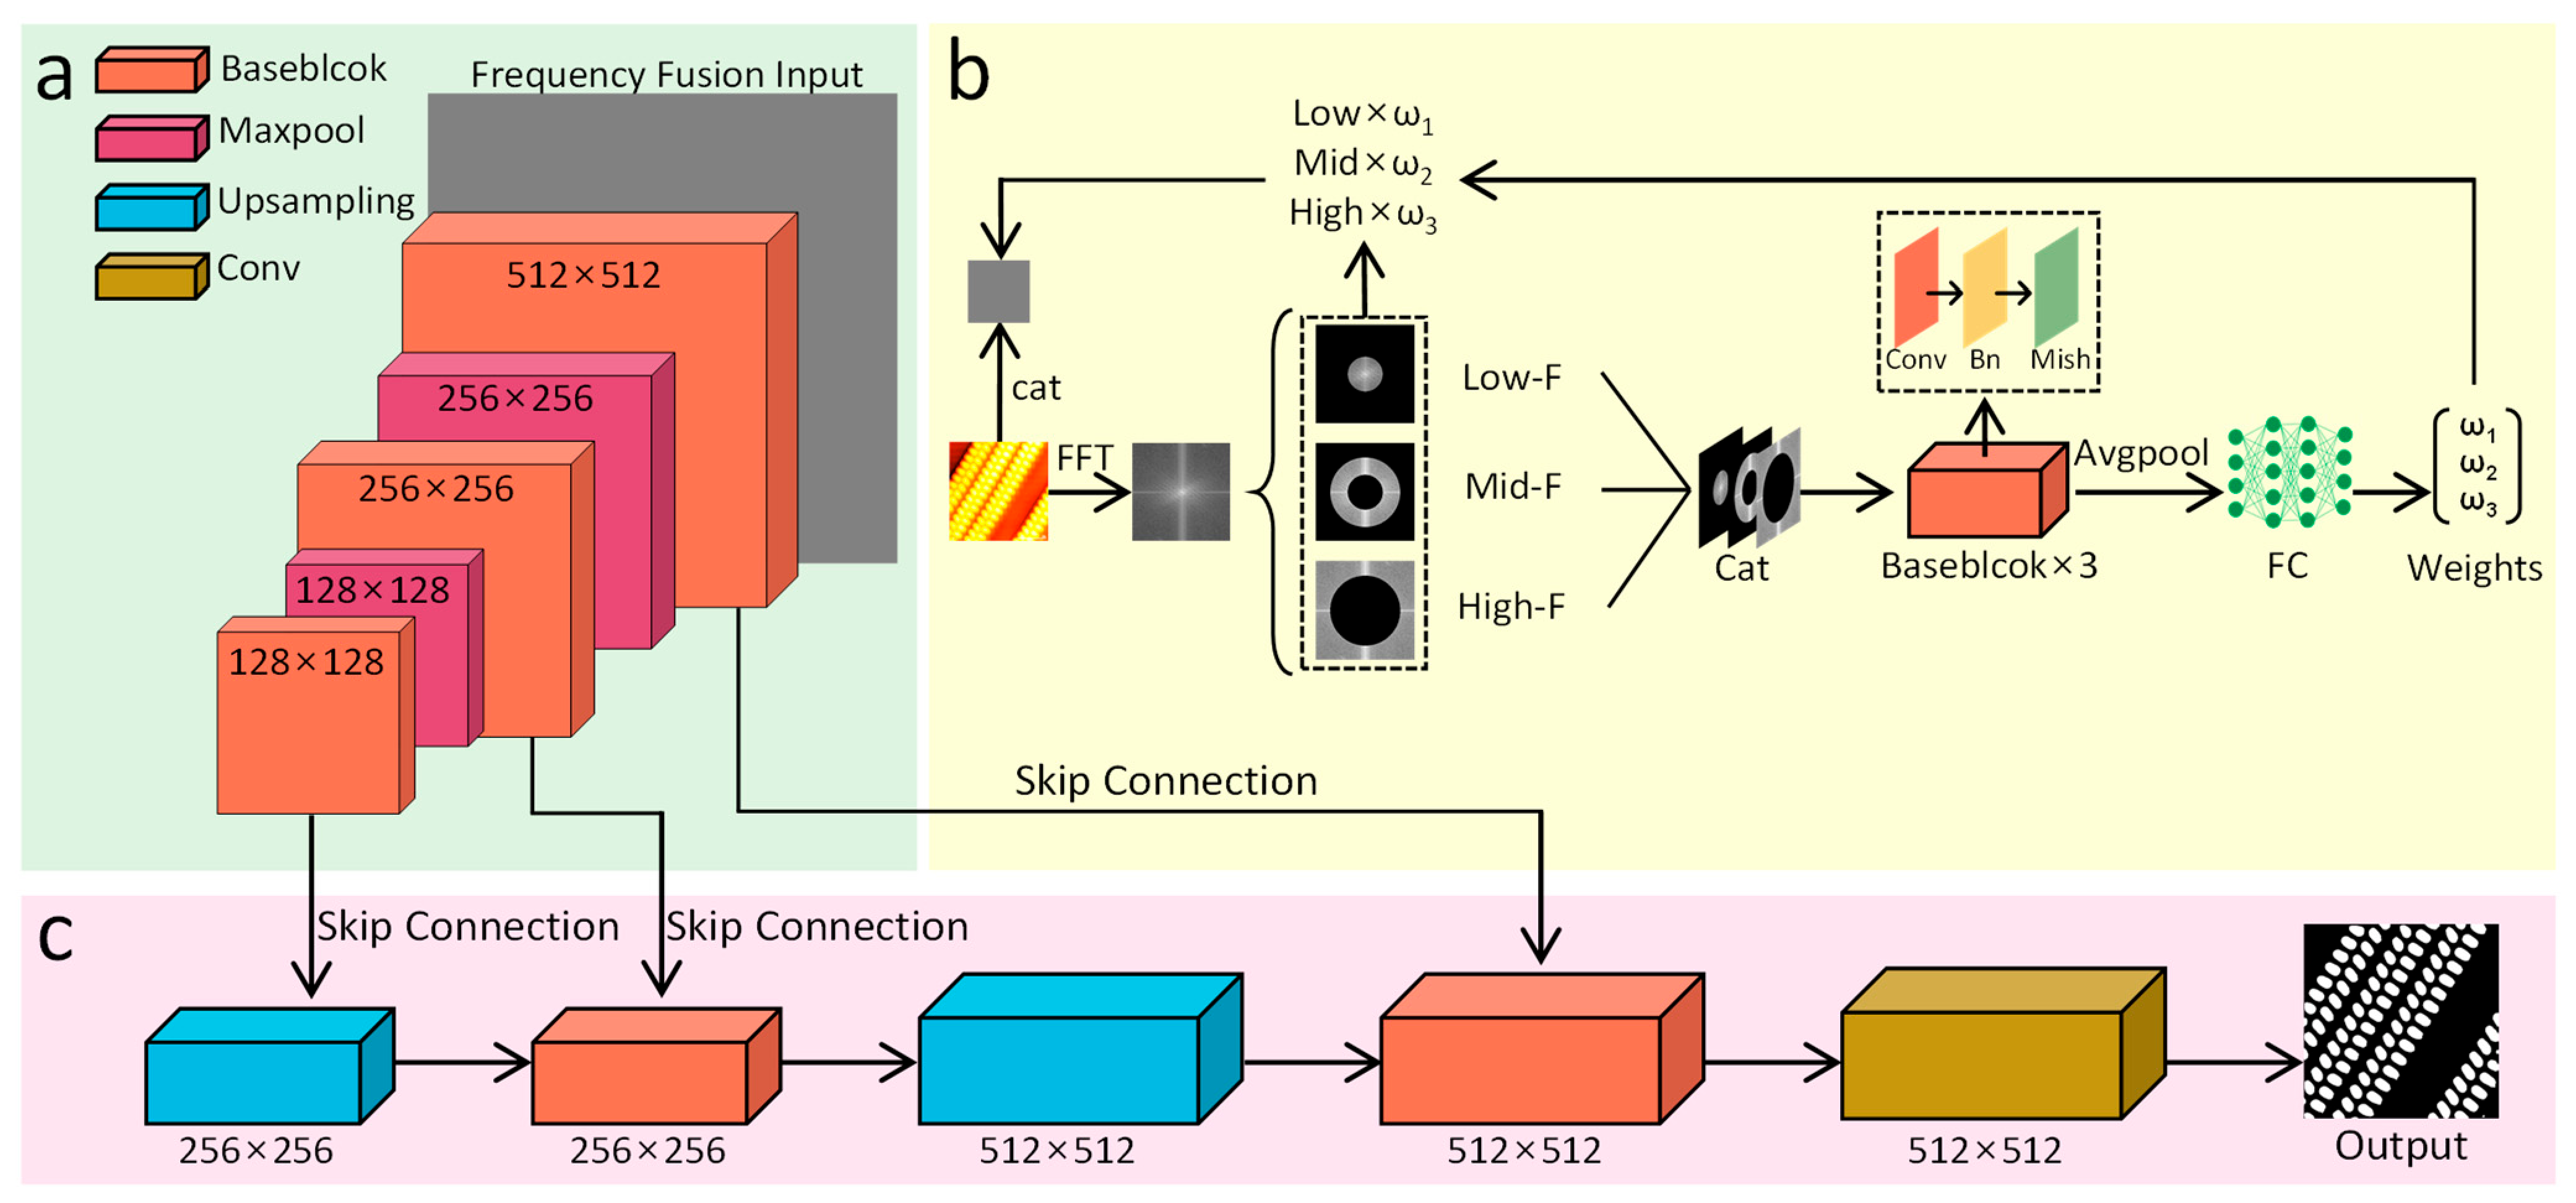
To enable quantitative and detailed analysis of STM image data of NTO molecules, we designed and proposed SpecMol—a specialized image segmentation neural network architecture tailored to the characteristics of STM images—the detailed architecture of which is depicted in Figure 2. As shown in Figure 2a, the model input is a frequency fusion input, constructed by integrating spatial-domain information from the original STM image with its corresponding frequency-domain representation. The frequency-domain component is obtained by applying a fast Fourier transform (FFT) to the raw STM image, which partially captures the periodic features of the surface structure in reciprocal space [24,25].
Figure 2.
Schematic illustration of the SpecMol neural network architecture. (a) The encoder, following the classic U-Net downsampling pathway; (b) The frequency fusion input module, which constructs a multi-channel input by integrating spatial and spectral information and feeds it into the encoder; (c) The decoder, which progressively upsamples feature maps via transposed convolutions to restore the original image resolution.
The specific pipeline for generating this fused input is illustrated in Figure 2b: first, an FFT is performed on the real-space STM image to obtain its frequency-domain representation. Subsequently, three concentric circular masks of different radii are employed to partition the spectrum into low-, mid-, and high-frequency sub-bands, which, respectively, correspond to long-range order, intermediate-range modulation, and local structural details of the surface. These three spectral components are then concatenated along the channel dimension and fed into three parallel feature extraction modules, denoted as baseBlocks. Each baseBlock comprises convolutional layers (Conv), batch normalization (BN), and Mish activation functions, designed to extract discriminative features from each frequency band.
To further enable adaptive weighting across frequency bands, the network incorporates a global average pooling (AvgPool) layer followed by a fully connected (FC) layer after the baseBlocks. This module compresses the multi-channel features into a three-dimensional weight vector that dynamically reflects the relative importance of each frequency band for the current task. This learned weight vector is then used to perform channel-wise reweighting of the original three spectral sub-band components. Finally, the reweighted frequency-domain information—retained in its spectral form—is concatenated with the original spatial-domain STM image along the channel dimension to construct the final frequency fusion input, which serves as the input to the subsequent stages of the network. The pipeline illustrated in Figure 2b can be mathematically formulated as follows:
Here, denotes the weight vector corresponding to the different frequency bands, where , , and are the weights for the low, mid, and high-frequency bands, respectively. The function represents the neural network depicted in Figure 2b. The notations [, , ] indicate the feature maps for the low, mid, and high-frequency bands, respectively. represents the frequency fusion input.
Subsequently, the frequency fusion input is fed into the encoder module illustrated in Figure 2a, which consists of a sequence of interleaved baseBlocks and max-pooling layers. This design progressively downsamples and encodes the input features into a low-resolution latent representation (128 × 128). The encoder adopts the classic U-Net architecture, ensuring effective capture and preservation of spatial information throughout the encoding process.
In the decoding stage (Figure 2c), the feature maps are gradually upsampled back to their original resolution (512 × 512) through a series of baseBlocks combined with upsampling modules implemented via transposed convolutions. Finally, a terminal convolutional layer produces a binary mask image as the segmentation output.
To enhance model performance, the STM images were preprocessed with denoising and contrast enhancement operations to improve structural discriminability and thereby optimize the quality of subsequent analysis.
For training label generation, this study adopts an unsupervised-learning-based strategy. Specifically, a Gaussian Mixture Model (GMM) is applied to the preprocessed STM images to perform an initial segmentation [26,27], yielding coarse yet effective region partitions that serve as pseudo-labels for supervised training. This approach not only substantially reduces the time and labor costs associated with manual annotation but also mitigates potential subjective biases introduced by human intervention. As demonstrated by X. Wang et al., such methods can achieve excellent segmentation performance even without reliance on exhaustive manual labeling [28]. Moreover, given that STM imaging is inevitably affected by noise, artifacts, and variations in tip condition, an automated segmentation strategy helps ensure the objectivity and scientific rigor of experimental results while minimizing human-induced errors.
Regarding loss function design, we note that pseudo-labels generated via unsupervised methods may suffer from issues such as ambiguous or shifted boundaries and spatially accurate but morphologically coarse regions. Consequently, we forgo pixel-wise cross-entropy loss in favor of a weighted combination of boundary-aware loss and Dice loss, formulated as follows:
where is a weighting hyperparameter, set to 0.2 in this work, and and denote the boundary-aware loss [29] and Dice loss [30], respectively, defined as follows:
Here, denotes the number of valid samples, represents the binary pseudo-label, and denotes the predicted probability map for the segmentation mask. The term refers to the signed distance function (SDF) computed from the label . A small constant is introduced as a smoothing factor to avoid division by zero.
In this loss function design, the Dice term ensures robust optimization with respect to overall region overlap, while the boundary-aware term—based on the signed distance function (SDF)—acts as a soft constraint that guides the model toward learning more precise object contours. Importantly, this approach mitigates overfitting to potential boundary noise present in the pseudo-labels [31,32,33]. The effectiveness of such an optimization strategy in weakly and semi-supervised image segmentation has been demonstrated by H. Kervadec et al. in the context of medical image analysis [29].
3. Results
Model training was conducted using the PyTorch 2.6 deep learning framework on a computational platform equipped with an NVIDIA GeForce RTX 4090 GPU and an Intel Core i9-14900K CPU. To enhance training stability and improve model generalization, the original dataset was augmented using image augmentation techniques and split into training and test sets at an 8:2 ratio. The model was trained for 100 epochs, optimized with the AdamW optimizer, and an early-stopping mechanism (patience = 5) was employed to mitigate overfitting [34]. The proposed SpecMol model achieved excellent segmentation performance on the test set, with quantitative metrics reported in the first row of Table 1.
Table 1.
Performance metrics of segmentation models on the test set.
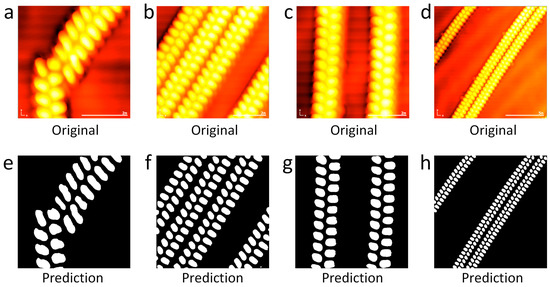
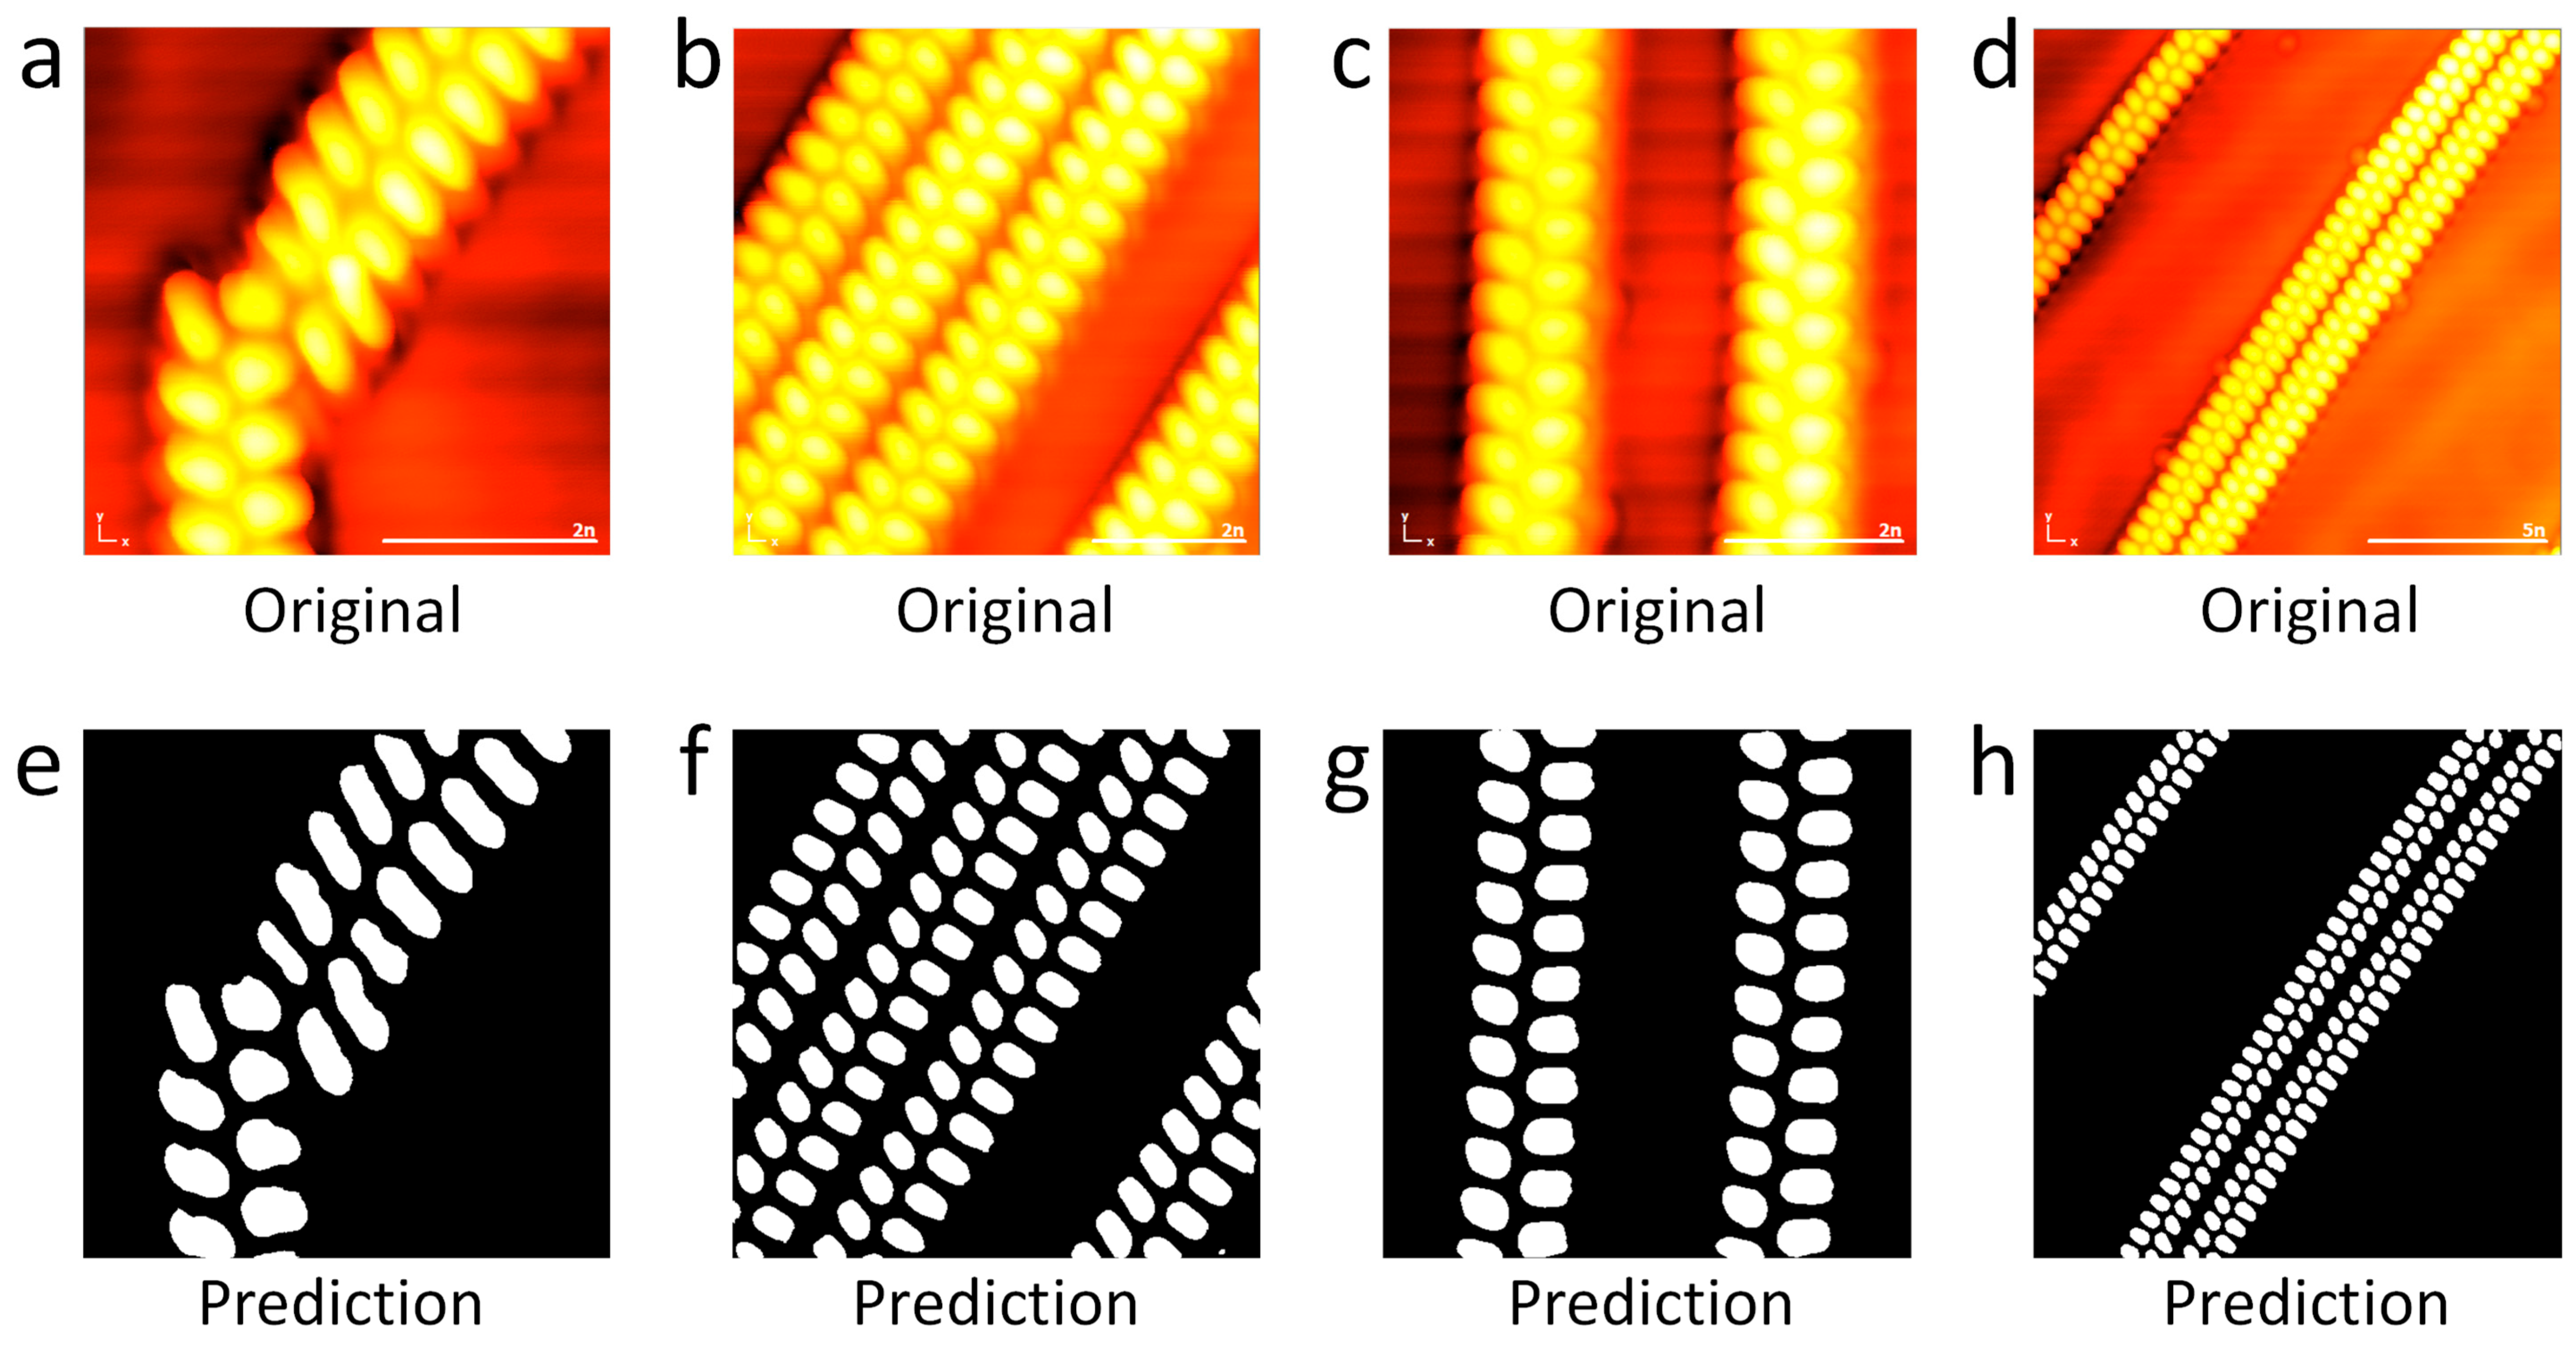
As illustrated in Figure 3, which presents typical segmentation examples of NTO molecular targets by SpecMol, subfigures a and e, b and f, c and g, d and h correspond to the in-put STM images and their respective segmentation results. It can be observed that each in-dividual NTO molecule is precisely delineated with clear boundaries. Notably, there is no adhesion between adjacent connected components, indicating that the model effectively separates closely packed molecules. Visually, the segmentation results are highly satisfactory, demonstrating the model’s strong capability in preserving structural integrity and resolving fine details in complex molecular images.
Figure 3.
Representative segmentation results of SpecMol on the test set. Each pair shows the original STM image (above (a–d)) and the corresponding predicted segmentation mask (below (e–h)), illustrating the model’s precise identification and delineation of adsorbed NTO molecular structures. All STM images shown in this figure were acquired at a bias voltage of 0.04 V.
To further validate the effectiveness of SpecMol, we conducted comparative and ablation studies. First, we removed the frequency fusion module to construct an ablated variant, denoted SpecMol-nofft. As shown in the second row of Table 1, its IoU, Dice coefficient, and Accuracy all decreased significantly, demonstrating that the introduced frequency-domain fusion mechanism effectively captures discriminative information from reciprocal space, thereby aiding more accurate localization of target regions.
Furthermore, we reproduced several mainstream segmentation architectures—namely U-Net [35], FPN [36], and DeepLabv3+ [37]—using ResNet-34 [38] as the backbone network to serve as baseline models (rows 3–5 of Table 1). Experimental results indicate that all these methods underperform compared to SpecMol in this task. Notably, FPN and DeepLabv3+ exhibit particularly poor performance, which may be attributed to the unique characteristics of scanning tunneling microscopy (STM) images: molecular structures of the same class typically exhibit highly consistent local features and strong scale invariance. In such cases, multi-scale feature fusion strategies can introduce redundant or even misleading information, thereby impairing the model’s ability to discriminate subtle structural details.
Finally, in terms of computational efficiency, SpecMol exhibits substantially fewer parameters (Params) and floating-point operations (FLOPs) than the competing models, highlighting its lightweight and efficient design. This advantage makes SpecMol particularly suitable for deployment in real-world scientific research scenarios, offering low-latency, resource-efficient automated analysis for high-throughput STM imaging.
To support the subsequent quantitative analysis of NTO molecular chains and to ensure the rigor and interpretability of our findings, we first establish a clear definition of the criteria for identifying the orientation of individual NTO molecules and specify the associated geometric parameters.
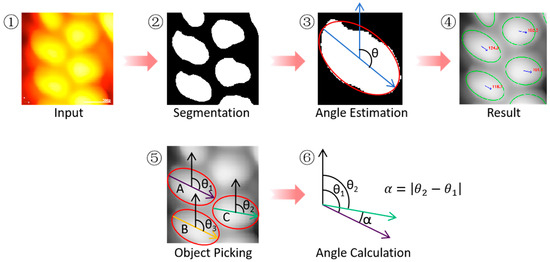
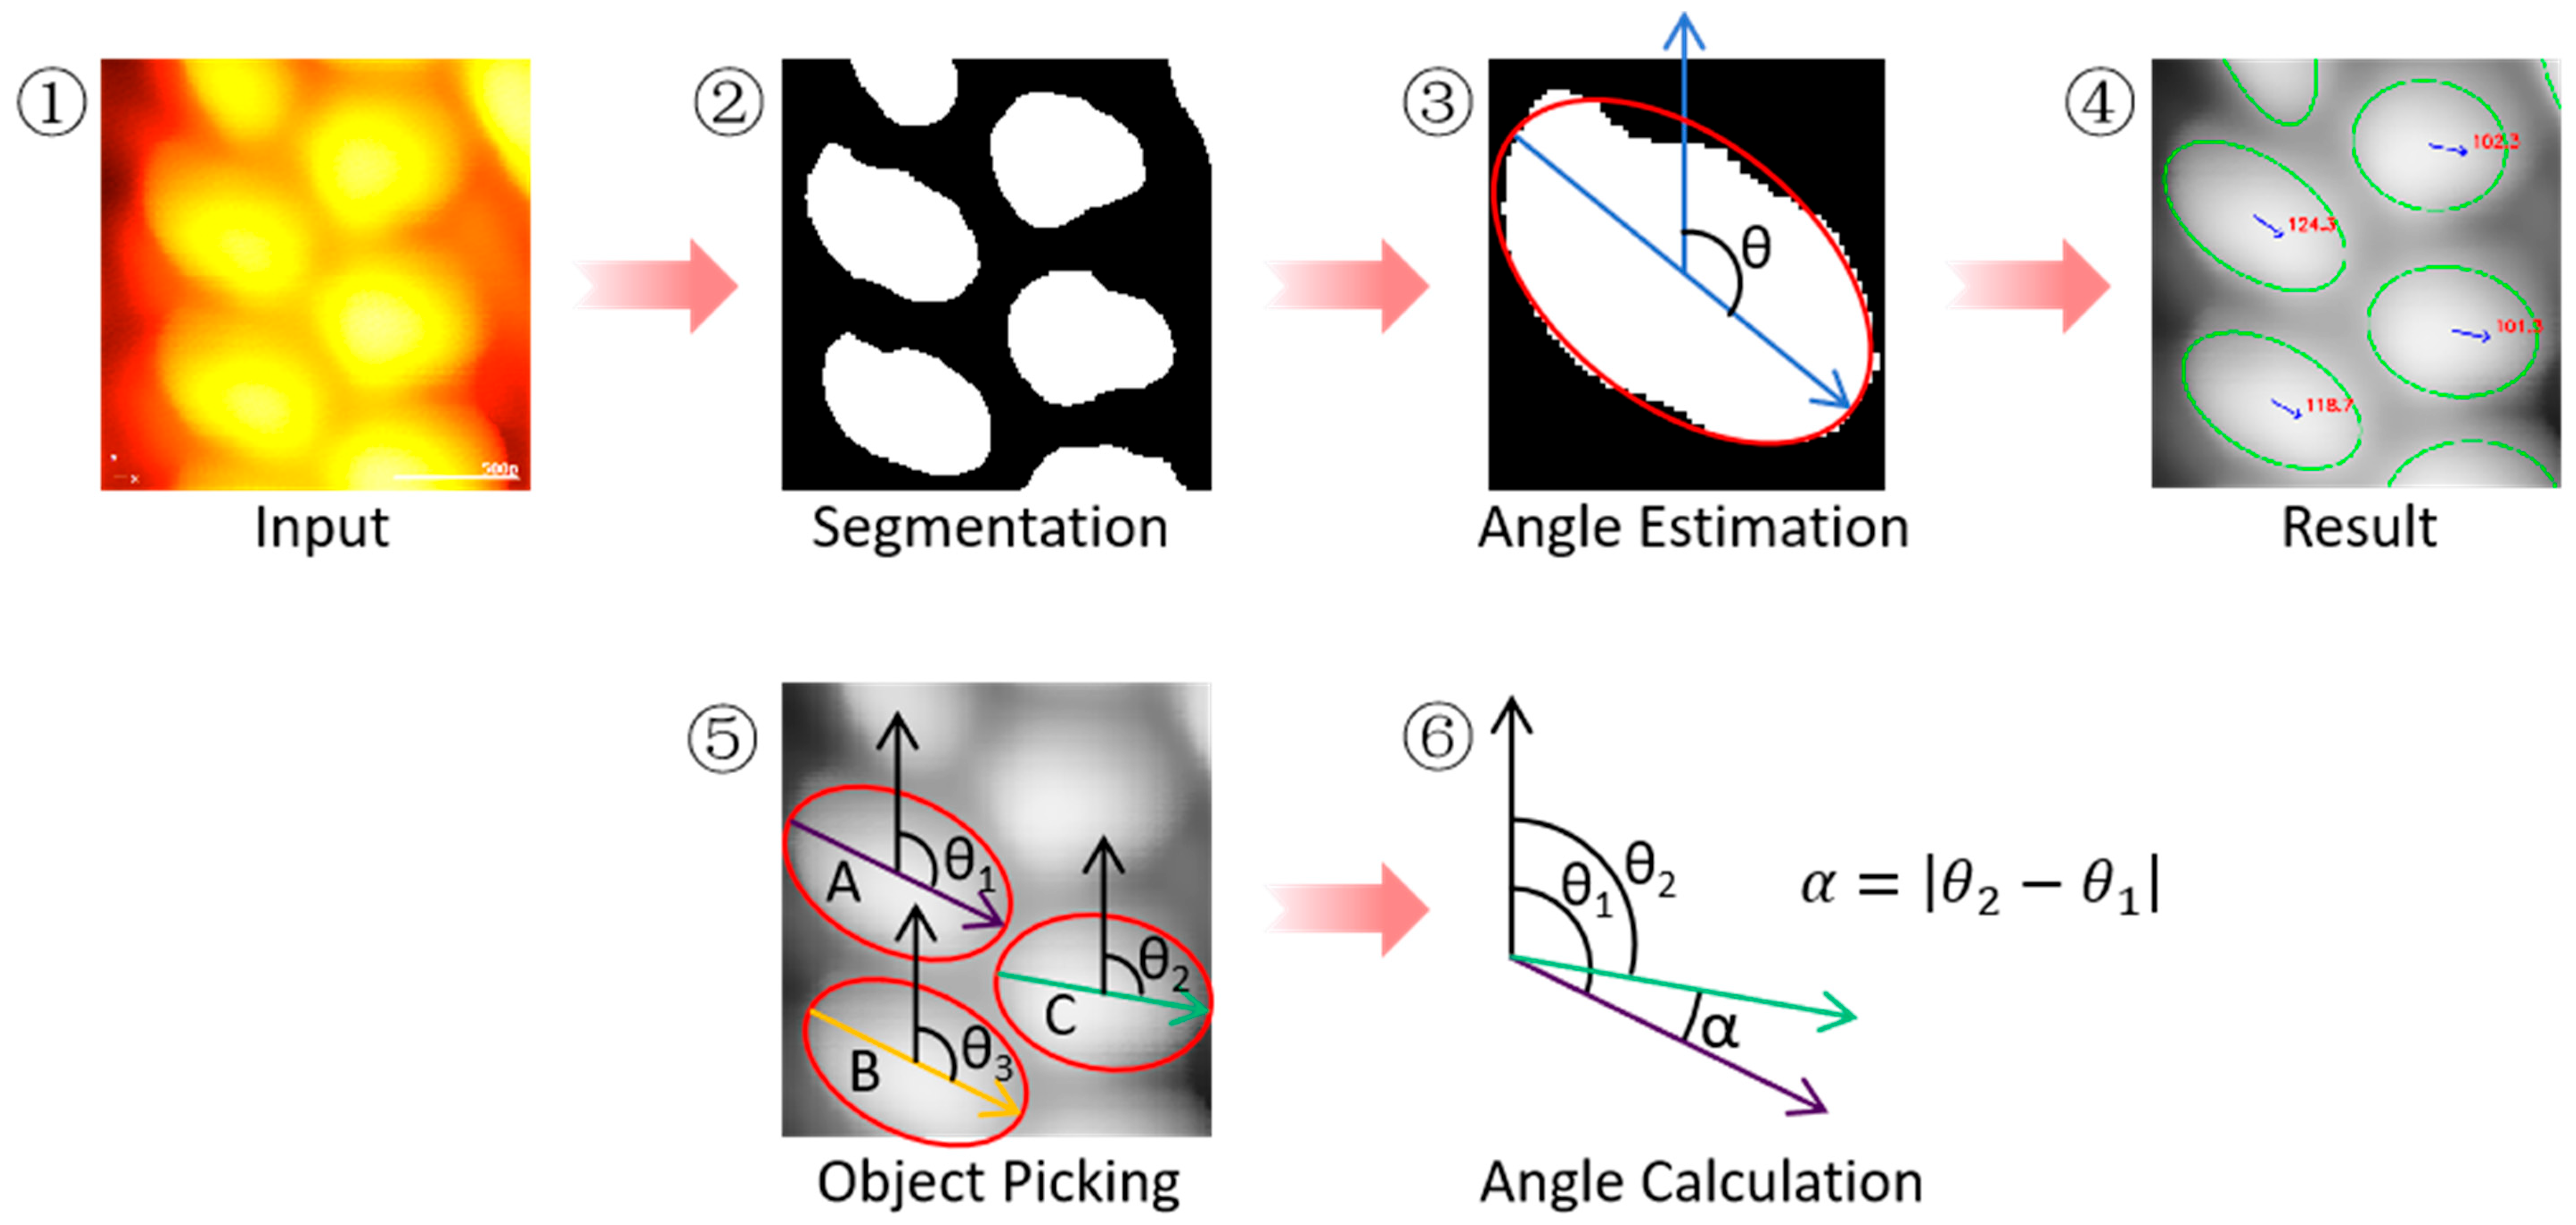
As illustrated in Figure 4, the extraction pipeline for the orientation of a single NTO molecule proceeds as follows: First, the trained SpecMol model is applied to perform pixel-wise segmentation of the STM image (Figure 4②), yielding multiple binary connected components, each corresponding to the localized electronic density distribution of an individual NTO molecule. Next, for each connected component, a least-squares ellipse fitting algorithm is employed to approximate its contour, and the major axis of the fitted ellipse is adopted as the primary orientation vector of the molecule [39]. To resolve the directional ambiguity inherent to axial symmetry (i.e., 180° periodicity), we enforce a convention that the major axis vector always points toward the first or fourth quadrant of the image coordinate system—specifically, its x-component is constrained to be non-negative. Finally, the molecular orientation angle θ is defined as the angle between this major axis and the positive direction of the image y-axis (Figure 4③), serving as the numerical representation of the NTO monomer’s orientation. An example of the resulting orientation visualization is shown in Figure 4④.
Figure 4.
Schematic illustration and relevant explanations of applying SpecMol to study NTO molecular chains. The STM image was acquired at a bias voltage of 0.04 V. (①) An exemplary STM image, the "500p" denotes the scale bar, which corresponds to 500pm.; (②) Segmentation results from SpecMol, showing multiple binary connected components, each corresponding to an individual NTO molecule; (③) Determination of molecular orientation using a least-squares ellipse fitting method and definition of the orientation angle θ; (④) Visualization of the orientation angle θ; (⑤) Schematic representation of the unit dimer structure within NTO chains and the definition of the relative angle α between dimers; (⑥) Methodology for calculating the relative angle α of the unit dimer.
As previously noted, NTO molecules self-assemble via intermolecular hydrogen bonding into highly ordered one-dimensional chain-like superstructures, with well-defined dimers as their fundamental building blocks. Building upon the quantitative characterization of single-molecule orientations enabled by the SpecMol model, we further formalize the geometric configuration of these dimers.
As illustrated in Figure 4⑤, within a continuous NTO molecular chain, any interior molecule (denoted as molecule B) can topologically form potential dimeric units with its two adjacent neighbors (molecules A and C). To ensure consistency in the analysis protocol, we adopt the following convention: the dimer is defined by pairing each molecule with its immediate predecessor along the chain direction. Specifically, for molecule B, the corresponding elementary dimer consists of molecules A and B (see Figure 4⑥).
Based on this definition, the relative orientation angle α of the elementary dimer is defined as the absolute difference between the orientation angles of the two constituent molecules:
where and denote the orientation angles of molecules A and B, respectively (as defined in Figure 4⑤). The angle α effectively quantifies the relative rotational offset between the two NTO monomers within the dimer and serves as a key geometric parameter for subsequent quantitative assessment of local order and conformational consistency along the molecular chain.
To investigate the structural response of NTO molecular chains under mechanical perturbation, we performed controlled in situ mechanical manipulation using the tip of a scanning tunneling microscope (STM) under ultrahigh vacuum (UHV) and cryogenic (5 K) conditions. Specifically, a fully formed, intact one-dimensional NTO molecular chain was selected as the target. Localized external forces were applied at either the terminal or lateral positions of the chain by precisely tuning the STM tip position, tunneling current, and bias voltage to induce controlled displacement or conformational perturbation. During manipulation, the tip height was dynamically adjusted to maintain an appropriate interaction force—sufficient to induce structural response yet gentle enough to prevent molecular desorption or irreversible damage.
High-resolution STM images (acquired in constant-current mode) of the same region were recorded before and after mechanical perturbation, with strict spatial registration ensured between the two states. By comparing these pre- and post-manipulation images, structural evolution such as deformation, displacement, scission, or reconstruction of the NTO chain can be clearly identified. Furthermore, by integrating the aforementioned SpecMol-based orientation quantification method, we systematically analyze the evolution of the molecular orientation angle θ and the dimeric relative angle α under external mechanical stimuli.
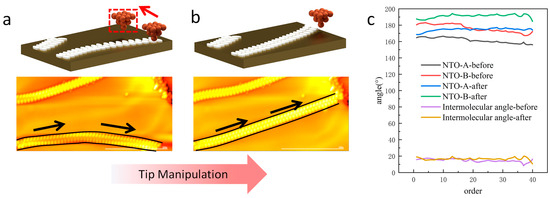
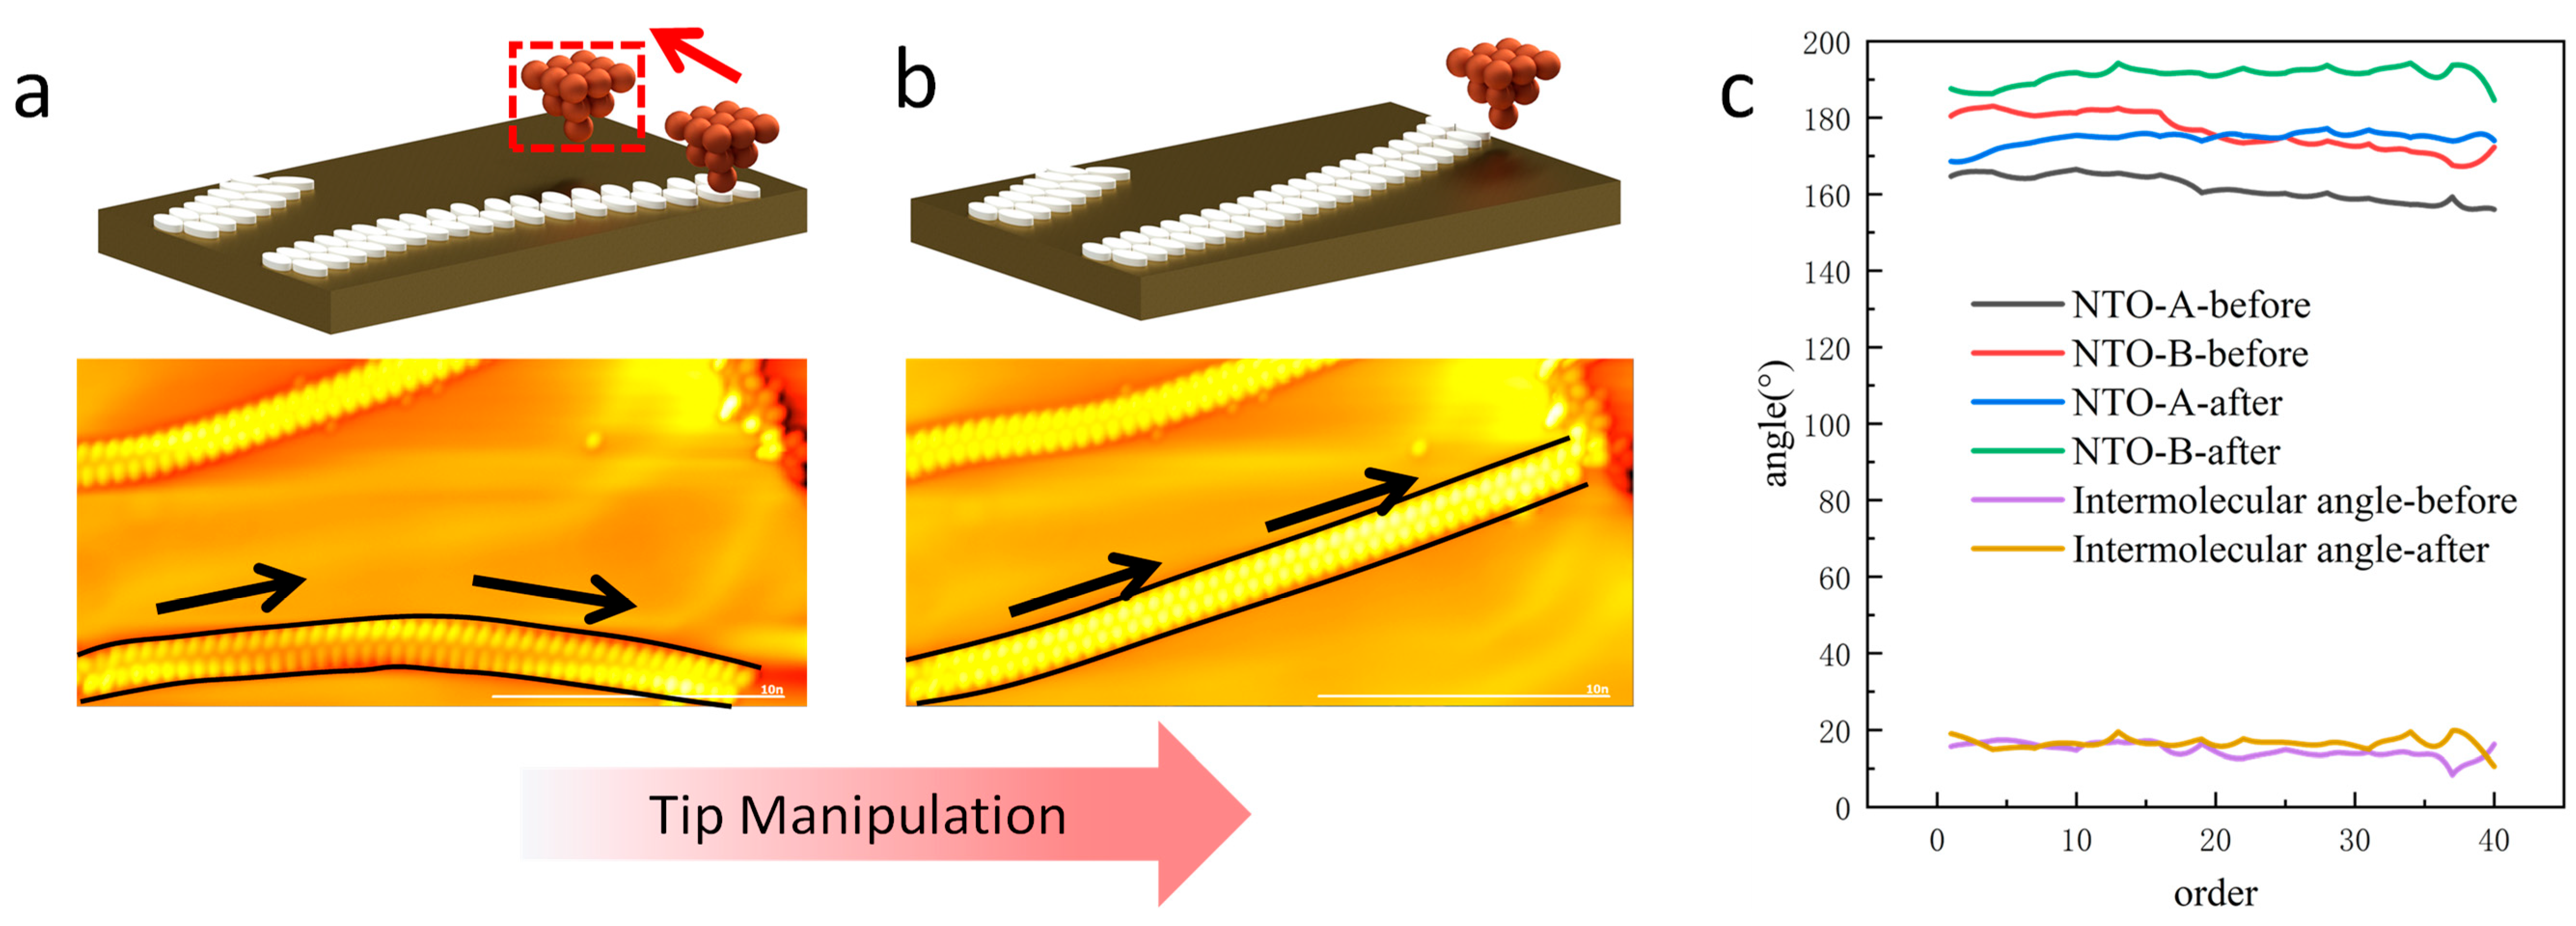
The mechanical manipulation process is illustrated in Figure 5a. To accurately induce a structural response, the NTO molecular chain was manipulated by applying lateral forces through continuous scanning in a bottom-to-top direction relative to the image frame. Specifically, the STM tip was scanned across the lower end of the chain to effectively “push” the assembly into its post-manipulation configuration (indicated by the blue-highlighted region). The technical details of this manipulation protocol are described by Wang et al. (under review). Macroscopic observation of the chain morphology indicates that the molecular chain did not exhibit any fracture, misalignment, or structural defects after the force application, preliminarily confirming its exceptional mechanical stability. The mechanical manipulation process is illustrated in Figure 5a. To precisely induce a structural response, lateral forces were applied to the NTO molecular chain via continuous scanning in a bottom-to-top direction relative to the image frame. Specifically, the STM tip was scanned horizontally near the lower end of the chain, exerting a controlled lateral pushing force that drove the assembly into its post-manipulation configuration. Macroscopic inspection of the chain morphology revealed no evidence of fracture, misalignment, or structural defects following the application of this lateral force, preliminarily demonstrating its exceptional mechanical stability.
Figure 5.
Schematic illustration and analysis of applying localized external force to NTO molecular chains using an STM tip. The STM image was acquired at a bias voltage of 0.04 V. (a) The position of the STM tip relative to the NTO molecular chain before the application of ex-ternal force, where the red arrow and red dashed box indicate the intended direction and location of tip movement; (b) The position of the STM tip relative to the NTO molecular chain after the ap-plication of external force; (c) Angle variations of dimeric units within the same NTO molecular chain before and after applying external force, where the y-axis represents the angle values and the x-axis represents the sequence of molecules from left to right along the chain. To further investigate the impact of mechanical perturbation on the internal geometric configuration of the molecular chain, we conducted quantitative analysis. Specifically, based on the spatial sequence from left to right in the STM images, we sequentially extracted the orientation angles θ of each NTO monomer (as defined in Figure 4⑤) and calculated the relative angles between adjacent dimers according to the A–B pairing rule described in Figure 4⑤. The results are presented in Figure 5b: the x-axis represents the monomer index within the chain, while the y-axis denotes the corresponding angle values.
The curve ranging from 160° to 200° characterizes the distribution of the single-molecule orientation angles θ, showing a smooth and monotonic trend consistent with the overall macroscopic orientation of the NTO molecular chain, reflecting a highly ordered self-assembled structure. In contrast, the curves in the 0° to 20° range, colored blue and yellow, represent the dimeric relative angles α before and after the mechanical perturbation, respectively, with an average value of 14.55°. These two curves exhibit a high degree of overlap, indicating that the local dimer configurations remain largely unchanged following the perturbation.
To quantify this stability from a statistical perspective, we computed the Pearson correlation coefficient and the Concordance Correlation Coefficient (CCC) for the pre- and post-perturbation α sequences. The results show a Pearson coefficient r = 0.865 (p = 1.79 × 10⁻¹⁴), indicating a very strong positive linear correlation with extremely high statistical significance (p ≪ 0.001). Additionally, CCC = 0.834 further confirms that the two datasets not only exhibit consistent trends but also align closely in absolute numerical values [40].
In summary, these findings demonstrate that the NTO molecular chain exhibits remarkable structural robustness under localized external forces, with internal dimeric geometric configurations remaining stable without significant reconstruction or distortion. This provides direct microscopic evidence supporting the low mechanical sensitivity of NTO materials.
4. Discussion
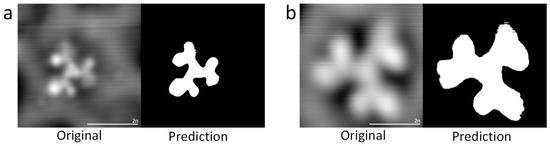
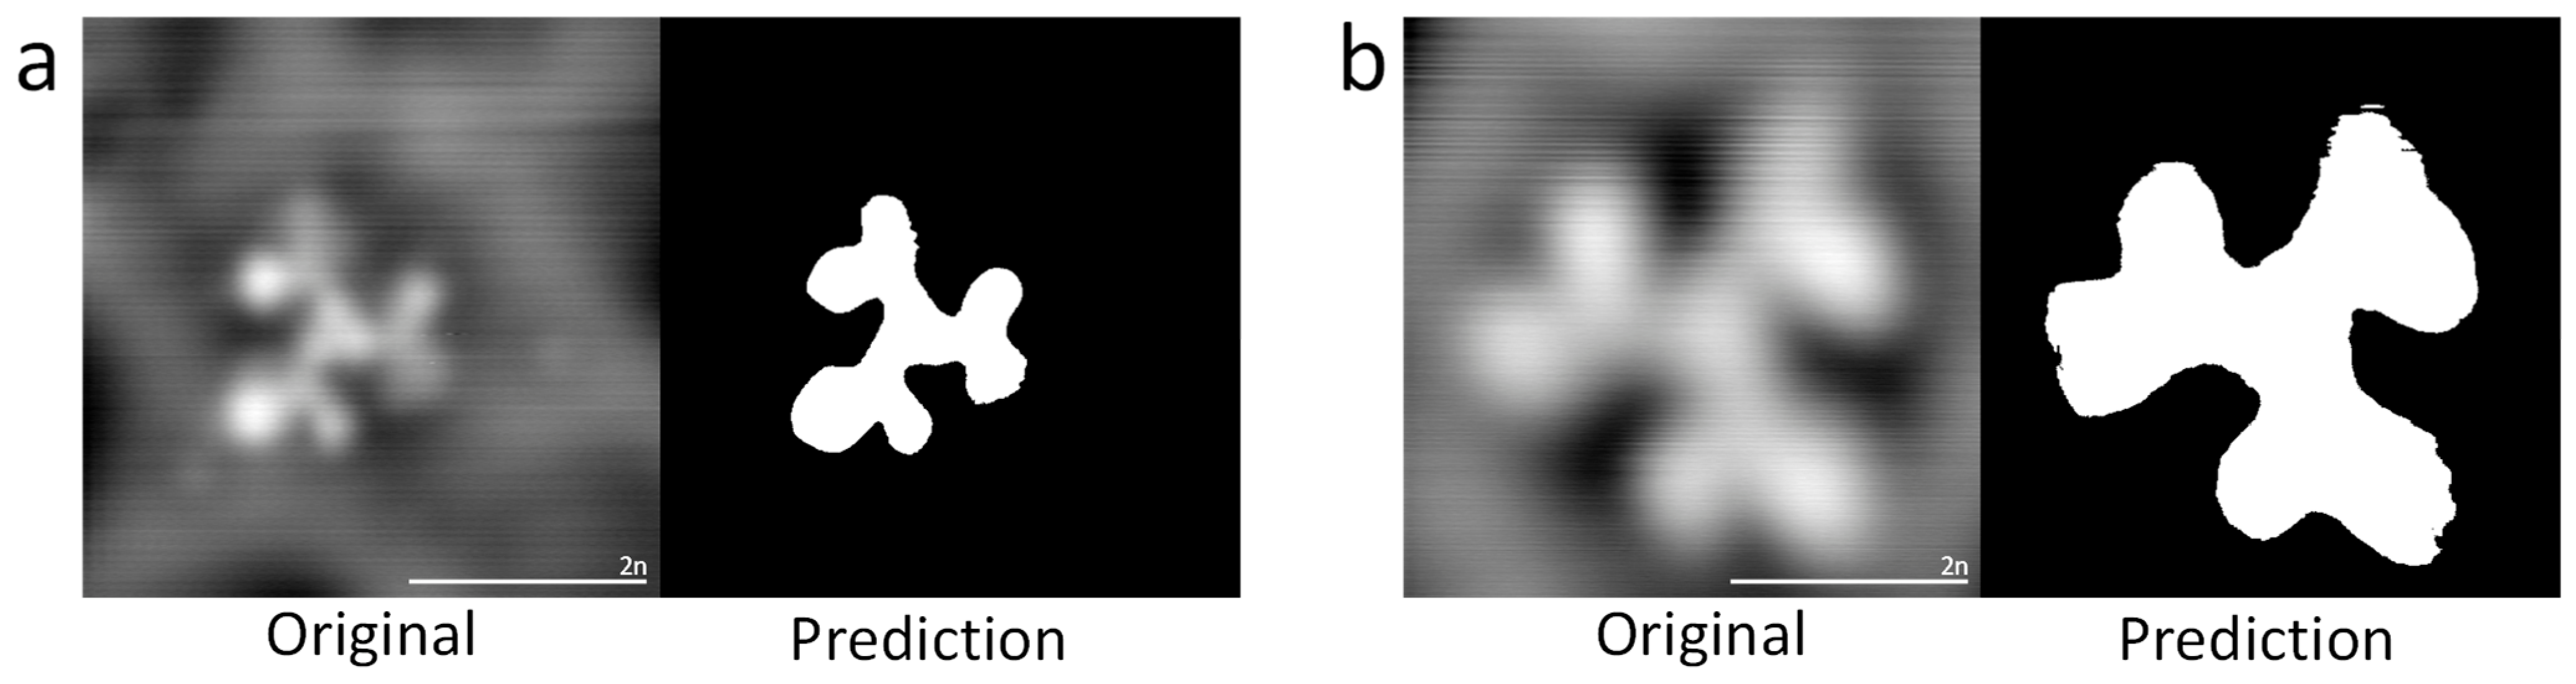
In summary, this work presents and implements SpecMol—a deep-learning-based, high-precision STM image segmentation framework—that successfully enables automated identification and quantitative orientation analysis of individual NTO molecules in surface-adsorbed assemblies. To validate the generalizability of the framework, we further applied it to a novel STM im-age dataset featuring 4′,4″,4‴-tris(N-3-methylphenyl-N-phenylamino)triphenylamine (MTDATA) molecules. Compared to the NTO system, this dataset presents distinct challenges: it focuses on single-molecule imaging with a larger field of view (~2 nm), higher pixel resolution (512 × 512), and targets that are large, irregularly shaped molecules—constituting a fundamentally different segmentation task from the small, elliptical targets primarily studied here. Without modifying the model architecture or training strategy and without any hyperparameter tuning, we trained SpecMol on this dataset using a 9:1 train-test split. The model achieved excellent quantitative performance on the test set (82.3% IoU and 97.6% accuracy). The visualization results presented in the newly added Figure 6 further demonstrate that SpecMol maintains robust segmentation capability even when confronted with a domain shift involving significantly different target characteristics, effectively delineating the complex boundaries of these large, irregular molecular structures.
Figure 6.
Visualization results of SpecMol on the MTDATA test set. From (left (a)) to (right (b)): original STM images, ground-truth segmentation masks, and predicted segmentation masks.
Building upon this capability, we combine in situ STM-based mechanical manipulation with geometric parameter extraction to, for the first time, reveal at real-space atomic resolution that the dimeric units within one-dimensional self-assembled NTO chains maintain a highly stable relative orientation under external mechanical perturbation (exhibiting minimal angular variation, with CCC = 0.834). This confirms the remarkable local structural rigidity inherent to the NTO dimer architecture.
This finding not only validates the mechanical robustness of hydrogen-bond-dominated NTO superstructures at the microscopic scale but also provides direct experimental evidence and a mechanistic explanation for the low mechanical sensitivity observed in NTO as a high-energy, insensitive energetic material.
Our study highlights the powerful potential of deeply integrating artificial intelligence with scanning probe techniques for molecular-scale characterization of functional materials, thereby opening new avenues for the rational design and safety assessment of next-generation energetic materials.
Author Contributions
Conceptualization, Y.W. and C.G.; methodology, T.Z., Q.Z. and J.Z.; software, L.Z. and J.Z.; validation, T.W., X.C. and L.L.; formal analysis, L.Z.; investigation, T.Z.; data curation, L.Z.; writing—original draft preparation, L.Z.; writing—review and editing, T.Z., Y.W. and C.G.; visualization, L.Z.; supervision, Y.W. and C.G.; project administration, H.Y. and Y.W.; funding acquisition, Y.W. All authors have read and agreed to the published version of the manuscript.
Funding
This work was supported by the National Natural Science Foundation of China, grant numbers 62271048, 62471038, 12304205, and 92163206, and the National Key R&D Program of China, grant numbers 2024YFA1611300 and 2021YFA1400103.
Data Availability Statement
The original contributions presented in this study are included in the article, further inquiries can be directed to the corresponding author.
Conflicts of Interest
The authors declare no conflicts of interest. The funders had no role in the design of the study; in the collection, analyses, or interpretation of data; in the writing of the manuscript; or in the decision to publish the results.
Correction Statement
This article has been republished with a minor correction to the readability of figure 1. This change does not affect the scientific content of the article.
Abbreviations
The following abbreviations are used in this manuscript:
| CNN | Convolutional Neural Network |
| DOATF | A macrocyclic energetic molecule (3,4-dinitro-1,2,5-oxadiazole-fused framework) |
| HMX | Octahydro-1,3,5,7-tetranitro-1,3,5,7-tetrazocine |
| NBM | Nitrobenzene-based molecule |
| NTO | 3-Nitro-1,2,4-triazol-5-one |
| RDX | Hexahydro-1,3,5-trinitro-1,3,5-triazine |
| STM | Scanning Tunneling Microscopy |
| UHV | Ultrahigh Vacuum |
References
- Yang, X.; Huang, Y.; Wang, X. Research Progress on the Application of NTO in Composite Explosives and Its Acidity Issues. Mater. Rep. 2019, 33, 627–629. [Google Scholar]
- Ling, L.; Wang, J.; Li, J.; Li, Y.; Lv, L. Symmetry-Breaking Density Functional Theory Study on the Thermal Decomposition Mechanism of 3-Nitro-1,2,4-triazol-5-one (NTO). Chin. J. Org. Chem. 2023, 43, 285. [Google Scholar] [CrossRef] [Scilit]
- Yang, Z.; Li, J.; Tang, J.; Luo, W.; Liang, Y.; Zhao, T.; Zhang, J.; Li, H.; Wu, J. Bifuruzan skeleton: Developing new high-energy and high-density energetic materials. J. Mol. Model. 2025, 31, 16. [Google Scholar] [CrossRef] [Scilit] [PubMed]
- Zhao, Y.; Jin, B.; Peng, R. Application of Carbon Nanomaterials in Desensitizing Technique of Energetic Materials. Chin. J. Energ. Mater. 2023, 32, 422–434. [Google Scholar] [CrossRef]
- Chang, X.; Huang, L.; Gao, Y.; Yu, C.; Cao, Y.; Lv, L.; Lin, X.; Du, S.; Gao, H.-J. Adsorption structure of macrocyclic energetic molecule DOATF on Au(111). Chin. Phys. B 2023, 32, 096802. [Google Scholar] [CrossRef] [Scilit]
- Jeong-Soo, C.; Young-Soo, K. Determination of the NDR and electron transport properties of self-assembled nitro-benzene monolayers using UHV-STM. J. Electr. Eng. Technol. 2006, 1, 366–370. [Google Scholar]
- Türker, L. Effect of magnesium or/and titanium on NTO molecule–A DFT study. Earthline J. Chem. Sci. 2025, 12, 225–238. [Google Scholar] [CrossRef] [Scilit]
- Wei, Z.; Zhong, Q.; Pan, J.; Lim, F.H.; Chi, L.; Du, S. Two-Stage Machine Learning Framework for Accurate Discrimination of Isomers and Very-Similar Molecules on Surfaces. J. Am. Chem. Soc. 2025, 147, 35232–35243. [Google Scholar] [CrossRef] [Scilit]
- Zhan, L.; Fan, H.; Zhang, T.; Wang, T.; Cao, X.; Li, Y.; Zhou, Z.; Zhang, Q.; Yang, H.; Wang, Y. MAED-CNN: A Deep Learning Model for Atomic-Scale Image Denoising. J. Vac. Sci. Technol. 2025, 45, 686–695. [Google Scholar]
- Ziatdinov, M.; Maksov, A.; Kalinin, S.V. Learning surface molecular structures via machine vision. npj Comput. Mater. 2017, 3, 31. [Google Scholar] [CrossRef] [Scilit]
- Li, J.; Telychko, M.; Yin, J.; Zhu, Y.; Li, G.; Song, S.; Yang, H.; Li, J.; Wu, J.; Lu, J. Machine vision automated chiral molecule detection and classification in molecular imaging. J. Am. Chem. Soc. 2021, 143, 10177–10188. [Google Scholar] [CrossRef] [Scilit]
- Tim, J.; Seifert, M.S. Peer Kasten, Björn Möller, Tim Fingscheidt, Markus Etzkorn, Timo de Wolff, Uta Schlickum, Chirality Detection in Scanning Tunneling Microscopy Data Using Artificial Intelligence. Small Methods 2024, 8, 2400549. [Google Scholar] [CrossRef] [Scilit] [PubMed]
- Yang, S.H.; Choi, W.; Cho, B.W.; Agyapong-Fordjour, F.O.T.; Park, S.; Yun, S.J.; Kim, H.J.; Han, Y.K.; Lee, Y.H.; Kim, K.K. Deep Learning-Assisted Quantification of Atomic Dopants and Defects in 2D Materials. Adv. Sci. 2021, 8, 2101099. [Google Scholar] [CrossRef] [Scilit]
- Joucken, F.; Davenport, J.L.; Ge, Z.; Quezada-Lopez, E.A.; Taniguchi, T.; Watanabe, K.; Velasco, J., Jr.; Lagoute, J.; Kaindl, R.A. Denoising scanning tunneling microscopy images of graphene with supervised machine learning. Phys. Rev. Mater. 2022, 6, 123802. [Google Scholar] [CrossRef] [Scilit]
- Fu, T.; Zang, Y.; Zou, Q.; Nuckolls, C.; Venkataraman, L. Using deep learning to identify molecular junction characteristics. Nano Lett. 2020, 20, 3320–3325. [Google Scholar] [CrossRef] [Scilit]
- Kurki, L.; Oinonen, N.; Foster, A.S. Automated structure discovery for scanning tunneling microscopy. ACS Nano 2024, 18, 11130–11138. [Google Scholar] [CrossRef] [Scilit]
- Lingtong, W.; Haonan, W.; Ruijin, Y.; Muyang, L.; Gao, Y.; Ming, H. Research on the Method of Bearing Micro Deformation Detection. Sens. World 2023, 29, 28–33. [Google Scholar]
- Zhang, Y.; Gan, W.-B.; Wang, L.-X.; Hu, W.-B.; Tang, J.-G.; Li, S. Algorithm and Experimental Study of Micro Deformation Monitoring Based on Fiber Optic Gyroscope. Wuhan Ligong Daxue Xuebao/J. Wuhan Univ. Technol. 2015, 37, 83–86. [Google Scholar]
- Narasimhan, S.; Vanderbilt, D. Elastic Stress Domains and the Herringbone Reconstruction on Au(111). Phys. Rev. Lett. 1992, 69, 1564. [Google Scholar] [CrossRef] [Scilit] [PubMed]
- Becker, C.; Wandelt, K. Surfaces: Two-Dimensional Templates. Top. Curr. Chem. 2009, 287, 45–86. [Google Scholar]
- Wang, Z.; Zong, R.; Wang, Y.; Sun, S.; Xu, J.; Tong, Y. Thermal Expansion Characteristics of High Energy Insensitive Explosive A-Nto. J. Energ. Mater. 2023, 43, 444–459. [Google Scholar] [CrossRef] [Scilit]
- Zhurova, E.A. Chemical Bonding in Energetic Materials: Β-Nto. Acta Crystallogr. Sect. B Struct. Sci. 2001, 57, 359–365. [Google Scholar] [CrossRef] [Scilit] [PubMed]
- Bolotina, N.; Kirschbaum, K.; Pinkerton, A.A. Energetic Materials: Alpha-Nto Crystallizes as a Four-Component Triclinic Twin. Acta Crystallogr. Sect. B Struct. Sci. 2005, 61, 577–584. [Google Scholar] [CrossRef] [Scilit]
- Martinez, H.; Tison, Y.; Baraille, I.; Loudet, M.; Gonbeau, D. Experimental (xps/stm) and Theoretical (flapw) Studies of Model Systems M1/4tis2 (m=fe, Co, Ni): Influence of the Inserted Metal. J. Electron Spectrosc. Relat. Phenom. 2002, 125, 181–196. [Google Scholar] [CrossRef] [Scilit]
- Rath, M.; Chen, Y.; Krieger, G.; Sahib, H.; Preziosi, D.; Salluzzo, M. Scanning Tunneling Microscopy and X-Ray Photoemission Studies of NdNiO2 Infinite-Layer Nickelates Films. Phys. Rev. Mater. 2024, 8, 054802. [Google Scholar] [CrossRef] [Scilit]
- Chassagnol, B.; Bichat, A.; Boudjeniba, C.; Wuillemin, P.-H.; Guedj, M.; Gohel, D.; Nuel, G.; Becht, E. Gaussian Mixture Models in R. R J. 2023, 15, 56–76. [Google Scholar] [CrossRef] [Scilit]
- Feng, Z.; Limin, L.; Yuqing, S.; Jianmei, C.; Xin, Z. Adaptive Spatially Neighborhood Information Gaussian Mixture Model for Image Segmentation. J. Comput. Res. Dev. 2011, 48, 2000–2007. [Google Scholar]
- Wang, X.; Yang, J.; Darrell, T. Segment Anything Without Supervision. Adv. Neural Inf. Process. Syst. 2024, 37, 138731–138755. [Google Scholar]
- Kervadec, H.; Bouchtiba, J.; Desrosiers, C.; Granger, E.; Dolz, J.; Ayed, I.B. Boundary Loss for Highly Unbalanced Segmentation. In Proceedings of the 2nd International Conference on Medical Imaging with Deep Learning, London, UK, 8–10 July 2019. [Google Scholar]
- Abdollahi, A.; Pradhan, B.; Alamri, A. VNet: An End-to-End Fully Convolutional Neural Network for Road Extraction from High-Resolution Remote Sensing Data. IEEE Access 2020, 8, 179424–179436. [Google Scholar] [CrossRef] [Scilit]
- Wang, B.; Zou, L.; Chen, J.; Cao, Y.; Cai, Z.; Qiu, Y.; Mao, L.; Wang, Z.; Chen, J.; Gui, L.; et al. A Weakly Supervised Segmentation Network Embedding Cross-scale Attention Guidance and Noise-sensitive Constraint for Detecting Tertiary Lymphoid Structures of Pancreatic Tumors. IEEE J. Biomed. Health Inform. 2024, 28, 988–999. [Google Scholar] [CrossRef] [Scilit]
- Xue, Y.; Tang, H.; Qiao, Z.; Gong, G.; Yin, Y.; Qian, Z.; Huang, C.; Fan, W.; Huang, X. Shape-Aware Organ Segmentation by Predicting Signed Distance Maps. In Proceedings of the AAAI Conference on Artificial Intelligence, New York, NY, USA, 7–12 February 2020; Volume 34. [Google Scholar]
- Sudre, C.H.; Li, W.; Vercauteren, T.; Ourselin, S.; Cardoso, M.J. Generalised Dice Overlap As a Deep Learning Loss Function for Highly Unbalanced Segmentations. In International Workshop on Deep Learning in Medical Image Analysis; Springer: Cham, Switzerland, 2017. [Google Scholar]
- Kingma, D.P.; Ba, J. Adam: A Method for Stochastic Optimization. arXiv 2015, arXiv:1412.6980. [Google Scholar]
- Ronneberger, O.; Fischer, P.; Brox, T. U-Net: Convolutional Networks for Biomedical Image Segmentation. In Medical Image Computing and Computer-Assisted Intervention—MICCAI 2015; Lecture Notes in Computer Science; Springer: Cham, Switzerland, 2015; Volume 9351. [Google Scholar]
- Lin, T.-Y.; Dollar, P.; Girshick, R.; He, K.; Hariharan, B.; Belongie, S. Feature Pyramid Networks for Object Detection. In Proceedings of the IEEE Conference on Computer Vision and Pattern Recognition, Honolulu, HI, USA, 21–26 July 2017. [Google Scholar]
- Chen, L.-C.; Zhu, Y.; Papandreou, G.; Schroff, F.; Adam, H. Encoder-Decoder with Atrous Separable Convolution for Semantic Image Segmentation. In Proceedings of the European Conference on Computer Vision, Munich, Germany, 8–14 September 2018; Lecture Notes in Computer Science. pp. 833–851. [Google Scholar]
- He, K.; Zhang, X.; Ren, S.; Sun, J. Deep Residual Learning for Image Recognition. In Proceedings of the IEEE Conference on Computer Vision and Pattern Recognition, Las Vegas, NV, USA, 26 June–1 July 2016. [Google Scholar]
- Chen, R.; Sun, Y. The study of an improved randomized algorithm for detecting ellipses based on least square approach. Ind. Instrum. Autom. 2017, 2, 35–38+46. [Google Scholar]
- Lin, L. A concordance correlation coefficient to evaluate reproducibility. Biometrics 1989, 45, 255–268. [Google Scholar] [CrossRef] [Scilit]

Disclaimer/Publisher’s Note: The statements, opinions and data contained in all publications are solely those of the individual author(s) and contributor(s) and not of MDPI and/or the editor(s). MDPI and/or the editor(s) disclaim responsibility for any injury to people or property resulting from any ideas, methods, instructions or products referred to in the content. |
© 2026 by the authors. Licensee MDPI, Basel, Switzerland. This article is an open access article distributed under the terms and conditions of the Creative Commons Attribution (CC BY) license.