


Abstract
In the subsequent backfilling mining method, the composite structure formed by the ore pillar and the backfill is the key element in ensuring the stability of the working face. Its mechanical behaviour directly affects mining safety and ore recovery rates. In order to elucidate the mechanical response and failure mechanisms of rock-like backfill composite structures (RLBCS) under biaxial loading, specimens with different water-to-cement (W/C) ratios (0.5, 0.6, 0.7 and 0.8) for the rock-like backfill were prepared in this study. Biaxial loading tests were conducted, with digital image correlation (DIC) technology employed simultaneously to monitor the evolution of strain and displacement on the specimen surface. The results indicate that the biaxial strength of RLBCS decreases exponentially as the W/C increases. When the W/C exceeds 0.7, the strength reaches a plateau. The strength contribution of the backfill increases relatively. The axial stress–strain curve exhibits four distinct phases. A pronounced bimodal distribution is observed when the W/C exceeds 0.5. The evolution of lateral strain exhibits a transition point where compression is followed by expansion. The threshold for lateral expansion stress exhibits a non-monotonic variation. The modulus of elasticity decreases as the W/C increases. The apparent structural strain ratio exhibits a non-monotonic variation. The failure pattern exhibits marked asymmetry. The rock-like side shows tensile failure. Where the interface is present, this manifests as localised crushing at the top of the rock-like layer, cracking along the interface, and bulging of the backfill. The W/C ratio of the rock-like material governs the failure mechanism of RLBCS. The strain localisation modes in backfill materials are classified into two types: post-peak abrupt and pre-peak gradual. The evolution of interface strain exhibits four distinct stages: an initial abrupt change, cooperative deformation, crack initiation, and post-peak instability. The spatiotemporal evolution of interfacial delamination and the deformation of the backfill was quantified through displacement field analysis. The research findings provide a theoretical basis for the design of underground mining operations.
1. Introduction
The subsequent backfilling mining method is an important technical approach to achieving environmentally friendly mining in metal mines [1,2]. By dividing the mining area into ore rooms and ore pillars and implementing staged mining and backfilling, it is possible to effectively control ground pressure, improve resource recovery rates and reduce the risk of surface subsidence [3,4]. In this mining method, the ore chamber is backfilled with a cemented backfill following extraction [5,6,7,8]. The backfill and the central ore column form a backfill-ore pillar-backfill sandwich-type composite load-bearing structure [9,10]. A schematic of this mining method and the resultant pillar-backfill composite structure is shown in Figure 1. This rock backfill composite structure serves as the core support unit for maintaining the long-term stability of the underground working [11,12]. Its mechanical behaviour directly influences the safe implementation of subsequent backfilling mining methods and the optimisation of working face structural parameters [13,14].
Figure 1.
Schematic of subsequent backfilling mining and the resulting pillar-backfill composite structure.
During actual mining operations, rock-backfill composite structures are subjected to complex stress conditions and engineering disturbances [15,16,17,18]. On the one hand, when an ore pillar undergoes blasting and excavation, the propagation of stress waves generated by the explosive load leads to the accumulation of internal damage and a deterioration in strength [19,20,21]. Research indicates that, in environments subject to high in situ stress, blasting disturbances are one of the primary factors affecting the stability of ore pillars. The interaction between blasting loads and initial in situ stress exacerbates the extent of damage to the ore pillars [22,23,24]. On the other hand, once mining operations have concluded, the rock backfill composite structure bears the vertical pressure transmitted by the overlying strata [25,26,27]. It is also subject to lateral confinement provided by the backfill in adjacent working faces or the surrounding rock. Its stress state exhibits typical characteristics of biaxial loading [28,29,30]. Therefore, investigating the mechanical behaviour and failure mechanisms of composite structures under biaxial loading is of great significance for guiding the design of ore pillar dimensions and the optimisation of backfill proportions.
In recent years, scholars both in China and abroad have conducted extensive research into rock backfill composite structures [31,32,33,34]. Zhou et al. [35] developed a particle flow model for waste rock cemented backfill. They investigated the effect of segregation on the uniaxial compressive mechanical behaviour and found that the lower the degree of segregation in the slurry, the higher the strength of the backfill. Hu et al. [36] investigated the influence of the strength ratio between the rock and the backfill, and the contact angle, on the crack propagation and damage behaviour of rock backfill composite structures under uniaxial compression. It was found that when the interface angle was between 0° and 30°, cracks originated within the backfill. When the interface angle was between 60° and 90°, cracks propagated along the interface. Zhao et al. [37] investigated the mechanical response of rock-backfill-rock composite structures under different interface angles and height ratios through uniaxial compression and acoustic emission tests, combined with finite element and discrete element methods. It has been found that an increase in the inclination angle significantly reduces the load-bearing capacity and resistance to deformation of the composite structure. Through laboratory experiments and PFC numerical simulations, Wang et al. [38] identified three distinct stages in the damage evolution of rock backfill composite structures under uniaxial compression. These stages are the slow damage accumulation stage, the accelerated damage development stage, and the rapid damage growth stage. Wang et al. [39] developed a damage constitutive model for rock-enclosed backfill. They found that the total damage is composed of both damage at the centre of the backfill and damage to the rock. The damage curve exhibits an S-shaped evolution. Wang et al. [40] found that the strength of composite structures exhibits a trend of first decreasing and then increasing as the interface angle increases. The strength is lowest at 60° and highest at 90°. Li et al. [41] employed an FDM-DEM coupled method to investigate the dynamic mechanical response of rock backfill composite structures under different interface angles and impact velocities. It was found that the peak intensity first decreased and then increased as the interface angle increased. The above research has laid an important foundation for understanding the mechanical behaviour of rock backfill composite structures. However, existing research has largely focused on uniaxial loading conditions. There is still a lack of systematic understanding regarding the mechanical response and strain evolution of rock backfill composite structures under biaxial loading. In particular, there is a lack of quantitative characterisation of the coordination of deformation in the interface region and the evolution of damage. In research involving multi-axial loading conditions, Yu et al. [42] conducted triaxial loading tests on rock–backfill composite structures, revealing the influence of seepage pressure on the evolution of damage indices and the distribution characteristics of cracks; however, this study did not systematically analyse the deformation coordination and damage evolution at the interface between the rock and the backfill. Ji et al. [43] conducted biaxial compression tests on rock materials containing defects and, using techniques such as acoustic emission, DIC and CT, analysed the controlling role of confining pressure on crack initiation and propagation; however, this study did not address rock–backfill composite structures. Overall, systematic research into the mechanical behaviour and interfacial damage evolution of rock–backfill composite structures under biaxial and triaxial loading conditions remains very limited.
In summary, this paper focuses on rock-like backfill composite structures (RLBCS) with varying W/C ratios. Biaxial loading tests were conducted, with digital image correlation (DIC) technology employed simultaneously to monitor the evolution of strain and displacement on the specimen surface. To analyse the strength characteristics, deformation behaviour, failure modes and the spatiotemporal evolution of the strain-displacement field of RLBCS. The aim is to investigate the mechanical properties and damage evolution of RLBCS under biaxial loading. The findings of this study provide a theoretical basis for analysing the stability of mining areas and optimising structural parameters in subsequent backfilling mining methods.
2. Materials and Methods
2.1. Materials
The tailings used in this study were sourced from a lead-zinc mine in Inner Mongolia, China. The binder used is 32.5 ordinary Portland cement sourced from a cement plant in Shandong, China. The water used in the experiment is tap water from the laboratory. The chemical composition of the tailings was analysed using an X-ray fluorescence spectrometer (XRF-1800, Shimadzu Corporation, Kyoto, Japan). The main chemical constituents are shown in Figure 2a. The main constituents of the tailings are SiO2 (31.3%) and CaO (27.1%), followed by Al2O3 (15.6%) and Fe2O3 (12.9%). A high CaO content suggests that the tailings are rich in carbonate minerals or calcareous components, which can participate in cement hydration reactions in alkaline environments and promote the formation of ettringite (AFt) and calcium-silicate-hydrate (C-S-H) gels, thereby facilitating early-age strength development in the backfill. In addition, the elevated CaO content increases the alkalinity of the pore solution, which may activate the latent pozzolanic activity of SiO2 and Al2O3 present in the tailings, promoting secondary hydration reactions that further densify the microstructure during prolonged curing. A laser particle size analyser (Mastersizer 3000, Malvern Panalytical Ltd., Malvern, UK) was used to measure the particle size distribution of the tailings. The differential and cumulative distribution curves are shown in Figure 2b. The particle size range of the tailings is quite wide. The median particle size (d50) is approximately 114.3 μm, whilst d10 and d60 are approximately 25.7 μm and 142.9 μm respectively. The coefficient of uniformity (Cu = d60/d10) is 5.56. This indicates a good particle size distribution, making it suitable for use in cemented backfill.
Figure 2.
The chemical composition (a) and particle size distribution (b) of the tailings.
2.2. Preparation of RLBCS Samples
In this study, pure cement paste was employed as the rock-like material rather than natural rock for several considerations. First, given that the present investigation focuses primarily on the mechanical behaviour of the backfill component within the composite structure, a low-capacity loading system suitable for cemented backfill was utilised. To ensure compatibility with this loading system, pure cement paste specimens with relatively low strength were adopted as substitutes for natural rock, following the methodology reported in previous studies [44]. Second, the pure cement paste exhibits pronounced brittle behaviour upon failure, which closely resembles the mechanical response of natural rock under compression. Third, there is no universally accepted standard for defining the strength ratio or strength difference between engineering rock masses with varying strengths and cemented backfill; however, the W/C ratio is a well-established and widely used parameter for differentiating the strength of cementitious materials. Its adoption as the control variable in this study ensures good reproducibility and experimental consistency. Finally, the use of cement paste avoids the inherent variability associated with natural rock, such as joints, fractures, and mineral heterogeneity, thereby allowing for a more controlled investigation of the composite structure behaviour.
In this study, RLBCS samples with different W/C ratios were designed; the preparation process is shown in Figure 3. The W/C ratio is defined as the mass ratio of water to cement. RLBCS specimens are rectangular prisms measuring 50 mm × 50 mm × 100 mm (length × width × height). The rock-like layer is 10 mm thick, whilst the backfill layer is 30 mm thick. First, rock-like samples were prepared using cement and water. The W/C ratios of the rock-like samples were 0.5, 0.6, 0.7 and 0.8. The cement and water were mixed and stirred for 3 min using a JJ-5 standard laboratory stirrer (Wuxi Jianyi Instrument Machinery Co., Ltd., Wuxi, China) at room temperature (20 ± 2 °C). The slurry was poured into a mould measuring 100 mm × 50 mm × 10 mm (length × width × height). Curing was carried out in a constant-temperature and humidity curing chamber at a temperature of 20 °C and a humidity of 95%. The curing period was 2 d. The interface between the rock-like slab and the backfill is a critical element of the RLBCS, and its preparation was carefully controlled to ensure reproducibility. After curing for two days, these rock-like panels were neither oven-dried nor soaked, as both treatments could alter the interfacial bonding properties. The rock-like surfaces were not artificially roughened nor coated with an adhesive; consequently, the interface retained its original state as cast.
Figure 3.
The preparation processes of RLBCS samples.
The solid content of the backfill was 75%, with a cement-to-tailings ratio of 1:8. First, the tailings, cement and water were mixed for 3 min, then the mixture was poured into a mould measuring 50 mm × 50 mm × 100 mm (length × width × height). Before pouring, the prepared rock-like pieces were placed into the mould. The formwork was removed after 48 h. The specimen was cured in a constant-temperature and humidity curing chamber at a temperature of 20 °C and a humidity of 95%. The curing period was 7 d. Regarding the curing regime, the rock-like slabs were pre-cured for 2 days to achieve sufficient handling strength for demolding and placement into the composite mould, while still maintaining a relatively fresh surface to promote bonding with the freshly cast backfill. Prolonged pre-curing of the rock-like phase (e.g., 7 d or more) would have resulted in a more mature surface with reduced surface moisture and reactivity, potentially compromising interfacial bonding. The composite was then cured for an additional 7 days before testing, as this duration is widely adopted in cemented backfill studies to represent the early-age strength development of the backfill. Relevant for assessing short-term stability in mining operations. Prior to testing, all specimens were visually inspected for visible defects, and dimensional verification was performed using a vernier calliper (accuracy ±0.02 mm). Specimens with dimensional deviations exceeding ±0.1 mm or visible defects were discarded.
The specimen dimensions used in this study are standard sizes commonly employed in rock mechanics testing, which effectively ensure the reproducibility of the tests and the comparability of the data. However, it should be noted that there is a significant difference in scale between the small-scale laboratory specimens and the actual dimensions of the mine workings on site; this scale effect may affect the direct extrapolation of the test results. Therefore, when applying the results of this study directly to the design of actual mine workings, it is recommended that appropriate scale corrections be made in conjunction with numerical modelling or on-site monitoring methods.
2.3. Biaxial Loading Experiment
Biaxial loading tests on the RLBCS were conducted using a backfill loading system (Euro-Asia Instrumentation Ltd., St. Albans, UK). The experimental system comprises a loading device, a computer control unit and a data acquisition unit. The loading system comprises two independent units: one for axial loading and one for lateral loading. Both operate in a rigid loading mode. This is a standard biaxial loading setup widely adopted in rock mechanics testing. Precise loading is achieved via a computerised control system. The loading machine is equipped with high-precision strain gauges and displacement transducers. During the experiment, data is automatically collected and saved in real time to a computer.
The biaxial loading configuration adopted in this study was designed to simulate the stress state of the pillar-backfill composite structure in subsequent backfilling mining operations. In the field, after the extraction of adjacent stopes, the composite structure is subjected to vertical pressure from the overburden, which is replicated by axial loading applied to the top of the specimen. Meanwhile, lateral support from adjacent backfilled stopes or surrounding rock is simulated by lateral loading applied to the rock-like surfaces. During the experiment, the bottom of the specimen is fixed, and axial stress is applied to the top. Lateral stress is applied to the rock-like surfaces on both sides. This involves leaving one side of the interface between the rock-like and the backfill unsupported, i.e., without lateral confinement. The stress path under biaxial loading was determined on the basis of preliminary experiments, as shown in Figure 4. The biaxial loading is divided into two stages. The first stage involves simultaneous loading in the lateral and axial directions. The loading rate for both directions is 0.5 MPa/min. Loading is stopped when the stress in both directions reaches 0.5 MPa. In the second stage, the lateral stress is kept constant. Only axial loading is applied. The loading rate is controlled by displacement at a rate of 0.005 mm/s until the specimen fails. The experimental setup and specimen loading method are shown in Figure 5. The axial load is applied uniformly over the full top surface of the specimen (50 mm × 50 mm). The lateral load is applied to the external rock-like surfaces through a loading platen with a contact area of 50 mm (width) × 50 mm (height), centred on the 50 mm × 50 mm side face. Stress is calculated as pressure divided by area and is determined directly by the computer. To minimise end friction, a thin layer of lubricating grease was applied between the loading platens and the specimen ends. The alignment tolerance was maintained within ±0.05 mm, verified using a dial gauge during setup.
Figure 4.
Diagram of biaxial loading stress path and specimen loading.
Figure 5.
Biaxial loading test system.
For each W/C ratio, three parallel sets of RLBCS specimens were prepared and tested under identical loading conditions, yielding a total of 12 specimens. As this study focuses on the analysis of stress–strain curves and DIC results, the specimens with strength values closest to the mean were selected for data processing and analysis. This approach reduces the workload whilst ensuring the accuracy of the results. It should be noted that the loading rates adopted in this study were selected based on preliminary tests and kept constant across all specimens to ensure data comparability. However, the loading rate itself is known to influence the mechanical response and failure characteristics of composite structures. A systematic investigation of the parameters affecting loading rates would require dedicated experiments to be conducted at multiple loading rates. This is beyond the scope of the present study and will be addressed in future research. The results of this study are primarily applicable to quasi-static loading conditions.
2.4. DIC Test
DIC measurements were carried out concurrently during the biaxial loading tests to monitor the evolution of strain and displacement on the specimen surface in real time. A high-resolution smartphone camera (12 MP, f/1.6 aperture) was used to record the specimen surface during loading at a frame rate of 60 fps. The camera was positioned perpendicular to the observation surface at a working distance of approximately 300 mm with a physical pixel size of approximately 0.08 mm/pixel. Speckle patterns were applied using aerosol spray paints to achieve an average speckle size of 3–5 pixels and a speckle density of approximately 40–50%. The recorded videos were exported as image sequences at 5 fps (0.2 s interval) for DIC analysis. The downsampling from 60 fps recording to 5 fps analysis was validated by comparing the strain fields obtained at 5 fps and 60 fps for selected specimens; no significant differences were observed in the strain localization patterns or the timing of the first stress drop. The 5 fps rate is therefore sufficient to capture the key deformation events under the quasi-static loading condition employed in this study. Load and displacement data were synchronously recorded by the testing machine at 10 Hz and time-stamped to the image acquisition system. The analysis was performed using Vic-2D with a subset size of 31 × 31 pixels, a step size of 5 pixels, bicubic spline interpolation, and a strain window of 15 × 15 data points. Displacement measurement precision was subject to standard correlation errors inherent to the DIC algorithm; no independent verification was performed. Data points with correlation coefficients below 0.8 were excluded to minimise measurement errors, particularly in regions with significant strain localization or cracking. DIC analysis was performed on the representative specimen that exhibited the closest mechanical response to the group average, as full processing of all specimens would be prohibitively time-consuming. This selection ensured that the strain field analysis is representative of the typical behaviour for each W/C group.
The principle behind DIC testing involves calculating the displacement field by tracking changes in the position of a specific sub-region within images taken before and after deformation of the specimen’s surface [45,46]. Specifically, the initial, undeformed image is divided into a number of grid sub-regions. The deformed image is then searched to identify the target sub-region whose grey-scale distribution best matches that of each sub-region. This yields the displacement vector at the centre of the sub-region. Using full-pixel scanning and sub-pixel interpolation algorithms. On this basis, the strain field can be obtained by numerically differentiating the displacement field. This enables the analysis of mechanical behaviours such as deformation localisation, crack initiation and propagation during the loading of the specimen.
It should be noted that the present DIC analysis is based on a 2D setup, which assumes that the specimen surface remains planar throughout the loading process. This assumption is reasonable for the pre-peak deformation stage. However, in the post-peak stage, the specimen may undergo significant out-of-plane displacement due to localised bulging, delamination, and cracking, which would violate the planar assumption and may introduce measurement errors. Consequently, the DIC results obtained during the post-peak phase are interpreted only qualitatively. The two-dimensional DIC system itself has inherent limitations in capturing non-planar deformation and does not correct for perspective or non-planar errors.
3. Results
3.1. Strength Characteristics of RLBCS
Table 1 shows the strength values, mean, standard deviation, and coefficient of variation for all samples in this study. Figure 6a shows the relationship between the biaxial compressive strength of RLBCS and the W/C ratio. As can be seen from the graph, the biaxial strength of RLBCS exhibits a decreasing trend with increasing W/C. The data points can be tentatively described by an exponential decay function within the tested W/C range. However, with only four W/C levels, this fitting should be regarded as an empirical trend rather than a validated constitutive law. As the water–cement ratio increased from 0.5 to 0.8, the biaxial strengths were 6.5430 MPa, 5.6481 MPa, 5.1600 MPa and 5.1588 MPa respectively. Figure 6b shows the rate of change in strength for samples based on a W/C of 0.5. When the W/C was increased from 0.5 to 0.8, the strength decreased by 13.68%, 21.14% and 21.16% respectively. The macroscopic strength of RLBCS appears to be primarily governed by the rock-like component, as inferred from the consistent reduction in composite strength with increasing W/C ratio (which corresponds to lower rock-like strength). A high W/C reduces the strength and stiffness of the rock-like material, thereby compromising its function as a primary load-bearing unit. This causes the RLBCS as a whole to fail even under relatively low stress. It is worth noting that the strength of samples with W/C ratios of 0.7 and 0.8 is similar. This indicates that when the strength of the rock-like material falls below a certain critical threshold, its dominant influence on the strength of the RLBCS diminishes, whilst the contribution of the backfill material to the strength increases.
Table 1.
Strength results for RLBCS.
Figure 6.
The relationship between Biaxial strength and its rate of change with W/C: (a) biaxial strength; (b) biaxial strength change rate.
3.2. Deformation Characteristics of RLBCS
3.2.1. Stress–Strain Curve
Figure 7a shows the axial stress-axial strain curve for RLBCS under biaxial loading. As can be seen from the figure, the axial stress-axial strain curve of RLBCS exhibits typical four-stage deformation characteristics. These are the initial pore-closure stage, the linearly elastic stage, the yield stage and the post-peak stage. This segmental characteristic reflects the progressive failure process of RLBCS under load. Initial pore-closure stage: the curve is concave, with stress increasing slowly and strain increasing relatively rapidly. This stage is primarily driven by the closure of primary micro-pores within the specimen and interfacial voids. The interface between the backfill and the rock-like material begins to consolidate gradually. Linear elastic stage: Stress and strain are approximately linearly related. The RLBCS is in a state of elastic deformation. Yield stage: The slope of the curve gradually decreases. The specimen enters the stage of cumulative plastic deformation. Post-peak phase: After the stress reaches its peak, it begins to decline; all samples exhibit a distinct stress plateau during the post-peak phase. This indicates that the failure process of the RLBCS during the post-peak phase is relatively gradual, and that it possesses a good residual load-bearing capacity.
Figure 7.
Relationship between axial stress and axial strain: (a) stress–strain curve; (b) strength increment.
It is worth noting that when the W/C exceeds 0.5, the axial stress-axial strain curve exhibits a distinct bimodal pattern. However, there are significant differences in the bimodal shapes of the curves for different W/C. As can be seen from Figure 7a, when the W/C is 0.6, the curve drops sharply for the first time after the linear elastic stage ends, forming the first peak. Subsequently, the stress rises non-linearly once more to a second peak before declining. The axial stress at the first peak in the curve is 5.65 MPa, and the axial stress at the second peak is 5.34 MPa. The axial stress value at the second peak is lower than that at the first peak, representing a reduction of 5.49%. At a W/C of 0.7, the position of the first peak on the curve is similar to that of the sample with a W/C of 0.6, occurring at the end of the linear elastic stage. The curve then rises non-linearly to a second peak before falling. Unlike the curve for a W/C of 0.6, the axial stress value of the first peak in the sample with a W/C of 0.7 is significantly lower than that of the second peak. The axial stress values for the first and second peaks are 4.71 MPa and 5.16 MPa, respectively. The axial stress value for the second peak has increased by 9.55%. At a W/C of 0.8, the bimodal distribution of the curve differs significantly from that of samples with W/C of 0.6 and 0.7. The first peak of the curve occurs prior to the elastic strain stage. Furthermore, there is a significant difference in axial stress between the two peaks. The axial stress values for the first and second peaks were 1.60 MPa and 5.16 MPa respectively; the axial stress value for the second peak increased by 222.50%.
As can be seen from Figure 7a, there is a marked difference in the reduction in the stress value at the first peak of the curves for different W/C. Figure 7b shows the relationship between the peak stress of the first peak and the W/C. As can be seen from the graph, the decrease in peak stress at the first peak diminishes as the W/C increases. When the W/C was increased from 0.5 to 0.8, the peak stress at the first peak decreased by 13.61%, 16.64% and 66.03% respectively.
Figure 8a shows the axial stress-lateral strain curve. As can be seen from the figure, the axial stress-lateral strain curve exhibits three distinct phases. These are the initial loading stage, i.e., the stage during which both axial and lateral stresses are applied up to 0.5 MPa; the stage during which the axial stress increases from 0.5 MPa to its peak; and the stage following the peak axial stress. In this study, the following strain sign convention is adopted: compressive strain is defined as negative, and tensile/expansive strain is defined as positive. However, the identification of compression and expansion phases is based on the evolution trend of strain, rather than solely on the sign of the strain value itself. Specifically, a consistent increase in strain (becoming more positive) indicates progressive expansion, while a consistent decrease in strain (becoming more negative) indicates progressive compression. This trend-based approach is applied throughout the analysis, particularly in identifying the compression-to-expansion transition in the lateral strain evolution.
Figure 8.
Relationship between axial stress and lateral strain: (a) stress–strain curve; (b) the relationship between lateral expansion stress and W/C.
During the initial loading stage, when the lateral stress is applied up to 0.5 MPa, the lateral strain increases as the W/C increases. As the W/C increased from 0.5 to 0.8, the strain values were 1.256%, 2.032%, 2.500% and 2.555% respectively, representing increases of 61.78%, 23.03% and 2.20%. This phenomenon indicates that the plastic deformation capacity of the rock-like material governs the initial deformation response of the RLBCS. Rocks with a high W/C undergo significant lateral deformation even under low stress.
During the phase in which the axial stress ranges from 0.5 MPa to its peak value, the lateral strain values show little change. During this phase, the RLBCS exhibits a deformation pattern characterised by compression followed by expansion. The axial stress corresponding to this inflexion point is the lateral expansion stress threshold. From an engineering perspective, the lower this threshold, the sooner the structure enters the stage of expansion damage under relatively low loads. This increases the risk of long-term stability. Figure 8b shows the relationship between lateral expansion stress and the W/C. It can be observed that the lateral expansion stress threshold varies non-monotonically with the W/C. At a W/C of 0.5 and an axial stress of 2.61 MPa, the RLBCS transitioned from lateral compression to lateral expansion. When the W/C was increased to 0.6, the lateral expansion stress decreased to 1.13 MPa. As the W/C continued to increase, the lateral expansion stress gradually increased.
In the post-peak phase of axial stress, the RLBCS continues to undergo lateral expansion. This indicates that, once the load-bearing limit is reached, the RLBCS will continue to exert expansion pressure on the surrounding rock. In actual mining workings, this means that failure of the ore pillar backfill system will result in sustained compressive deformation of adjacent workings, which may trigger a chain reaction of instability.
3.2.2. Modulus of Elasticity and Apparent Structural Strain Ratio of RLBCS
The modulus of elasticity is calculated by linear regression of the linear elastic region of the axial stress–axial strain curve
where ΔσAxial is the difference in axial stress between the start and end points of the linearly elastic region; and ΔεAxial is the difference in axial strain between the two points.
E = ΔσAxial/ΔεAxial
The results of the modulus of elasticity calculations are shown in Table 2. Figure 9 shows the elastic modulus and apparent structural strain ratio of RLBCS with different W/C. As can be seen from Figure 9a, the modulus of elasticity decreases as the W/C increases. The elastic modulus decreases with increasing W/C, and the data can be tentatively described by an exponential decay function within the tested range. A notable drop is observed between W/C = 0.7 and 0.8; however, with only four data points, the existence of a sharp stiffness threshold requires verification with additional intermediate W/C levels. This observation is therefore presented as a preliminary trend rather than a definitive critical value. In RLBCS, relatively hard rock-like elements serve as the primary load-bearing elements. A reduction in their modulus of elasticity directly weakens the overall deformation resistance of the RLBCS. It is worth noting that when the W/C increased from 0.7 to 0.8, the modulus of elasticity dropped sharply by 58.47%. This indicates that there is a critical point at which the material’s stiffness undergoes a sudden change under the conditions of this study. This threshold effect can be attributed to a fundamental change in the microstructure of rock-like materials at higher water-to-cement ratios. The reduction in cement hydration products causes the material’s stiffness to drop precipitously once a critical point is crossed. In engineering practice, this means that when the structural stiffness of the combined ore pillar and backfill structure falls below a certain critical value, it may lead to a significant increase in deformation under the same load. This, in turn, affects the stability of the mining face.
Table 2.
Calculated results for the modulus of elasticity.
Figure 9.
Relationship between Young’s modulus, (a) R value (b) and water–cement ratio.
Under biaxial loading conditions, as the lateral constraint acts as an active load, the traditional definition of Poisson’s ratio is not applicable. The apparent structural strain ratio (R) is used to describe the relationship between lateral and axial strain
R = εpeak,lateral/εpeak,Axial.
As can be seen from Figure 9b, the R value exhibits a non-monotonic variation as the W/C increases. As the W/C increases from 0.5 to 0.7, the R value gradually rises. However, when the W/C increases from 0.7 to 0.8, the R value decreases again.
3.3. Damage Pattern
Figure 10 shows the failure mode of the RLBCS. As can be seen from the figure, the failure mode of RLBCS exhibits a marked asymmetry. There are marked differences in the crack distribution and failure modes between the rock-like side and the side containing the interface. On the rock-like side, the crack morphology of all samples was essentially consistent, primarily manifesting as tensile cracks developing along the axial direction. Most of the cracks run across the entire surface of the rock-like formation.
Figure 10.
Damage patterns of the sample.
On the side containing the interface, the crack distribution is more complex, manifesting primarily in the following three forms of failure: (1) Rock-like failure zones are concentrated in the top region of the specimen, exhibiting characteristics of local fragmentation or spalling. This is because the top region bears the direct axial loading from the indenter, resulting in significant stress localisation effects. (2) Interfacial cracking was observed in some specimens. The cracks propagated along the interface between the rock-like and the backfill. This indicates that the interfacial bond strength is lower than the strength of the materials on either side, resulting in delamination failure during loading. (3) Bulging and protrusion damage occurred within the backfill, perpendicular to that side. This manifests as the backfill being forced outwards towards the open side.
The aforementioned fracture characteristics are closely related to the controlling effect of the constraints on the direction of crack propagation under biaxial loading. Previous studies have shown that, under multi-axial loading, the side with relatively lower constraint is the primary direction of crack propagation [47]. In the biaxial loading configuration used in this study, one side of the interface remains free (i.e., without lateral confinement), whilst the rock-like side is subjected to lateral loading. Consequently, the side containing the interface becomes the preferred direction for deformation release and crack propagation. This explains why bulging failure occurs within the backfill perpendicular to this side. It should be noted that the top crushing is partly influenced by stress concentration at the platen-specimen contact, and the asymmetric bulging of the backfill is primarily a boundary effect associated with the free surface on the interface side. These boundary-induced effects are qualitatively distinguished from the intrinsic material response in the discussion.
3.4. Analysis of DIC Test Results
Using DIC technology, the evolution of the strain-displacement field at different stress stages under biaxial loading was analysed. For each specimen, strain curves at 20%, 40%, 60%, 80% and 100% of the peak stress, as well as at the time immediately following the peak, were selected for analysis. Taking the axial stress-axial strain curve of a specimen with a W/C of 0.5 as an example, the stress points were selected as shown in Figure 11a. At the same time, a grid of strain and displacement monitoring points was arranged at the interface and in the cracked regions of the backfill, as shown in Figure 11b. Monitoring points are divided into two categories. For the interface region, 10 monitoring points were pre-defined on all specimens using a consistent physical coordinate system. For backfilled surfaces, as strain concentration zones are randomly distributed according to the crack pattern, monitoring points were set individually for each strain concentration zone identified in the strain contour plots of each specimen. Their physical coordinates vary between specimens. The reported displacements and strains correspond directly to the node values at each monitoring point.
Figure 11.
Axial stress–strain curve annotation of DIC sampling points (a) and monitoring point layout in DIC images (b).
3.4.1. Analysis of the Evolution of the Apparent Strain Field
Figure 12 shows the strain contour plots for various stress values. As can be seen from the figure, there is a strong correlation between the W/C and the evolution of strain. At a W/C of 0.5 and 20% σpeak, strain is concentrated within the rock-like material, particularly in areas such as the top and lateral edges. This indicates that, during the initial loading phase, the high-strength rock-like material acts as the primary load-bearing unit, taking the lead in absorbing and accumulating strain energy. As the load increases, the strain localisation shifts from the rock-like region to the interface region. At peak stress, strain is highly concentrated in the interface region. In contrast, only slight strain localisation occurs within the backfill. As the rock-like strength decreases (W/C of 0.6 and 0.8), the evolution of the strain field reflects different characteristics of synergistic load-bearing and progressive damage. When the W/C is 0.6 or 0.8, even under relatively low loads (20% σpeak), strain localisations occur not only in the rock-like but also simultaneously within the backfill. This demonstrates that when the difference in strength between the rock mass and the backfill decreases, the backfill contributes to the overall load-bearing capacity during the initial stages of loading. The deformation behaviour of the two components is highly coordinated. As the load increases, the regions of strain localisation within the rock-like reach their limit first, leading to local failure. The ultimate failure is the result of the coupled action of rock-like failure and the plastic yielding of the backfill. For specimens with a W/C of 0.7, no distinct strain evolution was observed within the void-filling material at the observation surface. This may be due to the single-sided observation angle of the DIC and the spatial randomness of damage propagation.
Figure 12.
Strain contour plots for all stress nodes across all specimens: (a) W/C = 0.5; (b) W/C = 0.6; (c) W/C = 0.7; (d) W/C = 0.8.
In the post-peak phase, the strain distribution across the surface of all samples differs markedly from that observed during the peak phase. Strain localisation is primarily localised at the interfaces and within the backfill. This indicates that, following the failure of the rock-like material, stress redistribution occurs within the RLBCS. Stress is transferred from the rock-like through the interface into the backfill, with the backfill becoming the primary load-bearing element.
It is acknowledged that the present interpretation of strain localization is based on qualitative DIC observations; quantitative indicators such as crack density or fracture energy were not evaluated in this study, as these measurements require complementary post-test techniques beyond the scope of this work.
The bimodal feature observed in the axial stress–strain curves warrants further examination. To identify the physical origin of each peak, strain fields at the first peak were extracted and analysed (Figure 13). At the first peak, the strain field shows pronounced localization concentrated at the top of the rock-like layer. Strain accumulation also occurs at the interface and in the backfill area. There are distinct cracks at the top of the rock-like formation. This observation supports the following interpretation: the first peak corresponds to the onset of localised failure within the rock-like portion.
Figure 13.
Strain contour plot of the first peak in a double-peak curve: (a) W/C = 0.6, axial strain 1.25%, axial stress 5.65 MPa; (b) W/C = 0.7, axial strain 0.83%, axial stress 4.72 MPa; (c) W/C = 0.8, axial strain 0.49%, axial stress 1.55 MPa.
A semi-quantitative description of the bimodal mechanism is provided based on stress–strain curves and DIC observations. Based on the strain field observations at the first and second peaks, the bimodal behaviour can be described in the following three consecutive stages: (1) The initial stage of the first peak: local failure of the rock-like material. When the axial stress reaches the first peak, strain localization begins to occur at the top of the rock-like material, and distinct cracks are present. This indicates that the stress drop following the first peak is triggered by local cracks within the rock-like material. (2) Stress recovery and load transfer. The load previously borne by the rock-like fracture zone is redistributed to other areas. This is reflected in a renewed rise in the stress–strain curve. (3) Second peak and post-peak phase. After the load redistribution, strain continued to accumulate within the specimen until a second peak was reached. The range of stress increments from the trough of the first peak to the second peak was 0.56 MPa (W/C = 0.6) to 3.68 MPa (W/C = 0.8). During the post-peak phase, the stress gradually decreased.
Figure 14 shows the strain evolution curves at the surface monitoring points of the RLBCS. Strain localisations in the backfill manifest in two distinct types. The first type is post-peak strain localisation. Samples with a W/C of 0.5 exhibit this behaviour. When the rock-like has high strength, the strain in the backfill during the pre-peak stage is close to zero. This indicates that the backfill contributes almost nothing to the effective bearing capacity, with the load being borne almost entirely by the rock-like. At the peak stage, the strain value rises abruptly. This indicates that the rock-like has reached its load-bearing limit, resulting in brittle failure or interface failure. The load is instantly transferred to the backfill. The second type is pre-peak strain localisation. Samples with a W/C greater than 0.5 exhibit this behaviour. As the strength of the rock-like material decreases, the backfill begins to contribute to the deformation from the very start of loading. The evolution of the strain exhibits a step-like increase: an initial sharp rise occurs at the onset of axial loading. This is followed by a relatively stable plateau phase. A second, sustained sharp rise in strain occurs in the post-peak phase. This process indicates that the backfill undergoes a progressive damage process comprising initial coordinated deformation, stable load-bearing, and plastic deformation. In particular, the rise and fall in strain observed in the sample with a water-to-cement ratio of 0.8 (as shown in Figure 14d). It is highly likely that micro-fractures formed in the rock-like material at an early stage, temporarily releasing local stresses and thereby alleviating stress localisations within the backfill. This clearly demonstrates the mutual influence of damage between materials and the dynamic redistribution of loads.
Figure 14.
Strain-time curves at monitoring points and stress–strain curves: (a) W/C = 0.5; (b) W/C = 0.6; (c) W/C = 0.7; (d) W/C = 0.8.
The strain evolution at the interface monitoring points exhibits marked spatial heterogeneity and temporal non-synchronisation. The strain variation trajectories at each monitoring point are independent and show significant differences. This confirms that the interface is a region characterised by a highly complex stress field and extremely inconsistent deformation. The evolution of interface strain is closely correlated with the strength of the rock-like material. For high-strength rock (W/C of 0.5), there should be no significant change in interfacial strain for the majority of the loading duration. Interfacial strain increases significantly in the post-peak stage. This indicates that interfacial failure is the result of macroscopic failure rather than its cause. The failure may originate in the rock-like. In the case of rocks with medium to low stiffness (W/C > 0.5), a slight increase in strain occurs in stress localisation zones, such as the top of the interface, during the initial loading phase. Some measurement points showed signs of strain accumulation even before the peak. This indicates that interface damage developed in tandem with the loading process. The significant increase in strain remains concentrated primarily in the post-peak phase, indicating that the interface has been fully penetrated, acting as the final failure path.
Figure 15 shows the strain distribution in different regions during the peak phase. The strain distribution in the backfilled crack region exhibits a non-monotonic variation with the water-to-cement ratio. When W/C = 0.6, the strain range is widest and the values are highest (0.92299–3.48285%); at W/C = 0.7, the range was narrowest and the values were lowest (0.28171–1.01197%); W/C = 0.5 and 0.8 fell in the middle, with ranges of 0.3779–0.52145% and 0.56303–1.64146%, respectively. This indicates that during the peak stage, when the rock-like material has a W/C ratio of 0.6, more significant localised deformation concentration occurs in the internal crack zones of the backfill. In contrast, the strain distribution is most uniform at a low W/C ratio of 0.5, with the narrowest range. The strain distribution in the left interface region shows an overall decreasing trend as W/T increases. That is, the strain amplitude on the left interface of specimens with higher W/T values narrows significantly. This indicates that deformation at the interface is more uniform, and the degree of local tensile strain is reduced. The strain range in the right-hand interface region is greatest at W/C = 0.6, followed by W/C = 0.5; the ranges at W/C = 0.7 and W/C = 0.8 are relatively smaller, with the range at W/C = 0.7 being the narrowest. A comparison of the left and right interfaces reveals asymmetry in the deformation on both sides during the peak phase.
Figure 15.
Strain values in each region at the peak stage: (a) backfilled crack region; (b) left interface region; (c) right interface region.
3.4.2. Analysis of the Evolution of the Apparent Displacement Field
Figure 16 shows the curve of axial displacement at the monitoring point over time. The yellow section in the diagram represents the lateral loading phase. The axial displacement of the backfill remains negative (in the direction of compression) throughout the loading process. However, the rate at which it evolves and its post-peak behaviour exhibit significant variability. As both the axial and lateral stresses increased simultaneously to 0.5 MPa, the axial displacement changed only slightly. When the lateral stress remains constant and the axial stress is increased independently, the absolute value of the axial displacement continues to increase. This corresponds to the linear elastic and yield stages of the macroscopic axial stress-axial strain curve. This indicates that the backfill continues to bear and transmit axial loads. In the post-peak stage, the axial displacement behaviour of samples with different W/C differs markedly (remaining stable, continuing to compress or rebounding). For example, the plateau phase of the displacement curve for a sample with a W/C of 0.5 suggests that failure is likely to be dominated by tensile or shear cracks perpendicular to the plane of observation. The axial compression of the backfill in the direction of observation is halted by macroscopic fracture. The displacement of the sample with a W/C of 0.7 continued to rebound upwards. This indicates that the failure propagated along the direction of the observation plane, causing the backfill to expand locally into the free space.
Figure 16.
Axial displacement-time curves at monitoring points and stress–strain curves: (a) W/C = 0.5; (b) W/C = 0.6; (c) W/C = 0.7; (d) W/C = 0.8.
The evolution of axial displacement at the interface exhibits four distinct stages. The first stage is initial displacement adjustment. At the onset of loading, a sudden change in axial displacement was observed at the interface of specimens with a W/C greater than 0.5, with displacement values varying by 0.1 to 0.2 mm.
The second stage is the cooperative deformation stage. During this stage, axial and lateral stresses are applied simultaneously. The curve is horizontal or approximately horizontal. The axial displacement at the interface enters a plateau phase. This indicates that, at lower stress levels, the interface is in a state of elastic, coordinated load-bearing. The rock-like and the backfill deform in unison, with no significant accumulation of displacement.
The third stage is the stage of crack initiation and propagation at the interface. As the axial stress increases, the absolute value of the axial displacement at the interface gradually increases. This indicates that axial displacement at the interface has begun to accumulate continuously in a single direction. This trend suggests that the shear stress at the interface may have exceeded its local bond strength, implying a transition toward frictional slip-dominated load transfer. However, as interfacial shear stress was not directly measured, this interpretation should be regarded as an inference based on the observed displacement evolution, rather than a directly verified mechanism.
The fourth stage is the post-peak instability phase. The curve exhibits a variety of patterns, such as remaining roughly flat, gradually decreasing or gradually increasing. Different displacement patterns correspond to different ultimate failure states. A stable displacement may indicate that the macroscopic failure surface has bypassed that monitoring point. A continuously increasing displacement suggests that the point lies within a failure zone undergoing continuous slippage. A sudden change in displacement implies that a violent displacement or delamination has occurred at that point.
Figure 17 shows the curve of lateral displacement versus time at the monitoring point. In the initial stage of simultaneous application of axial and lateral stresses, the horizontal displacement changes rapidly. This reflects the initial deformation adjustment and contact compaction process that the backfill undergoes in order to adapt to bidirectional constraints. Furthermore, horizontal displacement within the backfill exhibited characteristics of stability prior to the peak and loss of control following the peak. During the axial loading phase, once the lateral confinement has stabilised, the horizontal displacement remains relatively stable. This demonstrates that the constant lateral stress effectively restrains the lateral expansion of the backfill. However, in the post-peak phase, horizontal displacement changes abruptly (increasing or decreasing). This indicates that stress redistribution within the RLBCS intensifies following macroscopic instability. The backfill undergoes significant lateral deformation. The pattern of horizontal displacement at the interface closely resembles that of the backfill. The displacement plateau phase prior to the peak indicates that, before the axial load reaches its peak, lateral confinement effectively restricts lateral opening at the interface. Failure at the interface is primarily due to axial shear slip.
Figure 17.
Horizontal displacement-time curves at monitoring points and stress–strain curves: (a) W/C = 0.5; (b) W/C = 0.6; (c) W/C = 0.7; (d) W/C = 0.8.
4. Discussion
4.1. The Effect of W/C Ratio on Strength and Deformation Behaviour
It should be noted that the present study focused on the mechanical response of the composite structure as a whole, rather than on independent characterisation of its individual constituents. Therefore, standalone tests for UCS, elastic modulus, density, porosity, and tensile strength of each rock-like formulation and the backfill material were not conducted. Consequently, the explanation regarding the role of rock-like constituents in determining the mechanical behaviour of composite structures is inferred indirectly from observations at the composite structure level.
Experimental results indicate that the biaxial strength of RLBCS decreases exponentially as the water-to-cement ratio (W/C) of the rock-like material increases. Furthermore, when the water-to-cement ratio exceeds 0.7, the strength decreases only slightly. This phenomenon is consistent with the findings of Wang et al. [48]. The strength of a rock-backfill composite is primarily determined by the component with the higher strength. Based on the results of this study, it can be inferred that there may be a threshold for rock strength. Above this value, the strength contribution of the backfill becomes significant. This provides new insights into the transition from rock-dominated to collaborative load-bearing. This transition can be attributed to the gradual reduction in the difference in elastic modulus between the two types of material. From an engineering practice perspective, this threshold provides a reference for the design of backfill proportions in subsequent backfill mining operations. Where the stability of the mine pillars is poor, the load-bearing contribution of the backfill should be explicitly taken into account in the stability assessment. However, given the laboratory scale of this study, direct extrapolation to field conditions should be made with caution, and the threshold value identified herein is intended as a reference trend rather than a prescriptive design criterion.
The bimodal characteristic observed in the axial stress–strain curve warrants further investigation. The first peak most likely corresponds to local cracking within the rock-like material, whilst the second peak reflects the emergence of the filling material’s load-bearing capacity following stress redistribution. The variation in the relative values of the two peaks at different W/C ratios (where the first peak is higher than the second at W/C = 0.6, and the first peak is lower than the second at W/C = 0.7 and 0.8) indicates a change in the failure mechanism. At lower W/C ratios, the rock-like material undergoes sudden failure. At higher W/C ratios, however, it undergoes gradual deterioration. Backfilling compensates for the loss of bearing capacity. This interpretation is supported by the DIC strain field observations (Figure 12). Specifically, as loading progresses, the region of strain concentration gradually shifts from the rock-like material to the interface and the backfill.
4.2. The Effect of Lateral Confinement on the Deformation and Failure Evolution
The evolution of lateral strain exhibits a transition from compression to expansion. The threshold stress varies non-monotonically with W/C (Figure 8b). This non-monotonic behaviour reflects the competition between rock-like strength and interfacial effects. When W/C = 0.5, the high stiffness of the rock-like material effectively resists lateral deformation, resulting in a higher threshold. When W/C = 0.6, the reduction in stiffness causes lateral expansion to occur earlier, but the interface still retains sufficient bond strength to transmit shear stress. When W/C ≥ 0.7, a further reduction in stiffness and interface degradation lead to premature localised damage. This localised damage temporarily relieves the lateral stress, thereby delaying the onset of overall lateral expansion. This mechanism is consistent with the observed initial interface displacement (0.1–0.2 mm) when W/C > 0.5, as reported in Section 3.4.2. This indicates that the interface had already undergone consolidation and damage accumulation before the macroscopic lateral expansion threshold was reached.
The post-peak lateral expansion observed in all test specimens (Figure 8a) has a significant impact on the stability of the mining area. Previous studies on the rock-fissure composite bodies mainly focused on the mechanical behaviour during the pre-peak stage [49]. The results of this study indicate that, under biaxial loading, the composite structure continues to exert lateral expansion pressure on the surrounding rock even after failure. In subsequent backfilling mining operations, this means that the failed mine pillar–backfill system will continue to induce compressive deformation in adjacent mining areas or drifts. This may trigger progressive instability. This should be further verified in actual engineering projects using monitoring equipment.
4.3. Mechanisms by Which Interfaces Influence Failure and Strain Localisation
DIC analysis has provided new insights into interface-controlled failure in RLBCS. The identification of two distinct strain concentration modes in backfill is the core contribution of this study. These are the post-peak abrupt failure mode (W/C = 0.5) and the pre-peak gradual failure mode (W/C > 0.5). This classification reveals different load-transfer mechanisms. In the post-peak sudden failure type, the high-strength rock-like material bears the vast majority of the load until its sudden failure triggers an instantaneous transfer of the load to the backfill. Conversely, the pre-peak gradual type reflects a process of gradual degradation of rock-like material, whereby the backfill gradually assumes the load through stress redistribution.
This distinction in the mechanism has practical significance for backfill design. In working faces where the ore pillar is expected to retain high strength, the backfill primarily activates its load-bearing capacity after the ore pillar has failed. Consequently, the post-peak ductility of its composite structure is more critical than its pre-peak strength. Conversely, where the strength of the mine pillar is moderate to low, the backfill contributes to load-bearing from the early stages of loading, and the coordination between the peak strength and deformation of the composite structure is equally important. Given that this study was conducted only on a laboratory scale, the strength threshold for mineral columns in actual engineering applications requires further investigation.
4.4. Limitations and Future Work
Several limitations of this study should be acknowledged. First, the experiments were conducted on small-scale specimens (50 mm × 50 mm × 100 mm) under idealised loading conditions; scale effects may influence the transferability of the results to full-scale mining conditions. When extrapolating current laboratory results to field conditions, four parameters may undergo significant changes: (1) Strength. Large rock blocks exhibit lower apparent strength due to a greater number of defects; (2) Crack patterns. While only a few through-cracks appear in small specimens, field-scale failure involves complex crack networks; (3) Interfacial effects. At the laboratory scale, interfacial interactions may be exaggerated, potentially amplifying their mechanical effects; (4) Rock heterogeneity and boundary conditions. Natural joints, bedding planes, and stress gradients cannot be replicated by laboratory models. These factors should be taken into account when extrapolating to field-scale conditions. Second, the rock-like material was simulated using pure cement paste rather than natural rock, and the interface was artificially created under controlled laboratory conditions; this idealised representation may not capture the complexity of natural rock-backfill interfaces in the field. Third, only a single confinement condition (lateral stress of 0.5 MPa); the mechanical response under different confinement levels or more complex stress paths remains unknown. Fourth, the DIC measurements were limited to a two-dimensional observation surface, which cannot fully capture three-dimensional deformation fields, particularly in the post-peak stage where out-of-plane displacement becomes significant. Fifth, the specimens were tested at a single curing age (7 days for backfill, 9 days for rock-like), whereas field backfill properties evolve over longer time scales. Sixth, specimen-to-specimen variability—while minimised through controlled preparation procedures—may still influence the results, and the limited number of replicates for DIC analysis should be considered. Seventh, direct measurements of interface shear or tensile strength were not conducted, so interpretations regarding interface bond behaviour remain inferred from composite-level observations. Eighth, this study lacks standalone mechanical property data for the individual constituents of the RLBCS, including UCS, elastic modulus, density, porosity, and tensile strength of both the rock-like formulations and the backfill material. While the composite-level response provides strong phenomenological evidence for the inferred mechanisms, the lack of direct component-level data precludes a quantitative assessment of the strength ratio and stiffness mismatch effects. Despite these limitations, the consistent trends observed across the four W/C levels and the complementary DIC data provide robust phenomenological evidence for the proposed mechanisms. Future work should address these limitations through larger-scale testing, varied confinement conditions, three-dimensional DIC or CT imaging, longer curing ages, and direct interface property characterisation.
5. Conclusions
In this study, RLBCS specimens with different W/C ratios were prepared. Biaxial loading tests were conducted. By combining DIC strain and displacement monitoring, the mechanical properties and fracture behaviour of the RLBCS were investigated. The following main conclusions were drawn:
(1) The biaxial strength of composite structures is dominated by the rock-like phase and exhibits an exponential decline as the W/C increases. When the W/C increased from 0.5 to 0.8, the strength fell from 6.54 MPa to 5.16 MPa, a decrease of 21.1%. Under the current test conditions, the strengths are similar when W/C = 0.7 and 0.8.
(2) The axial stress-axial strain curve exhibits four distinct stages: initial consolidation, linear elasticity, yield, and post-peak. When the W/C exceeds 0.5, the curve displays a bimodal pattern. The presence of a post-peak stress plateau indicates that RLBCS possesses good residual load-bearing capacity. The evolution of lateral strain is divided into three stages: initial loading, pre-peak and post-peak. The threshold for lateral expansion stress exhibits a non-monotonic variation with the W/C. The corresponding thresholds for W/C of 0.5, 0.6, 0.7 and 0.8 are 2.61 MPa, 1.13 MPa, 3.83 MPa and 4.98 MPa, respectively. The modulus of elasticity decreases exponentially as the water–cement ratio increases. The apparent structural strain ratio exhibits a non-monotonic variation.
(3) The failure patterns exhibit marked asymmetry. On the rock-like side, failure occurs as axial tensile splitting. On the side containing the interface, failure manifests in three forms: crushing at the top of the rock-like section, cracking at the interface, and bulging of the backfill material.
(4) The backfill exhibits two distinct modes of strain localisation. High-strength rock (W/C of 0.5) corresponds to the post-peak abrupt change type. The backfill contributes almost nothing to the load-bearing capacity prior to the peak; medium- to low-strength rock (W/C > 0.5) corresponds to the pre-peak progressive type, with the backfill participating in cooperative deformation from the very start of loading. The evolution of interface strain exhibits four distinct stages: an initial sudden displacement, a platform of cooperative deformation, crack initiation and propagation, and post-peak instability.
(5) Analysis of the displacement field indicates that the axial displacement of the backfill exhibits various patterns, including stable, sustained compression or rebound, during the post-peak phase.
This study was primarily conducted using small-scale specimens in a laboratory setting; in future, the effects of scale and complex stress paths may be further investigated. By combining numerical simulation with in situ monitoring techniques, a cross-scale correlation model spanning from the laboratory to the engineering scale will be established. Furthermore, future research should build upon experiments conducted at the composite structural level, supplemented by systematic characterisation of the individual components, thereby enabling a more rigorous quantitative analysis of these controlling factors.
Author Contributions
P.W.: conceptualization, methodology, investigation, writing—original draft, formal analysis. J.L.: conceptualization, writing—review and editing, visualisation, investigation. W.S.: funding acquisition, writing—review and editing, resources, supervision. B.T.: data curation. Z.W.: resources, supervision. H.J.: validation. X.L.: visualisation. All authors have read and agreed to the published version of the manuscript.
Funding
We want to frankly recognise substantial grants from China’s National Key Research and Development Programme (with a grant number of 2022YFC2905003).
Data Availability Statement
The data presented in this study are available on request from the corresponding authors.
Conflicts of Interest
Author Pengtao Wang was employed by the company Shandong Gold Mining Technology Co., Ltd. Authors Pengtao Wang, Zaihai Wu, Hanwen Jia and Xiaofei Li were employed by the company Shandong Gold Group Co., Ltd. The remaining authors declare that the research was conducted in the absence of any commercial or financial relationships that could be construed as a potential conflict of interest.
References
- Li, S.; Dan, Z.; Yin, T.; Huang, Q. Response surface optimization and performance verification of cemented backfilling ratio for decyanided tailings. Results Eng. 2026, 30, 110072. [Google Scholar] [CrossRef] [Scilit]
- Gedik, A.; Lav, A.H.; Lav, M.A. Investigation of alternative ways for recycling waste foundry sand: An extensive review to present benefits. Can. J. Civ. Eng. 2018, 45, 423–434. [Google Scholar] [CrossRef] [Scilit]
- Bian, H.; Zhao, Y.; Zhao, L.; Shen, H.; Wang, Y.; Hao, J.; Jiang, Y. Energy-driven cross-scale mechanism of overburden instability in deep mining: From continuous deformation to discontinuous failure. Eng. Fail. Anal. 2026, 190, 110749. [Google Scholar] [CrossRef] [Scilit]
- Wang, Y.; Kong, D.; Wu, G.; Xiong, Y. Study on failure of roof overburden and high ground pressure control under deep repeated mining. Eng. Fail. Anal. 2026, 183, 110226. [Google Scholar] [CrossRef] [Scilit]
- Li, J.; Feng, G.; Bai, J.; Yilmaz, E.; Zhao, H.; Li, H.; Ma, J. Thermal effect on bearing behavior and instability of coal-backfill composites. Compos. Struct. 2025, 371, 119447. [Google Scholar] [CrossRef] [Scilit]
- Qin, H.; Wang, F.; Chen, D.; Hao, W.; Tang, T.; Liu, C.; Wang, X.; Li, C.; Lu, D. Performance and backfilling process design of coal-based solid waste paste under conditions of constant temperature, humidity, and variable pressure. Powder Technol. 2026, 473, 122208. [Google Scholar] [CrossRef] [Scilit]
- Li, J.; Yilmaz, E.; Cao, S. Influence of Solid Content, Cement/Tailings Ratio, and Curing Time on Rheology and Strength of Cemented Tailings Backfill. Minerals 2020, 10, 922. [Google Scholar] [CrossRef] [Scilit]
- Li, J.; Yilmaz, E.; Cao, S. Influence of industrial solid waste as filling material on mechanical and microstructural characteristics of cementitious backfills. Constr. Build. Mater. 2021, 299, 124288. [Google Scholar] [CrossRef] [Scilit]
- Xiao, M.; Du, C.; Song, W.; Wang, Y.; Shi, Z.; Lu, Y. Spatiotemporal evolution of the temperature field in cemented tailings backfill considering volume effects and its impact on the thermal environment. Energy Build. 2026, 356, 117110. [Google Scholar] [CrossRef] [Scilit]
- Zhang, C.; Song, W.; Guo, J.; Wang, Y.; Wang, X.; Li, X. Hydration behavior, microstructural evolution, and mechanical performance of tailings-based solid waste cemented backfill under high-temperature conditions. Powder Technol. 2026, 472, 122155. [Google Scholar] [CrossRef] [Scilit]
- Hao, J.; Zhou, Z.; Chen, Z.; Che, Z. Failure behavior of rock and steel slag cemented paste backfill composite structures under uniaxial compression: Effects of interface angle and steel slag content. J. Cent. South Univ. 2025, 32, 2679–2695. [Google Scholar] [CrossRef] [Scilit]
- Yu, Z.; Pan, Z.; Guo, J.; Liu, P.; Li, Y.; Wang, S.; Wu, H.; Ren, C.; Jin, J.; Zhang, B. Functional contribution and optimization of mix proportion of coal gangue, slag, and fly ash in the preparation of alkali-activated backfill materials. J. Environ. Manag. 2026, 404, 129184. [Google Scholar] [CrossRef] [Scilit] [PubMed]
- Long, D.; Wang, Y.; Li, C.; Wu, Y. Macro-meso fatigue fracture and instability of rock-backfill composite structure under increasing-amplitude cyclic loading. Constr. Build. Mater. 2024, 416, 135187. [Google Scholar] [CrossRef] [Scilit]
- Zhu, Z.; Zhou, Z.; Liu, J.; Zheng, F.; Mu, H. Prediction of ultrafine tailings backfill strength using the BO-XGBoost model. Powder Technol. 2026, 474, 122176. [Google Scholar] [CrossRef] [Scilit]
- Zhang, H.; Chen, R.; Wang, Y.; Bi, H.; Fan, C.; Peng, H. A coupled strain-damage framework for rock deformation and dynamic damage under cyclic loading based on mesoscale elastoplastic elements. Comput. Geotech. 2026, 192, 107879. [Google Scholar] [CrossRef] [Scilit]
- Zhang, M.; Fan, J.; Yang, W.; Li, Z.; Chen, J.; Jiang, D.; Li, Y.; Nelias, D. Experimental study on dynamic fracture and fragmentation behavior of surrounding rock in salt cavern gas storage under impact loading. Eng. Fract. Mech. 2025, 328, 111559. [Google Scholar] [CrossRef] [Scilit]
- Li, X.; Wang, J.; Cui, C.; Yan, B.; Ma, X.; Mu, P.; Chen, Y.; Zheng, W.; Yang, L.; Song, Y. Dynamic strength evolution and fracture transition in 3D-printed soft rock: A combined experimental and numerical study on flaw inclination effects. Theor. Appl. Fract. Mech. 2026, 144, 105536. [Google Scholar] [CrossRef] [Scilit]
- Wang, Y.; Liao, Z.; Bao, W.; Bi, S.; Zhu, J. Spallation of underground rock openings with weak planes in surrounding rock mass subjected to dynamic loading: An analytical investigation. Tunn. Undergr. Space Technol. 2026, 168, 107178. [Google Scholar] [CrossRef] [Scilit]
- Li, P.; Liu, Y.; Zhang, J.; Guo, Q.; Tang, C.; Wang, M.; Cai, M. Failure features and support design of the tunnel surrounding rock in fractured rock masses in a deep mine exposed to blasting disturbance. Eng. Fract. Mech. 2026, 335, 111920. [Google Scholar] [CrossRef] [Scilit]
- Gao, Q.; Yang, Q.; Jia, Y.; Zhou, H.; Yang, Z.; Leng, Z. Co-simulation of rock blasting crater by finite and discrete element methods and experiment validation. Simul. Model. Pract. Theory 2026, 149, 103274. [Google Scholar] [CrossRef] [Scilit]
- Li, X.; Li, Q.; Li, H.; He, L.; Hu, Z.; Xie, K.; Xia, X. An improved constitutive model for predicting blast-induced damage zones and surrounding rock pressure. Int. J. Rock Mech. Min. Sci. 2026, 202, 106504. [Google Scholar] [CrossRef] [Scilit]
- Wang, H.C.; Zhang, Q.B. Experimental testing, characterisation methods, and mechanical behaviour of blast-induced rock damage from uniaxial strain to multiaxial stress states. Int. J. Rock Mech. Min. Sci. 2026, 201, 106436. [Google Scholar] [CrossRef] [Scilit]
- Gao, W.; Wang, M.; Yu, H.; Wan, D.; Ren, L.; Zhu, Z. Three-dimensional numerical investigation of blast-induced rock failure under in-situ stress using the material point method. Comput. Geotech. 2026, 194, 108002. [Google Scholar] [CrossRef] [Scilit]
- Zhao, M.; Zhou, C.; Prado, Á.; Jiang, N.; Meng, X.; Yang, Y. Quantitative classification and threshold determination of rock blasting damage based on blasting crater tests and numerical simulation. Eng. Fract. Mech. 2026, 336, 111956. [Google Scholar] [CrossRef] [Scilit]
- Wang, X.; Liu, T.; Mei, W.; Huang, J.; Li, X.; Xiang, C. Continuum-discrete coupled model for dynamic impact of heterogeneous rock with X-shaped joints under biaxial preloading. Comput. Part. Mech. 2026, 13, 189–209. [Google Scholar] [CrossRef] [Scilit]
- Zhang, X.; Li, Z.; Yu, H.; Zhou, H.; Wang, H.; Jiao, X.; Wang, F. Experimental and numerical studies on rock damage law in straight-hole cut blasting under biaxial confining pressure. Int. J. Min. Sci. Technol. 2025, 35, 1529–1541. [Google Scholar] [CrossRef] [Scilit]
- Bi, R.; Liu, M.; Li, G.; Zhou, J.; Du, K. Mechanical properties and risk characterization of surrounding rocks containing various blocks of arch-shaped holes under biaxial compression. Eng. Fail. Anal. 2024, 158, 107983. [Google Scholar] [CrossRef] [Scilit]
- Robbiano, F.; Liu, K.; Zhang, Q.-B.; Orellana, L.F. Dynamic mechanical properties of veined rocks under biaxial confinement. Int. J. Rock Mech. Min. Sci. 2023, 170, 105538. [Google Scholar] [CrossRef] [Scilit]
- Luo, P.; Li, D.; Zhang, C.; Ru, W.; Han, Z.; Ma, J. Experimental investigation on biaxial mechanical properties of laminated rock and floor heave mechanism of tunnel based on DIC. Eng. Fail. Anal. 2024, 156, 107848. [Google Scholar] [CrossRef] [Scilit]
- Huang, L.; Chen, J.; Li, X.; Zhang, Z.; Zhang, P.; Zhang, C. Quantitative characterization of crack damage severity and geometric distribution in flawed rock masses under coupled biaxial compression and dynamic disturbance. Theor. Appl. Fract. Mech. 2026, 145, 105704. [Google Scholar] [CrossRef] [Scilit]
- Wang, Y.; Yi, X.; Long, D.; Li, P.; Cai, M. Macro-meso fracture and instability of rock-backfill composite structure (RBCS) specimens subjected to fatigue-creep interaction loading: Cement-tailing ratio effect. Constr. Build. Mater. 2024, 420, 135615. [Google Scholar] [CrossRef] [Scilit]
- Wang, K.; Gao, Y.; Zhou, Y.; Wang, H. Mechanical behaviors and failure mechanisms of rock-backfill-coal composite with pre-existing fissures under unilateral constraint loading. Mater. Today Commun. 2025, 46, 112821. [Google Scholar] [CrossRef] [Scilit]
- Xin, J.; Jiang, Q.; Gong, F.; Liu, L.; Liu, C.; Liu, Q.; Yang, Y.; Chen, P. Mechanical behaviors of backfill-rock composites: Physical shear test and back-analysis. J. Rock Mech. Geotech. Eng. 2024, 16, 807–827. [Google Scholar] [CrossRef] [Scilit]
- Guo, J.; Li, Z.; Wang, X.; Jiang, H.; Chen, S.; Zhang, J. Mechanical properties and damage evolution of rock–backfill composite under impact load. Green Smart Min. Eng. 2025, 2, 109–121. [Google Scholar] [CrossRef] [Scilit]
- Zhou, J.; Yao, N.; Ye, Y.; Oppong, F.; Liu, Y. Numerical simulation study on the effect of delamination degree of waste rock cemented backfill on its uniaxial compression mechanical behavior. Results Eng. 2026, 29, 109814. [Google Scholar] [CrossRef] [Scilit]
- Hu, J.; Jiang, X.; Li, J.; Yu, Z.; Huang, W.; You, C.; Huang, M. Effect of backfill strength and interface angle on crack evolution and damage law of backfill rock composite under uniaxial compression. Results Eng. 2025, 28, 108197. [Google Scholar] [CrossRef] [Scilit]
- Zhao, Y.; Li, M.; Qiu, X.; Tan, L.; Xing, S.; Li, J. Mechanical response properties and acoustic emission characteristics of rock-backfilling composites under uniaxial compression. Eng. Fail. Anal. 2026, 185, 110394. [Google Scholar] [CrossRef] [Scilit]
- Wang, X.; Li, Z.; Guo, J.; Lu, C.; Jiang, H.; Mei, J. Experimental and numerical investigations on damage mechanical behaviors of surrounding rock-backfill composite under uniaxial compression. Constr. Build. Mater. 2024, 417, 135210. [Google Scholar] [CrossRef] [Scilit]
- Wang, J.; Fu, J.; Song, W.; Zhang, Y. Mechanical properties, damage evolution, and constitutive model of rock-encased backfill under uniaxial compression. Constr. Build. Mater. 2021, 285, 122898. [Google Scholar] [CrossRef] [Scilit]
- Wang, Y.; Lu, H.; Wu, J. Experimental investigation on strength and failure characteristics of cemented paste backfill-rock composite under uniaxial compression. Constr. Build. Mater. 2021, 304, 124629. [Google Scholar] [CrossRef] [Scilit]
- Li, Z.; Wu, A.; Wang, S.; Wang, J. Numerical investigation on dynamic mechanical response of rock–backfill composites: Effect of interface angle and loading condition. Eng. Fract. Mech. 2026, 335, 111901. [Google Scholar] [CrossRef] [Scilit]
- Yu, X.; Tan, Y.; Qi, S.; Song, W.; Kemeny, J.; Zheng, B.; Guo, S. Damage index correlation in massive granite-porous backfills under hydromechanical triaxial cyclic loading using acoustic emissions and X-ray computed tomography. J. Mater. Res. Technol. 2024, 33, 3659–3671. [Google Scholar] [CrossRef] [Scilit]
- Ji, P.X.; Viegas, G.; Zhang, Q.B. Mechanical and fracturing characteristics of defected rock-like materials under biaxial compression. Int. J. Rock Mech. Min. Sci. 2024, 176, 105692. [Google Scholar] [CrossRef] [Scilit]
- Kou, Y.; Jiang, Z.; Li, J.; Song, W.; Tang, B.; Li, X.; Luan, L. Study on the mechanical properties and macro–micro scale damage characteristics of rock-like-backfill composite structure under true triaxial loading. Eng. Fail. Anal. 2026, 193, 110907. [Google Scholar] [CrossRef] [Scilit]
- Li, J.; Cao, S.; Song, W. Flexural behavior of cementitious backfill composites reinforced by various 3D printed polymeric lattices. Compos. Struct. 2023, 323, 117489. [Google Scholar] [CrossRef] [Scilit]
- Li, J.; Cao, S.; Yilmaz, E.; Liu, Y. Compressive fatigue behavior and failure evolution of additive fiber-reinforced cemented tailings composites. Int. J. Min. Metall. Mater. 2022, 29, 345–355. [Google Scholar] [CrossRef] [Scilit]
- Li, Q.; Li, J.; Kou, Y.; Song, W. Experimental Study on the True Triaxial Unloading Mechanical Properties of Cement Tailings Backfill Under Different Intermediate Principal Stresses. Minerals 2025, 15, 1227. [Google Scholar] [CrossRef] [Scilit]
- Wang, Y.; Chen, Z.; Xia, Y.; Li, P.; Cai, M. The Effect of Cyclic Disturbed Frequency on Mechanical, Acoustic Emission and Crack Pattern for Rock–Backfill Composites Exposed to Fatigue Loading Condition. Rock Mech. Rock Eng. 2025, 58, 7041–7066. [Google Scholar] [CrossRef] [Scilit]
- Lu, H.; Wang, Y.; Gan, D.; Wu, J.; Wu, X. Numerical investigation of the mechanical behavior of the backfill—Rock composite structure under triaxial compression. Int. J. Min. Metall. Mater. 2023, 30, 802–812. [Google Scholar] [CrossRef] [Scilit]
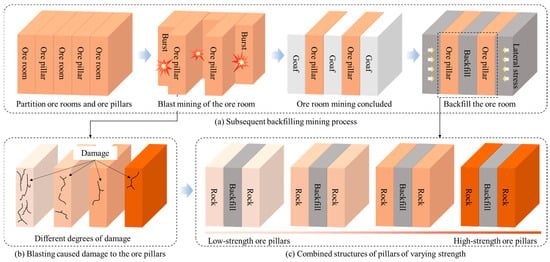
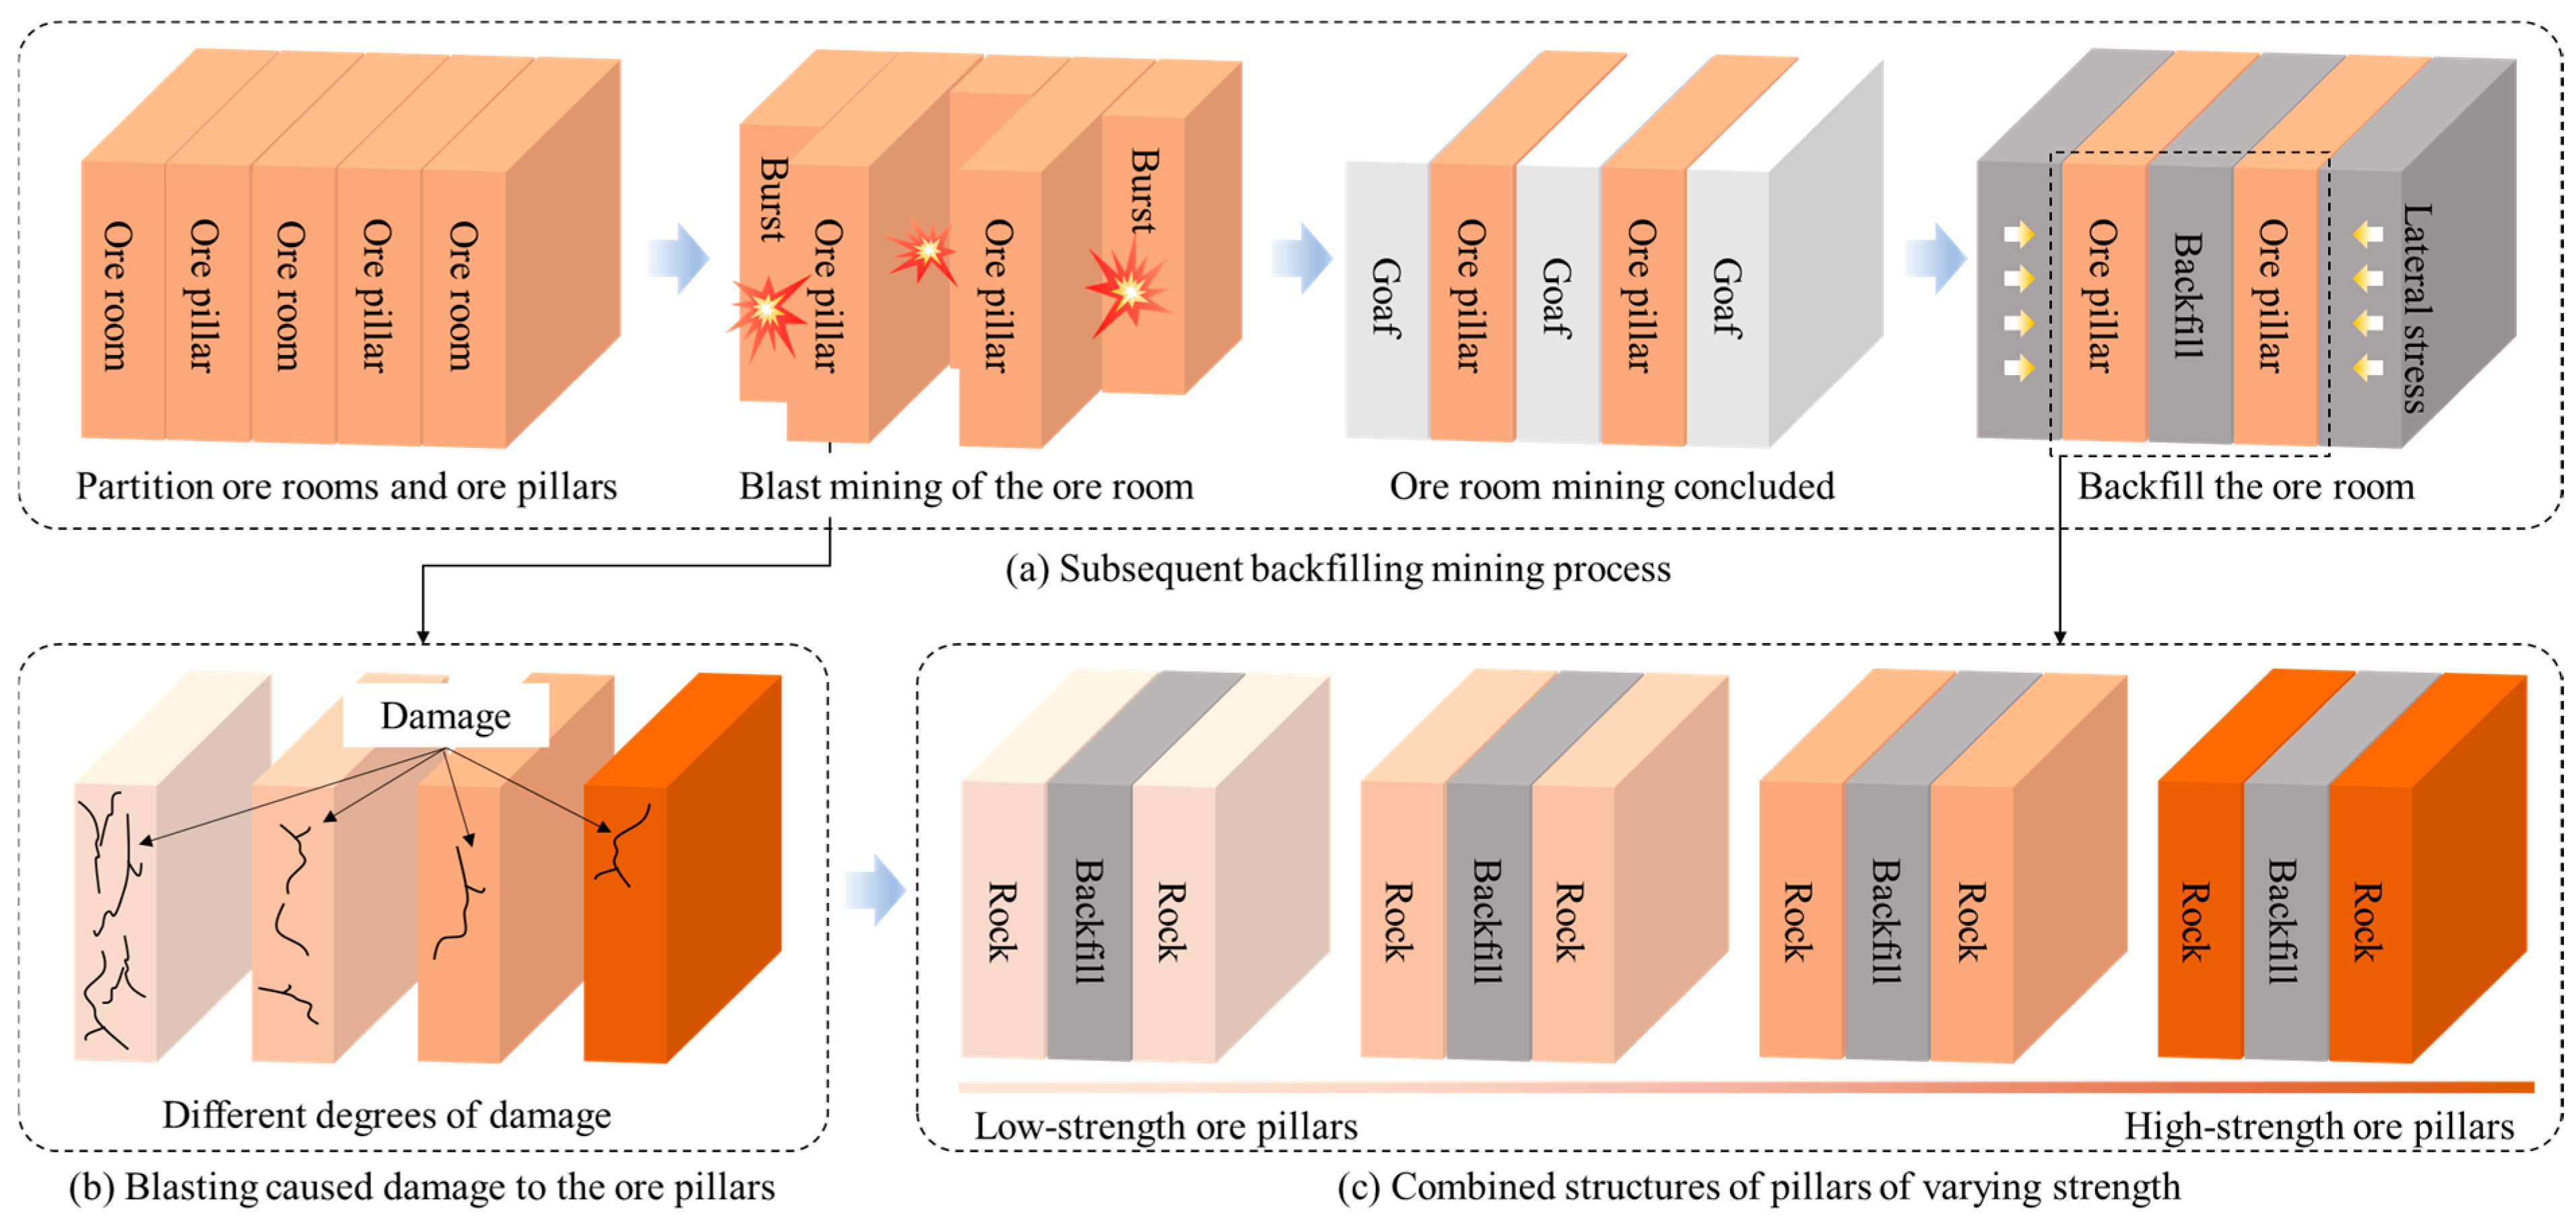
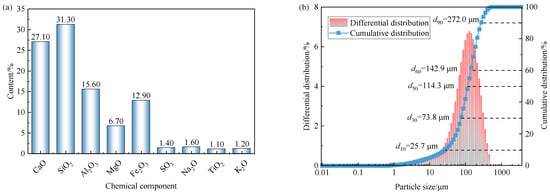
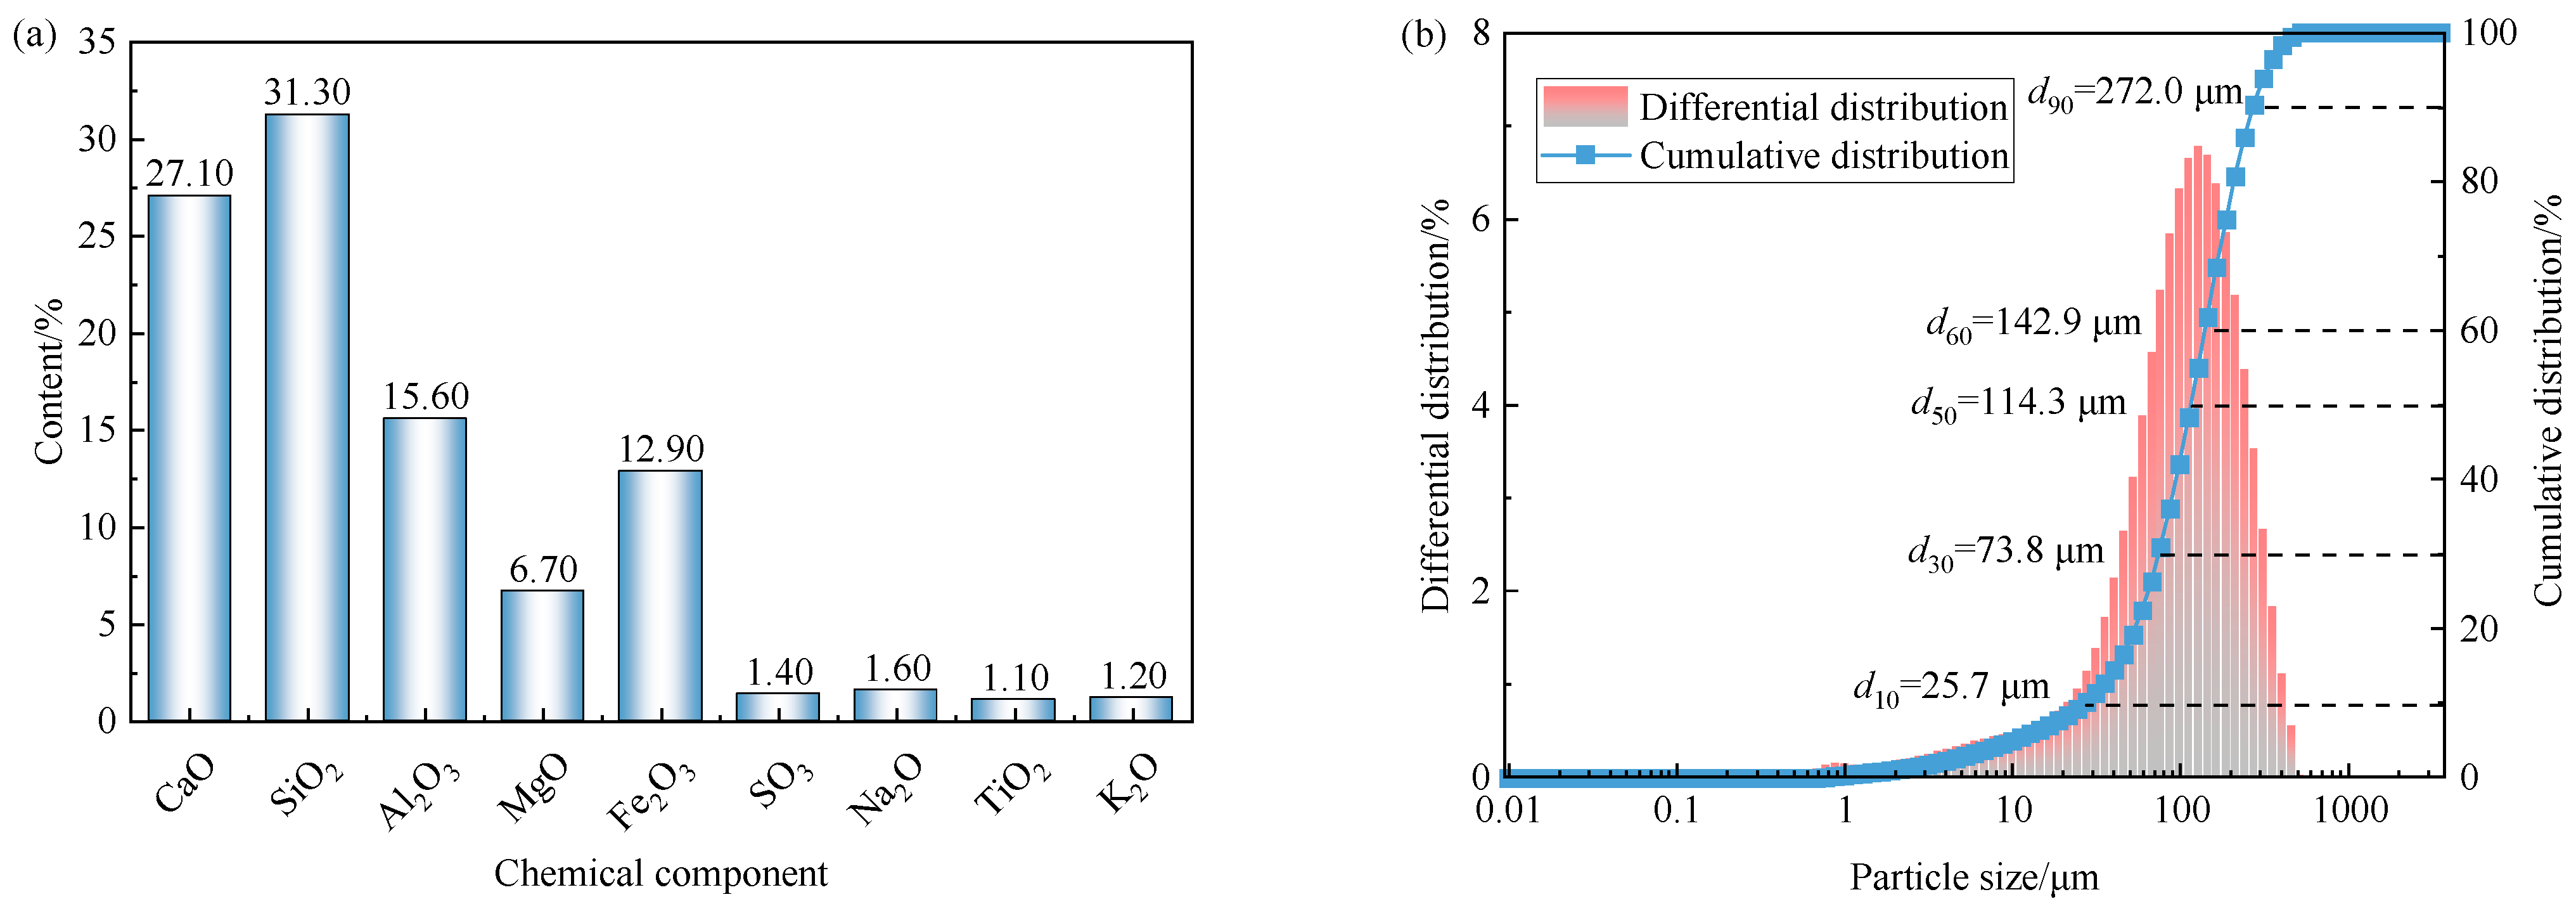
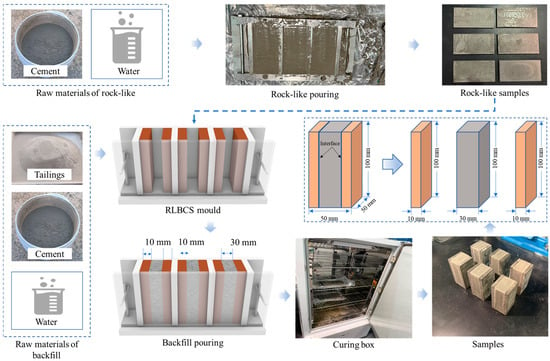
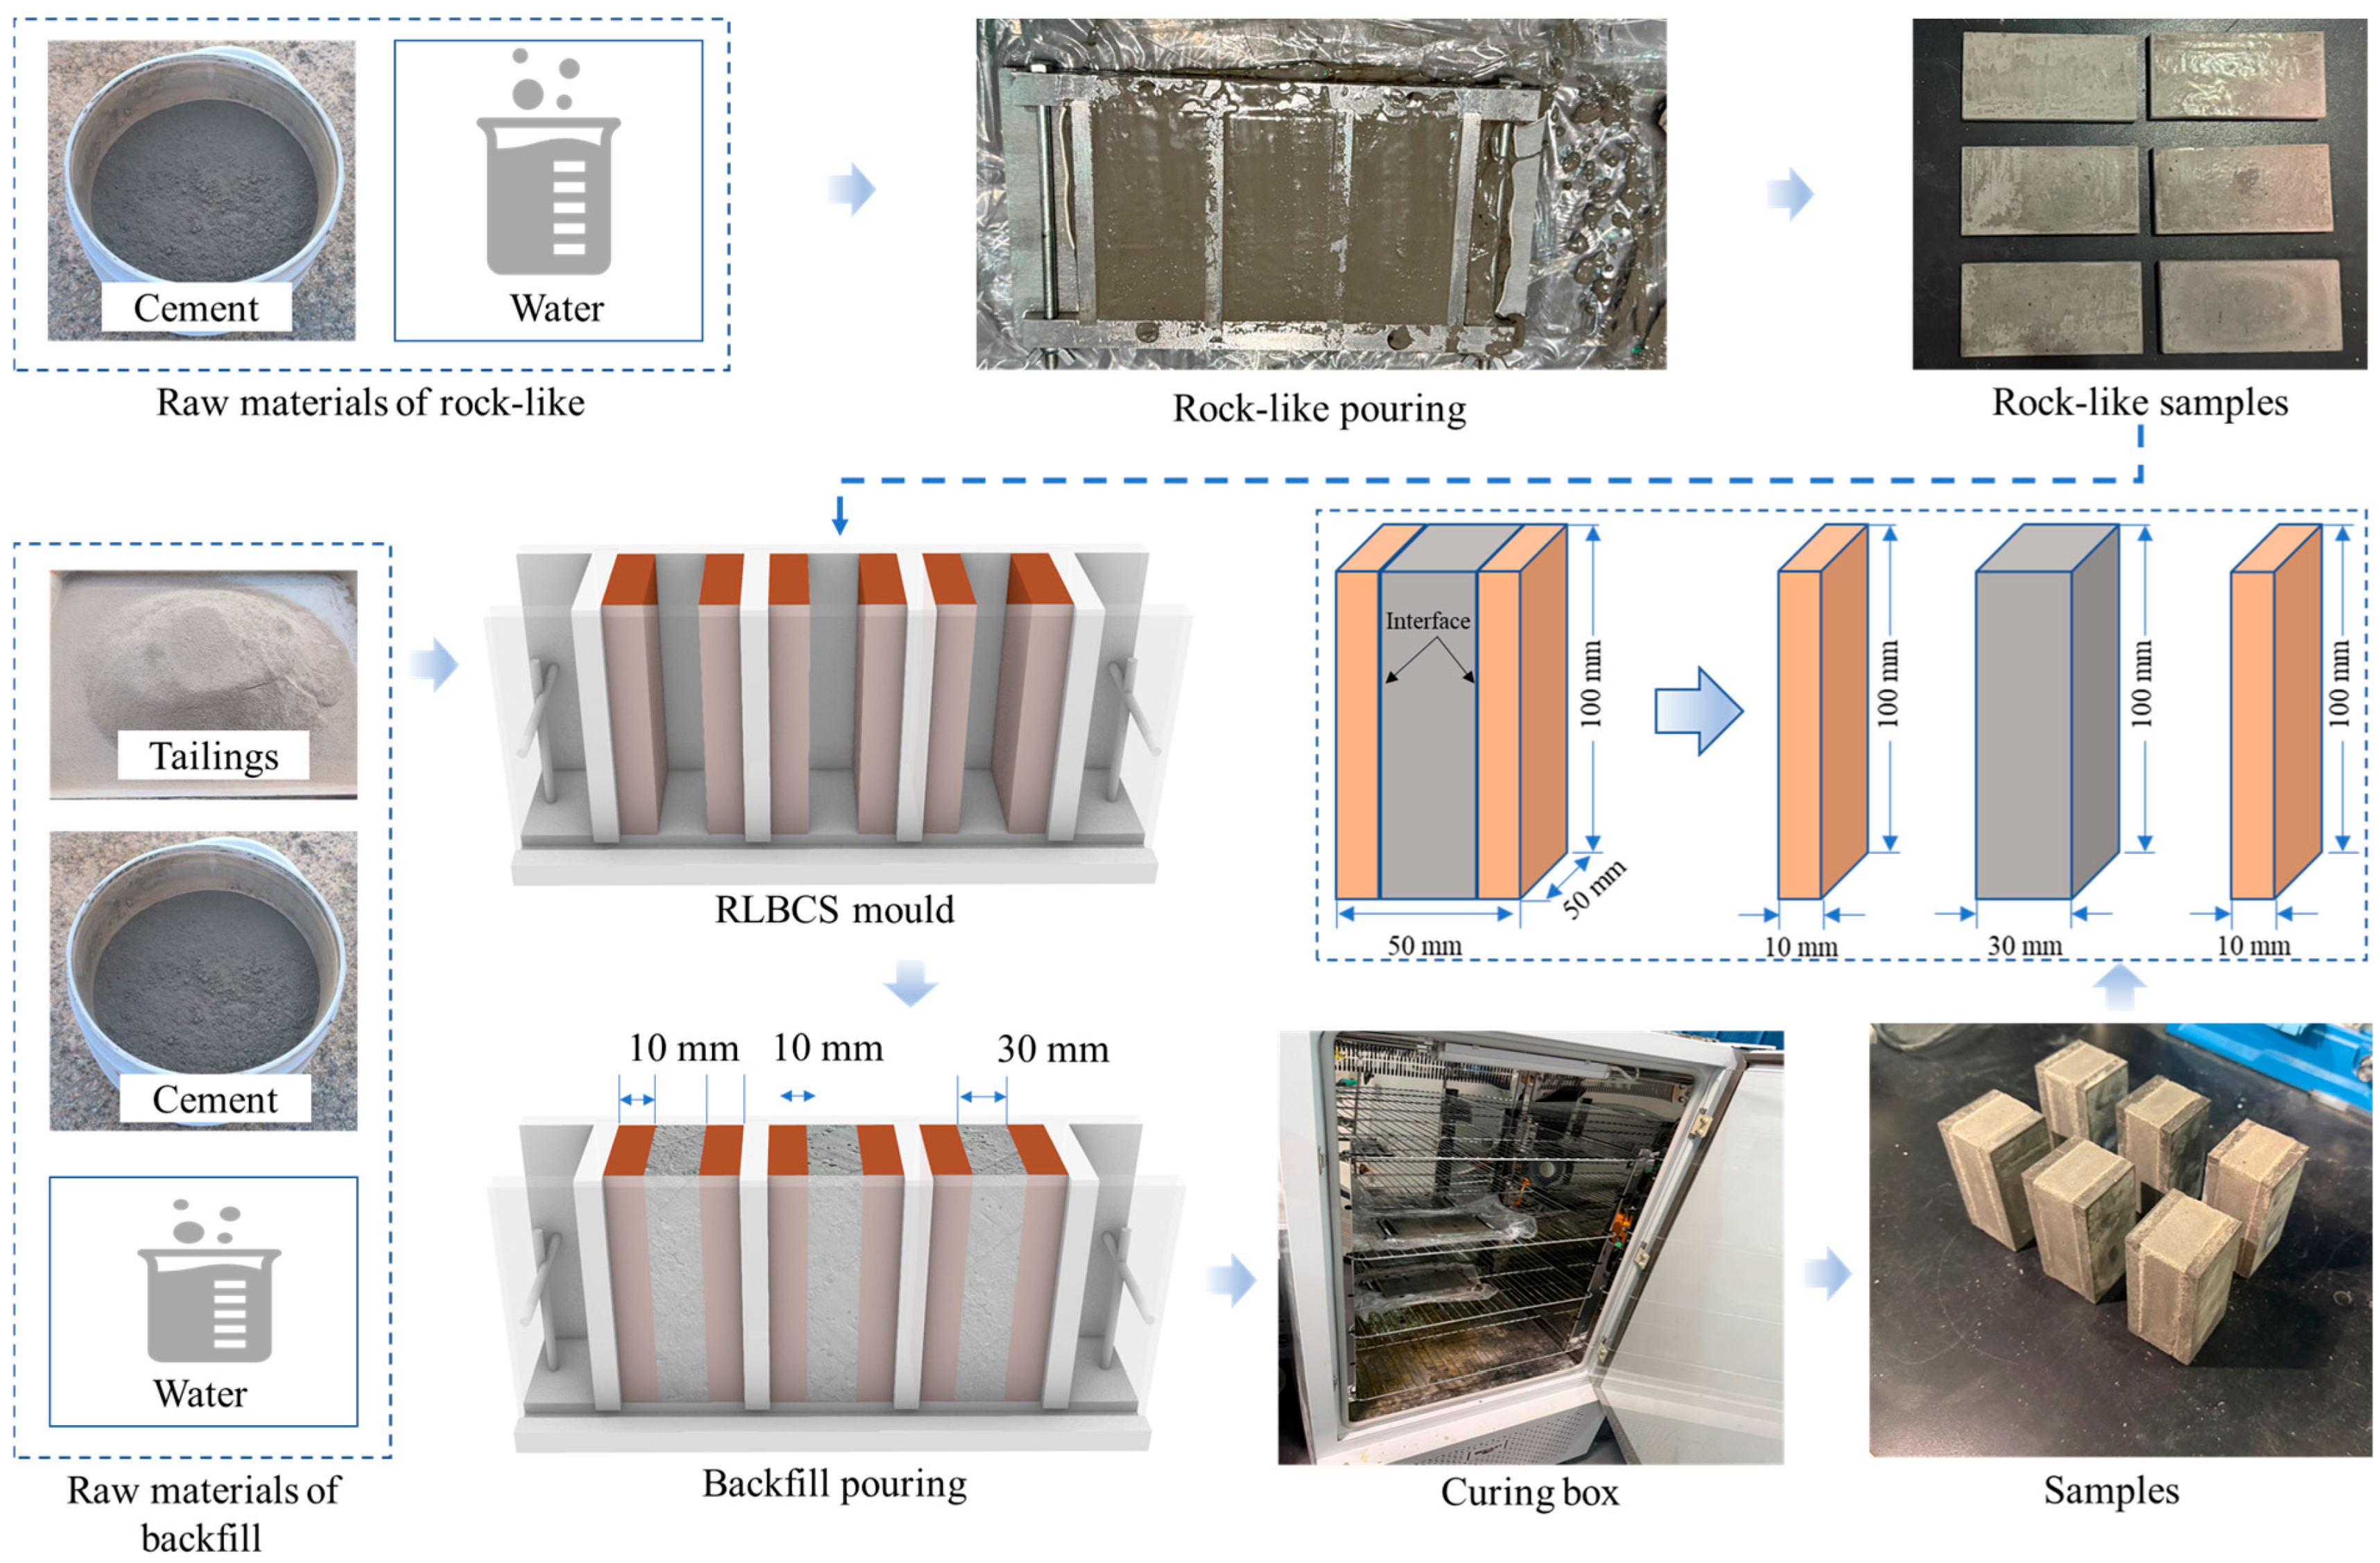
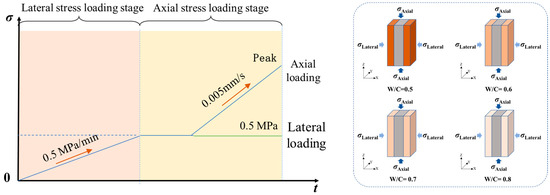
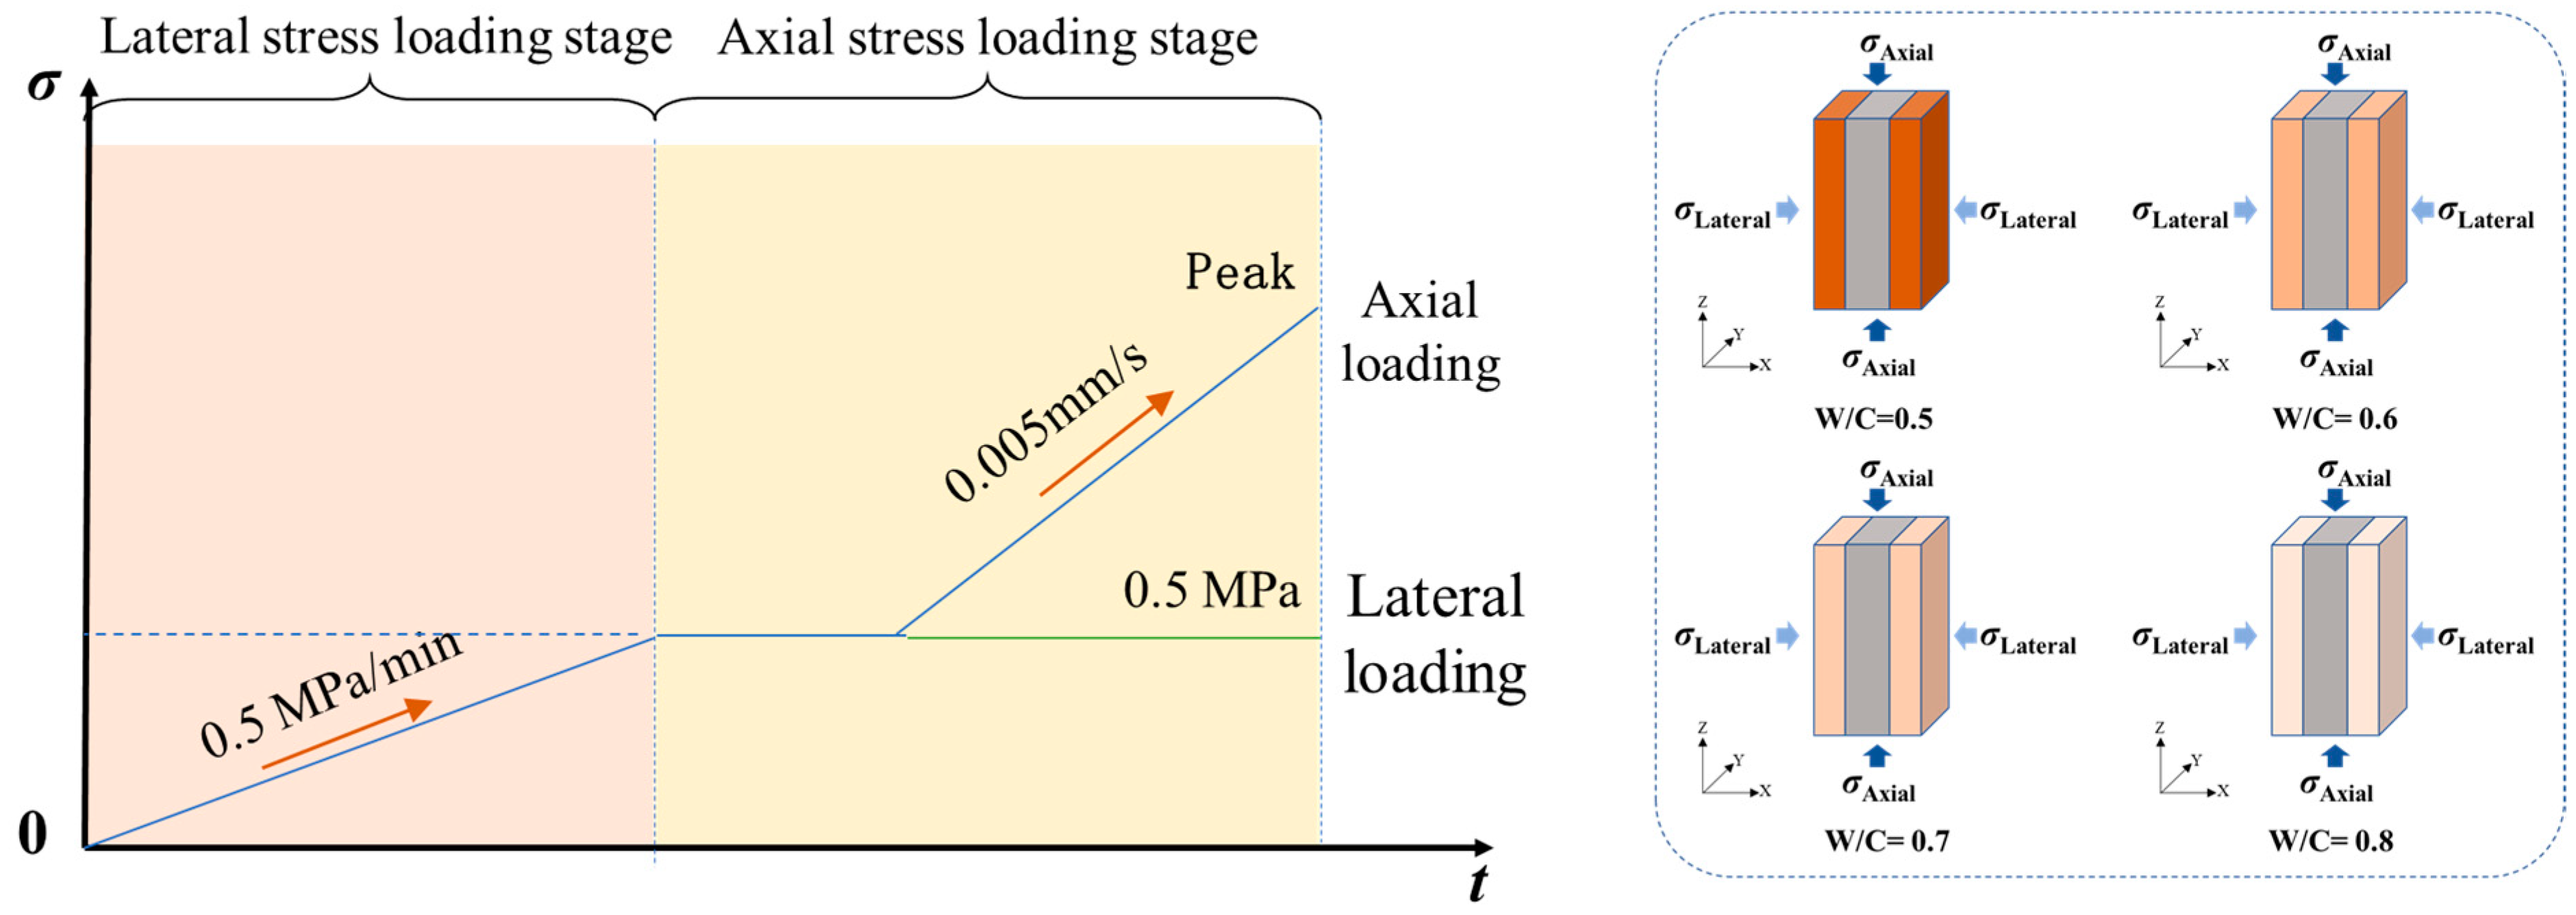
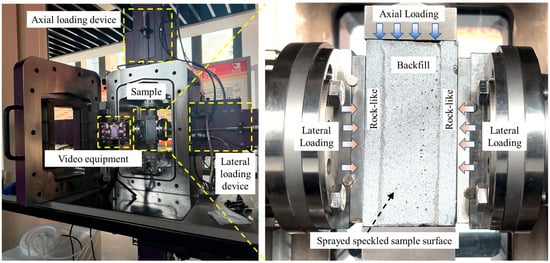
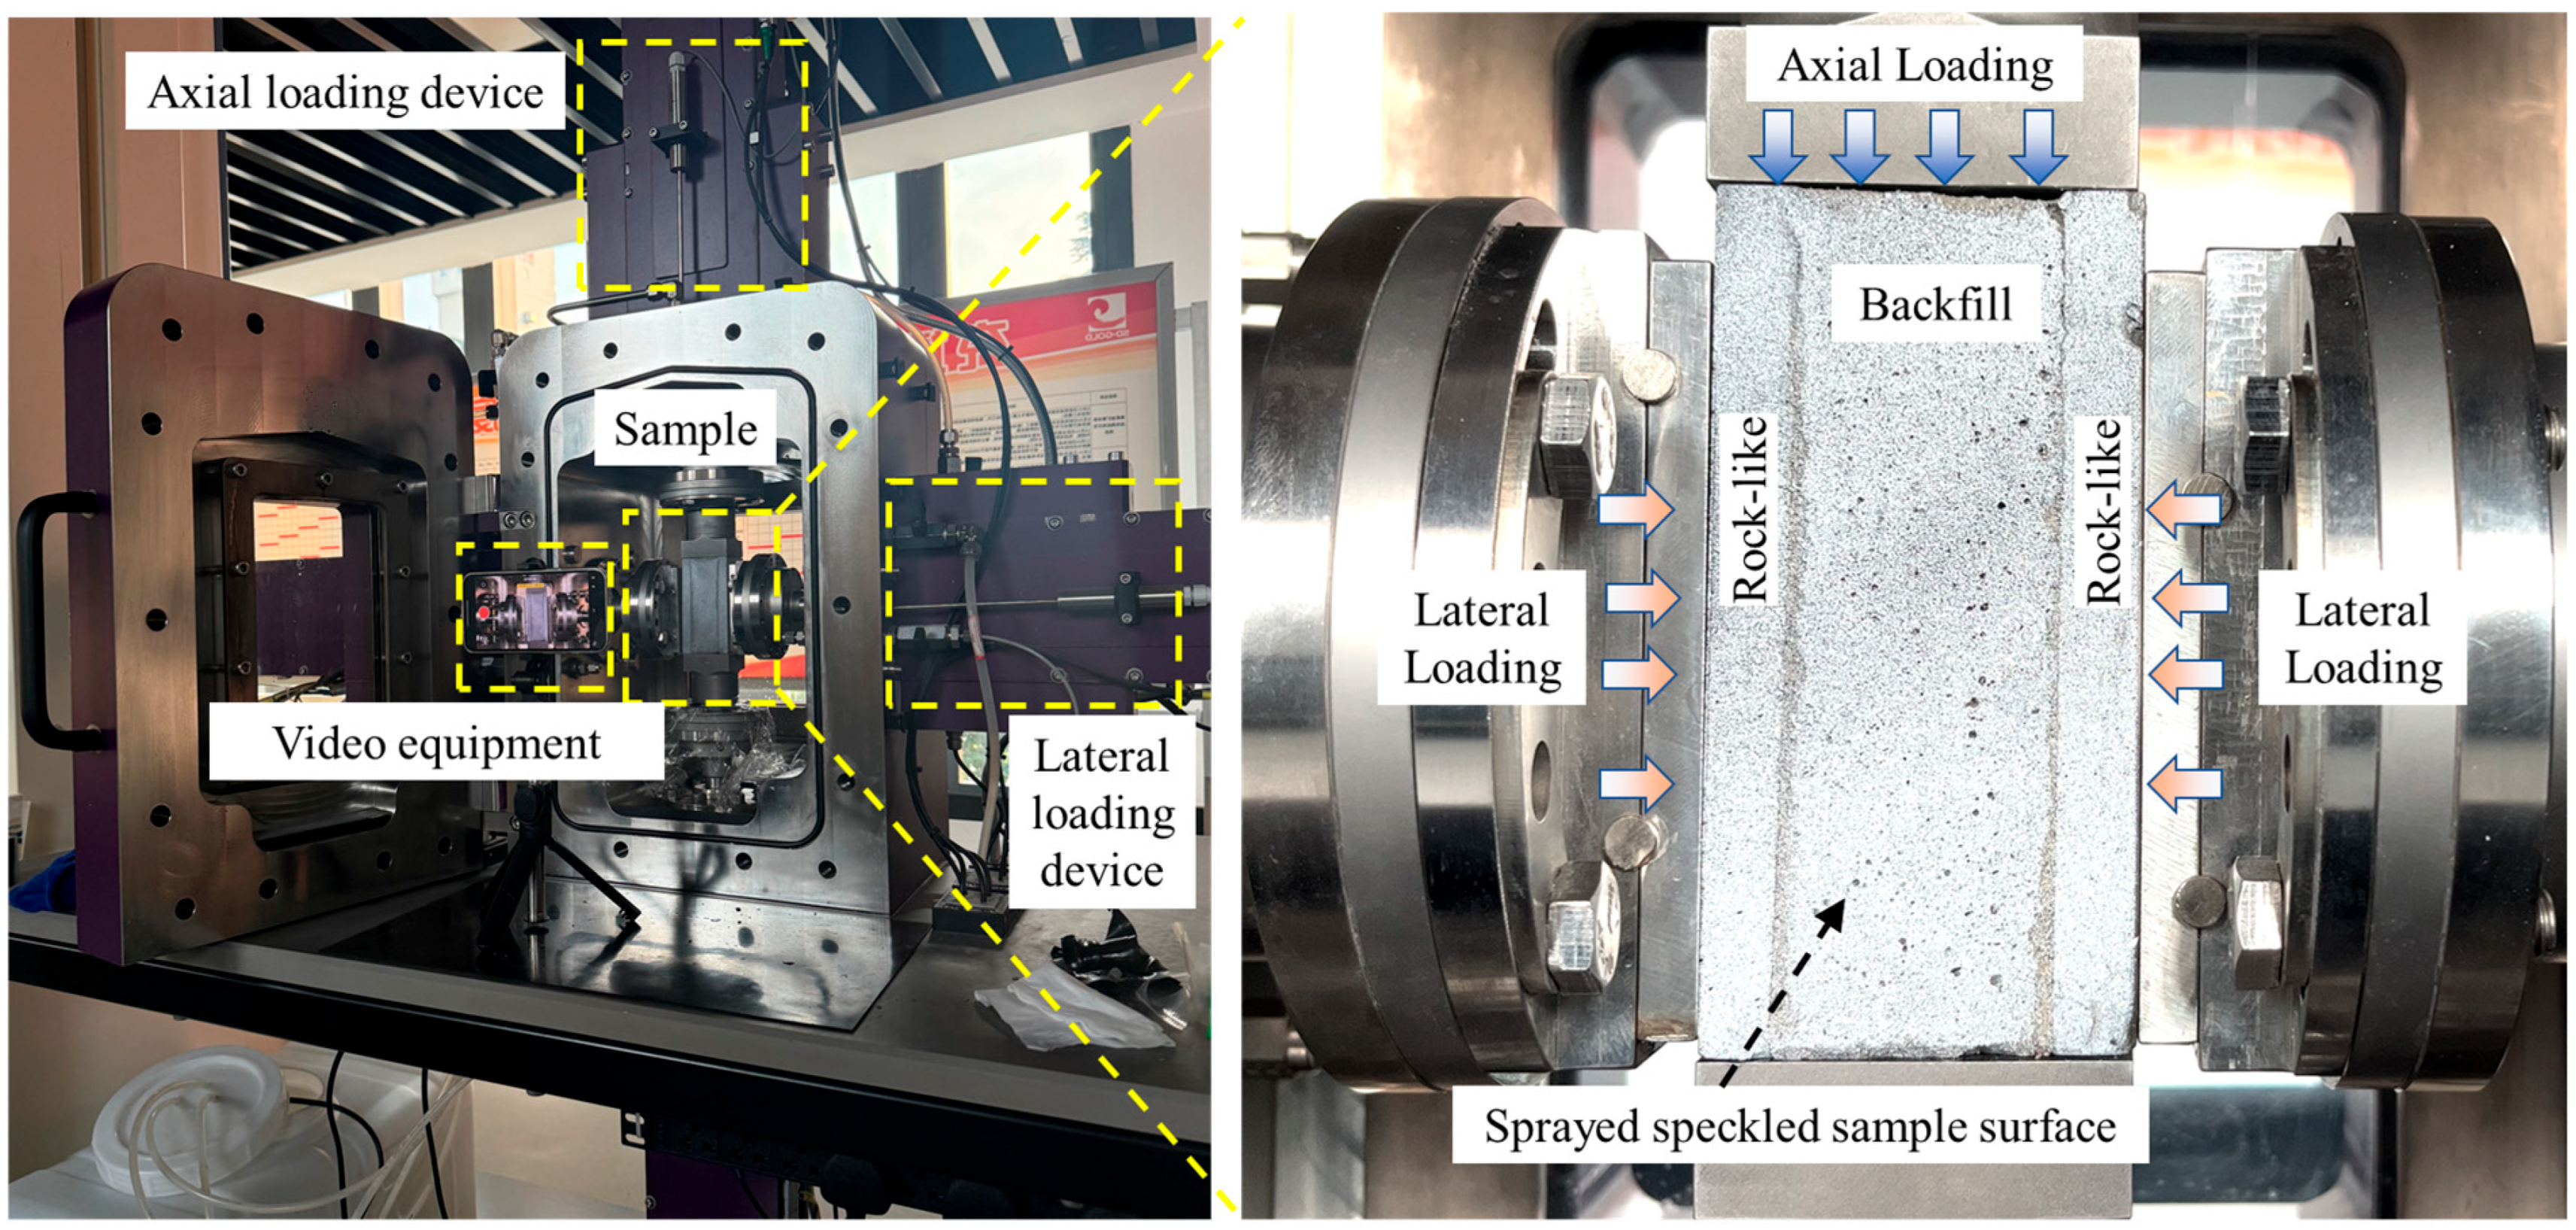
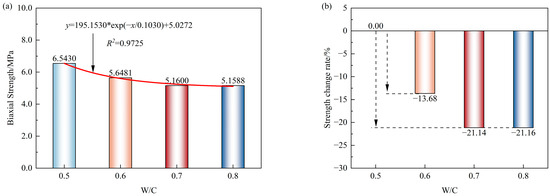
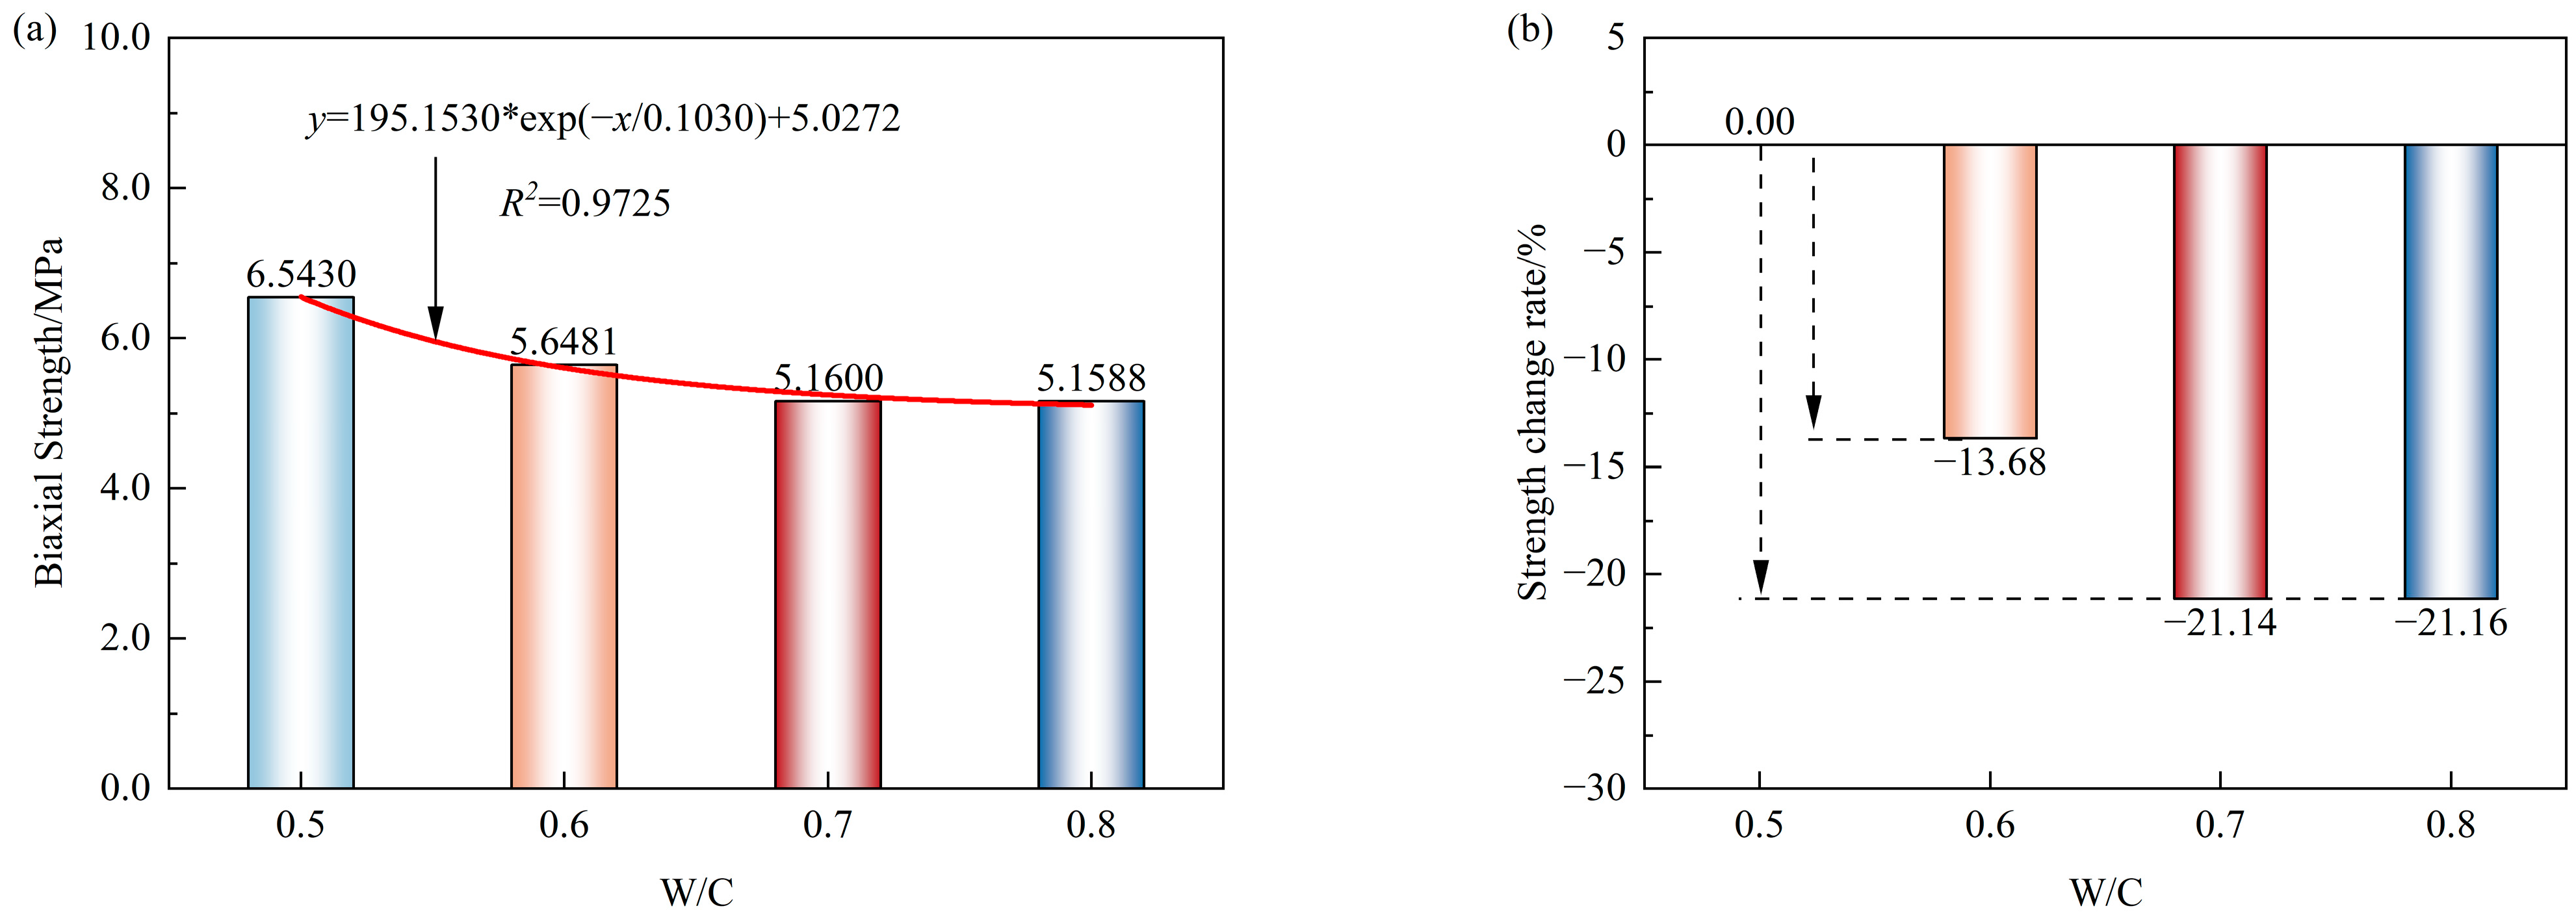
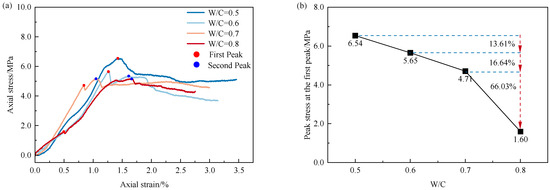
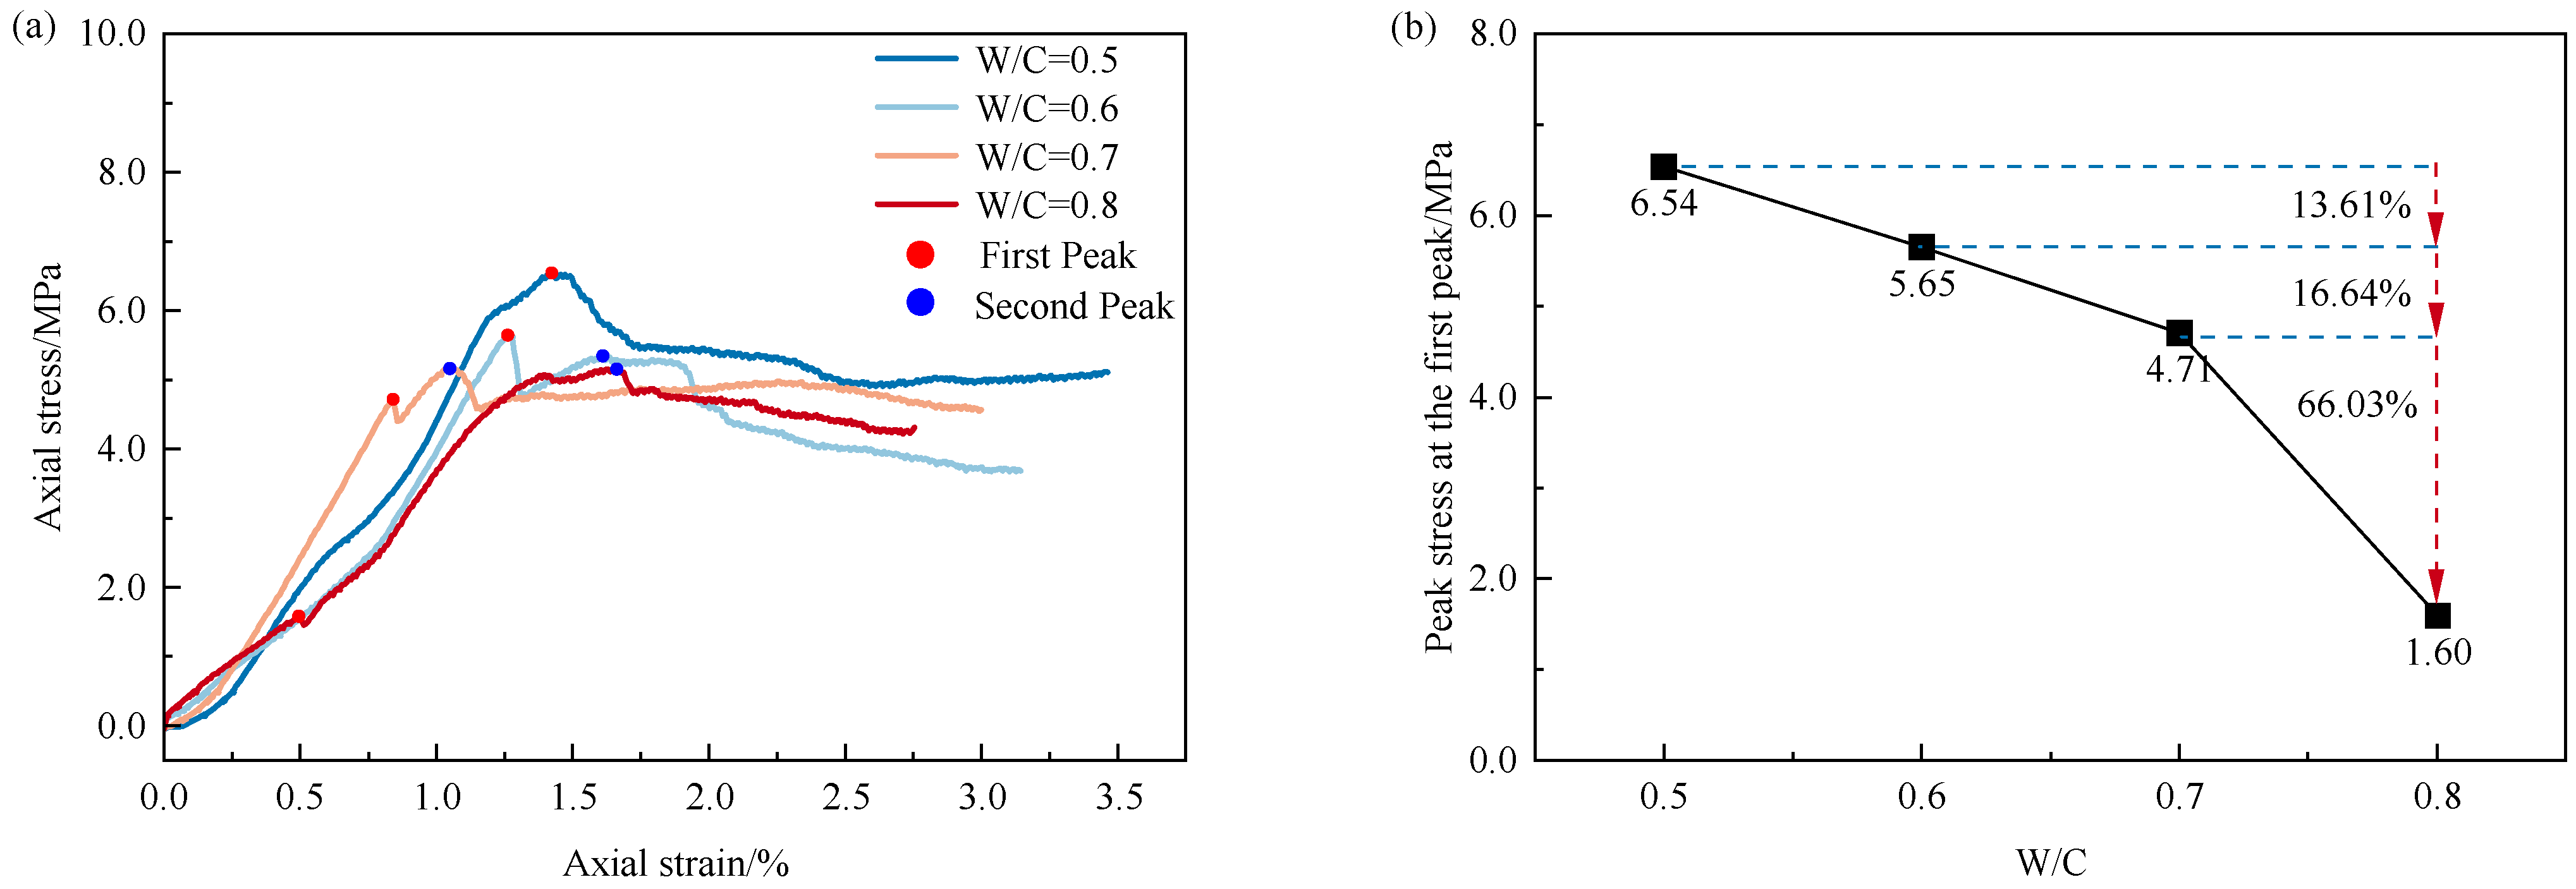
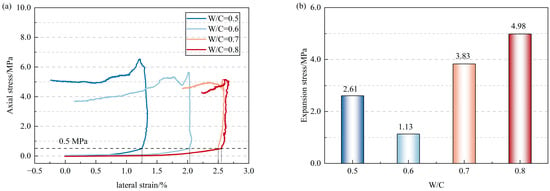
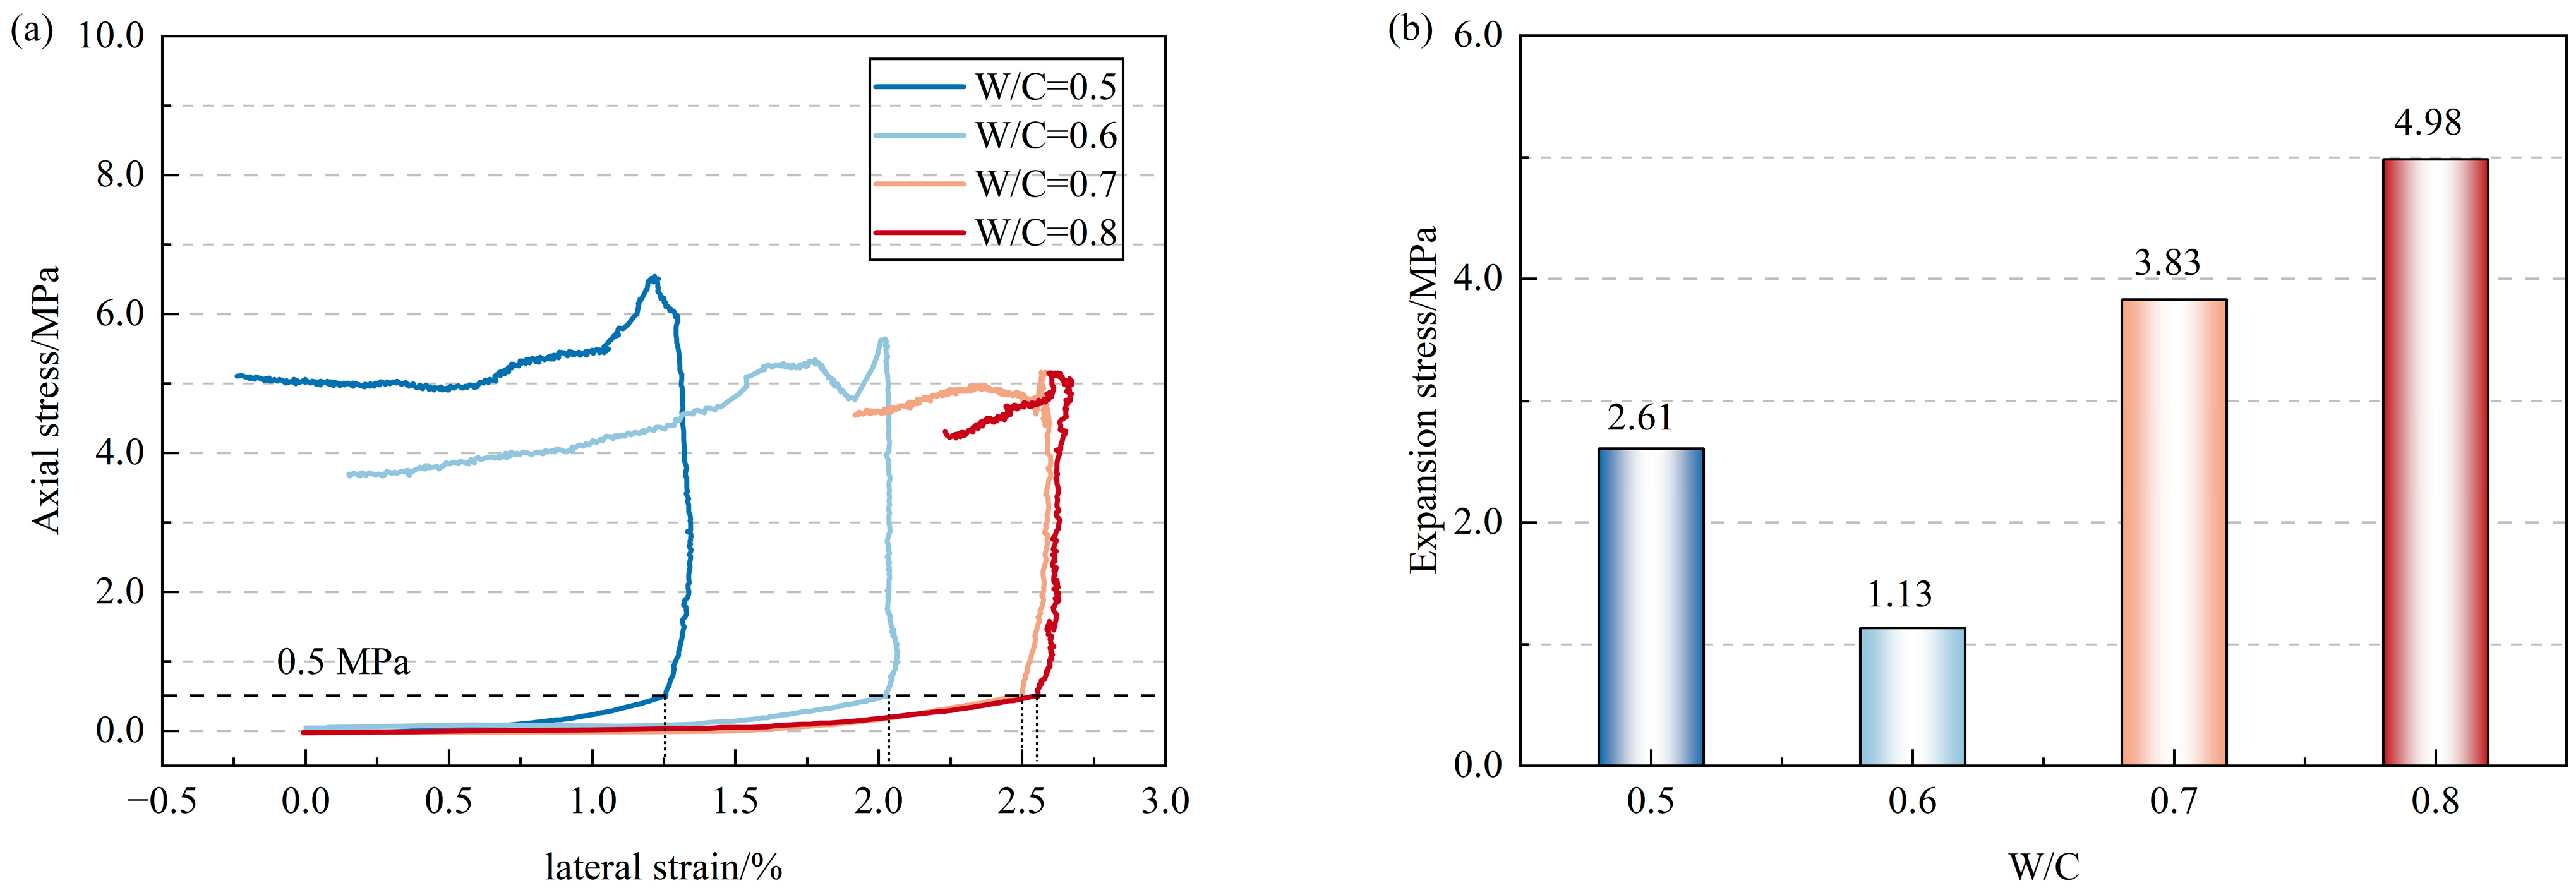
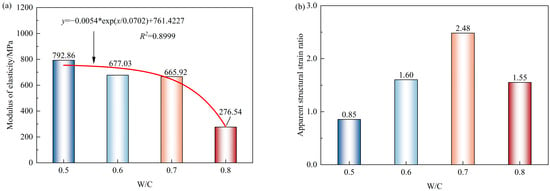
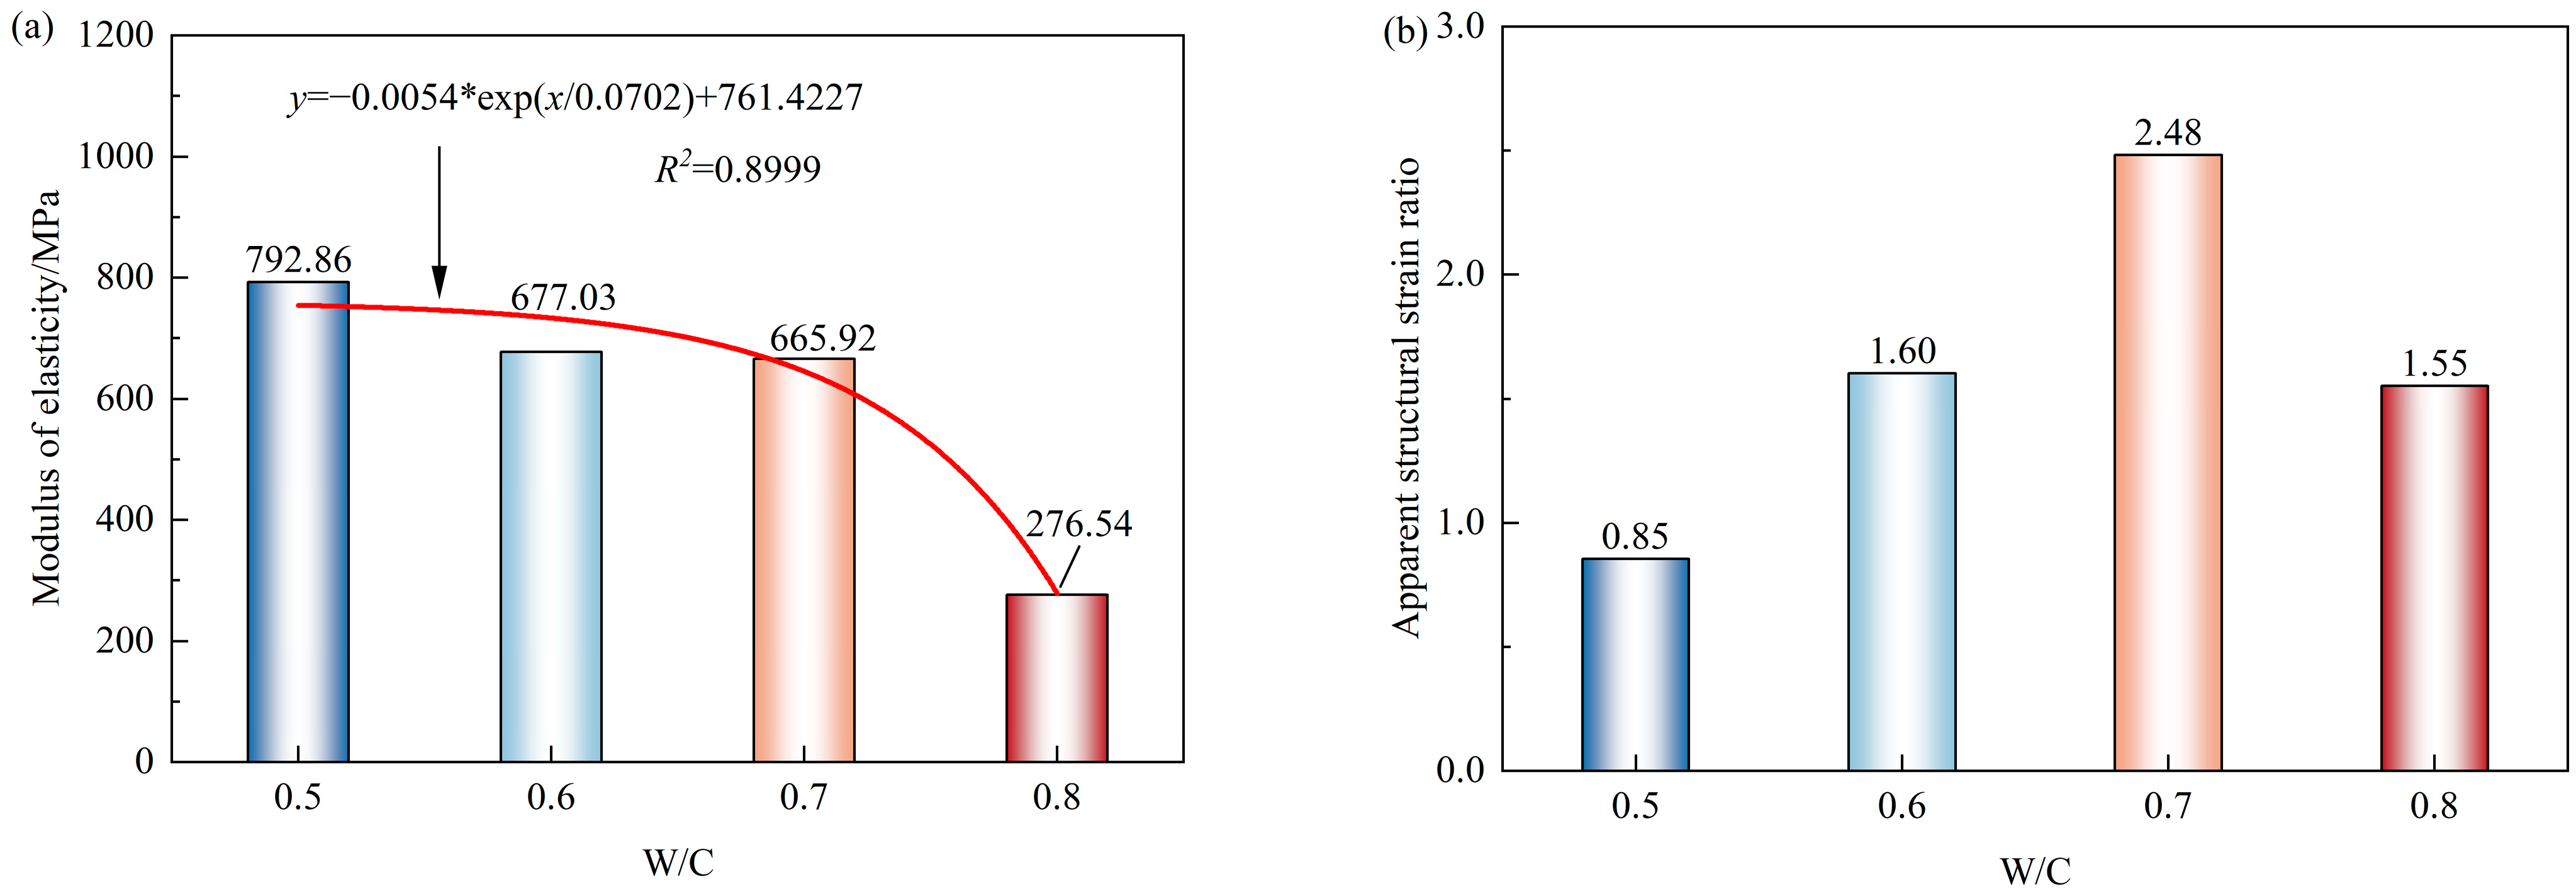
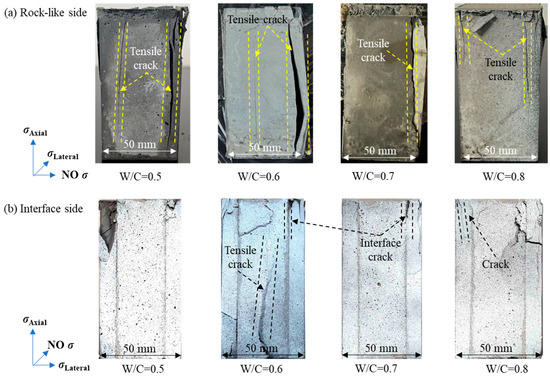
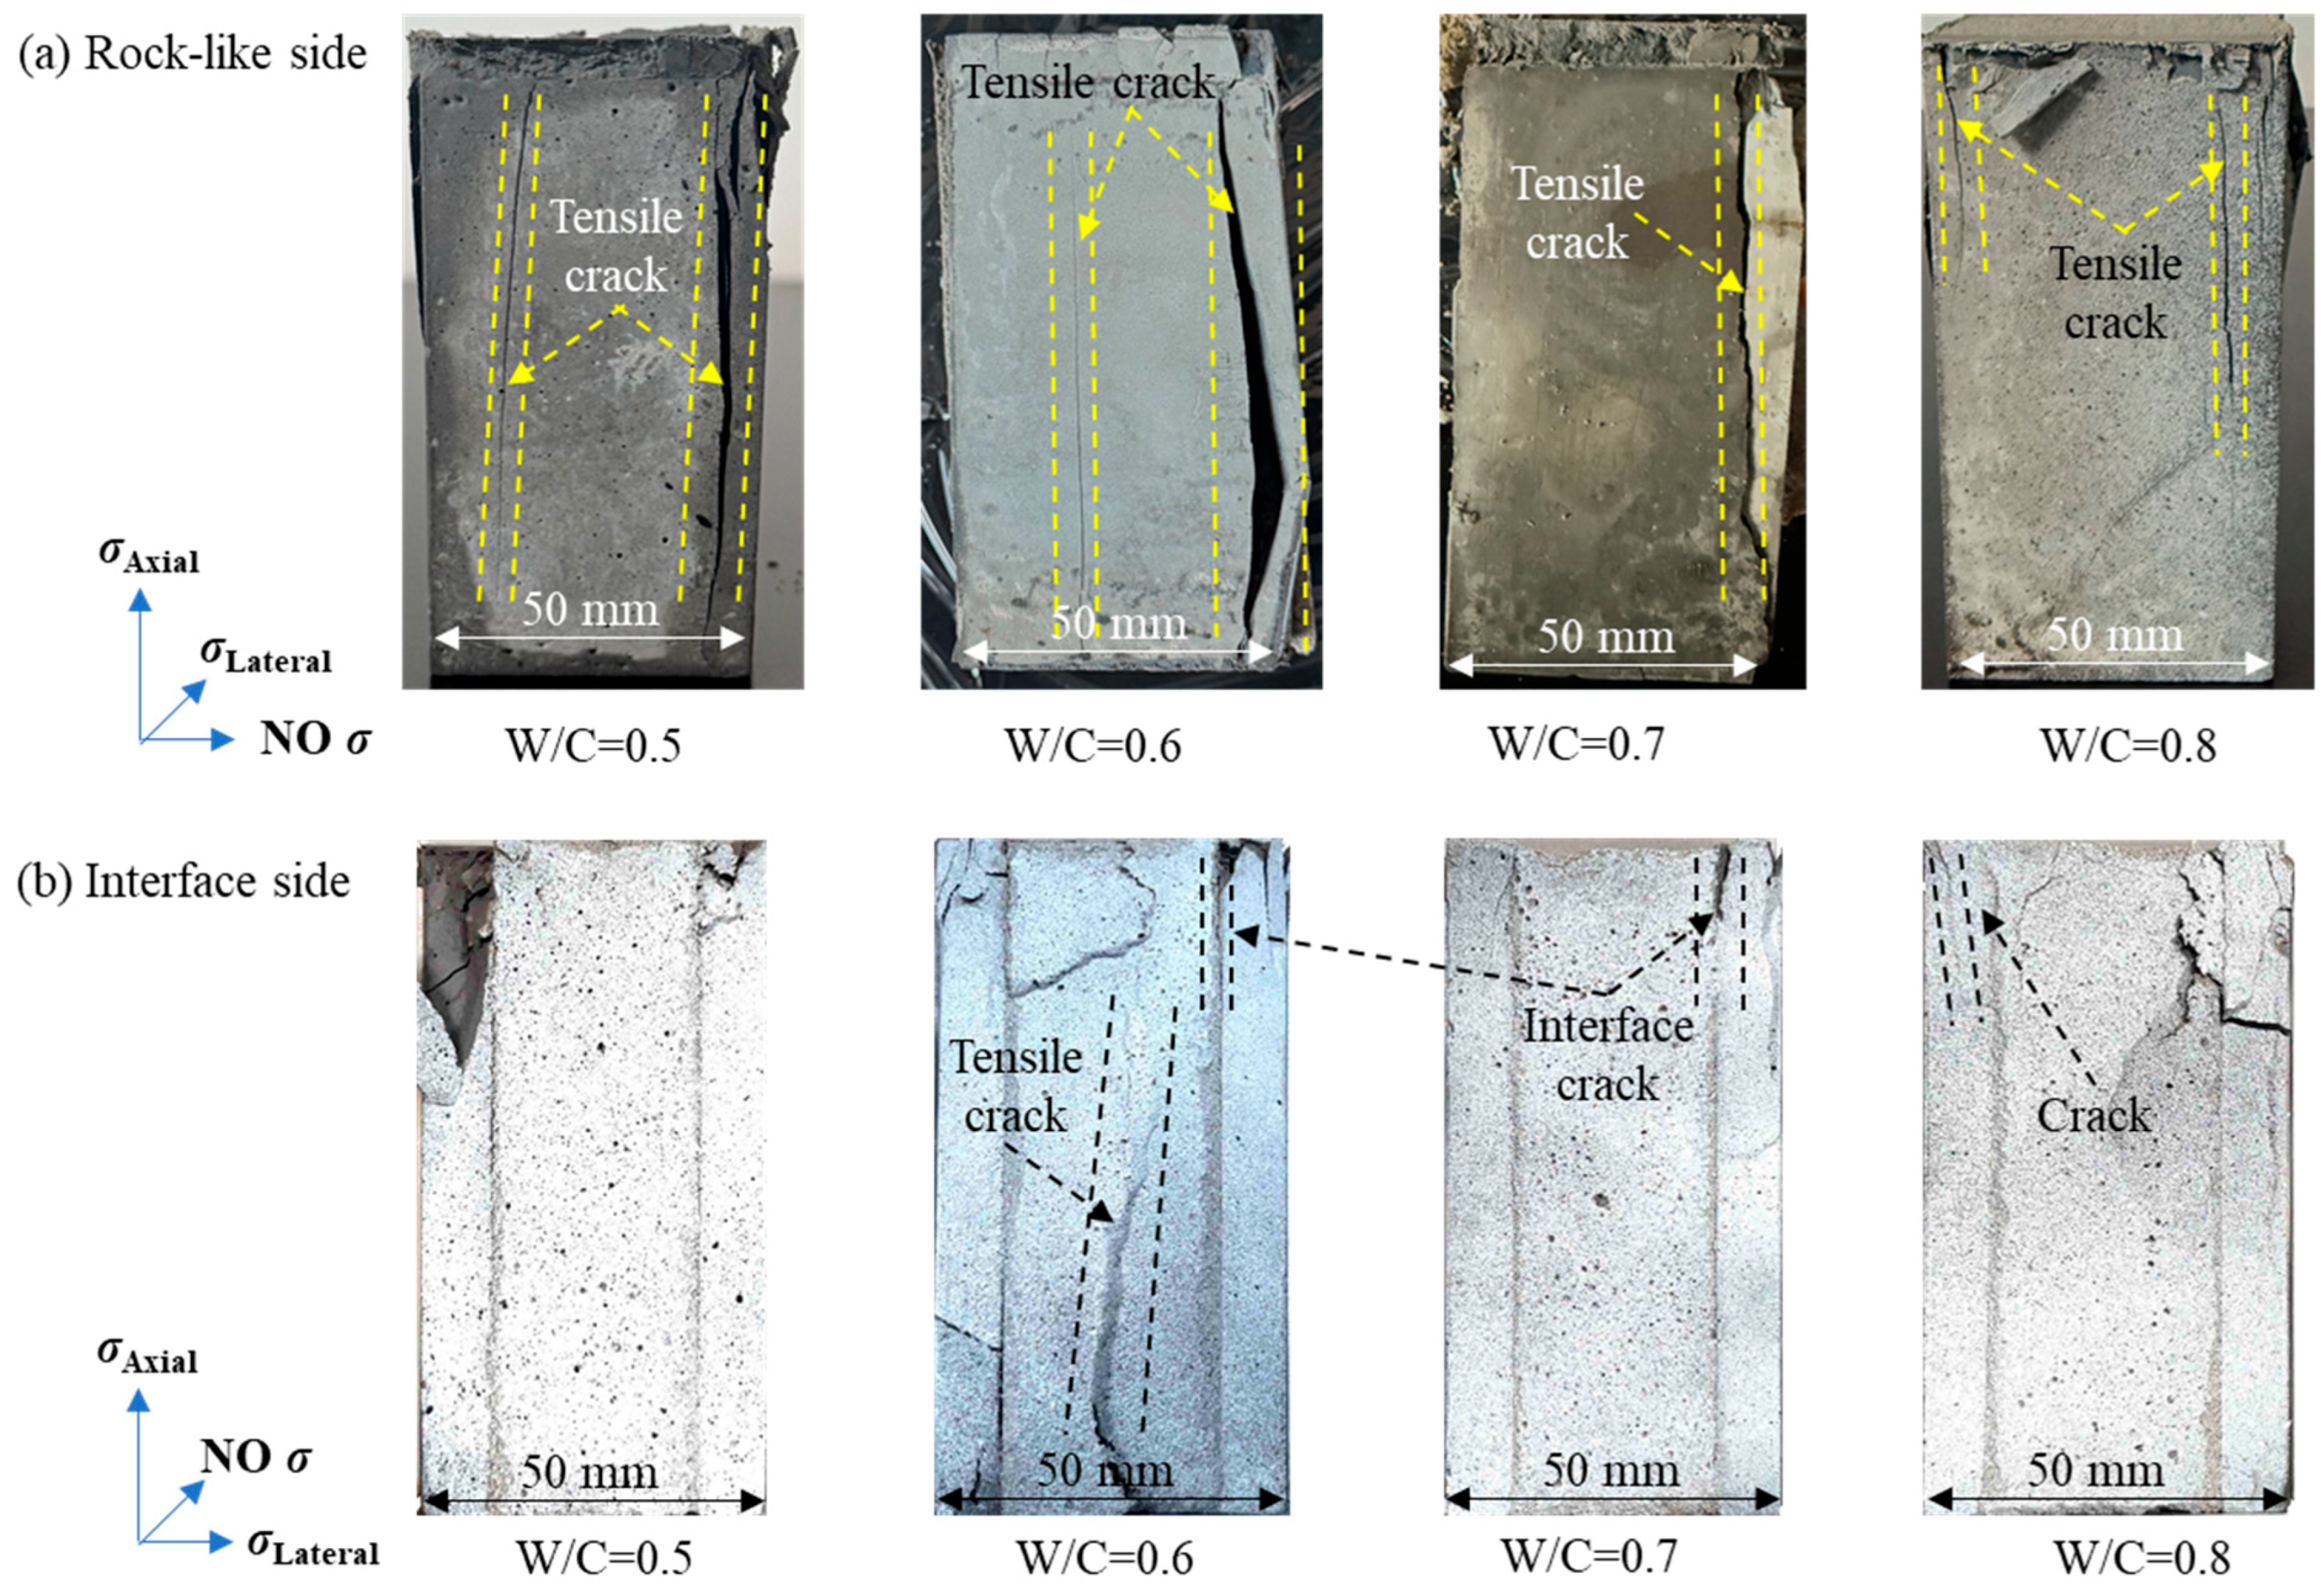
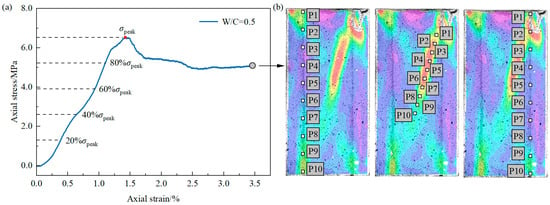
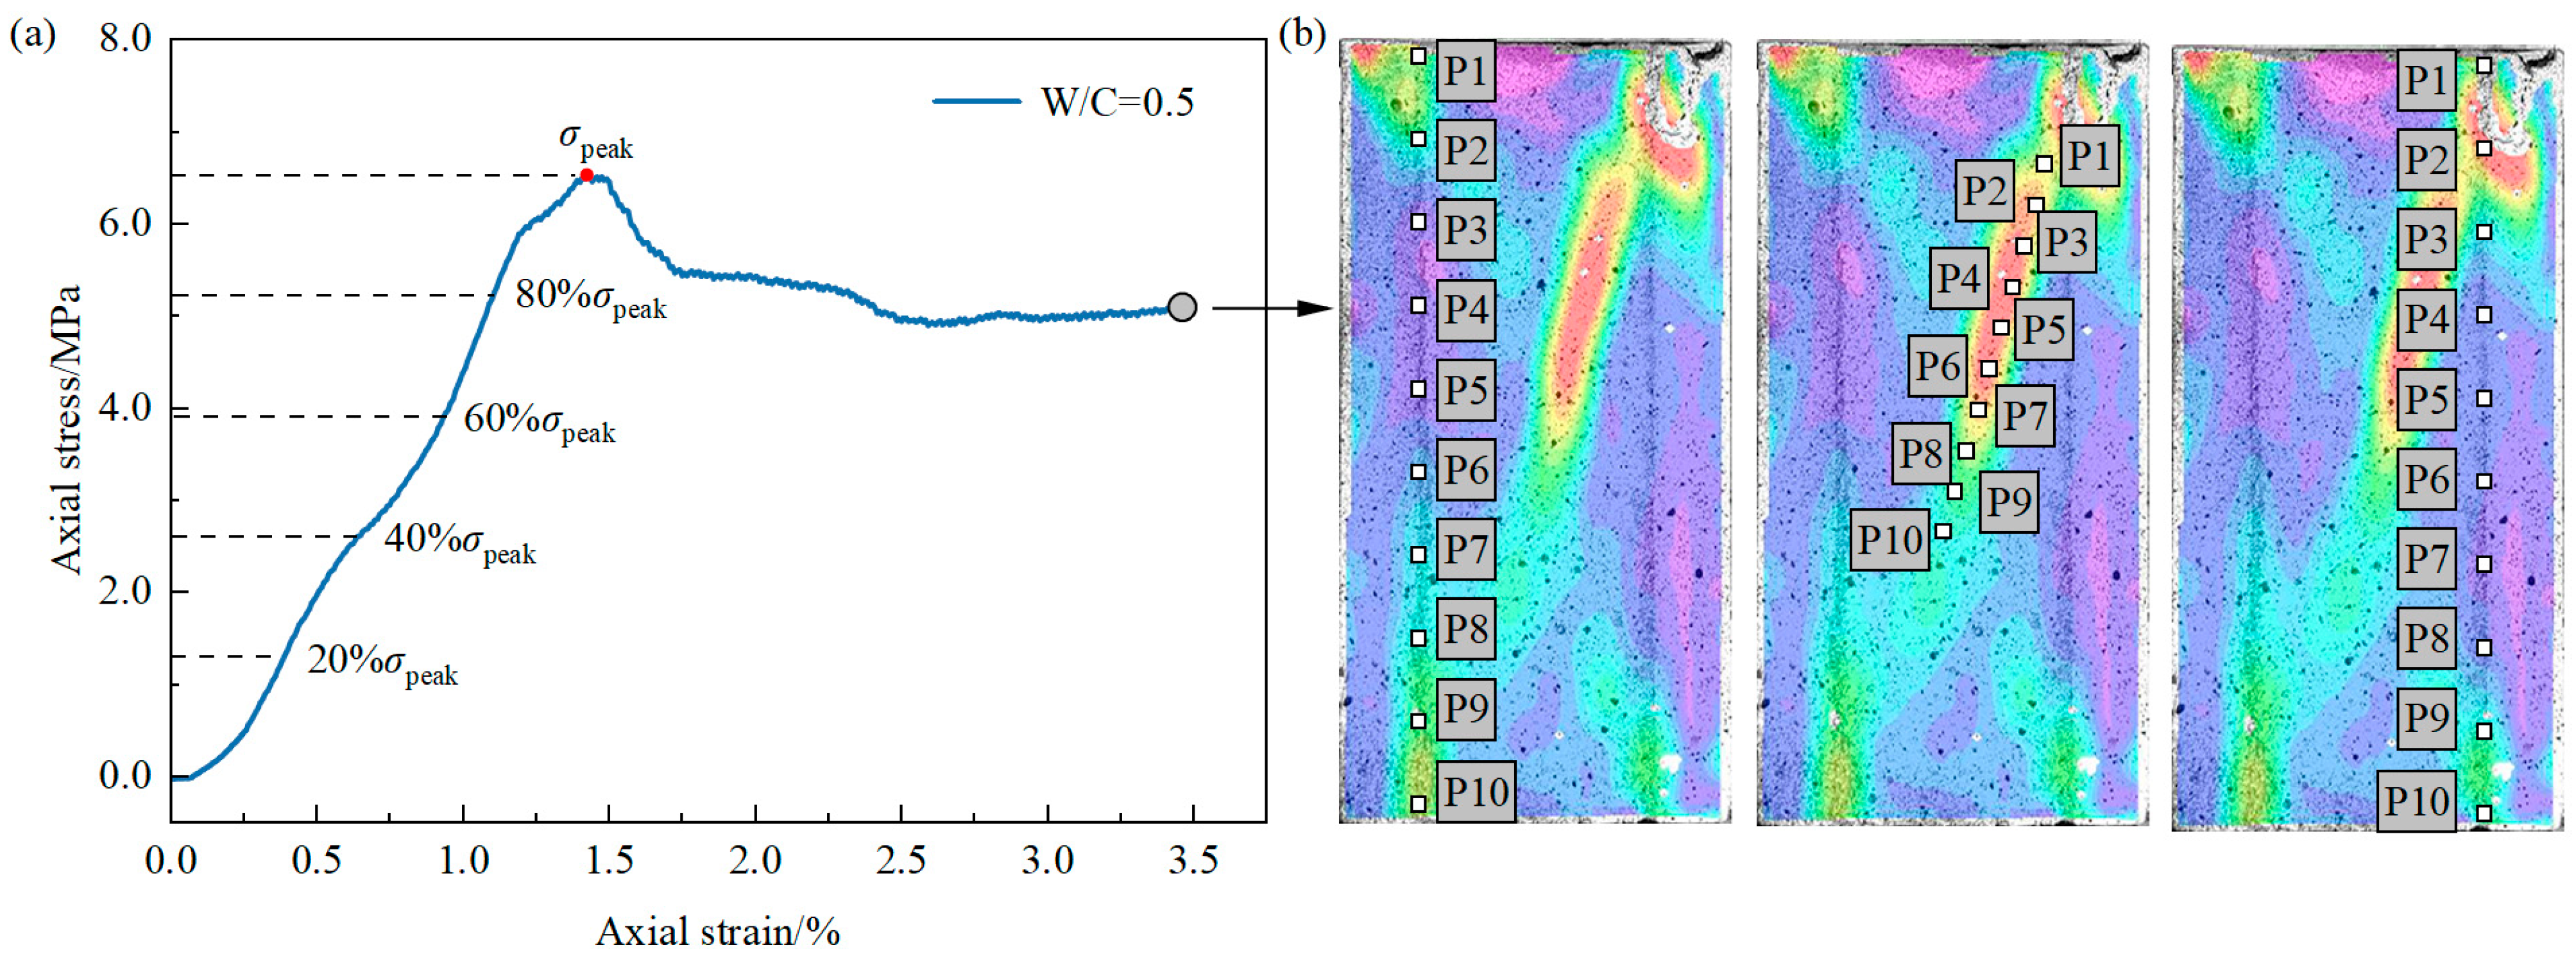
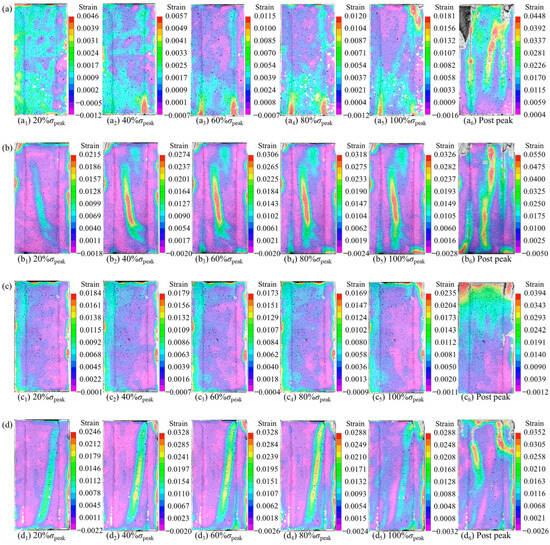
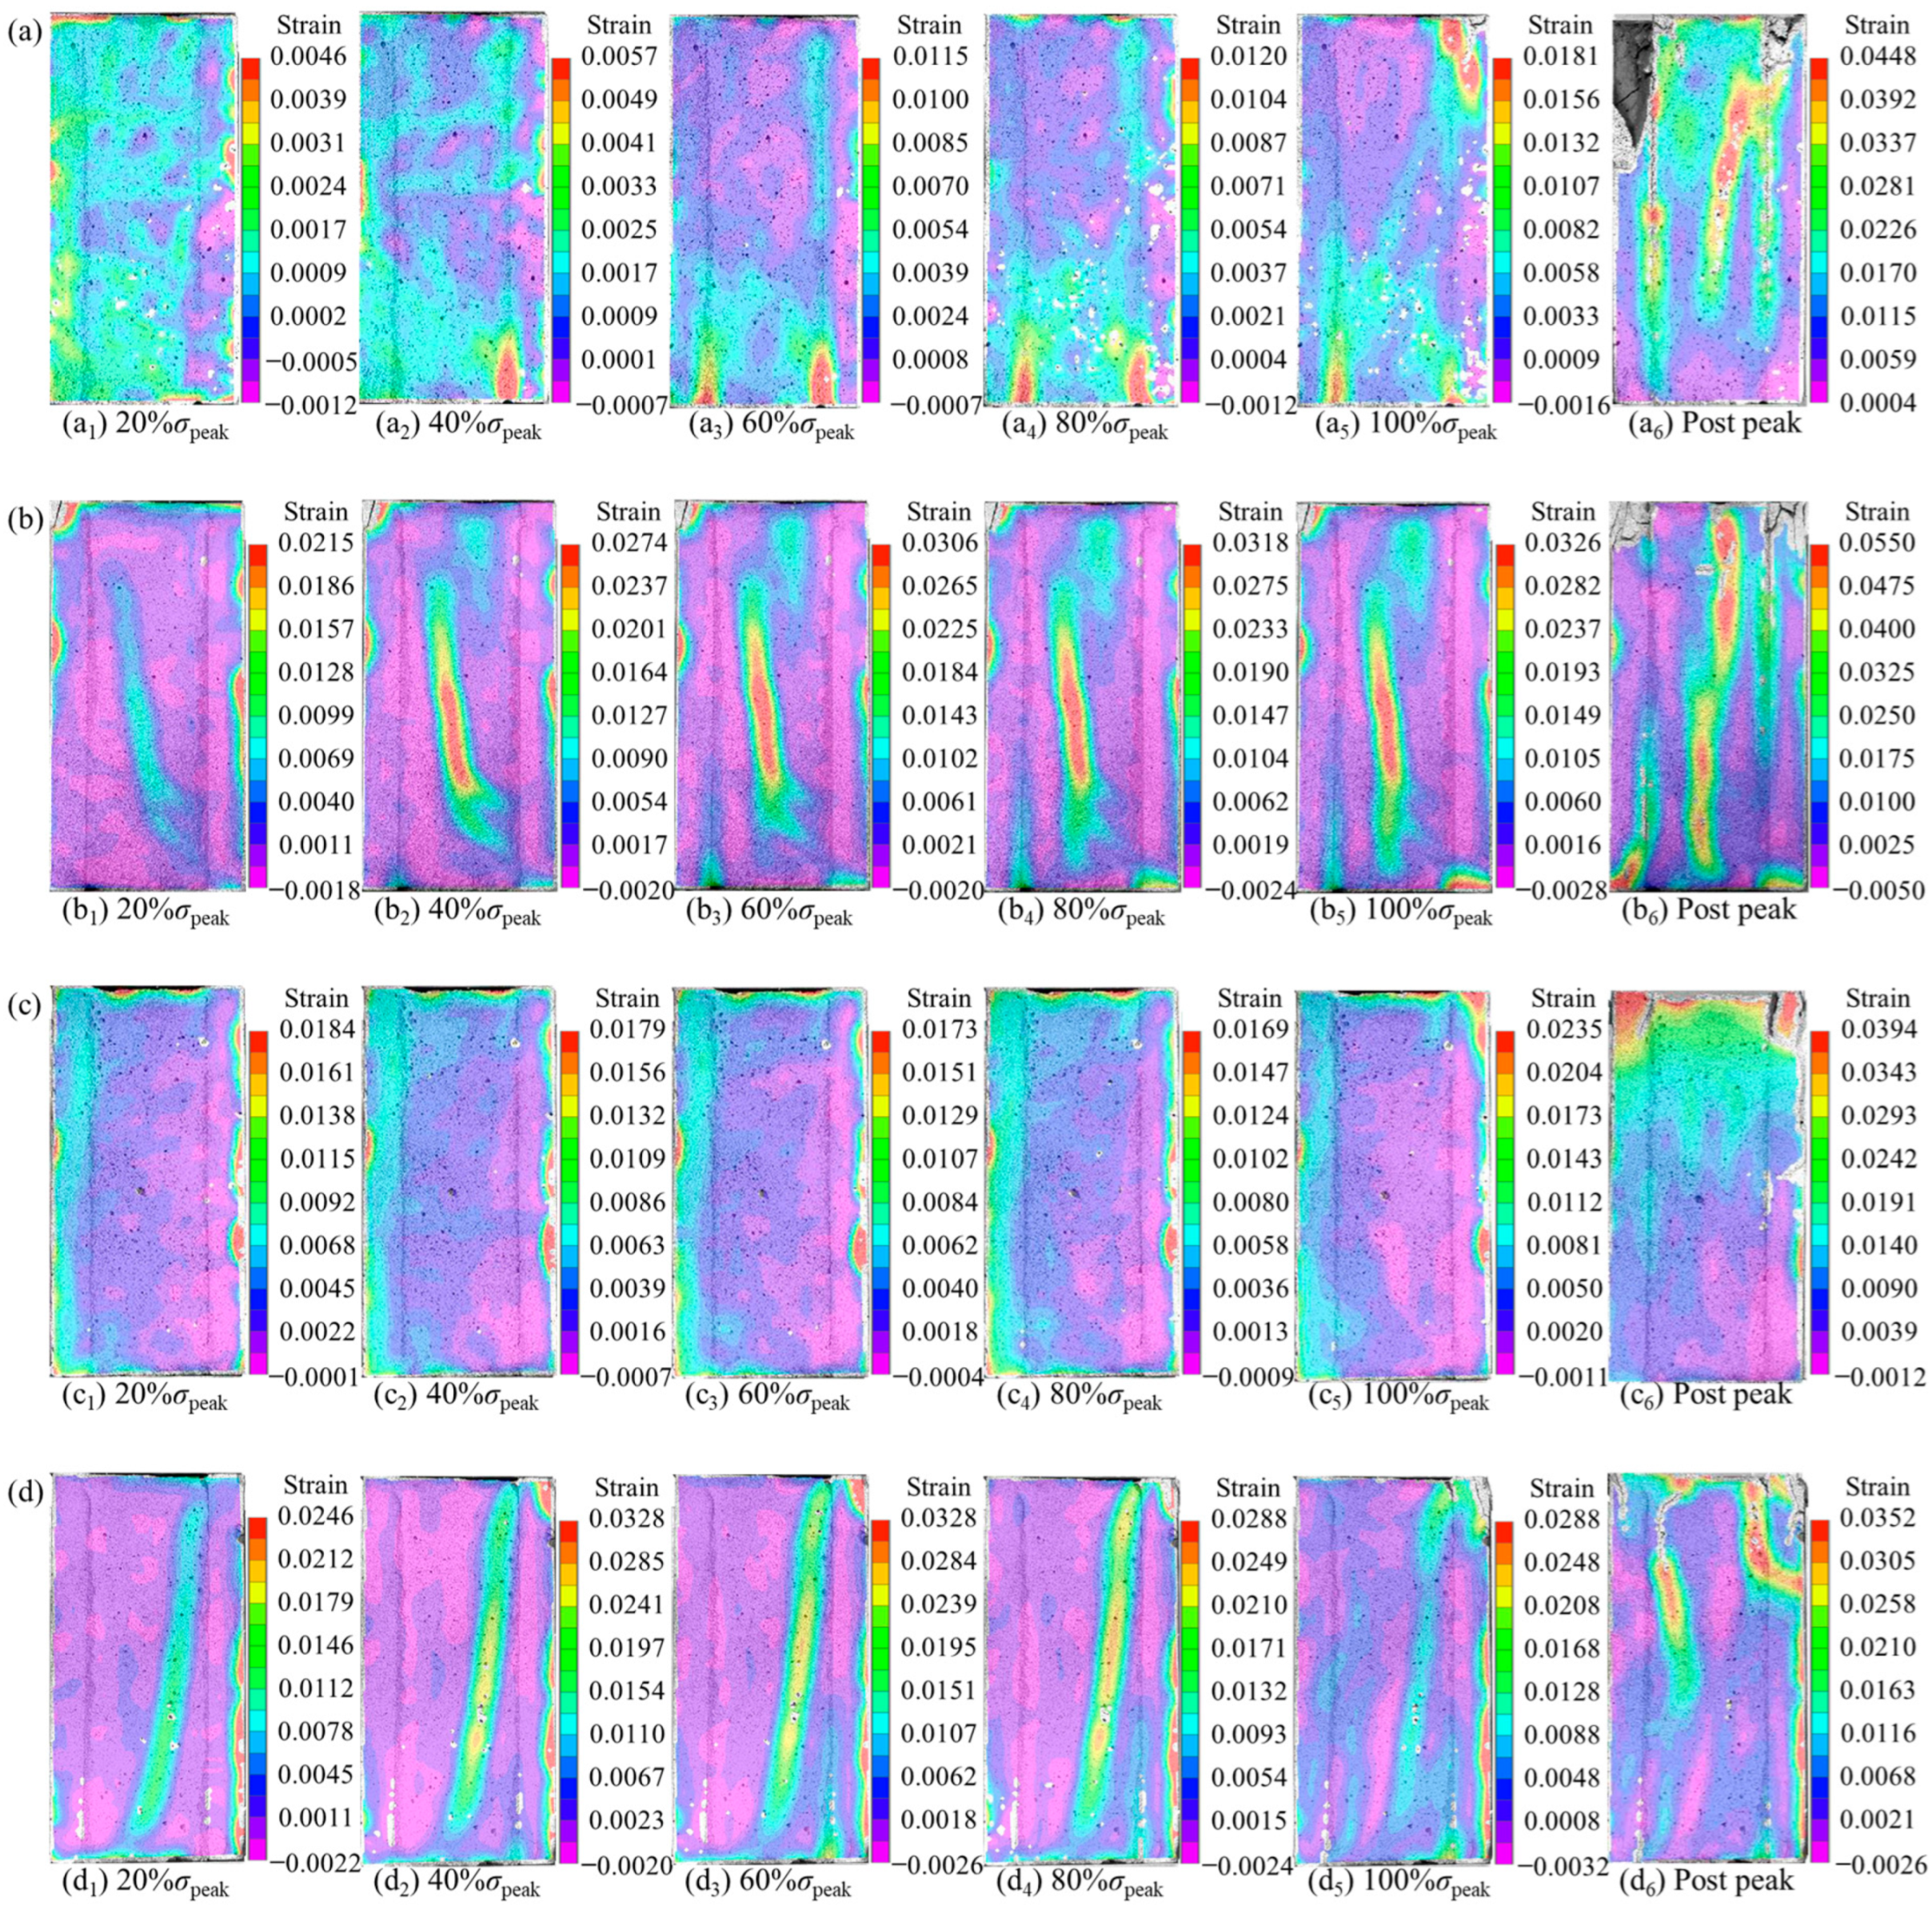
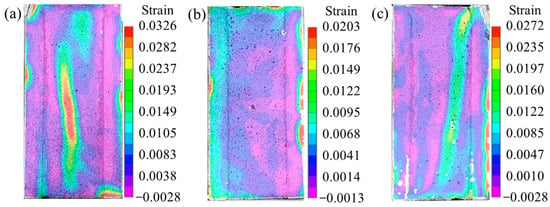
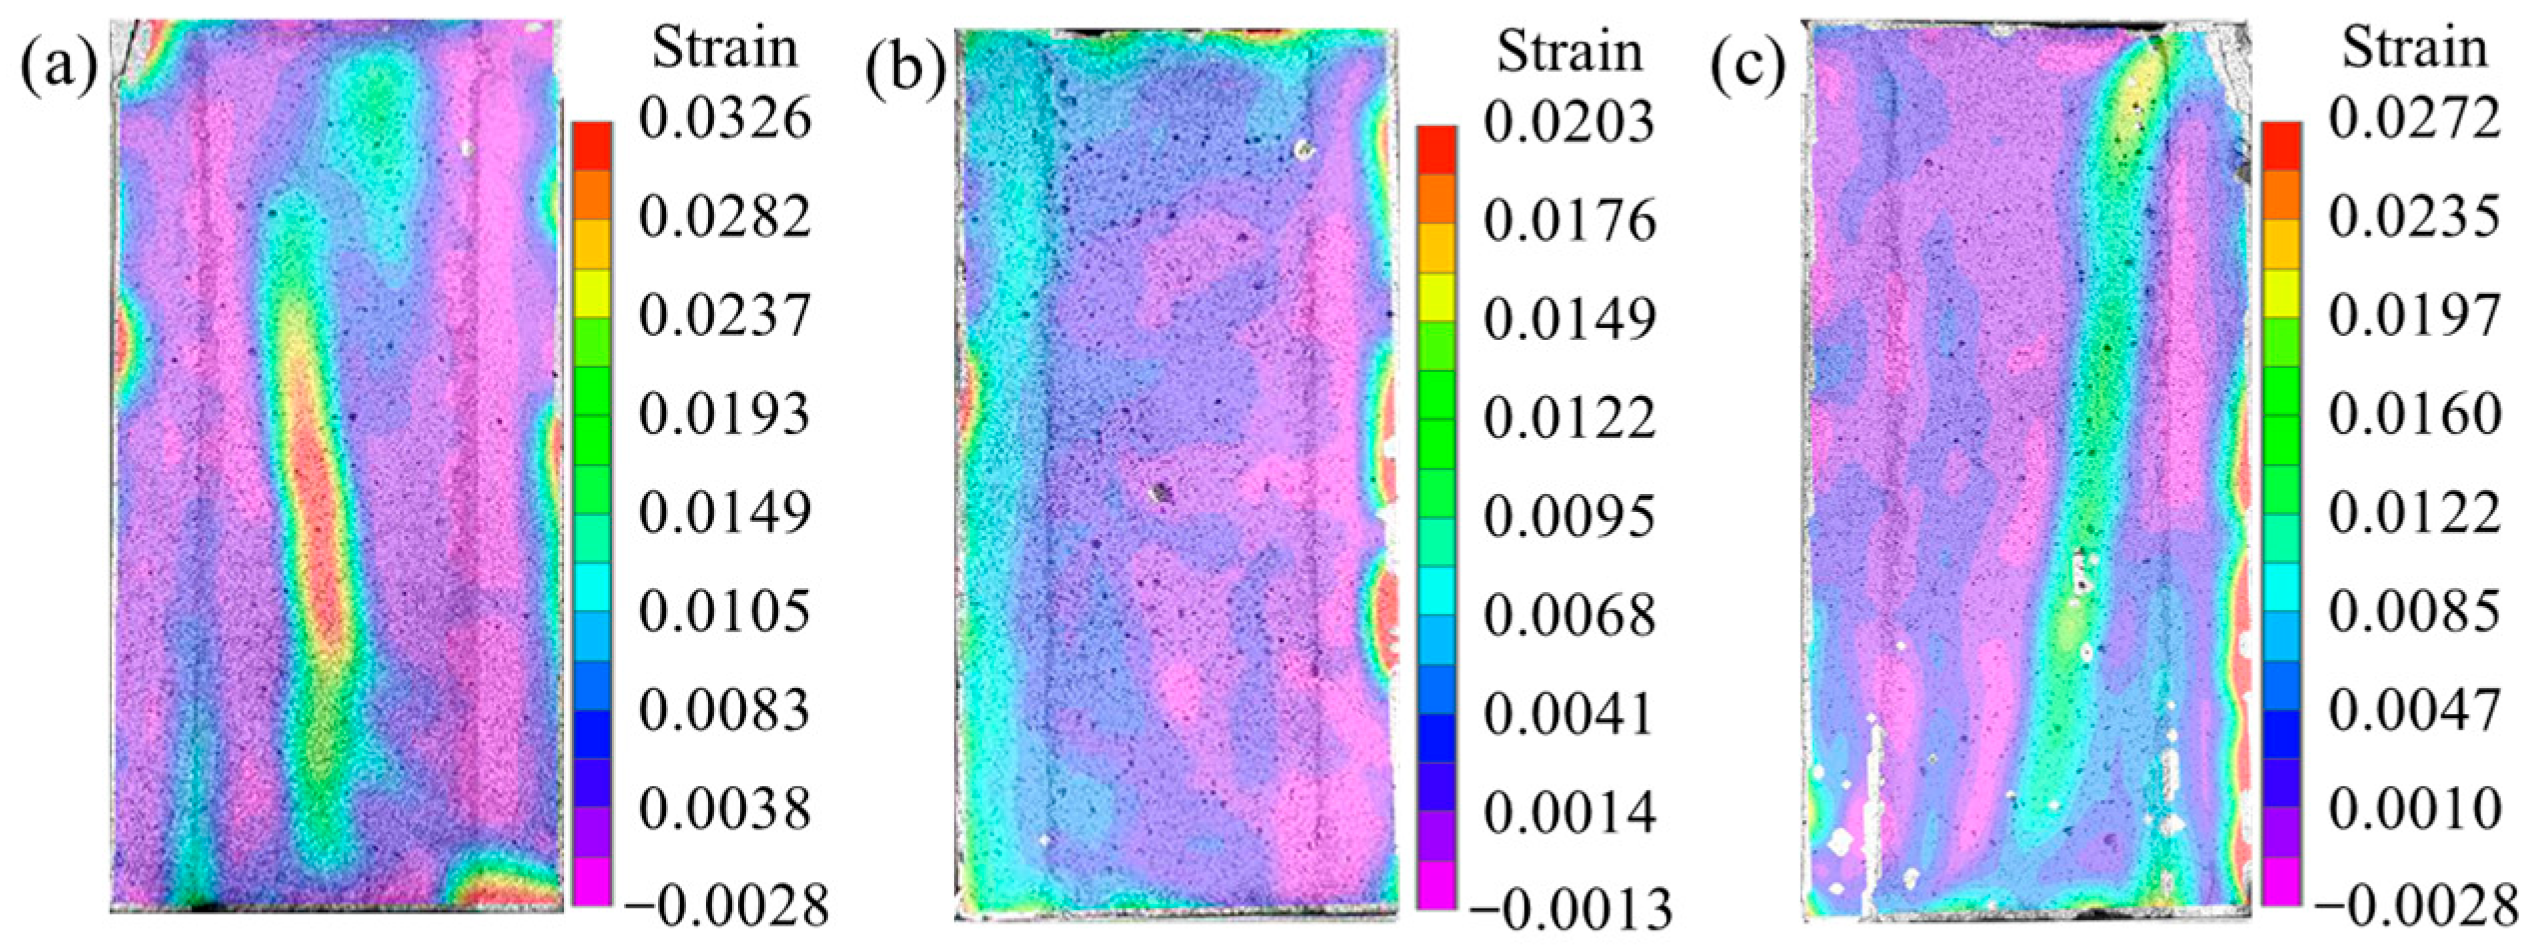
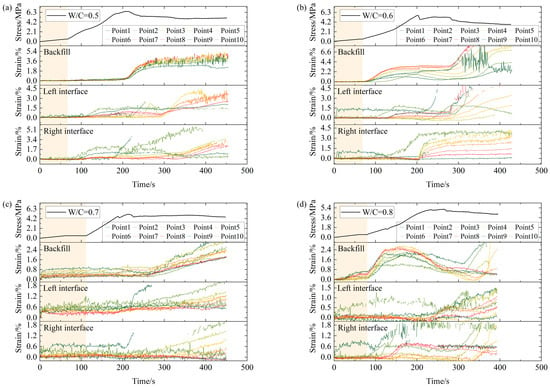
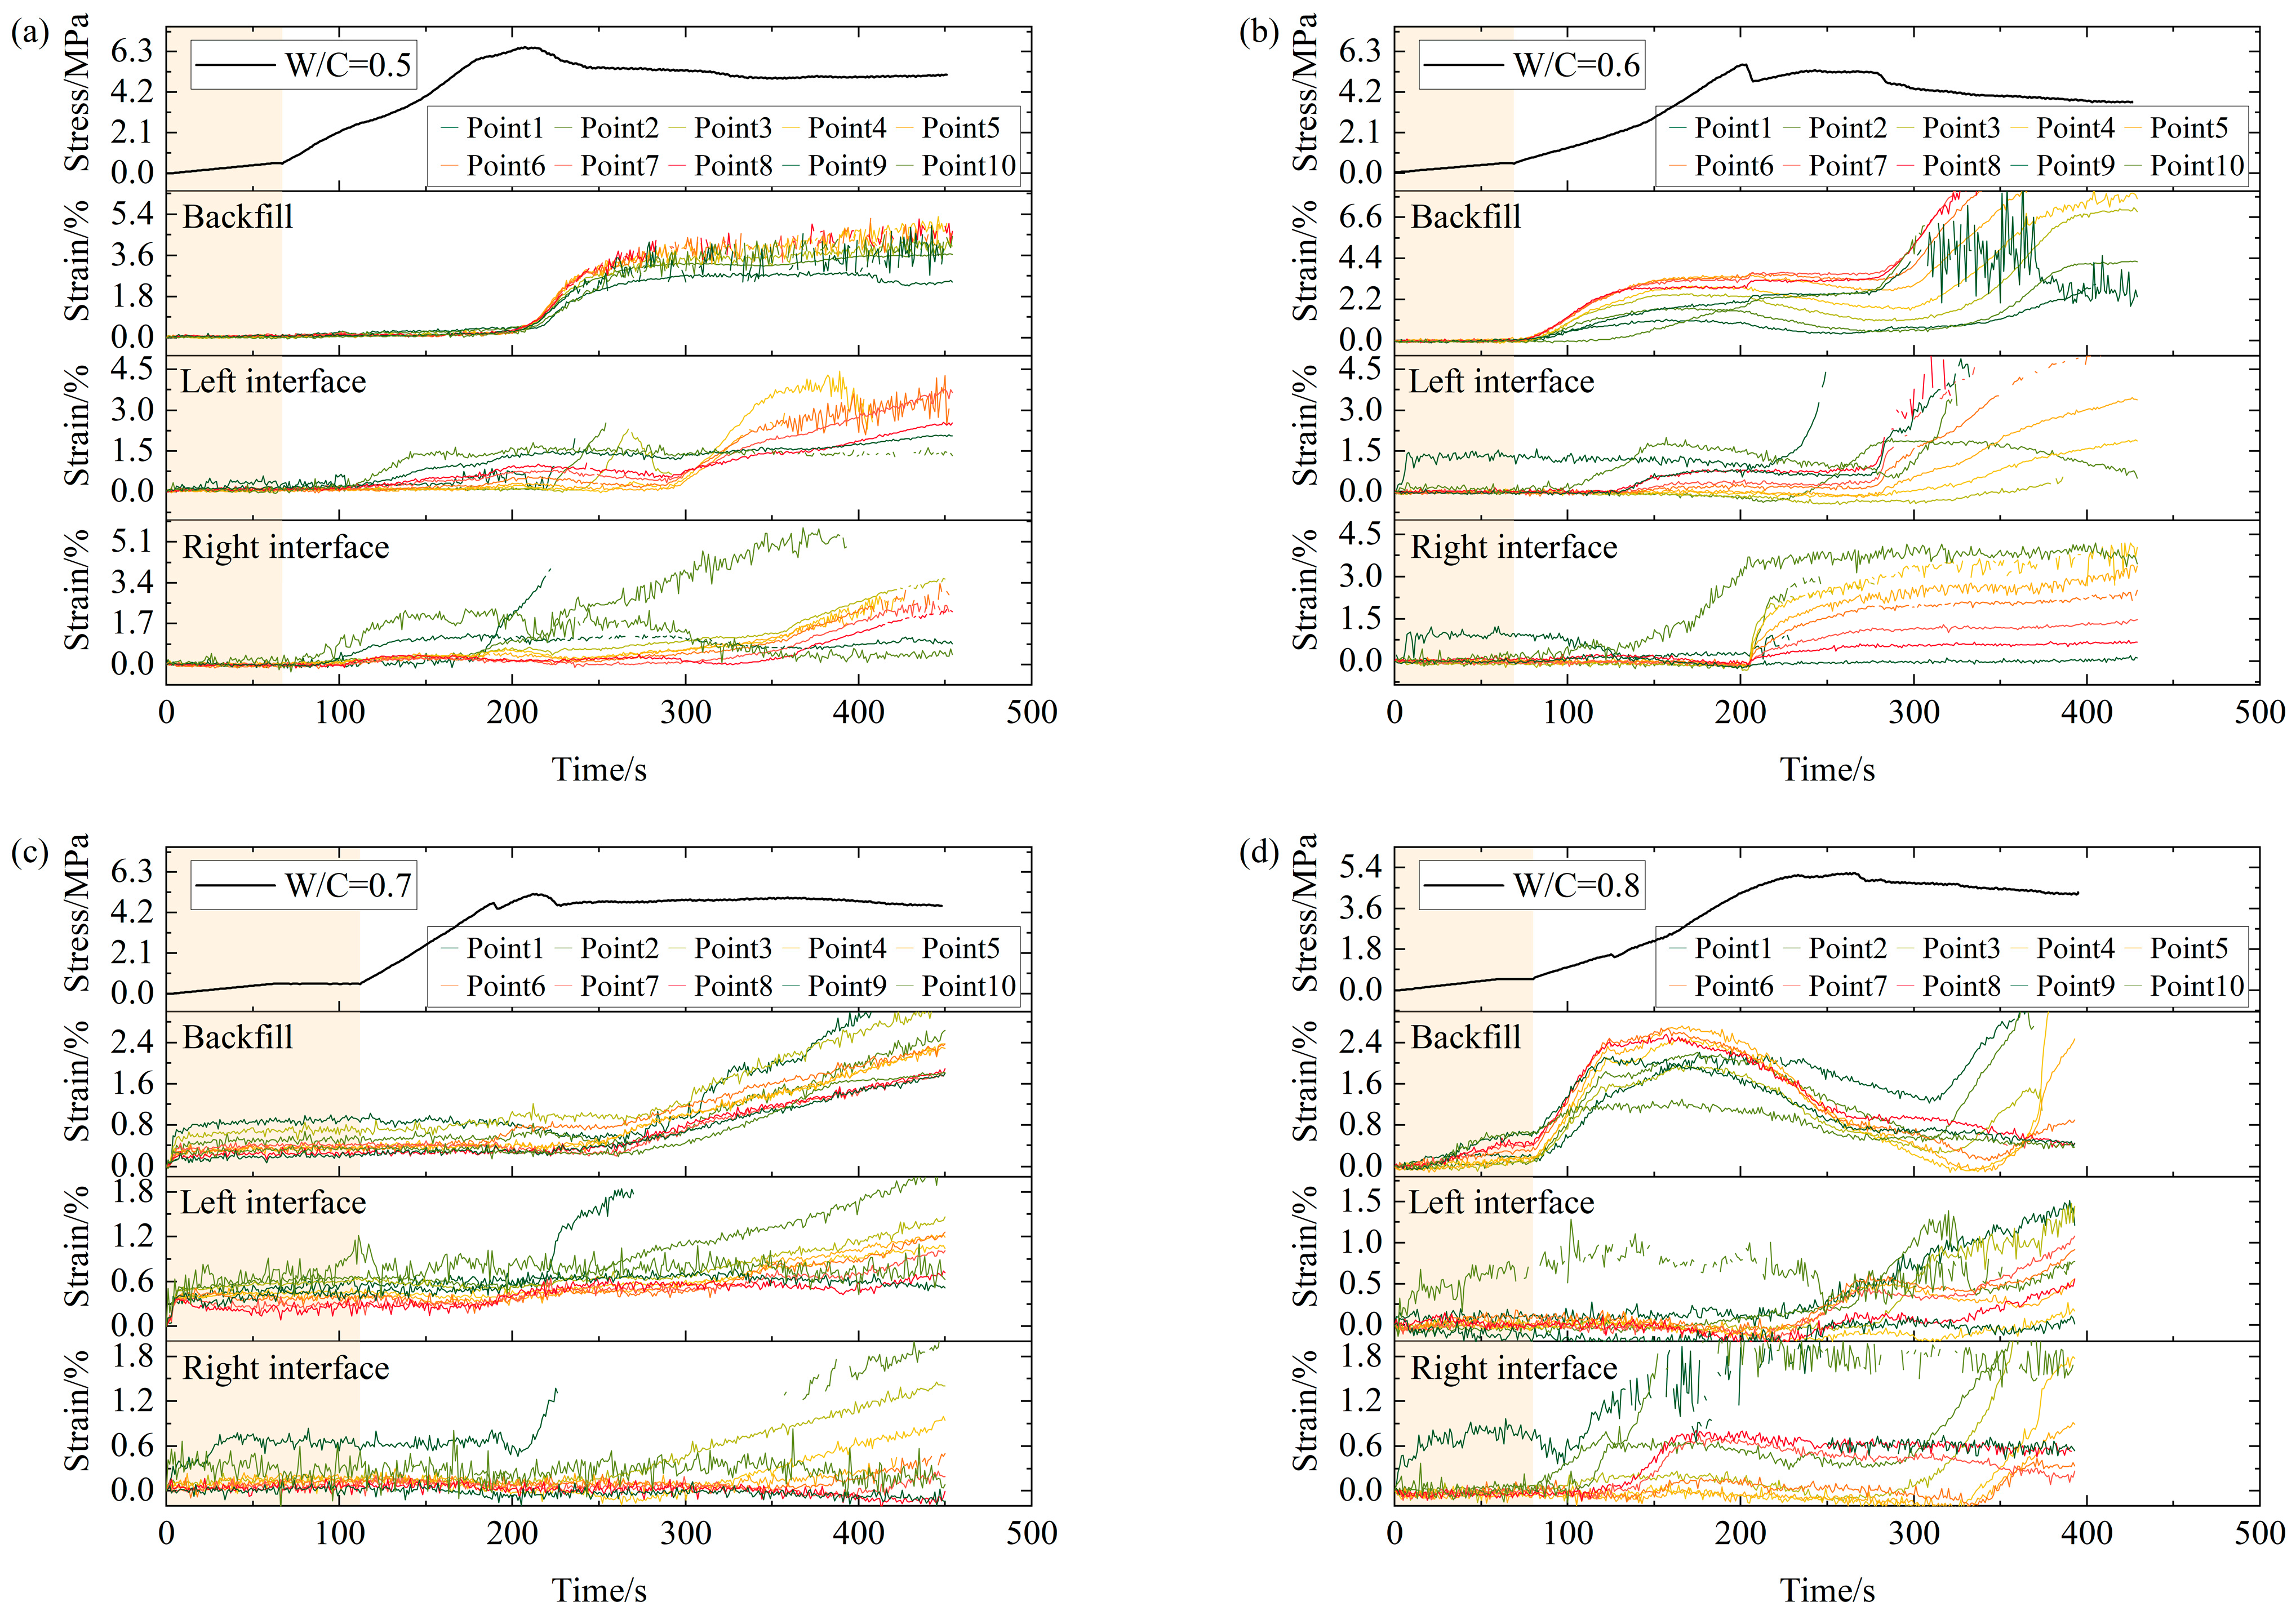
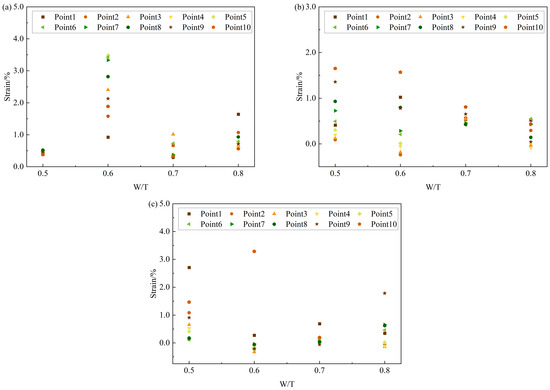
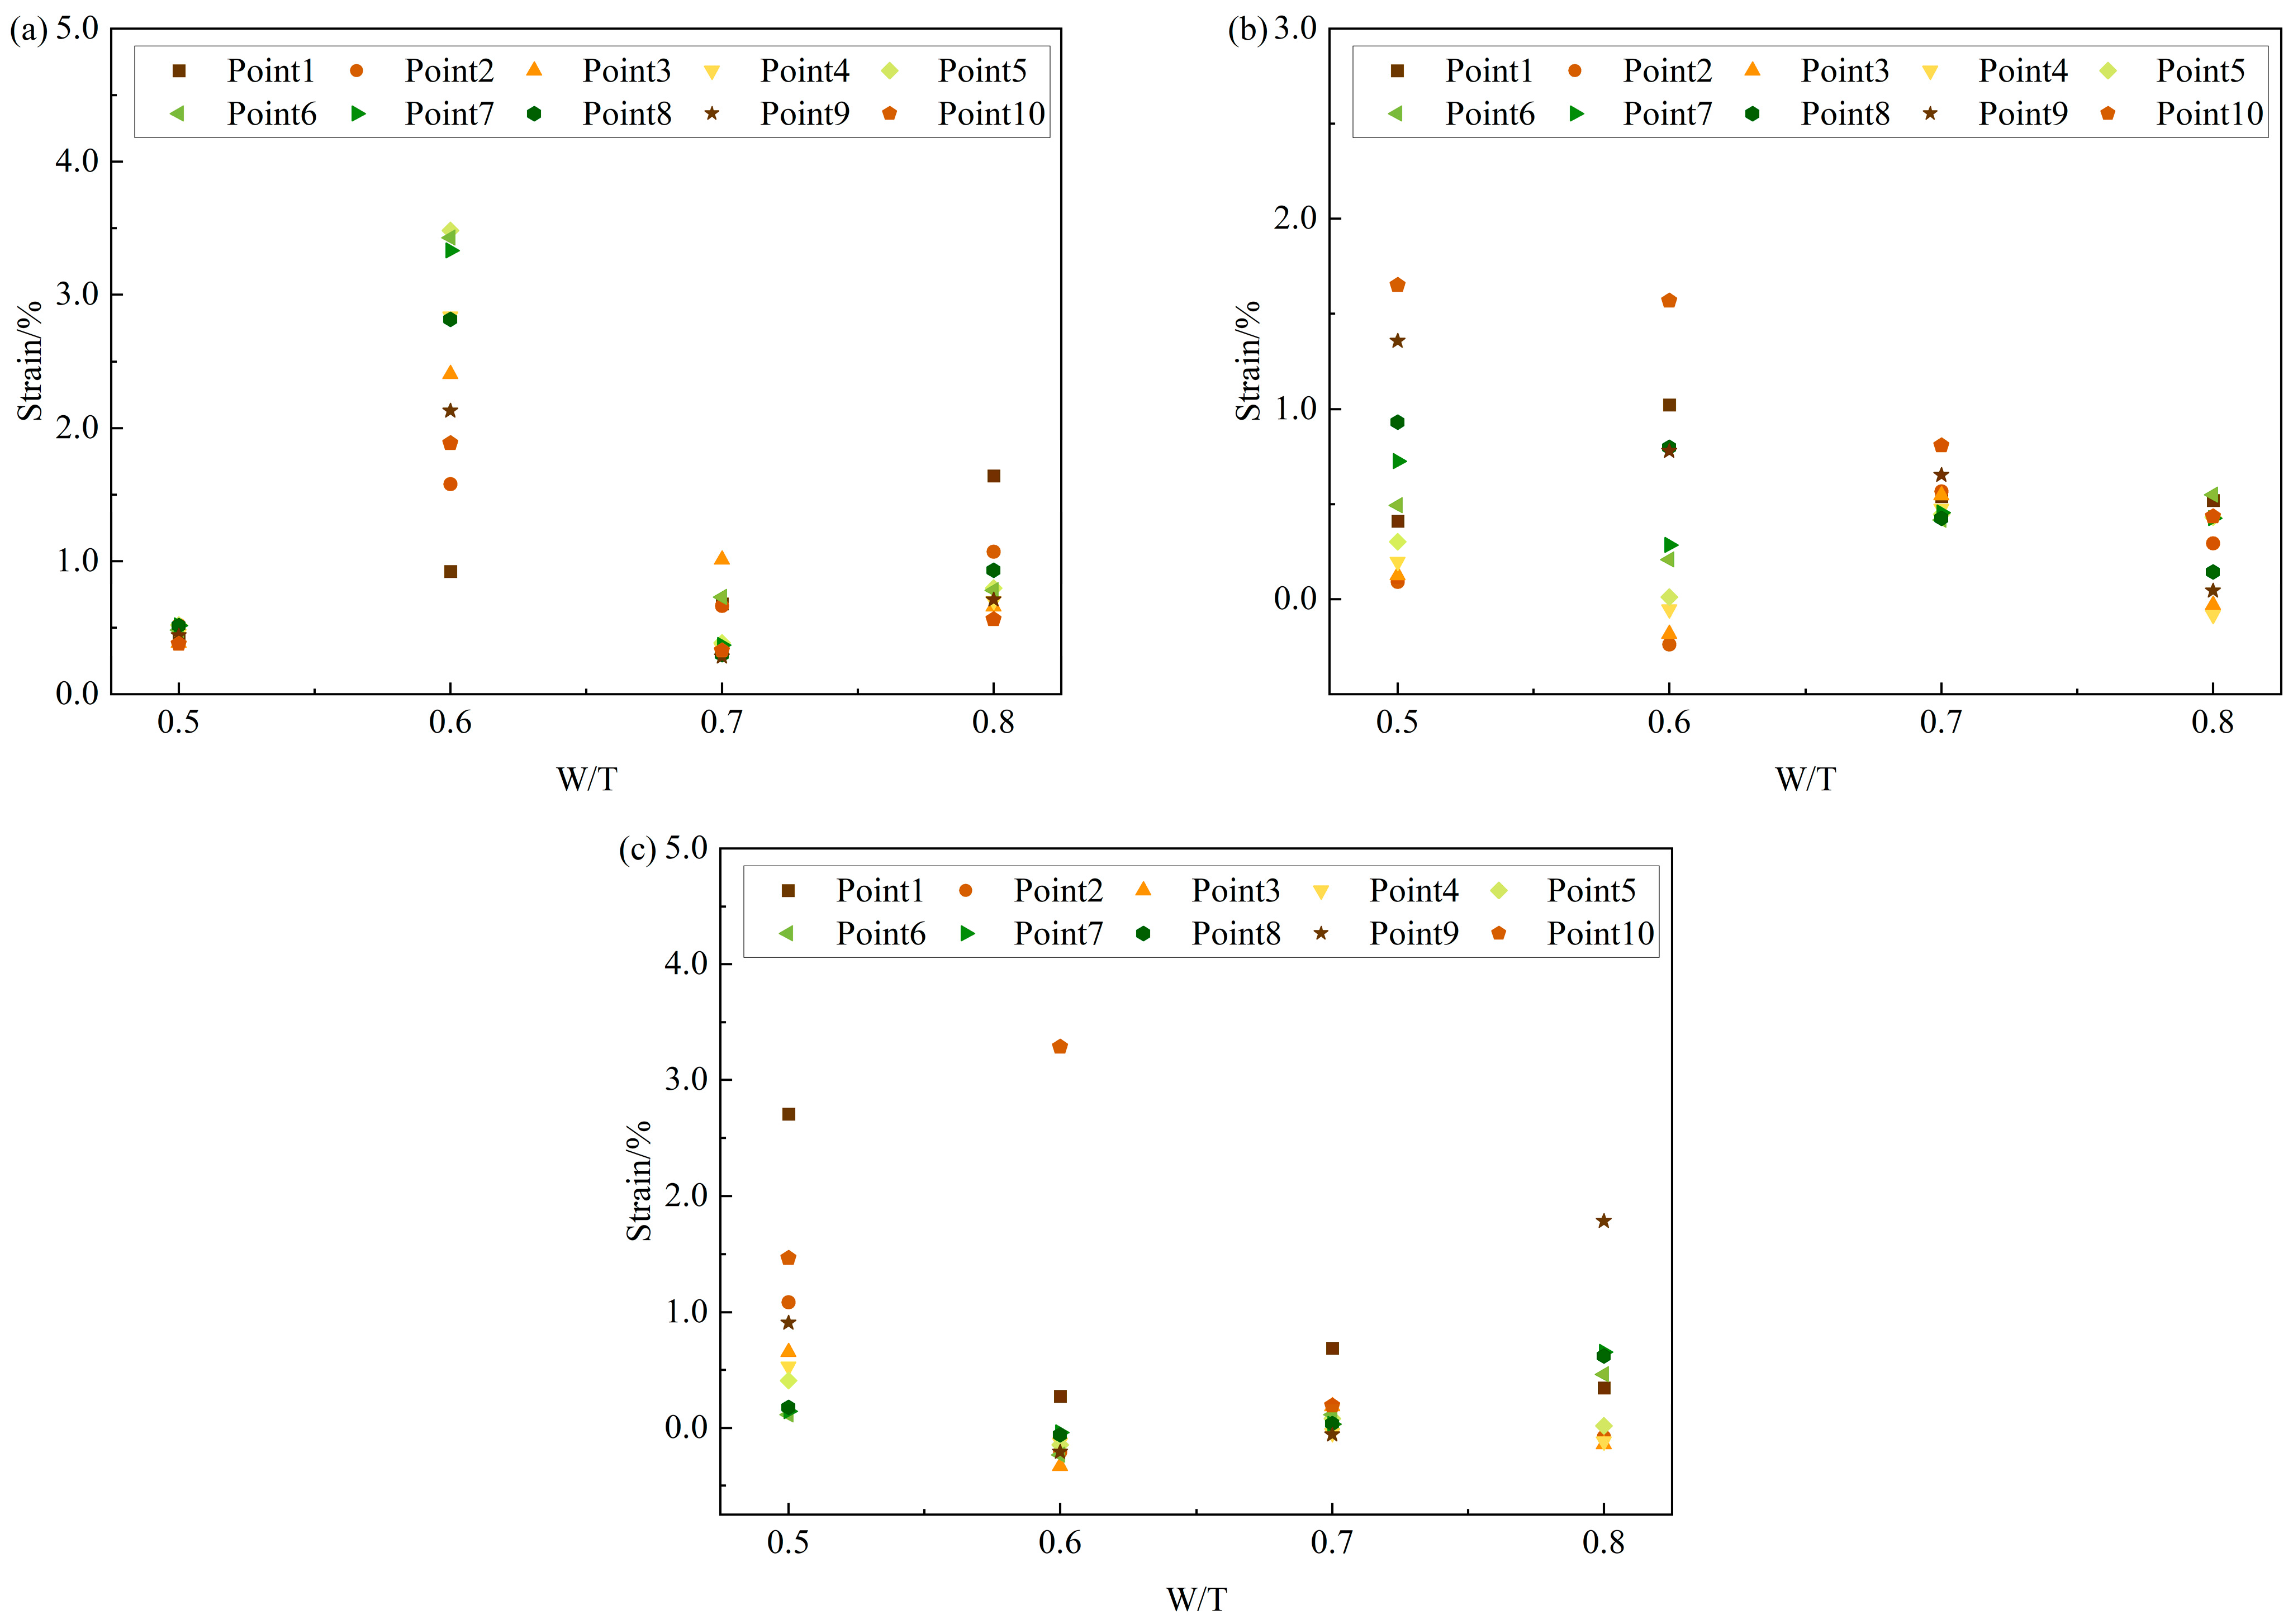
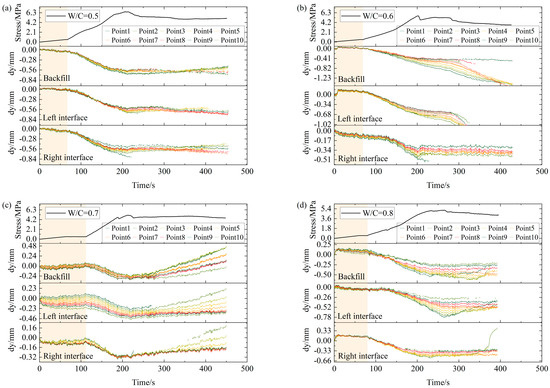
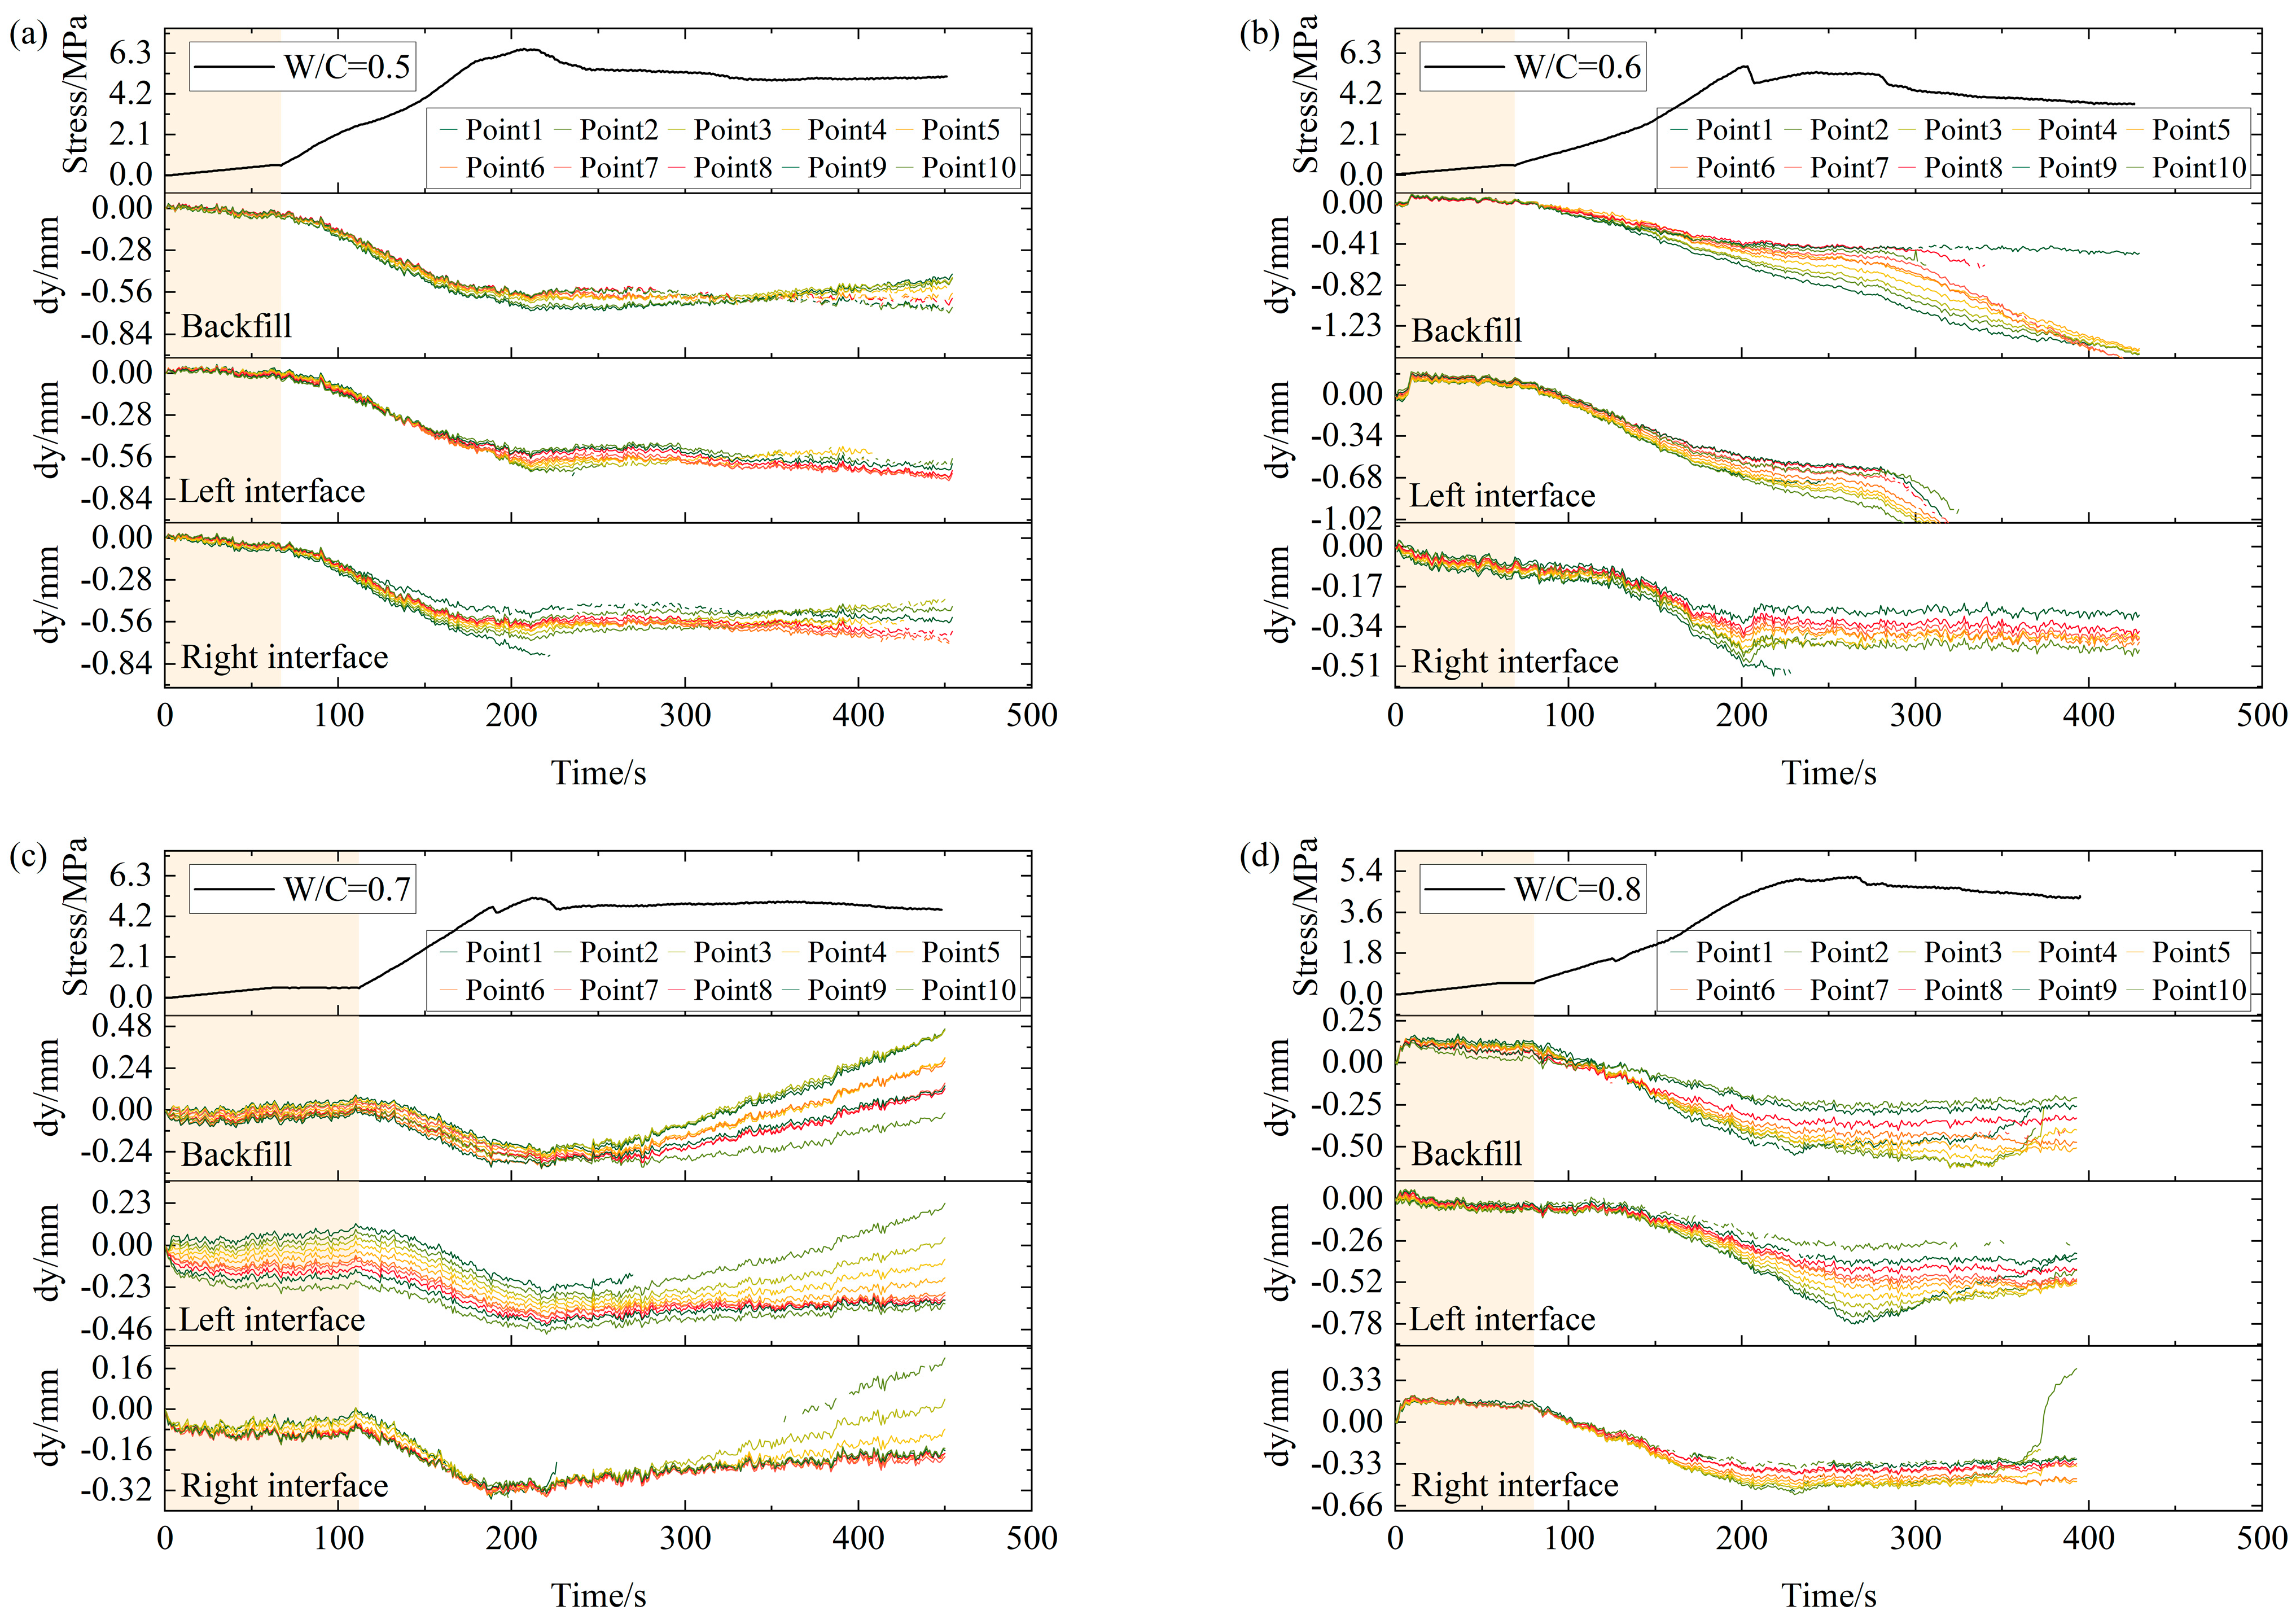
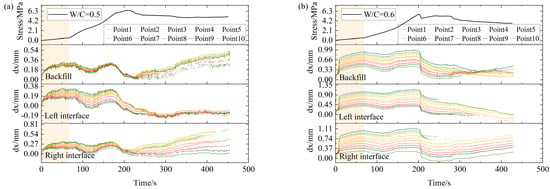
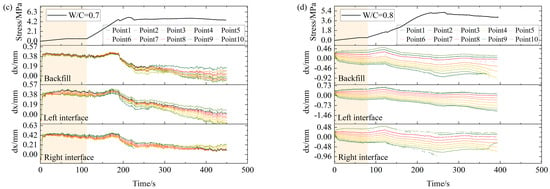
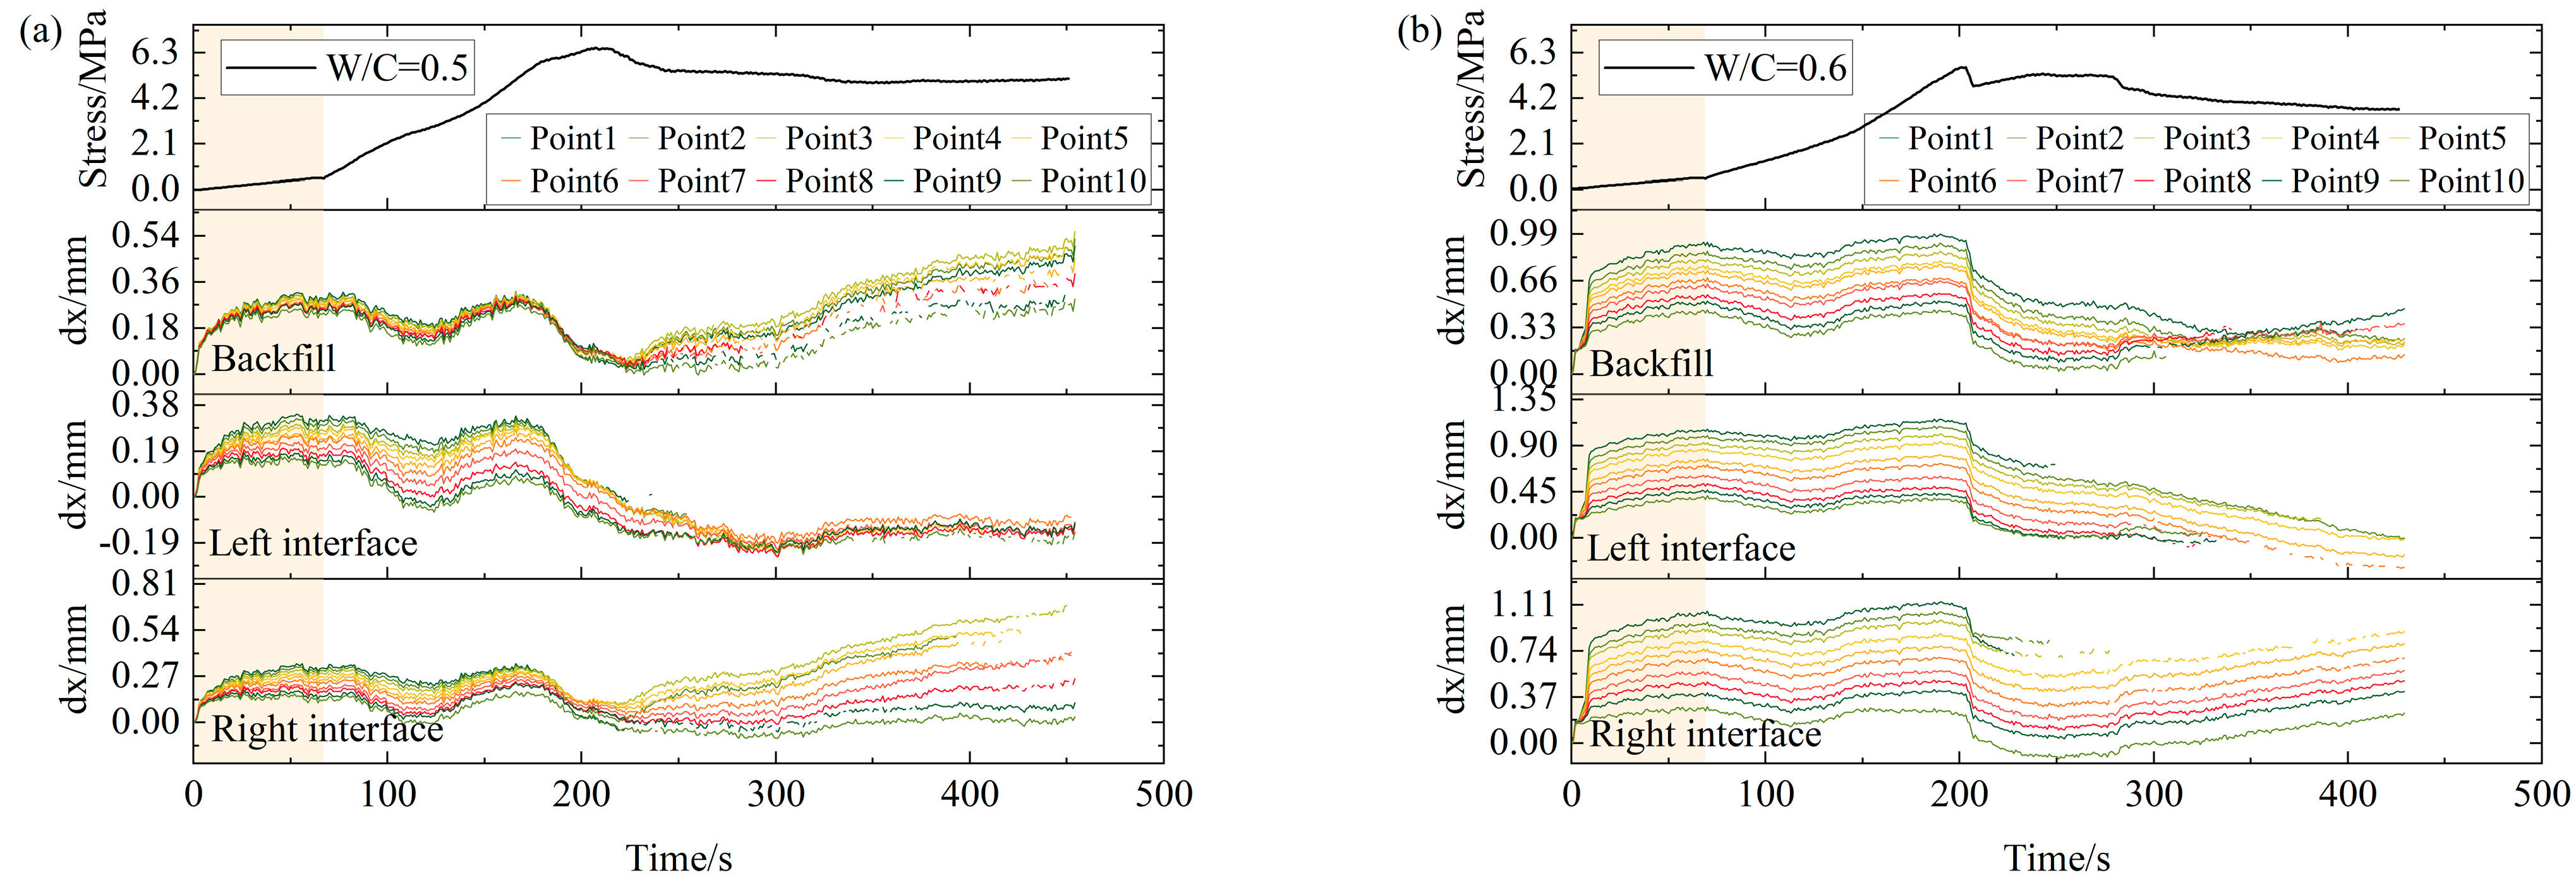
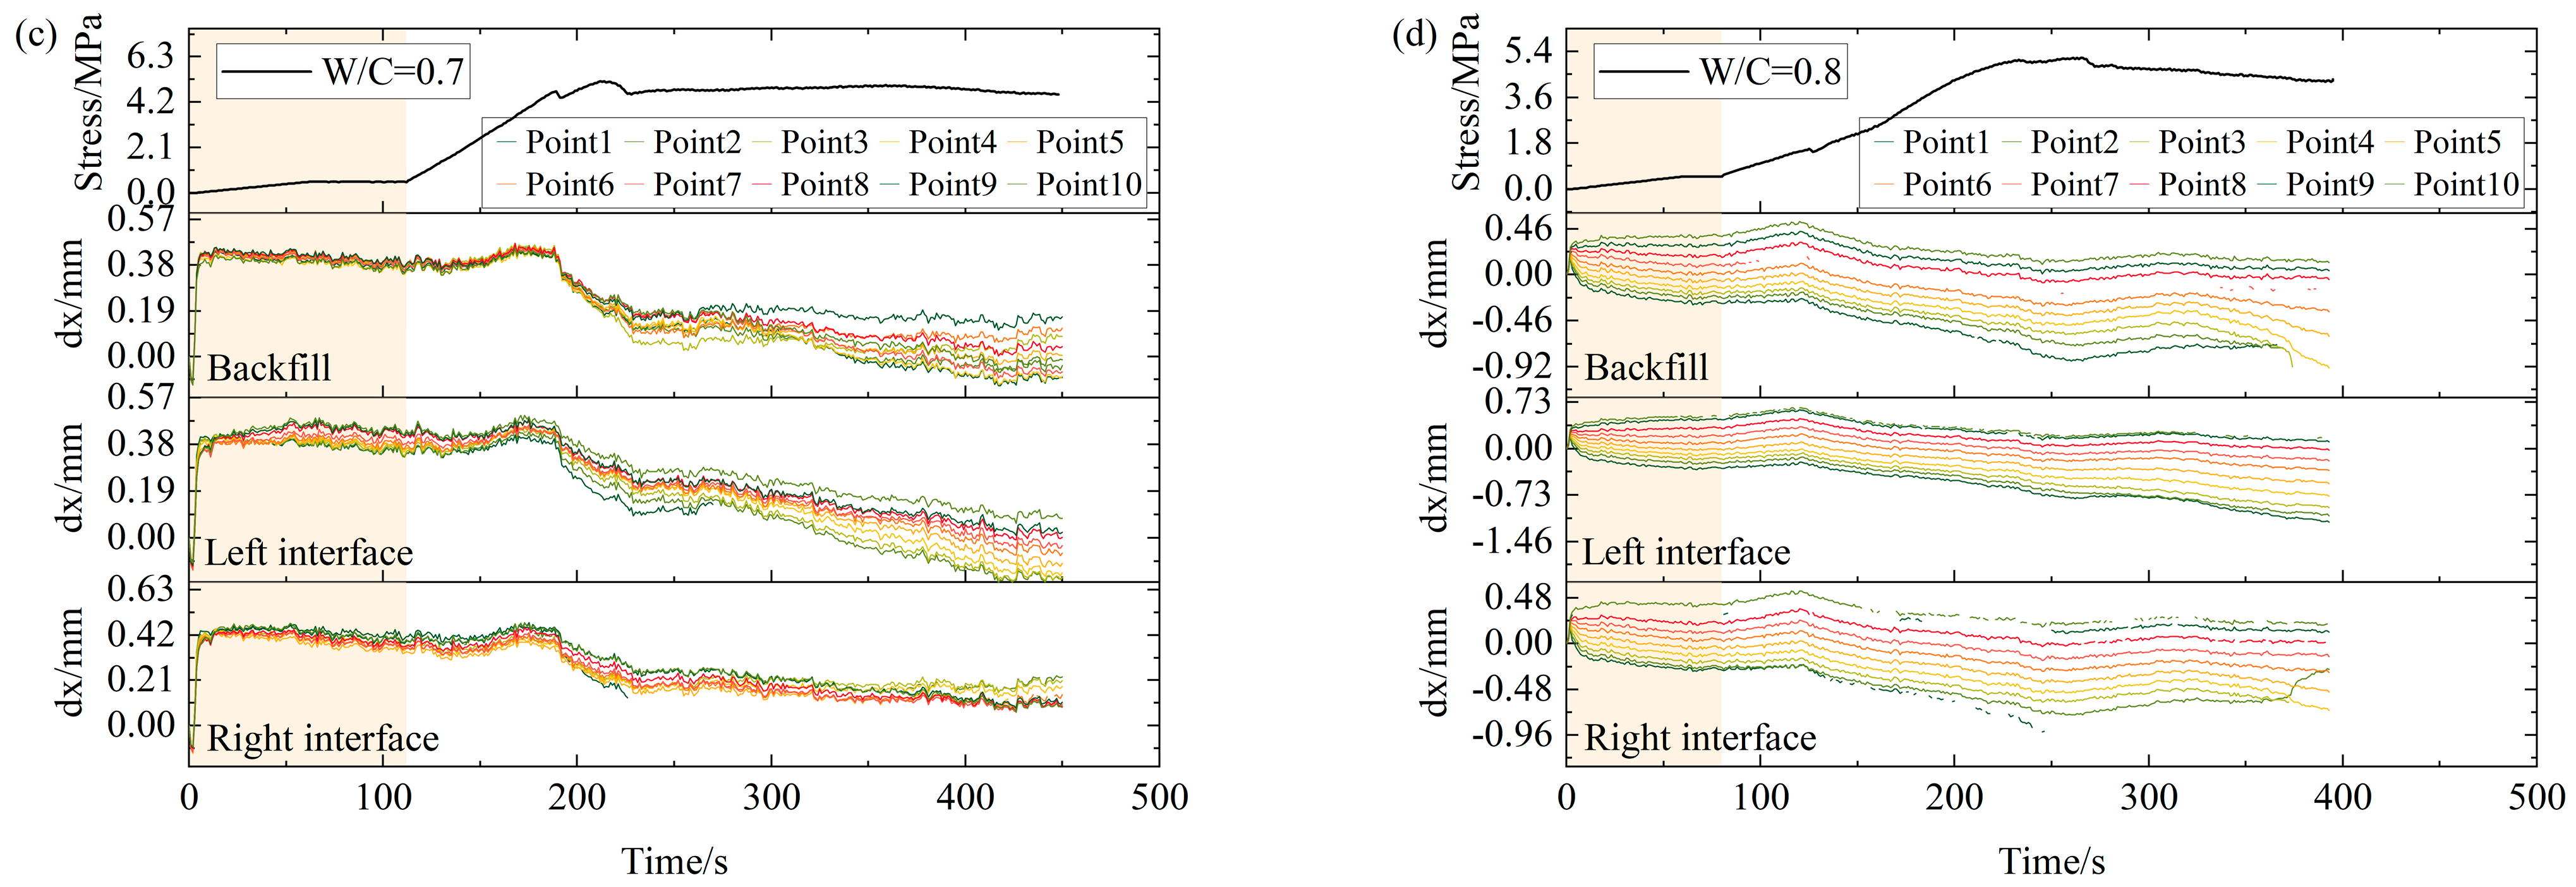

Disclaimer/Publisher’s Note: The statements, opinions and data contained in all publications are solely those of the individual author(s) and contributor(s) and not of MDPI and/or the editor(s). MDPI and/or the editor(s) disclaim responsibility for any injury to people or property resulting from any ideas, methods, instructions or products referred to in the content. |
© 2026 by the authors. Licensee MDPI, Basel, Switzerland. This article is an open access article distributed under the terms and conditions of the Creative Commons Attribution (CC BY) license.