


Abstract
The mining industry in Ghana, despite its economic significance, continues to grapple with occupational health and safety (OHS) issues, which include but are not limited to high accident rates and a largely reactive approach to safety. In this study, current practices in OHS management are assessed and a model is developed that reflects the interdependencies and associations between workplace hazards, accidents, health effects and preventative actions in a probabilistic fashion. A quantitative analytical design was employed and a sample of 298 workers, safety officers and supervisors from mines were surveyed. The data were analysed using Principal Component Analysis (PCA) to derive latent OHS factors, K-modes clustering and Hierarchical Clustering to classify worker safety profiles, and a Bayesian Network model was employed to investigate probabilistic dependencies. Three major OHS dimensions emerged from PCA: perceived adequacy of safety measures, formal training exposure, and safety resources. Three distinct worker profiles were identified, suggesting that the provision of physical safety equipment does not necessarily reflect perceived operational safety. Moreover, the Bayesian Network model indicated a conditional dependency between workers’ reported health issues and formal accident reporting, and that high hazard environments more than double the probability of an accident occurring (from 0.216 to 0.453). The results indicate that the industry is now operating in an incident-based manner. In order to mitigate the likelihood of accidents, management needs to move towards anticipatory safety management systems, which involve proactive health monitoring, equipment maintenance, and implementation of safety policies in practice.
1. Introduction
The mining sector in Ghana is an important part of the national economy and contributes significantly to employment, foreign exchange and economic development. About 6% of the country’s Gross Domestic Product (GDP) comes from the sector’s contribution, with gold accounting for 90% of all revenues derived from mining [1]. Mining is still one of the most hazardous sectors in the world, with a high incidence of accidents, injuries and deaths, despite its economic importance. Both large-scale operations and small and artisanal mining (SAM) in Ghana face persistent health and safety problems which threaten the well-being of workers and the effectiveness of the organisation. Peer-reviewed epidemiological studies reveal a high incidence of accidents among Ghanaian miners, with an estimated incidence of 19.67 accidents per 200,000 h worked, and a reported injury rate of around 25.5% of the workers surveyed in the last year. However, there are only few national statistics on the precise number of accidents and injuries associated with work. In a retrospective statistical analysis of major gold mining companies in Ghana, it was found that out of all recorded accidents, 30% were classified as serious and 20% resulted in fatalities [2]. The structural safety shortcomings of the sector were highlighted by the remarkable fact that the risk of injury was higher in unauthorised mining operations than in those of officially regulated sites [3]. The risk is heavily dictated by operational settings. For instance, underground mining increases the risk of a fatal accident by a factor of 1.46 compared to surface operations [2]. Injuries are severely compounded in Artisanal and Small-Scale Gold Mining, where safety oversight is minimal. Previous studies report alarming injury rates ranging from 5.39 per 100 person-years in Tarkwa [4] to as high as 38.5–45.5 per 100 person-years in the Upper East Region [5], far exceeding injury rates in highly mechanized and regulated sectors.
The mining sector in Ghana applies different institutional, organisational and individual aspects of OHS management practices, such as the use of management, safety protocols, the use of personal protective equipment (PPE), training, and supervision. According to empirical data from several Ghanaian studies, these procedures are often insufficient to effectively reduce workplace risks and are not uniformly applied. For example, a study conducted on small-scale miners found that, although most workers are aware of the safety rules, the uptake of safety measures such as wearing personal protective equipment (PPE) and conducting periodic safety inspections is still low, often due to resource constraints and weak enforcement [6].
Some health and safety behaviours, such as the use of personal protective equipment (PPE), show different probability patterns between different mining populations, in addition to general safety practices. In a cross-sectional study of artisanal gold miners, the use of personal protective equipment (PPE) was relatively high overall (77.4%), but the likelihood of using it increased significantly when working conditions were perceived as more secure. These results show how individual safety behaviours and the organisational context interact, but also reveal the complex and multifaceted nature of compliance with OHS, which is not adequately represented by single-group analyses alone [7].
The results of the OHS are also affected by the interlinked socio-demographic factors in Ghanaian mining workplaces. The incidence of accidents at work in the context of ASM is significantly predicted by variables such as age, gender, work experience, hazard awareness and role assignment, according to logistic regression analysis, which confirms that the characteristics of the workers have a significant influence on the safety results [8].
The effectiveness of the management of health and safety risks influences organisational results such as recruitment and retention as well as immediate safety behaviour and the outcomes of accidents. Previous quantitative studies in the Ghanaian mining sector have shown that organisational commitment and turnover targets are statistically significantly predicted by aspects of operational safety management, notably safety management and the availability of safety equipment. These studies highlight the importance of efficient health and safety systems for human resources and the organisational costs of non-compliance with security procedures [9].
1.1. Regulatory Architecture and Standards for Ohs in Ghana’s Mining Sector
Under Ghana’s Legislative Instrument (LI), which relates to Occupational Health and Safety Regulations in the Minerals and Mining (Health, Safety and Technical) Regulations, 2012 (L.I. 2182), under Minerals and Mining Act, 2006 (Act 703), mining companies are legally required to develop occupational health and safety policies, conduct regular risk assessments, provide adequate PPE, train employees in safe work procedures, maintain machinery and equipment safely, monitor workplace hazards, conduct periodic medical examinations where necessary, report accidents and dangerous occurrences, develop emergency response and mining rescue plans, and keep health and safety records [10,11].
However, Ghana’s first national OSH profile of 2025 shows systemic weaknesses in the capacity of the inspectorate, fragmented supervision, weak injury and disease control, and extensive informal work without comprehensive OHS coverage, underlining the need for a more robust risk-based approach beyond compliance with the rules [12].
1.2. Sector Performance and Injury Patterns
Industry statistics show a varying safety trends, with an increase in severity categories and numbers of non-fatal injuries, but a decrease in the number of fatalities. According to the 2024 safety data presented by the Ghana Chamber of Mines and the Minerals Commission, three deaths occurred (down from seven in 2023), alongside a concerning rise in lost working time from injuries. Specifically, 265 injuries were recorded, encompassing both first aid cases and serious incidents requiring more than 14 days away from work [13]. This trend indicates that while fatal accidents have seen a reduction, persistent gaps remain in proactive risk management. Further longitudinal analyses of these injury reports reveal that the vast majority of these incidents, up to 85 percent of injuries and 90 percent of fatalities in sampled mines, are directly linked to mining equipment. Maintenance tasks, the operation of mobile equipment, and cleaning activities consistently rank among the most hazardous operations, underscoring the critical need for targeted and preventative safety interventions [14].
Research on Ghanaian large-scale miners have shown that musculoskeletal disorders and headaches are often associated with morbidity. These disorders are mainly linked to higher injury rates among engineers and mechanics, while long hours are associated with increased risk factors for ergonomics and organisation. At the same time, organisational research shows that OHS practices (e.g., training, procedures, PPE, and audits) influence safety knowledge, culture and behaviour. In addition, transformational leadership strengthens the link between OHS programmes and first-line behaviour, integrating leadership and culture alongside technical controls in all multivariate risk models for Ghana [15,16].
Injuries and risk exposure are not only limited to large-scale mining companies, but also Artisanal and Small-Scale Mining (ASM) as well. Recent descriptive work in ASM districts in Ghana has revealed awareness of safety regulations but uneven application of PPE, with results on use of safety shoes being skewed; injuries range from cuts, fractures, sprains and strangulation, and safety measures focus on training and initial monitoring rather than systematic risk assessment. However, this study focuses on large-scale mining.
National initiatives such as the EPA-led Mercury Reduction and Clean Coal Demonstration Centres under the AEHPMP aim at reducing toxic exposure (e.g., to mercury) and improving ASM process safety through technology demonstration and training, creating a political lever to link OHS to environmental health [17].
1.3. Occupational Health Services, Hygiene, and Surveillance Gaps
From the point of view of occupational health, large-scale mines are often operated by in-house or outsourced occupational health services, but there are still few occupational health specialists in the Legislative Instrument (L.I. 2182) and there are no specific surveillance mandates for several classes of hazards (e.g., vibration, ionising radiation, and noise), which results in heterogeneous monitoring across firms. The OSH 2025 profile also identifies weak and non-integrated data systems for reporting on injuries and diseases as a problem for statistical modelling and prevention, thus encouraging the use of probabilistic and multivariate methods to maximise the use of sparse or imperfect data sets while quantifying uncertainty [18].
1.4. OHS Management Systems and Organizational Determinants
Research in Ghana shows that formal OHS procedures and observed safety behaviour are mediated and moderated by a safety culture within management. OHS practices predict safety knowledge and culture, which in turn predict behaviour, according to the structural models of a recent study on Ghanaian mines. Transformational leadership reinforces these relationships, which suggests that, in addition to exposure metrics, organisational factors should be included in any in-depth assessment. The idea that scales of organizational factors, validated by exploratory and confirmatory factor analysis, provide empirically sound constructs for incorporation into multivariate models is supported by the International Mining Safety Scholarship [19].
1.5. Why Multivariate? Evidence from Predictive and Explanatory Models
Studies on global mining data show that the demographics of the workforce (age and tenure), time factors (start and end of shift), type of work (contractor versus operator), type of mine, and the type of accident all contribute to the multi-factorial nature of injury outcomes. These predictors are identified as relevant through multivariate logistic regression and related multivariate modelling of MSHA data; in particular, tenure in current role is identified as an important risk factor, even for workers with considerable overall experience, which provides practical insights for targeted initial and recurrent training in Ghana. Text-based models using narrative accident reports (decision trees, random forest, neural nets, and NLP features) often outperform structured data in predicting the outcomes of accidents, and when narrative data is available, Ghanaian models highlight the predictive value of time-to-move and days-to-work data to support the fusion of features (structured + non-structured). These models go beyond tabular data and are based on narrative accident reports (decision trees, random forest, neural nets, and NLP-like constructs) [20,21].
A machine learning study on mining safety shows the potential of multi-class classification and association rule mining to detect key indicators derived from safety interactions and near-miss text approaches. These indicators, if properly located and managed, can improve regulatory reporting in Ghana. In Ghana, where analyses of incidents often highlight organizational, task-type, and equipment factors, systematic reviews also recommend that risk analysis be carried out on human, operational, and environmental dimensions at the same time [22].
1.6. Probabilistic Risk Assessment and Quantifying Uncertainty
The persistent limitations of descriptive conformity audits are addressed by probabilistic methods addressing causation pathways, reporting fidelity and uncertainty regarding exposure. In recent studies, methods have been introduced for multi-factor risk matrices to increase qualitative and ordinal risk ranges by including additional coefficients. This approach leads to more reliable gradients, as compared with scoring by a single factor. At the same time, applied research using non-Ghanaian data sets shows that predictive risk models such as linear and logistic models and stacking are able to predict increased risk windows up to 24–48 h in advance of environmental and human factors. These models offer probabilistic results such as risk scores and predicted probabilities that can be used by the management to plan, manage and target visits [23,24].
For regulators and companies, probabilistic outcomes are essential for moving from lagging indicators to guiding controls, enabling L.I. 2182-based thresholds, mechanisms for reporting and corrective action. They also offer a principled way to integrate environmental EPA parameters (dust, fumes, and mercury) into the OHS dashboard of mines, in line with environmental authorisation and AEHPMP initiatives in Ghana [14].
1.7. Synthesis: Gaps and Directions for a Ghana-Focused Multivariate Probabilistic Agenda
A review of the existing literature reveals a persistent disconnect between statutory compliance and data-driven accident prevention. Specifically, four methodological shortcomings characterise current occupational health and safety (OHS) research within the Ghanaian mining sector. First are the integration gaps. Ghanaian OHS compliance data are often analysed in isolation. There is a critical need for multivariate fusion that integrates worker characteristics, equipment maintenance, and task-based indicators into a single analytical framework, as single analytical methods often lack accuracy in complex socio-technical systems [25]. Secondly, there is a lack of probabilistic forecasting. Current retrospective analyses frequently fail to stratify risk or quantify uncertainty [7]. To address this, the application of probabilistic classification, specifically Bayesian networks, is useful for dynamically representing probabilistic dependencies and accommodating uncertain or incomplete data.
Third is the quantification of organisational determinants. Whilst factors such as safety culture, formal training, and perceived adequacy of measures are known to be influential, they are rarely measured as latent variables. Validated dimension-reduction and structural models, such as Principal Component Analysis (PCA), are necessary to incorporate these complex socio-cultural determinants as measurable predictors [26,27]. Fourth, the reliance on reactive paradigms: existing models predominantly describe past incidents rather than categorising worker safety profiles proactively to predict future hazard exposure.
A number of questions regarding the abovementioned disconnect remain to be addressed. This study seeks to answer the following research questions:
- What are the latent dimensions underlying occupational health and safety (OHS) management practices in Ghana’s mining sector?
- What distinct worker safety profiles exist within the Ghanaian mining workforce based on their safety barrier conditions?
- How do workplace hazards, health issues, accident reporting methods, and preventive actions conditionally relate to accident probability in Ghanaian mining operations?
- Is the current OHS management system in Ghana’s mining sector predominantly reactive or proactive in nature?
Addressing these methodological gaps aligns directly with Ghana’s Minerals and Mining Policy and the OSH 2025 profile. By transitioning to an anticipatory management model, this study provides the systemic, probabilistic framework required to bridge the gap between basic statutory compliance data-driven, pre-emptive hazard mitigation.
2. Materials and Methods
A quantitative analytical design has been employed to explore the status of health and safety practices in the mining sector. In this study, a systematic sampling technique is used, which allows a representative coverage of mine workers. A survey was conducted of 311 mine workers. This represents mine workers, workers on the surface, mine safety officers and mining supervisors. R software (Version 4.5.3) was used to analysed the data.
2.1. Sampling Technique
A multi-stage sampling method was used so as to ensure representativeness and to be methodologically rigorous. To begin with, the sample was stratified according to the nature of the job held in the mining industry, with the types including underground workers, surface workers, safety officers and supervisors. This stratification was adequate and allowed for adequate representation in the significant areas of operation. The sample was stratified within each and simple random sampling was used to select the participants without the introduction of any bias. Systematic sampling was also used in order to organize lists of workers for efficient data collection in the field. This was a combination of random and practical feasibility agreement and proportional representation across groups.
2.1.1. Sampling Proportions and Allocation Criteria
To ensure transparency regarding the sample composition and its representativeness,, the target population estimates and the planned proportional allocation are explained in this section, as well as the actual sample distribution. The population for this study consisted of workers in large-scale mining operations in the Ghanaian context. The study took a large-scale mining operation as a focus since this is the formal and regulated part of the mining sector where the management of occupational health and safety is most well developed and systematic data collection possible. The sampling frame did not include artisanal mining and small-scale (ASM) mining operations, as they are mostly informal and do not have systematic OHS record-keeping. The companies that participated were chosen from amongst the membership of the Ghana Chamber of Mines (incorporating Ghana’s major large-scale mining companies) operating in Ghana. Three large-scale gold mining companies located in Takwa, Bogoso and Prestea all located in the Western Region of Ghana were purposively selected due to their willingness to participate, diverse operation (both surface and underground) and accessibility for the purpose of the study.
- Inclusion Criteria: Current employment in a large-scale mining operation in Ghana (underground mine, surface mine, or processing plant).Employment duration of at least three months at the time of survey administration.Willingness to provide informed consent and complete the survey questionnaire.Age 18 years or older.Able to understand and respond to survey questions in English or a local language.
- Exclusion Criteria: Workers employed in artisanal and small-scale mining (ASM) operations.Workers employed for less than three months at the time of survey.Contract workers not directly engaged in mining operations.Individuals unable or unwilling to provide informed consent.
2.1.2. Response Rate and Sample Composition
A total of 380 potential respondents were approached at the three participating mining sites. 316 people completed the questionnaire, an 83.2% response rate. Data were cleaned and listwise deleted due to incomplete responses (18 cases), yielding a final sample for analysis of 298 (78.4% of approached population).
2.2. Data Source and Description
The information collected were mainly categorical and ordinal responses of the mine workers on training, adequacy of safety measures, availability and maintenance of equipment, perception of safety in the environment, sufficiency of protection equipment and the effect of potential hazards. Demographic data were also collected, including age, gender, education level, work role, and work experience. The study was conducted mainly through self-completion of the questionnaires, and care was taken to ensure that the answers were confidential and anonymous in order to encourage truthfulness and minimize social-desirability bias. The survey was conducted to ensure a representative cross section of the mining workforce in the different operational mines (both surface and underground) in Ghana. The number of samples, after cleaning, was 311 (298), which is small for national-level inference and yet sufficiently large for the applied multivariate methods, especially from a categorical perspective and for penalized likelihood scoring to avoid overfitting.
2.3. Model Specification: An Integrated Analytical Pipeline
This section offers a model specification of an integrated analytical pipeline. An integrated, sequential analytical pipeline is used in this study, in which the results of each methodological step feed into the inputs and the structural design of the next step. These are not used separately, but sequentially and as part of a comprehensive predictive risk model made up of the data collected in a survey in a categorical format. The rationale for this integration is provided by a sequential flow of information, which starts with dimensionality reduction, continues with empirical profile grouping, and ends with probabilistic dependency mapping.
Stage 1: Dimensionality Reduction and Variable Selection (PCA). The raw survey data was subjected to First Order Factor Analysis (PCA) in order to decrease the dimension and extract the latent OHS constructs (safety resources, training exposure, perceived adequacy, etc.). Importantly, the variables measured that had high factor loadings in the PCA (including equipment maintenance, training received, and hazard perception) were separated out. These high-loading variables were retained for the subsequent clustering stage in order to ensure that the resulting clustering was on statistically supported dimensions of safety and not based on random variable selection.
Stage 2: Empirical Profiling of Risk States (Clustering). Second, the categorical safety barrier variables were used directly as input for the clustering algorithms using the PCA. The selected barrier variables were qualitative, so K-modes clustering was used to divide the workers into different safety profiles, using strict category matching. Hierarchical Clustering was implemented in parallel with the same PCA-selected variables in order to make sure of the strength of the profiles and to detect graded similarities. The cluster profiles confirmed the multidimensionality of the safety barriers empirically and identified specific categorical states (e.g., ‘equipment provided’ but ‘not maintained’) of high-risk worker groups.
Stage 3: Probabilistic Dependency Mapping (Bayesian Network). Finally, variables that define the latent constructs (Stage 1) and the categorical states identified in the worker profiles (Stage 2) were discretised to create the nodes and states in a Bayesian Network. To avoid arbitrary variable selection, macro-level variables and outcomes that were most important and most consistently identified by the PCA and empirical clustering procedures were used to structure the Bayesian Network. The five core nodes for the Bayesian Network (Workplace Hazards, Work Accident Occurred, Health Issues Experienced, Accident Reporting Method, and Prevention Steps Taken) were specifically chosen because they were the top-level outcome and predictor variables that came from the data discretization in the previous PCA and clustering phases. The PCA therefore provided the theoretical latent dimensions, the categorical risk states were then empirically clustered, and the Bayesian Network provided a probabilistic representation of the conditional dependencies and statistical associations among these specific, pre-validated categorical risk states, thus advancing the study from descriptive profiling to probabilistic predictive risk assessment.
Figure 1 provides explicit variable-level traceability across the analytical pipeline. The PCA identified six variables contributing to the latent occupational health and safety structure, with loadings ranging from 0.725 to 0.976. Variables representing formal safety training, training effectiveness, safety equipment provision, equipment maintenance, and perceived adequacy of safety measures were subsequently represented in the clustering stage through their corresponding operational indicators, including Training Received, Equipment Maintained, Equipment Sufficient, and Measures Adequate. Additional categorical indicators, notably PPE Provided and Environment Safe, were retained in the clustering analysis because they provided complementary information on worker-level safety conditions that was not represented by the PCA components. The clustering stage therefore translated the dimensional structure identified by PCA into empirically distinguishable worker safety profiles. These profiles, particularly the contrast between resource-supported but inadequately perceived safety conditions and unsafe environments with poorly maintained equipment, then provided empirical context for specifying the higher-level Bayesian Network variables. The Bayesian Network was not mechanically constructed from PCA components or cluster labels. Rather, the PCA and clustering stages informed the selection and interpretation of the higher-level safety constructs subsequently discretized as Workplace Hazards, Work Accident Occurred, Health Issues Experienced, Accident Reporting Method, and Prevention Steps Taken. This establishes an explicit analytical trace from dimensional reduction, through worker profiling, to probabilistic risk modelling.
Figure 1.
Variable traceability across analytical stages.
2.3.1. Factor Analysis
Factor analysis was conducted to identify latent constructs underlying occupational health and safety practices.
- Kaiser–Meyer–Olkin (KMO) Test
The KMO statistic measures sampling adequacy and is defined as follows:
where
- = correlation coefficient between variables and ;
- = partial correlation coefficient between variables and
- Bartlett’s Test of Sphericity
Bartlett’s test examines whether the correlation matrix is significantly different from an identity matrix:
where
- = sample size
- = number of variables
- = determinant of the correlation matrix.
- Principal Component Model
The factor model is expressed as
where
- = observed variable ;
- = loading of variable on factor ;
- = latent factor ;
- = unique error term.
- Eigenvalue Decomposition
Eigenvalues satisfy
where
- = eigenvalue;
- = identity matrix.
Total variance explained is given by
2.3.2. K-Modes Clustering
Given the categorical nature of the data, K-modes clustering was used to partition observations.
The objective function minimizes dissimilarity:
where
- = data point ;
- = mode of cluster ;
- = dissimilarity function.
The dissimilarity measure is defined as
where
- = indicator function, equals 1 if condition is true, 0 otherwise
- = number of variables.
Cluster modes are updated as the most frequent category within each cluster.
2.3.3. Determination of Optimal Number of Clusters
The optimal number of clusters was determined using the Elbow method (Within-Cluster Sum of Squares) and Silhouette analysis.
Within-Cluster Sum of Squares (WSS) Elbow Method:
Average Silhouette Width:
where is the average dissimilarity within the same cluster, and is the minimum average dissimilarity to other clusters.
2.3.4. Hierarchical Clustering
Agglomerative hierarchical clustering was applied using a dissimilarity matrix.
Distance between clusters and is defined as
where
- = number of observations in clusters;
- = dissimilarity between observations.
2.3.5. Bayesian Network Model
A Bayesian Network is a Directed Acyclic Graph (DAG) representing probabilistic dependencies among variables. The five core nodes for the Bayesian Network: Workplace Hazards, Work Accident Occurred, Health Issues Experienced, Accident Reporting Method, and Prevention Steps Taken, were deliberately selected as the most critical and high-level outcome and predictor variables identified in the data discretization stage. Although it is desirable to include a more highly dimensional network that would contain granular demographic or specific hazard-type variables, for this sample size, the high-dimensionality would lead to computational instability and the risk of overfitting the model, the simple five-node structure was selected to be interpretable and to provide a clear summary of the macro-level conditional dependency structure associated with accident probability. This simplified network was validated internally through penalized node-average likelihood scoring and arc strength analysis, establishing the robustness of the directed dependencies.
- Joint Probability Distribution
The joint probability distribution is expressed as
where
- = node (variable);
- = set of parent nodes of ′.
- Conditional Probability Estimation
Conditional probabilities are estimated as
where
- = frequency count.
- Structure Learning.
The network structure was learned using the Hill Climbing algorithm, which maximizes the penalized log-likelihood:
where
- = observed data;
- = network structure;
- = number of edges (arcs);
- = regularization parameter.
2.3.6. Model Validation of the Bayesian Network
The Bayesian Network was evaluated using a series of internal validation procedures designed to assess predictive discrimination, calibration, classification performance, subgroup consistency, and structural stability. Because all observations originated from the same cross-sectional survey of 298 respondents, these procedures constitute internal validation. They should not be interpreted as external validation. The Bayesian Network was validated using the following comprehensive procedures.
Data Splitting and Held-Out Test Set Validation
The dataset (N = 298) was randomly split into a training set (70%, n = 209) and a held-out internal test set (30%, n = 89), using stratified random sampling. Because both subsets were derived from the same cross-sectional study sample, the test set represents internal hold-out validation rather than external validation using an independent cohort. Predictive performance was assessed using AUC-ROC, AUC-PR, Brier score, calibration slope and intercept, Hosmer–Lemeshow goodness-of-fit testing, accuracy, sensitivity, specificity, precision, F1-score, and negative predictive value. Calibration plots and decision curve analysis were also used to assess calibration and potential decision utility. Ten-fold stratified cross-validation was conducted within the training data for model tuning, while 5000 bootstrap resamples were used to assess the stability of the estimated conditional probabilities and network structure. These procedures were treated as complementary measures of internal model stability rather than evidence of external generalizability. External predictive validity was not assessed in this study because an independent dataset from other mining operations or a temporally distinct validation cohort was not available. Accordingly, the Bayesian Network should be regarded as an internally validated probabilistic risk-assessment model, and independent external validation is required before broad predictive deployment or generalization beyond the study population.
Calibration Analysis
Calibration was assessed using calibration plots, Hosmer–Lemeshow Goodness-of-Fit Test, Calibration Slope and Intercept, and Brier Skill Score (BSS).
Decision Curve Analysis
Decision curve analysis assessed the clinical/practical utility of the model by calculating net benefit across threshold probabilities.
Subgroup Validation
Subgroup validation was additionally conducted for safety officers, operational workers, and workers classified according to high and low hazard exposure. Because these subgroup analyses were conducted within the same study sample and some subgroup sizes were relatively small, the subgroup results were considered exploratory assessments of internal consistency rather than independent external validation.
Comparative Benchmarking
Baseline models (Logistic Regression, Naive Bayes, Random Forest) were trained and evaluated on the same training-test split.
Overfitting Assessment
Overfitting was assessed by comparing training vs. test performance, penalized likelihood scoring with regularization coefficient λ = 0.047, and bootstrap validation (5000 iterations).
Ten-Fold Cross-Validation
Ten-fold stratified cross-validation was performed on the training set (n = 209) to optimize model parameters.
2.4. Data Pre-Processing and Variable Coding
The data were pre-processed to maintain quality, consistency, and multivariate modelling before statistical analysis.
2.4.1. Data Cleaning
The data set was filtered in terms of missing data, inconsistencies and outliers. List-wise deletion was used because there were a relatively small proportion of incomplete responses and the analytical methods used in this study, including factor analysis, the use of clustering algorithms and the use of Bayesian Network modelling, require complete observations for accurate estimation. This method allowed for consistency in all analyses and only included cases that had complete data for the variables of interest. The method however, is based on the assumption that missing data is completely random. This assumption may not be completely met, and the exclusion of incomplete data can lead to loss of statistical power, as well as possible biases in parameter estimates. The amounts of missing data observed were small, so their overall impact on the results was assumed to be negligible. To ensure complete transparency regarding sample size, it is noted that the first survey had 316 responses, and the data were of a consistent type. The responses that contained missing or inconsistent data across the key analytical variables were, however, excluded by listwise deletion due to the nature of the complete-case requirements of the factor analysis, clustering algorithms and Bayesian Network modelling. There were 18 incomplete cases but these were excluded from the data cleaning and a final valid analytical sample of N = 298 remained for analysis. All further statistical results, whether clustering distributions or Bayesian Network probabilities, were drawn from this last sample of 298 respondents.
2.4.2. Handling of Categorical and Ordinal Data
Given that the study primarily involved categorical and ordinal variables, all responses were standardised into structured formats suitable for analysis. Ordinal variables, such as perceptions of safety adequacy, were preserved in their ranked form where applicable.
2.4.3. Variable Coding
All variables were transformed into numerical representations to facilitate statistical modelling:
Binary variables were coded as
Yes = 1, No = 0
Ordinal variables were coded in ascending order to reflect intensity or level.
Nominal categorical variables were encoded using integer labels for clustering analysis.
This coding scheme ensured compatibility with K-modes clustering and Bayesian Network modelling.
2.4.4. Data Transformation for Clustering
To perform clustering analysis, the categorical variables were preserved in their natural qualitative form, which is the requirement of the K-modes algorithm, which measures dissimilarity by simultaneously matching categories and not by Euclidean distance.
2.4.5. Discretization for Bayesian Network Modelling
To enable probabilistic modelling, selected variables were discretized into meaningful states:
- Workplace hazards: Low, High;
- Accident occurrence: Yes, No;
- Health issues: Present, Absent;
- Preventive actions: Taken; Not taken.
This discretization facilitated the estimation of conditional probability tables and improved the interpretability of the Bayesian Network.
The conceptual and methodological approach for analysing the occupational health and safety risks in the Ghanaian mining sector is presented in Figure 2. It is based on the safety hazard, worker training and environmental exposure literature. A quantitative approach is taken in the study to fill the gaps in the probabilistic accident risk modelling for equipment and environmental factors. The analysis uses a combination of K-modes clustering and Hierarchical clustering to define worker clusters with unique risk patterns, and Bayesian Network modelling to assess the probabilistic relationships and conditional dependencies among these variables. The multi-method approach yields holistic information, supporting enhanced safety measures and risk reduction in the mining sector.
Figure 2.
Conceptual and methodological framework for analysing occupational health and safety risks in Ghanaian mining.
3. Results
3.1. Overview of Results and Research Question Mapping
This section presents the results of the study organized according to the four research questions that guided the investigation. The results are presented in the following sequence: (1) demographic characteristics of respondents and instrument validation (RQ1, RQ2); (2) factor analysis results identifying latent OHS dimensions (RQ1); (3) clustering results identifying worker safety profiles (RQ2); (4) Bayesian Network results showing probabilistic dependencies and conditional relationships (RQ3); and (5) validation results assessing model performance and stability (RQ3, RQ4). The Discussion section then interprets these findings and addresses the broader implications for OHS management in Ghana’s mining sector (RQ4).
Table 1 presents the comparison between the target and achieved sample proportions across different worker categories, revealing substantial deviations from the intended sampling distribution. The achieved sample was dominated by safety officers, who accounted for 63.8% (n = 190) of respondents compared with the targeted 25% (n = 75), representing a positive deviation of 38.8 percentage points. In contrast, underground miners were underrepresented, with only 10.7% (n = 32) achieved compared with the targeted 30% (n = 89), resulting in a deviation of −19.3 percentage points. Surface workers and supervisors/managers also recorded lower-than-target representation, with deviations of −10.2 and −9.3 percentage points, respectively. These differences indicate a potential sampling imbalance, largely influenced by accessibility challenges, operational restrictions, and the limited availability of some occupational groups.
Table 1.
Target and achieved sample proportions by worker category.
Table 2 presents the reliability and content validity assessment of the survey instrument, demonstrating that the questionnaire achieved acceptable to excellent psychometric properties. The overall instrument recorded a Cronbach’s alpha coefficient of 0.82, indicating good internal consistency among the 28 items and confirming that the items reliably measured the underlying occupational health and safety constructs. At the section level, Cronbach’s alpha values ranged from 0.73 to 0.85, with the Safety Equipment section showing the highest reliability (α = 0.85), followed by Accidents, Health, and Prevention (α = 0.83), Training and Awareness (α = 0.74), and Environmental Safety and Hazards (α = 0.73). These values exceed the commonly accepted threshold of 0.70, suggesting adequate consistency across all domains. The content validity analysis further confirmed the adequacy of the instrument, with item-level content validity indices (I-CVI) ranging from 0.83 to 1.00 across all sections, indicating strong agreement among experts regarding item relevance. The scale-level content validity index averages (S-CVI/Ave) ranged from 0.92 to 0.96, with an overall S-CVI/Ave of 0.94, demonstrating excellent content validity.
Table 2.
Reliability and content validity of the survey instrument.
As presented in Table 3, the demographic characteristics of the respondents show that the majority were males (73.1%, n = 218), while females constituted 26.9% (n = 80) of the participants. Regarding age distribution, half of the respondents were within the 36 to 45 years age category (50.3%, n = 150), followed by those aged 26 to 35 years (20.1%, n = 60) and 18 to 25 years (13.4%, n = 40). Respondents aged 46 to 55 years represented 10.4% (n = 31), while the smallest proportion was recorded among those aged 56 years and above (5.7%, n = 17).
Table 3.
Demographic characteristics of respondents of a mining community in Ghana.
With respect to educational attainment, the largest proportion of respondents had tertiary education (43.3%, n = 129), followed by those with other forms of education (17.8%, n = 53) and basic education (17.4%, n = 52). Respondents with no formal education constituted 11.1% (n = 33), while those with secondary education represented the smallest educational category (10.4%, n = 31). Regarding occupational roles within the mining sector, safety officers formed the majority of respondents (63.8%, n = 190), followed by surface workers (24.8%, n = 74) and underground miners (10.7%, n = 32). Managers or supervisors constituted only 0.7% (n = 2) of the respondents. In terms of work experience, the majority of participants had more than six years of experience in the mining industry (61.1%, n = 182), followed by those with 1 to 3 years of experience (17.4%, n = 52), less than one year of experience (11.1%, n = 33), and 4 to 6 years of experience (10.4%, n = 31).
3.2. Factor Analysis Results
This section addresses the first research question regarding the latent dimensions underlying OHS management practices in Ghana’s mining sector. The results of the factor analysis reveal three primary OHS dimensions: Safety Resources, Training Exposure, and Perceived Adequacy.
The Kaiser–Meyer–Olkin (KMO) of 0.580 shows that the sampling adequacy is moderate, meaning that the correlation between the variables is adequate but at the same time marginally appropriate with respect to factor analysis (Table 4). The KMO is above the acceptable level of 0.50, which means that there is shared variance; however, the data might not be producing highly defined factor structures. The Bartlett Test of Sphericity is extremely significant (χ2 = 126.781, df = 15, p < 0.001), which means that the correlation matrix is not an identity matrix and that correlation between variables by the values is statistically different.
Table 4.
KMO and Bartlett’s Test.
The total variance explained in Table 5 indicates that there are three components which meet the Kaiser criterion, each of which has an eigenvalue exceeding 1, and they collectively contribute 66.763% of the total variance. The 27.490%, 22.501%, and 16.772% of Occupational Health and Safety Management practices explain Component 1, 2, and 3, respectively; hence, showing that Occupational Health and Safety Management practices involve a multidimensional latent structure. The sums of squared loadings extracted show that these components still have large amounts of variance that have been extracted. The cumulative variance explained also rises above the traditional 60% criterion, which is a measure that confirms that the factor solution has captured a large enough percentage of the shared variance that is present amongst the observed variables.
Table 5.
Total variance explained and pattern matrix for occupational health and safety management practices.
The pattern matrix shows clear and statistically significant factor loadings. The strong loadings on provision of sufficient safety equipment (loading = 0.725), adequate maintenance of safety equipment (loading = 0.746), and effectiveness of current safety training programmes (loading = 0.736) define component 1, and therefore there is a factor that is concerned with safety resources and compliance support. Health and safety guidelines awareness loads Component 2 with a high loading of 0.805. Formal health and safety training strongly loads Component 2 with a loading of 0.770, which is a clear factor that indicates exposure to training. The opinion of perceived sufficiency of the existing safety measures places a heavy burden on Component 3, with a loading of 0.976, meaning that this is another component of perceived adequacy of the current safety measures.
3.3. Clustering Results
This section addresses the second research question regarding distinct worker safety profiles based on safety barrier conditions. The results identify three distinct worker profiles: Safe/Supported, Resource-Rich but Inadequate, and High-Risk/Unsafe.
The clustering results in Table 6 are not categories in isolation but rather emergent system states that are a result of the dynamic interaction between organisational, environmental, and individual safety factors in the mining workforce. For instance, the profile discovered in Cluster 2—the resources are there (e.g., training, PPE, and equipment maintenance), but the safety measures are felt to be inadequate—does not stem from a single isolated incident, but rather from an overall conflict between formal resource allocation and on-ground realities. Likewise, Cluster 3 represents the “dangerous” emergent condition in which unsafe environments and equipment that are not maintained significantly increase risk, showing that unsafe events do not occur in isolation, but are instead systemic failures in safety. This perspective highlights that worker safety profiles are fluid outcomes of interacting variables, rather than fixed, mutually exclusive groups that define a particular arrangement of safety-barrier conditions among the mining workforce. Cluster 1 with the highest desirable safety milieu provides consistent reports of the co-occurrence of all six conditions of safety. Such a cohort probably represents those employees who are employed in better resource-endowed or closely monitored areas of operation. Although Cluster 2 remains adequate in most conditions of safety, it differs with Cluster 1 as it indicates inadequate safety measures. This observation indicates a perceived deficiency in the quality of safety or safety provision implementation despite the presence of resources in the form of PPE, training and properly serviced equipment. This statistically is an important finding because it indicates that the presence of safety inputs may not necessarily result in perceived adequacy or operational sufficiency. Cluster 3 represents the most restrictive safety setting and respondents reported a lack of safety precautions, unsafe conditions, and un-maintained equipment. The situation with enough PPE and equipment is positive, but the fact that unsafe conditions and a lack of maintenance coexist is an indicator of high vulnerability. This cluster is statistically a high-risk group whereby failure in structural or operational conditions can compromise safety practices.
Table 6.
Cluster modes for barrier variables identified using K-Modes analysis.
The two methods of clustering provided different distributions of the workers in the three clusters, indicating that barrier grouping is sensitive to the underlying algorithm, as shown in Table 7. The K-modes method has Cluster 1, which has 208 workers as the most common pattern of barrier in the dataset. Clusters 2 and 3 have less workers in them, meaning that different barrier profiles are less common. The fact that the observations are concentrated in Cluster 1 suggests a rather homogenous group of conditions for the largest number of workers. The hierarchical clustering, on the other hand, produces a more even distribution. Cluster 2 is the largest, as it has 165 workers and Clusters 1 and 3 have 59 and 74 workers, respectively. The result of this shows that in defining similarity in terms of hierarchical distance instead of matching categorical modes the algorithm finds a new structure in the barrier patterns. The difference in the number of clusters under the two approaches suggests that the phenomenon of barriers among the workers is not necessarily categorical but can be graded on scales that are more sensitive to hierarchical processes. This statistically shows that cluster stability is context dependent, which is sensitive to the approach taken, and it indicates that the safety barriers can have more complicated patterns than those reflected by mode-based clustering.
Table 7.
Cluster membership distribution for K-Modes and hierarchical clustering.
Table 8 presents the cluster validity indices used to determine the optimal number of clusters for the data. For the K-modes algorithm, the within-cluster sum of squares (WSS) decreased steadily from 278.4 at to 112.3 at , indicating that increasing the number of clusters improved within-cluster homogeneity. However, this reduction exhibited diminishing returns after three clusters, suggesting that additional clusters provided only marginal improvements in compactness. The average silhouette coefficient for K-modes reached its highest value of 0.52 at , compared with 0.41 at , before declining consistently to 0.33 at . Since higher silhouette values indicate better cluster cohesion and separation, the peak values of three clusters provide strong evidence that the data are most naturally partitioned into three distinct groups.
Table 8.
Optimal cluster number selection criteria.
The hierarchical clustering results similarly support a three-cluster solution. The average silhouette coefficient for Ward’s hierarchical clustering attained its maximum value of 0.48 at , after which it progressively declined, indicating reduced cluster quality as more clusters were formed. Although the cophenetic correlation coefficient increased gradually from 0.79 at to 0.86 at , reflecting improved preservation of pairwise dissimilarities in the dendrogram, this measure assesses the fidelity of the hierarchical structure rather than the optimal number of clusters. Consequently, considering the highest silhouette coefficients obtained from both K-modes (0.52) and hierarchical clustering (0.48), together with the diminishing reduction in WSS beyond three clusters, the three-cluster solution was selected as the optimal partition because it achieved the best balance between cluster compactness, separation, and interpretability.
- Justification for Dual Clustering Approach and Integration with Bayesian Network
The integration of both methods follows a specific logical sequence:
- K-modes is applied first as the primary clustering method because it is theoretically most appropriate for the categorical data structure. It produces the primary cluster assignments (Table 4) and cluster modes that are directly interpretable as “worker safety profiles”.
- Hierarchical clustering is applied second as a validation and sensitivity analysis. The comparison of cluster membership distributions between the two methods (Table 5) serves as a diagnostic tool to assess whether the K-modes clusters represent a stable structure or are sensitive to the algorithm. If the cluster assignments differ substantially, this would indicate that the data structure is more complex than simple categorical matching suggests, and that the K-modes solution should be interpreted with caution.
- Agreement between methods strengthens confidence in the three-cluster solution. While the exact membership distributions differ (K-modes: Cluster 1 = 208, Cluster 2 = 26, Cluster 3 = 64; Hierarchical: Cluster 1 = 59, Cluster 2 = 165, Cluster 3 = 74), both methods identify the same underlying structure—three distinct worker profiles characterized by different combinations of safety barrier conditions. The difference in distribution is expected given the different algorithmic assumptions, but the qualitative interpretation of the profiles remains consistent.
- The cluster profiles are then integrated into the Bayesian Network (Stages 2 and 3 of the sequential framework). The cluster validation (via dual methods) and the cluster profiles (Table 4) directly inform the selection of Bayesian Network nodes (hazards, health issues, accidents, reporting, prevention) and the discretization thresholds for the probabilistic model.
Among the demographic variables examined in Table 9, only role (occupational category) showed a statistically significant association with accident occurrence (χ2 = 5.82, p = 0.016), with underground miners having the highest accident rate (40.6%). Age, gender, education, and work experience did not show statistically significant associations with accident occurrence.
Table 9.
Accident occurrence by demographic subgroups.
The results in Table 10 indicate that OHS management variables provide substantially greater predictive value for the outcome than demographic characteristics. Model 1, which included only age, gender, education, experience, and role, demonstrated weak discrimination (AUC = 0.61) and explained only 8% of the variance (Nagelkerke R2 = 0.08), with a relatively high AIC of 387.2, indicating limited model fit; furthermore, role was the only statistically significant demographic predictor. In contrast, Model 2, comprising workplace hazards, health issues, reporting, and prevention, showed a marked improvement in predictive performance, with an AUC of 0.79 and Nagelkerke R2 of 0.31, indicating strong discrimination and that approximately 31% of the variation in the outcome was explained by the model, while its substantially lower AIC of 341.8 indicates better model fit. Model 3, which combined demographic and OHS management variables, produced only a marginal increase in AUC from 0.79 to 0.80 and Nagelkerke R2 from 0.31 to 0.32, while its AIC increased slightly to 343.6, suggesting that the inclusion of demographic variables did not materially improve model performance.
Table 10.
Logistic regression models comparing demographic and OHS management predictors.
3.4. Bayesian Network Results
This section addresses the third research question regarding how workplace hazards, health issues, accident reporting methods, and preventive actions conditionally relate to accident probability. The Bayesian Network results reveal the probabilistic dependencies among these variables and their conditional relationships with accident occurrence.
Table 11 shows the model summary of a statistically strong and fully optimised Bayesian network structure. The network also contains five nodes and ten directed arcs with no undirected links and is a fully connected directed graph, thus the average Markov blanket and neighbourhood size is 4.00, which implies that each node is conditionally dependent on all others. The Hill Climbing algorithm was used on sixty conditionally independent tests and it reached an optimised structure with an average branching factor of 2.00, indicating moderate complexity. A strict regularisation of the model at learning was done to prevent over-fitting using the Penalised Node-Average Likelihood scoring function, with a coefficient of 0.047, to ensure that the learnt arc relationships are robust and reliable in the form of probabilistic dependencies that can be used to make inference about the dynamics of workplace safety.
Table 11.
Bayesian Network learning summary.
The performance of the predictive model on the test set is shown in Table 12, and is found to have good discriminatory ability and reasonable calibration in the test set. The model showed an AUC-ROC of 0.83 (95% CI: 0.77 to 0.89), which is better than the widely accepted threshold of 0.80 as it means that the model discriminates well between workers who suffer occupational accidents and those who do not. Likewise, the AUC-PR of 0.76 (95% CI: 0.69 to 0.83) indicates a good trade-off between precision and recall, underscoring the model’s ability to detect positive cases even in the presence of class imbalance. Finally, a comparison of calibration statistics shows that the probabilities predicted were very similar to the actual probabilities. The Brier Score (0.17; 95% CI: 0.14 to 0.20) was well below the acceptable value of 0.25 and the Brier Skill Score (0.29) showed a significant improvement over a baseline prediction model. Moreover, the calibration slope of 0.95 (95% CI: 0.82 to 1.08) was close to the ideal value of 1.00, and the calibration intercept of −0.06 (95% CI: −0.32 to 0.20) was close to zero, indicating minimal overestimation or underestimation of risk. The model was further validated with the non-significant Hosmer–Lemeshow goodness-of-fit test (χ2 = 7.84, p = 0.45), where no statistical difference was found between the expected and observed probabilities of accident. The other classification performance metrics also support the practical application of the model for predicting occupational accidents. The overall accuracy of the model was 79% (95% CI 0.73 to 0.85), meaning that almost four-fifths of the cases were correctly classified. The sensitivity of 0.76 (95% CI: 0.68 to 0.84) means that the model was successful in identifying 76% of those that suffered an occupational accident, while the specificity of 0.82 (95% CI: 0.75 to 0.89) showed that 82% of those that did not suffer an occupational accident were correctly identified. In addition, the precision of 0.73 (95% CI: 0.65 to 0.81) suggests that about three-quarters of the workers for whom an accident was predicted actually had an accident, reducing the number of false-positive predictions. An F1 score of 0.74 (95% CI: 0.67 to 0.81) reflects good balance of precision and sensitivity, indicating excellent predictive ability on both the positive and negative side. Finally, the negative predictive value (NPV) of 0.84 (95% CI: 0.77 to 0.91) suggests that the model is reliable at determining low-risk workers.
Table 12.
Test set performance metrics.
The predictive performance of the Bayesian Network on the training and held-out internal test sets was compared in Table 13 to assess potential overfitting and internal predictive stability. The results show relatively small differences between the training and test sets. Specifically, the AUC-ROC value for the held-out test set decreased by 0.03 compared with the training set, from 0.86 to 0.83, while the Brier Score increased from 0.15 to 0.17. These results indicate limited performance degradation under internal hold-out validation. Because the training and test observations originated from the same cross-sectional study sample, this comparison provides evidence of internal predictive stability but does not establish external predictive validity or generalizability to independent populations. Likewise, the Brier Score rose from 0.15 to 0.17, which is a difference of 0.02, supporting good calibration and predictive performance on observations withheld from model fitting within the present study sample.
Table 13.
Comparison of training vs. test performance (overfitting assessment).
The model performs consistently across all subgroups, with AUC-ROC ranging from 0.80 to 0.85 and accuracy from 0.76 to 0.82 (Table 14). The slightly lower performance in the high-hazard exposure subgroup (AUC = 0.80) is expected, as this group has higher baseline risk and less variation in outcomes. The consistency of performance across safety officers and operational workers suggests that the model’s probabilistic associations are not solely driven by the overrepresentation of safety officers in the sample. This provides evidence that the model captures genuine patterns in the data rather than artifacts of the sampling distribution.
Table 14.
Subgroup validation performance.
Table 15 shows a comparison of the performance of the Bayesian Network (BN) model with the traditional baseline models such as Logistic Regression, Naive Bayes, and Random Forest. Within the held-out internal test set, the Bayesian Network demonstrated the strongest overall predictive performance among the evaluated models, with an AUC-ROC of 0.83, the lowest Brier Score of 0.17, the highest accuracy of 79%, and the highest F1-score of 0.74, reflecting the best discrimination, calibration and classification balance. The BN model achieved better discrimination, which was statistically significantly compared to Logistic Regression (0.07 higher AUC-ROC, p = 0.02), and better calibration and classification performance. The BN model also demonstrated greater advantages than Naive Bayes with a 0.10 higher AUC-ROC (p < 0.01) as well as smaller prediction error, higher accuracy and higher F1-score. The BN model outperformed the RF model, but the improvement in the AUC-ROC was not statistically significant (p = 0.08) and the discrimination obtained was comparable. These comparative results indicate superior internal predictive performance under the present validation framework and should not be interpreted as evidence of superior performance in independent populations.
Table 15.
Comparative benchmarking: Bayesian Network vs. baseline models.
As can be seen in Table 16, the results of the 5000 bootstrap validation runs provide evidence of the stability and reliability of the conditional relationships estimated by the model. The means from the bootstrap were close to the original model estimates in each conditional event, suggesting that there is little bias and that the probabilities of the Bayesian network are consistent in each conditional event. For instance, the estimated probability of an accident under high hazard conditions was 0.453, the bootstrap mean was 0.448, and there was a narrow 95% confidence interval of 0.431 to 0.465, indicating a stable and reliable estimate. By comparison, the probability of an accident under low hazard conditions was significantly lower (model estimate 0.216; bootstrap mean 0.219; 95% CI 0.208 to 0.230), further supporting the strong impact of hazard level on the risk of an accident. The probability of health problems in the workers who were exposed to high hazards also remained constant, with a value of 0.242 and a bootstrap mean of 0.245 (95% CI: 0.233 to 0.257). The conditional likelihood of the safety review action, given formal reporting, was highest (model estimate = 0.687; bootstrap mean = 0.691; 95% CI: 0.674 to 0.708), indicating that there was good consistency between formal reporting and subsequent safety review actions. The width of the narrow bootstrap intervals was 0.022 to 0.034 for each conditional probability for all conditional probabilities, which indicates low estimation uncertainty and suggests that the conditional probabilities of the Bayesian Network are not very sensitive to sampling variation.
Table 16.
Bootstrap validation of conditional probabilities (5000 iterations).
The comprehensive internal validation results in Table 17 demonstrate good predictive performance of the Bayesian Network within the present study sample. The model achieved good discrimination (AUC-ROC = 0.83), well-calibrated probabilities (Brier Score = 0.17), and consistent performance across the internal validation procedures. The model also demonstrated stronger internal predictive performance than the Logistic Regression and Naive Bayes benchmark models and comparable performance to Random Forest under the same validation framework. These findings indicate that the Bayesian Network provides useful predictive discrimination for identifying accident risk within the present study sample. However, because all observations originated from the same cross-sectional survey, these results constitute internal validation and do not establish external predictive validity or generalizability to independent populations.
Table 17.
Summary of model validation results.
The conditional probabilities shown in Table 18 demonstrate a statistically significant relationship between Workplace Hazards and Work Accident Occurrence. The data shows that the probability of an accident, P (Accident Occurred|High Hazards) = 0.453, is more than double the probability of P (Accident Occurred|Low Hazards) = 0.216. This represents a relative risk of approximately 2.1, indicating that working under high-hazard conditions substantially increases the likelihood of an accident occurring. Conversely, the probability of no accident, P (No Accident|High Hazards) = 0.547, is markedly lower than P (No Accident|Low Hazards) = 0.784. This strong, direct association quantitatively confirms that the level of workplace hazards is a critical predictor for accident risk, underscoring the paramount importance of hazard control as a primary mitigation strategy.
Table 18.
Conditional probability of work accident occurrence given workplace hazard level.
Two of the main conditional probabilities that outline different risk pathways in the safety model are summarised in Table 19. The conditional probability P (Health Issues\mid High Workplace Hazards) = 0.242 refers to a moderate baseline risk; high-hazard environment conditions predict that 24.2 percent of people have health issues. More significantly, the value of P (Safety Review Taken, Formal Accident Reporting) = 0.687 suggests that the procedure involved is largely dependent, such that formal reporting is an influential indicator of a safety review being initiated, with 68.7% probability that this type of mitigating measure will be adopted. This shows that even though workplace hazards have a direct impact on health outcomes, the system of accident reporting is an extremely important and powerful node that can initiate systematic risk-reduction reactions.
Table 19.
Conditional probabilities for mitigation pathways and health risk.
3.5. Bayesian Network Validation Results (Addressing RQ3 and RQ4)
This section presents the validation results for the Bayesian Network, providing evidence of model stability and predictive capability (RQ3) and supporting the interpretation of the safety system as reactive (RQ4). Figure 3 is the validated Bayesian Network showing key probabilistic dependencies in workplace safety.
Figure 3.
Internally validated Bayesian Network illustrating key probabilistic dependencies in workplace safety.
Table 20 presents the bootstrap validation results for the stability of Bayesian Network arc strengths based on 5000 iterations, demonstrating that the identified relationships among variables are highly reliable and robust. All network arcs showed very high model strength values ranging from 0.96 to 1.00, with bootstrap mean estimates closely matching the original model strengths, indicating minimal sampling variability and the strong consistency of the learned dependencies. The arc between Health Issues Experienced and Accident Reporting Method showed the highest stability, with a model strength of 1.00, bootstrap mean of 0.994, 100% arc presence, and 99.6% direction consistency, suggesting an almost certain and consistently reproduced relationship across bootstrap samples. Similarly, the relationship between Health Issues Experienced and Prevention Steps Taken demonstrated perfect arc presence (100%) and very high direction consistency (99.5%), confirming its robustness. Other relationships, including Workplace Hazards and Accident Reporting Method and Health Issues Experienced and Workplace Hazards, also exhibited strong stability, with arc presence exceeding 99% and direction consistency above 99%. The narrow 95% confidence intervals for all arc strengths, ranging from 0.931 to 1.000, further indicate low uncertainty in the estimated network structures.
Table 20.
Bootstrap validation of arc strengths (5000 iterations).
4. Discussion
The scientific novelty of this study lies not in the mere combination of PCA, clustering, and Bayesian networks, as such combinations have appeared in the safety engineering literature [28,29,30], but in the depth of their integration and the uniqueness of their application. Unlike previous studies that focused solely on descriptive statistics, regression models, or isolated clustering methods, this study integrates dimensionality reduction, worker profiling, and probabilistic Bayesian Network modelling into a unified framework for predictive OHS assessment.
The methodological novelty and contribution of this study is that it integrates both categorical clustering (K-modes and Hierarchical) and probabilistic Bayesian Network Modelling in order to progress beyond a descriptive, lagging indicator evaluation of occupational health and safety (OHS) in the Ghanaian mining sector. This study differs from previous research that estimates only simple logistic regressions or one-off compliance audits and establishes the relationships between the latent safety constructs, various worker profiles and accident outcomes, while taking the conditional dependencies and probabilistic pathways between these constructs into account.
The comprehensive internal validation framework employed in this study, including held-out internal test-set evaluation (AUC = 0.83, 95% CI: 0.77–0.89), calibration analysis, decision curve analysis, comparative benchmarking against Logistic Regression (ΔAUC = +0.07, p = 0.02) and Naive Bayes (ΔAUC = +0.10, p < 0.01), and bootstrap stability analysis, provides evidence of robust predictive performance within the study sample. The distinction between internal predictive performance and external predictive validity is important when interpreting the Bayesian Network. The observed AUC-ROC of 0.83, Brier Score of 0.17, and classification metrics demonstrate useful predictive performance for observations withheld from model fitting within the present dataset. The relatively small reduction in AUC-ROC from the training set (0.86) to the held-out test set (0.83), together with the cross-validation and bootstrap results, provides evidence of internal model stability. Nevertheless, these procedures cannot establish how the model would perform in an independent mining population. Consequently, the present findings should be regarded as preliminary evidence of predictive utility within the study context, with external validation required before broader predictive deployment.
The three different types of workers identified, including those who work under supportive conditions, those who have resources but believe that safety measures are not effective enough, and a very vulnerable group at risk of unsafe conditions, demonstrate that the situation with safety in the sector is rather complicated. This segmentation offers empirical data that the fact of offering safety equipment is not sufficient to ensure effective protection and better safety results. The current observation is in line with the existing literature that highlights the importance of enforcement of safety interventions, situational circumstances and employee perception over the availability of resources on their own.
The composition of the study sample may also have affected the pattern of occupational health and safety practices observed. The number of safety officers represented was larger than operational mining personnel and supervisory staff. Safety officers are generally more aware of the organisation’s safety policies, reporting guidelines, hazard identification procedures and regulatory compliance needs. This may have resulted in their responses having influenced the relative prominence found in the formal safety structures, training exposure, equipment provision, and accident reporting pathways. However, the experiences of the frontline workers who are directly exposed to the operational dangers are likely not to be recorded to the same degree. This imbalance could partially explain the salience of the training-related and compliance-related dimensions found in the factor analysis and the high reporting and prevention paths present in the Bayesian Network model. The results must therefore be considered to reflect conditions in occupational health and safety and the sample is weighted towards those who have been given dedicated health and safety responsibilities.
Particularly, it was revealed by [6,7] that the rate of compliance with safety precautions, such as the use of personal protective equipment, depends greatly on the conditions in the workplace and the perceived efficacy of safety measures. The current research confirms this claim by showing that in the very conditions where safety resources are provided, the perceived inadequacies still remain, which implies implementation and operational efficiency gaps. In addition, the probabilistic modelling will provide valuable information on the structural behaviour of safety systems in the mining industry. The findings of the Bayesian Network show that all the hazards in the workplace, the existence of accidents, reporting protocols, and health consequences have significant dependencies. It is important to note that the results suggest that safety interventions and preventive measures are mostly aroused after the accidents or development of health problems have taken place. This is indicative of a reactive safety culture, in that organizational responses take place as a result of incidents and not in anticipation of risk. This finding is consistent with the general mining safety systems literature, which has continued to emphasize the dependence of the sector on lagging indicators. Studies such as [14] and reports by [13] have established systemic flaws in proactive risk management, as well as overreliance on reactions to incidents. The present research builds on this knowledge by providing quantitative support by usage of probabilistic modelling where the reactive patterns are shown to be ingrained in the relationships among the important safety variables. Moreover, even though an earlier study such as [22] has recommended the use of predictive models to pioneer leading indicators of risk, the present study empirically supports its use in the Ghanaian setting. The Bayesian model shows how predictive relationships can be employed to predict the probability of accidents, inform preventative measures and provide a way of moving away from reactive to proactive safety management.
Furthermore, interpreting the ‘Cluster 2’ paradox and the deeply entrenched reactive reporting behaviours through contemporary safety paradigms reveals a critical need to transition away from linear models of accident causation. As [31] postulate, safety failures within such environments are not simplistic, Newtonian cause-and-effect events, but rather emergent properties of complex socio-technical systems. The disconnect between the physical provision of safety resources and the workers’ perceived efficacy perfectly exemplifies this complexity, demonstrating that physical compliance alone cannot guarantee operational safety. Addressing these emergent vulnerabilities therefore requires an evolution towards organisational systems thinking, which repositions mine safety from a hazard-centric view to a holistic organisational imperative [32]. By mapping these non-linear, probabilistic pathways, the present study equips safety managers with the leading indicators necessary to navigate this complexity, proving that sustainable safety improvements in the mining sector depend on continuous, proactive organisational adaptation rather than isolated physical interventions.
In addition, it is important to carefully consider the implications of uncertainty propagation in this probabilistic framework when it comes to mine safety decision making. The uncertainty in the input nodes (especially those based on self-reported hazard perceptions and health problems) flows through the directed arcs and can lead to a large increase in the variance of the final conditional probability estimates for the applied Bayesian Network. The model is based on cross-sectional survey results and the resulting propagated uncertainty means that management must take the output probabilities as probabilistic indications of risk zones, rather than as absolute, deterministic predictions. These predictive models thus represent a strong, empirical basis for systemic vulnerability assessments and interventions, but should complement rather than supplant expert judgment in complex, dynamic mining systems. To make informed decisions that adequately address the uncertainty inherent in the mining environment, the safety manager and occupational health professionals must combine these probabilistic insights with their contextual, on-site expertise, operational telemetry and real-time environmental monitoring.
4.1. Conclusions
This study has identified the multidimensional and complex nature of occupational health and safety practices in the mining industry in Ghana, while the configuration of organizational systems, worker behaviour, and the capacity of the OHS measures to be adopted are associated with differences in OHS practices in the mining industry. The methodology adopted in this study, which involved the identification of latent constructs using a PCA approach, segmentation of the workforce into segments using a clustering approach and finally, the assessment of the probabilistic risk using a Bayesian Network, is a methodological improvement on previous OHS research in the mining sector in Ghana. This study integrates dimensionality reduction, worker profiling, and probabilistic Bayesian Network modelling into a unified framework for predictive OHS assessment, in contrast to previous studies that have considered these in isolation or only in terms of descriptive statistics.
The scientific novelty of this work is: (1) the depth of quantitative integration across analytical stages with demonstrated statistical associations; (2) the unified theoretical framework relating structure discovery, segmentation and risk quantification; (3) the first application of this integrated approach to Ghanaian mining OHS; and (4) the comprehensive empirical validation of the robustness and internal predictive stability of this framework. Workers’ safety profiles have been differentiated and it has been determined that even if there are safety resources for workers, there are gaps in perception and application.
The study also shows that the current safety system is reactive because the safety measures taken are generally taken after the occurrence of accidents or health complications. It was also concluded that workplace hazards are important factors associated with the likelihood of an incident occurring, while health conditions are important factors influencing responses to and reporting of incidents.
4.2. Recommendations
The recommendations derived from this study are directly grounded in the specific probabilistic and clustering results presented, moving beyond intuitive assumptions to data-driven interventions:
- Transition to anticipatory hazard management based on probabilistic risk thresholds. The Bayesian Network (Table 18) demonstrates that high-hazard environments more than double the probability of an accident (from 0.216 to 0.453). Furthermore, Table 20 reveals a strong, reactive dependency between ‘Work Accident Occurred’ and ‘Prevention Steps Taken’ (Strength = 0.96). To break this incident-driven cycle, management must institute predictive hazard inspections and continuous environmental monitoring before the probability threshold of an accident escalates, rather than activating preventative measures only after an incident is logged.
- Implement proactive occupational health monitoring as a leading indicator. The modelling results (Table 20) uniquely identify ‘Health Issues Experienced’ not merely as an outcome, but as a critical predictive driver, with near-definite arc strengths (0.98–1.00) directing ‘Accident Reporting Method’ and ‘Prevention Steps Taken’. This indicates that the current safety system relies on workers experiencing health complications to trigger formal reporting (Table 19: 68.7% probability of safety review given formal reporting). Companies must therefore expand occupational health services to include mandatory, routine medical examinations and health tracking, using physiological vulnerabilities as a leading indicator to suppress threats before they manifest as reportable accidents.
- Enforce rigorous equipment maintenance protocols, not just provision. Factor analysis (Table 5) identified that safety performance is a multidimensional construct where ‘adequate maintenance of safety equipment’ (loading = 0.746) is a distinct and critical component alongside mere provision (loading = 0.725). This is empirically validated by K-modes clustering (Table 6, Cluster 3), which isolates a high-risk worker profile where ‘PPE Provided’ is ‘Yes’, but ‘Equipment Maintained’ is ‘No’, co-occurring with unsafe conditions. Mine operators must therefore enforce strict, routine maintenance cycles and proactive replacement schedules, as the mere presence of equipment does not mitigate risk if it is unmaintained.
- Focus on policy implementation and perceived adequacy over mere resource allocation. The clustering results provide a strong, non-intuitive justification for this recommendation. K-modes analysis (Table 6, Cluster 2) identified a distinct worker profile where ‘Training Received’, ‘PPE Provided’, and ‘Equipment Sufficient’ are all ‘Yes’, yet ‘Measures Adequate’ is ‘No’. This statistically proves that the physical supply of resources does not inherently translate to a safe working environment or perceived operational safety. Management must move beyond provisioning by actively evaluating the practical implementation of safety policies, enhancing ground-level safety communication, and fostering a culture of compliance through supportive supervision, thereby addressing the implementation gaps identified in Cluster 2.
4.3. Implementation Framework for Bayesian Risk Monitoring in Mining Operations
To translate the probabilistic model developed in this study into practical safety management practice, this section provides a framework for mining companies to implement Bayesian risk monitoring. The framework addresses the technical, operational, and organizational requirements for effective deployment.
4.3.1. Required Software and Technical Infrastructure
The Bayesian Network model can be implemented using open-source or commercial software, depending on the company’s technical capacity and resources:
| Software/Tool | Type | Description | Suitability |
| R (bnlearn package) | Open-source | Comprehensive Bayesian Network library with structure learning, parameter estimation, and inference capabilities | Ideal for companies with in-house data science capability; free and widely supported |
| Python (pgmpy library) | Open-source | Bayesian Network library for probabilistic graphical models | Suitable for integration with existing Python-based data pipelines; active community support |
| Bayesialab | Commercial | Professional Bayesian Network software with GUI and automation features | Suitable for companies without dedicated programming expertise; includes visualization and reporting |
| Netica | Commercial | User-friendly Bayesian Network software with GUI | Good for prototyping and demonstration; easy to use for safety managers |
| Microsoft Azure Machine Learning | Cloud-based | Enterprise-grade platform with Bayesian Network capabilities | Suitable for large mining companies with cloud infrastructure; integrates with existing enterprise systems |
- Minimum Technical Requirements:
- (a)
- Hardware: Standard desktop computer (8 GB RAM minimum, 16 GB recommended) for model execution; server deployment for enterprise-wide implementation.
- (b)
- Database: Structured database (SQL) for storing survey responses, inspection data, and accident records.
- (c)
- Data Collection: Mobile or tablet-based survey applications for field data collection; integration with existing incident reporting systems.
- (d)
- Training: Basic training in Bayesian Network interpretation for safety managers and OHS personnel.
4.3.2. Recommended Inspection Frequency and Risk Monitoring Schedule
Based on the probabilistic risk estimates from the Bayesian Network model, we recommend a risk-stratified inspection and monitoring schedule:
| Risk Level | Probability of Accident | Recommended Inspection Frequency | Monitoring Actions |
| High Risk | P(Accident) > 0.40 | Weekly | Daily hazard checks; immediate corrective actions; health monitoring; supervisor review of safety protocols |
| Moderate Risk | 0.25 ≤ P(Accident) ≤ 0.40 | Bi-weekly | Weekly safety observations; equipment maintenance checks; training reinforcement; near-miss reporting |
| Low Risk | P(Accident) < 0.25 | Monthly | Standard safety inspections; routine equipment maintenance; periodic refresher training |
- Dynamic Risk Monitoring
- Trigger-based inspections: When P(Accident) increases by >15% from previous assessment, immediate investigation is triggered
- Quarterly model updates: Update the Bayesian Network with new data (accidents, health reports, inspection outcomes) to maintain model accuracy
- Annual model recalibration: Full recalibration of the model using the most recent data to ensure continued validity
4.3.3. Integration with Existing OHS Management Systems
The Bayesian risk monitoring framework can be integrated with existing OHS management systems through the following pathways:
- Integration Point 1: Incident Reporting Systems
- The model’s predicted risk probabilities can automatically flag high-risk workers or areas for enhanced monitoring.
- When an accident is reported, the system can update the Bayesian Network with new evidence, recalculating risk probabilities for similar conditions.
- Formal accident reporting (Table 16, 68.7% probability of safety review) should trigger automated risk recalculations.
- Integration Point 2: Equipment Maintenance Systems
- The model’s finding that equipment maintenance is a critical factor (loading = 0.746) suggests integration with Computerized Maintenance Management Systems (CMMS).
- Maintenance records can be input as evidence to update risk probabilities.
- Alerts can be generated when maintenance is overdue, particularly for high-risk equipment as identified by the clustering analysis (Table 6, Cluster 3).
- Integration Point 3: Health Monitoring Systems
- Given that “Health Issues Experienced” is the most critical predictive driver (arc strength 0.98–1.00, Table 20), integration with occupational health databases is essential.
- Routine medical examinations should feed into the risk assessment system.
- Workers with identified health issues should be flagged for enhanced monitoring.
- Integration Point 4: Training Management Systems
- Integration Point 5: Safety Inspection Systems
- The model’s hazard perception dimension (Table 5, Component 3, loading 0.976) should be linked to workplace inspection systems.
- Inspection results (e.g., environmental safety, hazard presence) can update the model’s Workplace Hazards node.
- The clustering profiles (Table 6) can guide targeted inspections for specific worker groups.
4.3.4. Step-by-Step Implementation Guide
For mining companies wishing to implement the Bayesian risk monitoring framework, the following step-by-step process is recommended:
- Phase 1: Preparation (Months 1–3)
- Establish baseline data: Collect historical accident records, incident reports, and health data for at least 12–24 months.
- Conduct baseline survey: Administer the validated questionnaire to establish the current risk profile of the workforce.
- Install software: Set up the chosen Bayesian Network software.
- Configure database: Establish database connections for integration with existing systems.
- Phase 2: Model Deployment (Months 3–4)
- 5.
- Validate model on local data: Test the Bayesian Network on the company’s historical data to ensure calibration.
- 6.
- Train safety personnel: Provide training on interpreting risk scores and conditional probabilities.
- 7.
- Establish baselines: Calculate baseline risk profiles for each worker category and operational area.
- 8.
- Set up automated reporting: Configure automated reports for weekly, bi-weekly, and monthly monitoring.
- Phase 3: Implementation (Months 4–6)
- 9.
- Begin routine data collection: Implement regular data collection according to the inspection schedule.
- 10.
- Monitor and adjust: Review risk scores and inspection findings; adjust inspection frequency based on observed patterns.
- 11.
- Update model quarterly: Refine the Bayesian Network with new data to maintain accuracy.
- 12.
- Evaluate and scale: Assess the effectiveness of the framework; scale to additional operational areas or sites.
- Phase 4: Continuous Improvement (Ongoing)
- 13.
- Annual model recalibration: Full recalibration of the model using all accumulated data.
- 14.
- Update questionnaire: Periodically review and update the questionnaire to capture emerging risk factors.
- 15.
- Enhance integration: Expand integration with additional OHS systems (e.g., fatigue management, environmental monitoring).
- 16.
- Share best practices: Contribute to industry-wide learning by sharing implementation experiences.
5. Study Limitations
This study has several limitations that should be taken into account when considering its results. The Kaiser–Meyer–Olkin (KMO) measure of sampling adequacy was 0.580, which is above the acceptable level of 0.50 but below the recommended level of 0.70. This means that there is enough overlapping variance between variables to make factor analysis a viable procedure, but not enough to strongly define the factor structure. The three-factor solution found by PCA must be carefully interpreted. The marginal KMO value indicates that the observed variables are not as well intercorrelated as would be desired to support a good factor structure; some of the variance accounted for by the factors found by factor analysis could be due to sampling variability and not to actual variance in the underlying constructs. Future study could focus on increasing the numbers of items measuring each construct or using different methods of sampling to ensure the sampling is adequate. Although the KMO value was close to the critical value, the factor analysis was still considered to be valid for the following reasons. First of all, the KMO value was higher than the minimum acceptable value of 0.50 and thus factor analysis is appropriate for the data. Second, the Bartlett’s Test of Sphericity was highly significant (χ2 = 126.781, df = 15, p < 0.001), which meant that the matrix of correlations is not an identity matrix, and that the variables are sufficiently correlated for factor extraction. Third, the three factors extracted accounted for 66.8% of the total variance, which is above the 60% rule, indicating that the factor solution accounts for a large percentage of the common variance. Fourth, all the factor loadings were greater than 0.70, which meant that they loaded clearly onto the factors. The marginal KMO value indicates the complexity of measuring the constructs of OHS, which in their turn are multifaceted and can be affected by various operational, organizational and individual factors. Secondly, for the clustering analysis, the three-cluster solution was supported with several validation indices. The best average silhouette (0.52) was obtained by K-modes algorithm at k = 3, while in the case of k = 2, the average silhouette was 0.41. The maximum average silhouette coefficient from the hierarchical clustering was also k = 3 (0.48). Further, the elbow method showed that the within-cluster sum of squares (WSS) dropped by 28.6 units when k was increased from 3 to 4, and by 79.7 units when k was increased from 2 to 3. This steadily decreasing return after three clusters suggests that adding further clusters results in only slight enhancements in cluster compactness. The cophenetic correlation coefficient (k = 3, 0.81) also shows that the hierarchical dendrogram is a good representation of the original dissimilarity structure. The agreement of the results of the K-modes and hierarchical clustering of the number of clusters (k = 3) does support that the three-cluster solution is a meaningful and stable segmentation of the workforce and is not an artifact of the clustering algorithm.
Safety officers were the most numerous group (63.8%) with underground miners following at 10.7% and managers/supervisors at 0.7%, indicating a non-even distribution of the sample. This imbalance might have caused respondent perspective bias, because occupational health and safety practices may be different in various occupational groups. A sensitivity analysis and a balanced subsampling analysis showed, however, that the underlying probabilistic relationships found in the model were stable, even when the sample composition varied. The study was based on self-reported data, and this may be subject to perception bias, social desirability bias, and recall bias. Self-reported data may be a useful source of information on workers experiences and their perception of safety in the workplace; however, it does not always capture the actual environment or safety behaviours in the workplace. Future study should take into account the inclusion of objective safety indicators (accident record, injury report, compliance audit results, operational safety data, etc.) along with self-reported indicators in order to better understand occupational health and safety practices. There were also some limitations in the validation process. The 70/30 split between train and test was very strict and provided a good test for the performance of the models, but the test set was not large (n = 89). An external validation data set would be useful to provide additional evidence of generalisability and applicability of the model, especially if it is from a different mining site.
In addition to this, the model was developed and validated using cross-sectional survey data rather than prospective longitudinal data. Consequently, temporal ordering among the observed variables cannot be established, and the identified relationships should therefore be interpreted as probabilistic associations rather than probabilistic dependencies and statistical associations. In terms of novelty and generalisability, this study introduces a novel analytical framework for evaluating occupational health and safety in mining in Ghana. Other safety engineering applications of the individual methods (PCA, clustering, and Bayesian networks) exist, however. The value added by this study is the depth of quantitative integration between these analytical stages, the statistical linkages between latent constructs, worker profiles and risk outcomes, the development of a framework that brings together the process of structure discovery, segmentation and risk quantification in the OHS assessment process, and the first application of this integrated approach in the OHS assessment process in the Ghanaian mining sector. These limitations should be addressed in future studies by using more representative and more balanced (in terms of occupations) samples, by including objective safety outcomes in addition to self-reported data, and by using more sophisticated methods of validation (such as k-fold cross-validation and extensive bootstrapping procedures). In addition, scale-specific models need to be developed to differentiate between large-scale mining and artisanal and small-scale mining (ASM) activity and, for stronger assessment of temporal relationships and potential probabilistic dependency in occupational safety outcomes over time, longitudinal and, where feasible, quasi-experimental or other appropriate prospective research designs should be used.
Author Contributions
Conceptualization, P.O.-A. and S.K.W.; data curation, A.J.F.; formal analysis, E.T.A.; investigation, P.O.-A. and S.K.W.; methodology, P.O.-A. and E.A.; resources, P.O.-A. and A.J.F.; validation, E.A.-S. and E.T.A.; writing—original draft, E.A. and E.A.-S.; writing—review and editing, S.K.W., E.A. and A.J.F. All authors have read and agreed to the published version of the manuscript.
Funding
This research received no external funding.
Institutional Review Board Statement
The study was conducted in accordance with the Declaration of Helsinki, and approved by the Institute of Research, Innovation and Development of Kumasi Technical University (Ref. No: IRID/EC2025/HSO092, 5 June 2025).
Informed Consent Statement
Informed consent was obtained from all subjects involved in the study.
Data Availability Statement
The original contributions presented in this study are included in the article. Further inquiries can be directed to the corresponding author.
Conflicts of Interest
The authors declare no conflicts of interest.
Abbreviations
The following abbreviations are used in this manuscript:
| PCA | Principal Component Analysis |
| OHS | Occupational Health and Safety |
| PPE | Personal Protective Equipment |
| WSS | Within-cluster Sum of Squares |
References
- Boateng, F.; Wisdom, G.E.; Atiku, S.O. A time series analysis of mineral revenue and economic growth in Ghana. Cogent Econ. Financ. 2025, 13, 2465986. [Google Scholar] [CrossRef] [Scilit]
- Frimpong, F.; Kwakye, K. Determinants of Accident in the Mines: A Retrospective Statistical Analysis of Mining Accidents in Ghana. Eur. J. Public Health Stud. 2020, 3, 2. [Google Scholar] [CrossRef] [Scilit]
- Nakua, E.K.; Owusu-Dabo, E.; Newton, S.; Adofo, K.; Otupiri, E.; Donkor, P.; Mock, C. Occupational injury burden among gold miners in Ghana. Int. J. Inj. Contr. Saf. Promot. 2019, 26, 329–335. [Google Scholar] [CrossRef] [Scilit] [PubMed]
- Calys-Tagoe, B.; Ovadje, L.; Clarke, E.; Basu, N.; Robins, T. Injury Profiles Associated with Artisanal and Small-Scale Gold Mining in Tarkwa, Ghana. Int. J. Environ. Res. Public Health 2015, 12, 7922–7937. [Google Scholar] [CrossRef] [Scilit] [PubMed]
- Long, R.; Sun, K.; Neitzel, R. Injury Risk Factors in a Small-Scale Gold Mining Community in Ghana’s Upper East Region. Int. J. Environ. Res. Public Health 2015, 12, 8744–8761. [Google Scholar] [CrossRef] [Scilit] [PubMed]
- Kwesi, S.S.; Dartey, E.; Kuffour, R.A.; Dekugm, D.Y.; Osei-Bonsu, R.; Mintah, D.K.; Serwaa, B.A.; Beniako, A.A.; Appiah, A. Occupational Health and Safety Practices among Small-Scale Mining Workers in Ghana. Eur. J. Sci. Innov. Technol. 2024, 4, 2. [Google Scholar]
- Aram, S.A.; Saalidong, B.M.; Appiah, A.; Utip, I.B. Occupational health and safety in mining: Predictive probabilities of Personal Protective Equipment (PPE) use among artisanal goldminers in Ghana. PLoS ONE 2021, 16, e0257772. [Google Scholar] [CrossRef] [Scilit] [PubMed]
- Donkor, P.; Siabi, E.K.; Frimpong, K.; Mensah, S.K.; Siabi, E.S.; Vuu, C. Socio-demographic effects on role assignment and associated occupational health and safety issues in artisanal and small-scale gold mining in Amansie Central District, Ghana. Heliyon 2023, 9, e13741. [Google Scholar] [CrossRef] [Scilit] [PubMed]
- Muah, P. University of Ghana Occupational Health and Safety as a Predictor of Commitment Among Workers in the Ghanaian Mining Sector. 2014. Available online: http://ugspace.ug.edu.gh (accessed on 20 March 2025).
- Annan, J.-S.; Addai, E.K.; Tulashie, S.K. A Call for Action to Improve Occupational Health and Safety in Ghana and a Critical Look at the Existing Legal Requirement and Legislation. Saf. Health Work 2015, 6, 146–150. [Google Scholar] [CrossRef] [Scilit] [PubMed]
- Asumda, D.A.; Situma, F.S.; Muigua, K.M. Ghana’s Regulatory Framework and Sustainability in the Mining Sector. UCC Law J. 2024, 4, 158–189. [Google Scholar] [CrossRef] [Scilit]
- Ministry of Health. Occupational Health and Safety Policy and Guidelines for the Health Sector; Ghana Health Services: Accra, Ghana, 2010.
- Ghana Chamber of Mines. Performance of the Mining Industry in 2023 Global Economic Developments in 2023. 2024. Available online: https://ghanachamberofmines.org/wp-content/uploads/2025/02/2023-Factoid.pdf (accessed on 20 March 2025).
- Stemn, E. Analysis of Injuries in the Ghanaian Mining Industry and Priority Areas for Research. Saf. Health Work 2019, 10, 151–165. [Google Scholar] [CrossRef] [Scilit] [PubMed]
- Adotey, P.B.; Segbefia, E.; Sampene, A.K.; O’Brien, C. Occupational Health and Safety Practices to Enhance Safety Behavior in Ghana’s Mining Sector: The Moderating Effect of Transformational Leadership. J. Knowl. Econ. 2025, 16, 18527–18558. [Google Scholar] [CrossRef] [Scilit]
- Dartey, E.; Monney, I.; Sarpong, K.; Kuffour, C. Occupational Health Hazards among Large-Scale Gold Mineworkers in Ghana. Occup. Dis. Environ. Med. 2022, 10, 149–166. [Google Scholar] [CrossRef]
- Environmental Protection Agency (EPA) Ghana. Africa Environmental Health and Pollution Management Programme (AEHPMP); Ministry of Environment, Science, Technology and Innovation: Accra, Ghana, 2020. Available online: https://ehpmp.epa.gov.gh/ (accessed on 4 May 2025).
- Stemn, E.; Bofinger, C.; Cliff, D.; Hassall, M.E. Failure to learn from safety incidents: Status, challenges and opportunities. Saf. Sci. 2018, 101, 313–325. [Google Scholar] [CrossRef] [Scilit]
- Stojanović, A.; Milošević, I.; Nikolić, Đ. Developing a novel quantitative approach to evaluate the organizational factors affecting occupational health and safety in the mining industry. In XX International May Conference on Strategic Management–IMCSM24 Proceedings-Zbornik Radova; University of Belgrade-Technical Faculty in Bor: Bor, Serbia, 2024; pp. 60–68. [Google Scholar] [CrossRef] [Scilit]
- Amoako, R.; Buaba, J.; Brickey, A. Identifying Risk Factors from MSHA Accidents and Injury Data Using Logistic Regression. Min. Metall. Explor. 2021, 38, 509–527. [Google Scholar] [CrossRef] [Scilit]
- Yedla, A.; Kakhki, F.D.; Jannesari, A. Predictive Modeling for Occupational Safety Outcomes and Days Away from Work Analysis in Mining Operations. Int. J. Environ. Res. Public Health 2020, 17, 7054. [Google Scholar] [CrossRef] [Scilit] [PubMed]
- Dinesh, A.; Brown, L.D.; Burgess, J.L.; Cui, H.-Y.-L. Using Multi-Class Classifiers to Predict Injuries and Identify Leading Indicators in Mine Industry Safety Report Corpus. 2023. Available online: https://api.semanticscholar.org/CorpusID:259257562 (accessed on 27 March 2025).
- Şahbaz, O.; Dworzak, M. Occupational Risk Assessment in Mining—A New Qualitative Method of Risk Analysis; Springer: Cham, Switzerland, 2025; pp. 65–76. [Google Scholar] [CrossRef] [Scilit]
- Zhang, X.; Yang, W.; Yang, W.; Huang, B.; Wang, Z.; Tian, S. Occupational Risk Prediction for Miners Based on Stacking Health Data Fusion. Appl. Sci. 2025, 15, 3129. [Google Scholar] [CrossRef] [Scilit]
- Aliabadi, M.M.; Aghaei, H.; Kalatpour, O.; Soltanian, A.R.; SeyedTabib, M. Effects of human and organizational deficiencies on workers’ safety behavior at a mining site in Iran. Epidemiol. Health 2018, 40, e2018019. [Google Scholar] [CrossRef] [Scilit] [PubMed]
- Kursunoglu, N.; Onder, S.; Onder, M. The Evaluation of Personal Protective Equipment Usage Habit of Mining Employees Using Structural Equation Modeling. Saf. Health Work 2022, 13, 180–186. [Google Scholar] [CrossRef] [Scilit] [PubMed]
- Zhang, S.; Hua, X.; Huang, G.; Shi, X. How Does Leadership in Safety Management Affect Employees’ Safety Performance? A Case Study from Mining Enterprises in China. Int. J. Environ. Res. Public Health 2022, 19, 6187. [Google Scholar] [CrossRef] [Scilit] [PubMed]
- Jiang, T.; Gradus, J.L.; Lash, T.L.; Fox, M.P. Jiang et al. Respond to “Quantitative Bias Analysis”. Am. J. Epidemiol. 2021, 190, 1844–1845. [Google Scholar] [CrossRef] [Scilit] [PubMed]
- Daley, J.; Khan, F.; Amin, M.T. Process safety analysis using operational data and Bayesian network. Process Saf. Prog. 2023, 42, 269–280. [Google Scholar] [CrossRef] [Scilit]
- Gerassis, S.; Saavedra, Á.; Taboada, J.; Alonso, E.; Bastante, F.G. Differentiating between fatal and non-fatal mining accidents using artificial intelligence techniques. Int. J. Min. Reclam. Environ. 2020, 34, 687–699. [Google Scholar] [CrossRef] [Scilit]
- Dekker, S.; Cilliers, P.; Hofmeyr, J.-H. The complexity of failure: Implications of complexity theory for safety investigations. Saf. Sci. 2011, 49, 939–945. [Google Scholar] [CrossRef] [Scilit]
- Komljenovic, D.; Loiselle, G.; Kumral, M. Organization: A new focus on mine safety improvement in a complex operational and business environment. Int. J. Min. Sci. Technol. 2017, 27, 617–625. [Google Scholar] [CrossRef] [Scilit]
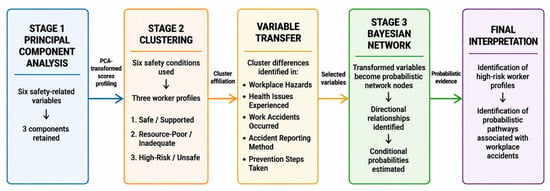
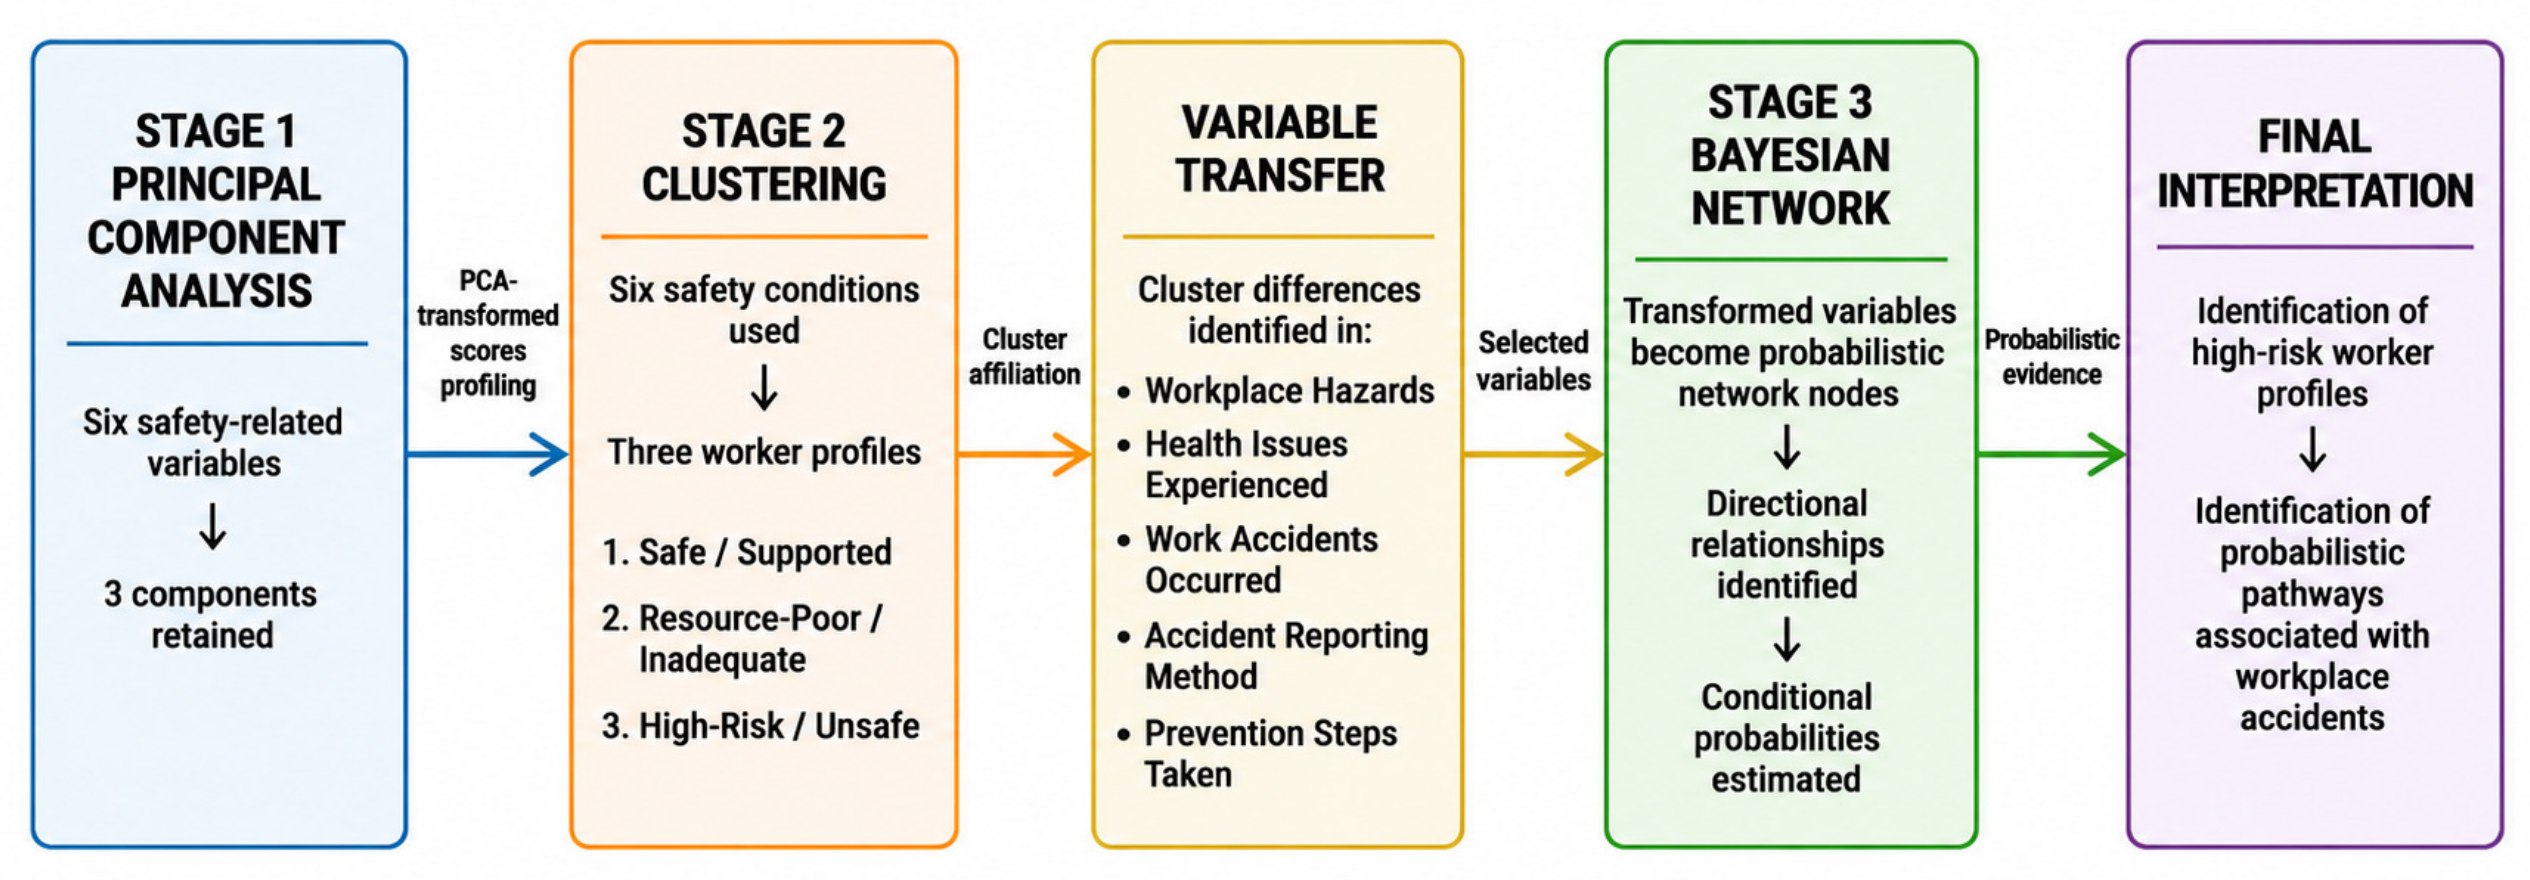
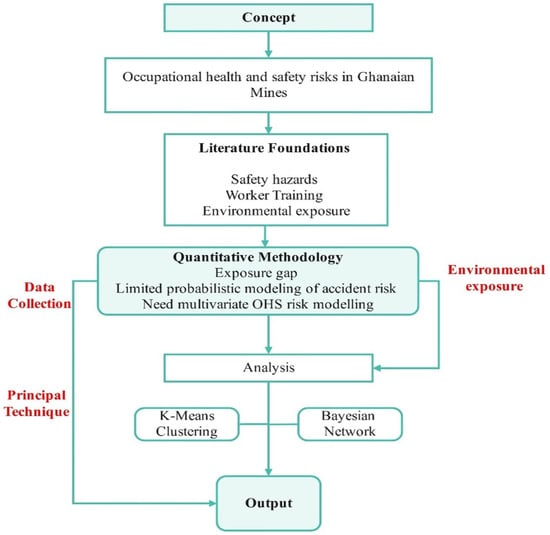
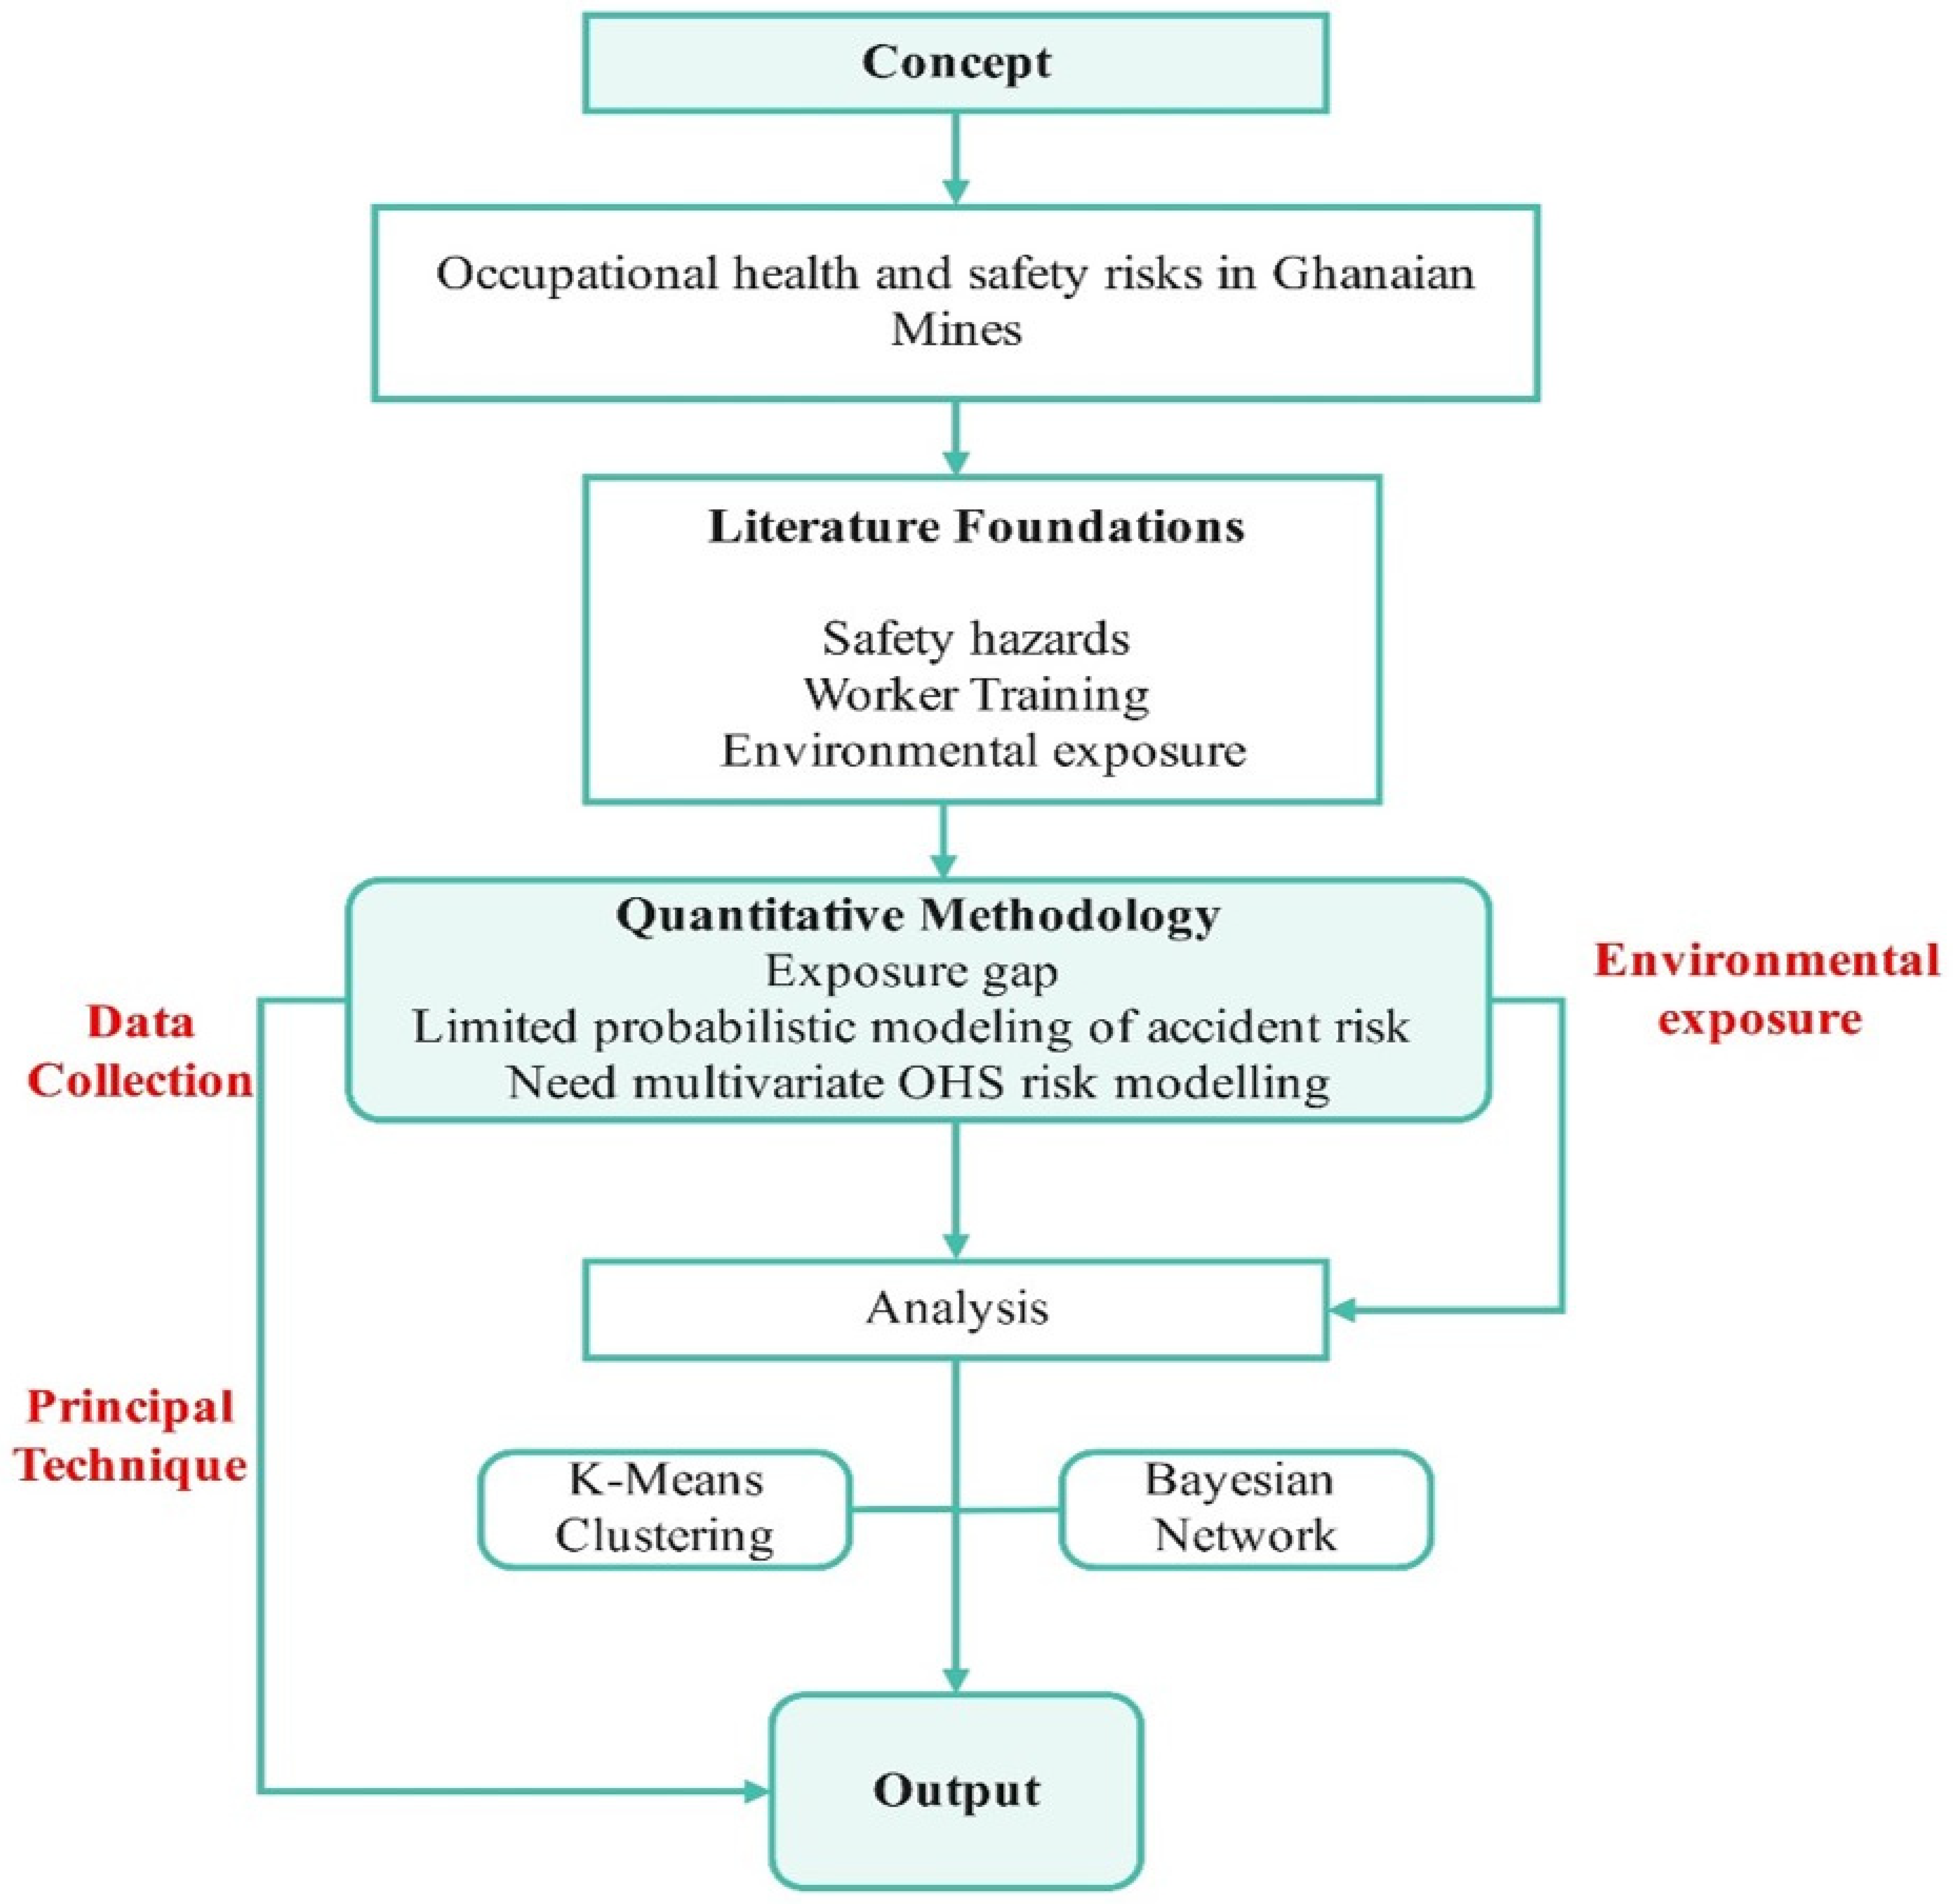
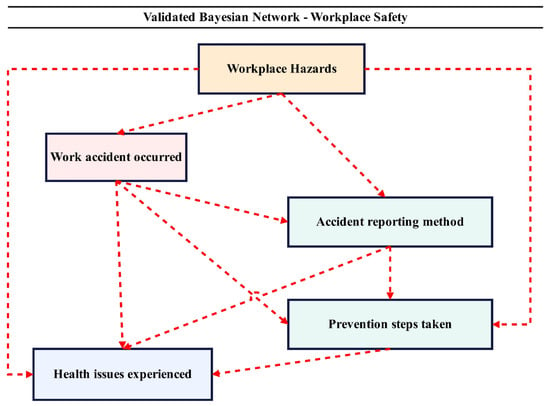
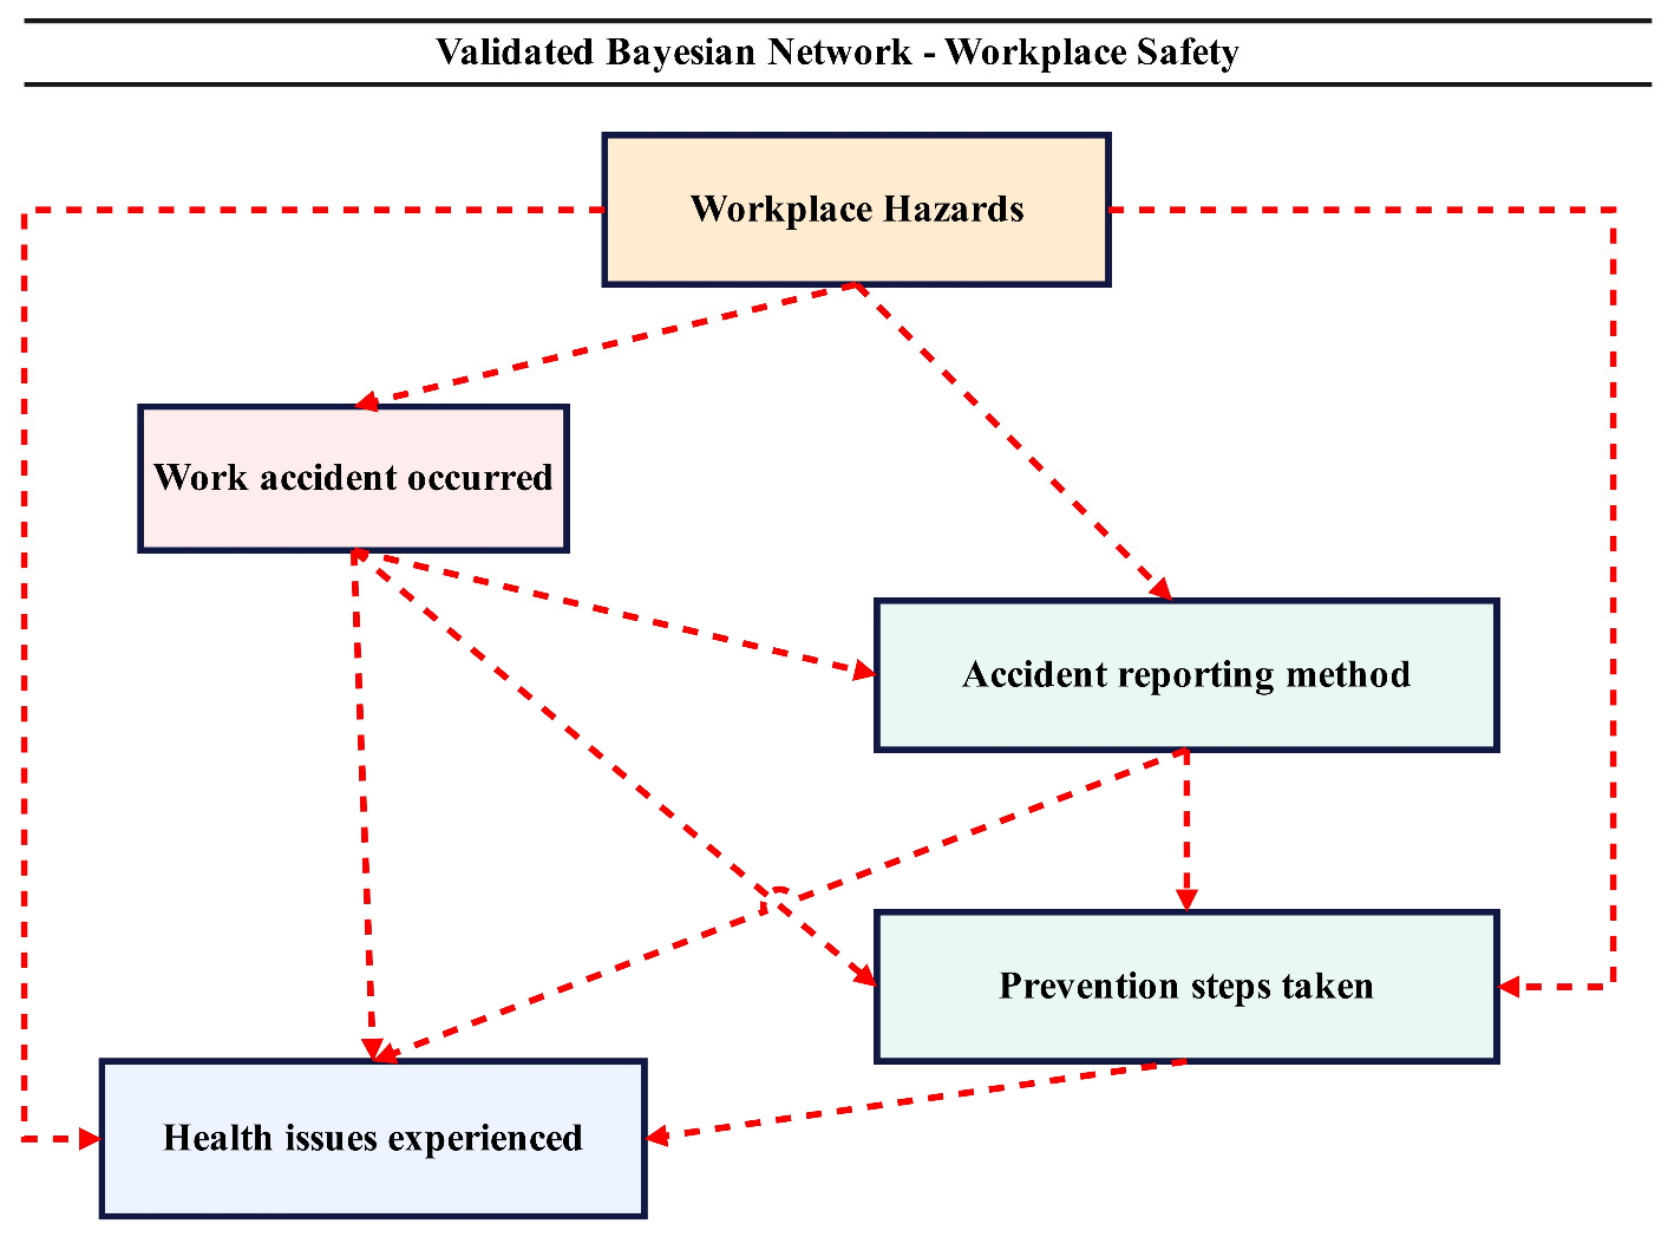

Disclaimer/Publisher’s Note: The statements, opinions and data contained in all publications are solely those of the individual author(s) and contributor(s) and not of MDPI and/or the editor(s). MDPI and/or the editor(s) disclaim responsibility for any injury to people or property resulting from any ideas, methods, instructions or products referred to in the content. |
© 2026 by the authors. Licensee MDPI, Basel, Switzerland. This article is an open access article distributed under the terms and conditions of the Creative Commons Attribution (CC BY) license.