


Abstract
To examine the deformation behavior and failure mechanisms of large-scale mine chutes under complex service conditions, we performed multiple C-ALS three-dimensional laser scanning surveys on the 1#, 2# and 3# chutes at an iron mine in Anhui Province. The results showed that all three chutes had severe non-uniform expansion, with maximum diameters of 12.2 m, 14.8 m and 16.9 m, respectively. The maximum annual wear rates during the detection period were 2.4 m, 6.0 m and 2.5 m, respectively. The failure of the chutes was mainly caused by local block collapse drops, influenced by the joints and fissures of the surrounding rock, and the wear showed significant discontinuous and non-uniform characteristics. Based on the detection data, a three-peak Gaussian model is established to describe the nonlinear distribution of the expansion along depth, with peak centers located at −462 m, −497 m and −520 m. By comparing linear and exponential models, it is determined that the expansion exhibits a linear evolution trend with time. Based on the maximum diameter and annual wear rate, we estimate the remaining safe service life of each chute, and provide the confidence interval for the expansion value at a 90% confidence level (such as [1.31 m, 4.83 m] at −520 m). Research shows that high-precision 3D laser scanning can effectively reveal the deformation and evolution laws inside the chute. It is recommended to immediately take reinforcement measures for chute 2 and establish a dynamic monitoring system for the common weak zone between −480 m and −520 m. Research on the evolution of surrounding rock fractures should be carried out to provide a scientific basis for chute life assessment and risk control.
1. Introduction
The function and service environment of the ore chute: As a key structure in the mining production system, the ore chute primarily undertakes the efficient transportation of ore and waste rock and has the advantages of continuous operation, strong transportation capacity, and a high space utilization rate [1]. However, its service environment is extremely complex and harsh [2]. During prolonged operation, the wellbore interior is subjected not only to high-frequency, high-intensity ore impacts and abrasion, but also to adverse geological conditions, including rock fragmentation, severe ground pressure, and extensively developed joint networks [3,4]. This multi-factor coupled service environment poses serious problems of wear, expansion, and stability to the chute structure, which in turn affect the safety and production efficiency of the entire mine [5].
Taking the 1#, 2# and 3# main shafts of a large iron mine in Anhui Province as an example, serious structural damage has occurred during long-term service. The 3D laser scanning detection results show that the local expansion of the three shafts is extremely significant, with maximum diameters of 12.2 m, 14.8 m and 16.9 m, far exceeding the original design section. Among them, the expansion value of the 2# chute at −520 m is as high as 5.0 m, and the annual wear rate is 6.0 m. With the development of expansion, the surrounding rock undergoes local block collapse under the influence of joint fissures, further exacerbating the instability of the wellbore structure [6]. This type of deformation and damage problem has seriously threatened the normal use of the chute, resulting in a significant reduction in its design service life [7,8]. Therefore, it is urgent to adopt high-precision detection methods to systematically obtain the three-dimensional shape changes inside the wellbore, and based on this, conduct expansion trend prediction and life evaluation, providing a basis for stability judgment and reinforcement decision-making.
The C-ALS 3D laser scanning system, as a portable device dedicated to underground space exploration, can quickly obtain high-precision point cloud data without touching the wellbore wall and generate a 3D model of the interior of the chute and a horizontal cross-section map at any depth, and is suitable for quantitative analysis of chute deformation, expansion, and wear [9,10,11]. By using this technology to conduct multi-stage on-site inspections of the 1#, 2# and 3# chutes of the iron mine, key data such as the three-dimensional shape changes, expansion range, and wear rate inside the shaft can be accurately obtained [12], revealing the evolution law of non-uniform wear of the shafts and the characteristics of non-uniform wear influenced by joint fissures [13,14]. This provides a scientific basis for evaluating the stability of the shaft structure and identifying weak areas of the surrounding rock, effectively guiding subsequent reinforcement design and maintenance decisions [15].
Based on this, this article takes the 1#, 2# and 3# ore shafts of the iron mine as the research object, and uses the C-ALS three-dimensional laser scanning system to carry out multi-stage on-site inspections. The aim is to systematically grasp the deformation characteristics and spatial distribution laws of the three shafts, and focus on the following prediction research: firstly, to construct a three peak Gaussian model to reveal the nonlinear spatial distribution law of the expansion value along depth, and to achieve expansion prediction at any depth within the range of 440 m to 540 m [16]. The second is based on the four-phase detection data of the 3# chute, comparing linear and exponential models to determine the dominant trend of brush expansion over time [17]. Thirdly, by combining the set limit diameter with the annual wear rate of each chute, quantitatively estimate the remaining safe service life and identify key chutes that urgently need reinforcement [18]. The fourth is to introduce confidence interval methods to quantify the uncertainty of expansion prediction and provide risk boundaries for engineering decision-making [19]. The research results can provide systematic engineering reference and data support for the stability evaluation of the chute structure, optimization of reinforcement schemes, deployment of dynamic monitoring systems, and life assessment [20].
2. Project Overview and Testing Methods
2.1. Project Overview and Chute Descriptions
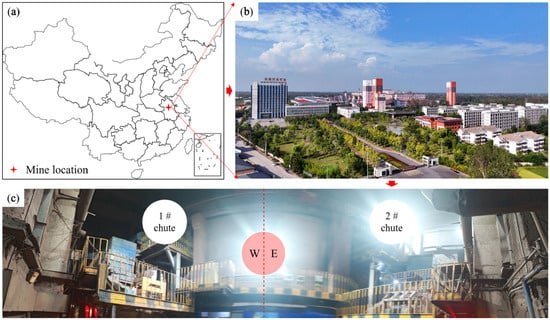
This iron mine is a large underground mine in Anhui Province, see Figure 1a,b, which adopts a main chute system [21] to undertake the centralized transportation of ore and rock, see Figure 1c. This study focuses on the deformation detection and failure mechanism analysis of three main shafts, namely 1#, 2# and 3#, in the mine. All three chutes serve the main production stage of the mine, with the 3# chute connected to the −525 m horizontal roadway, through which the ore and rock at this level are primarily transported [22].
Figure 1.
Relationship between geographic location and bottom position of the chute: (a) geographic location; (b) geomorphology; (c) position relationship of the chute.
According to the detection data, the depth range of the three chutes is roughly from −440 m to −550 m. In terms of specific service life, previous documents indicate that as of the inspection in 2014, the remaining design service life of 3# chute is 21 years [23]. The specific initial usage time of the 1# and 2# chutes is not clearly listed, but from the inspection time nodes (2013–2014) and wear degree, it can be seen that the chutes had been put into use until the first inspection, showing varying degrees of expansion and deformation [24].
The surrounding rock conditions where the chute is located are relatively complex, with developed joints and fissures, resulting in significant unevenness in wellbore wear, mainly characterized by local block collapse drops rather than continuous uniform wear [25,26]. This geological background is a key factor in influencing the failure mode and evolution process of the chute. The significant role of geological structure in ore pass failures has been widely recognized in previous studies [27].
2.2. Testing Methods and Equipment
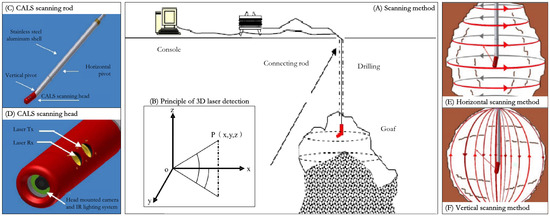
This study used the C-ALS 3D laser scanning system to perform underground 3D shape scanning of the 1#, 2# and 3# chutes of the iron mine. C-ALS is a portable 3D laser scanning device specifically designed for underground space exploration; see Figure 2. It can generate a 3D model of the chute interior and horizontal cross-sections at any depth. This system is suitable for quantitative analysis of chute deformation, expansion, and wear [11,28,29].
Figure 2.
Equipment diagram: (A) Scanning method, (B) principle of 3D laser detection, (C) C-ALS scanning rod, (D) C-ALS scanning head, (E) horizontal scanning method, (F) vertical scanning method.
The detection-time nodes for the three chutes are as follows:
The 1# chute: Two inspections were conducted, one on August 3, 2013 (first) and the other on 23 October 2014 (second).
The 2# chute: Two inspections were conducted, one on December 30, 2013 (the first) and the other on 23 October 2014 (the second).
The 3# chute: Four inspections were conducted from August 2013 to October 2014, with specific inspection dates of 3 August 2013 (first inspection), 30 December 2013 (second inspection), 12 May 2014 (third inspection), and 23 October 2014 (fourth inspection) [30].
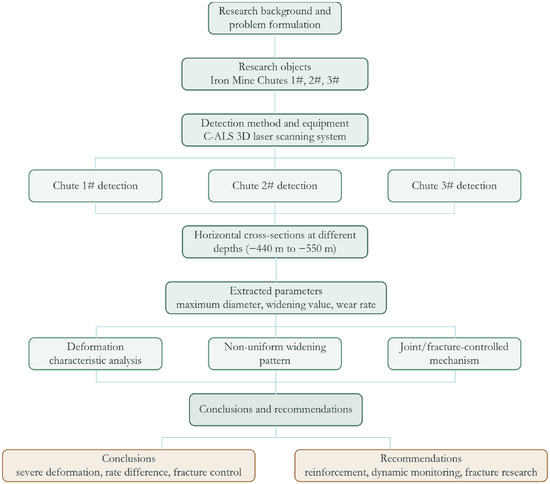
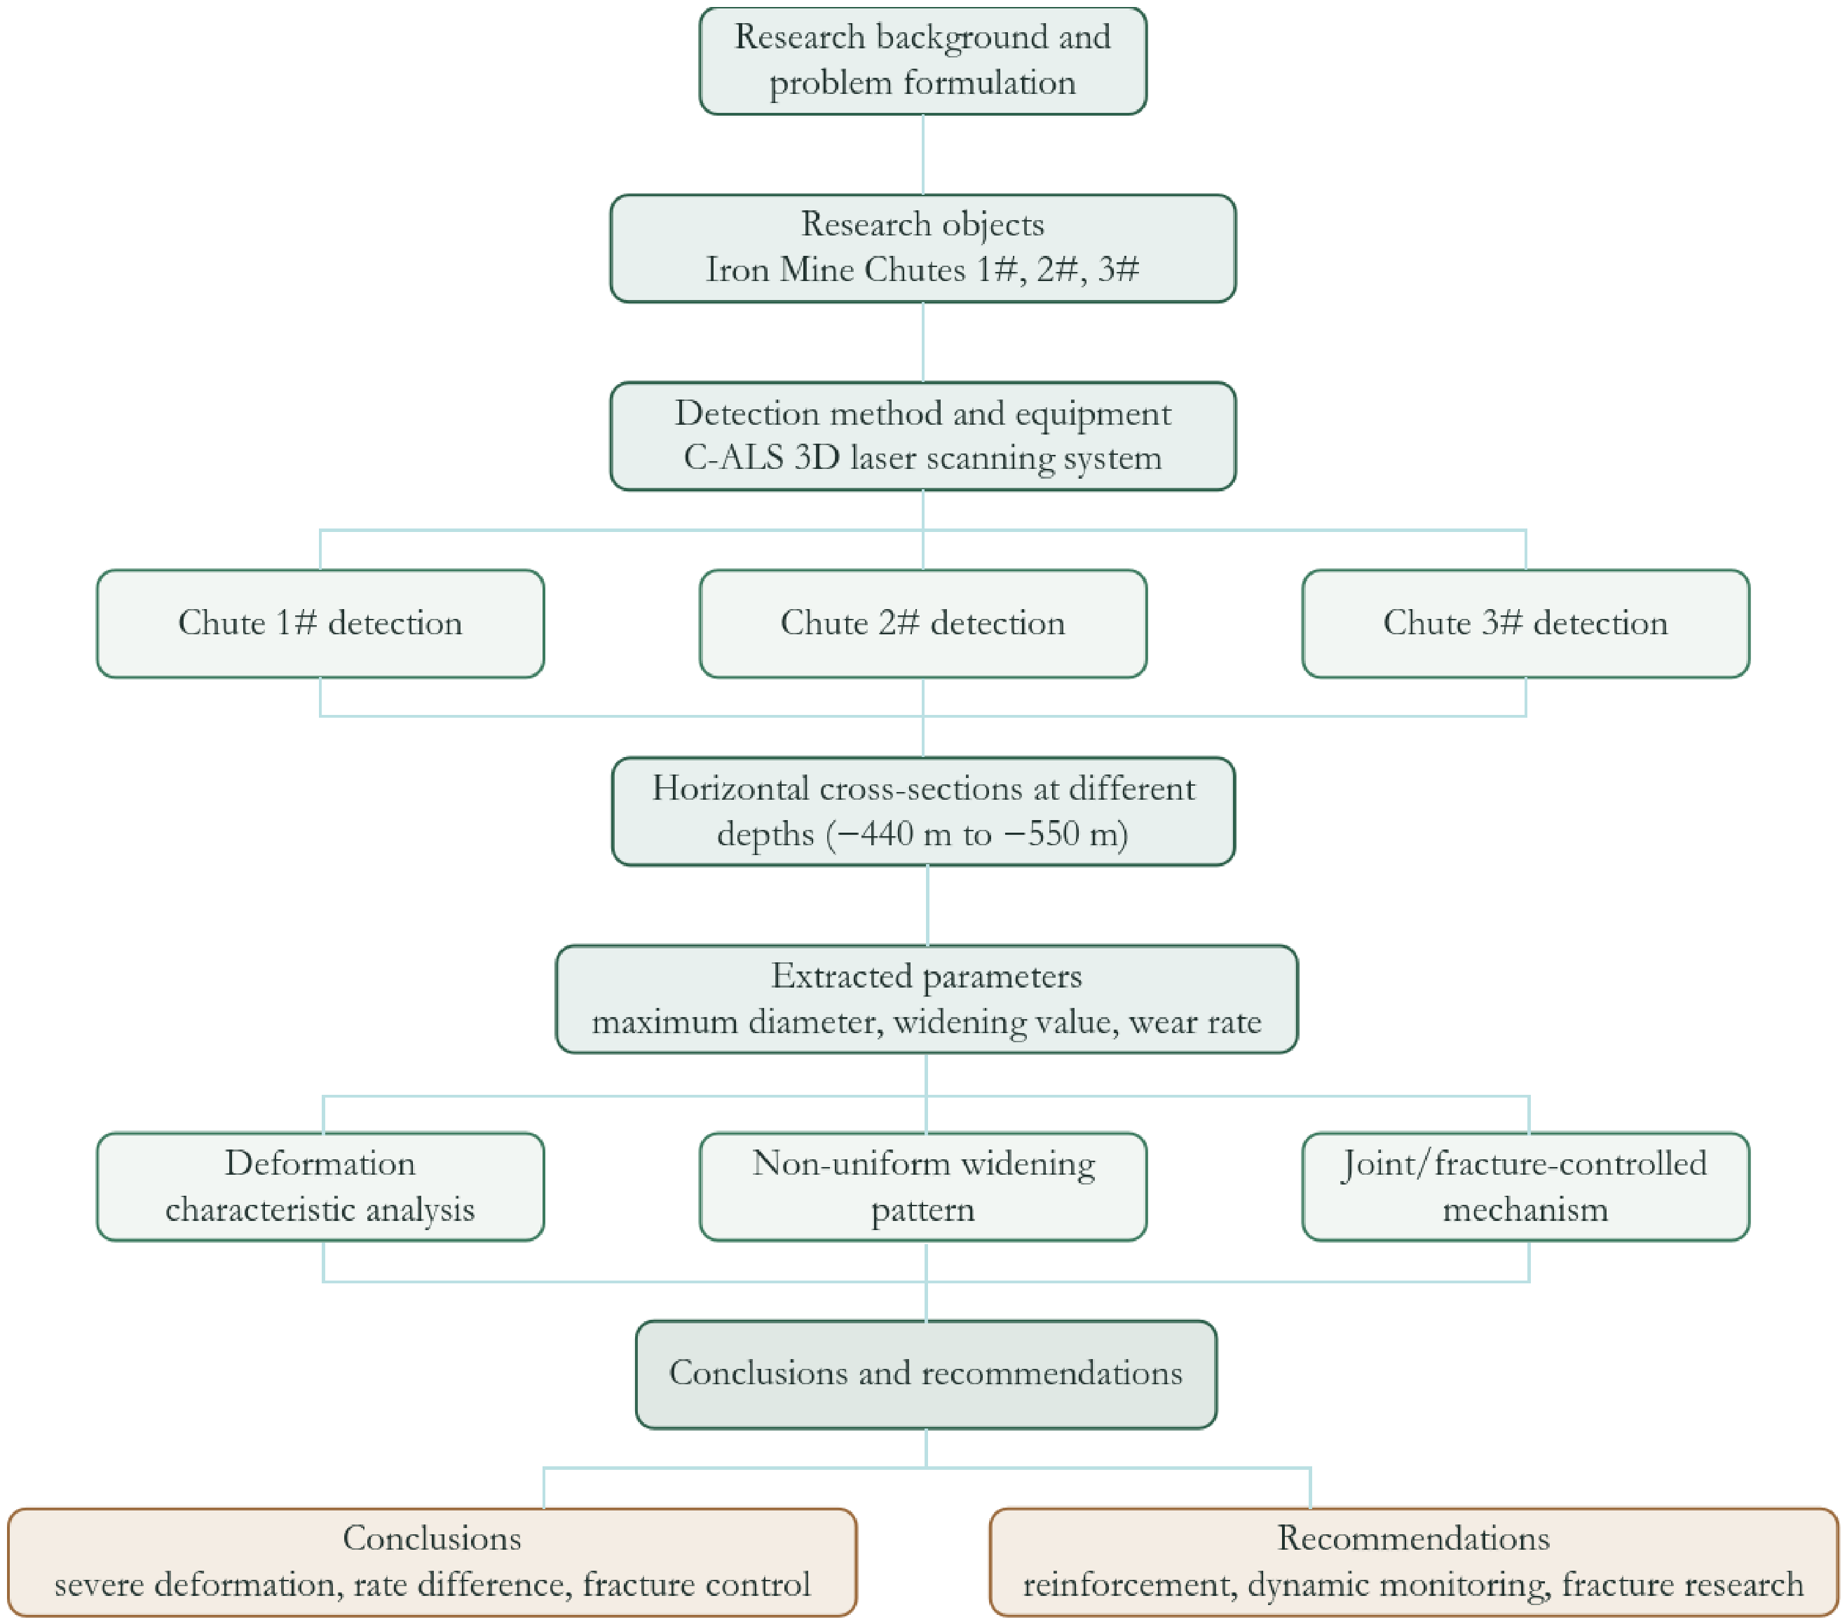
After each inspection, the system generates cross-sectional views of the wellbore at various depth levels (such as −440 m, −445 m, −450 m… −550 m, etc.), and displays them in the same proportion and uniform direction (with the chute orientation pointing directly above the image), facilitating intuitive comparison of inspection results at different times [31]. The maximum diameter and expansion value of all cross-sections are based on the last test result, and the expansion value refers to the change in the maximum wear position at each level during the two tests [32]; see Figure 3.
Figure 3.
Method flow chart.
3. Inspection Results of the Chute
3.1. The 1# Chute
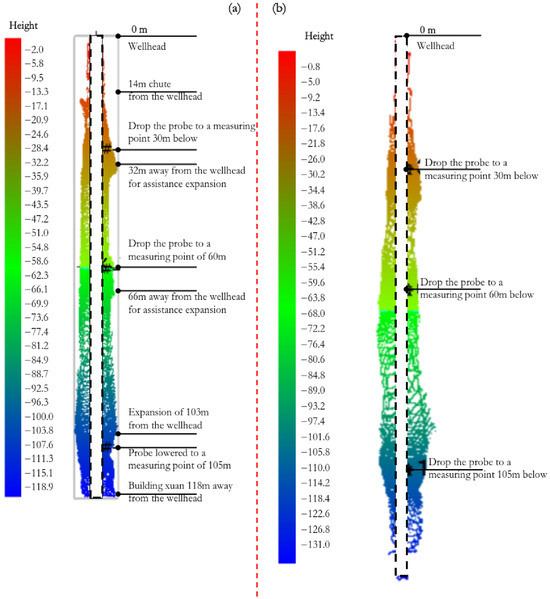
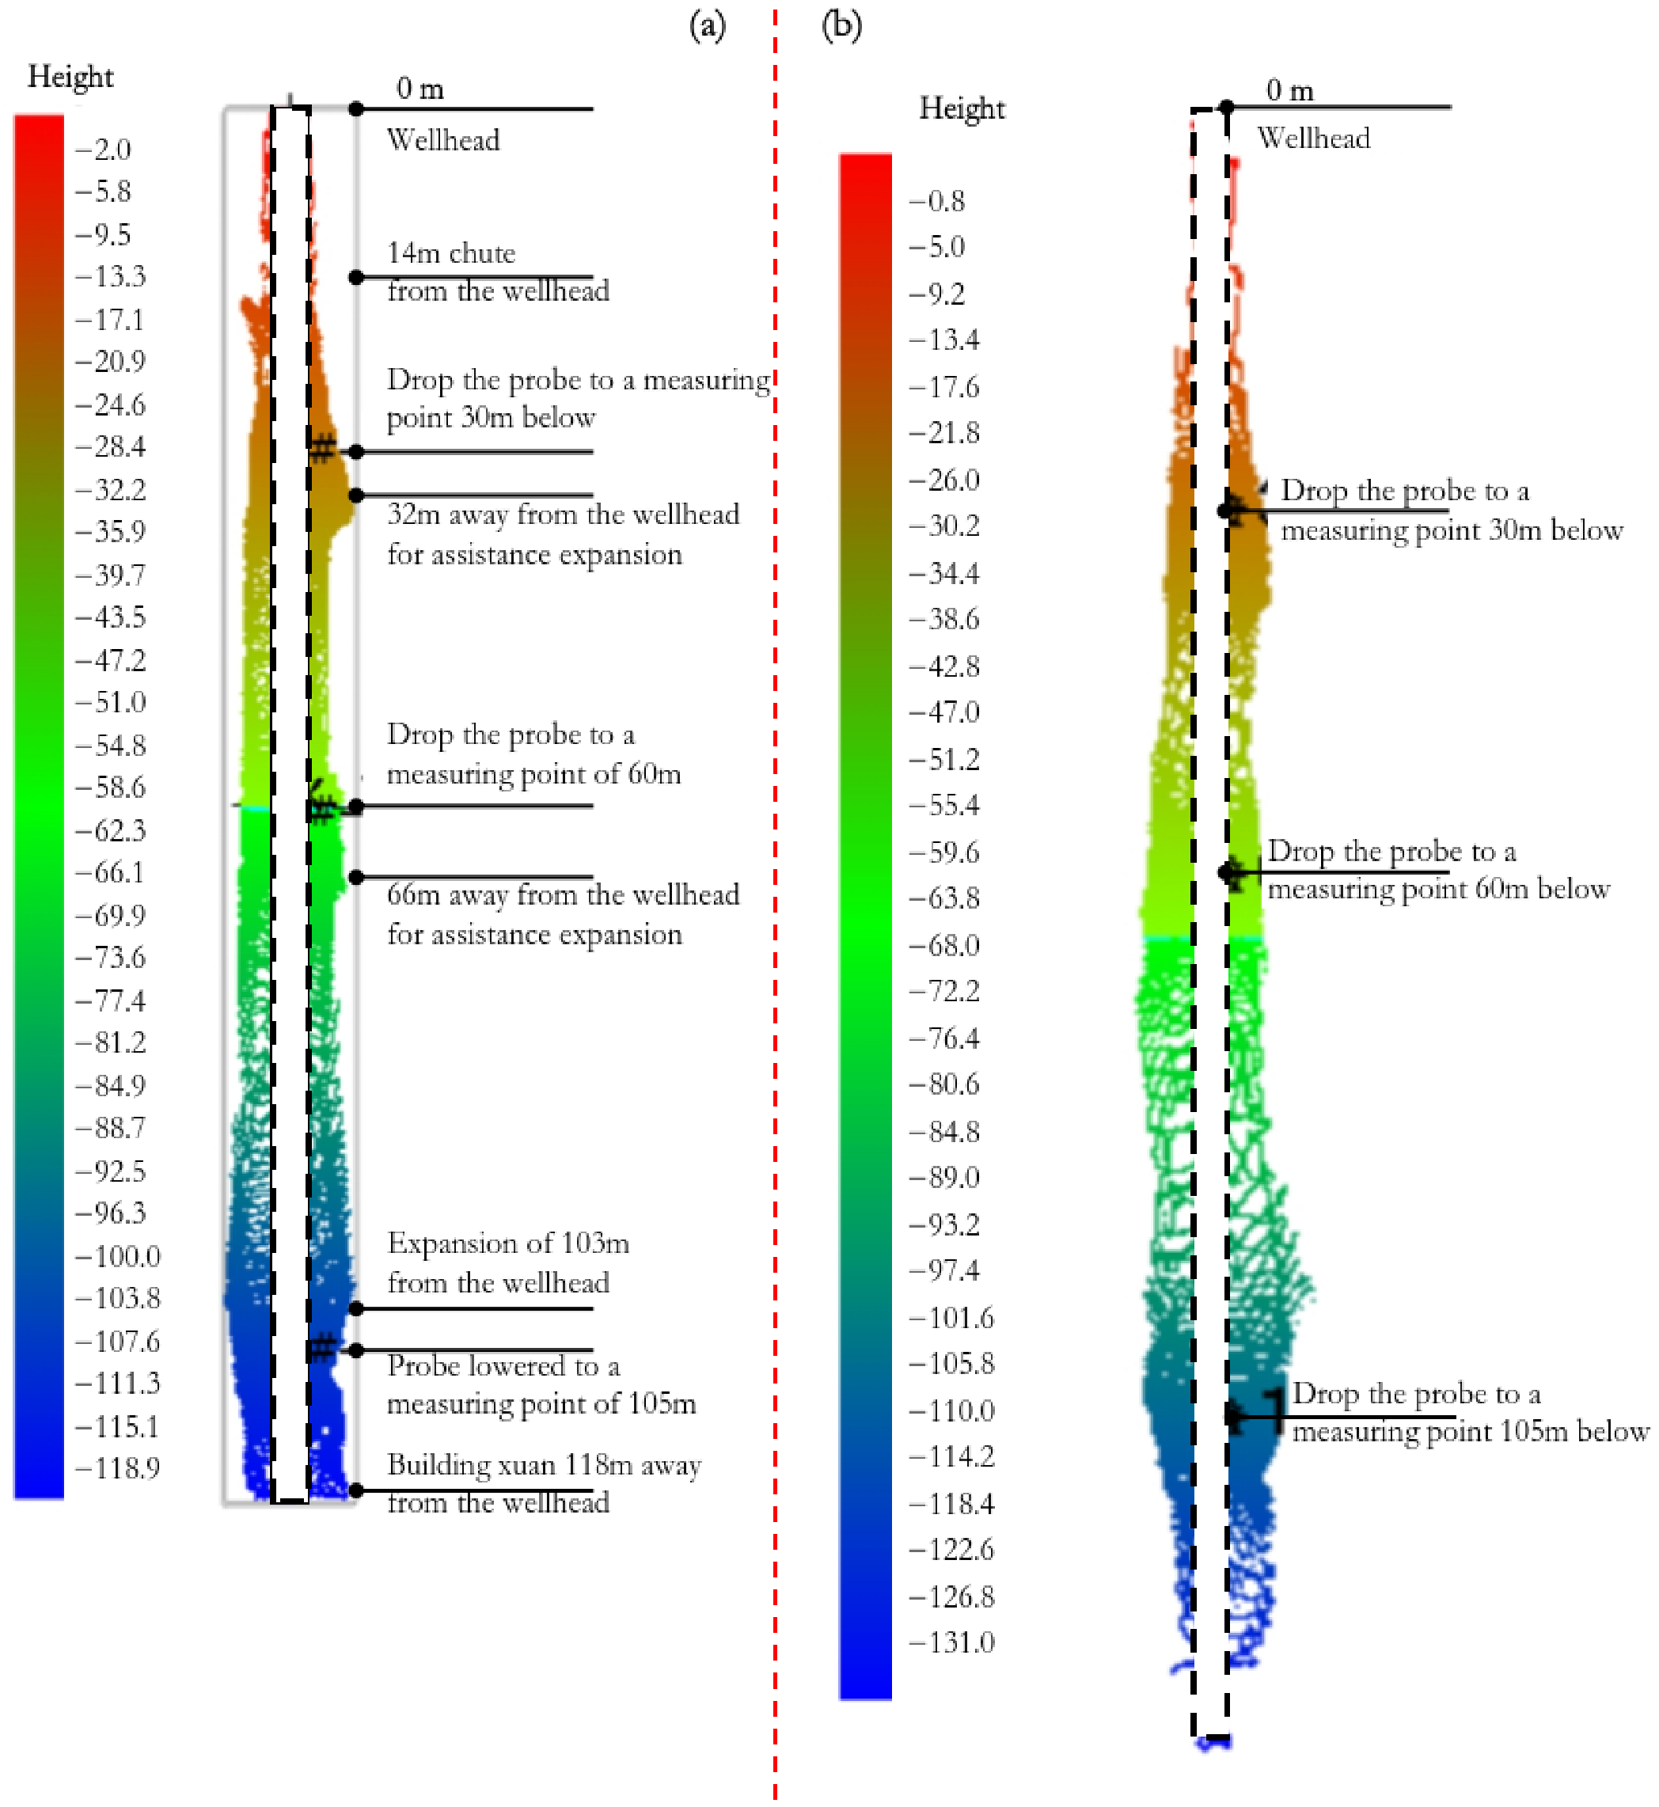
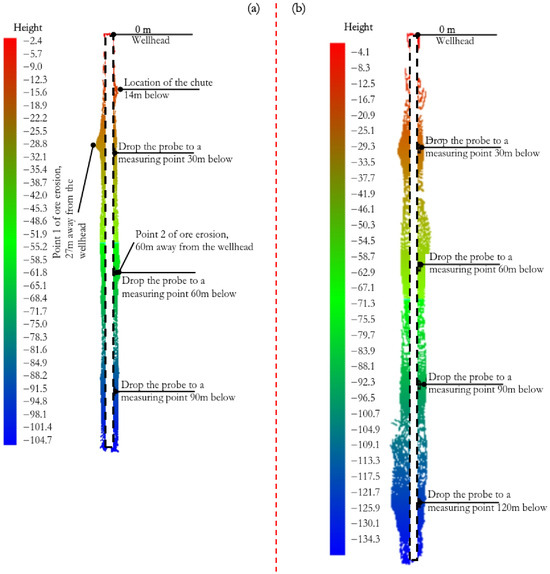
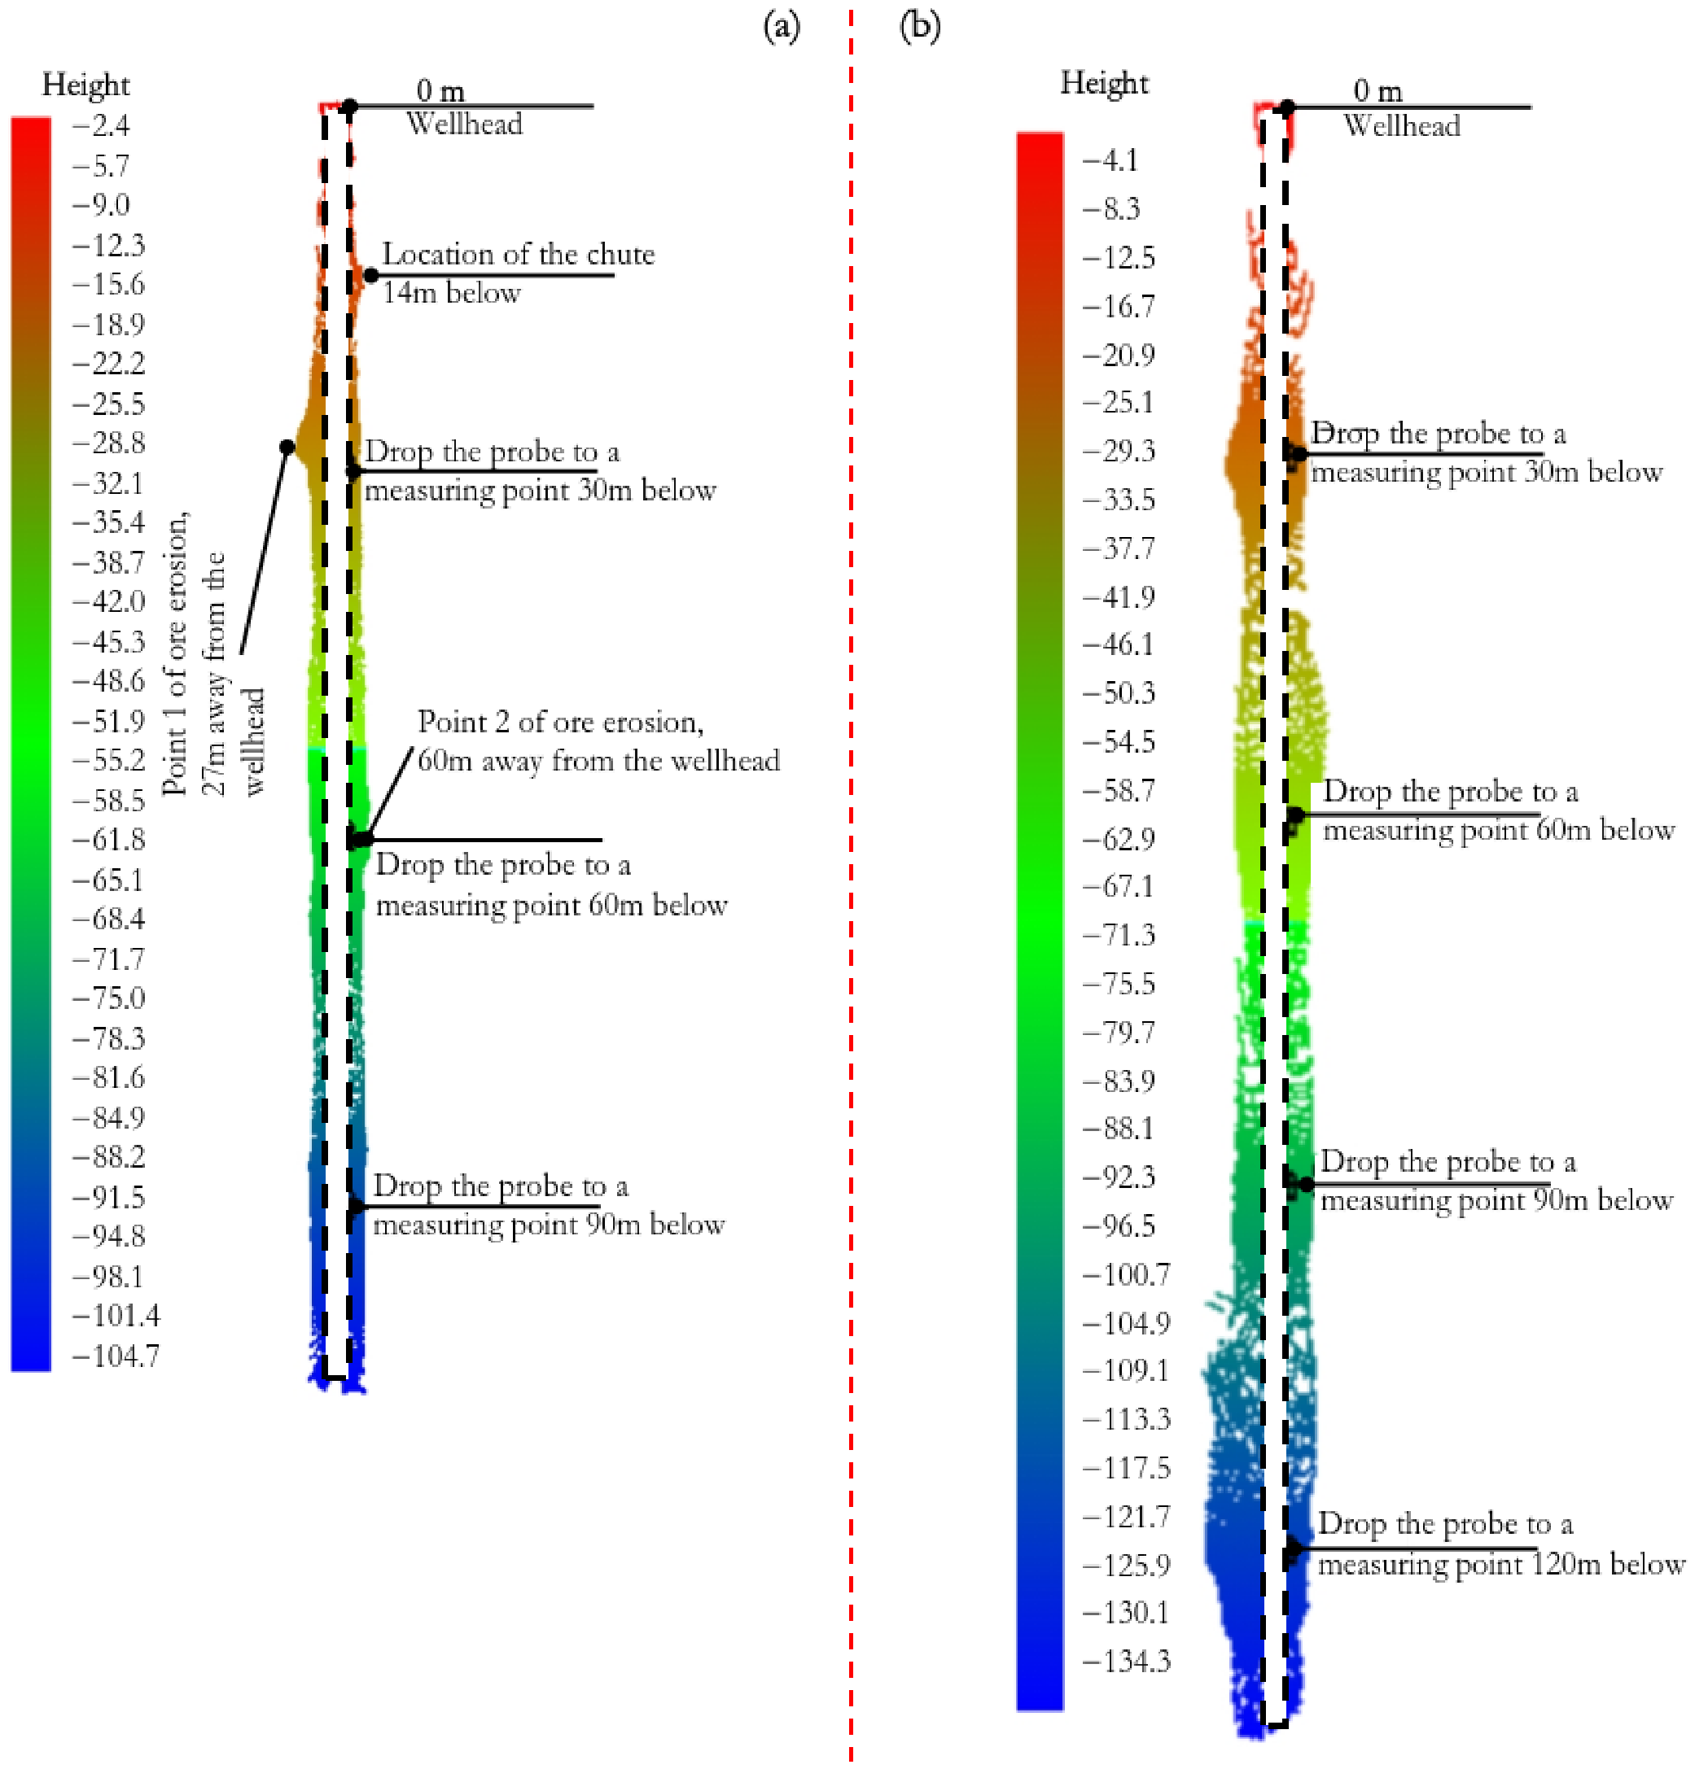
According to the results of two C-ALS 3D laser scanning inspections (on 3 August 2013 and 23 October 2014), (see Figure 4), the 1# chute shaft experienced varying degrees of expansion and deformation at different depth levels [9]. The maximum diameter appears at the −520 m level, reaching 12.2 m, far exceeding the original design cross-section. During the time span of the two inspections (approximately 14.7 months), there was significant local expansion of the wellbore, with the most severe expansion occurring at the −520 m level, with a maximum expansion of 2.8 m. Based on this calculation, the maximum annual wear rate of the 1# chute is approximately 2.4 m [33].
Figure 4.
The 1# shaft inspection results: (a) first time on 3 August 2013 and (b) second time on 23 October 2014.
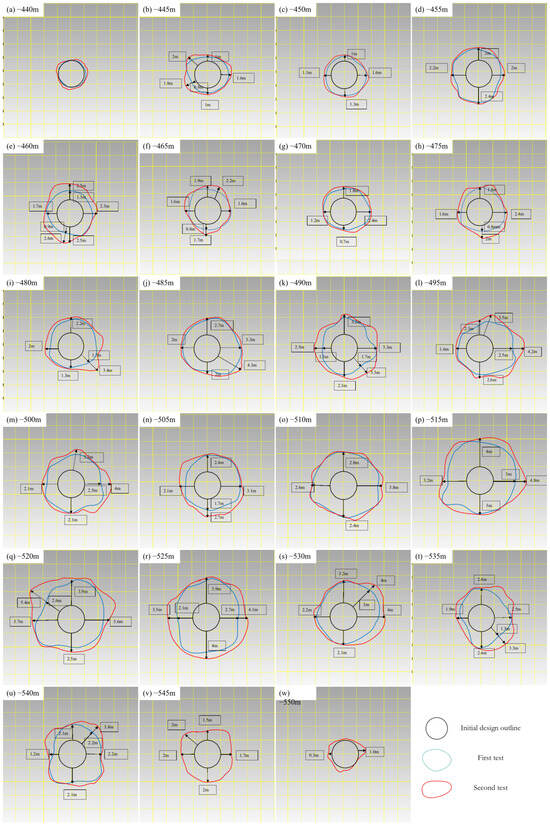
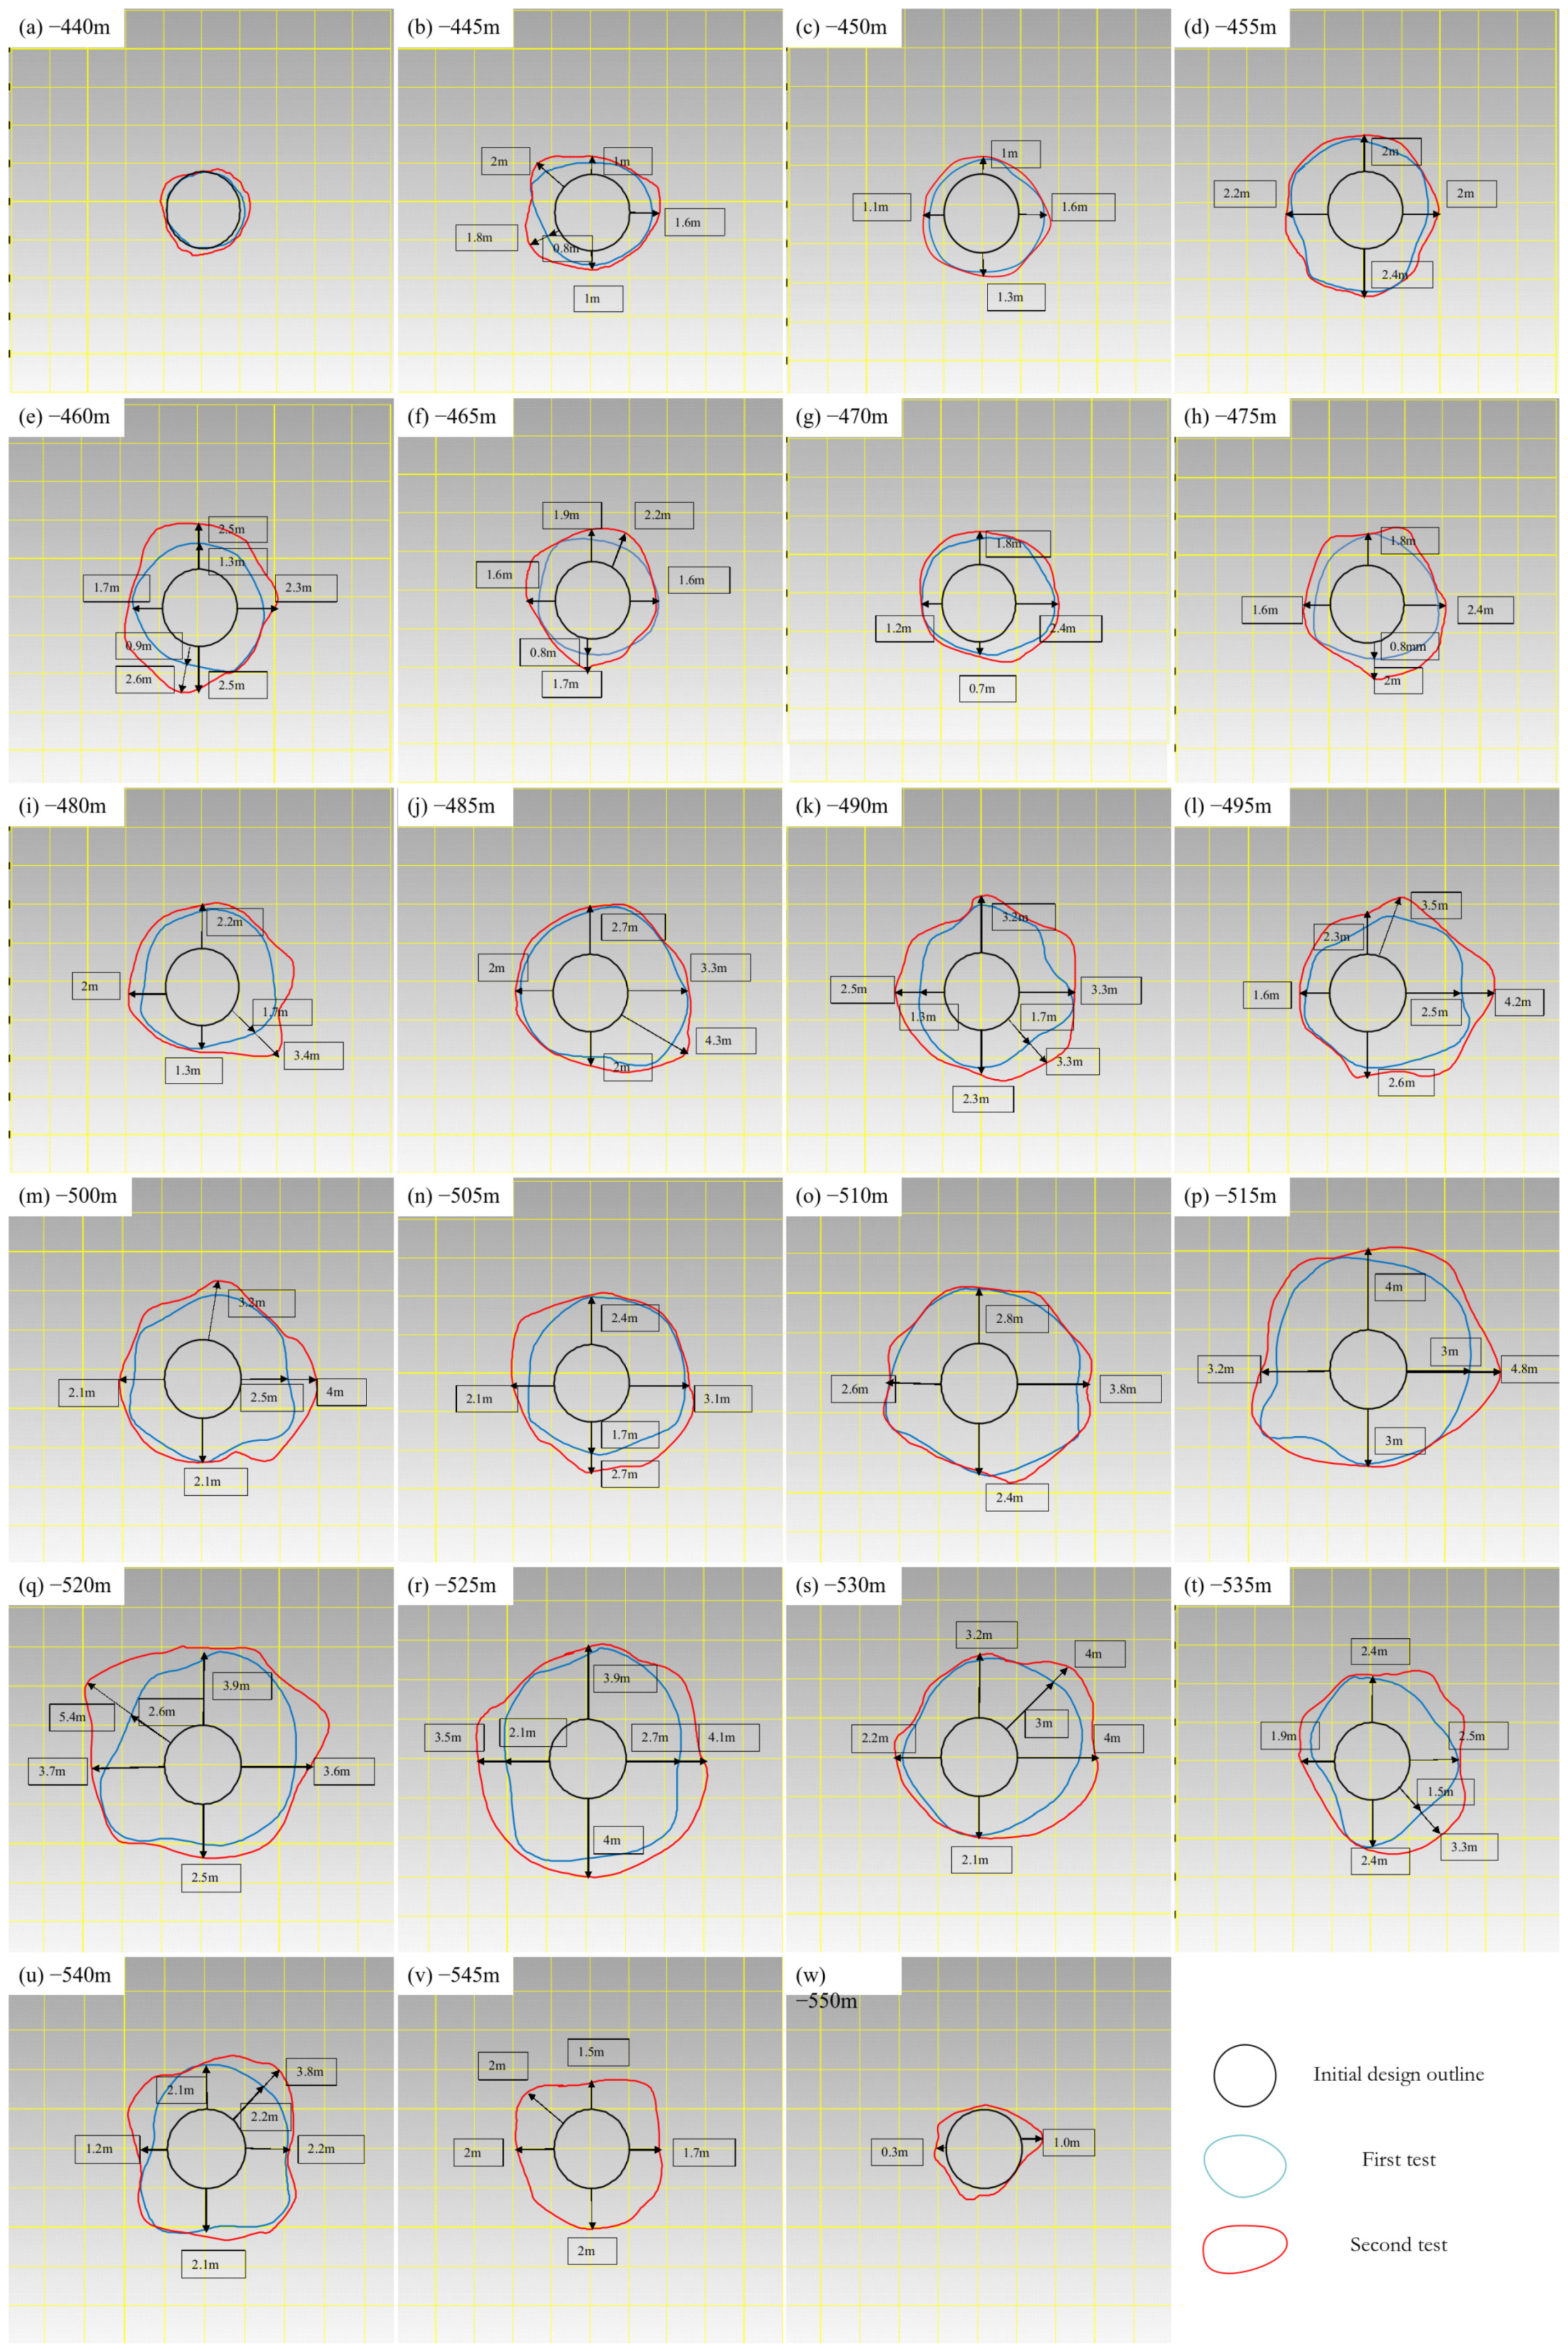
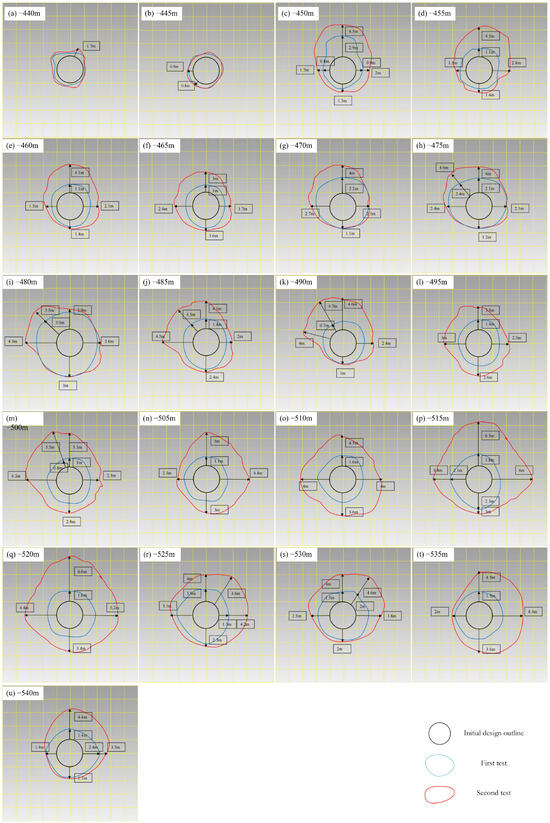
From the cross-sectional morphology, see Figure 5, the wear of the 1# chute is not uniformly distributed, but exhibits obvious local block collapse drop characteristics, influenced by the joints and fissures of the surrounding rock [25,34]. Within the depth range of −440 m to −550 m, multiple horizontal sections exhibit irregular expansion patterns, which are particularly prominent around −520 m [35]. The detailed test results are summarized in Table 1.
Figure 5.
The 1# comparison of cross-sectional data before and after shaft inspection.
Table 1.
Summary of inspection results for 1# chute.
The detailed cross-sectional information of the two inspections of the 1# chute is as follows (all cross-sections are uniformly pointed towards the top of the picture in the direction of the chute, and all pictures are displayed at the same scale for comparison).
Analysis of the two inspections of the 1# chute shows that the maximum diameter occurs at the −520 m level, with a maximum diameter of 12.2 m. During the time span of the two inspections (3 August 2013–23 October 2014), varying degrees of expansion occurred in the shaft. Among them, the maximum expansion value reached 2.8 m at −520 m, and the maximum annual wear rate during the inspection period was 2.4 m [33].
3.2. The 2# Chute
The 2# chute underwent two inspections (on 30 December 2013 and 23 October 2014), see Figure 6, and the inspection results showed that its deformation degree was the most severe among the three [9]. The maximum diameter is located at the −515 m level, reaching 14.8 m. During the time span of the two inspections (approximately 9.8 months), the maximum expansion of the brush at the −520 m level reached 5.0 m, and the annual wear rate was as high as 6.0 m, significantly higher than that of the 1# chute [36,37].
Figure 6.
The 2# shaft inspection results (a) first time on 30 December 2013 and (b) second time on 23 October 2014.
From the analysis of cross-sectional morphology, the expansion of the 2# chute also exhibits non-uniform characteristics influenced by joint fissures [25,34], and some horizontal depths (such as −455 m, −480 m, etc.) also show significant expansion values (3.4 m and 2.2 m, respectively). Overall, the structural stability of the 2# chute is the worst, with the fastest wear rate, and reinforcement measures are urgently needed to prevent further deterioration [38,39]; see Figure 7. The detailed test results are summarized in Table 2.
Figure 7.
The 2# comparison of cross-sectional data before and after shaft inspection.
Table 2.
Summary of inspection results for 2# chute.
The detailed cross-sectional information of the two inspections of the 2# chute is as follows. (All cross-sections are uniformly pointed towards the top of the picture in the direction of the chute, and all pictures are displayed at the same scale for comparison).
Through the analysis of the results of two inspections of the 2# chute, the maximum diameter of the chute shaft was located at the −515 m level, with a maximum diameter of 14.8 m. During the time span of the two inspections (30 December 2013 to 23 October 2014), varying degrees of expansion occurred in the shaft. Among them, at −520 m, the maximum expansion value reached 5.0 m, and the maximum annual wear rate was 6.0 m [36,37].
3.3. The 3# Chute
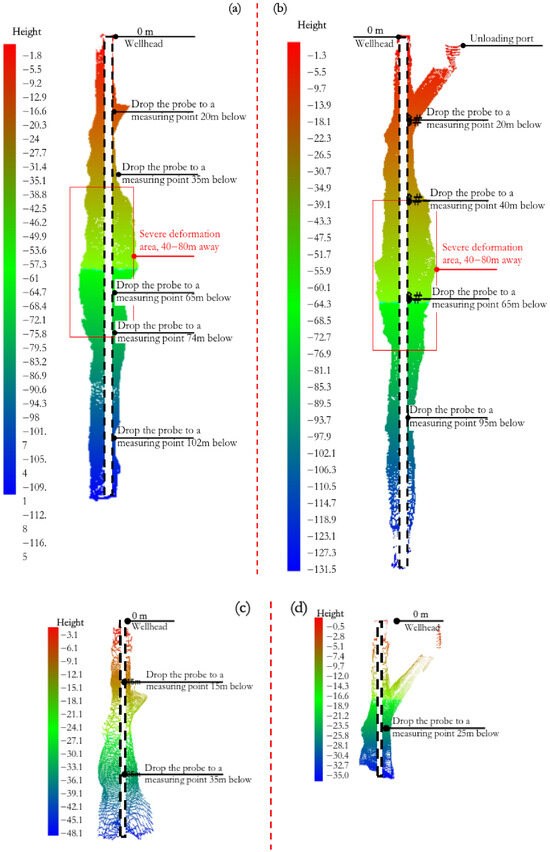
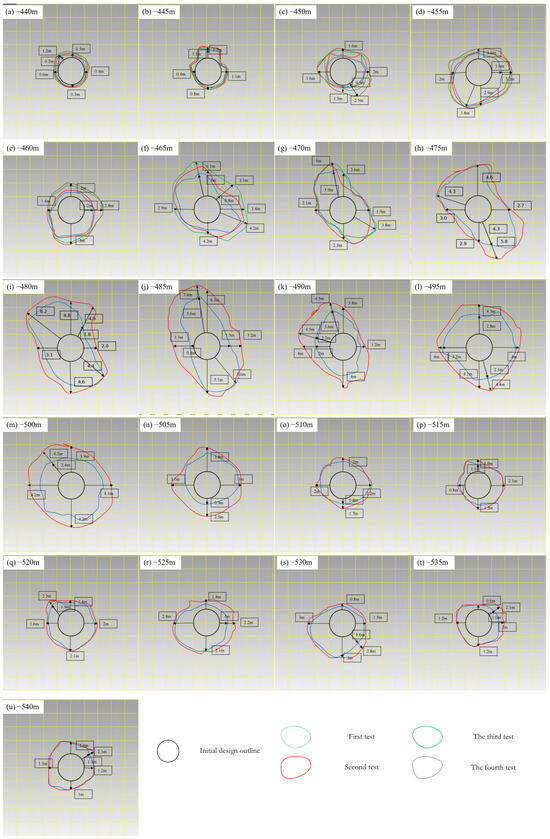
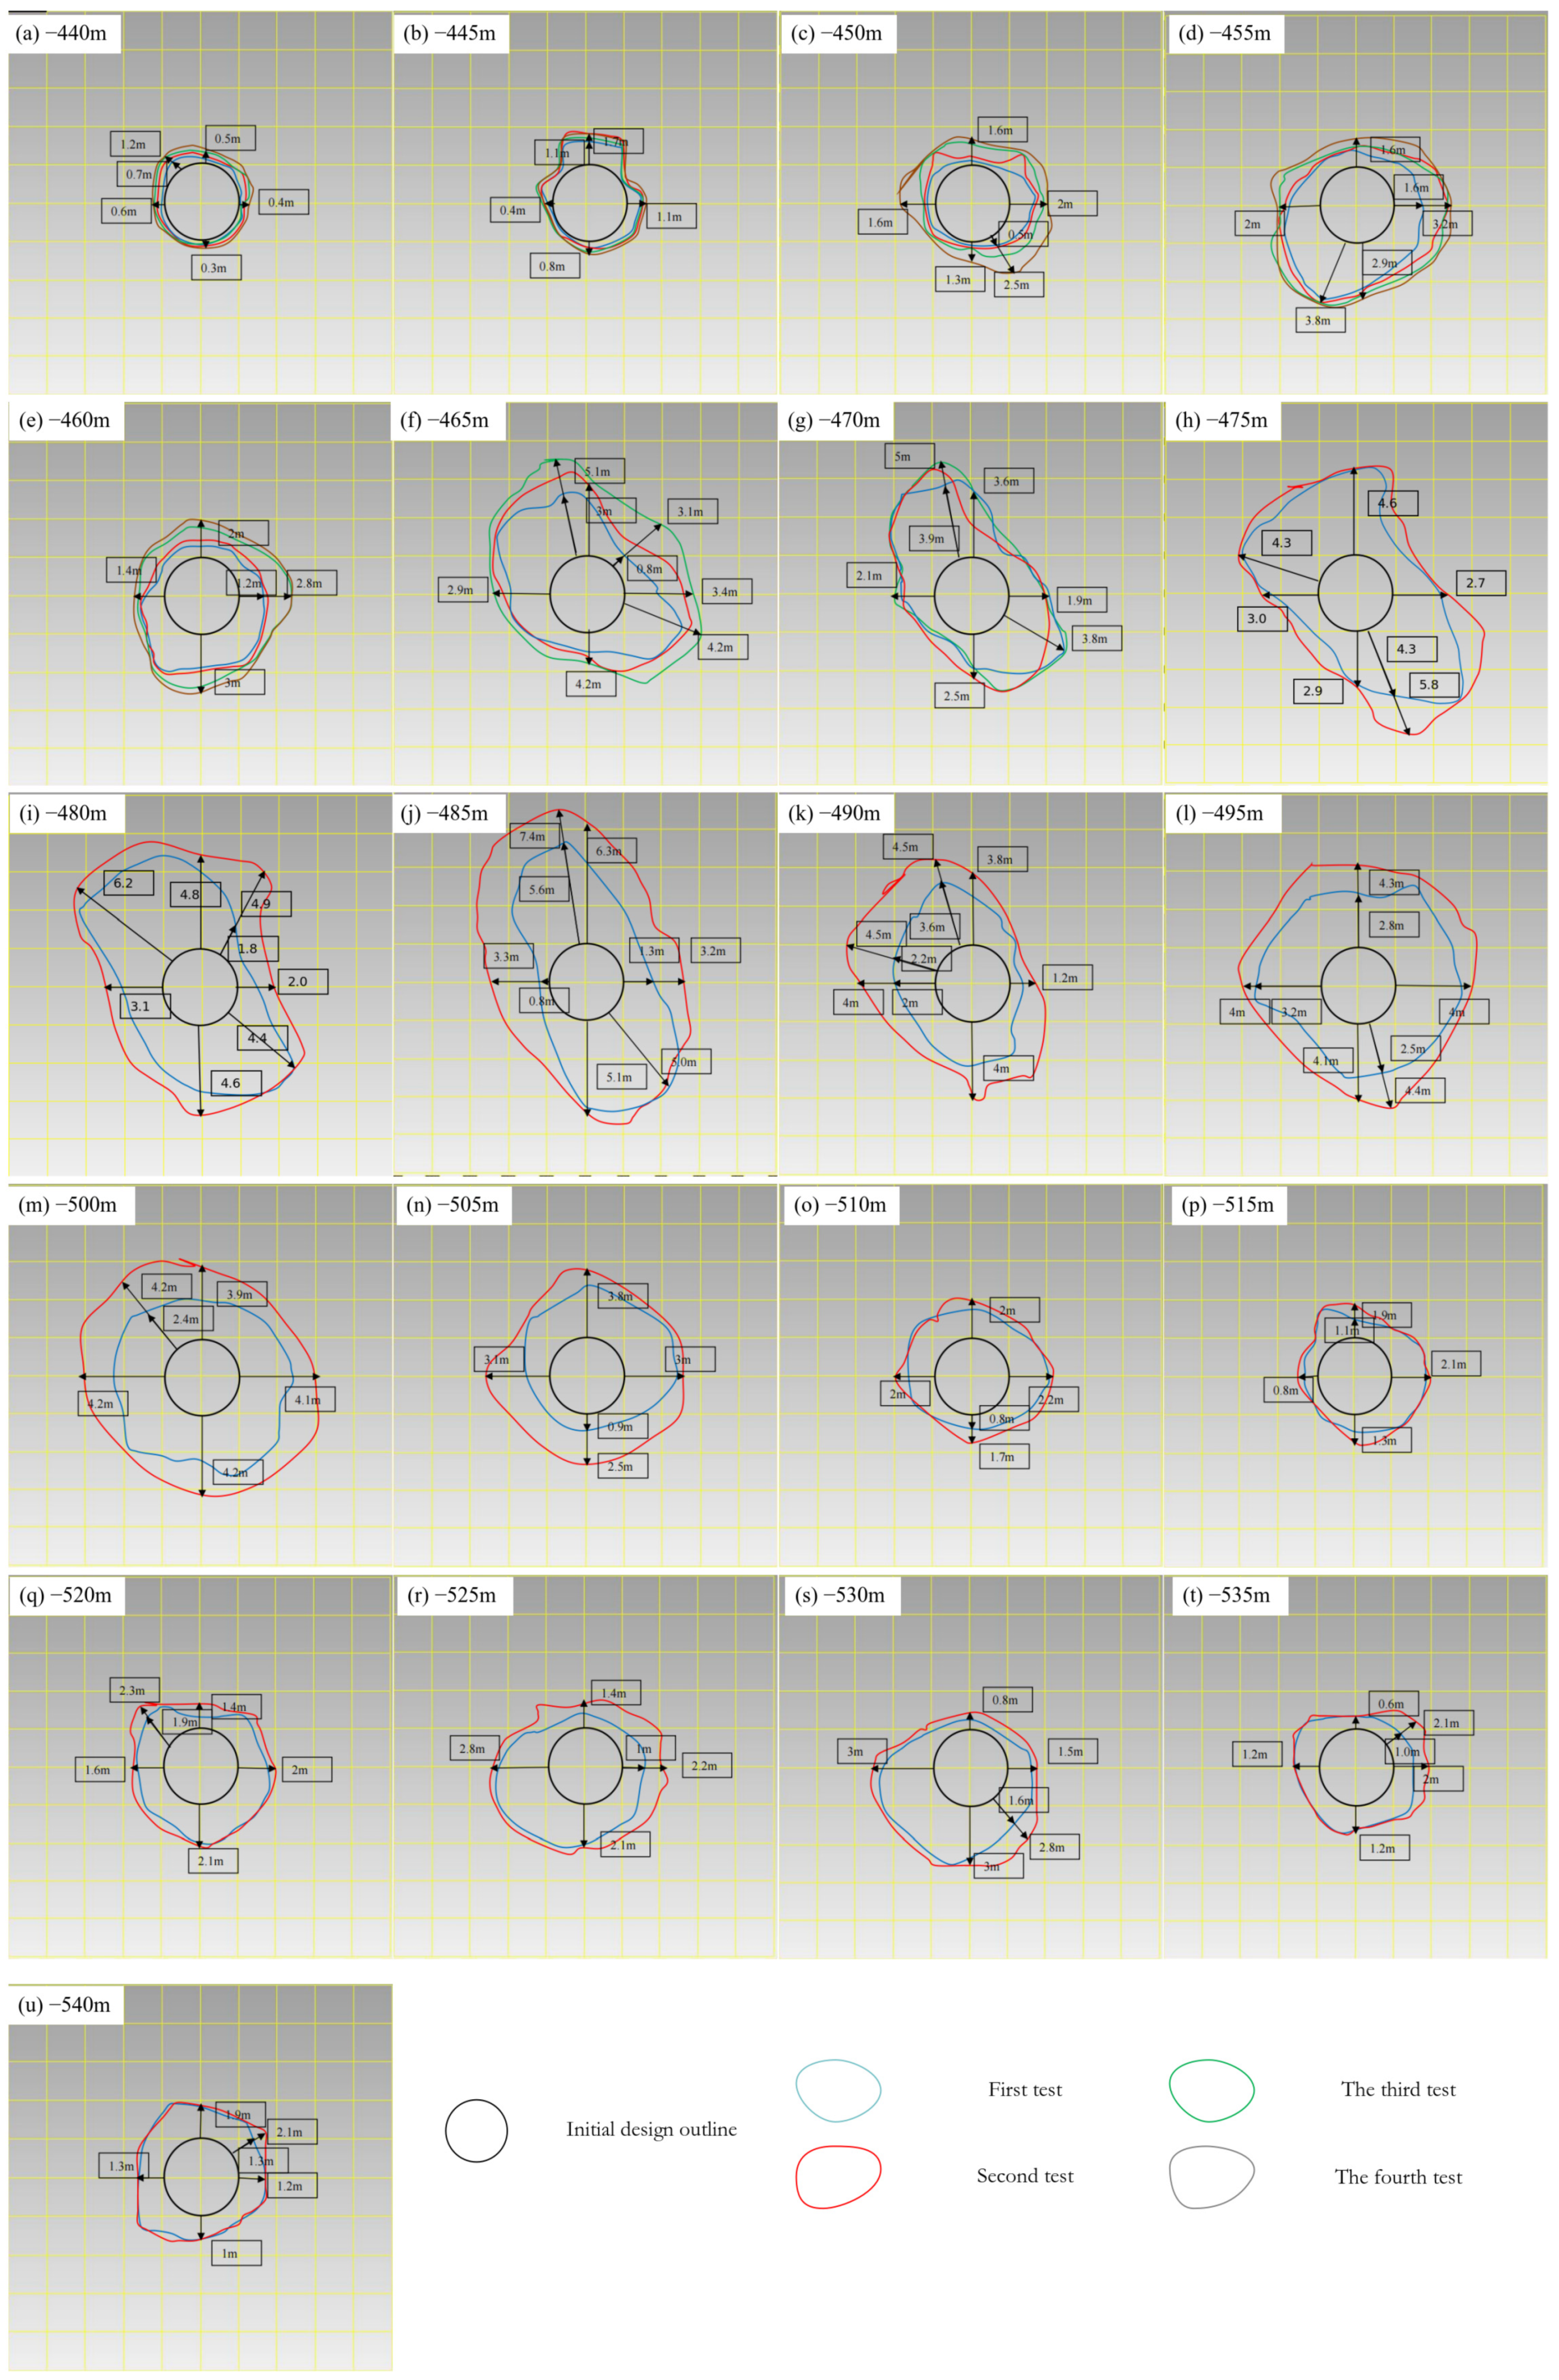
The 3# chute underwent four inspections (on 3 August 2013, 30 December 2013, 12 May 2014 and 23 October 2014), see Figure 8, covering a period of approximately 14.7 months. The maximum diameter is also located at the −485 m level, reaching 16.9 m. The maximum brush expansion occurs at the −480 m level, with a brush expansion value of 3.1 m and a maximum annual wear rate of 2.5 m [40].
Figure 8.
The 3# shaft inspection results: (a) first inspection on 3 August 2013; (b) second inspection on 30 December 2013; (c) third inspection on 12 May 2014; (d) fourth inspection on 23 October 2014.
As noted in Section 2.1, the 3# chute serves the −525 m level. The test results show that the wellbore walls at −525 m and below are mainly affected by the friction of the ore, and the expansion phenomenon is not obvious, which will not have a significant impact on the production level of the lower part temporarily. However, due to the cutting effect of rock joints and fissures [41,42], the overall wear of the wellbore still exhibits non-uniform characteristics, and there is a risk of block collapses falling in some areas [25,34]. The occasional occurrence of large rock blocks during the mining process also confirms this [26]; see Figure 9. The detailed test results are summarized in Table 3.
Figure 9.
The 3# comparison of cross-sectional data before and after shaft inspection.
Table 3.
Summary of inspection results for 3# chute.
The detailed cross-sectional information of the 3# chute is shown below. (All cross-sections are uniformly oriented towards the top of the picture in the direction of the chute, and all pictures are displayed at the same scale for comparison).
Through the analysis of the four inspection results of the 3# chute, the maximum diameter of the chute shaft is located at the −485 m level, with a maximum diameter of 16.9 m. During the time span of the four inspections (3 August 2013–23 October 2014), varying degrees of expansion occurred in the shaft. Among them, at −480 m, the maximum expansion value reached 3.1 m, and the maximum annual wear rate was 2.5 m [36,37,40].
The 3# chute is connected to the −525 m level, and after the main production stage enters the −525 m level, the ore and rock at this level will be transported from there. At present, the wellbore wall of the −525 m level and below is mainly affected by the friction of the ore, and the expansion phenomenon is not obvious (see the profile diagram of −525 m and below mentioned above), which will not have an impact on the lower −525 m level for the time being [41,42].
Due to cracks and joints in the surrounding rock, the wear is relatively uneven. It is not a continuous uniform wear, but a sudden drop of rock blocks in some weak areas. This can be verified by the occasional occurrence of large rock blocks during the mining process [25,26,34].
4. Analysis and Prediction of Chute Detection
4.1. Section and Shape Analysis
By comparing and analyzing the cross-sectional views of three chutes at different depths (−440 m to −550 m), all sections are uniformly oriented towards the top of the picture in the direction of the chute and displayed at the same scale. The following common conclusions can be drawn:
Uneven wear and tear: The wear and tear of the chute shaft is not continuous and uniform, but concentrated in local weak areas, manifested as block collapses, that are influenced by the joints and fissures of the surrounding rock [25,34,43].
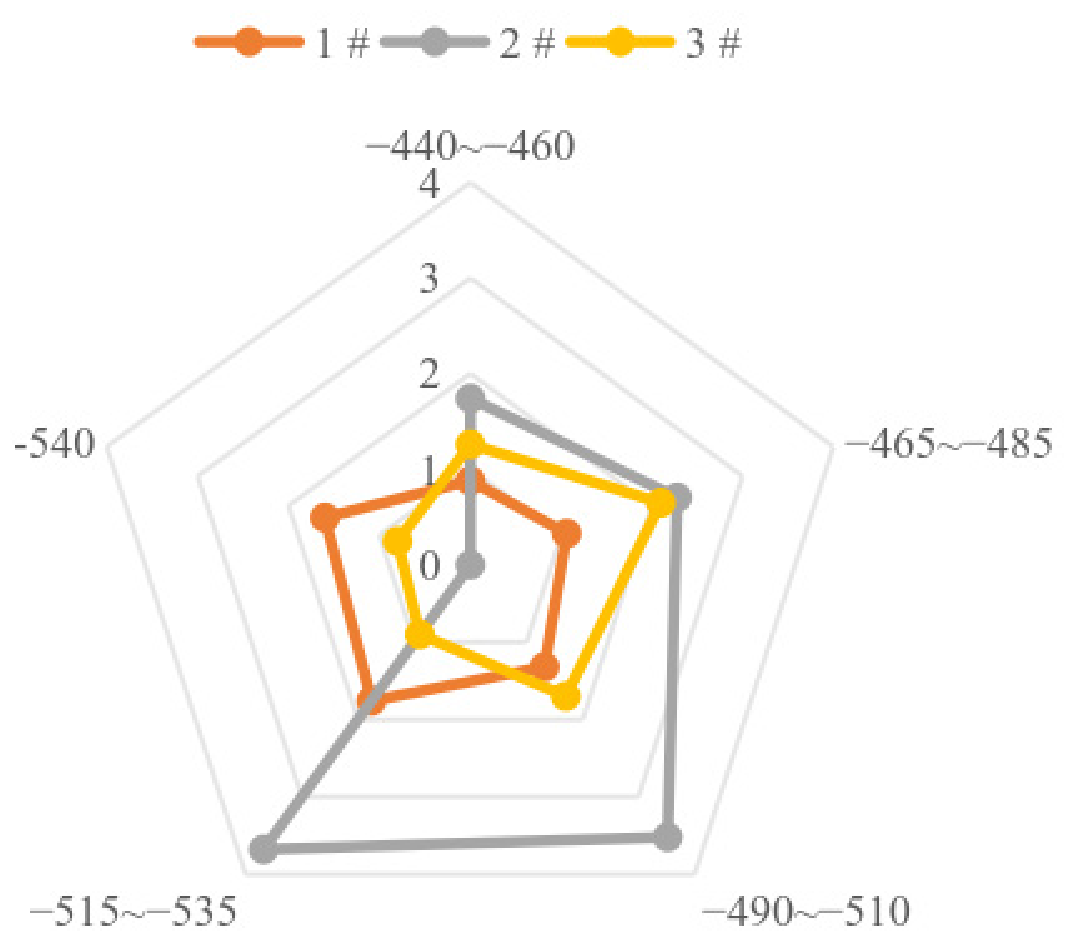
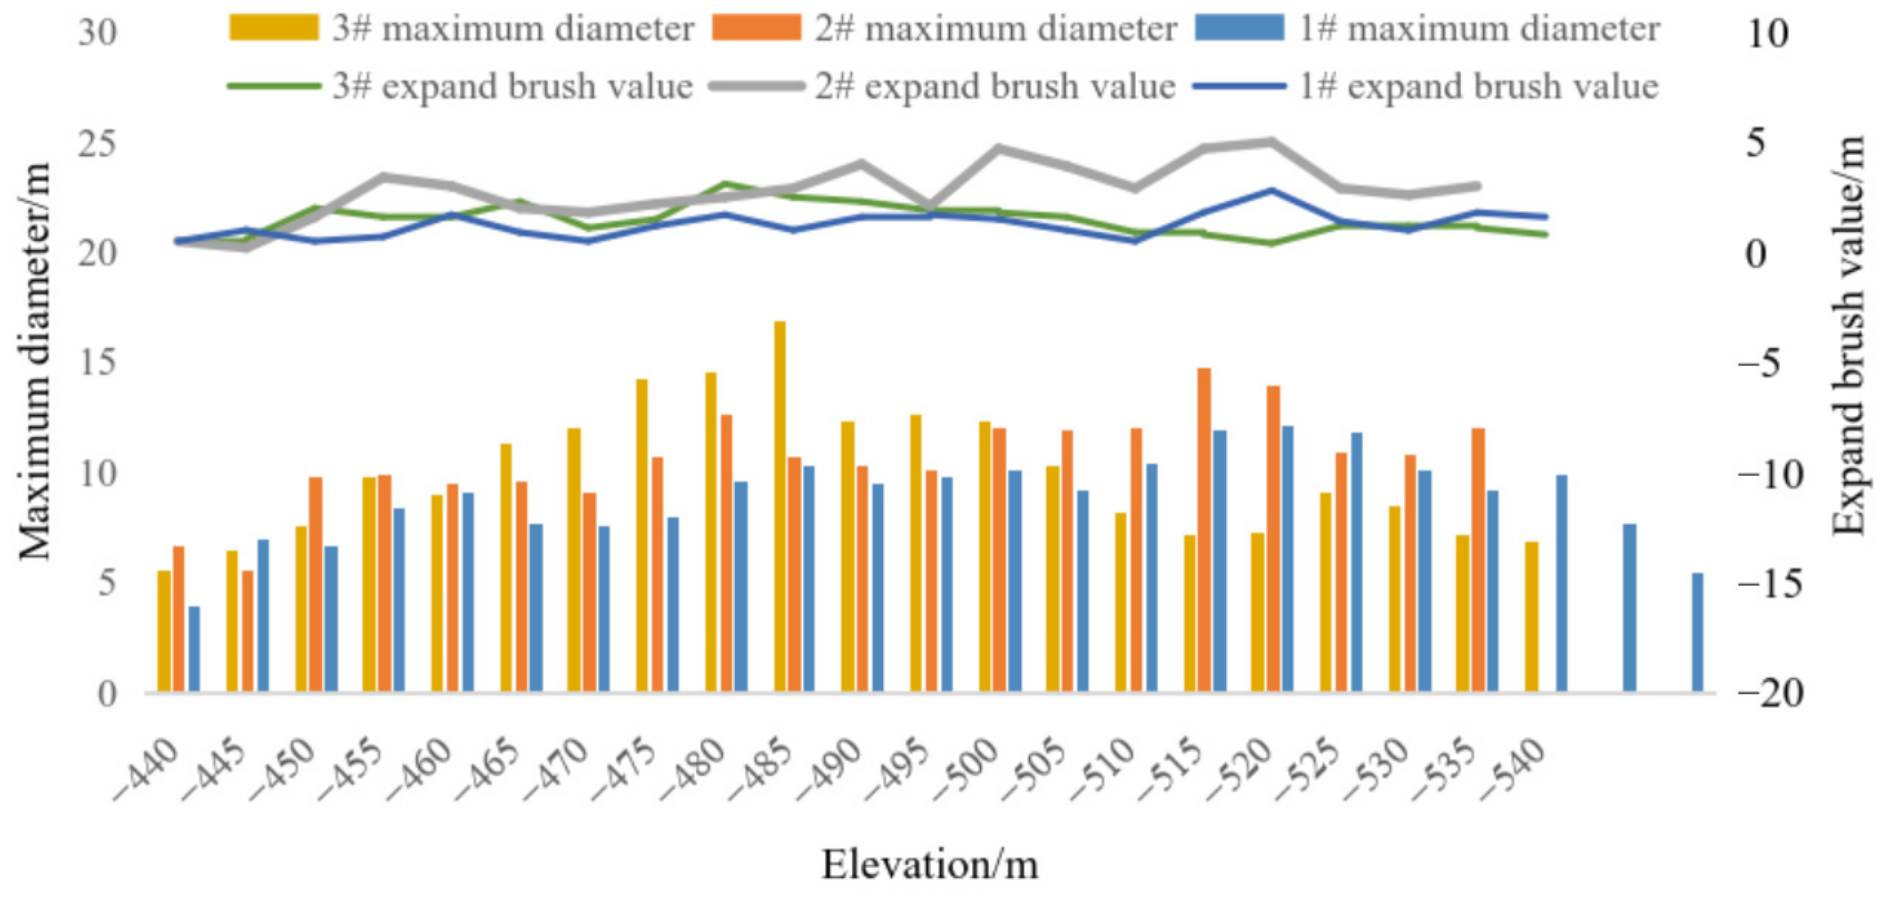
Concentrated expansion positions: The maximum expansion position is mostly concentrated in the range of −480 m to −520 m, which may be related to the poor quality of the surrounding rock, joint development, or high frequency of ore rock impact within this depth range [36,44,45].
There is a significant difference in wear rate among the three shafts: the annual wear rate of shaft 2 (6.0 m) is much higher than that of shaft 1 (2.4 m) and shaft 3 (2.5 m), indicating that its surrounding rock conditions or service strength are more severe [9,36].
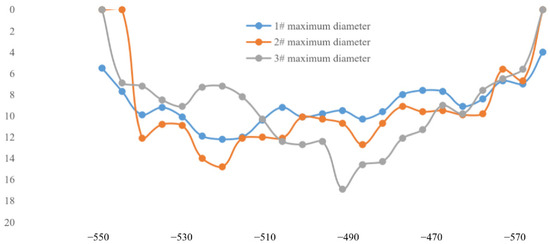
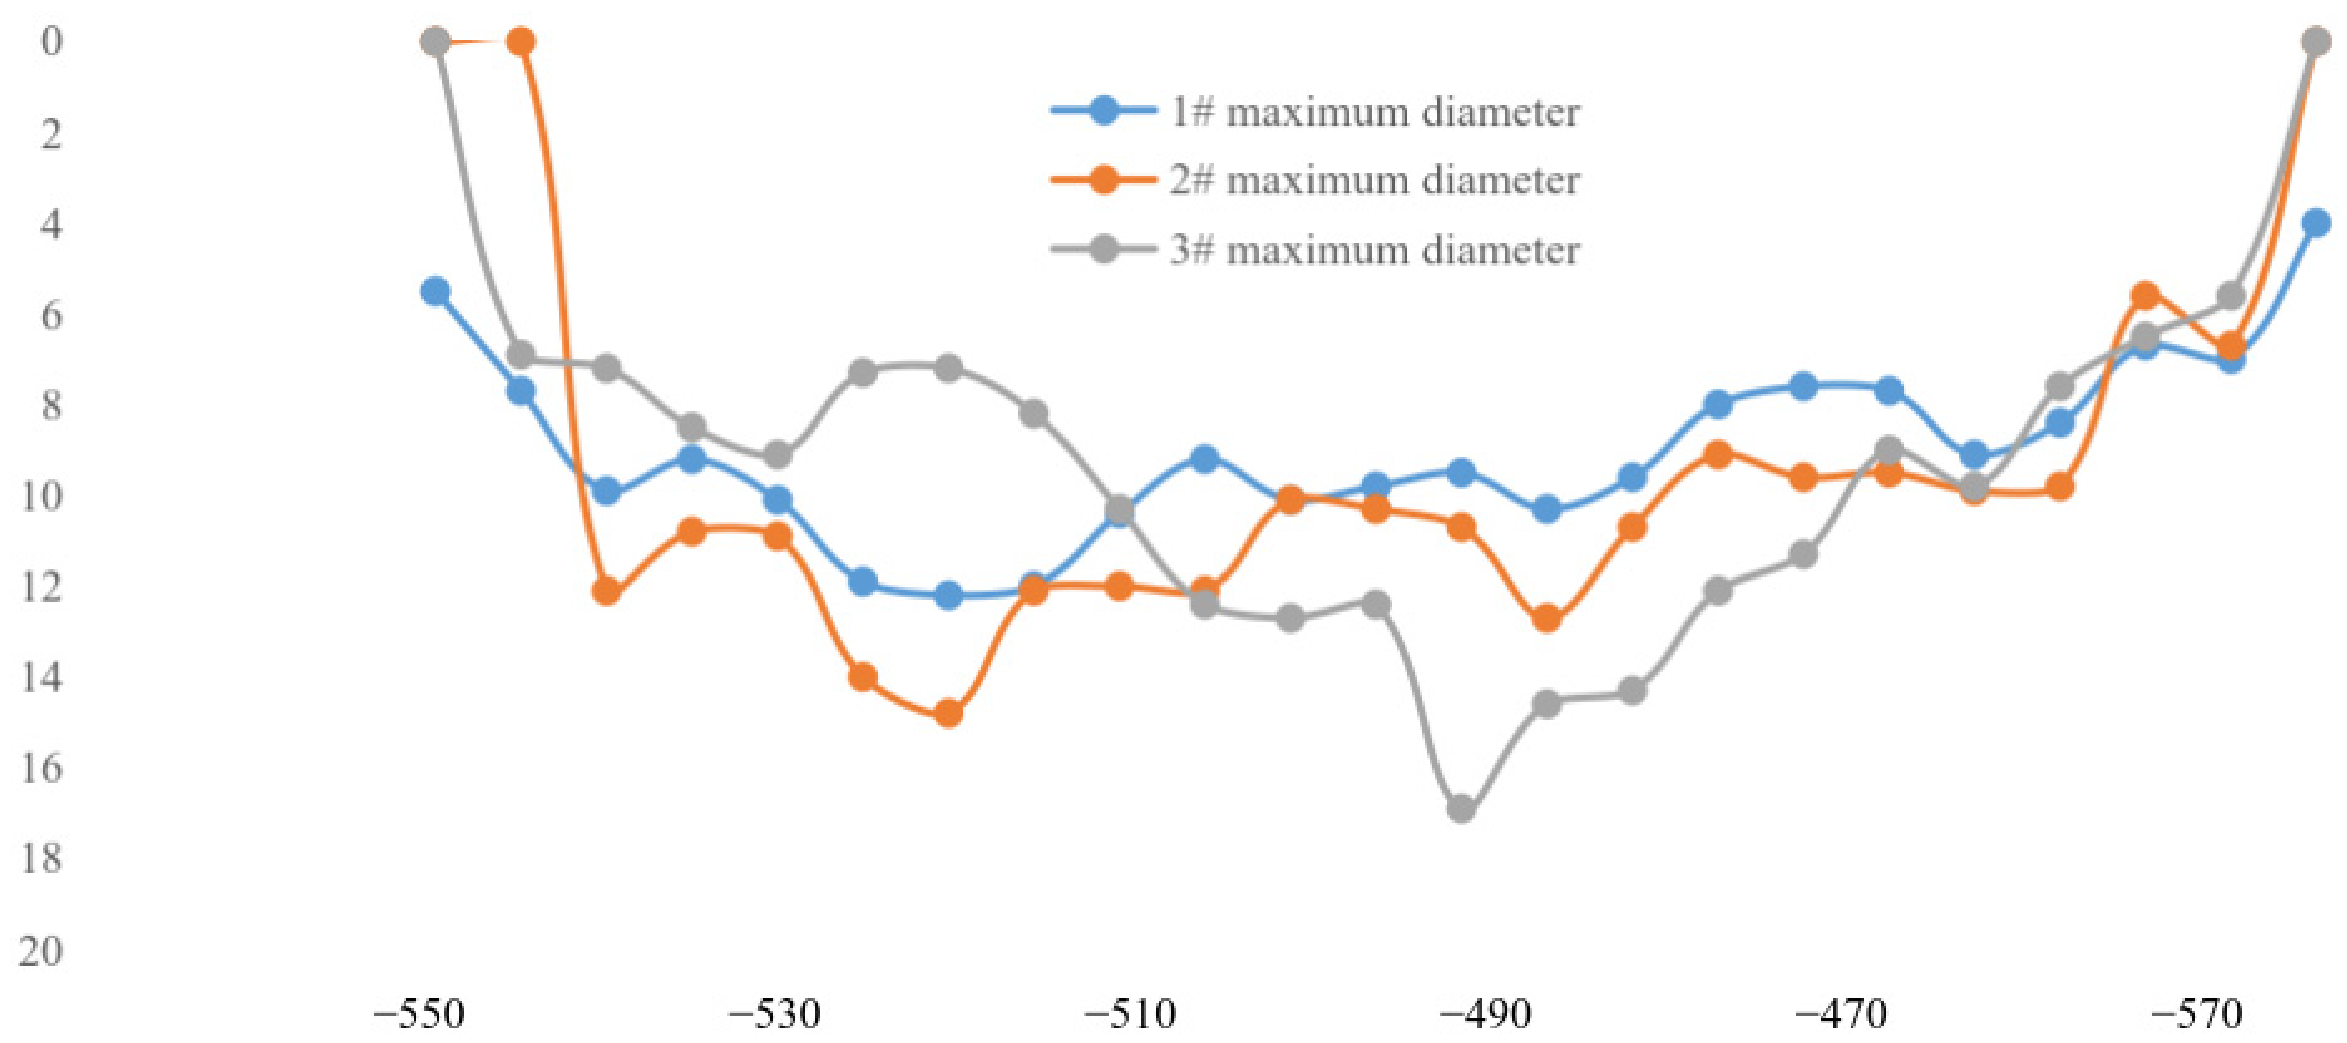
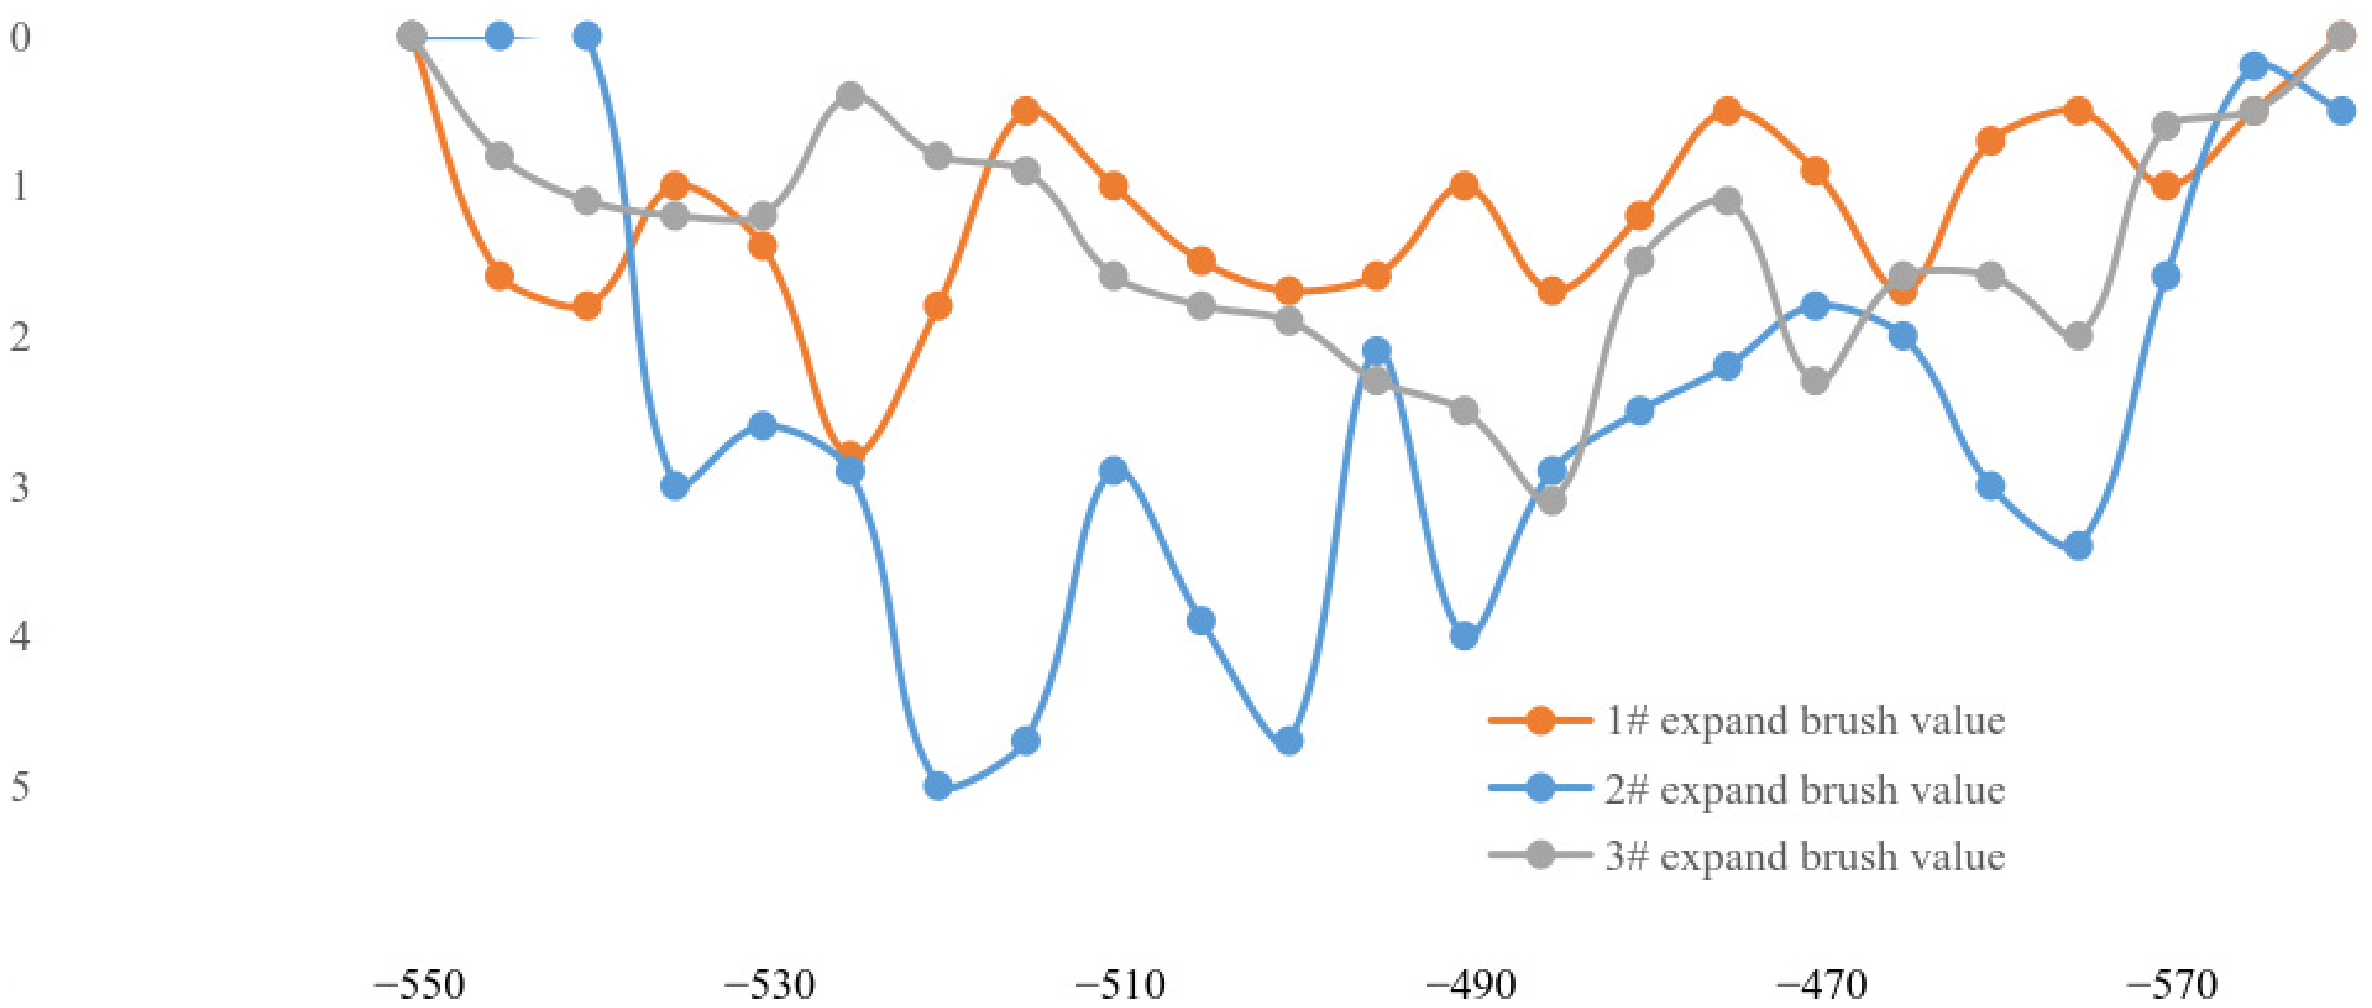
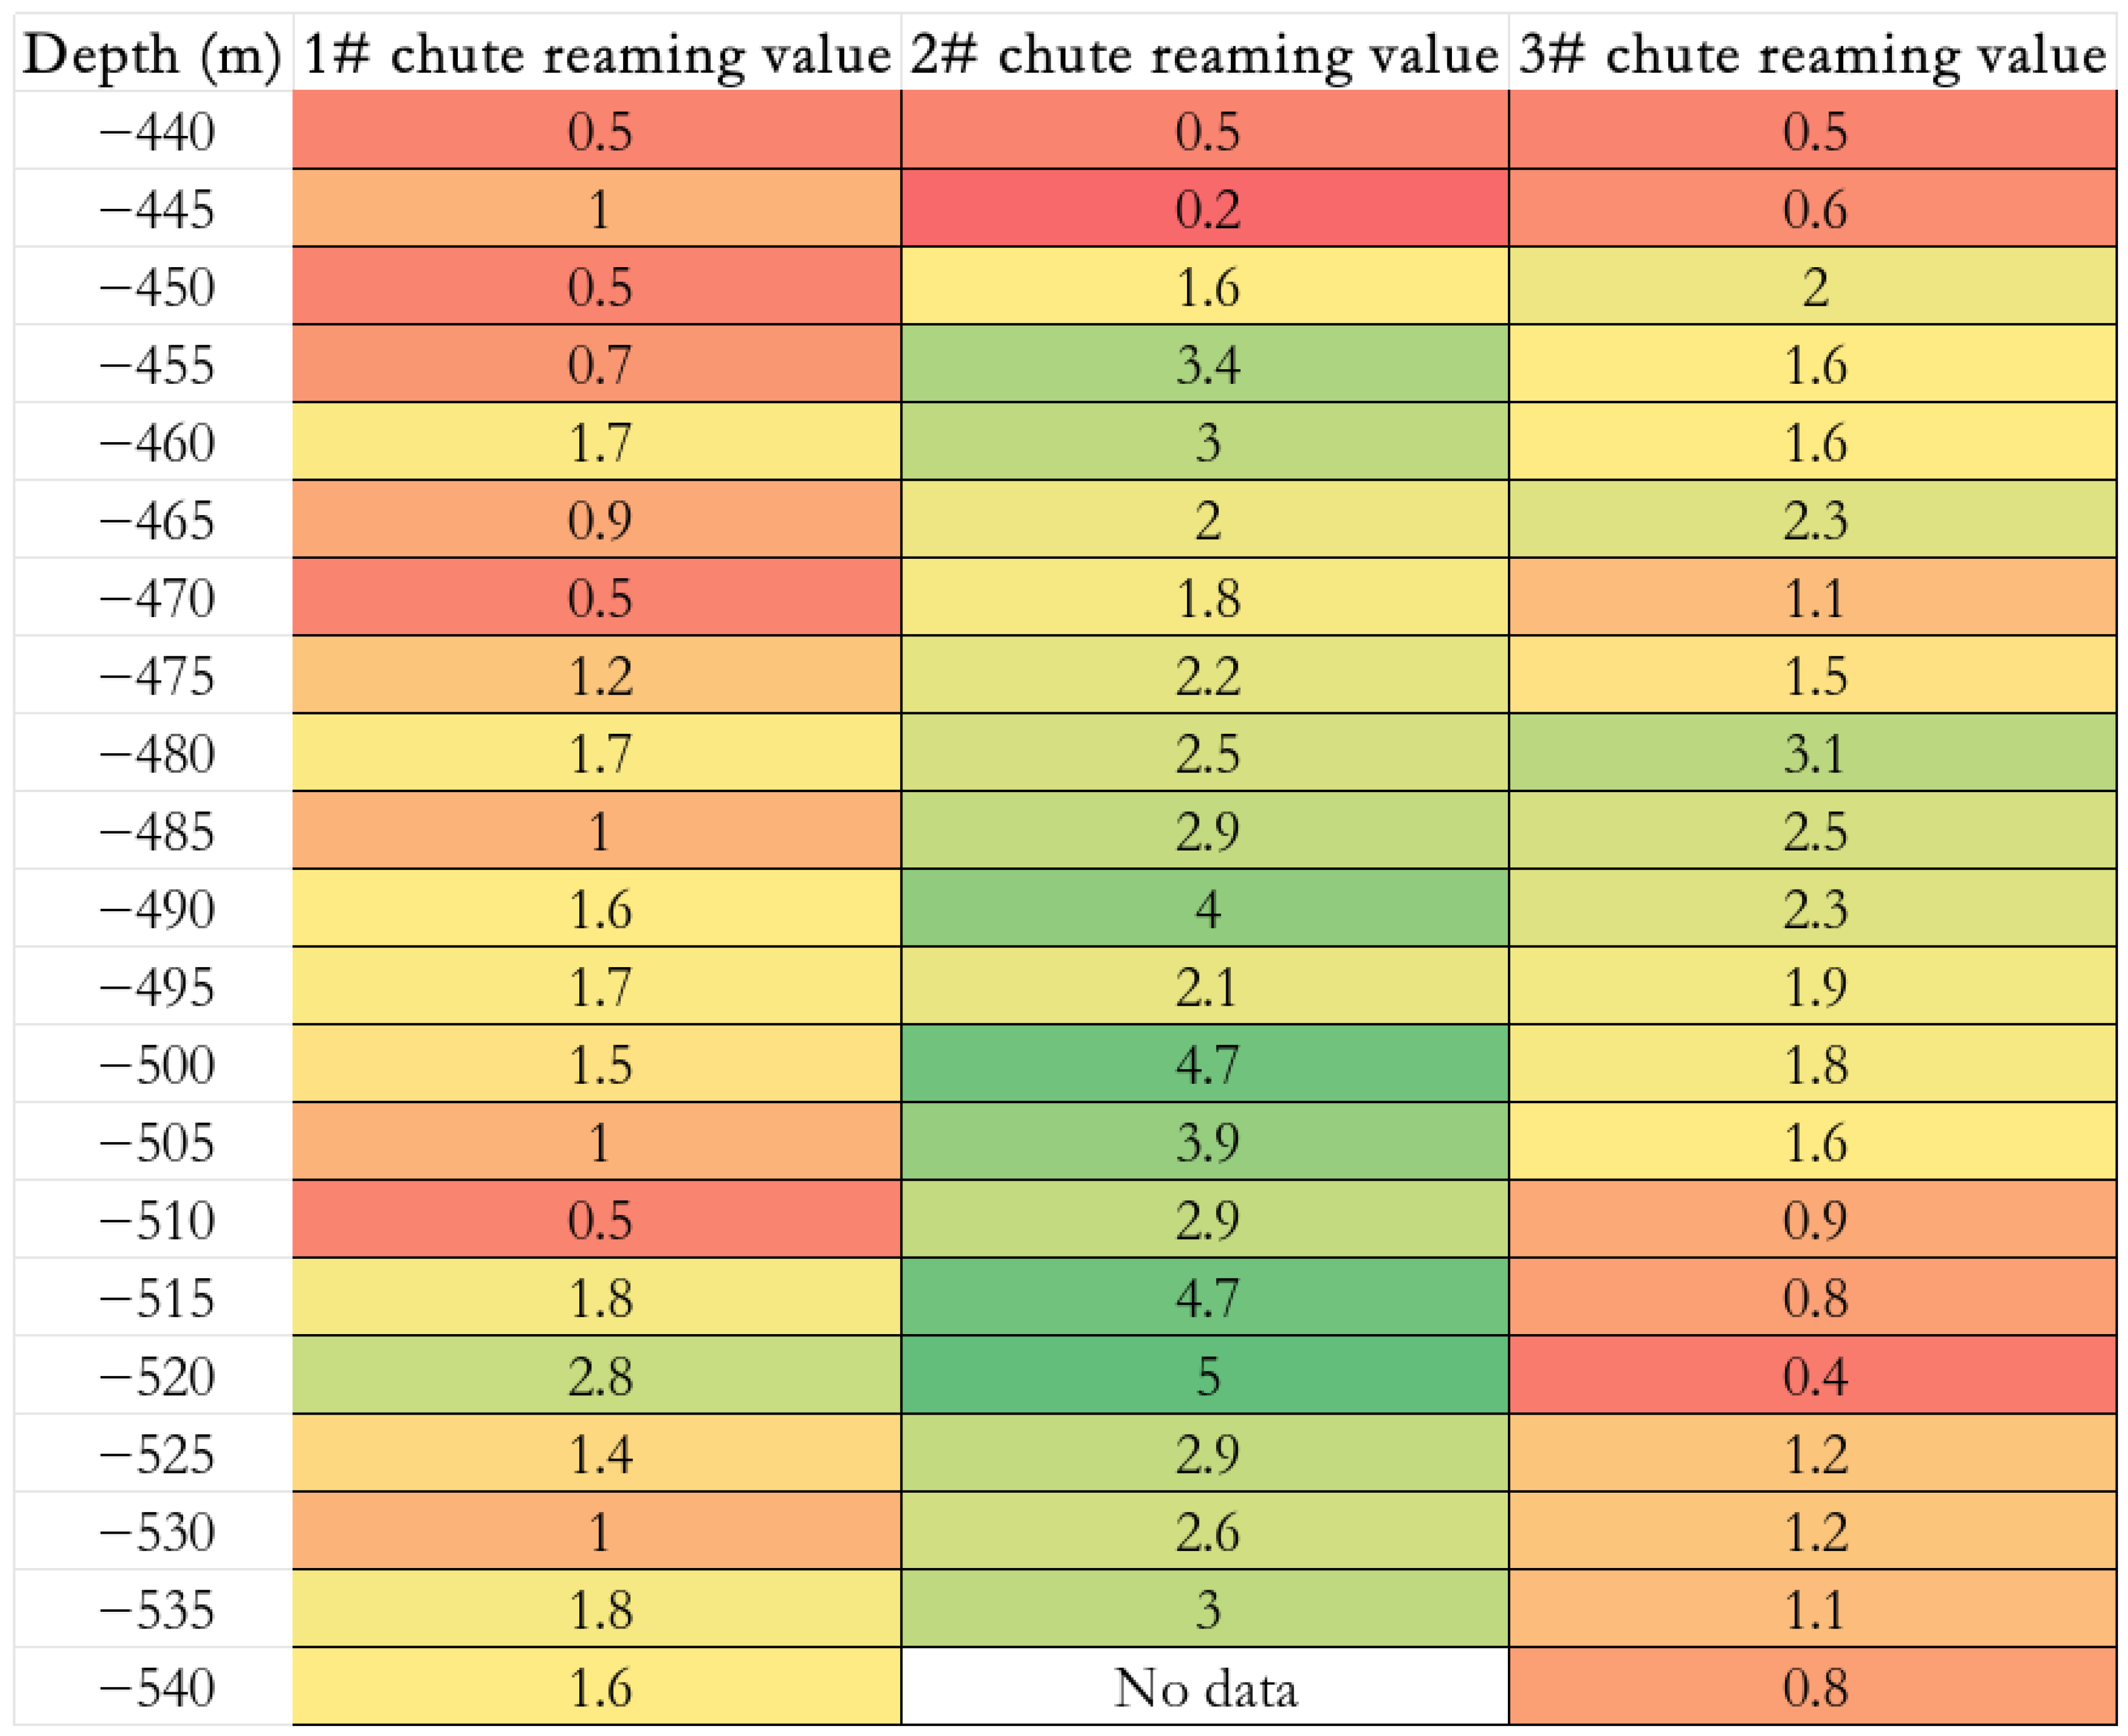
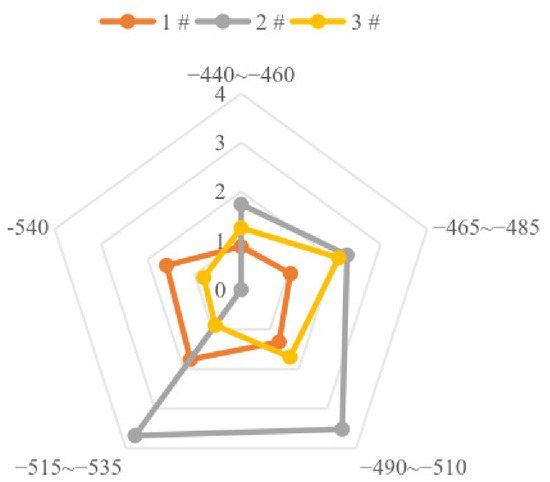
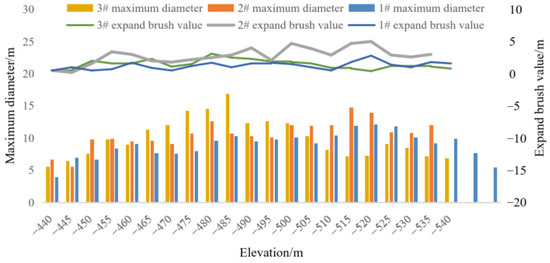
Through the C-ALS 3D laser scanning system, a full stage scanning inspection was conducted on the 1#, 2# and 3# chutes, which accurately obtained the 3D morphological changes inside the chutes (Figure 10). All three shafts have undergone significant deformation, with a maximum diameter of 16.9 m and an annual wear rate of up to 6.0 m (Figure 11 and Figure 12). The test results indicate that the damage to the chute is mainly affected by the block-shaped falling formed by the downward erosion and rebound of the ore during this impact (Figure 13). By comparing the test results and analysis of three chutes, data support was provided for the subsequent stability evaluation and reinforcement design of the chutes (Figure 14) [46].
Figure 10.
Maximum diameter of each chute (m).
Figure 11.
Expansion value of each chute (m).
Figure 12.
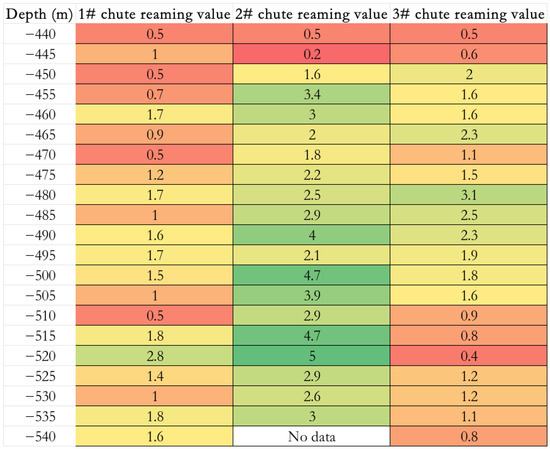
Heat map of expansion values.
Figure 13.
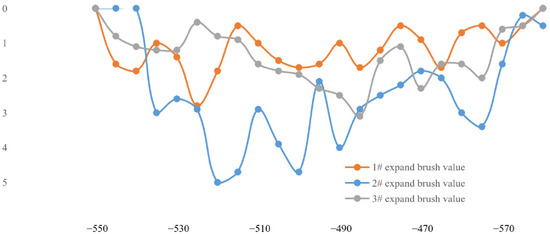
Distribution map of expansion values for each chute (1#, 2#, 3#) in different depth intervals (m).
Figure 14.
Comprehensive comparison chart of maximum diameter and expansion value of each chute.
4.2. Prediction of Cross-Sectional Morphology
Let the absolute depth value x = −Depth (unit: m, positive value), and the expansion value E (x).
Because there are roughly three main concentrated areas of spreading in each set of data, the superposition of three Gaussian peaks is adopted; refer to Formula (1) [16,47]:
among which
= predicted expansion value (m).
: Peak height.
: Peak center depth (m).
: Peak width.
Based on the expansion values of shafts 1#, 2#, and 3# at the same depth, the missing values in each shaft’s data are first removed, and the arithmetic mean of the expansion values of shafts 1#, 2#, and 3# at the same depth is taken to obtain a comprehensive expansion value sequence. On this basis, three main peak intervals (approximately 462 m, 497 m and 520 m) were identified, and a model with three peak Gaussian functions superimposed on a constant baseline was used for fitting. By adjusting the amplitude, center position, and width parameters of each peak, the predicted values were as close as possible to the measured comprehensive mean. Finally, a brush expansion value prediction formula applicable to the depth range of 440 m to 540 m was established [48].
In the model validation, the fitted prediction formula was substituted into a typical depth (such as 500 m) for calculation, and it was found that the preliminary predicted value was slightly higher than the measured comprehensive mean. Therefore, the amplitude, width parameters, and baseline values of the three Gaussian peaks were fine-tuned. Finally, an empirical formula containing a constant baseline of 0.5 and three Gaussian terms was determined, with peak centers located at −462 m, −497 m and −520 m, respectively, which can comprehensively reflect the three chutes’ expansion pattern and be used for predicting expansion values at any position within the depth range of 440 m to 540 m; refer to Formula (2) [16,47,48].
Among them: x = absolute depth value (m, for example, 460 is taken as −460 m).
= predicted expansion value (m).
This model can predict the average expansion value at any depth within the range of −440 m~−540 m, integrating the rules of three chutes [16,47].
4.3. Analysis of Prediction Results
Based on multi-period 3D laser scanning detection data, this section further constructs a time evolution model, residual life prediction method, and probability confidence interval for the expansion of the chute, providing a quantitative basis for the dynamic evaluation and maintenance decision-making of the chute [47,48,49].
4.3.1. Time Evolution Prediction: Comparison Between Exponential and Linear Models
Taking the 3# chute with the highest number of detections as an example (a total of four detections, spanning from August 2013 to October 2014), select the depth level with the most significant expansion (such as −480 m), and record the maximum expansion value E (t) for each period. Assuming the initial detection time is t0 with expansion E0, and subsequent times ti with expansions Ei, a linear model Formula (3) is used [47]:
The exponential model Formula (4) was also tested: [50,51]
where a, b, c, k and d are undetermined parameters, which can be obtained by fitting the measured data. Determine the parameters using the least squares method and compare the goodness of fit (R2) and residual distribution of the two models. The results showed that the expansion of the 3# chute at −480 m was more consistent with a linear growth trend, with an annual growth rate of about 2.5 m/year, while the exponential model did not show significant acceleration characteristics, indicating that the current stage of wear is dominated by mechanical friction and local block drops and has not yet entered the unstable acceleration stage [42,43,47].
4.3.2. Remaining Life Prediction: Safety Life Estimation Based on Extreme Diameter
The safe-limit diameter for the use of the chute is defined as Dlim. Based on engineering experience and structural stability requirements, Dlim = 16 m (the original design section is approximately 6 m) [36,44,52]. Assuming the current maximum diameter is Dcurr and the annual wear rate is v (unit: m/year), the remaining safe service life Trem can be estimated by the following Formula (5):
Dlim: Safety-limit diameter for chute use.
Dcurr: Current maximum diameter.
v: Annual wear rate.
Trem: Remaining safe service life.
Taking the 2# chute as an example, the current maximum diameter is 14.8 m (−515 m horizontal), and the annual wear rate is v = 6.0 m/year [9,36]. Substituting the above equation yields, refer to Formula (6).
That is about 2.4 months. Considering that the expansion of the chute at −520 m has reached 5.0 m, and the actual local diameter may have approached or exceeded 16 m, there is a high risk of sudden instability. It is recommended to immediately stop using it or take high-strength reinforcement measures [53].
For the 1# and 3# chutes’ remaining lifetimes, refer to Formulas (7) and (8):
It is worth noting that, upon data verification, the maximum diameter of chute No.3 at the −485 m level has reached 16.9 m, exceeding the prescribed safe limit diameter of 16 m. Its nominal remaining service life is negative, indicating that the chute is in an over-limit state. Accordingly, it shall be assigned the highest priority, and high-strength reinforcement or suspension of service shall be implemented immediately, rather than continuing routine monitoring [36,44].
These results indicate that the surrounding rock dimensions should be re-evaluated using rock mechanics, and the limit values are empirical and may differ in other projects. When these values are referenced in other engineering practices, optimization design should be carried out based on the actual situation.
4.3.3. Probability Prediction: Estimation of Confidence Interval for Expanding Brush Value
To quantify the uncertainty of the expansion prediction, based on the expansion value samples of three chutes at the same depth, we calculate the mean and standard deviation σ(x) at each depth level. Assuming that the expansion values follow a normal distribution [50,54], the (1 − α) × 100% confidence interval at a certain depth x is Formula (9).
- n: Sample size (total number of chute cases, 3).
- : Significance level.
- /2: The (upper) quantile of the standard normal distribution.
- 1 − a: Confidence level.
Here, n = 3 represents the number of chutes, and zα/2 is the quantile of the standard normal distribution (e.g., when α = 0.1, z0.05 = 1.645, corresponding to a 90% confidence interval).
Taking the −520 m depth as an example, the expansion values of the three shafts are 2.8 m, 5.0 m and 1.4 m, respectively. The calculated is 3.07 and σ is 1.85 m. The 90% confidence interval is as follows:
This interval reflects the statistical fluctuation range of the expansion value of the chute at −520 m, which can provide a risk boundary for engineering decision-making [47,54].
4.3.4. Suggestions for Comprehensive Prediction Process
In summary, it is recommended to establish a dynamic and quantitative process for predicting and evaluating the expansion of the chute in practical engineering. Firstly, based on multi-period 3D laser scanning data, the critical depth range with the most severe expansion (such as −480 m to −520 m) should be accurately extracted, and the evolution trend of expansion should be judged according to the time series. The appropriate form should be selected between linear and exponential models [47,50]. On this basis, combined with the set limit diameter (such as 16 m) and the current maximum annual wear rate, estimate the remaining safe service life of each chute [36,44]. At the same time, the expansion value samples of multiple chutes at the same depth should be used to calculate their mean and standard deviation, and then provide a confidence interval for the expansion value at a certain confidence level (such as 90%) to quantify the uncertainty of the prediction [47,54]. As the number of detections increases, it is necessary to continuously update the model parameters and prediction results to achieve a closed-loop system of monitoring, modeling, prediction, and update, providing a scientific basis for the priority ranking and risk control of the reinforcement of the chute [11,28,29].
5. Discussion
From the perspective of the wear rate, the 2# chute has expanded by 5.0 m in less than 10 months, with an annual wear rate of up to 6.0 m [9,36], while the 3# chute, with a maximum diameter of 16.9 m, has an annual wear rate of only 2.5 m and a remaining design life of 21 years (based on 2014) [23]. This stark contrast indicates that the wear rate is the key indicator determining whether the chute can reach its designed service life, rather than simply the maximum diameter. If reinforcement measures are not taken for the 2# chute and its current wear rate continues, its diameter at −520 m will exceed the safety threshold of 16 m within 1 to 2 years, posing a serious risk of failure [36,38,44]. Therefore, the wear rate must be comprehensively evaluated based on the surrounding rock conditions, service strength, and reinforcement measures [3,5,25].
From the perspective of spatial distribution, the deformation of the chute shows obvious unevenness, with the maximum expansion location concentrated near three depths of −462 m, −497 m and −520 m, corresponding to the three peak centers of the Gaussian model, indicating that the above intervals are the common weak zones of the chute structure [16,40,47]. Among them, the range of −480 m to −520 m is particularly prominent, which is speculated to be related to the poor quality of the surrounding rock, dense joints, or high frequency of mineral rock impact within this depth range [25,34,36]. The expansion prediction formula established through the three-peak Gaussian model can effectively reflect the nonlinear multimodal distribution of expansion along depth in the range of −440 m to −540 m, and the predicted values have good consistency with the measured comprehensive mean [16,47,48].
It is worth noting that although the three chutes show obvious common characteristics at the peak of expansion, individual differences are also significant. The expansion amplitude of the 2# chute at −520 m is much higher than that of the 1# and 3# chutes, indicating that even in the same geological environment and depth range, local differences in surrounding rock conditions or service strength can still have a significant amplification effect on the expansion amplitude [16,36,44]. This discovery suggests that in the design and reinforcement of chutes, unified management should not only be based on depth intervals, but also differentiated assessments of the actual service status of each chute, and the −480 m to −520 m interval should be the focus of monitoring and management [16,40,47,55,56].
The innovation and contribution of this study are as follows. Firstly, at the level of data acquisition, unlike most studies that rely on theoretical analysis, numerical simulation, or indirect measurement, this study used a C-ALS portable 3D laser scanning system to conduct on-site measurements of the actual cross-sectional profiles and high-density point cloud data of three in-service large chutes, overcoming the objective difficulty of direct contact measurement for such vertically constrained structures. Secondly, at the spatial modeling level, this study proposes a three-peak Gaussian superposition model to describe the non-uniform and multimodal distribution characteristics of the expansion amount along depth, breaking through the common assumption of uniform wear or empirical linear contour in previous research, and providing a new mathematical tool for the quantitative characterization of the deformation of the chute. Thirdly, at the level of time evolution, using the four-phase detection data of the 3# chute, the fitting effect of the linear model and the exponential model was quantitatively compared, confirming that the current wear stage is still in the linear growth interval. This conclusion directly serves the formulation and priority ranking of maintenance plans. Fourthly, at the level of engineering decision-making, an integrated probabilistic life prediction framework was constructed by combining deterministic residual life estimation based on limit diameter with uncertainty quantification (confidence interval) based on three chute samples. This framework provides a more comprehensive risk boundary and decision support than the commonly used single value prediction in the literature.
It should be acknowledged that the present study lacks systematic quantitative characterization of discontinuities (e.g., orientation, spacing, persistence, RQD, and RMR/Q/GSI) and in situ stress data. Consequently, the interpretation that the observed non-uniform wear is controlled by joints and fissures remains a working hypothesis based on deformation phenomena, rather than a rigorously validated conclusion. To further verify this mechanism, future work should include systematic discontinuity mapping, rock mass classification, and numerical modeling incorporating a discrete fracture network (DFN) coupled with continuum–discontinuum methods, following the approach of Esmaieli [57].
6. Conclusions and Suggestions
6.1. Conclusions
Through multi-stage C-ALS 3D laser scanning detection and comparative analysis of the 1#, 2# and 3# chutes of the iron mine, the following main conclusions are drawn:
Severe deformation: Significant wellbore expansion and non-uniform deformation occurred in all three chutes. Among them, the maximum diameter of the 1#, 2# and 3# chutes reached 16.9 m (located at the −485 m level), far exceeding the original design section, indicating that the structure of the chutes has been severely damaged.
During the inspection period, the maximum annual wear rates of the three shafts were 2.4 m, 6.0 m and 2.5 m, respectively. The wear rate of shaft 2 was significantly higher than those of the other two shafts, indicating that its surrounding rock conditions or service loads were more severe, with the highest risk of damage, and urgent reinforcement was needed.
The damage mechanism is influenced by joint fissures: the expansion of the chute is mainly manifested as local block collapses falling, rather than continuous and uniform wear. The cross-sectional maps at various depths show that the expansion is mostly concentrated in the weak areas in zones with well-developed joints and fissures, indicating that the structural planes of the surrounding rock are the key factors influencing the failure mode and evolution process of the chute. It should be noted that this interpretation is presently proposed as a working hypothesis based on observed deformation phenomena, and further site-specific discontinuity mapping and numerical modeling are required for rigorous verification.
Parts of the sections are relatively stable. Taking the 3# chute as an example, the level of −525 m and below mainly bears the frictional effect of the ore, and the expansion phenomenon is not obvious, indicating that there are differences in the failure modes at different depth levels, and the wear rate of the friction-dominated section is relatively low.
In terms of prediction, the expansion depth of the three chutes is concentrated near −462 m, −497 m and −520 m, forming a common weak zone that should be monitored and reinforced as a key area. The expansion shows a non-linear multimodal distribution pattern along depth, and the predicted values are in good agreement with the measured mean. Although the peak position of expansion is similar, the expansion amplitude of the 2# chute at −520 m is much higher than that of the 1# and 3# chutes, indicating a significant amplification effect of differences in the surrounding rock or service conditions.
6.2. Suggestions
Based on the above conclusion, the following suggestions are proposed for the subsequent operation and maintenance of the iron ore slide. Firstly, for the most severely deformed 3# chute, systematic reinforcement measures such as anchor spraying, steel lining, or grouting should be taken immediately to prevent sudden instability. Secondly, it is recommended to install a dynamic monitoring system that integrates 3D laser scanning and displacement sensors, focusing on monitoring the common weak zone from −480 m to −520 m, to achieve real-time feedback on wellbore deformation and surrounding rock stability. Finally, further research should be conducted on the evolution of rock joints and fractures, combined with geological radar and other methods to reveal the coupling mechanism of impact friction fracture propagation, providing a theoretical basis for predicting the life of the chute and evaluating its long-term stability.
Author Contributions
Methodology, C.Z.; software, H.Q.; data curation, H.Q.; writing—original draft, C.Z., Z.L. and Z.H.; writing—review and editing, C.Z. and H.Q.; supervision, H.Q.; funding acquisition, Z.H. and Z.L. All authors have read and agreed to the published version of the manuscript.
Funding
This work was supported by the Special Fund for Basic Scientific Research of the China Academy of Safety Science and Technology (Grant No. 2026JBKY01), the National Natural Science Foundation of China (Project No. 52274249, 52334003).
Institutional Review Board Statement
Not applicable.
Informed Consent Statement
Not applicable.
Data Availability Statement
The original contributions presented in this study are included in the article. Further inquiries can be directed to the corresponding author.
Acknowledgments
The authors would like to thank the referees for their valuable comments and suggestions.
Conflicts of Interest
The authors have no relevant financial or non-financial interests to disclose.
References
- GB 51036-2014; Specification for Quality Acceptance of Mining Shaft and Lane Engineering in Nonferrous Metals Mines. China Planning Press: Beijing, China, 2014.
- Lu, Z.; Ma, C. Research on Mineral Rock Movement and Its Hazards and Countermeasures in Metal Mine Slippers; Science Press: Beijing, China, 2024. [Google Scholar]
- Lu, Z.; Ma, C.; Cao, P.; Ma, Q. The current status and direction of research on the problem of metal mine slip. Met. Mines 2019, 3, 1–9. [Google Scholar]
- Skawina, B.; Salama, A.; Gunillasson, J.; Strömsten, M.; Wettainen, T. Comparison of Productivity When Running Filled, Near-Empty, or Flow-Through Orepass Using Discrete Event Simulation. Mining 2022, 2, 186–196. [Google Scholar] [CrossRef] [Scilit]
- Hadjigeorgiou, J.; Stacey, T.R. The absence of strategy in orepass planning, design, and management. J. South Afr. Inst. Min. Metall. 2013, 113, 795–801. [Google Scholar]
- Li, J.; Ma, Y.; Fu, X. Three dimensional laser scanning detection and damage analysis of the Li Guanji iron ore pass. Mod. Min. 2022, 6, 45–48. [Google Scholar] [CrossRef] [Scilit]
- Liu, Y.; Lv, L.; Nan, D.; He, J.; Wei, J. Research and Application of Impact Damage Mechanism of Main Chutes in Metal Mines. In Hydraulic and Civil Engineering Technology X; Series Advances in Transdisciplinary Engineering; IOS Press: Amsterdam, The Netherlands, 2025; pp. 1109–1114. [Google Scholar] [CrossRef] [Scilit]
- Potvin, Y.; Hadjigeorgiou, J.; Wesseloo, J. Towards optimising ground support systems in underground mines. In Proceedings of the Ninth International Symposium on Ground Support in Mining and Underground Construction, Sudbury, ON, Canada, 23–25 October 2019; pp. 493–502. [Google Scholar]
- Zeng, S. Damage analysis and prevention of open-pit chute based on C-ALS measurement. Fujian Metall. 2020, 5, 14–17. [Google Scholar] [CrossRef] [Scilit]
- Ma, C.; Mozumder, S.A.; Hossen, M.; Shao, M.; Jiang, Y. Research on Vertical Shaft Detection System Based on CMOS-Camera and Lidar. IEEE Access 2024, 13, 36247–36262. [Google Scholar] [CrossRef] [Scilit]
- Yu, L.; Jian, W.; Guoguang, L.; Wenxiao, S. A deformation detection method for chute based on SLAM technology. Appl. Laser 2021, 41, 916–922. [Google Scholar]
- Rutkowski, W.; Lipecki, T. Use of the iPhone 13 Pro LiDAR Scanner for Inspection and Measurement in the Mineshaft Sinking Process. Remote. Sens. 2023, 15, 5089. [Google Scholar] [CrossRef] [Scilit]
- Wang, S. Research on collapse detection and safety measures of chute based on laser scanning technology. Mod. Min. 2023, 39, 183–186. [Google Scholar]
- Sha, W.; Zhang, C.; Peng, Z.; Wei, Y.; Chen, K. Fine scanning and modeling technology for the ore pass in the Pulang copper mining area. Min. Metall. 2020, 29, 5–10. [Google Scholar]
- Zhang, S.; Ma, H.; Wang, H. Research on the treatment plan of anhui development mining co., ltd.’s no. 3 main chute. China Saf. Prod. Sci. Technol. 2014, 10, 276–281. [Google Scholar]
- Zhang, C.; Peng, Z.; Ji, H. Stability analysis of mining area slide based on BLSS-PE and FLAC~(3D) coupling modeling technology. Nonferrous Met. Eng. 2020, 10, 92–99. [Google Scholar]
- Yu, Z.; Xu, M.; Fu, S.; Wei, M. The impact damage law and settlement monitoring technology of the main ore chute. China Saf. Prod. Sci. Technol. 2025, 21, 67–73. [Google Scholar]
- Ma, J.; Wei, D.; Zhang, Q. Experimental study on the probabilities of kinked arches and kinked arch locations in ore passes under the influences of multiple factors. Sci. Rep. 2023, 13, 15364. [Google Scholar] [CrossRef] [Scilit] [PubMed]
- Yu, G. Research on the Damage and Failure Laws of Marble Under Impact. Ph.D. Thesis, Kunming University of Science and Technology, Kunming, China, 2024. [Google Scholar]
- Ma, L.; Zheng, H.; Jin, P.; Zhu, N. Design and construction of high-level underground mine chute blasting excavation. Min. Technol. 2024, 24, 208–213. [Google Scholar]
- Tang, X.; Qu, Z.; Yang, X. Research and practice on anti blocking technology for deep underground mine shafts. Gold 2020, 41, 31–35. [Google Scholar]
- Salmi, E.F.; Sellers, E.J.; Hamman, E. Rock Engineering Systems for Quantifying Risks and Controls for the Resilient Design and Optimisation of Long and Ultra-long Ore Passes. Rock Mech. Rock Eng. 2025, 58, 12359–12418. [Google Scholar] [CrossRef] [Scilit]
- Ji, H. Research on the Impact Response and Loss Reduction Control of High Altitude Slant Shaft Wall. Ph.D. Thesis, South China University of Technology, Guangzhou, China, 2024. [Google Scholar]
- Guo, S. Application of ore block size detection system in the ore loading process of the chute. Color. Equip. 2025, 39, 56–61. [Google Scholar]
- Jalil, A.; Saferi, R. Mitigating Cone Chute Telescopic Failures in Clinker Distribution Through Abrasion-Resistant Design Improvements. J. Tek. Mesin 2024, 14, 45–55. [Google Scholar]
- Deng, Z.; Ma, C.; Xia, Z.; Ma, Q.; Lu, Z. Influence of ore-drawing port position on ore-rock flow characteristics in ore pass and lateral pressure on ore pass wall. Sci. Rep. 2024, 14, 21202. [Google Scholar] [CrossRef] [Scilit] [PubMed]
- Esmaieli, K.; Hadjigeorgiou, J.; Grenon, M. Stability Analysis of the 19A Ore Pass at Brunswick Mine Using a Two-Stage Numerical Modeling Approach. Rock Mech. Rock Eng. 2013, 46, 1323–1338. [Google Scholar] [CrossRef] [Scilit]
- Zhao, X.; Li, W.; Tai, H.; Gao, S. Application of 3d laser scanning technology in chute surveying. Urban Geotech. Investig. Surv. 2022, 1, 131–134. [Google Scholar]
- Liu, B.; Song, Y.; Ye, Y.; Zhang, Z. Research on Intelligent Supervision System of Ore Pass. Bilim. Madencilik Derg. 2023, 62, 4. [Google Scholar] [CrossRef] [Scilit]
- Hu, Y.; Feng, F.K.; Chen, H.X.; Liu, F.; Tang, X.Y.; Jiang, Y.H. Deformation characteristics analysis of main chute based on visual detection and modeling. Gold 2019, 40, 20–26. [Google Scholar]
- Zhu, T. Automatic Recognition of Ore Blockage Size at Underground Metal Mine Chute Opening. Ph.D. Thesis, Central South University, Changsha, China, 2024. [Google Scholar]
- Zhang, B.T.; Liu, Y.Z.; Zhang, Q.; Zou, X.T.; Chen, X.Q.; Pan, S.H. Development and application of similar test platform for ore drawing in chute. Min. Res. Dev. 2016, 36, 86–91. [Google Scholar]
- Wu, X.X. Study on Energy Dissipation Law of Ore-Rock Impact and its Damage to Chute Shaft Wall. Ph.D. Thesis, University of Science and Technology Liaoning, Anshan, China, 2022. [Google Scholar]
- Stacey, T.R.; Bartlett, P.J. Probabilistic evaluation of ore pass stability and support. In Proceedings of the ISRM International Symposium, Mbabane, Swaziland, 10–12 September 1990. [Google Scholar]
- Qin, X.S. Analysis of collapse failure causes of the main ore pass at no.4 crushing station in a mine. China Min. Mag. 2018, 27, 241–244. [Google Scholar]
- Yu, Z.; Xu, M.; Fu, S.; Wei, M. Ore impact-induced fragmentation patterns in the main ore pass and settlement monitoring techniques. J. Saf. Sci. Technol. 2025, 21, 67–74. [Google Scholar] [CrossRef]
- Rojas, C.; Anani, A.; Cordova, E.; Nyaaba, W.; Adewuyi, S.O.; Wellman, E. Analysis of raise boring with grouting as an op-timal method for ore pass construction in incompetent rock mass—A case study. Min. Metall. Explor. 2024, 41, 2177–2191. [Google Scholar] [CrossRef] [Scilit]
- Marysyuk, V.P.; Shilenko, S.Y.; Trofimov, A.V.; Kulagin, A.D. Justification of reinforcement technology and operating conditions for permanent ore passes in faulted rock mass in Oktyabrsky Mine. Gorn. Zhurnal 2024, 48–55. [Google Scholar] [CrossRef] [Scilit]
- Zhang, H. Comprehensive Transformation of the Main Shaft Hoisting System for Open-pit to Underground Mining in Miaogou Iron Mine. Mod. Min. 2025, 41, 96–101. [Google Scholar]
- Liu, Y.Z.; Zhang, B.T.; Ye, Y.C.; Zou, X.T.; Zhang, Q.; Cheng, X.; Pan, S. Similar experimental study on ore movement and shaft wall damage characteristics in main ore pass. J. Min. Saf. Eng. 2018, 35, 545–552. [Google Scholar]
- Xia, Z.; Deng, Z.; Lu, Z.; Ma, C. Study on the Macro-Fine Mechanical Behavior of Ore Flow Based on the Discrete Element Method. Appl. Sci. 2024, 14, 3457. [Google Scholar] [CrossRef] [Scilit]
- Wang, Q.F. Study on Ore Movement and Shaft Wall Wear Characteristics in Main Ore Pass of Jinshandian Iron Mine. Ph.D. Thesis, Wuhan University of Science and Technology, Wuhan, China, 2015. [Google Scholar]
- Zou, X. Study on Shaft Wall Damage in Ore-Drawing Section Under Ore-Rock Impact. Ph.D. Thesis, University of Science and Technology Liaoning, Anshan, China, 2023. [Google Scholar]
- Liu, Y.; Wang, J.; Li, G.; Sun, W. Deformation Detection Method of Main Ore Pass Based on SLAM Technology. Appl. Laser 2021, 41, 916. [Google Scholar]
- Jiang, L.; Ji, H.; Xue, L. Shaft Wall Damage to High-Depth Inclined Ore Passes under Impact Wear Behavior. Appl. Sci. 2023, 13, 13065. [Google Scholar] [CrossRef] [Scilit]
- Gardner, L.J.; Fernandes, N.D. Ore pass rehabilitation—Case studies from impala platinum limited. J. S. Afr. Inst. Min. Metall. 2006, 106, 17–23. [Google Scholar]
- Ma, Q.; Ma, C.; Li, J.; Lu, Z.; Xia, Z. Theoretical Analysis of Shaft Wall Damage and Failure Under Impacting of Ore-Rock Falling in Vertical Ore Pass. Appl. Sci. 2024, 14, 10695. [Google Scholar] [CrossRef] [Scilit]
- Zheng, H.; Jiang, Y.; Wu, X.; Zhang, S.; Sugimoto, S. Investigation on stress distribution and prestress loss model of prestressed anchor cables considering corrosion-induced debonding. Rock Mech. Bull. 2025, 4, 100189. [Google Scholar] [CrossRef] [Scilit]
- Fattahi, H. Applying Rock Engineering Systems to Evaluate Shaft Resistance of a Pile Embedded in Rock. Geotech. Geol. Eng. 2018, 36, 3269–3279. [Google Scholar] [CrossRef] [Scilit]
- Taylor, L.M.; Chen, E.P.; Kuszmaul, J.S. Microcrack-induced damage accumulation in brittle rock under dynamic loading. Comput. Methods Appl. Mech. Eng. 1986, 55, 301–320. [Google Scholar] [CrossRef] [Scilit]
- Grady, D.E.; Kipp, M.E. Mechanisms of dynamic fragmentation: Factors governing fragment size. Mech. Mater. 1985, 4, 311–320. [Google Scholar] [CrossRef] [Scilit]
- Gibbon, G.J. Development and support of ore passes at East Driefontein Gold Mine. In Proceedings of the International Conference on Rock Engineering, Newcastle upon Tyne, UK, 4–7 April 1977. [Google Scholar]
- Shi, J.; Wang, Z.; Zhang, Y.; Zhao, W.; Li, J.; Xian, G. Evaluation of shear stress distribution within CFRP cable anchorage based on OFDR monitoring technology. J. Build. Eng. 2025, 114, 114128. [Google Scholar] [CrossRef] [Scilit]
- Atkinson, B.K. Fracture Mechanics of Rock; Academic Press: London, UK, 1987. [Google Scholar]
- Trigueros, E.; Cánovas, M.; Arzúa, J.; Baraibar, J.M. Evaluating the influence of backfilling on the stability of an abandoned room-and-pillar mine: A case study in northern Spain. Geomech. Geophys. Geo-Energy Geo-Resour. 2024, 10, 116. [Google Scholar] [CrossRef] [Scilit]
- Trigueros, E.; Cánovas, M.; Arzúa, J.; Alcaraz, M. Stability of an abandoned siderite mine: A case study in northern Spain. Open Geosci. 2021, 13, 359–376. [Google Scholar] [CrossRef] [Scilit]
- Kamran, E.; John, H.; Martin, G. Estimating geometrical and mechanical REV based on synthetic rock mass models at Brunswick Mine. Int. J. Rock Mech. Min. Sci. 2010, 47, 915–926. [Google Scholar] [CrossRef] [Scilit]

Disclaimer/Publisher’s Note: The statements, opinions and data contained in all publications are solely those of the individual author(s) and contributor(s) and not of MDPI and/or the editor(s). MDPI and/or the editor(s) disclaim responsibility for any injury to people or property resulting from any ideas, methods, instructions or products referred to in the content. |
© 2026 by the authors. Licensee MDPI, Basel, Switzerland. This article is an open access article distributed under the terms and conditions of the Creative Commons Attribution (CC BY) license.