


Abstract
The mining industry still faces major environmental and socioeconomic problems as a result of tailings dam failures, which highlights the urgent need for improved monitoring and early-warning systems. This research offers practical recommendations for improved monitoring and safer design practices, in addition to investigating the use of digital image processing (DIP) as a non-invasive technique for tracking slope deformation in tailings dam models subjected to incremental pore water pressure increases. To replicate real-world conditions as closely as possible, a scaled laboratory embankment was built using coarse and fine tailings. During controlled pore-pressure loading, more than 500 high-resolution photos were taken, recording the entire deformation sequence from initial displacement to slope failure. The images were processed using Mathematica to generate pixel-by-pixel displacement fields and vector plots, providing a detailed visualization of deformation mechanisms. The findings demonstrated that DIP accurately detects and measures surface displacement, revealing the mechanisms, direction, and intensity of deformation. This study illustrates the extensive potential of DIP for real-time monitoring by directly connecting slope instability triggered by incremental pore water pressure with visual indications of slope deformation. While the results confirm the strong potential of DIP for deformation monitoring with a minimum detectable displacement of approximately 1.0 mm under controlled laboratory conditions, its field application may be affected by scale effects, variable lighting, and environmental occlusion. The mining industry benefits greatly from the insights gained through in-depth image analysis, which promotes safer tailings dam design and management. Overall, DIP can provide a reliable, scalable foundation for real-time deformation monitoring in operational tailings dams, where continuous image-based measurements can help identify early signs of instability and support proactive risk management.
1. Introduction
The safe management and stability of tailings facilities are essential for minimizing environmental risk and ensuring sustainable mining operations [1]. According to Kossoff et al. (2014), the environmental footprint of tailings storage facilities is substantial, as these structures are often located near water bodies or ecosystems that are vulnerable to contamination [2]. Tailings are stored in large embankments that must safely withstand long-term static and dynamic loads, as poor design or maintenance can lead to catastrophic dam failures [3]. Because tailings are often fine-grained, they tend to exhibit high water retention [4].
Pore water pressure reduces effective stress and threatens structural stability, often leading to displacement or failure under conditions such as heavy rainfall and rapid infiltration [5,6]. Liquefaction is one of the critical failure mechanisms in tailings dams, which occurs when saturated tailings material loses its shear strength and behaves like a fluid under loading [7]. This happens particularly in fine-grained materials with low permeability and high water content [8]. Climate change further amplifies these risks through extreme weather and environmental degradation, weakening mine waste structures [9]. Globally, tailings dam failures occur at an average rate of 4.4 incidents per year, with the United States recording the highest number of cases [10].
Increased pore water pressure lowers effective stress, causing deformation and increasing the risk of lateral and vertical displacements under both static and dynamic conditions, especially during seismic events and liquefaction [11,12,13]. Displacement behavior is a key indicator of instability and slope failure driven by gravitational and hydraulic forces [14]. Continuous monitoring of ground deformation, using tools such as InSAR (Interferometric Synthetic Aperture Radar), is therefore essential for early detection of instability [11]. Instruments such as inclinometers and Global Navigation Satellite System (GNSS) are commonly used to monitor dam displacement, with continuous tracking helping identify patterns that may indicate impending failure, particularly in response to external stresses, such as rainfall or seismic events [15]. Recent advances demonstrate a clear shift toward data-driven, multi-sensor slope-monitoring frameworks, where AI-powered digital twins integrating LiDAR-derived DEMs and machine-learning prediction models enable real-time assessment of slope stability and early warning [16]. In parallel, UAV-based monitoring has emerged as a flexible and high-resolution alternative to geodetic surveys, with UAV-mounted LiDAR proving effective for mine slopes [17].
Meanwhile, field-scale optical fiber sensing systems have demonstrated robust, continuous subsurface strain and displacement monitoring in open-cast mines, offering a complementary real-time early-warning capability where traditional point sensors remain limited [18]. The inverse velocity method is a widely used technique for predicting dam failure from displacement data by analyzing changes in inverse displacement rates over time [19]. Integrating real-time displacement monitoring and predictive algorithms into dam management significantly enhances the safety and integrity assessment of tailings dams, particularly in seismically active or aging facilities.
Experimental studies have shown that changes in pore water pressure affect displacement and slope stability. Researchers used a ring-shear apparatus to simulate landslides, revealing that sudden increases in pore pressure triggered large displacements due to soil liquefaction. These studies highlight the crucial role of pore water pressure in controlling slope failure and displacement under both experimental and real-world conditions [20]. Further research has shown that undrained loading of filtered tailings can generate excess pore pressure once a critical saturation level is reached, thereby reducing effective stress and increasing the likelihood of strain localization and instability [21,22]. Numerical and physical modeling studies further show that pore pressure increases with depth, forming poorly drained zones prone to deformation [19]. Large-scale physical modeling also reveals a three-stage pore-pressure evolution during breach, with peak earth pressures near the fore-dam and nonlinear, terrain-controlled breach behavior, improving hazard prediction [23].
Image-processing techniques capture surface displacements over an entire structure using visual data, unlike traditional point-based sensors such as inclinometers and GPS [24]. When combined with machine learning, these methods enable automatic, continuous detection of subtle movements, with tools like digital image correlation enhancing monitoring without physical sensors [25,26,27]. Environmental conditions still affect accuracy, but integration of neural networks helps mitigate these challenges, while artificial intelligence further supports real-time monitoring and worker safety [28,29].
Image processing is increasingly used as a non-invasive technique for measuring displacement and deformation in large geotechnical structures. While it offers several advantages over traditional methods, such as inclinometers and total stations, specific research gaps remain. One major challenge is maintaining accuracy and reliability under varying environmental conditions, such as changes in lighting and weather, which can impact data consistency [27,30]. Additionally, image processing techniques such as digital image correlation (DIC) are highly effective for measuring surface displacements but struggle to detect subsurface deformations, which is critical for understanding overall structural stability [31]. Further research is necessary to integrate image processing with traditional sensor-based methods, thereby creating hybrid systems that provide more comprehensive monitoring solutions [28,32].
This study aims to validate the use of digital image processing to accurately measure displacement in a small-scale tailings dam. The research demonstrates that digital image processing can effectively capture displacement in a controlled experimental setup, thereby confirming its effectiveness for displacement measurement and highlighting its potential scalability for larger-scale applications.
2. Materials and Methods
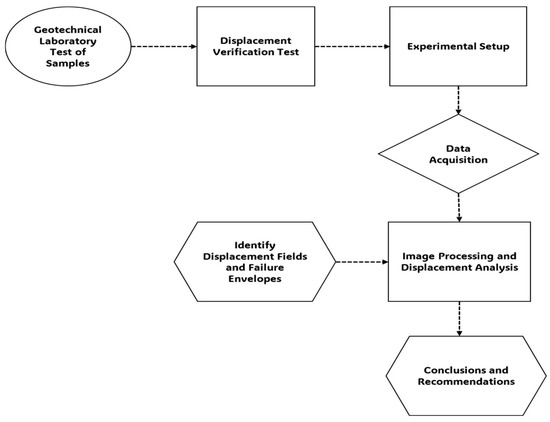
This chapter summarizes the materials, equipment, and experimental procedures used to evaluate displacement in a tailings dam model using digital image processing (DIP). The methodology followed a structured sequence (Figure 1), beginning with geotechnical characterization of coarse and fine tailings. A displacement verification test was conducted to confirm measurement accuracy. Controlled laboratory experiments were then performed under a gradually increasing pore water pressure, with sequential image acquisition. Table 1 below provides detailed information on the material properties.
Figure 1.
Flowchart of methodology for this study.
Table 1.
Properties of tailings material.
To properly understand the behavior of the materials used in the tailings dam test model, a series of geotechnical laboratory tests was conducted on both coarse and fine tailings. All tests were performed in accordance with relevant ASTM standards to ensure the consistency, accuracy, and reliability of the data. The coarse tailings material had particles passing through a 4.75 mm sieve (US Sieve Number 4), with approximately 74.2% finer than 0.106 mm and 16% finer than 0.075 mm. In comparison, the fine tailings material had about 81.3% finer than 0.075 mm, as determined in accordance with the Standard Test Method for Particle-Size Analysis of Soils.
2.1. Experimental Setup
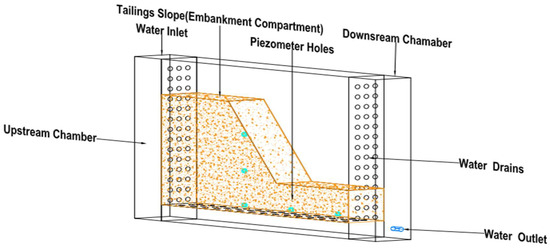
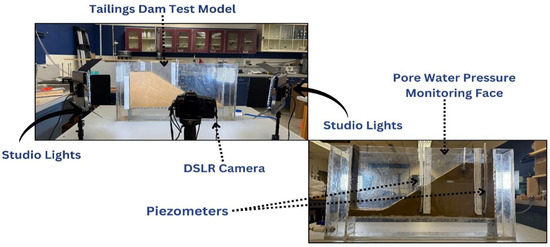
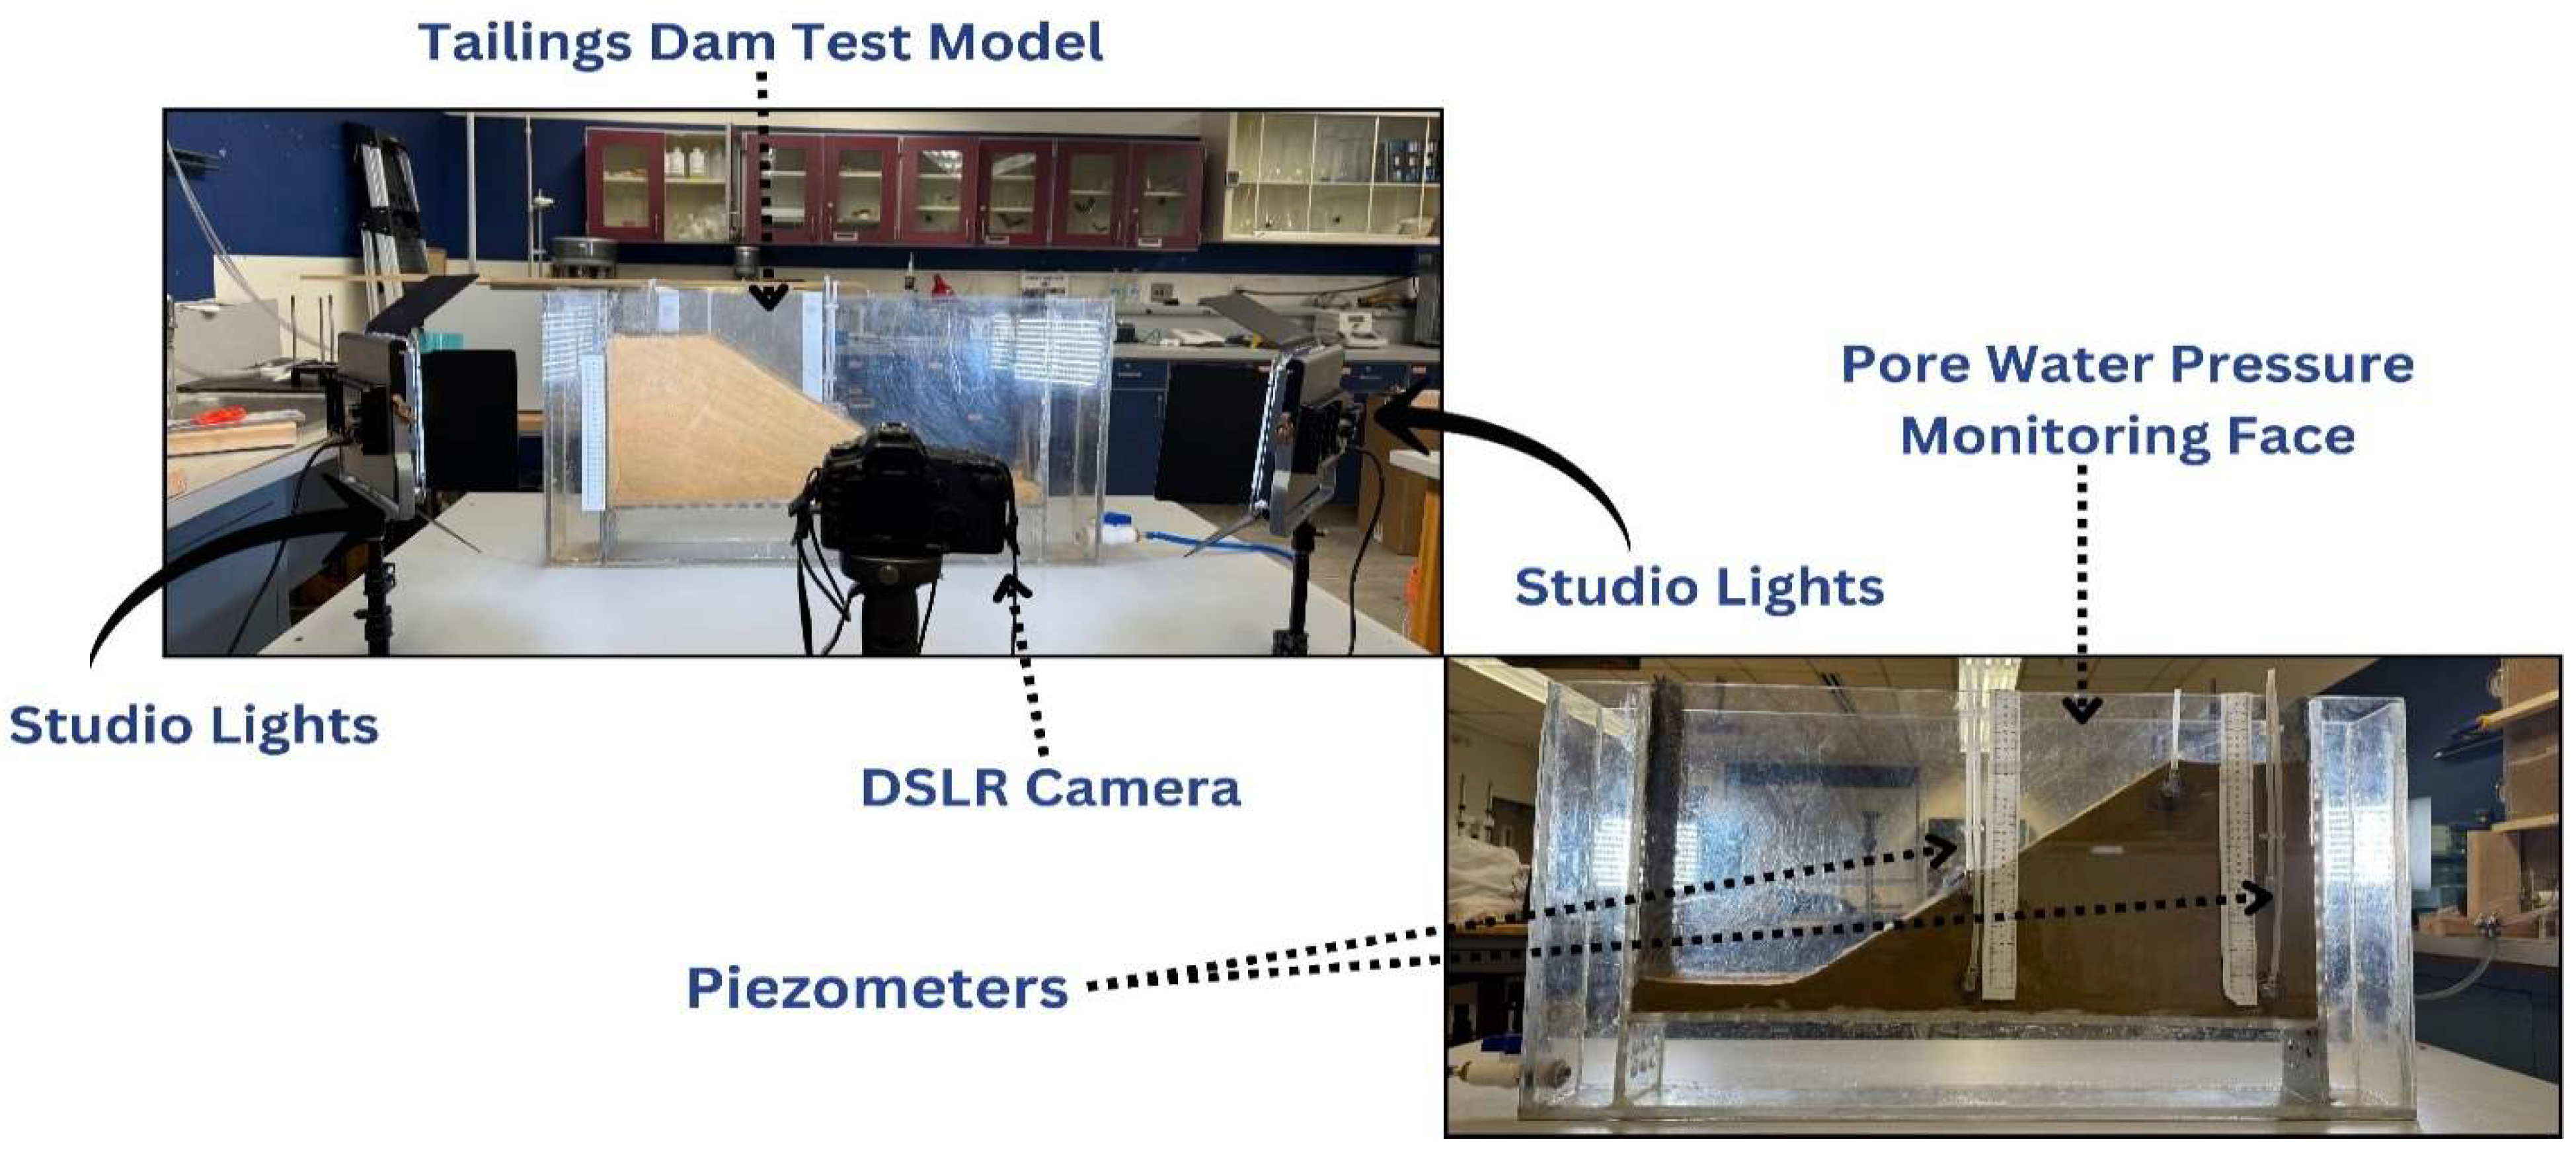
The design of the tailings dam test model (Figure 2) was a critical step in ensuring that the experimental setup accurately simulated real-world conditions. Given the complexity of tailings dam behavior, the model was structured to reflect key geotechnical and hydraulic properties while maintaining feasibility in a laboratory setting. The goal was to construct a scaled-down version of a tailings embankment, enabling controlled variations in pore water pressure and displacement monitoring using image processing techniques.
Figure 2.
Tailings dam test model.
The test model was designed with specific dimensions to strike a balance between experimental precision and practical feasibility. It measured 900 mm in length, 500 mm in height, and 100 mm in width. These dimensions were chosen to ensure the model could accommodate a representative tailings embankment while enabling clear observation and monitoring. The physical model compartment of the tailings dam was constructed using transparent polycarbonate sheets. The transparency of the acrylic enabled direct visual observation of changes on the side of the dam, such as seepage paths and displacement fields.
The structural layout of the model comprised four main compartments:
- The embankment compartment, which represented the tailings dam and its structural response to water infiltration.
- The water compartment, which allowed controlled water inflow and outflow, simulating real-world seepage conditions.
- Five standpipe piezometers, installed at 200 mm intervals within the embankment, to monitor pore water pressure and track changes in pore-pressure distribution during seepage.
- Monitoring face and displacement field measurement.
2.2. Equipment
Several key instruments were utilized to conduct the tailings dam test successfully. Each one played a crucial role in ensuring the tests ran smoothly, and the correct data was captured. The following equipment was used for the test, all shown in Figure 3: a DSLR camera (Canon Virginia Inc., Newport News, VA, USA) mounted on a tripod(GVM Inc., Biglerville, PA, USA), studio lighting units (GVM Inc., Biglerville, PA, USA), the tailings material, and the transparent tailings dam test model.
Figure 3.
Experimental setup.
2.3. Displacement Verification Test
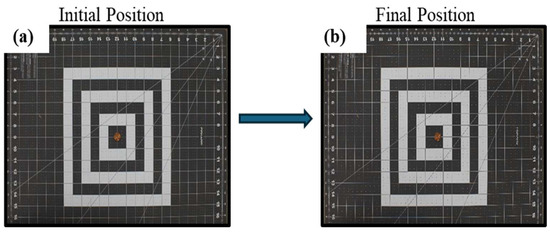
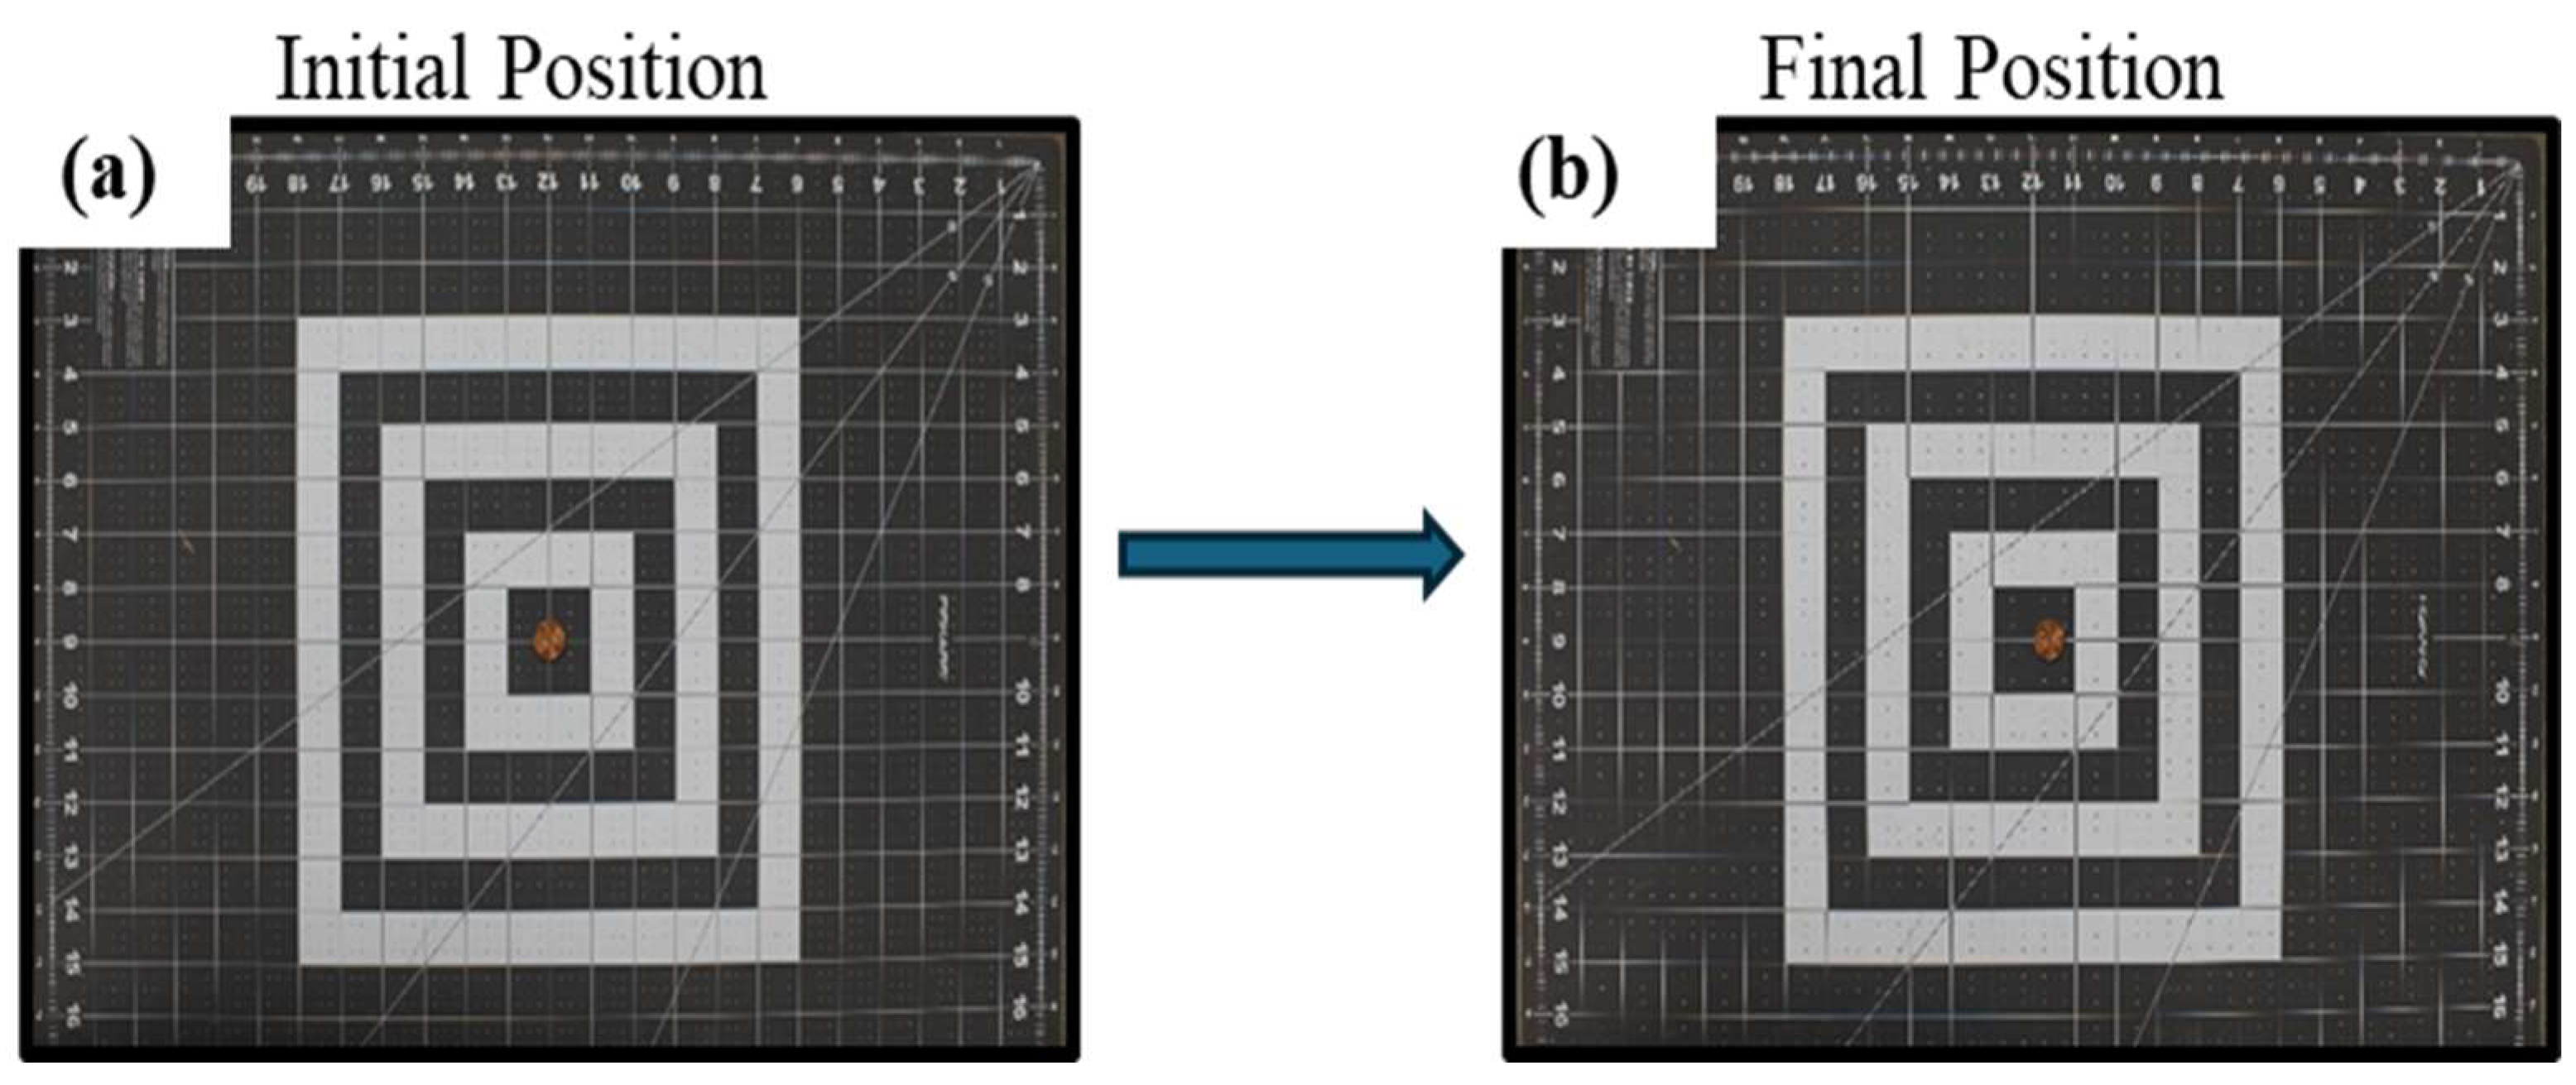
The purpose of the displacement verification test was to evaluate the accuracy and reliability of the image-based displacement analysis technique used in this study. By introducing a controlled, known movement within the frame, this test served as a benchmark to validate the precision of the image processing method before applying it to the complex tailings dam experiments. To verify this, a circular object (coin) with a known diameter of 19.05 mm, a scaled grid mat for calibration(Fiskars Brands, Inc., Wisconsin, USA), and a camera capturing high-resolution images from a fixed position were used.
2.3.1. Horizontal Displacement
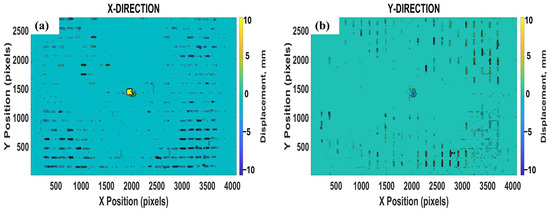
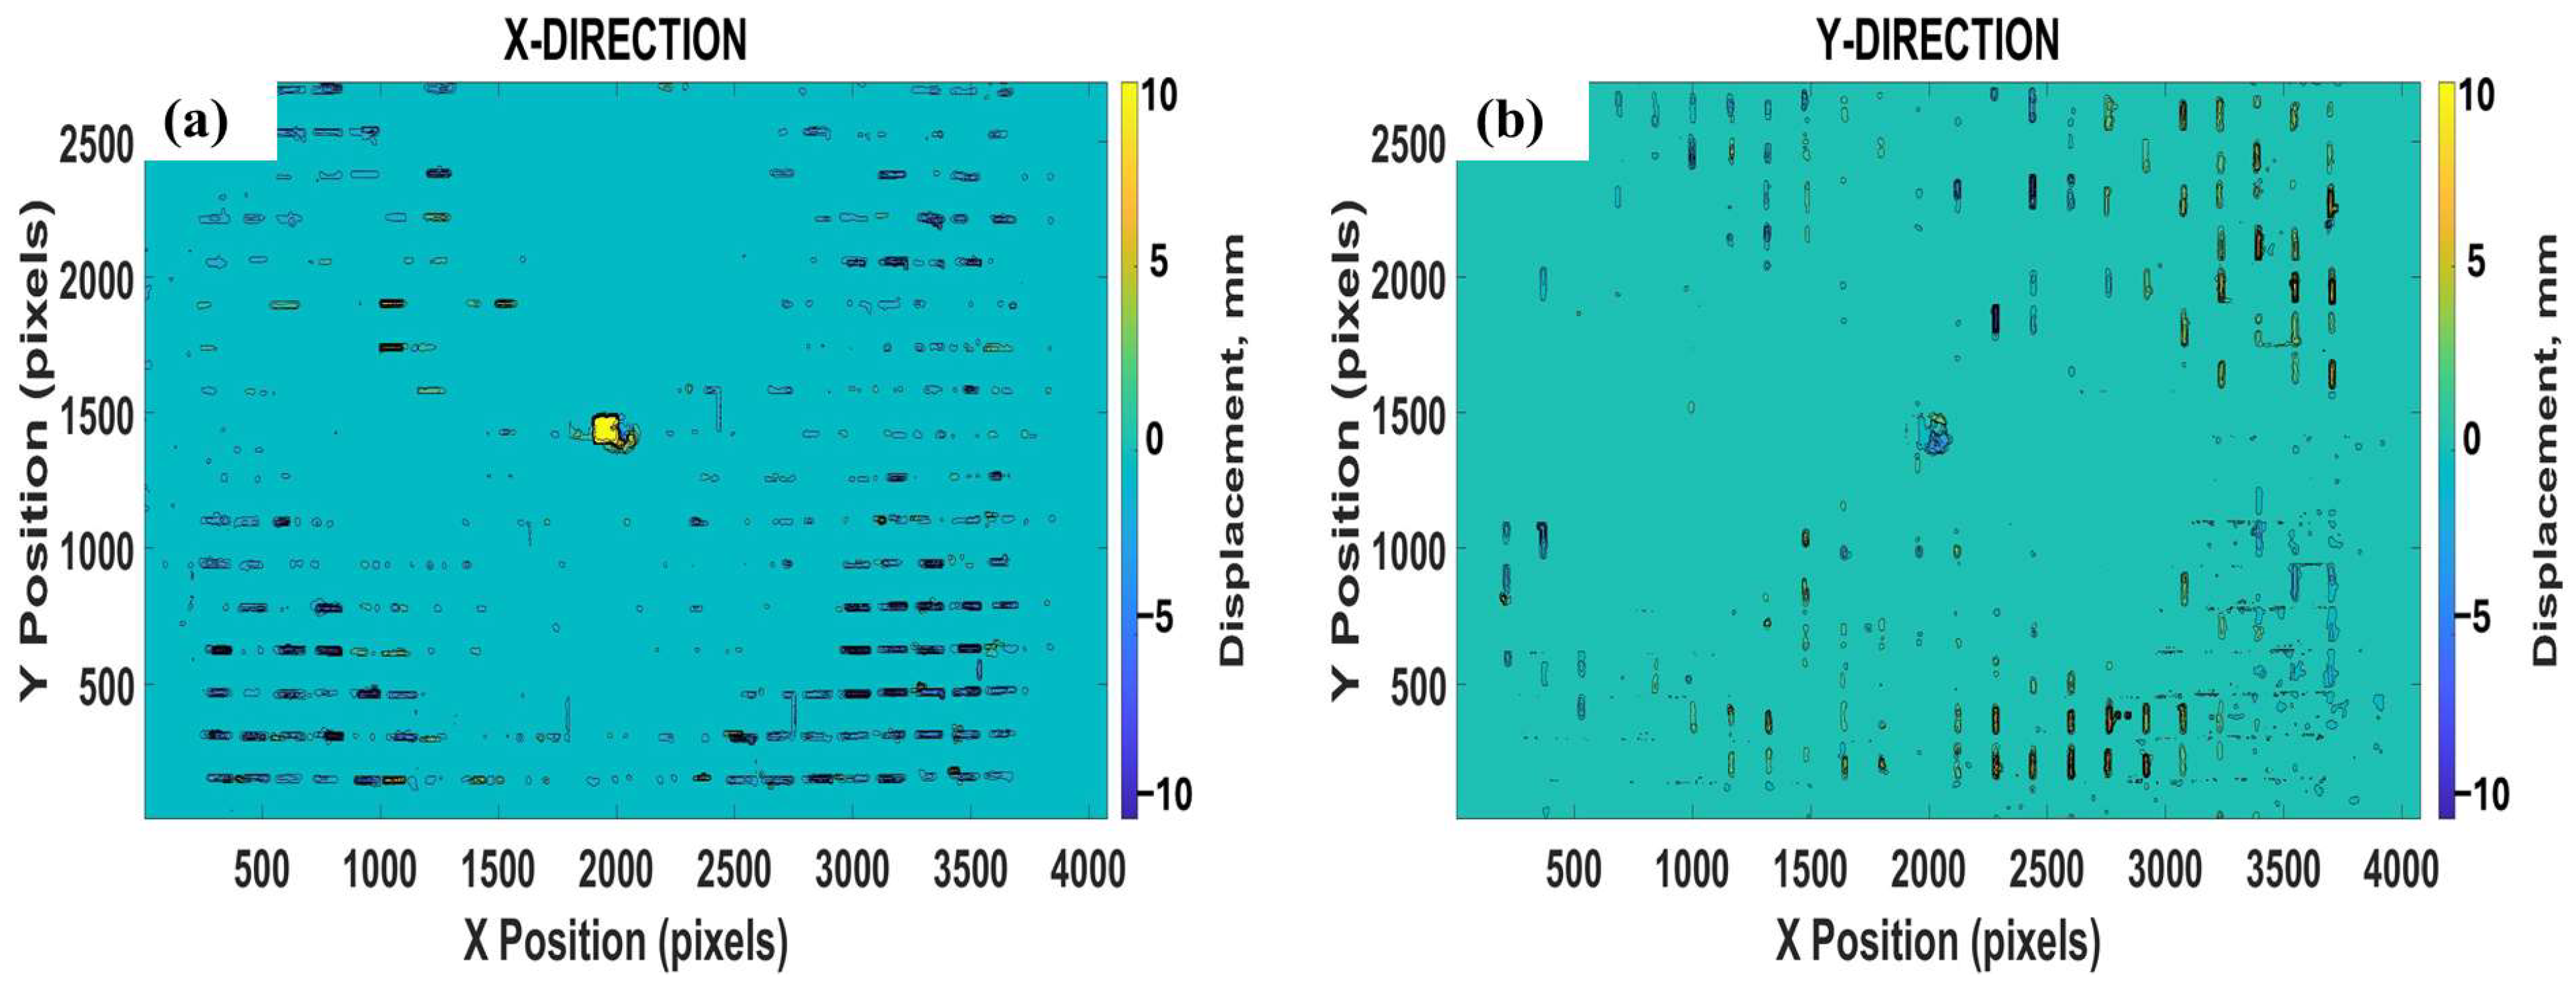
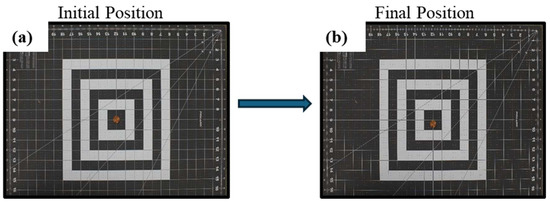
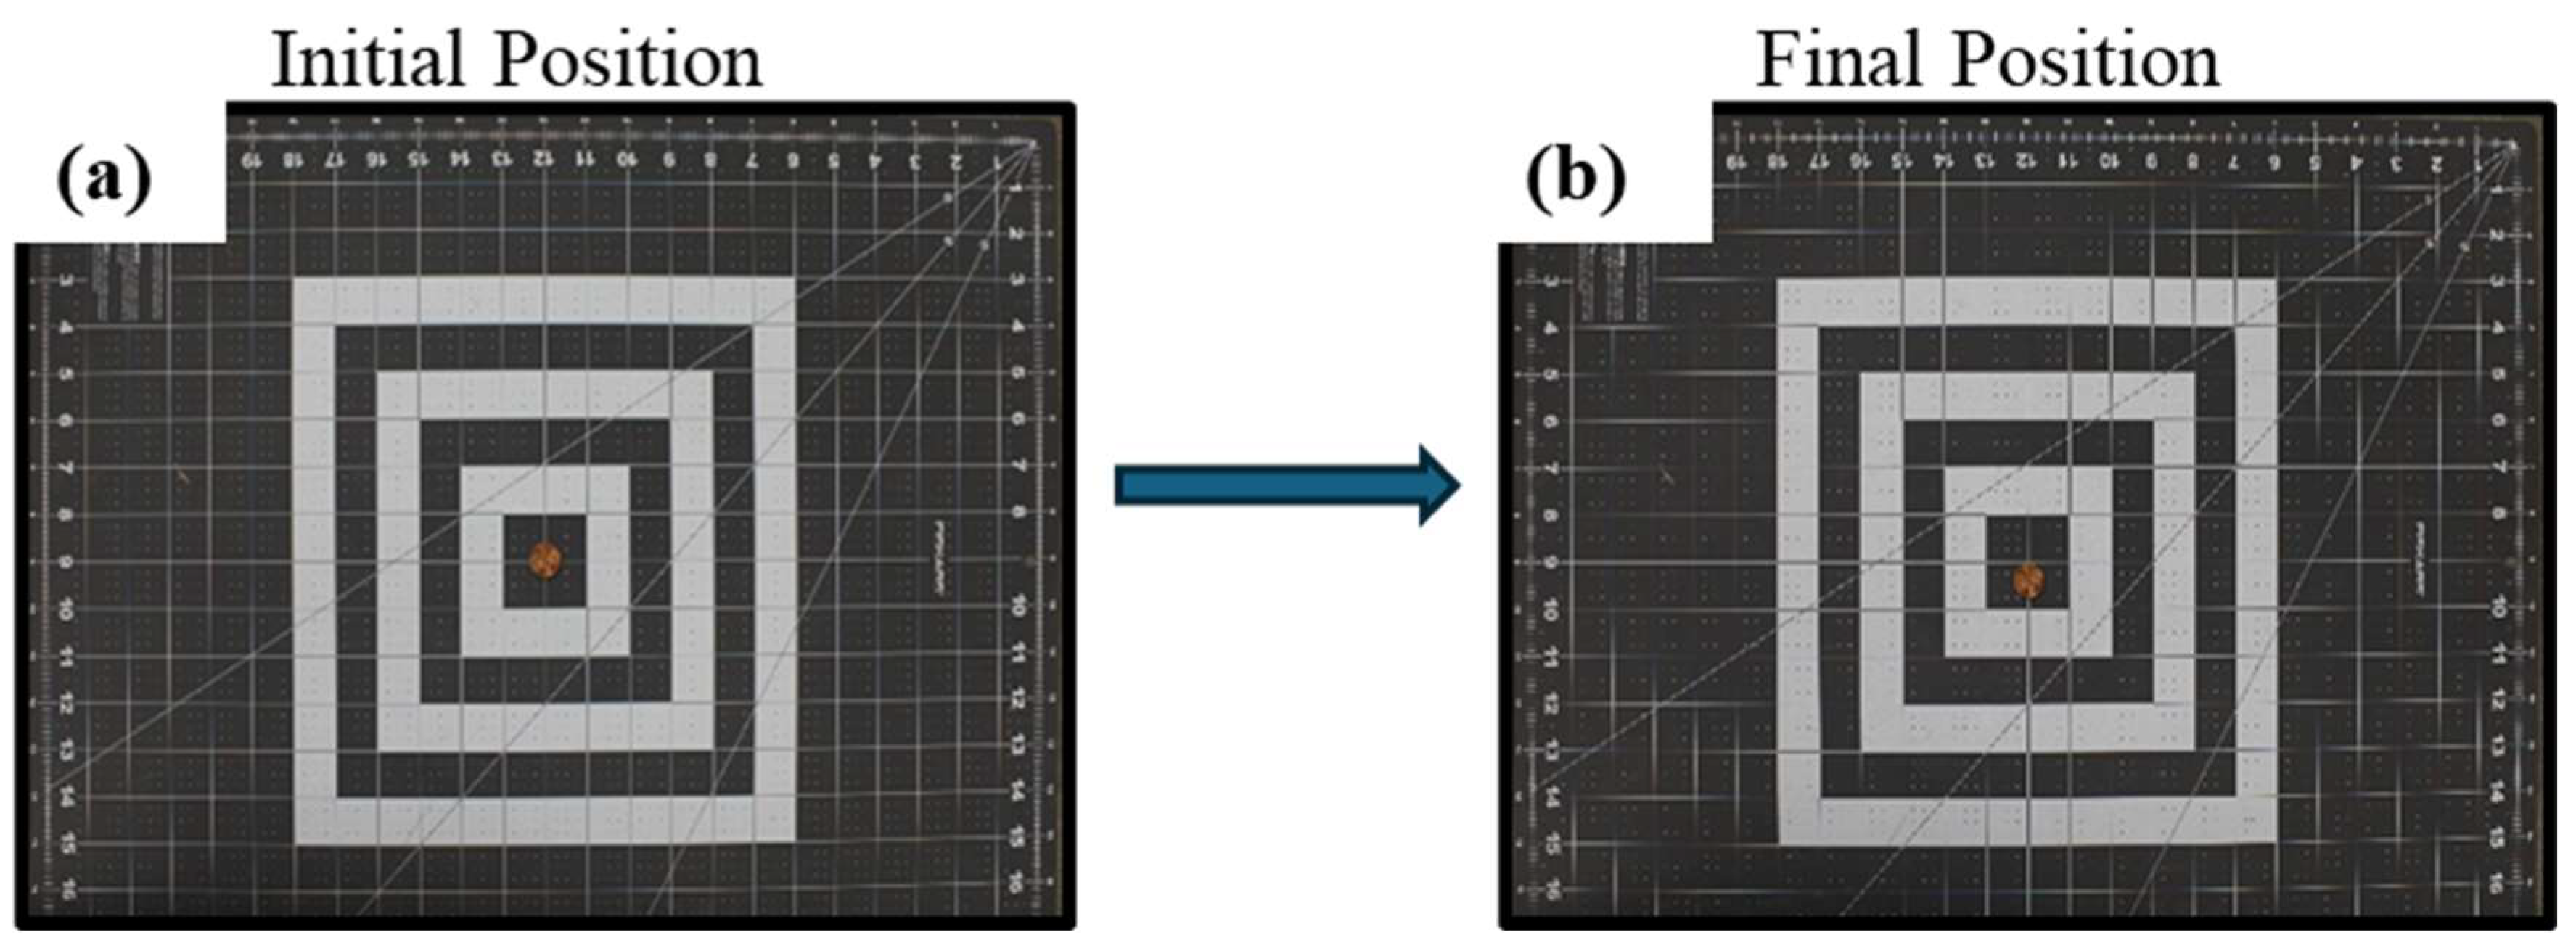
A coin was initially placed at the center of a grid mat and photographed (Figure 4a) and then shifted approximately 9.0 mm to the right along the x-axis for a second image (Figure 5b). The image analysis confirmed this motion, showing a clear horizontal displacement of around 10 mm (Figure 6), while vertical movement remained minimal.
Figure 4.
Horizontal direction displacement from initial to final position (a,b).
Figure 5.
Horizontal displacement in X direction and Y direction (a,b).
Figure 6.
Vertical direction displacement from initial to final position (a,b).
2.3.2. Vertical Displacement
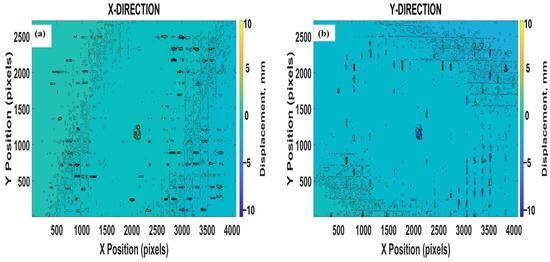
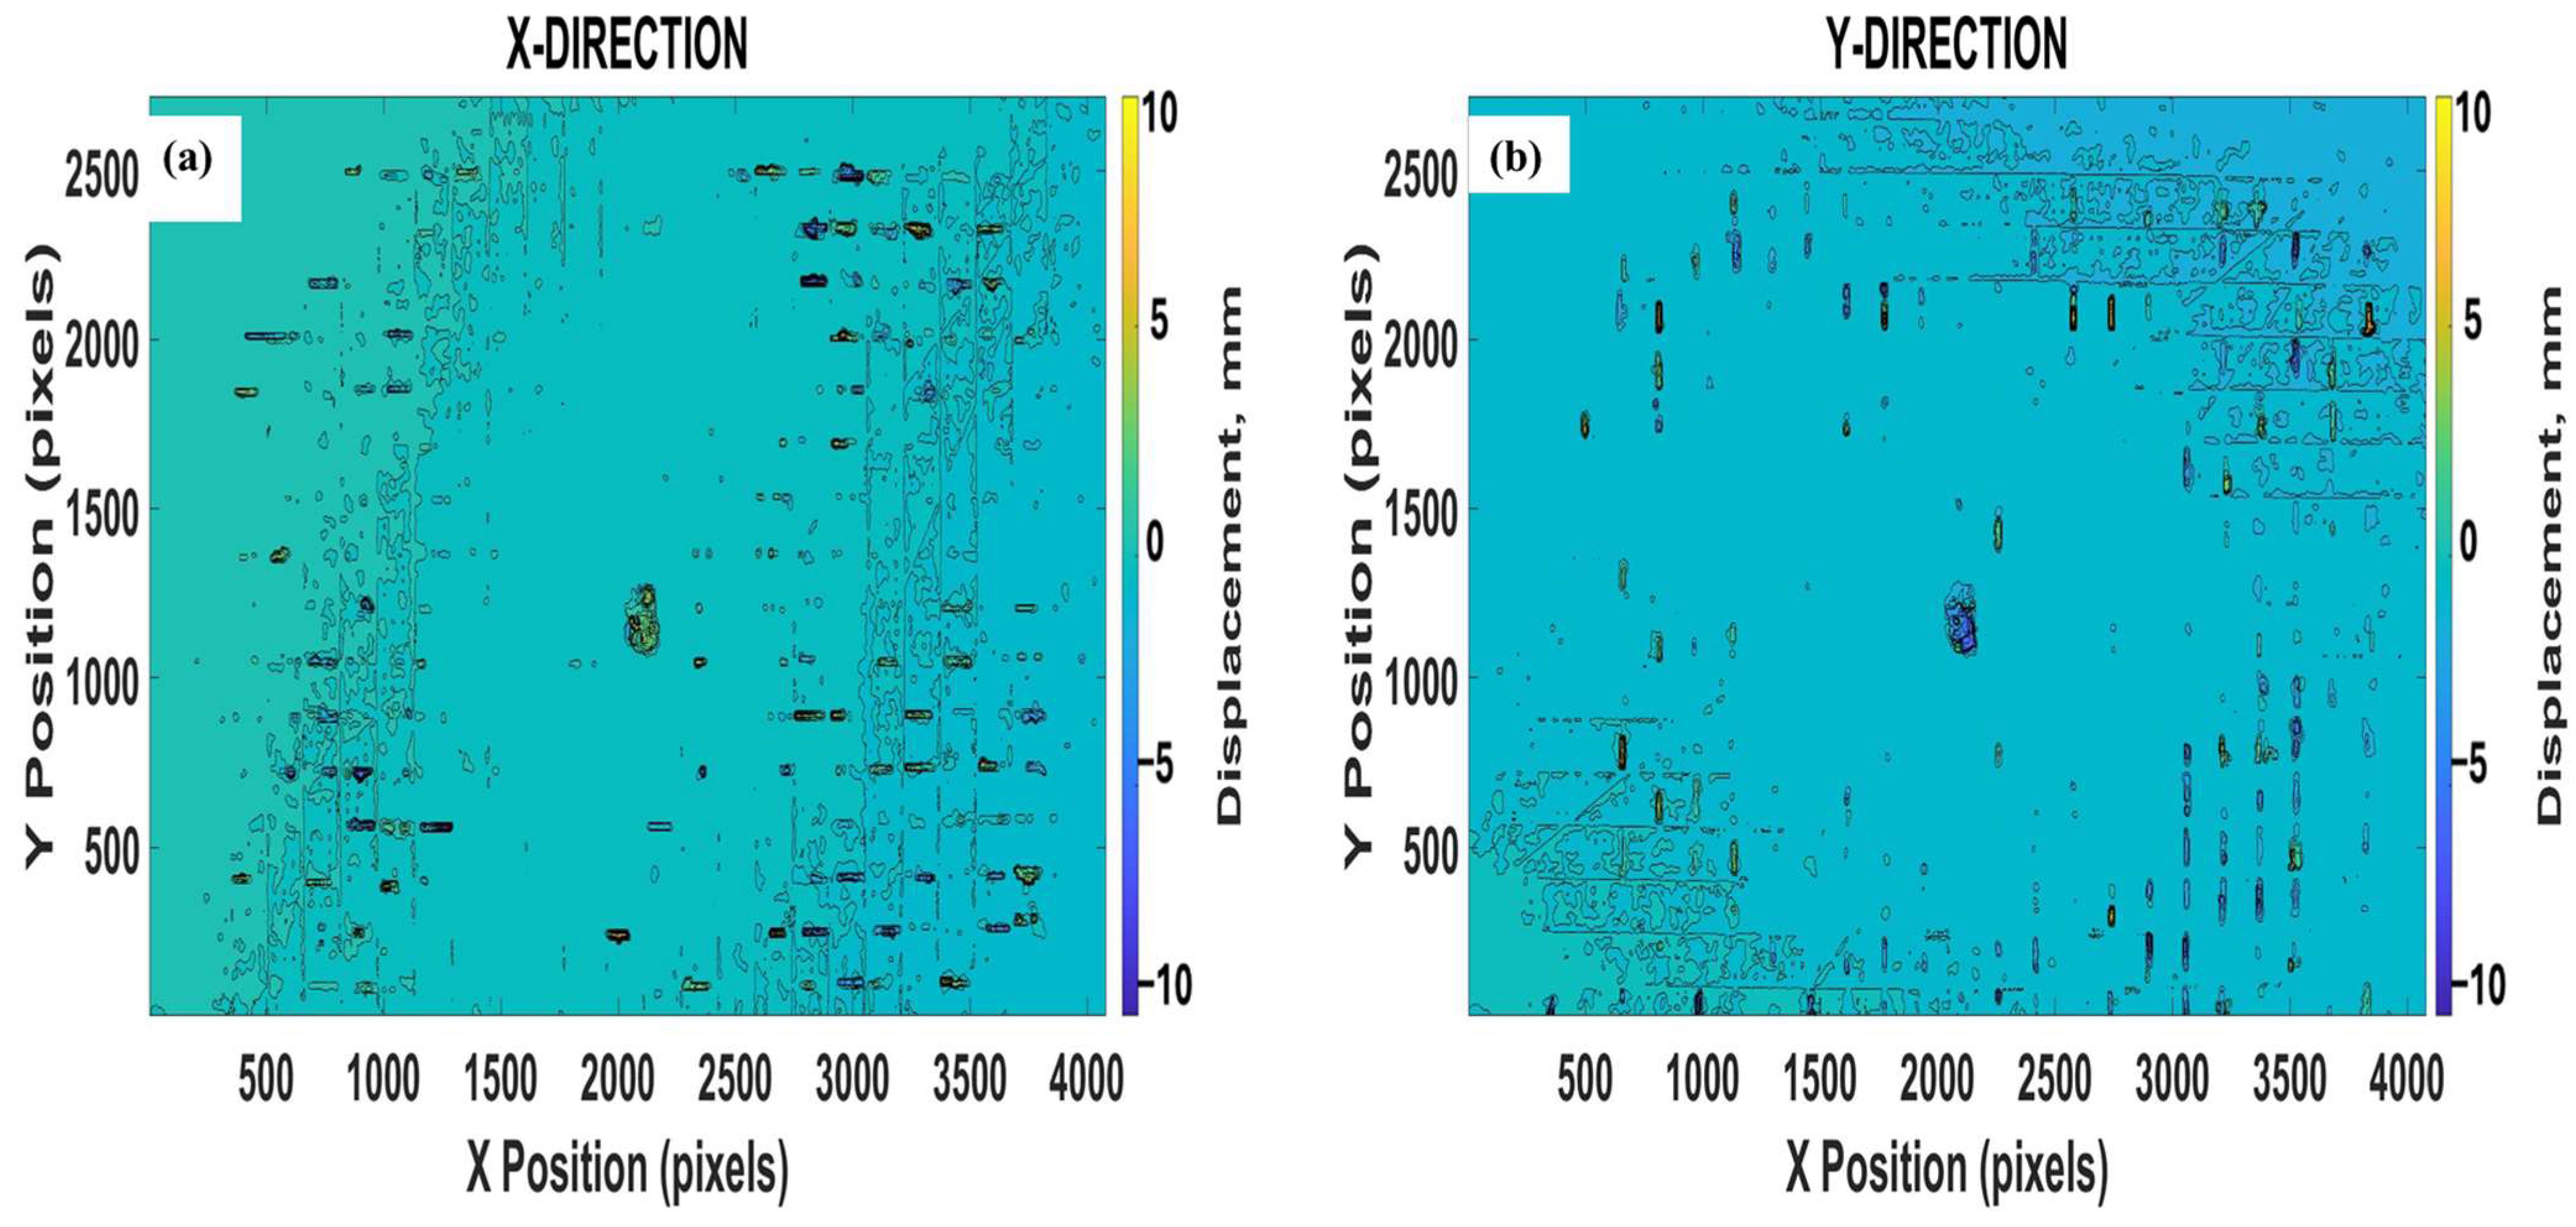
Using the same setup, the coin was moved about 9.0 mm downward along the y-axis (Figure 7a), and vertical displacement was analyzed. The Y-direction (vertical-direction) contour plot (Figure 8b) shows a noticeable downward shift of approximately −10.00 mm, while the X-direction (horizontal-direction) contour plot (Figure 8a) indicates little to no horizontal displacement.
Figure 7.
Results of vertical displacement in X and Y directions (a,b).
Figure 8.
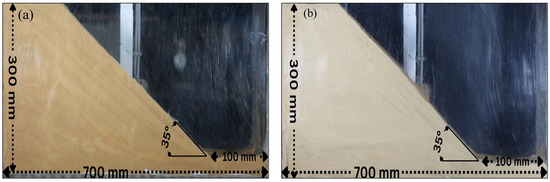
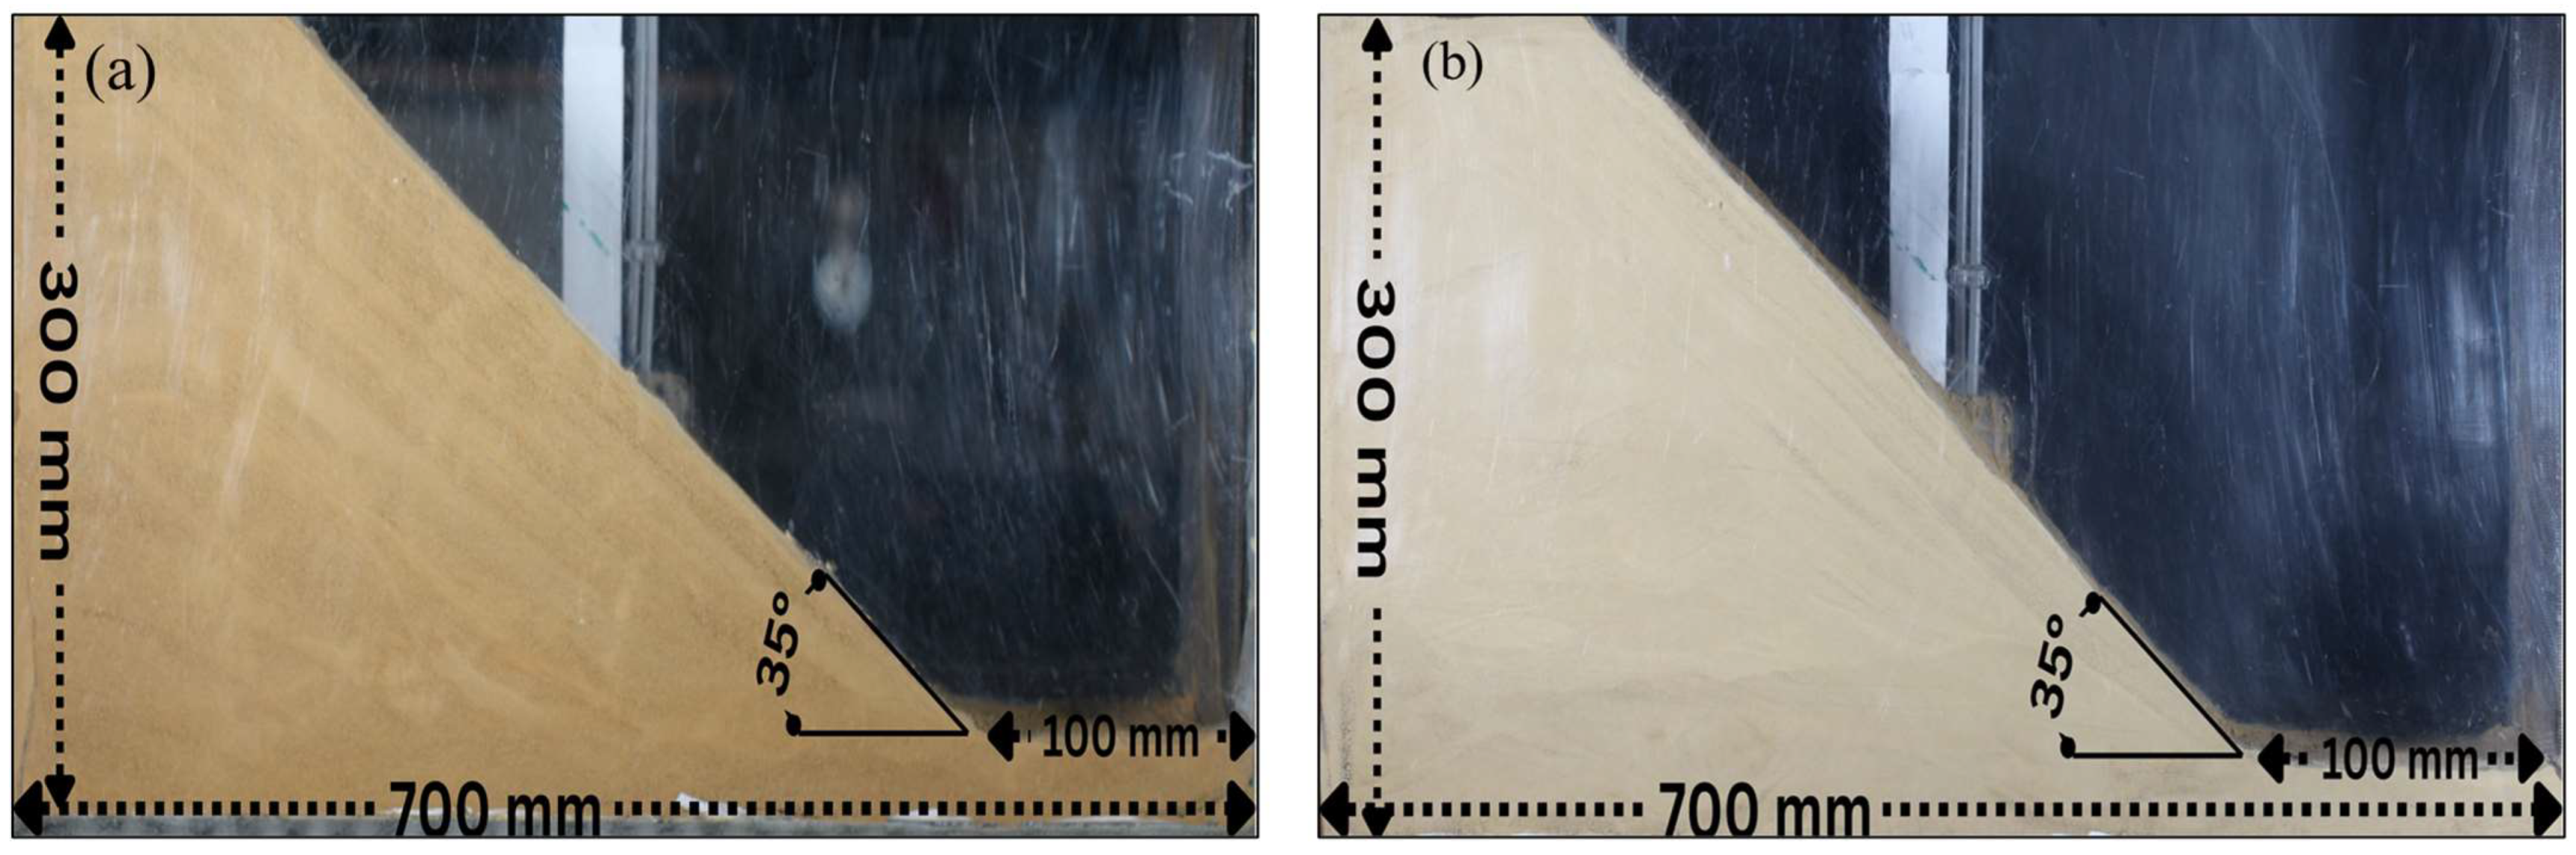
(a) Coarse tailings configuration. (b) Fine tailings configuration.
In conclusion, the displacement verification test confirmed that the digital image processing method can detect and quantify known movements, measuring the intended 10 mm displacement of the coin with an accuracy of approximately ±1.0 mm. Having validated this, the next step was to set up and run the complete tailings dam deformation experiments.
2.4. Experiment Data Acquisition
This study’s detection of the displacement fields and failure envelopes in a tailings dam test model was based on more than 500 digital images obtained from over two laboratory experiments (Figure 8a,b). The procedure was designed to replicate the gradual saturation and pore-pressure buildup commonly observed in tailings dams and natural slopes, with real-time monitoring using high-resolution image capture.
The slopes were constructed in the middle chamber of the test apparatus using coarse and fine tailings material. The slopes were built to a height of 300 mm, a width of 100 mm, and a base length of 700 mm. The slope was designed at an angle of approximately 35°, formed by careful layering to simulate a uniform and stable embankment condition. The slope angle was maintained at approximately 35°, ensuring geometric consistency between the two experiments. To ensure consistency in image acquisition, the Canon Mark III Digital Single-Lens Reflex (DSLR) camera equipped with a full-frame 36.0 × 24.0 mm sensor (Canon Virginia Inc., Newport News, VA, USA), with a resolution of 22.3 megapixels and a maximum image resolution of 5760 × 3840 pixels, was used, and two continuous color LED studio lighting units with adjustable color temperature (3200–5600 K) and a high color rendering index (CRI ≥ 95) were positioned at a fixed distance of 3 m from the tailings dam model and were rigidly stabilized throughout each experiment to eliminate vibration and lighting variability. The camera was oriented approximately 90° to the monitoring face of the tailings dam model, while two continuous color LED studio lighting units were positioned symmetrically on either side of the camera at the same elevation and directed toward the model at shallow incidence angles of approximately 30–45° (Figure 3).
2.5. Pore Water Pressure Application and Image-Based Data Acquisition
Once the slope was fully formed and stabilized, a high-resolution DSLR camera mounted on a fixed tripod, positioned about 3 m from the tailings model, was used to capture sequential images. Water was introduced in the upstream chamber at a slow, controlled flow rate of approximately 0.5 GPM to allow seepage through the tailings material toward the downstream drainage points. This replicated natural water infiltration in slopes and tailings dams. Specifically, as water levels in the upstream chamber were gradually increased, seepage into the tailings chamber raised the pore water pressure within the embankment. During this period, pore water pressure readings from the installed piezometers(Product Recovery Management Inc., Butner, USA) were recorded continuously, and images of the slope surface were captured at approximately one image every 2 s. This capture rate was selected due to the low permeability of the tailings material and the relatively slow rate of pore-pressure change. In addition, each image was assigned a sequential number (e.g., Image 1, Image 2, Image 3, etc.) to identify which image corresponded to a specific pore-pressure stage precisely. For instance, when the pore water pressure reached a loading level such as 1.0 kN/m2, the corresponding image number was recorded. This procedure ensured a convenient and accurate correlation between the evolution of pore water pressure and the images captured. The captured image sequence provided visual documentation of the entire failure process, from initial deformation through to final collapse. Pore water pressure values were recorded throughout the experiment; however, the pore water pressure at which displacement was first observed was of paramount importance.
2.6. Image Processing and Displacement Analysis
After acquiring high-resolution images during the experiment, the photographs were cropped to remove unnecessary background areas and isolate the region of interest. These prepared images were then imported into Mathematica (Version 14.1; Wolfram Research, Inc., 2024), where a dense optical-flow-based digital image processing algorithm was implemented to compute full-field pixel-by-pixel displacement vectors between consecutive images, thus highlighting the localized deformation within the slope model [37]. These matrices were visualized as gradient images to track movement progression and identify failure zones. The data was then transferred to MATLAB (Version 9.13.0 [R2023b]; MathWorks, Inc., 2023) for further analysis, where contour plots were generated to represent the displacement fields across the model [38]. A 25 cm printed ruler placed on the model served as a reference for calculating the pixel-to-length ratio, allowing the conversion of pixel displacement into accurate physical measurements [37].
3. Results and Discussion
3.1. Results
The results presented in this section are derived from physical laboratory experiments. Each laboratory test was thoroughly documented through high-resolution images that captured the slope in its initial condition, the progression of deformation, and the final state after failure. These image sequences provided the foundation for detailed displacement analysis using digital image processing techniques.
3.1.1. Test 1
Pore Water Pressure Before Failure
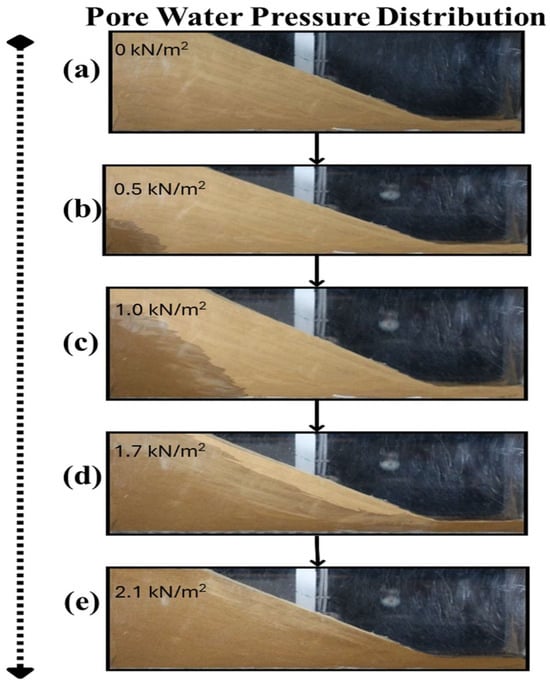
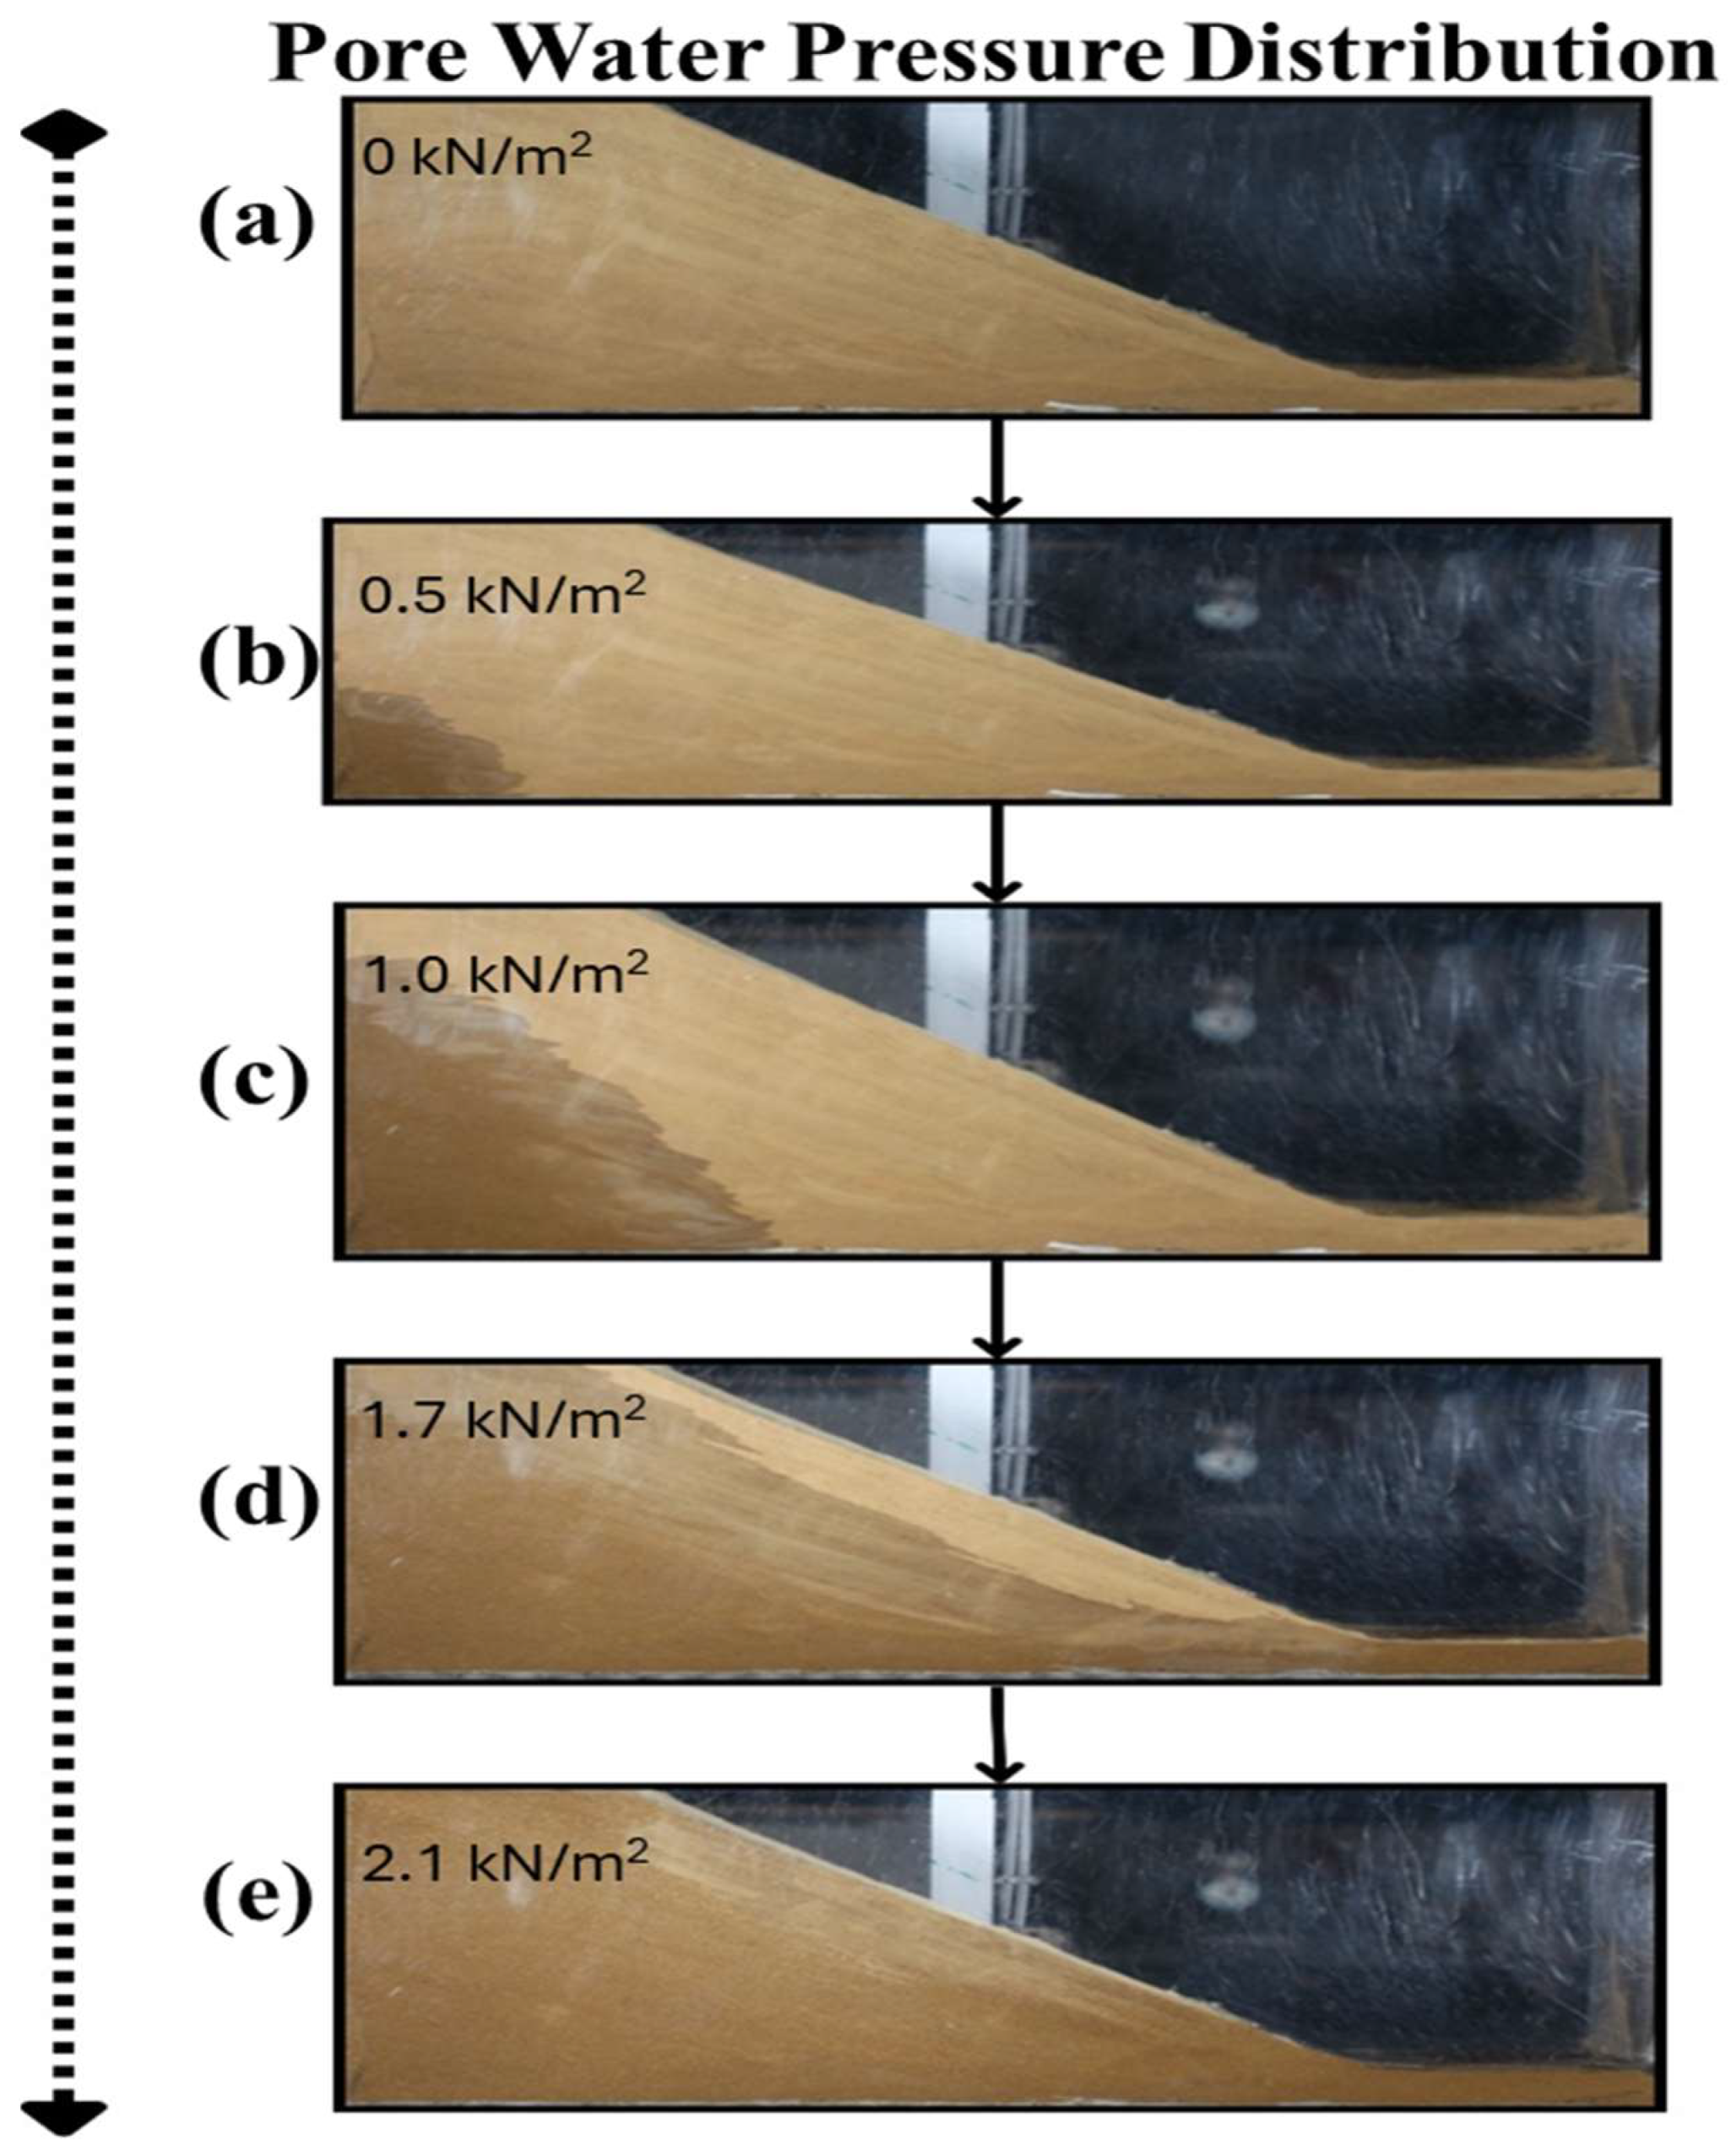
At the start of Test 1 (Figure 9a), the slope appeared stable, with no visible deformation. This served as a reference point for observing displacement and failure as pore water pressure increased [19]. The sequential photos below show how the coarse tailings slope responded as pore water pressure increased from 0 to 2.1 kN/m2 (Figure 9a–e). Initially, the slope remained stable and dry. As water seeped through the permeable tailings at 0.5–1.7 kN/m2, signs of moisture began to appear near the base. By 2.1 kN/m2 (Figure 9e), internal pore pressure reached a critical point, setting the stage for failure [6,7].
Figure 9.
Pore water pressure distribution in the tailings slope in Test 1 (a–e).
Visualization of Displacement Fields-Test 1
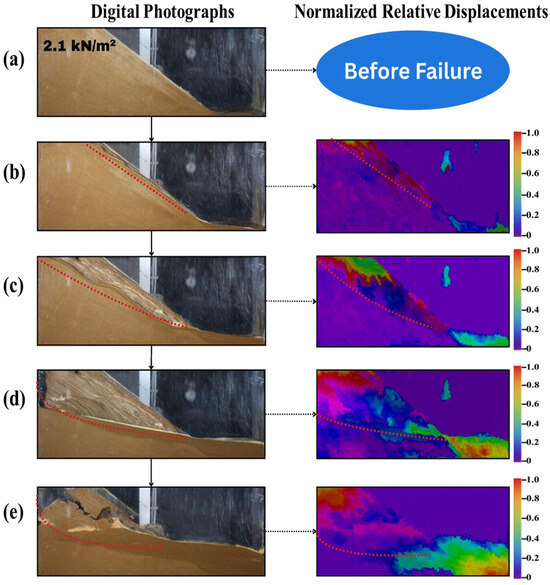
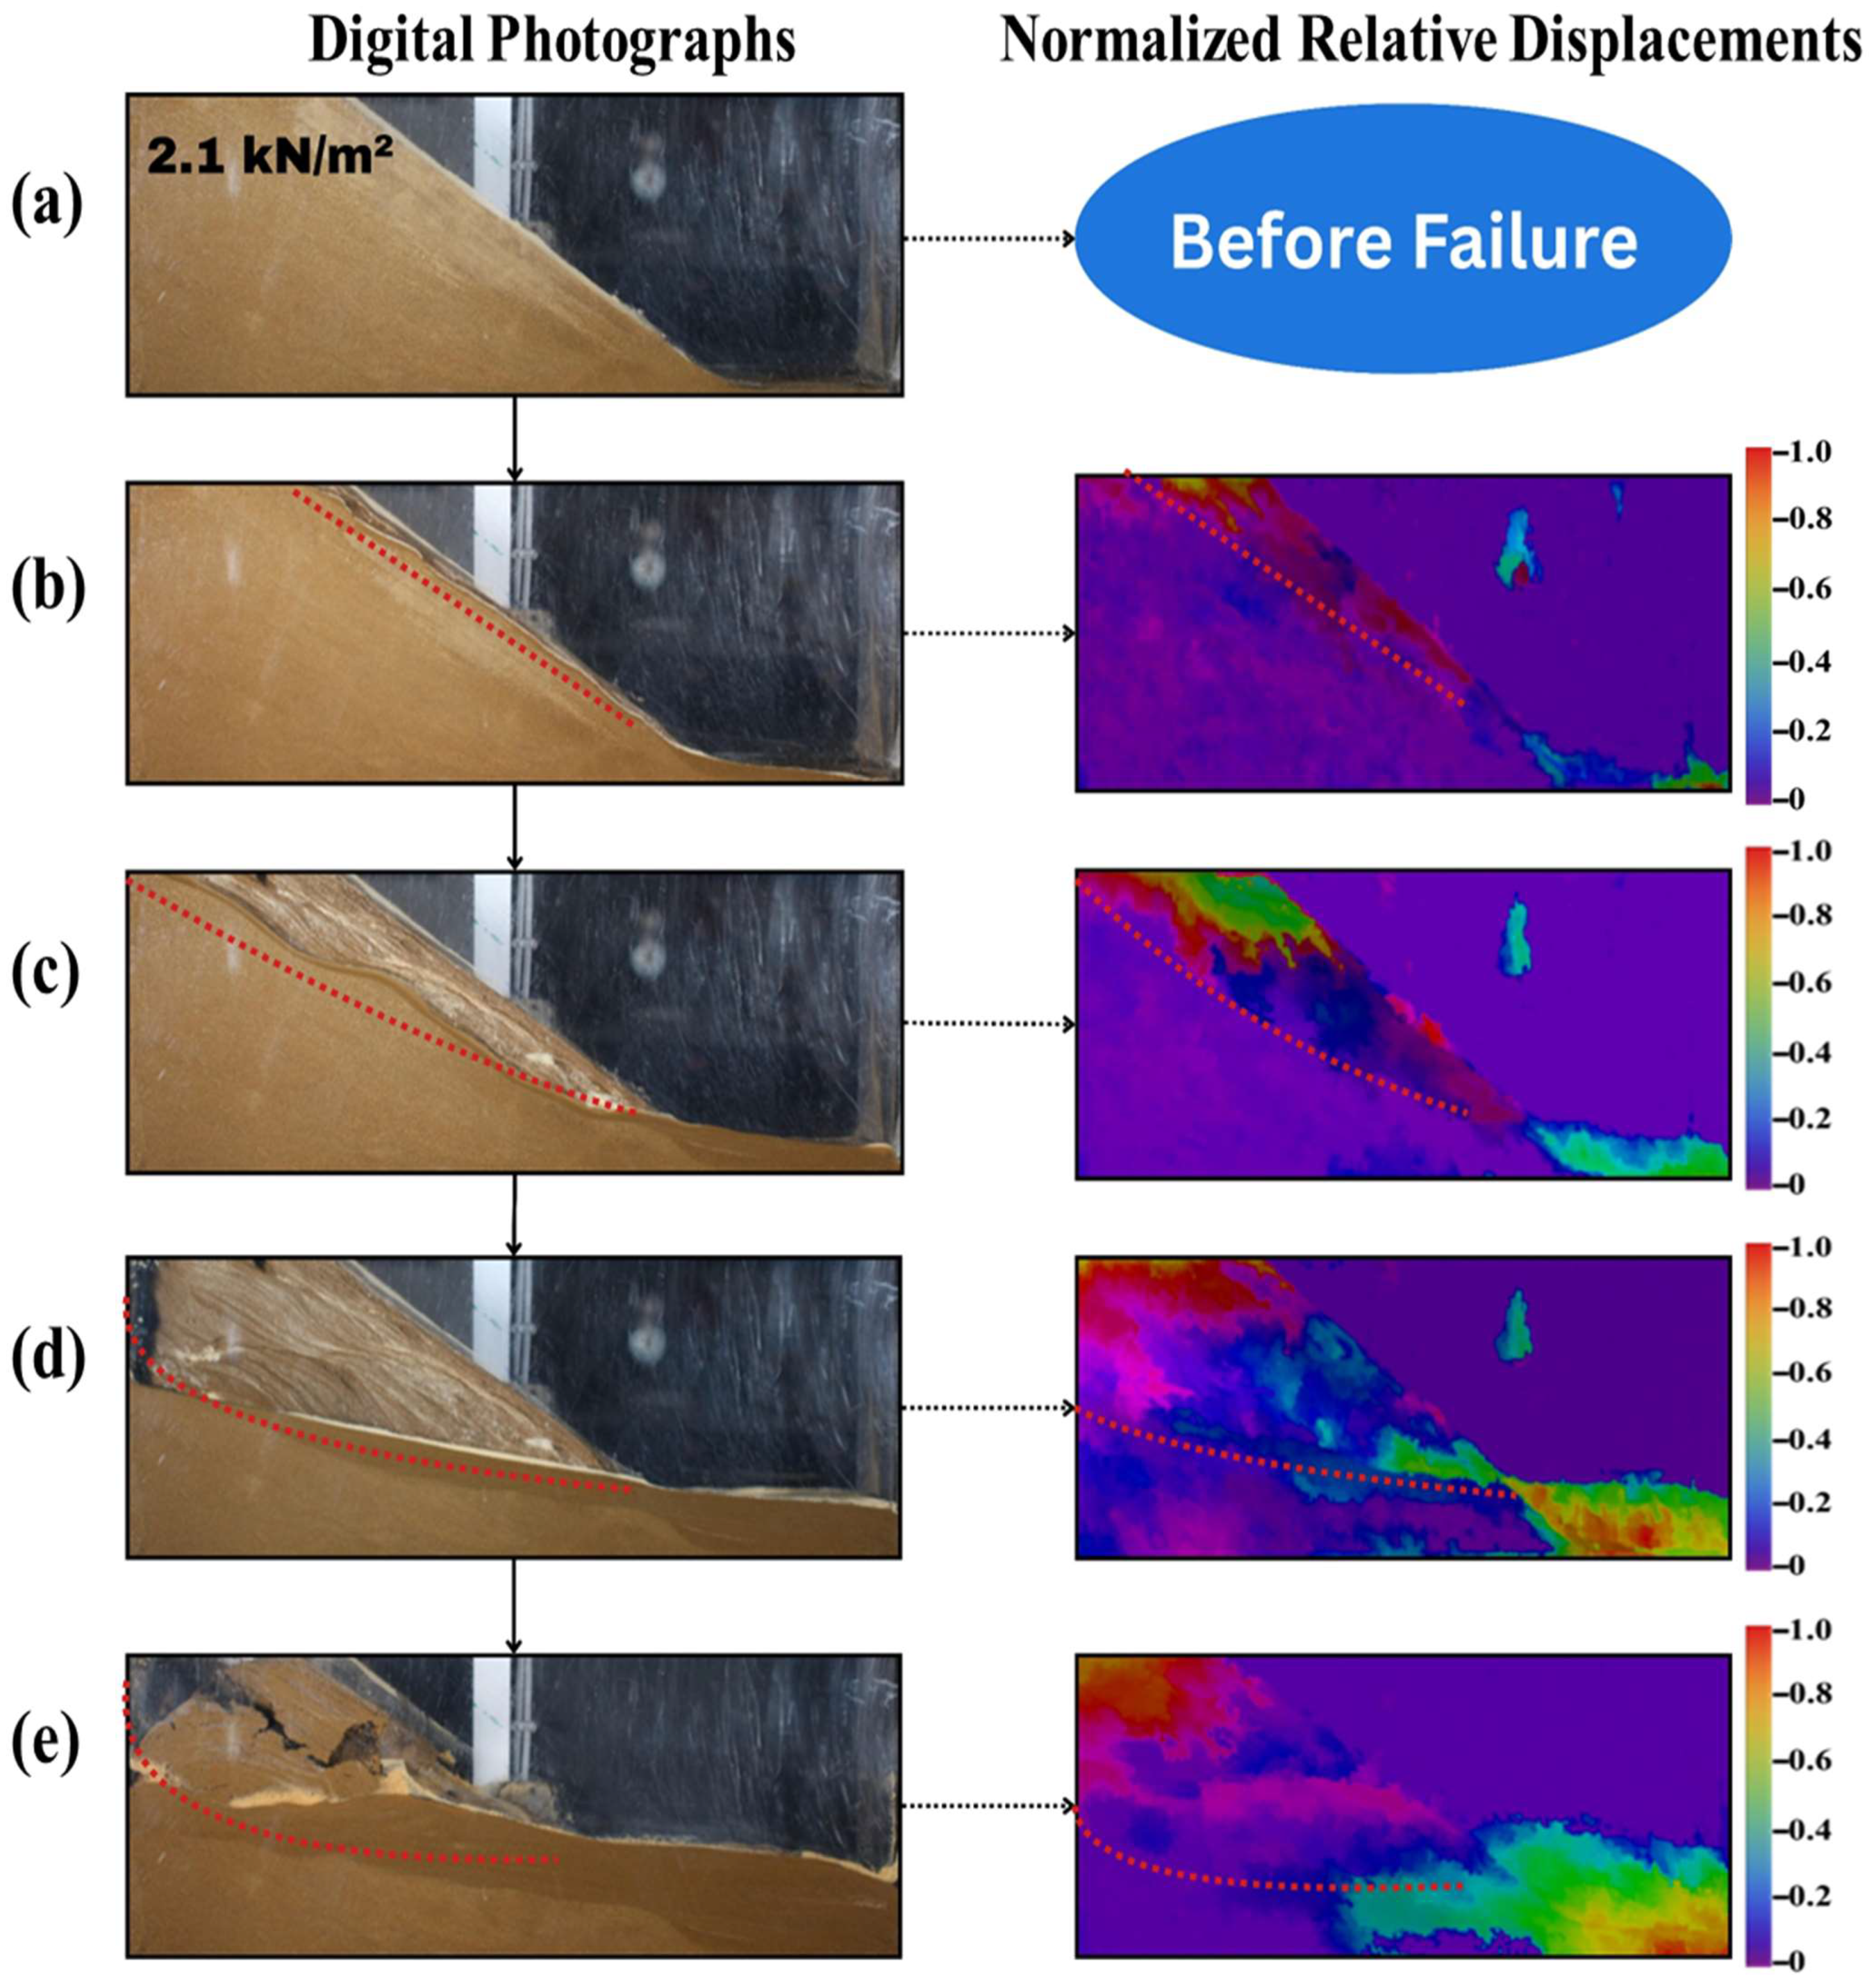
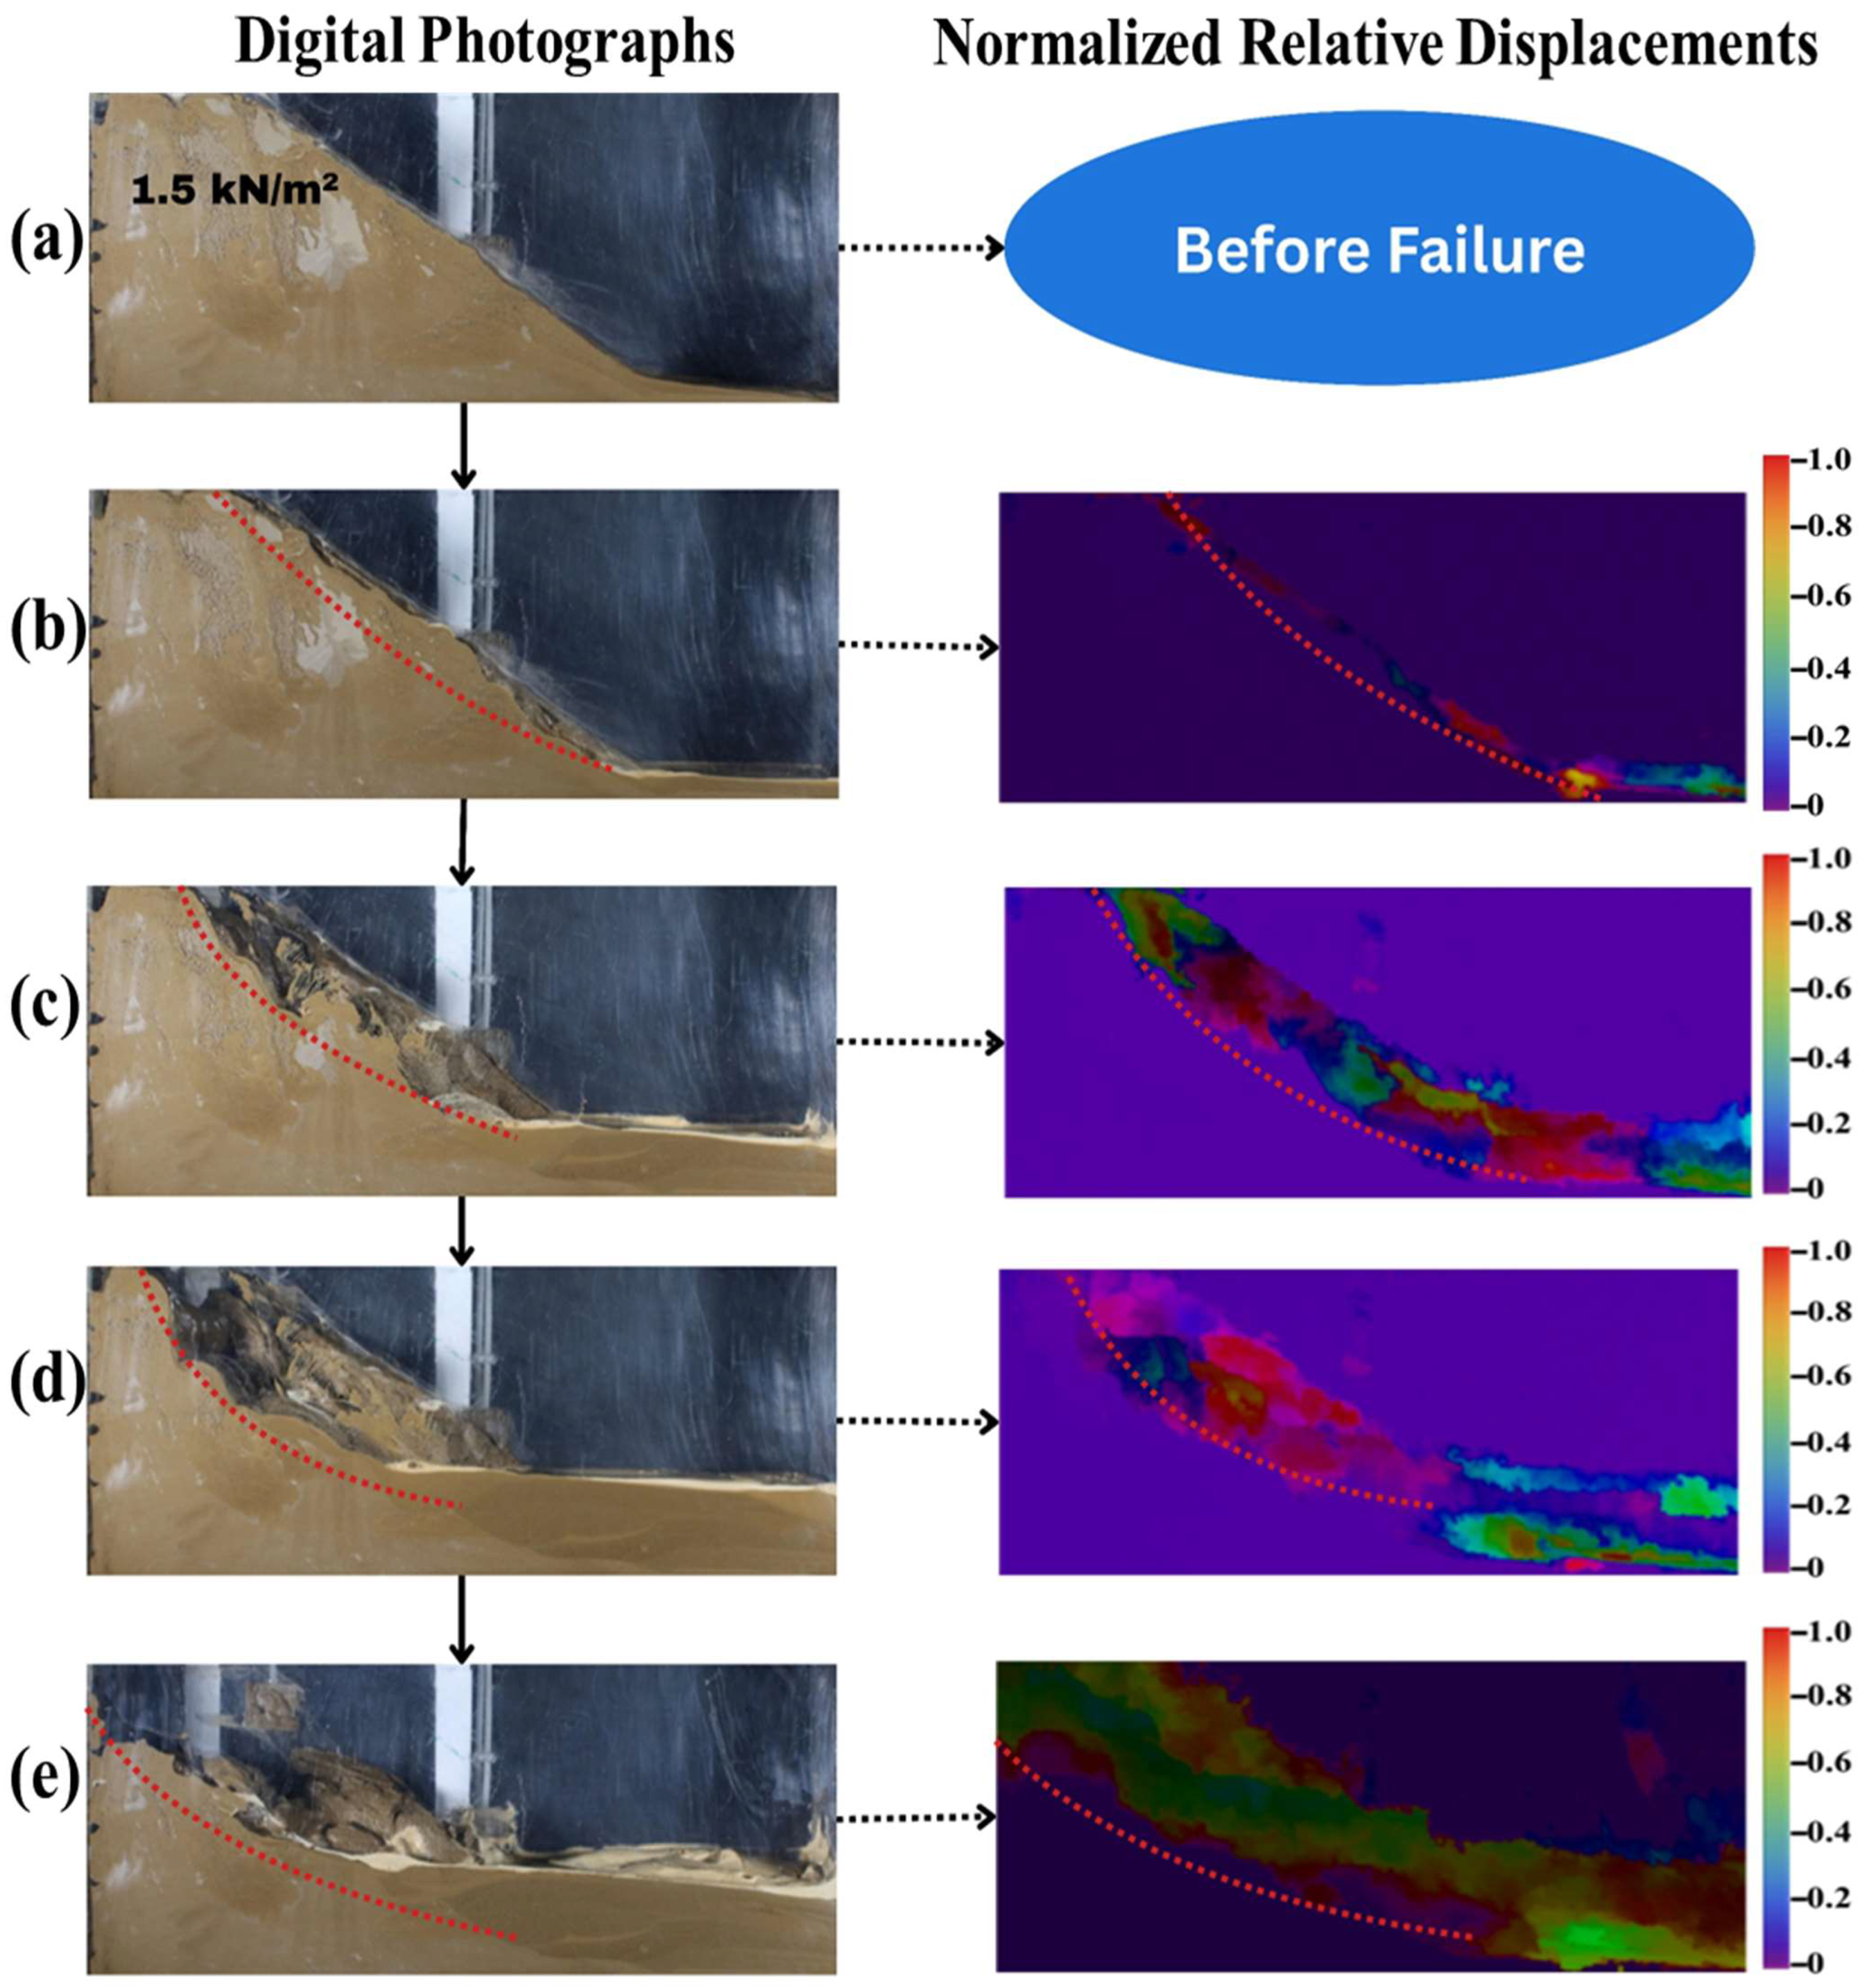
The images (Figure 10) show a side-by-side comparison of physical deformation and normalized displacement visualizations from lab tests. The image sequence illustrates the progressive deformation and failure of the coarse tailings slope, initiated at a pore water pressure of 2.1 kN/m2 (Figure 10a). The first frame captures the moment just after the onset of failure, showing a downward and outward movement of the upper-slope material. A clear translational slide develops as the sequence advances, with tailings moving along a defined plane toward the lower slope [2,26]. Internal pore water pressure gradually decreased during this process, likely due to water expulsion as the structure lost its ability to retain water [6,7].
Figure 10.
Digital photographs and normalized relative displacement results (derived from digital image processing) in Test 1 (a–e). On the color scale, 0 represents no displacement, and 1 represents the maximum captured displacement between the two compared digital photographs.
Visualization of the Displacement Field Contours in X and Y Directions
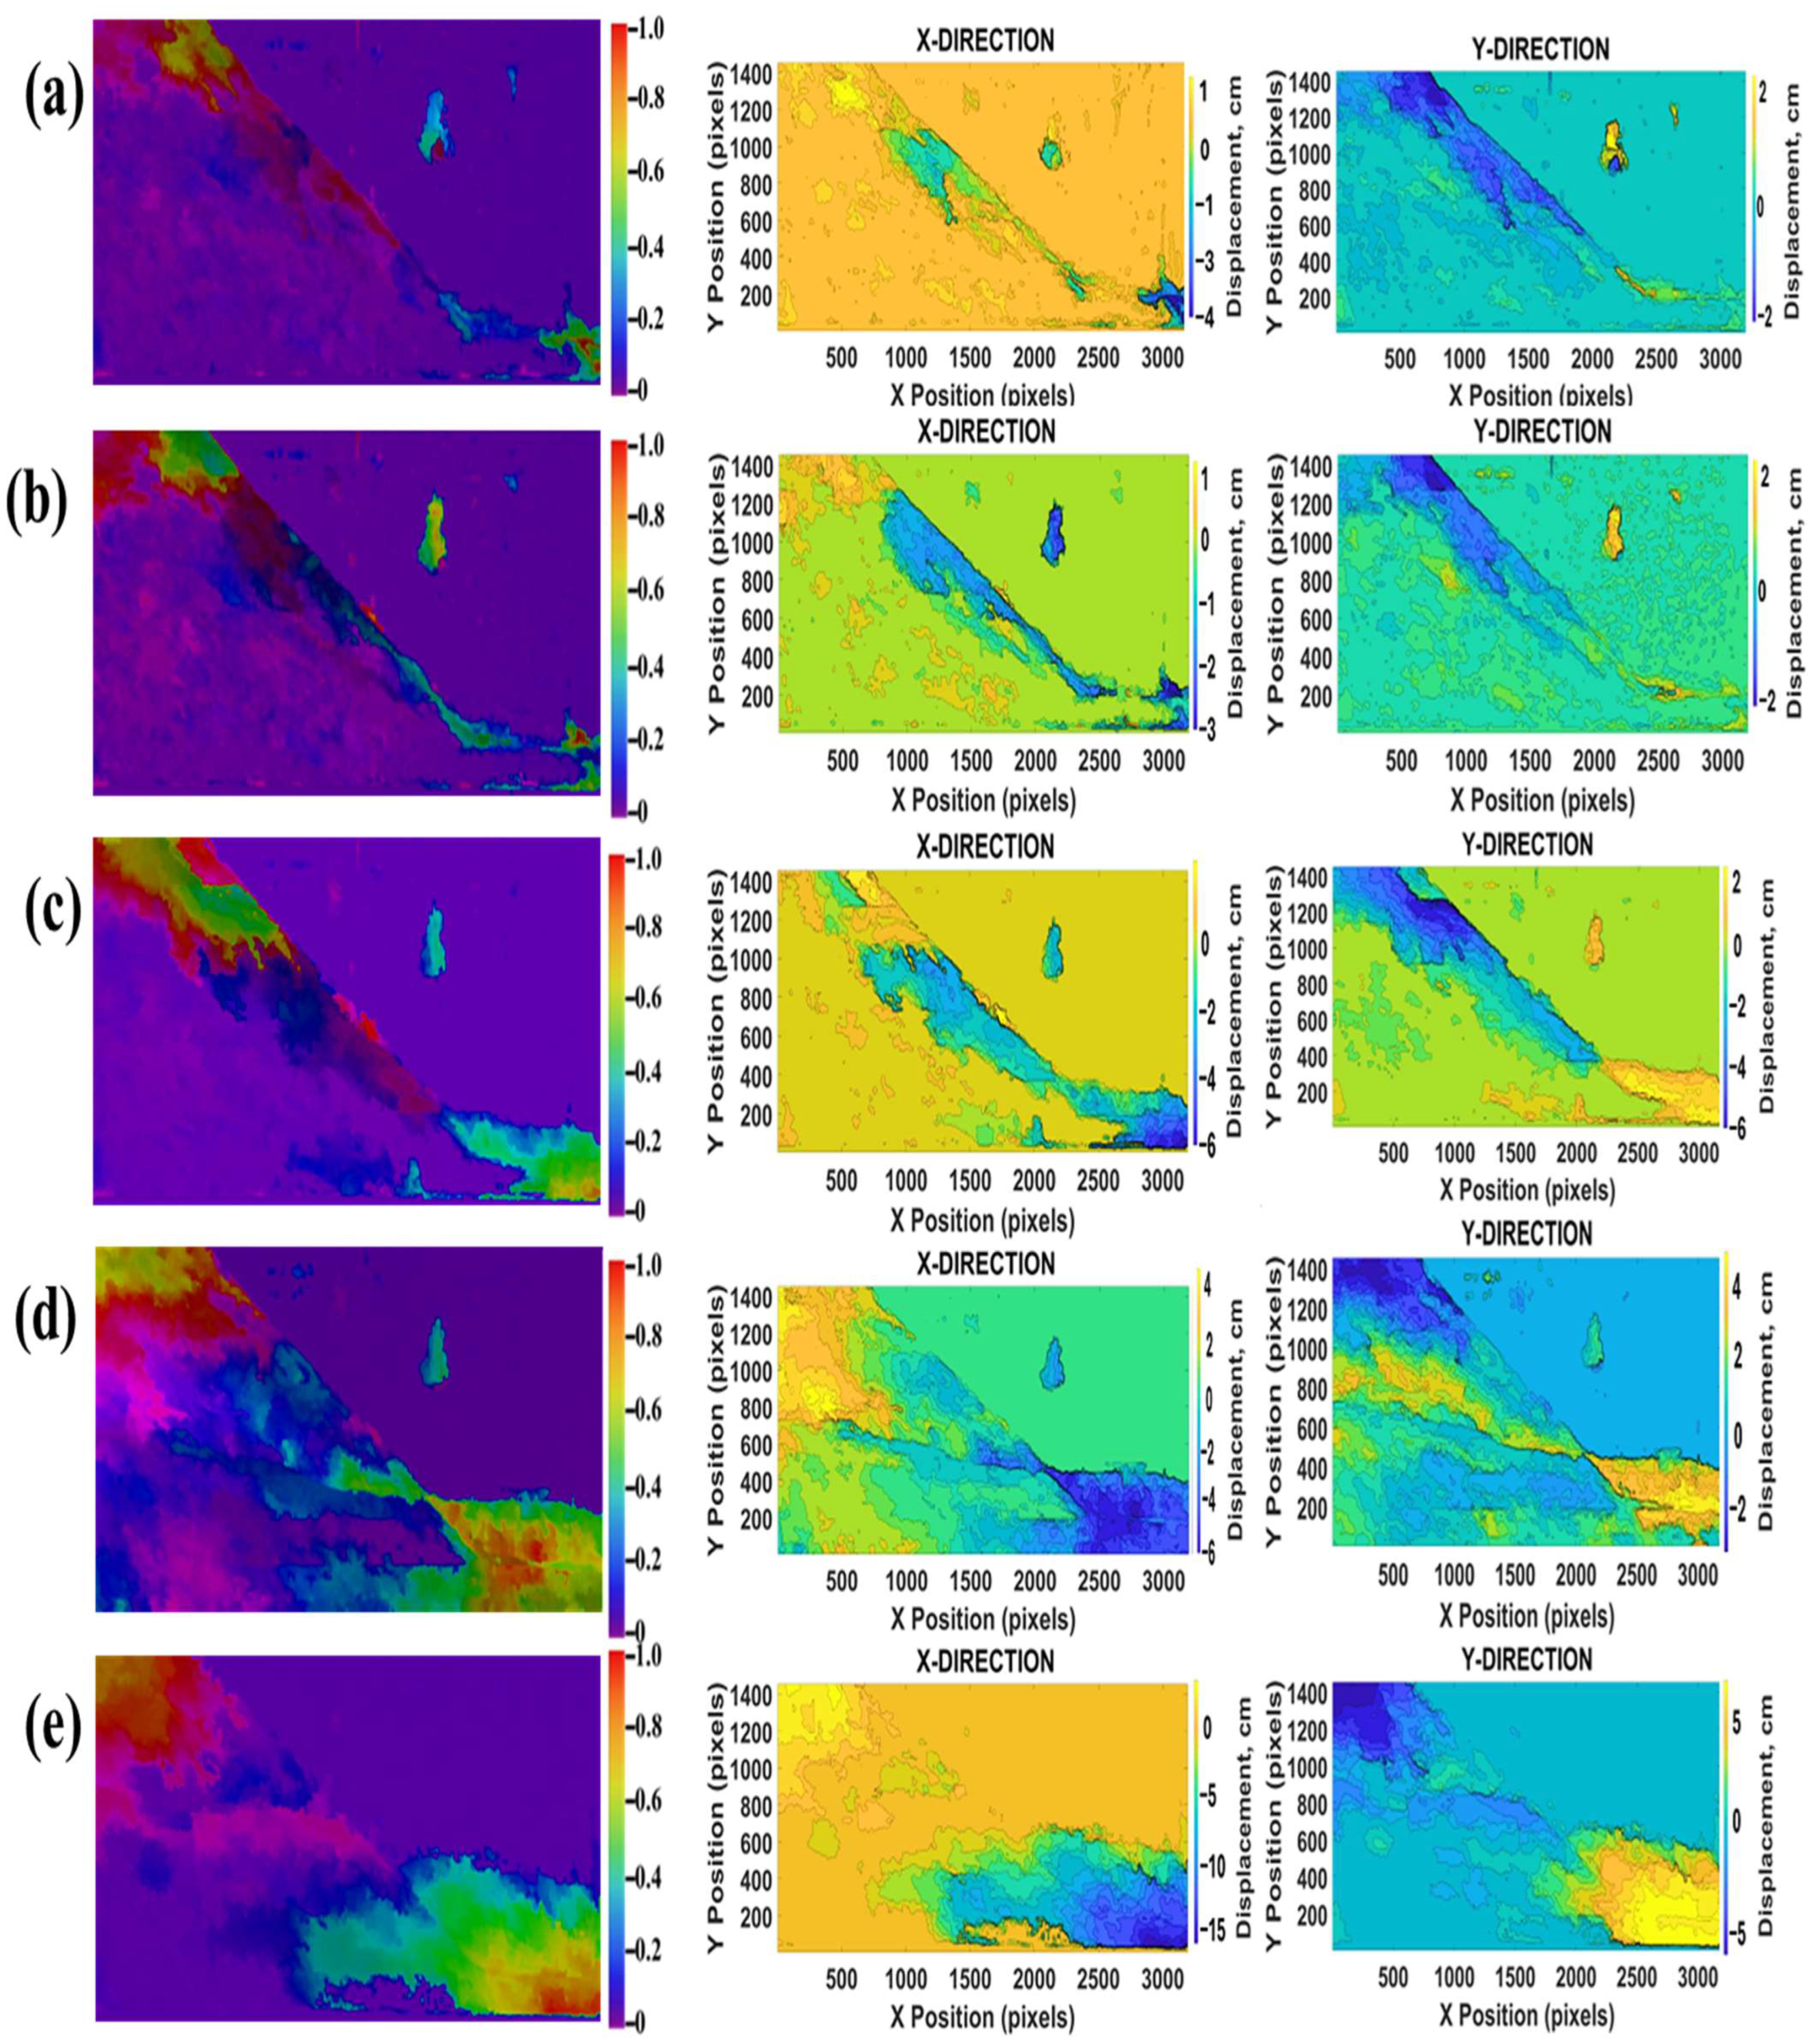
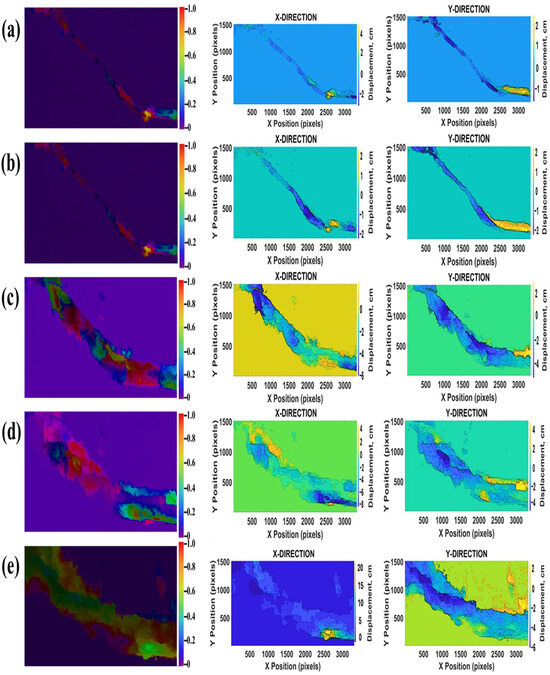
Figure 11 shows the visualization of the displacement field contours in the X and Y directions, illustrating displacement measured during slope instability in Test 1.
Figure 11.
Displacement field contours in X and Y directions in Test 1 (a–e).
3.1.2. Test 2
Test 2 was conducted using fine tailings material under the same rising pore water pressure conditions. This experiment followed the same geometric configuration and testing procedure as the previous test to ensure consistency.
Pore Water Pressure Before Failure
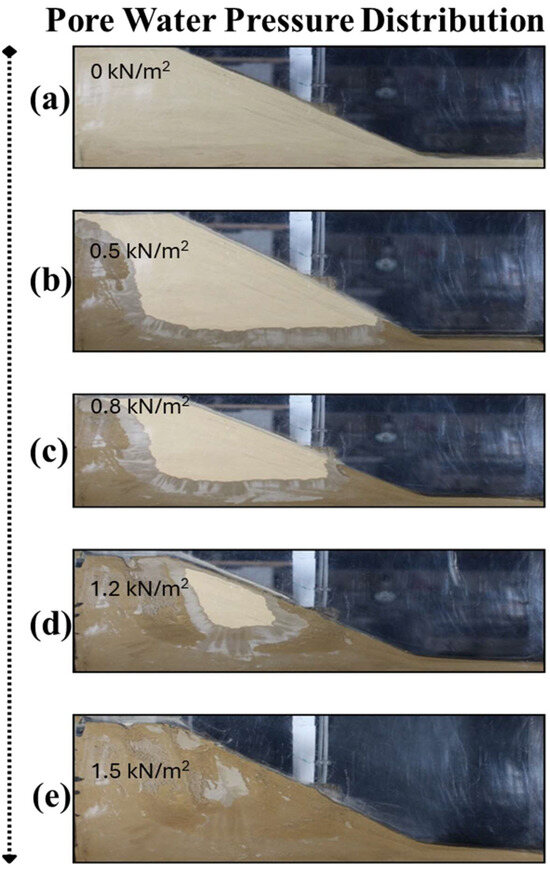
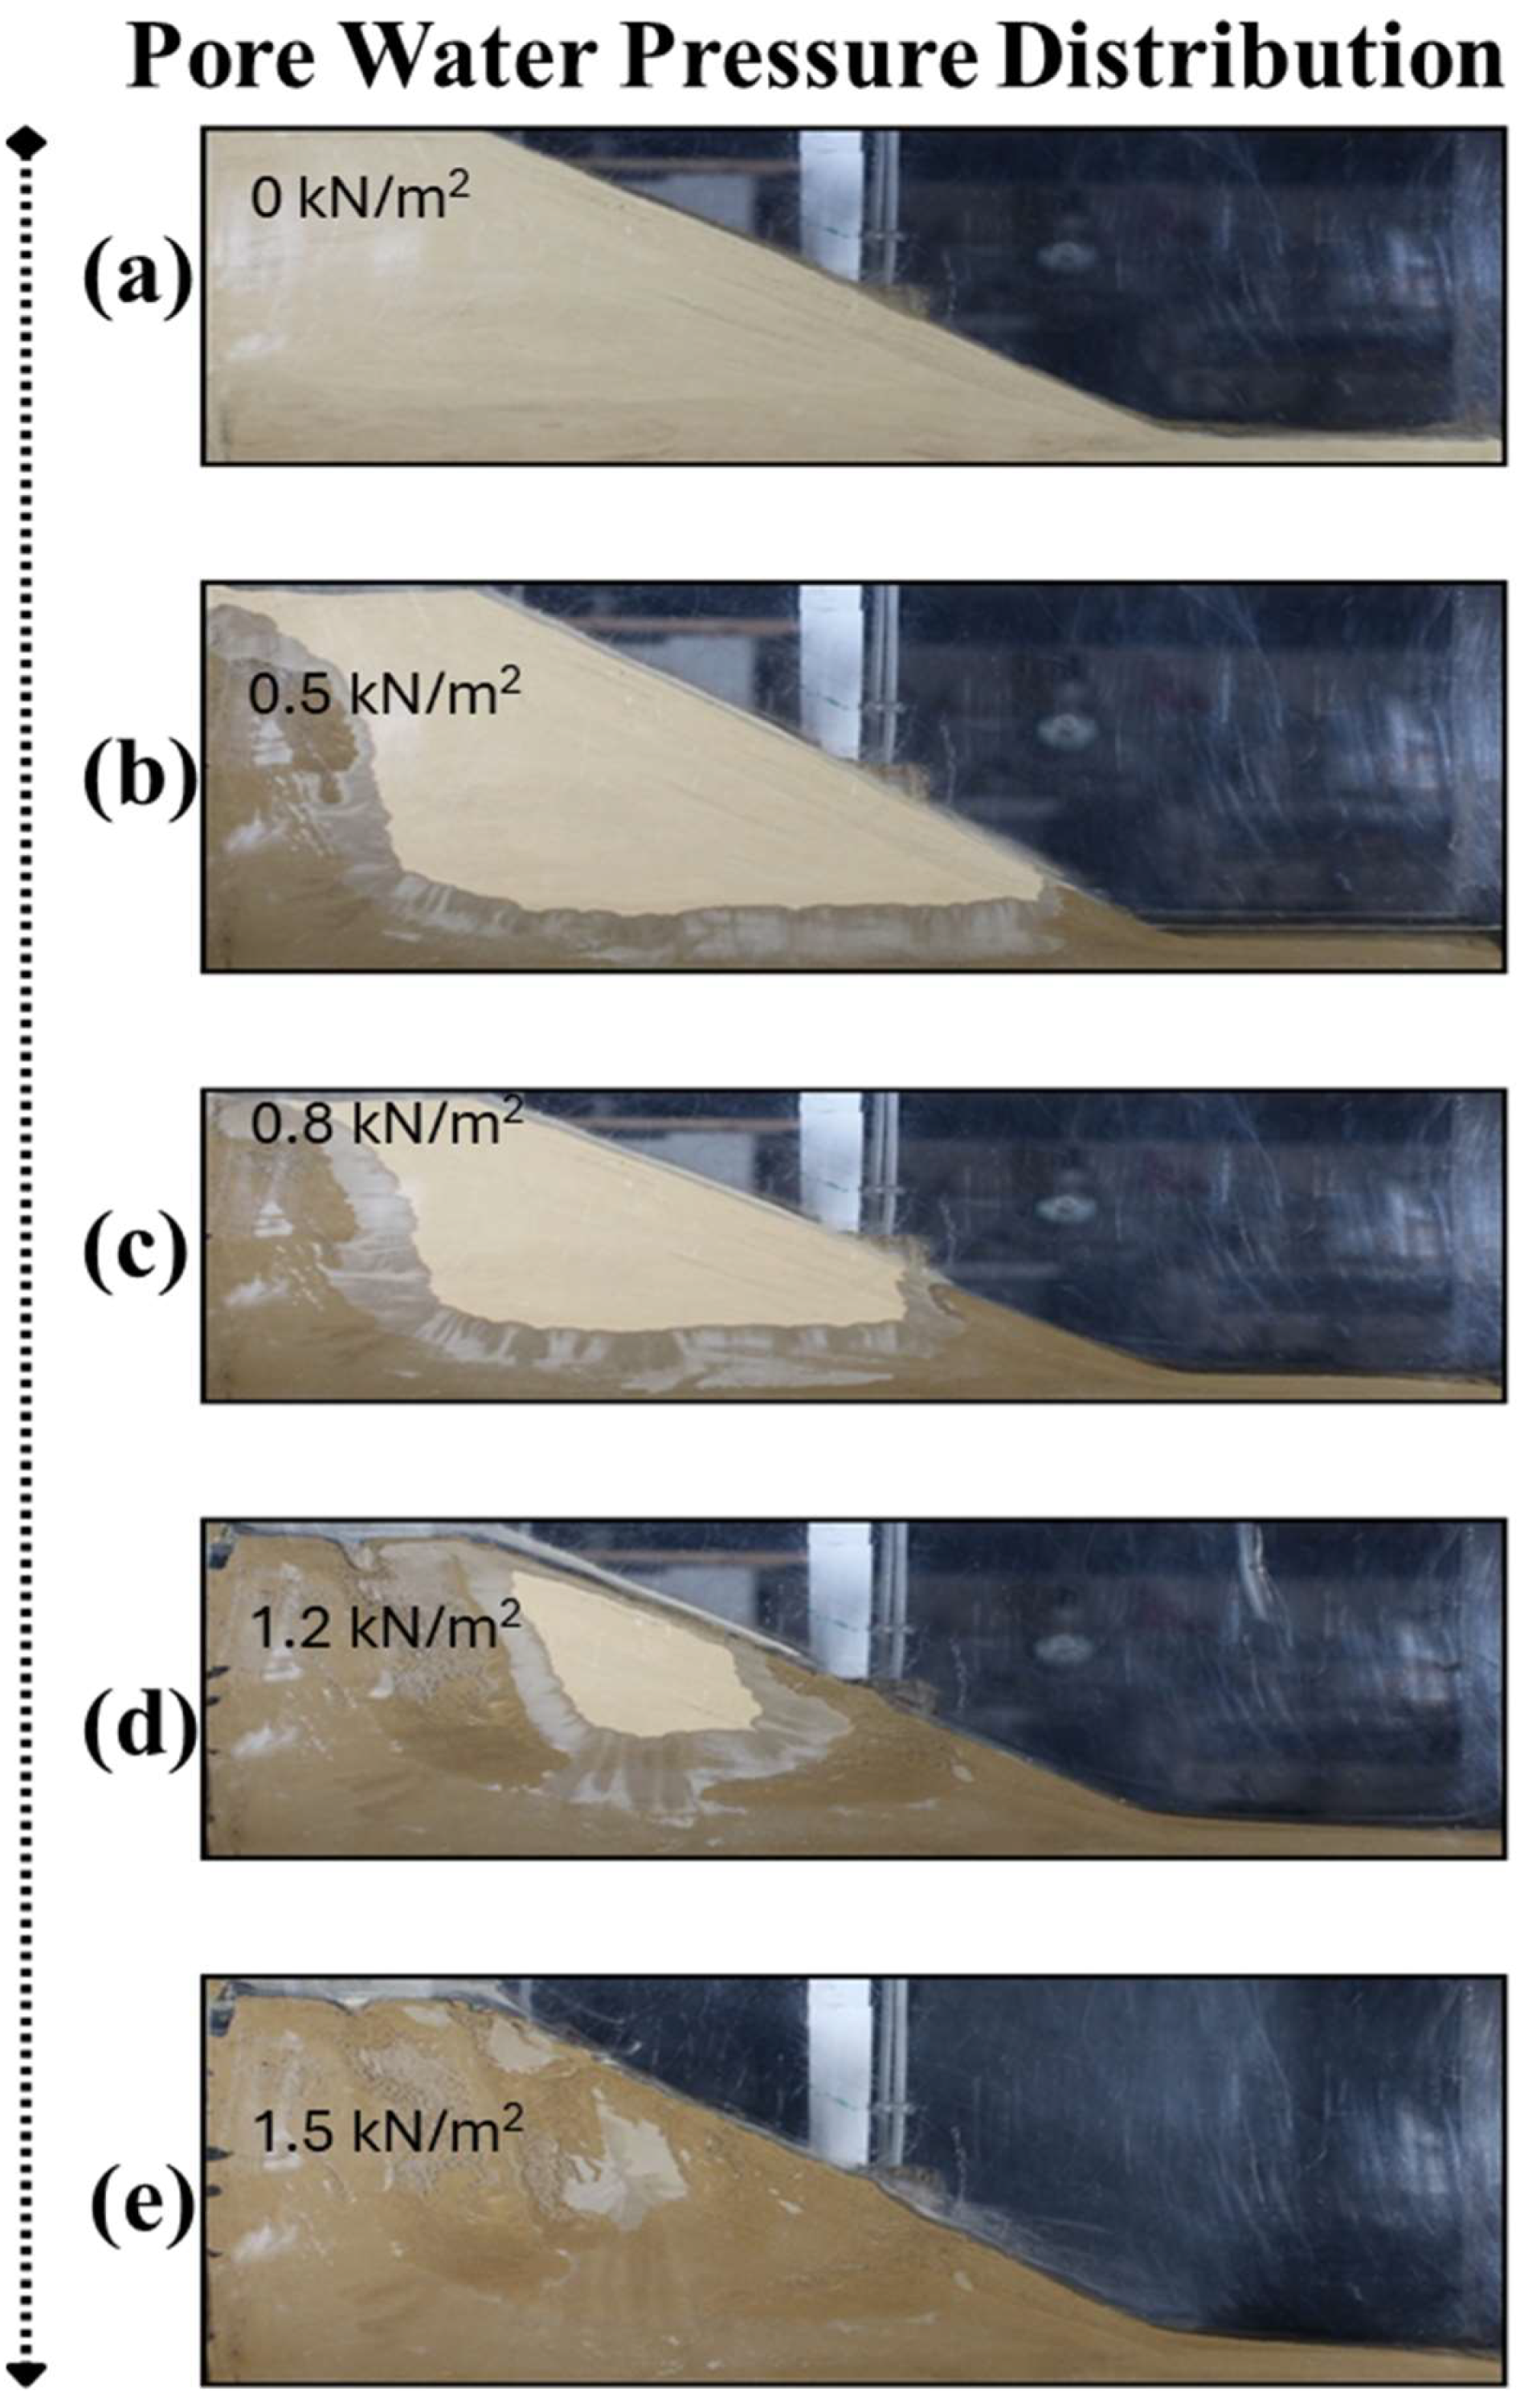
The sequential images in Figure 12 illustrate how the fine tailings slope responded to increasing pore water pressure from 0 to 1.5 kN/m2. At zero pore water pressure (Figure 12a), the slope was completely dry and stable. As pore pressure rose to 0.5 kN/m2 (Figure 12b) and 0.8 kN/m2 (Figure 12c), water began to infiltrate the slope, with visible saturation zones forming along the toe and side boundaries due to the low permeability of the fine tailings [6,7]. At a pore water pressure of 1.2 kN/m2 (Figure 12d), water accumulation became more pronounced, and portions of the slope appeared detached, indicating internal weakening. At a pore water pressure of 1.5 kN/m2 (Figure 12e), significant softening and localized settlement were observed, suggesting that the slope was approaching failure [19]. The rise in pore water pressure from the toe region (Figure 12) was controlled by seepage toward the downstream drainage boundary, where a local water table first formed under low-permeability conditions, causing pore pressure to accumulate at the toe before propagating upslope.
Figure 12.
Pore water pressure distribution in the tailings slope in Test 2 (a–e).
Visualization of Displacement Fields-Test 2
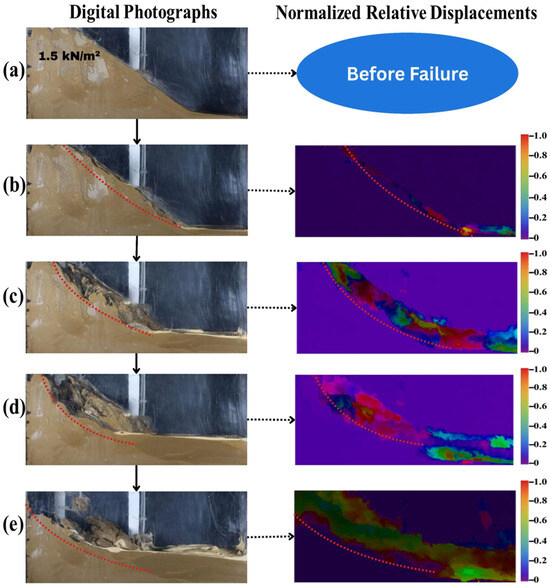
The images in Figure 13 illustrate the progressive deformation and failure of the fine-tailings slope under rising pore water pressure. In the initial stage (Figure 13a), the slope remained intact. As pressure increased, signs of instability began to appear (Figure 13b), with noticeable horizontal and vertical displacements showing the onset of movement [19]. As shown in Figure 14c, deformation increased, and a distinct curved slip surface started to show. By the stage in Figure 13d, the slope underwent further displacement along this slip surface, confirming the development of a circular or log-spiral failure surface [26]. Finally, as shown in Figure 13e, the slope collapsed, showing large-scale movement concentrated near the toe and crest, clearly demonstrating a full circular or log-spiral failure caused by increased pore water pressure.
Figure 13.
Digital photographs and normalized relative displacements in Test 2 (a–e).
Figure 14.
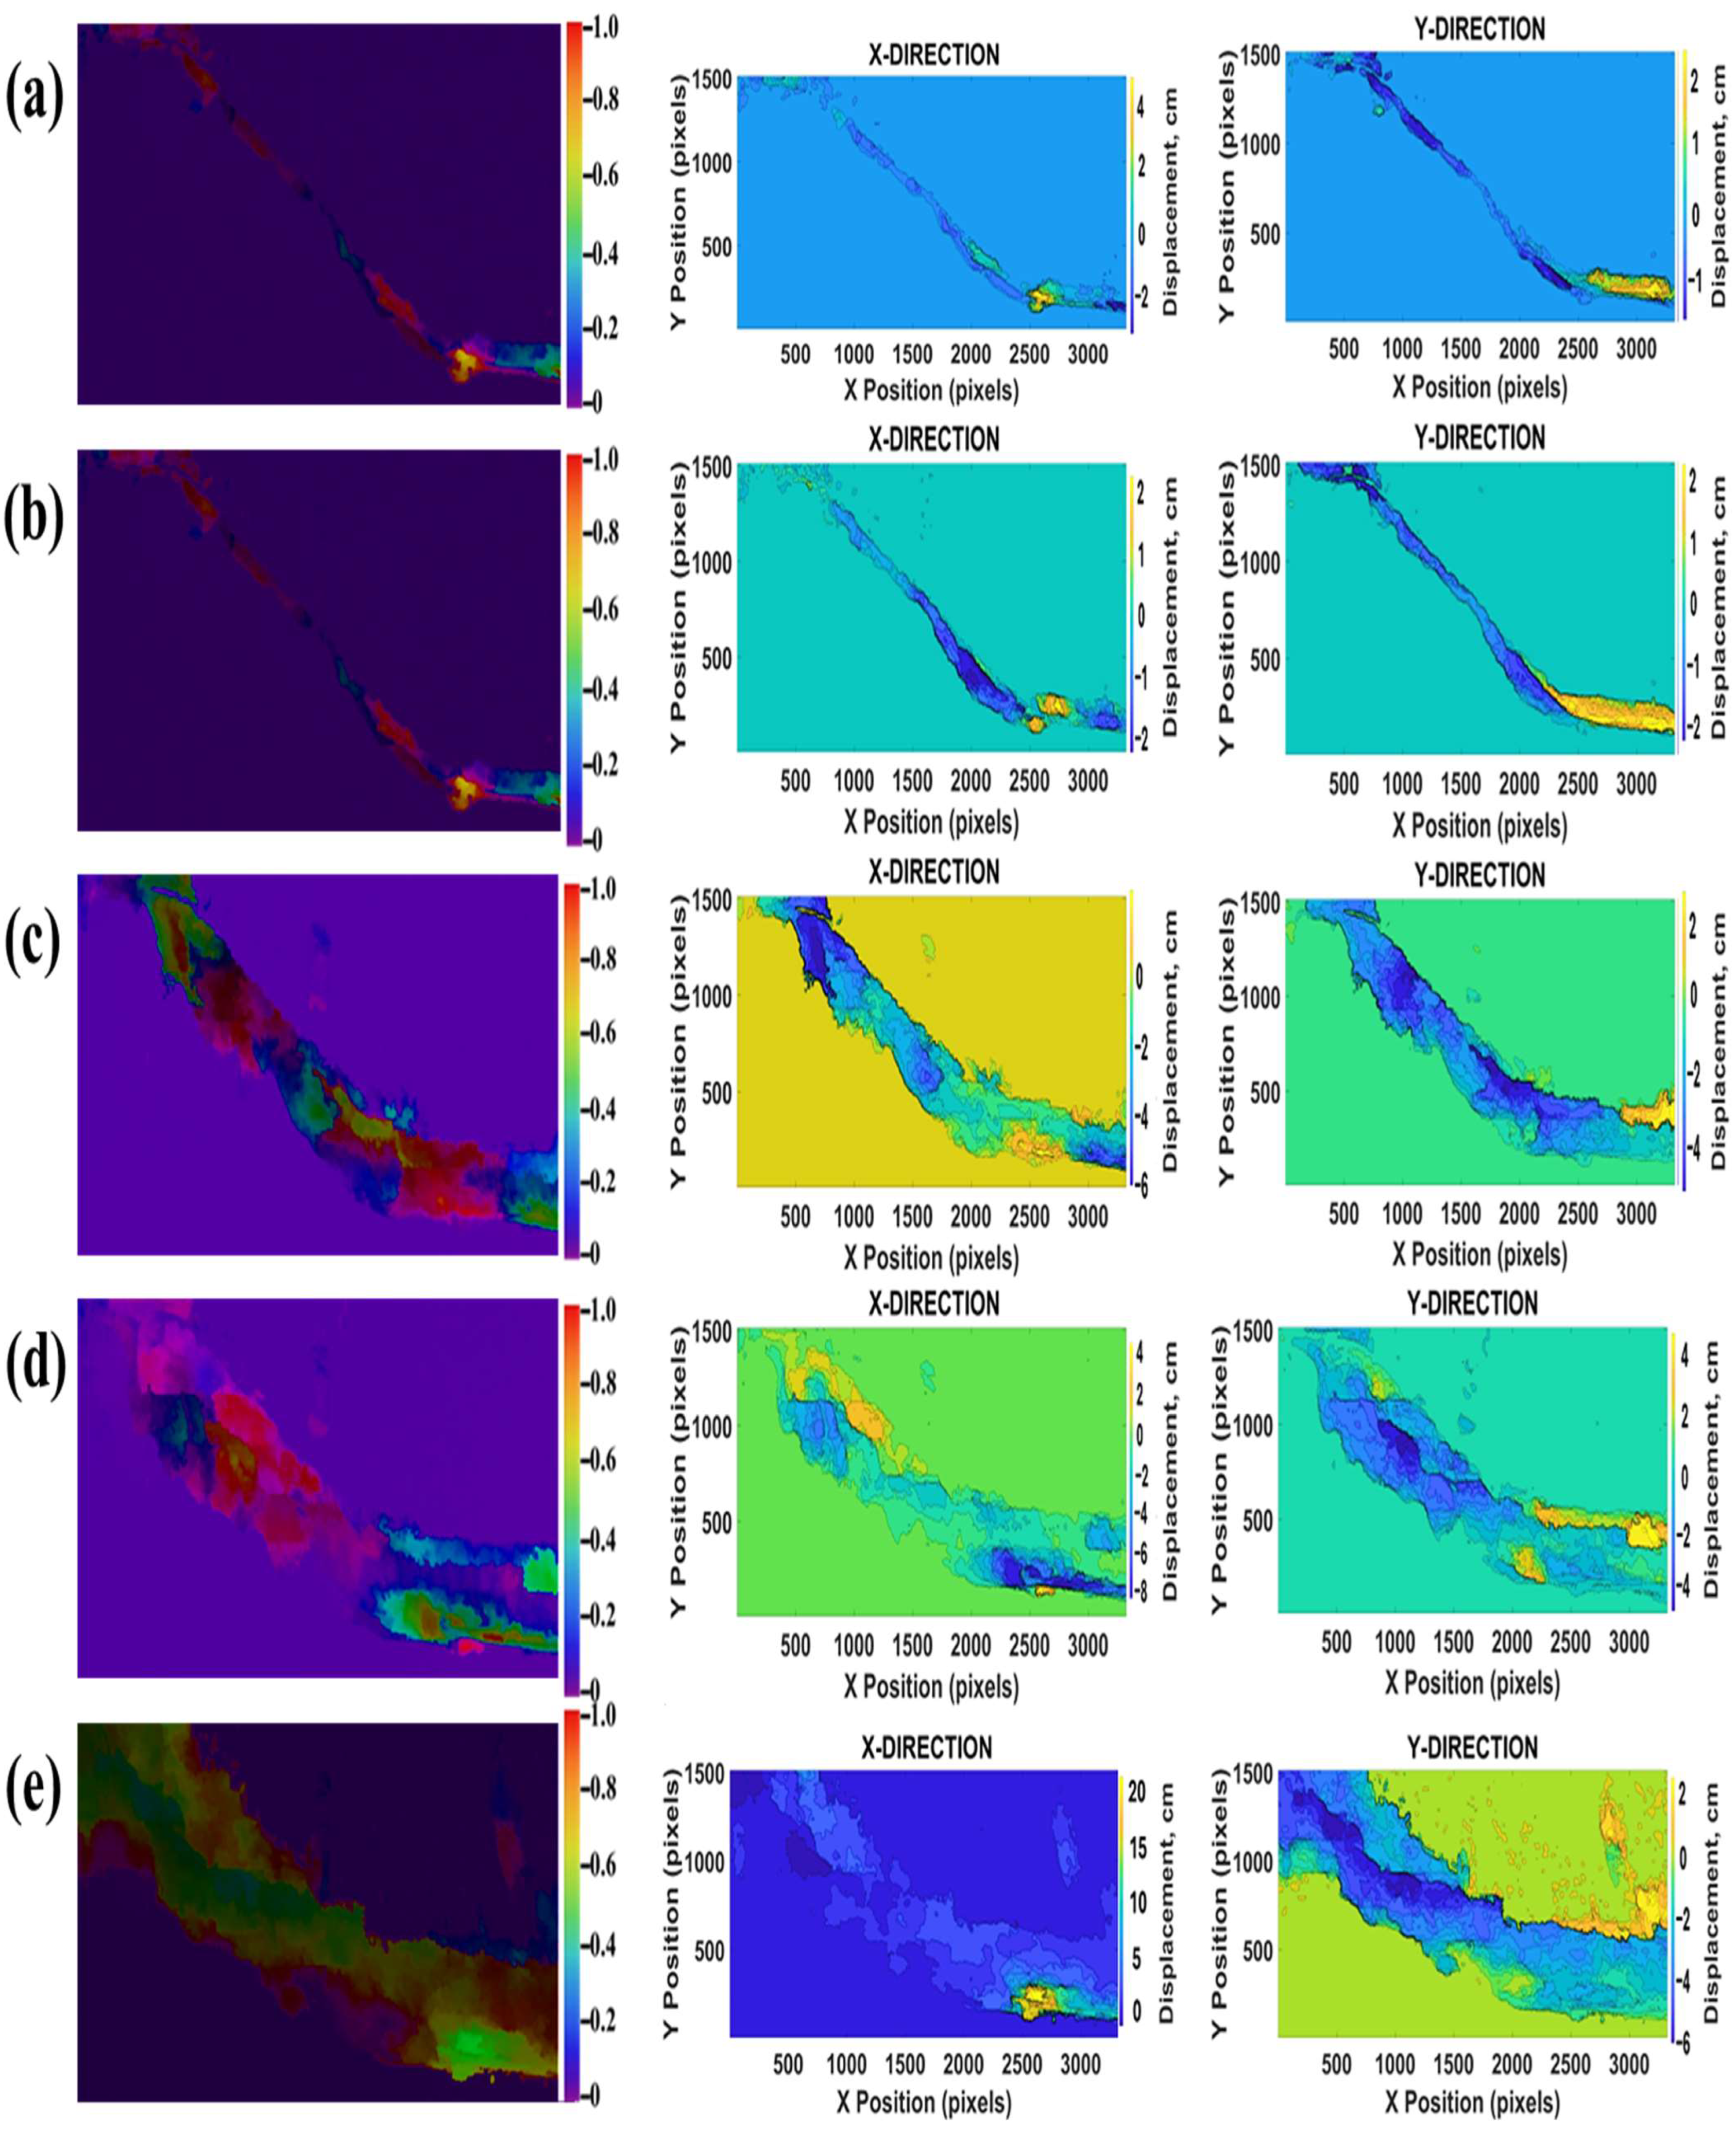
Displacement field contours in X and Y Directions in Test 2 (a–e).
Visualization of Displacement Field Contours in X and Y Directions
Figure 12 shows the displacement field contours in the X and Y directions, illustrating evolution and magnitude of deformation during slope instability in Test 2.
3.1.3. Displacement Direction Vector Fields of Tests 1 and 2
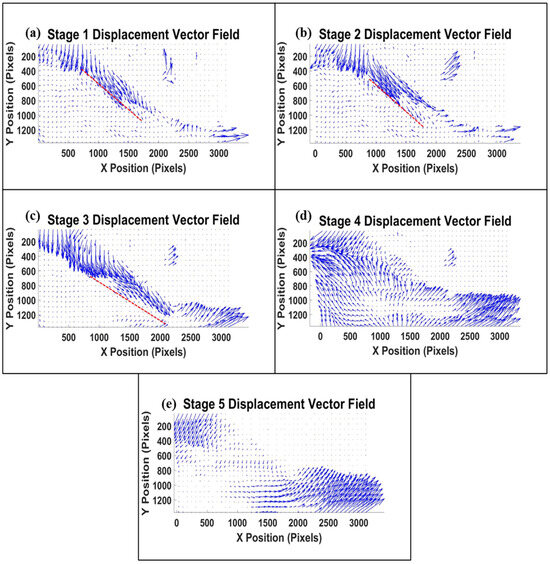
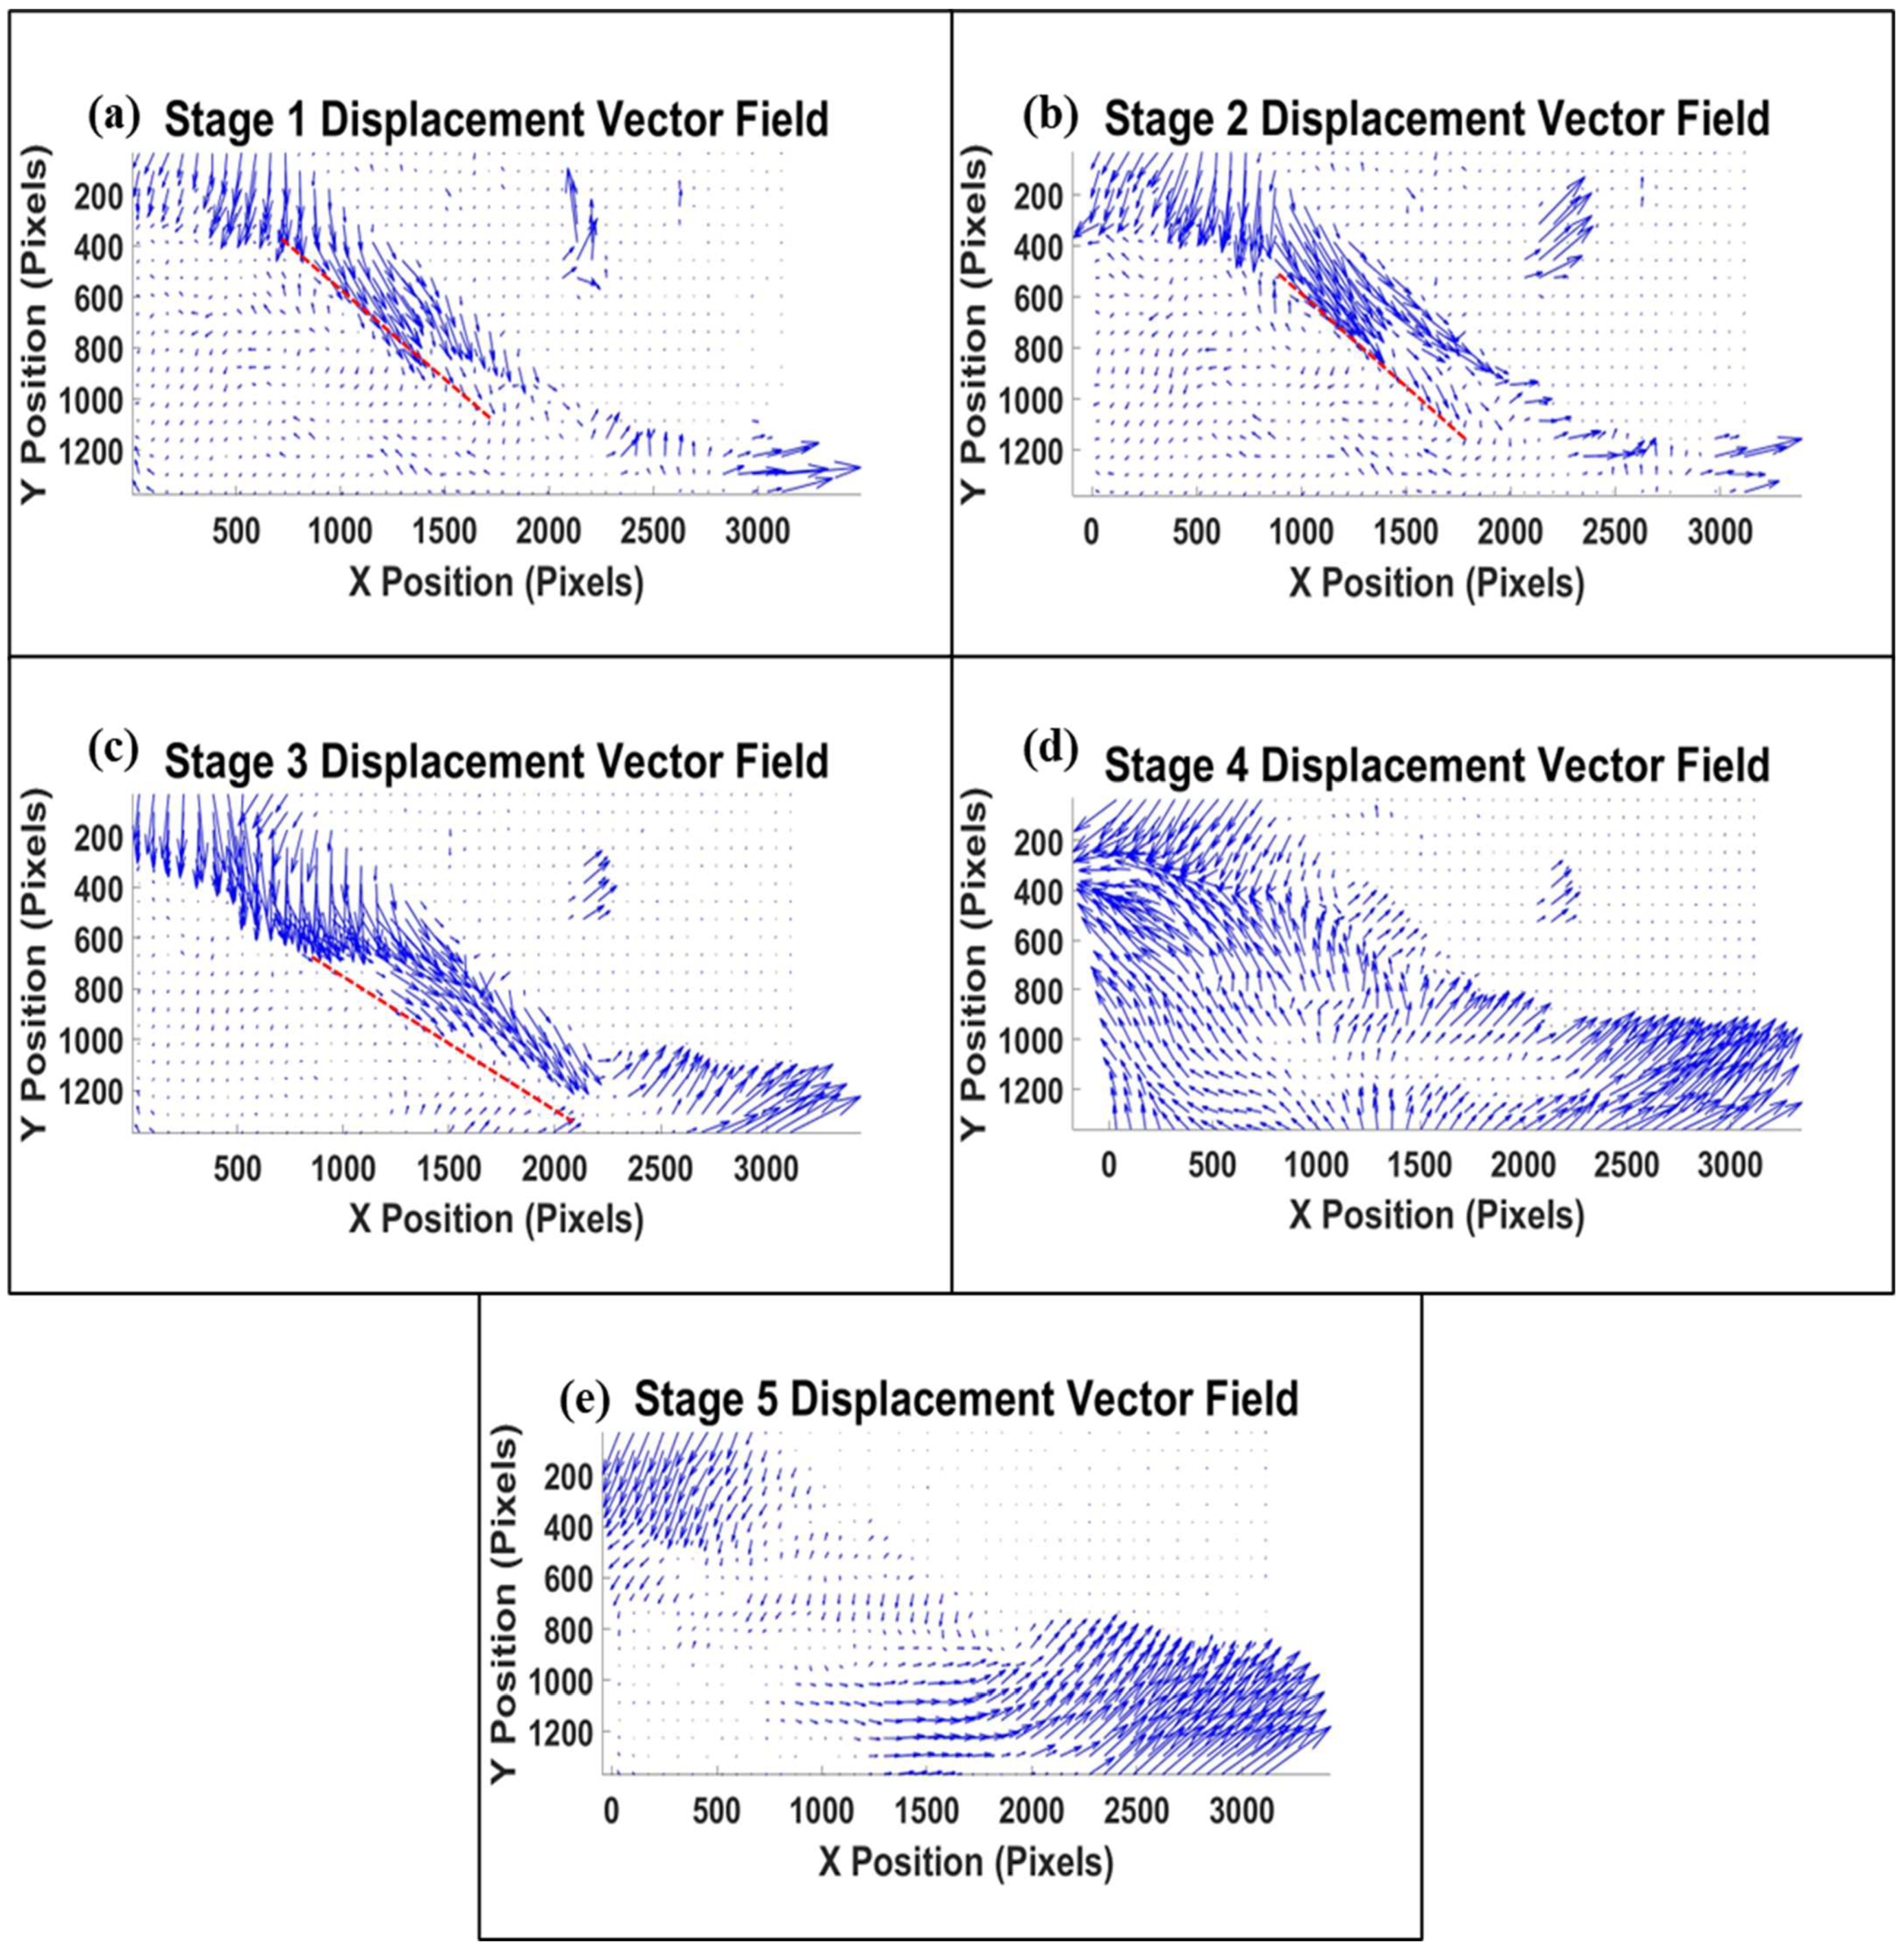
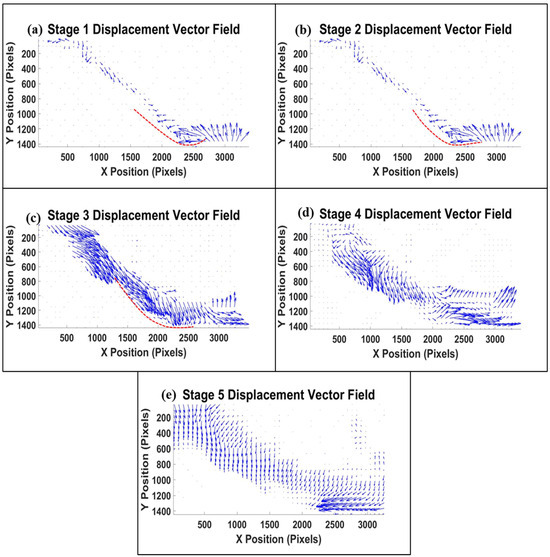
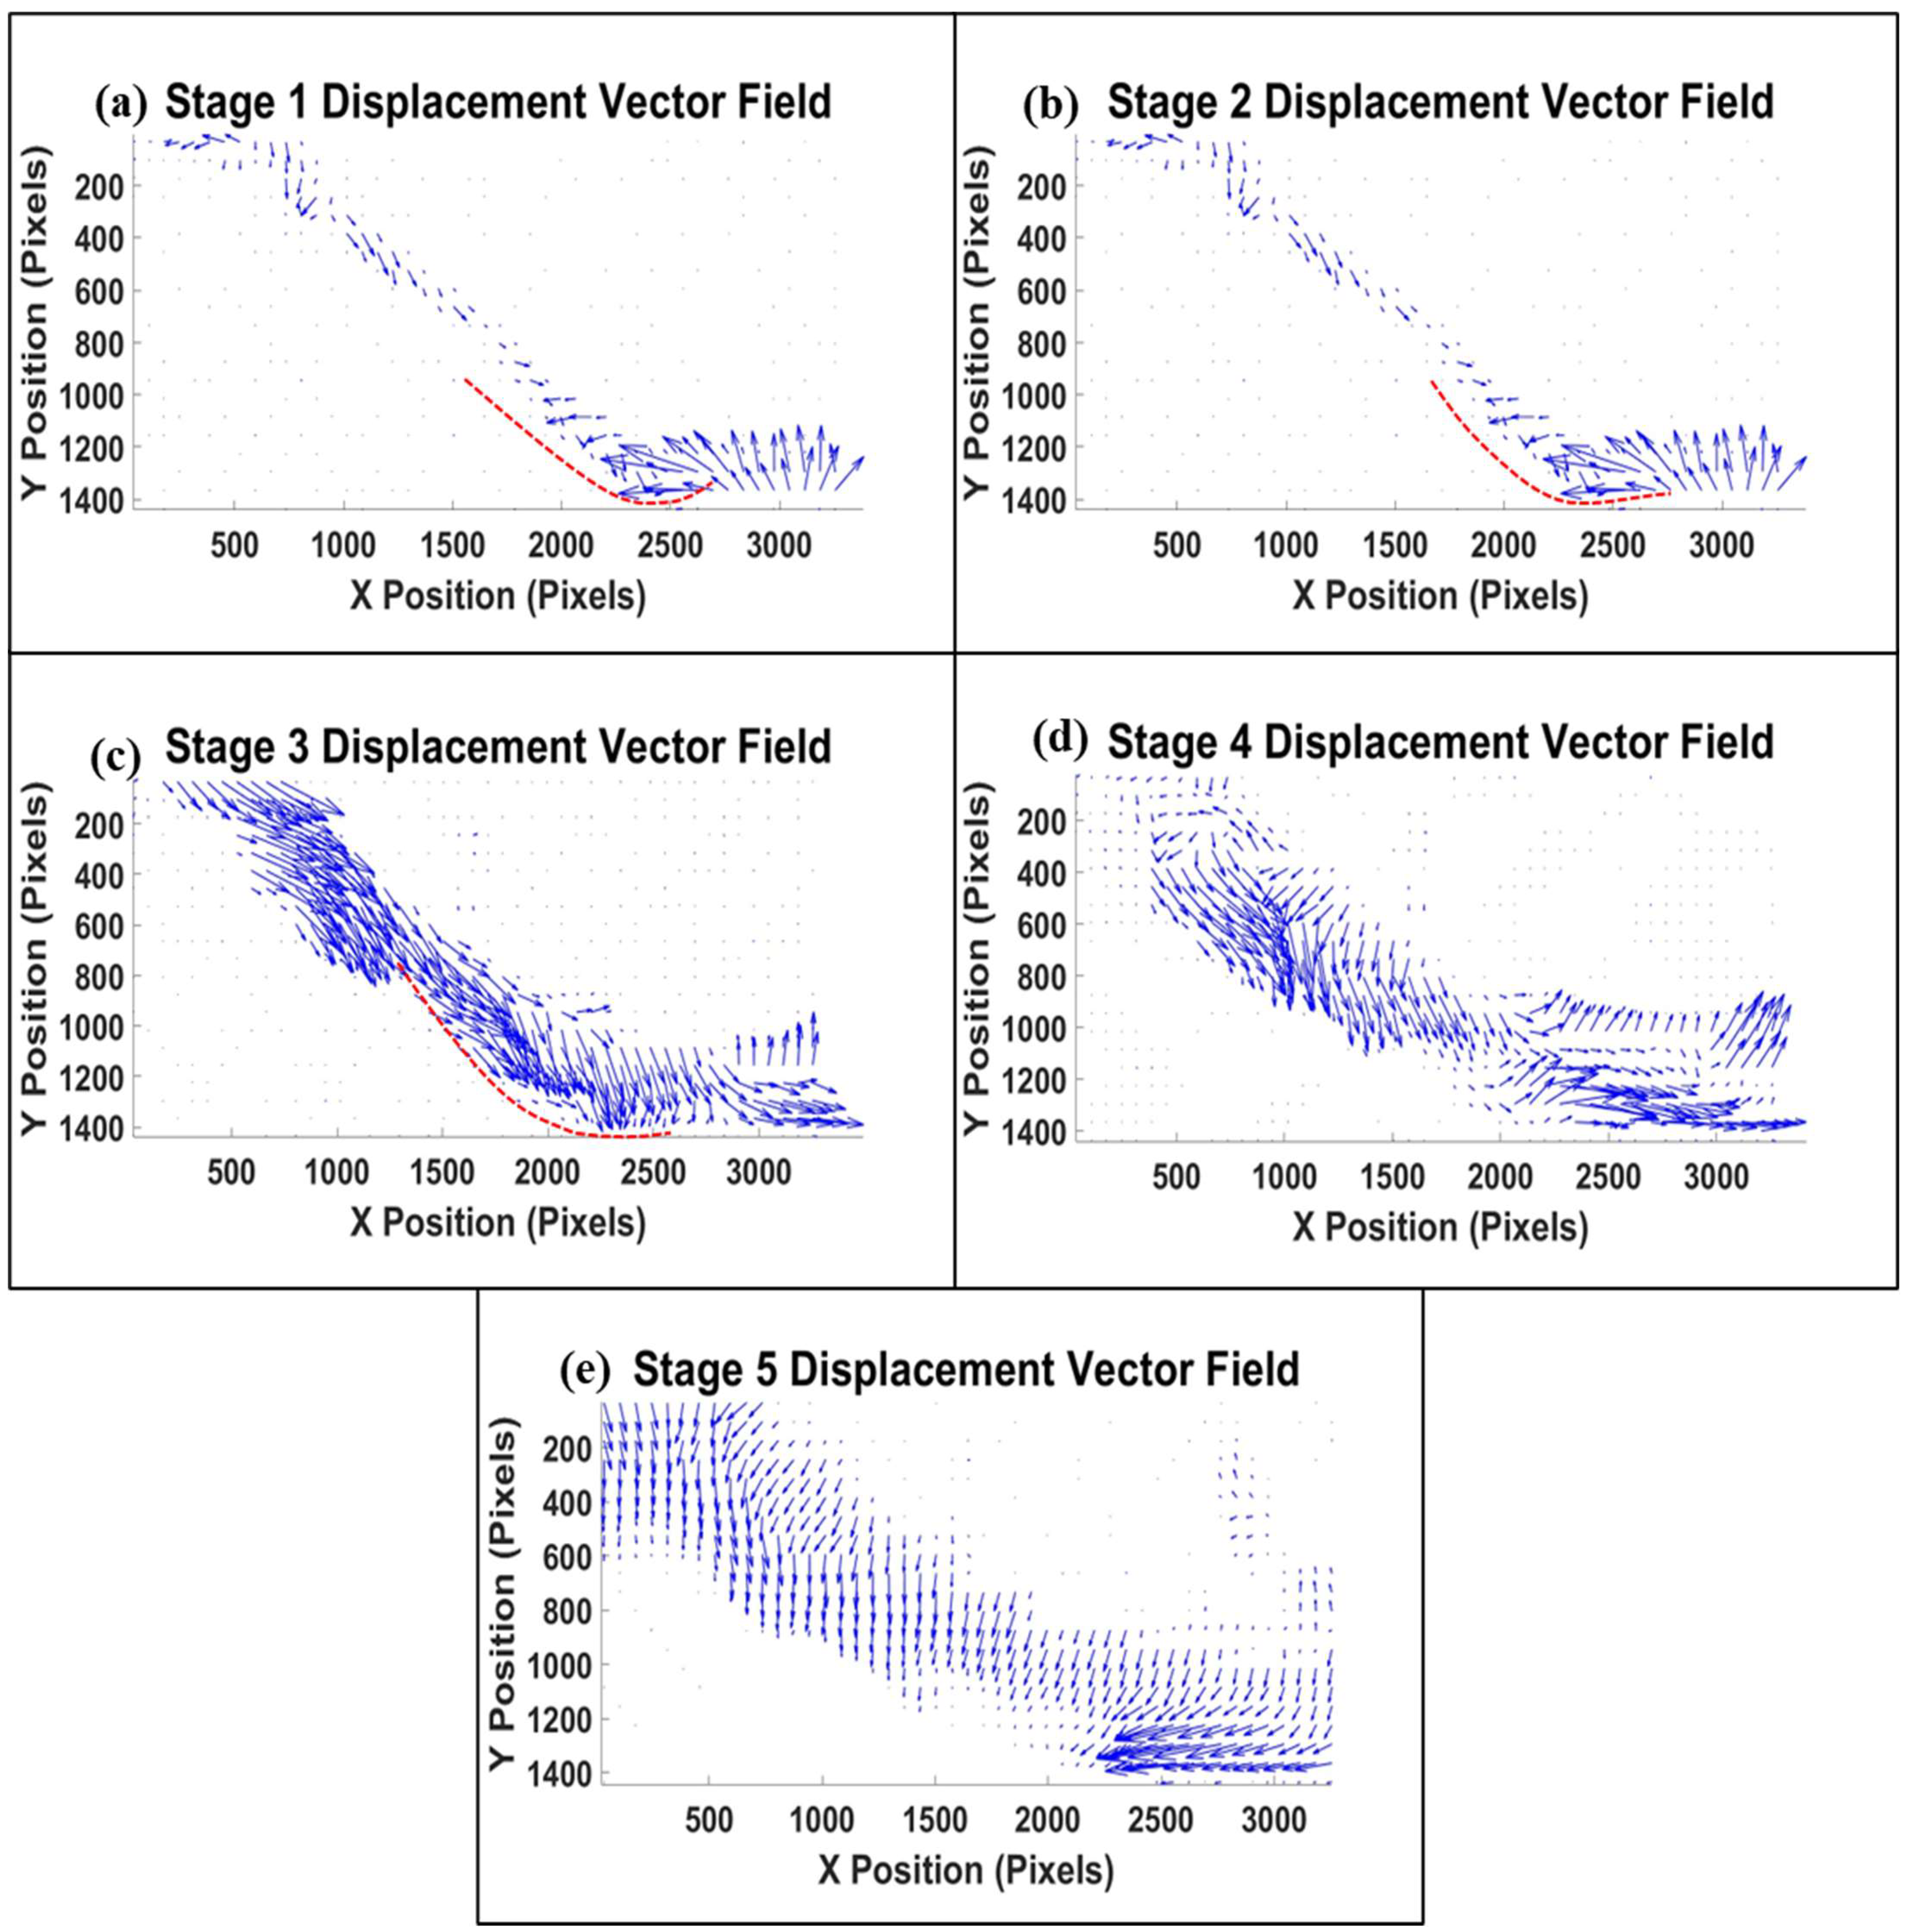
Figure 15a–d and Figure 16a–d show the displacement vector fields for coarse and fine tailings, respectively, showing the direction and progression of slope failure across each stage.
Figure 15.
Displacement vector plot of Test 1 (a–e). The red line represents the slip surface.
Figure 16.
Displacement vector plot of Test 2 (a–e). The red line represents the slip surface.
3.2. Discussion
3.2.1. Visualization of the Displacement Field Contours in X and Y Directions in Test 1 and Test 2
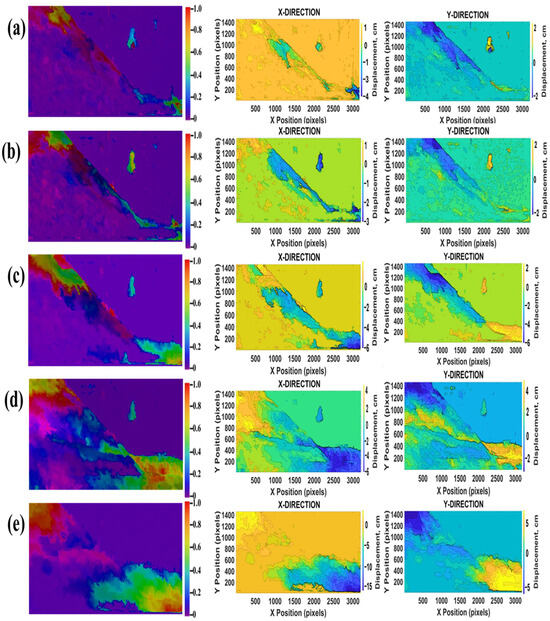
As pore water pressure continued to rise, displacement fields revealed progressive deformation [21]. The coarse tailings slope failed at 2.1 kN/m2 (Figure 10a). Displacements were first observed at the crest of the slope and later progressed downwards. In Stage 1 (Figure 11a), the X-direction (horizontal-direction) maximum displacement was approximately 4.51 cm, mainly limited to the base, and the Y-direction (vertical-direction) maximum displacement was 3.25 cm, limited to the crest. In Stage 2 (Figure 11b), displacements increased to 3.53 cm in both the X and Y directions, extending from the midsection toward the lower slope. Stage 3 (Figure 11c) showed more pronounced movement, with 6.24 cm in the X direction and 7.37 cm in the Y direction, indicating that the material was beginning to move downslope [2,26]. In Stage 4 (Figure 11d), maximum displacement was 6.33 cm in the X direction and 5.31cm in the Y direction. By Stage 5 (Figure 11e), the failure was fully developed, with displacements reaching 16.23 cm in the X direction and 8.41 cm in the Y direction, concentrated from the mid-slope down to the toe.
The image sequence illustrates the progressive displacement observed on the fine tailings slope, resulting from pore water pressure buildup. The fine tailings slope failed at 1.5 kN/m2 (Figure 13a). Initially, displacement was minimal, with measured horizontal and vertical displacements of approximately 2.2 cm and 2.1 cm, respectively. As pore water pressure rose, Stage 2 (Figure 14b) revealed more pronounced horizontal and vertical movements, measuring approximately 2.56 cm and 2.61 cm, respectively, highlighting the transition toward a defined circular or log-spiral failure surface [2,26]. By Stage 3 (Figure 14c), the total displacement further intensified to approximately 6.5 cm horizontally and 5.3 cm vertically, indicating a significant slope failure. In Stage 4 (Figure 14d), the circular surface was pronounced, with horizontal and vertical displacement values increasing to approximately 8.34 cm and 5.25 cm, respectively, clearly illustrating the slope’s failure. In Stage 5 (Figure 14e), the slope failed, with horizontal and vertical displacements peaking at approximately 20.13 cm and 7.22 cm, respectively, around the toe and crest. This severe deformation was primarily driven by elevated pore water pressures, which significantly reduced effective stress and shear strength in the fine tailings, resulting in pronounced circular or log-spiral failure surfaces and considerable downslope movement [19].
Coarse tailings, characterized by higher permeability (1.0 × 10⁻⁴ cm/s), allow excess pore water pressure to dissipate more rapidly during seepage. This slower reduction in effective stress delays material softening and favors translational sliding along a well-defined planar surface [26]. In contrast, fine tailings exhibit an order-of-magnitude lower permeability (1.0 × 10⁻⁵ cm/s), which restricts drainage and leads to rapid pore-pressure buildup [39,40]. As effective stress decreases more abruptly, shear strength is compromised over a broader zone, promoting the development of circular or log-spiral slip surfaces. These soil-mechanical controls align with the DIP-derived displacement fields, confirming that permeability-driven differences in hydraulic response fundamentally shape the observed deformation and failure patterns. Also, friction between the tailings dam test model wall and the tailings material may influence near-wall deformation behavior, potentially causing localized particle adherence and minor boundary effects [20].
The observed failure mechanisms and displacement patterns are consistent with previous experimental and numerical studies that report increased pore water pressure as a primary driver of effective stress reduction and slope instability in tailings dams [20,41]. Compared with remote-sensing approaches such as InSAR, which have been widely applied for detecting large-scale ground deformation in tailings facilities and natural slopes [11,19], the present laboratory-scale approach provides much higher spatial and temporal resolution under controlled hydraulic loading conditions. While InSAR is effective for long-term monitoring, it cannot resolve the detailed progression of displacement initiation and failure mechanisms at the scale investigated here [17,29].
3.2.2. Displacement Direction Vector Fields of Tests 1 and 2
In Stage 1 (Figure 15a), small downward vectors at the crest show initial settlement. These early arrows already align along a distinct planar direction, confirming the onset of a translational slip surface. In Stage 2 (Figure 15b), mid-slope arrows lengthen and continue to orient toward the toe along that same plane, marking the clear inception of planar slip. During Stage 3 (Figure 15c), vector magnitudes grow markedly and remain tightly aligned with the developing translational slip plane [2,25]. By Stage 4 (Figure 15d), arrows span much of the slope face, still following the same line of action, reflecting extensive mass movement along the translational surface. Finally, in the last stage, the slope collapses completely: long, near-horizontal vectors at the toe demonstrate that tailings material has moved from top to bottom, predominantly in the direction of downstream water flow [11].
In Stage 1 (Figure 16a), small vectors at the crest and along the slope face reveal the onset of settlement and downslope movement, with arrows uniformly directed toward the toe and slightly outlining the circular slip surface. By Stage 2 (Figure 16b), these vectors lengthen and become more pronounced, tracing a clear arc that confirms the developing log-spiral failure surface. In Stage 3 (Figure 16c), arrow magnitudes increase, and their paths closely follow the curvature of downward movement along the circular slip plane [2,25]. Stage 4 (Figure 16d) shows massive embankment failure with vector arrows that span much of the slope, while maintaining the spiral shape. Finally, in Stage 5, the slope collapses entirely.
3.3. Limitations
Although digital image processing (DIP) proved highly effective for capturing surface displacement in this controlled laboratory study, some limitations must be acknowledged for field deployment. The fixed lighting and camera used in the experiment minimized noise, whereas outdoor conditions may introduce challenges related to variable illumination, weather, and visual occlusion. Scale effects related to laboratory-to-field translation may also influence measurement sensitivity. The limited availability of tailings material also constrained the number of repeat tests, restricting broader statistical validation of the observed failure mechanisms. Despite these challenges, the present results confirm the strong potential of DIP as a reliable surface-deformation monitoring tool when appropriately adapted for field conditions. In operational tailings facilities, with real-time cameras and automated image analysis, this approach can enhance early-warning systems by detecting subtle displacement trends associated with rising pore water pressures before visible failure occurs [27].
4. Conclusions
By generating pixel-by-pixel displacement fields, DIP captured both the earliest signs of movement and the gradual evolution of failure, thereby validating its suitability for detailed stability assessments. Moreover, the generated pixel-by-pixel displacement vector plots effectively illustrated the direction of tailings-material movement during failure, enabling visual tracking of failure evolution and evaluation of deformation mechanisms as the slopes transitioned from initial settlement to complete failure. The findings confirmed that digital image processing is an effective and reliable technique for capturing displacement and failure evolution in tailings dam slope.
Coarse tailings, with their relatively higher permeability, dissipated excess pressure gradually but failed at a pore water pressure of approximately 2.1 kN/m2, as shown in Figure 11a. In contrast, fine tailings, with low permeability, failed at a pore water pressure of around 1.5 kN/m2, as demonstrated in Figure 14a. The fine tailings experienced rapid pressure buildup, a reduction in effective stress, and an earlier onset of a circular (log-spiral) failure mode.
While the DIP-based approach demonstrated high accuracy under controlled laboratory conditions, its application to full-scale tailings dams may be affected by variable lighting, weather conditions, camera vibration, and surface occlusion. These environmental factors can affect image consistency and displacement detection and therefore require appropriate mitigation strategies, such as stabilized camera mounts and filtered lighting, to ensure reliable field deployment.
Author Contributions
Conceptualization, M.R. and A.A.; methodology, M.R. and A.A.; software, A.A.; validation, M.R.; formal analysis, A.A. and R.O.; investigation, A.A. and B.A.; resources, M.R.; data curation, A.A.; writing—original draft preparation, A.A.; writing—review and editing, M.R., R.O., B.A. and S.D.; visualization, R.O.; supervision, M.R.; project administration, B.A. and S.D. All authors have read and agreed to the published version of the manuscript.
Funding
This research was funded by the Mineral Engineering Department of the New Mexico Institute of Mining and Technology, and the authors acknowledge the support provided by the Department of Mineral Engineering.
Data Availability Statement
All data supporting the conclusions of this study are included within the paper, with additional datasets available upon reasonable request.
Conflicts of Interest
The authors declare no conflicts of interest.
References
- Edraki, M.; Baumgartl, T.; Manlapig, E.; Bradshaw, D.; Franks, D.M.; Moran, C.J. Designing mine tailings for better environmental, social, and economic outcomes: A review of alternative approaches. J. Clean. Prod. 2014, 84, 411–420. [Google Scholar] [CrossRef] [Scilit]
- Kossoff, D.; Dubbin, W.E.; Alfredsson, M.; Edwards, S.J.; Macklin, M.G.; Hudson-Edwards, K.A. Mine tailings dams: Characteristics, failure, environmental impacts, and remediation. Appl. Geochem. 2014, 51, 229–245. [Google Scholar] [CrossRef] [Scilit]
- Vick, S.G. Planning, Design, and Analysis of Tailings Dams; BiTech Publishers Ltd.: Richmond, BC, Canada, 1990. [Google Scholar] [CrossRef]
- Otoo, R.; Razavi, M.; Abankwa, B.; Armah, A.; Donkor, S.; Brakohiapa, E. Review of the Combined Effects of Mineralogy and Particle Size on Tailings Dewatering Mechanism. Am. J. Min. Metall. 2025, 8, 13–19. [Google Scholar] [CrossRef] [Scilit]
- Rubey, W.W.; King Hubbert, M. Role of fluid pressure in mechanics of overthrust faulting: II. Overthrust belt in the geosynclinal area of western Wyoming in light of the fluid-pressure hypothesis. Geol. Soc. Am. Bull. 1959, 70, 167–206. [Google Scholar] [CrossRef] [Scilit]
- Bogaard, T.A.; Greco, R. Landslide hydrology: From hydrology to pore pressure. Wiley Interdiscip. Rev. Water 2016, 3, 439–459. [Google Scholar] [CrossRef] [Scilit]
- Martin, T.E. Characterization of pore pressure conditions in upstream tailings dams. Geotech News 2002, 20, 31–36. Available online: https://citeseerx.ist.psu.edu/document?repid=rep1&type=pdf&doi=5f52b1833aa6537c8f66f9301fe91d0c0bc16491 (accessed on 30 October 2025).
- Sridharan, A.; Prakash, K. Permeability of two-layer soils. Geotech. Test. J. 2002, 25, 443–448. [Google Scholar] [CrossRef] [Scilit]
- Armah, A.; Whajah, J.; Annankra, J.A. The Geomechanical Behavior of Mine Waste Rock Slopes under Climate-Induced Stressors: A Global Perspective. J. Eng. Comput. Sci. 2025, 4, 454–466. [Google Scholar] [CrossRef]
- Lin, S.-Q.; Wang, G.-J.; Liu, W.-L.; Zhao, B.; Shen, Y.-M.; Wang, M.-L.; Li, X.-S. Regional Distribution and Causes of Global Mine Tailings Dam Failures. Metals 2022, 12, 905. [Google Scholar] [CrossRef] [Scilit]
- Carlà, T.; Intrieri, E.; Raspini, F.; Bardi, F.; Farina, P.; Ferretti, A.; Colombo, D.; Novali, F.; Casagli, N. Perspectives on the prediction of catastrophic slope failures from satellite InSAR. Sci. Rep. 2019, 9, 14137. [Google Scholar] [CrossRef] [Scilit]
- Yeboah, N.N.; Ampomah, W.; Bratton, T.; Bui, D.; Amosu, A. Evaluating the impact of stress-induced changes on caprock integrity in the San Juan Basin. In SPE/AAPG/SEG Carbon, Capture, Utilization, and Storage Conference and Exhibition; SPE: Richardson, TX, USA, 2025; p. D011S007R001. [Google Scholar] [CrossRef] [Scilit]
- Carlà, T.; Intrieri, E.; Di Traglia, F.; Nolesini, T.; Gigli, G.; Casagli, N. Guidelines on the use of the inverse velocity method as a tool for setting alarm thresholds and forecasting landslides and structure collapses. Landslides 2017, 14, 517–534. [Google Scholar] [CrossRef] [Scilit]
- Bowker, L.N.; Chambers, D.M. The risk, public liability, and economics of tailings storage facility failures. Earthwork Act 2015, 24, 1–56. Available online: https://files.dnr.state.mn.us/input/environmentalreview/polymet/request/exhibit3.pdf (accessed on 7 November 2024).
- Rose, N.D.; Hungr, O. Forecasting potential rock slope failure in open pit mines using the inverse-velocity method. Int. J. Rock Mech. Min. Sci. 2007, 44, 308–320. [Google Scholar] [CrossRef] [Scilit]
- Xu, J.; Zhang, Y. AI-powered digital twin technology for highway system slope stability risk monitoring. Geotechnics 2025, 5, 19. [Google Scholar] [CrossRef] [Scilit]
- Tsachouridis, S.; Pavloudakis, F.; Sachpazis, C.; Tsioukas, V. Monitoring slope stability: A comprehensive review of UAV applications in open-pit mining. Land 2025, 14, 1193. [Google Scholar] [CrossRef] [Scilit]
- Samanta, G.; Sahu, P.; Behera, D.; Maniteja, M.; Jena, T.K. Optical fiber technology for monitoring of slope movement in open cast mine: Field application. J. Inst. Eng. (India) Ser. D 2025, 106, 1325–1330. [Google Scholar] [CrossRef] [Scilit]
- Wu, W.; Song, Z.; You, Y.; Peng, R.; Gan, Y.; Zhang, B. Pore water pressure and consolidation of tailing dams based on numerical simulation and a similar modeling, temporal and spatial distribution study. Sci. Rep. 2025, 15, 26122. [Google Scholar] [CrossRef] [Scilit]
- Sassa, K.; Fukuoka, H.; Wang, G.; Ishikawa, N. Undrained dynamic-loading ring-shear apparatus and its application to landslide dynamics. Landslides 2004, 1, 7–19. [Google Scholar] [CrossRef] [Scilit]
- Aghazamani, N.; Scalia, J., IV; Bareither, C.A. Assessing Induced Pore Pressure and Suction Stress under Undrained Compression of Filtered Tailings. J. Geotech. Geoenvironmental Eng. 2026, 152, 04025185. [Google Scholar] [CrossRef] [Scilit]
- Morton, K.L. The use of accurate pore pressure monitoring for risk reduction in tailings dams. Mine Water Environ. 2021, 40, 42–49. [Google Scholar] [CrossRef] [Scilit]
- Liu, Y.F.; Zhang, C. Physical simulation and impact analysis of large-scale tailings dam reach based on multi-source densing monitoring. J. Henan Polytech. Univ. (Nat. Sci.) 2025, 44, 64–74. [Google Scholar]
- Smith, M.W.; Carrivick, J.L.; Quincey, D.J. Structure from motion photogrammetry in physical geography. Prog. Phys. Geogr. 2016, 40, 247–275. [Google Scholar] [CrossRef] [Scilit]
- Alam, M.J.B.; Manzano, L.S.; Debnath, R.; Ahmed, A.A. Monitoring slope movement and soil hydrologic behavior using IoT and AI technologies: A systematic review. Hydrology 2024, 11, 111. [Google Scholar] [CrossRef] [Scilit]
- Chen, J.; Zhang, X.; Wang, Q. Detection of tailings dams using high-resolution satellite imagery and deep learning techniques. Remote Sens. 2020, 12, 2626. [Google Scholar] [CrossRef] [Scilit]
- Wang, K.; Yang, P.; Yu, G. 3D Numerical Modelling of Tailings Dam Breach Run Out Flow over Complex Terrain: A Multidisciplinary Procedure. Water 2020, 12, 2538. [Google Scholar] [CrossRef] [Scilit]
- Armah, A.; Abankwa, B.; Minnoh, P.K. Ethical and Sustainable Deployment of AI for Critical Mineral Extraction in the U.S.: A Multi-Objective Optimization Framework for Advancing Energy Transition and Environmental Stewardship. World J. Adv. Res. Rev. 2025, 28, 1780–1792. [Google Scholar] [CrossRef] [Scilit]
- Zhuang, Y.; Chen, W.; Jin, T.; Chen, B.; Zhang, H.; Zhang, W. A review of computer vision-based structural deformation monitoring in field environments. Sensors 2022, 22, 3789. [Google Scholar] [CrossRef] [Scilit]
- Bickel, V. Analysis of slope and surface displacements on Mars using high-resolution satellite imagery. Master’s thesis, ETH Zurich, Zürich, Switzerland, 2017. [Google Scholar] [CrossRef]
- Abankwa, B.; Islam, M.M.; Shakil, M.A.; Al-Khateeb, H.A.A.A.; Otoo, R.; Islam, M.A. Advancing Tailings Dam Safety: Integrating Risk Management, Technological Innovations, and Regulatory Reforms. Am. J. Min. Metall. 2025, 8, 1–12. [Google Scholar] [CrossRef] [Scilit]
- Qiu, D.; Xu, J.; Lin, H. Numerical analysis of the overtopping failure of the tailings dam model based on inception similarity optimization. Appl. Sci. 2024, 14, 990. [Google Scholar] [CrossRef] [Scilit]
- ASTM International. ASTM D5084-24; Standard Test Methods for Measurement of Hydraulic Conductivity of Saturated Porous Materials Using a Flexible Wall Permeameter. ASTM International: West Conshohocken, PA, USA, 2023.
- ASTM International. ASTM D854-23; Standard Test Methods for Specific Gravity of Soil Solids by Water Pycnometer. ASTM International: West Conshohocken, PA, USA, 2023.
- ASTM International. ASTM D3080-23; Standard Test Method for Direct Shear Test of Soils Under Consolidated Drained Conditions. ASTM International: West Conshohocken, PA, USA, 2023.
- ASTM International. ASTM D4318-17e1; Standard Test Methods for Liquid Limit, Plastic Limit, and Plasticity Index of Soils. ASTM International: West Conshohocken, PA, USA, 2018.
- Wolfram Research. ImageDisplacements—Wolfram Language Documentation; Wolfram Research: Champaign, IL, USA, 2023; Available online: https://reference.wolfram.com/language/ref/ImageDisplacements.html.en (accessed on 23 March 2025).
- The MathWorks Inc. MATLAB Documentation (R2023b); The MathWorks, Inc.: Natick, MA, USA, 2023; Available online: https://www.mathworks.com/help/matlab/ (accessed on 25 March 2025).
- Donkor, S.A.; Razavi, M.; Wilson, C.M.D.; Abankwa, B.; Otoo, R.; Armah, A. Long-Term Effects of Cement Kiln Dust (CKD) on the Permeability of a Treated Soil Slope. Geotechnics 2025, 5, 87. [Google Scholar] [CrossRef] [Scilit]
- Ma, C.; Li, R.; Zhang, C.; Guo, X.; Li, X. A study on compressibility and permeability of tailings with different particle sizes under high pressure. Bull. Eng. Geol. Environ. 2023, 82, 106. [Google Scholar] [CrossRef] [Scilit]
- Wu, L.Z.; Zhou, Y.; Sun, P.; Shi, J.S.; Liu, G.G.; Bai, L.Y. Laboratory characterization of rainfall-induced loess slope failure. Catena 2017, 150, 1–8. [Google Scholar] [CrossRef] [Scilit]

Disclaimer/Publisher’s Note: The statements, opinions and data contained in all publications are solely those of the individual author(s) and contributor(s) and not of MDPI and/or the editor(s). MDPI and/or the editor(s) disclaim responsibility for any injury to people or property resulting from any ideas, methods, instructions or products referred to in the content. |
© 2026 by the authors. Licensee MDPI, Basel, Switzerland. This article is an open access article distributed under the terms and conditions of the Creative Commons Attribution (CC BY) license.