


Abstract
Context: The increasing adoption of Internet of Things (IoT) technologies has transformed digital marketing into a software-intensive, data-driven ecosystem requiring continuous optimization under uncertainty. Existing decision-support approaches primarily optimize engagement or cost independently and rarely integrate behavioral dynamics, sustainability constraints, and managerial preferences within a unified information systems framework. Objectives: This study develops and evaluates a fuzzy multi-objective optimization framework that supports intelligent software-based marketing decision making by simultaneously maximizing customer engagement, minimizing digital resource consumption, and reducing behavioral saturation in IoT-enabled environments. Methods: A multi-objective mathematical model was developed in which customer responsiveness is represented through probabilistic engagement parameters, while fuzzy membership functions and a Max–Min satisfaction criterion represent imprecise managerial aspiration levels across the conflicting objectives. The small-scale experiment was solved exactly in GAMS to obtain reference Pareto-optimal solutions, whereas the large-scale experiment was conducted as a simulation study using NSGA-II and MOPSO to evaluate scalability and algorithmic performance. Both experimental settings relied exclusively on synthetically generated datasets; no real-world enterprise, customer-level, or campaign-level marketing data were used. Performance was assessed through Pareto-front analysis, key performance indicators, sensitivity analysis, and scenario-based managerial evaluation. Results: The proposed framework successfully generated high-quality Pareto-optimal solutions across multiple optimization objectives. NSGA-II consistently achieved superior customer engagement, personalization efficiency, and behavioral balance, whereas MOPSO demonstrated faster execution and lower sustainability costs. Sensitivity analysis confirmed the robustness of the framework under varying behavioral parameters, while scenario analysis showed that different optimization strategies can be selected according to organizational priorities. The principal limitation is that the framework has been evaluated only in controlled synthetic environments, which limits direct empirical generalization to operational enterprise marketing settings. Future research should validate the framework using longitudinal enterprise marketing data, real-time IoT interaction streams, and field-based deployment studies. Conclusions: The proposed framework contributes to information systems research by integrating fuzzy decision support, multi-objective optimization, and behavioral modeling into a scalable software architecture for IoT-enabled marketing. The approach enables adaptive, explainable, and sustainable decision making, providing organizations with a practical decision-support system capable of balancing customer experience, operational efficiency, and digital sustainability in intelligent marketing ecosystems.
1. Introduction
In the evolving landscape of the digital economy, the nature of interaction between firms and customers is undergoing a radical shift. The convergence of technologies such as the Internet of Things (IoT), big data analytics, and artificial intelligence (AI) is reshaping traditional marketing logic—moving decision-making from intuition-based heuristics to real-time, algorithmically driven insights [1,2]. Yet, while data accessibility has increased dramatically, the ability to extract actionable, high-frequency insights from dynamic and uncertain customer behavior remains a critical organizational capability [3]. This transformation has given rise to IoT-enabled engagement ecosystems, where users interact with brands across a variety of connected touchpoints including wearables, mobile applications, smart panels, and contextual notifications [4]. These channels open up unprecedented opportunities for personalization and precision-targeted campaigns. However, they also create new managerial tensions around communication overload, resource consumption, and diminishing engagement returns [5]. Consequently, a key strategic question emerges: How can organizations design marketing interventions that are not only personalized and effective, but also sustainable and behaviorally calibrated in IoT environments?
To operationalize this overarching question, the study addresses three specific research questions:
RQ1: How can IoT-enabled marketing decisions be formulated as a fuzzy multi-objective optimization problem that simultaneously balances expected customer engagement, digital-resource consumption, and behavioral saturation under probabilistic customer responsiveness and managerial aspiration levels?
RQ2: How do exact small-scale optimization and large-scale metaheuristic simulation differ in their ability to identify and approximate Pareto-optimal trade-offs, and how do NSGA-II and MOPSO compare in terms of solution quality, computational efficiency, marketing-oriented KPIs, and behavioral robustness?
RQ3: How can the technological, behavioral, and adaptive decision components of the proposed optimization framework be interpreted through established information-systems and dynamic-capability perspectives, and what theoretically informed propositions can be derived from the resulting model structure and scenario-based outcomes?
While recent studies have begun to explore this question [6,7,8], comprehensive, actionable frameworks remain limited—particularly those that integrate personalization, sustainability, and behavioral sensitivity into a unified decision model.
Recent contributions to digital marketing optimization have tackled parts of this problem, but typically with constrained scope. Many existing models adopt single-objective perspectives or assume static behavioral responses, limiting their applicability in real-time, multichannel ecosystems [9]. Traditional decision models often lack the scalability and adaptability required for high-frequency, context-aware engagement [10], while black-box machine learning solutions—despite their predictive accuracy—often fall short in interpretability, undermining managerial trust and strategic alignment [11]. To address these gaps, this study proposes a fuzzy multi-objective optimization framework that integrates behavioral dynamics, sustainability constraints, and decision-maker preferences within an IoT-based marketing architecture. The model simultaneously optimizes for three interdependent goals: (1) maximizing effective customer engagement, (2) minimizing digital sustainability costs (e.g., energy, bandwidth), and (3) mitigating behavioral saturation. Customer responsiveness is represented through probabilistic engagement parameters, whereas fuzzy membership functions are used to express managerial satisfaction with the achievement of the competing objectives. The multi-objective optimization process generates Pareto-optimal alternatives, while the fuzzy satisfaction structure provides an interpretable basis for evaluating trade-offs and identifying balanced compromise decisions [12].
From a theoretical standpoint, the study draws on Affordance Theory [13], the DeLone and McLean IS Success Model [14], and the Dynamic Capabilities framework [15] as complementary interpretive lenses for the design and interpretation of the proposed optimization framework. Rather than empirically testing or formally extending these theories, the study uses selected theoretical constructs to clarify the managerial meaning of the model components and optimization outcomes. IoT channel availability and action utility represent technology-enabled action possibilities consistent with Affordance Theory; engagement and fatigue-related exposure provide decision-level proxies for benefit and user-experience considerations discussed in the IS Success literature; and the reconfiguration of objective priorities illustrates an adaptive decision-support mechanism consistent with the logic of dynamic capabilities. The theoretical contribution therefore lies in translating selected theoretical constructs into an operational decision-modeling context rather than claiming direct empirical validation of the theories themselves. These theoretical contributions address significant gaps in the extant literature, which has either remained generic in its treatment of digital transformation [16] or narrowly focused on sustainability without integrating behavioral personalization [6,17]. Methodologically, the study leverages and compares two leading metaheuristic algorithms—NSGA-II and MOPSO—to solve the model at scale [18]. The comparative algorithmic evaluation allows for context-sensitive trade-offs between solution diversity, convergence quality, and computational efficiency. For model validation, the framework is also implemented in GAMS on small-scale scenarios, enabling the precise extraction of Pareto fronts and benchmarking of algorithmic approximations [19].
Importantly, this research also integrates sensitivity analysis, managerial preference simulation, and KPI-oriented evaluation into its methodology—bridging algorithmic outputs with executive decision contexts [20]. The model uniquely incorporates digital resource consumption into the marketing decision calculus, aligning strategic outcomes with Sustainable Development Goals [21] and advancing the agenda of responsible, intelligent marketing design. In sum, this research is situated at the nexus of digital marketing, fuzzy multi-objective decision modeling, and IoT system design. It offers both a rigorous optimization tool and a theoretically grounded decision-support framework for firms navigating the complexities of sustainable, personalized, and real-time customer engagement.
2. Theoretical Background
2.1. IoT Marketing and Behavioral Saturation
The integration of Internet of Things (IoT) technologies into marketing processes has fundamentally altered how firms engage with customers across digital ecosystems. Unlike traditional, linear communication strategies, IoT-based marketing facilitates continuous, context-aware, and real-time interactions across a growing set of smart touchpoints, including mobile apps, wearable devices, in-app messaging systems, and connected sensors [22]. This evolution supports the development of intelligent and responsive marketing systems that are capable of adapting content delivery based on behavioral signals and situational context.
In such environments, the volume, frequency, and contextual relevance of communications are increasingly shaped by continuous digital interaction and IoT-generated data streams [23]. Three related but conceptually distinct phenomena are particularly relevant. Digital fatigue refers to a broader state of cognitive or psychological exhaustion arising from sustained exposure to digitally mediated information, communication demands, and system interactions. It is therefore not limited to marketing communication and may emerge from the overall burden of persistent digital connectivity. Marketing-stimulus desensitization, closely related to advertising wearout, refers more specifically to the declining attentional, evaluative, or persuasive response that can occur when consumers are repeatedly exposed to the same or similar marketing stimuli. Repetition may initially improve familiarity and recall, but excessive exposure can reduce advertising effectiveness and generate negative reactions.
In this study, behavioral saturation is defined as the decision-level accumulation of marketing-exposure burden that increases the risk of fatigue, desensitization, and declining responsiveness as customer contacts become excessive. Behavioral saturation is therefore not treated as synonymous with either digital fatigue or advertising wearout. Instead, it represents an operational construct that incorporates their shared implication for marketing decision making: additional exposures should carry progressively greater concern when a customer is more susceptible to repeated contact. This distinction allows the optimization model to explicitly balance the potential engagement value of an additional marketing action against the behavioral burden associated with exposing a particular customer through a particular channel and time period [24,25].
Despite these concerns, existing research has largely focused on campaign-level effectiveness metrics (e.g., click-through rates, conversion probabilities) without sufficiently modeling the cumulative behavioral impact of repeated digital stimuli [26]. Moreover, few frameworks explicitly consider the interdependence between channel selection, message timing, and saturation dynamics, particularly in IoT-enabled contexts. This highlights the need for decision-support models that go beyond simple engagement maximization to account for long-term behavioral sustainability and the cognitive limits of digital consumers.
2.2. Multi-Objective Optimization in Marketing
Marketing decision-making in contemporary digital environments is inherently multi-faceted, involving trade-offs between objectives such as customer engagement, operational efficiency, communication cost, and sustainability performance. Traditional optimization models in marketing often assume a single objective function—commonly focused on maximizing campaign ROI or minimizing cost-per-click—which can oversimplify the complexity of real-world decisions [27]. However, in practice, marketing managers routinely navigate competing goals, where improving one outcome (e.g., engagement) may negatively impact others (e.g., user fatigue or infrastructure cost).
To address this complexity, multi-objective optimization (MOO) approaches have gained increasing attention in marketing research and practice. MOO models allow for the simultaneous consideration of several conflicting objectives and yield a Pareto front—a set of optimal solutions where no single objective can be improved without compromising another. This structure is particularly useful in dynamic environments, such as IoT-enabled marketing ecosystems, where contextual constraints and behavioral feedback must be accounted for in real time [28]. Despite their theoretical advantages, most existing applications of MOO in marketing remain limited in scope, focusing on narrowly defined problems such as budget allocation or campaign scheduling in static or low-dimensional contexts [24]. Furthermore, many studies assume deterministic environments and perfect information, thereby ignoring the inherent uncertainty and fuzziness of consumer behavior, engagement thresholds, and campaign response dynamics. Our model aligns with the growing body of research employing multi-objective optimization for sustainability-oriented decisions under uncertainty, as seen in the green supplier evaluation framework of Goodarzi et al. [29]. While their focus is on supplier networks, our model extends this logic to the consumer-facing side of IoT marketing ecosystems.
Another limitation lies in the disconnect between MOO models and marketing theory. While the mathematical elegance of Pareto optimization is well established, fewer studies have attempted to align optimization outputs with constructs such as customer experience, satisfaction, or perceived value. As such, there is a growing call to embed MOO techniques within richer behavioral and managerial frameworks—so that solutions reflect not only technical efficiency but also strategic alignment with consumer-centric values and market conditions.
This study builds on that direction by proposing a fuzzy multi-objective model tailored to the behaviorally sensitive and sustainability-aware nature of modern IoT-based marketing. The integration of multiple decision criteria—customer engagement, resource usage, and behavioral saturation—reflects a realistic depiction of the tensions marketers face, and sets the stage for further discussion of fuzzy modeling and algorithmic solution strategies in the following sections.
2.3. Fuzzy Logic and Uncertainty in Decision Support
Modern marketing environments—particularly those driven by IoT technologies—are characterized by uncertainty, imprecision, and subjective decision factors. Customer preferences fluctuate in real time, behavioral responses are often probabilistic rather than deterministic, and managerial decisions must frequently incorporate qualitative judgments. Traditional optimization models, which rely on crisp parameters and binary logic, are often ill-equipped to capture these nuances. To address these challenges, fuzzy logic has emerged as a powerful tool in decision support systems. Introduced by Zadeh [30], fuzzy logic allows for the modeling of vagueness and ambiguity through linguistic variables, soft constraints, and flexible preference structures. In marketing contexts, this enables the incorporation of real-world ambiguity—such as how customers might feel overwhelmed, or how much message frequency is too much—into mathematically tractable optimization models [31].
Fuzzy multi-objective decision-making (FMODM) has been successfully applied in fields such as supply chain management, environmental planning, and healthcare, where trade-offs must be balanced under uncertainty. However, its application in marketing remains relatively underdeveloped, particularly in IoT-enabled digital ecosystems. Most marketing-focused fuzzy models to date have addressed limited decision scopes (e.g., supplier selection or service personalization) and have not been integrated into large-scale campaign optimization frameworks [32]. Moreover, fuzzy logic enables managerial preference modeling—a critical but often overlooked aspect in algorithmic marketing. Unlike rigid weight-based methods, fuzzy preference functions can express nonlinear sensitivity, conditional priorities, and threshold tolerances, offering more nuanced and human-centered guidance in optimization scenarios [33]. For example, a manager may tolerate a slight increase in sustainability cost if engagement gains exceed a certain subjective threshold—a logic that fuzzy systems are uniquely equipped to represent. In the present framework, it is important to distinguish probabilistic behavioral representation from fuzzy managerial preference modeling. Customer response uncertainty is represented through the estimated response probability , while fatigue sensitivity is represented through δckt and the associated exposure-control structure. The fuzzy component serves a different purpose: the membership functions translate the achieved values of , and into satisfaction degrees between zero and one according to managerial aspiration levels. The Max–Min criterion can then be used to assess the most balanced level of satisfaction across the conflicting objectives. Thus, fuzzy logic in this study primarily supports preference interpretation and compromise evaluation rather than generating the Pareto frontier itself [34].
The Max–Min aggregation criterion was selected because the decision problem requires a balanced compromise among three conflicting objectives rather than allowing strong performance in one objective to fully compensate for poor performance in another. A fuzzy weighted-sum approach requires the decision-maker to specify explicit relative weights in advance and permits compensatory trade-offs, which may obscure an unacceptably low satisfaction level for engagement, sustainability, or behavioral saturation. Fuzzy TOPSIS, by contrast, is primarily suitable for ranking a predefined set of alternatives according to their distances from fuzzy positive- and negative-ideal solutions. In the present framework, the primary requirement is not post-hoc ranking but the direct identification of a compromise solution whose least-satisfied objective is improved as much as possible. The Max–Min criterion therefore fits the aspiration-level structure of the membership functions by maximizing the minimum satisfaction degree across and . This provides a transparent and relatively non-compensatory mechanism for preventing any single strategic objective from being severely underachieved.
2.4. Algorithm Selection and Managerial Sensitivity
The effectiveness of any multi-objective optimization framework—particularly one embedded with fuzzy logic—depends not only on its conceptual structure but also on the choice of algorithmic solver. Given the complexity and scale of real-world marketing problems in IoT environments, exact optimization methods are often computationally infeasible. As a result, metaheuristic algorithms have become the preferred tools for navigating large, nonlinear, and uncertain decision spaces [35]. Consistent with recent developments in scalable multi-objective optimization, such as Razdar et al. [36], our study benchmarks NSGA-II and MOPSO to address the complexity of high-dimensional, real-time decision spaces in IoT marketing. Among these, Non-dominated Sorting Genetic Algorithm II (NSGA-II) and Multi-Objective Particle Swarm Optimization (MOPSO) have emerged as leading methods for generating high-quality Pareto fronts across diverse application domains. NSGA-II is widely regarded for its strong convergence properties and its ability to maintain solution diversity, making it suitable for exploring complex trade-off surfaces in multi-objective spaces. In contrast, MOPSO is often favored for its computational efficiency and speed, particularly in data-intensive environments, due to its simpler structure and fewer tuning parameters [33].
Prior applications of metaheuristic optimization in marketing have generally focused on relatively narrow decision problems such as media allocation, pricing, campaign scheduling, or isolated customer-engagement tasks [35,36,37]. These applications typically do not combine high-dimensional customer–channel–action assignments with behavioral-saturation penalties, digital-resource constraints, channel-capacity restrictions, accessibility conditions, and repeated-exposure controls within the same multi-objective formulation. In addition, comparative studies that evaluate competing Pareto-based algorithms under an identical behavioral and sustainability-oriented marketing model remain limited [37]. This restricts the ability of prior work to determine how different search mechanisms perform when marketing decisions simultaneously involve engagement quality, resource efficiency, and behavioral exposure. NSGA-II and MOPSO are suitable for the present problem because the large-scale formulation is combinatorial, constrained, multi-objective, and NP-hard, making exhaustive exact optimization computationally impractical as the numbers of customers, channels, actions, and time periods increase. Both methods are population-based and can approximate multiple non-dominated solutions within a single optimization process without requiring gradient information or convexity assumptions. NSGA-II is particularly appropriate for preserving diversity across conflicting engagement, sustainability, and saturation objectives through non-dominated sorting and crowding-distance mechanisms, whereas MOPSO provides a complementary search strategy with relatively simple update rules and efficient exploration through particle learning and archive-based guidance. Their different search dynamics make them suitable for comparative benchmarking in this study, while their compatibility with binary encoding, feasibility repair, and constraint-handling procedures allows them to represent the discrete customer–channel–action decisions and operational restrictions of the proposed IoT-marketing model.
In addition to computational considerations, managerial sensitivity is an under-explored dimension in algorithm selection. Different decision-makers may prioritize different aspects of algorithmic behavior—such as robustness to parameter changes, ease of interpretation, or adaptability to managerial preferences. For instance, NSGA-II may offer richer trade-off insights suitable for strategic planning, while MOPSO may be preferred in operational settings where quick responses are critical.
This study addresses these gaps by implementing both NSGA-II and MOPSO within the same fuzzy optimization framework, allowing for a systematic comparison of their performance under varying customer behavior and system constraints. It also incorporates sensitivity analysis and preference-based evaluation mechanisms to assess how algorithm outputs align with managerial expectations and strategic priorities. Ultimately, the inclusion of algorithmic evaluation and managerial feedback loops strengthens the model’s practical applicability and ensures that optimization outcomes are not only mathematically sound but also actionable and interpretable in real-world marketing contexts.
2.5. Gaps and Future Research Directions
The literature reveals several specific methodological gaps in current IoT-enabled marketing and multi-objective decision-support research. First, prior IoT-marketing studies have mainly addressed customer analytics, segmentation, engagement mechanisms, and critical success factors [1,8,35]. Although these studies provide useful insights into customer behavior and IoT-enabled interaction, they do not formulate campaign-level multi-objective optimization models that simultaneously maximize expected customer engagement, minimize digital-resource consumption, and minimize behavioral saturation. In particular, explicit fatigue-weighted saturation objectives and operational constraints controlling per-period exposure, total campaign exposure, consecutive repetition, channel accessibility, and channel capacity are generally absent from these formulations [25,28].
Second, multi-objective optimization under uncertainty has been applied successfully in other decision domains [29], but the corresponding objective structures do not incorporate the specific behavioral and operational characteristics of IoT marketing. Existing formulations do not jointly represent customer-response probabilities, personalized customer–channel–action assignment, digital-resource consumption, and fatigue-related exposure within the same optimization model. The present framework addresses this gap through a tri-objective structure in which engagement, normalized sustainability cost, and behavioral saturation are optimized simultaneously.
Third, fuzzy approaches in the marketing and decision-support literature provide mechanisms for representing uncertainty, managerial judgment, and preference structures [31,33]. However, these fuzzy components are rarely integrated with a campaign-level Pareto-based marketing model in which probabilistic customer response and fuzzy managerial satisfaction are explicitly separated. In the proposed framework, response probability represents behavioral uncertainty within the optimization model, whereas fuzzy membership functions and the Max–Min criterion are used to evaluate managerial satisfaction with the three conflicting objectives. This distinction enables fuzzy logic to support compromise interpretation without replacing the underlying Pareto-based search process.
Fourth, although metaheuristic multi-objective optimization has been extensively applied in complex computational problems [35,36], comparative benchmarking remains insufficient in behavior-aware marketing applications. Existing marketing-oriented studies seldom compare competing Pareto-based algorithms under an identical set of objectives, behavioral constraints, resource constraints, and experimental conditions [33,37]. The present study addresses this limitation by benchmarking NSGA-II and MOPSO using the same mathematical formulation and synthetic datasets, with 30 independent runs, Pareto-quality assessment, statistical comparison, marketing-oriented KPIs, and behavioral sensitivity analysis.
Finally, existing digital-transformation and AI–IoT research emphasizes adaptive capabilities, sustainable technology use, and responsible digital decision making [38,39], but these concerns are rarely operationalized together within the mathematical structure of marketing optimization models. The proposed framework therefore integrates these concerns directly through a sustainability-cost objective, a fatigue-weighted behavioral-saturation objective, explicit customer-exposure constraints, and scenario-based managerial preference evaluation. Accordingly, the contribution of the study lies not in claiming that these individual concepts are absent from prior research, but in combining them within one behavior-aware, sustainability-oriented, fuzzy multi-objective marketing decision framework.
Taken together, these gaps point to an urgent need for a comprehensive framework that:
- Models IoT-based consumer engagement as a multi-objective problem involving trade-offs between personalization, saturation, and sustainability;
- Incorporates probabilistic behavioral parameters together with fuzzy satisfaction modeling to represent customer-response variability and managerial subjectivity;
- Leverages metaheuristic algorithms with comparative benchmarking and sensitivity diagnostics;
- Embeds behavioral constraints and preference dynamics into the optimization logic; and
- Provides a theoretically informed interpretation of the optimization framework using established perspectives from information systems and digital marketing.
The present study is designed to address these gaps. It introduces a fuzzy multi-objective optimization model grounded in IoT marketing ecosystems, with a strong emphasis on interpretability, strategic adaptability, and theory integration. The next section outlines the theoretical foundations on which this model is built.
2.6. Theoretical Framing and Contribution
Building upon the methodological and empirical gaps outlined above, this study uses three established theoretical perspectives to interpret the structure and managerial implications of the proposed optimization framework: Affordance Theory, the DeLone and McLean IS Success Model, and the Dynamic Capabilities framework. These theories are not empirically tested or formally extended in this study. Instead, they provide complementary conceptual lenses for relating the model’s technological, behavioral, and adaptive decision components to established information systems and organizational concepts.
2.6.1. Affordance Theory in IoT-Driven Engagement
Affordance Theory suggests that technological artifacts create action possibilities that may be realized through interactions between users and technological environments [13]. In the present framework, IoT-enabled channels can be interpreted as providing different technological opportunities for customer engagement [2]. Channel availability, action assignment, and channel-specific utility therefore offer operational representations that are consistent with an affordance perspective. The optimization model does not directly measure or test perceived or realized affordances; rather, Affordance Theory provides an interpretive lens for understanding how heterogeneous IoT touchpoints enable or constrain alternative marketing actions within the decision model [40].
Proposition 1.
Greater heterogeneity in available IoT channels and channel-specific action utilities expands the feasible opportunity set for personalized customer engagement within the optimization framework.
2.6.2. Reframing the IS Success Model Under Optimization
The DeLone and McLean IS Success Model [14] provides a useful interpretive perspective for considering the broader implications of engagement-related optimization outcomes. The present model does not directly operationalize or empirically measure the IS Success constructs of system use, user satisfaction, or net benefits. Instead, effective engagement and fatigue-related exposure are treated as decision-level proxies that are conceptually related to benefit and user-experience considerations. From this perspective, the optimization trade-off between increasing engagement and limiting excessive exposure can be interpreted as being consistent with the broader IS Success emphasis on balancing system use with favorable user outcomes.
Proposition 2.
Marketing solutions that increase effective engagement while simultaneously controlling fatigue-related exposure provide a more balanced decision outcome than solutions based solely on engagement maximization.
2.6.3. Dynamic Capabilities Perspective on Adaptive Decision Support
The Dynamic Capabilities perspective [15] provides a complementary lens for interpreting the adaptive decision-support features of the framework. The model allows decision-makers to examine alternative priority structures and to reconfigure the relative emphasis placed on engagement, sustainability, and behavioral saturation as managerial conditions change. This flexibility is conceptually consistent with the broader dynamic-capabilities logic of adapting and reconfiguring organizational resources in response to environmental change. However, the study does not directly measure sensing, seizing, or reconfiguration capabilities at the organizational level; rather, it illustrates how an optimization-based decision-support system can facilitate adaptive managerial decision making.
Proposition 3.
Changes in managerial priority structures lead to systematic changes in preferred optimization solutions, demonstrating the adaptive reconfiguration capability of the proposed decision-support framework.
The propositions advanced in this section are design propositions derived from the theoretical framing and architecture of the proposed decision-support model. They are not empirically tested propositions in the present study. The synthetic computational experiments can only illustrate whether the behavior of the model is consistent with the logic underlying these propositions; they do not constitute empirical evidence or statistical validation of the theoretical relationships. Empirical validation would require observed customer- and organization-level data collected from operational IoT-enabled marketing environments.
3. Mathematical Modeling
This section presents the fuzzy multi-objective optimization model developed to support decision-making in IoT-enabled marketing ecosystems. The model formalizes trade-offs among three strategic goals: (1) maximizing effective customer engagement, (2) minimizing digital resource consumption, and (3) mitigating behavioral saturation. By integrating fuzzy logic into a multi-objective framework, the model accommodates uncertainty, subjective managerial preferences, and behavioral complexity—making it well-suited to the demands of real-time, data-intensive marketing environments. Designed in response to the growing need for intelligent, sustainable, and adaptive marketing strategies, the model leverages data generated through IoT-enabled interactions across multiple channels. It provides a decision support structure that balances personalization goals with operational constraints, particularly in relation to digital resource limits and cognitive fatigue among customers.
The mathematical model is theoretically informed rather than designed as a direct empirical test of the theories discussed in Section 2.6. Channel availability and action utility provide model components that can be interpreted through an affordance perspective, while engagement and fatigue-related exposure provide decision-level indicators that are conceptually related to benefit and user-experience considerations. In addition, the ability to evaluate alternative objective priorities provides an adaptive decision-support feature that is consistent with the general logic of dynamic capabilities. These theoretical perspectives therefore support the interpretation of the model rather than constituting directly measured constructs within the mathematical formulation. The following subsections describe the full structure of the model, including sets, parameters, decision variables, objective functions, and constraints. Together, they define a computationally tractable yet conceptually rich formulation of customer-centric, sustainable marketing optimization.
| Sets | |
| Set of customers, indexed by c | |
| Set of customers classified as VIP customers | |
| Set of time periods, indexed by t | |
| Set of IoT-enabled marketing channels (e.g., mobile app, wearable, smart display), indexed by k | |
| Set of engagement actions (e.g., notification, discount, video), indexed by a | |
| Set of sustainability-related resources (e.g., energy, bandwidth), indexed by r | |
| Parameters | |
| Expected engagement score for customer c via channel k at time t | |
| Utility value of action a for customer c via channel k | |
| Sustainability cost of performing action a a on channel k with respect to resource r | |
| Available budget for resource r | |
| Estimated probability of engagement by customer c via channel k at time t | |
| Customer-specific behavioral-saturation sensitivity coefficient for customer on channel at time | |
| Minimum acceptable effectiveness ratio | |
| Maximum number of allowed engagements per customer per time period | |
| Maximum number of messages allowed through channel k at any given time | |
| Maximum total number of engagements per customer over the campaign duration |
In this model, mathematical parameters are linked to observable management realities. For example, Br represents the budget ceiling allocated to each marketing resource or campaign, reflecting the organization’s financial constraints. Qk represents the capacity of each marketing channel (such as the number of emails that can be sent or phone calls possible). L is the maximum limit on the number of actions a customer can receive in a given period to avoid saturation or overwhelm. Finally, Dmax is the customer’s fatigue threshold, reflecting their level of tolerance for marketing interactions.
| Decision Variables | |
| Engagement score obtained by customer via channel at time | |
| Total amount of resource r consumed during the campaign |
Objective Functions
s.t
The proposed model consists of three objective functions and a set of assignment, resource, effectiveness, channel-capacity, accessibility, and exposure-control constraints that jointly define the feasible decision space. The first objective function (1), titled “Maximizing effective customer interaction”, seeks to increase the total value of marketing actions carried out for customers through IoT channels over different time periods. In this function, the probability of customers responding to marketing actions, along with the value of each action, is considered in a combined manner in order to obtain the highest effectiveness from each interaction. In other words, this function is the main criterion for the usefulness of the marketing system from a behavioral and operational perspective. The second objective function (2) focuses on “Minimizing sustainability costs”. In this function, the consumption of resources such as energy, bandwidth and other digital capacities is measured. Each marketing action through a specific channel consumes some of these resources, and the sum of these costs is considered as an indicator of the sustainability of the system. The objective of this function is to reduce the environmental and technology-based impacts of implementing smart marketing policies. To make heterogeneous resources comparable, the consumption of each resource is normalized to the ceiling/budget of the same resource Br. The third objective function (3), “Minimizing Behavioral Saturation”, represents a fatigue-weighted exposure penalty. Each selected marketing action contributes to the objective according to the customer-specific fatigue sensitivity coefficient δckt associated with the corresponding customer, channel, and time period. Consequently, marketing exposure involving customers with higher fatigue sensitivity receives a larger penalty, whereas no penalty is incurred when no action is assigned. In conjunction with the exposure-control and repetition constraints, this objective discourages excessive marketing contact while allowing the optimization model to balance engagement benefits against the behavioral burden imposed on customers. The remaining constraints define the assignment, resource, effectiveness, capacity, accessibility, and exposure conditions of the model. Constraint (4) is dedicated to defining the interaction score for each customer, which is the sum of the value of actions taken at any time and through each channel. The interaction score zckt is defined as the sum of the values of actions weighted by the probability of effectiveness Pckt. Constraint (5) ensures that at most one marketing action is taken for a customer through a specific channel in each time period, and message overlap or interference is avoided. In order to maintain the binary decision structure, constraint (6) restricts the decision variable xckat to only two values of zero and one.
The consumption of digital resources, as a key part of sustainability, is calculated in constraint (7), which determines the total consumption of each resource based on the number of actions performed. Constraint (8) states that the consumption of each resource should not exceed the budget defined for it. To avoid negative and unrealistic values in resource consumption, constraint (9) emphasizes the non-negativity of the variables yr. Next, constraint (10) ensures that the achieved engagement for each customer is not lower than the expected level by defining a fuzzy effectiveness threshold. To control customer fatigue over time, constraint (11) limits the number of actions allowed for each customer in each time interval. Also, constraint (12) focuses on the capacity of each channel and prevents excessive messages from being sent from a particular channel. In order to maintain contact with important customers, constraint (13) requires that VIP customers are targeted with a marketing action at least once during the campaign.
To avoid sending marketing messages consecutively, constraint (14) ensures that actions with a specific feature are not repeated in two consecutive time periods. For each customer-channel action, assignment of the same action in two consecutive time periods is not allowed (no back-to-back repetition). Constraint (15) controls channel accessibility and prevents the assignment of marketing actions through channels that are unavailable to a given customer. Finally, constraint (16) limits the total number of marketing actions assigned to each customer over the entire campaign horizon, thereby reducing the risk of excessive exposure and message fatigue. The proposed framework distinguishes between the generation of multi-objective solutions and their fuzzy satisfaction-based interpretation. Customer responsiveness enters the optimization model through the probabilistic parameter , while represents customer-specific sensitivity to marketing exposure. These behavioral parameters are therefore distinct from the fuzzy decision layer. The three objective functions , and define the original multi-objective search space, in which Pareto-optimal solutions represent alternative trade-offs among engagement, sustainability, and behavioral saturation. The fuzzy component is subsequently used to express the managerial desirability of these objective values. For this purpose, a membership function is defined for each objective to transform its achieved value into a satisfaction degree between zero and one. The resulting satisfaction degrees provide a common decision scale for interpreting the competing objectives, while the Max–Min criterion identifies the minimum satisfaction level achieved across them. This separation preserves the Pareto-based nature of the optimization process while providing an interpretable fuzzy mechanism for managerial compromise evaluation. The fuzzy membership function for the first objective (Z1), which maximizes effective customer interaction, is defined as an increasing function. That is, as the value of the objective function Z1 increases, the degree of satisfaction also increases and approaches the value of one. This function can be defined as the following piecewise linear function:
where and are the minimum acceptable value and the ideal value for effective interaction, respectively.
For the second objective function (Z2), which is related to minimizing resource consumption and sustainability costs, the fuzzy membership function is considered to be decreasing. This means that the lower the value of Z2, the higher the satisfaction is achieved, and the function tends to the value 1:
In this regard, is the optimal or ideal value for the sustainability cost and is the maximum acceptable value.
For the third objective function (Z3), which minimizes the saturation of the interaction, a similar decreasing membership function is also used since decreasing the saturation is more desirable:
Here, too, the value represents a very low and ideal level of saturation, while represents the maximum acceptable level of customer saturation from marketing interactions.
In this research, the Max–Min Aggregation method is employed to maximize the minimum satisfaction among the three membership functions and thereby obtain a balanced compromise in which weak performance in one objective cannot be fully compensated for by strong performance in another.
s.t
where λ represents the minimum level of fuzzy satisfaction resulting from the realization of the three objectives. The model tries to increase this value as much as possible, while none of the objective functions have a satisfaction lower than it.
4. Research Methodology
This study adopts an applied research orientation, targeting practical improvements in IoT-enabled marketing systems through the development of a computational decision-support framework. Methodologically, it integrates quantitative modeling, multi-objective optimization, and metaheuristic simulation, with the overarching goal of solving a complex trade-off problem characterized by three competing objectives:
(1) Maximizing customer engagement effectiveness;
(2) Minimizing digital sustainability costs (e.g., energy and bandwidth);
(3) Controlling behavioral saturation caused by overexposure to marketing stimuli.
The methodological framework separates multi-objective search from fuzzy preference interpretation. Probabilistic response parameters and fatigue coefficients characterize customer-related behavioral conditions within the optimization model, while the three objective functions define the trade-off space explored by the solution methods. Exact optimization is used for the small-scale instance, whereas NSGA-II and MOPSO are employed to approximate Pareto-optimal solutions in the large-scale setting. Fuzzy membership functions and the Max–Min satisfaction criterion provide a complementary decision layer for interpreting objective achievement according to managerial aspiration levels.
4.1. Data Design and Experimental Setup
To computationally evaluate and test the model, the study employed a dual-stage data strategy combining synthetic dataset generation and scenario-based simulation. At the small-scale level, a controlled dataset was generated featuring:
- 5 customers;
- 4 IoT-enabled marketing channels;
- 3 discrete time periods.
This dataset included parameter values for engagement probabilities, customer fatigue sensitivity coefficients, channel-specific resource costs (e.g., energy, bandwidth), and action utilities. This configuration allowed the small-scale model to be solved exactly in GAMS 46.2.0 using the CPLEX 22.1.1 solver and enabled visualization of the resulting Pareto front representing the trade-offs among the three objectives.
Parameter generation followed a literature-informed but fully synthetic design. Both the small-scale and large-scale experiments were constructed without using observed enterprise, customer-level, or campaign-level IoT-marketing data. Prior empirical and domain studies were used to identify relevant behavioral and operational parameter categories and to establish plausible patterns of heterogeneity in customer response, IoT-enabled engagement, marketing-action effectiveness, digital-resource consumption, and customer sensitivity to repeated exposure [1,8,10,22,24,25,31].
Customer response probability was generated from a Uniform distribution over . This distribution was selected because no empirical enterprise dataset was available to justify concentration around a particular response level. Action utility was generated from a truncated Normal distribution with a mean of 70 and a standard deviation of 15, bounded to and rounded to the nearest integer. Behavioral-saturation sensitivity was generated from a truncated Normal distribution with a mean of 0.45 and a standard deviation of 0.15, bounded to [0.10, 0.80]. These specifications generate heterogeneous customer and action characteristics while preventing values outside the predefined admissible domains.
Resource consumption was generated using resource-specific distributions. Energy-related demand followed a Gamma distribution with shape parameter and scale parameter because energy consumption is non-negative and may exhibit right-skewed variation. Bandwidth and other digital-resource demands followed a Normal distribution with a mean of 4.5 and a standard deviation of 1.5, bounded to , representing approximately symmetric variation around a typical demand level. The available resource capacity was set at 70% of the corresponding unconstrained maximum resource demand to create a controlled capacity-stress condition and meaningful sustainability trade-offs. Generated values outside the specified ranges were clipped to their corresponding bounds.
The small-scale instance was solved using the exact GAMS–CPLEX implementation to provide a reference solution set. For the large-scale synthetic instance, the same mathematical objectives and feasibility conditions were evaluated through NSGA-II and MOPSO. This separation enabled the exact small-scale results to serve as a computational reference while allowing the scalability and stochastic performance of the metaheuristic procedures to be assessed on the larger problem instance.
4.2. Optimization Algorithms
To solve the model under high-dimensional conditions, two state-of-the-art metaheuristic optimization algorithms were employed and benchmarked:
(a) NSGA-II (Non-dominated Sorting Genetic Algorithm II)
NSGA-II was selected due to its proven efficacy in generating diverse and well-distributed Pareto fronts in multi-objective optimization problems. The algorithm’s mechanisms (such as non-dominated sorting, crowding distance preservation, and elitist selection) are well-suited to constrained problems like the present one.
(b) MOPSO (Multi-Objective Particle Swarm Optimization)
Inspired by the collective behavior of particles in nature, MOPSO was employed for its simplicity, speed, and effectiveness in high-dimensional search spaces. In this method, particles explore the solution space using both personal experience and global best positions stored in an elite archive.
Because the principal assignment variable xckat is binary, algorithm-specific encoding procedures were used to preserve the discrete decision structure. In NSGA-II, each candidate solution was represented directly as a binary chromosome, with each gene corresponding to an assignment decision xckat. Crossover was applied with a probability of 0.9, while bit-flip mutation was performed with a probability of 0.1. In MOPSO, particle velocities were updated in continuous space and subsequently mapped to binary decisions using a sigmoid transfer function. For a particle velocity v, the transfer probability was calculated as:
The corresponding binary position was assigned a value of 1 when a uniformly generated random number was smaller than S(v), and 0 otherwise. Following crossover, mutation, or particle-position updating, candidate solutions were checked against the model constraints. Structural violations related to action assignment, resource availability, channel capacity, accessibility, and customer-exposure limits were repaired whenever feasible. Remaining infeasible solutions were handled using a feasibility-first rule: feasible solutions were preferred to infeasible solutions, and when two infeasible solutions were compared, the solution with the lower total normalized constraint violation was preferred. The same objective-evaluation and feasibility criteria were applied to NSGA-II and MOPSO to maintain a consistent comparison.
4.3. Algorithm Configuration
The algorithm configurations were determined through a two-stage procedure combining literature-based initialization and preliminary problem-specific tuning. The standard algorithmic structure and initial parameter ranges were guided by the original NSGA-II and MOPSO formulations. For NSGA-II, the crossover and mutation probabilities were initialized from commonly used values in the literature, while population size and iteration count were subsequently examined through preliminary runs. For MOPSO, the initial ranges for inertia weight, personal and social learning coefficients, particle number, and archive size were similarly literature-informed and then evaluated through preliminary experiments using the present large-scale problem structure. The final settings resulting from this procedure are reported in Table 1.
Table 1.
Final NSGA-II and MOPSO parameter settings after literature-based initialization and preliminary tuning.
Preliminary tuning was conducted before the 30 independent experimental runs. For NSGA-II, population sizes of 50, 100, and 150 and iteration limits of 200, 300, and 400 were examined. Mutation probabilities of 0.05, 0.10, and 0.15 and crossover probabilities of 0.80 and 0.90 were also evaluated. The configuration with population size = 100, number of iterations = 300, mutation probability = 0.10, and crossover probability = 0.90 provided the best balance between Pareto-front quality, solution diversity, and computational time. Increasing the population to 150 or the iteration limit to 400 produced less than approximately 1% additional improvement in hypervolume while increasing computation time by approximately 30–40%. Smaller settings, particularly population size = 50 and 200 iterations, converged faster but produced visibly lower hypervolume and less diverse Pareto fronts.
For MOPSO, preliminary experiments considered 50, 100, and 150 particles; inertia weights of 0.4, 0.5, and 0.7; personal and social learning coefficients of 1.0, 1.5, and 2.0; and archive sizes of 50, 100, and 150. The combination of 100 particles, inertia weight = 0.5, personal learning coefficient = 1.5, social learning coefficient = 1.5, archive size = 100, and 300 iterations provided the most stable compromise between convergence, archive diversity, and execution time. Increasing the particle or archive size beyond 100 yielded only marginal improvements in Pareto quality while increasing computational cost. The final configurations shown in Table 1 were therefore fixed before the main experiments and were applied unchanged across all 30 independent runs of each algorithm.
All computational experiments were performed on a computer equipped with an Intel Core i7 processor and 16 GB of RAM running Windows 11. NSGA-II and MOPSO were implemented in MATLAB R2023a. Random-number generation was controlled using MATLAB’s Mersenne Twister generator through the rng(seed, ‘twister’) command. Thirty fixed seeds, ranging from 101 to 130, were used for the 30 independent runs, and the same seed set was applied to both algorithms to enable paired run-wise comparison. All algorithmic parameters reported in Table 1 were held constant across the repeated runs.
Because both NSGA-II and MOPSO are stochastic optimization algorithms, each algorithm was independently executed 30 times. The same set of 30 random seeds was used for both algorithms to enable run-wise paired comparison while preserving stochastic independence across repeated executions. For each run, the optimization-performance indicators and marketing-oriented KPIs were recorded, and the results were summarized using the mean and standard deviation (mean ± SD). Since normality of the paired performance differences could not be assumed, statistical comparisons between NSGA-II and MOPSO were conducted using the two-sided Wilcoxon signed-rank test at a significance level of α = 0.05. In addition to statistical significance, the Vargha–Delaney A12 statistic was calculated to quantify the magnitude and direction of the observed performance differences. An A12 value of 0.50 represents comparable performance, whereas values farther from 0.50 indicate stronger algorithmic dominance. For minimization criteria, performance orientation was accounted for when interpreting the direction of the effect size.
To complement the multi-objective comparison with a managerial decision perspective, three priority scenarios were defined for post-optimization evaluation. Because Z1 is a maximization objective whereas Z2 and Z3 are minimization objectives and the three measures are expressed on different scales, their raw values were not aggregated directly. Instead, the fuzzy satisfaction degrees defined in Equations (17)–(19) were used to place all three objectives on a common scale from 0 to 1, where higher values represent more desirable performance. The overall managerial score for each algorithm was then calculated as:
where w1, w2, and w3 denote the relative managerial importance assigned to engagement, sustainability, and behavioral saturation, respectively, with . Three managerial configurations were examined: a customer-engagement priority scenario , a sustainability-efficiency priority scenario , and a balanced-priority scenario . The resulting score was expressed on a 0–100 scale, with higher values indicating greater overall satisfaction under the corresponding managerial priority structure.
In practical use, the Pareto front is treated as a decision set rather than as a single automatic recommendation. The solution-selection workflow proceeds by first retaining the feasible nondominated solutions generated by the optimization algorithm and then evaluating each candidate through the fuzzy satisfaction degrees associated with Z1, Z2, and Z3. Managers specify the current strategic priority structure, and the corresponding managerial score is calculated for each Pareto candidate using Equation (26). Candidates can then be ranked according to this score, while their underlying engagement, resource-consumption, and behavioral-saturation values remain visible to the decision-maker. The highest-ranked feasible candidate provides the implementable solution under the selected managerial priorities; when no objective is given explicit priority, the Max–Min compromise provides a balanced alternative by favoring the solution with the strongest minimum satisfaction across the three objectives. The selected solution is finally translated through the decision variables into the customer–channel–action–time assignments to be implemented in the marketing campaign.
4.4. Definition of Performance Metrics and Marketing-Oriented KPIs
To support the managerial interpretation of the optimization results, three derived marketing-oriented KPIs were used in addition to the objective-function values , and . Personalization Efficiency represents the extent to which the marketing actions selected by the optimization procedure are aligned with the highest-utility alternatives available for the corresponding customer and channel. IoT Channel Utilization represents the percentage of available communication capacity across IoT-enabled channels that is used by the optimized marketing plan. Expected Message Acceptance Rate represents the average estimated customer response probability associated with the selected marketing actions. Because the experiments are based on synthetic behavioral data rather than observed customer responses, this indicator reflects expected rather than empirically observed message acceptance. Each KPI was calculated separately for every independent algorithm run, and the resulting values were summarized across the 30 runs using the mean and standard deviation.
For completeness, the mathematical definitions of the performance indicators used in the computational evaluation are specified here. The first three marketing-oriented KPIs (Customer Engagement Score, Sustainability Cost, and Over-Engagement Score) correspond directly to the objective functions , and Z3 already defined in Equations (1)–(3), respectively, and are therefore not repeated. Higher indicates greater expected engagement value, whereas lower and indicate lower digital-resource consumption and lower fatigue-weighted marketing exposure, respectively.
Hypervolume (HV) was calculated after orienting and normalizing the three objectives to a common minimization scale. For a solution s:
where P denotes the nondominated solution set and denotes the volume of the dominated objective space relative to the normalized reference point . A larger HV indicates a Pareto set that provides managers with a stronger overall combination of engagement, resource efficiency, and behavioral-saturation control.
Pareto-front Spread was calculated as:
where is the distance between consecutive nondominated solutions, is their mean distance, and and represent the distances associated with the two boundary solutions. Lower Spread indicates a more uniformly distributed Pareto front and therefore a more evenly diversified set of marketing trade-off alternatives.
The three derived marketing-oriented KPIs were computed as follows. Personalization Efficiency (PE) was defined as:
where . Higher PE indicates that the selected actions are closer to the highest-utility alternatives available for the targeted customers and channels.
IoT Channel Utilization (ICU) represents the percentage of available channel capacity used by the optimized campaign. Higher values indicate greater utilization of available IoT touchpoints, although this indicator should be interpreted jointly with sustainability cost and behavioral saturation rather than maximized independently.
Expected Message Acceptance Rate (EMAR) represents the mean predicted response probability associated with the selected marketing actions. Higher values indicate stronger expected customer responsiveness; however, because the study uses synthetic behavioral data, EMAR represents expected rather than empirically observed message acceptance.
5. Result Analysis
This section presents a detailed analysis of the performance and applicability of the proposed fuzzy multi-objective optimization model for IoT-enabled sustainable marketing. A two-stage experimental setup was adopted: (i) an exact optimization experiment using GAMS for a small-scale scenario, and (ii) a large-scale simulation using two metaheuristic algorithms NSGA-II and MOPSO. This dual-scale design enables exact-solution verification at small scale and algorithmic benchmarking under controlled large-scale computational conditions.
5.1. Experimental Setup: Scenario Design
The numerical experiments are structured around two complementary scenarios:
- Small-Scale Scenario: The small-scale scenario comprised 5 customers, 4 IoT-enabled marketing channels, and a 3-period planning horizon, consistent with the experimental design described in Section 4.1. Parameterized data enabled the GAMS solver to produce the full Pareto front, reflecting trade-offs among the three primary objectives:
Z1: Maximizing effective customer interaction
Z2: Minimizing sustainability cost
Z3: Minimizing behavioral saturation
An illustrative excerpt of the input dataset is provided in Table 2, which defines key parameters such as response probability, utility, and resource consumption for each customer-action-channel combination.
Table 2.
Example of input data for the small-scale scenario.
To account for the stochastic nature of the metaheuristic procedures, NSGA-II and MOPSO were each executed independently 30 times using the common seed set defined in the experimental protocol. Optimization-quality measures, execution time, objective-function outcomes, and marketing-oriented KPIs were recorded for every run. The results reported in the following sections therefore represent mean performance across the 30 independent executions, accompanied by the corresponding standard deviations. This repeated-run design also provides the observations required for paired statistical comparison between the two algorithms.
- B.
- Large-Scale Scenario: This synthetic scenario was constructed to evaluate the model’s scalability and algorithmic performance under large-scale conditions designed to emulate operational heterogeneity. It includes 1000 customers, 10 diverse IoT channels (e.g., apps, wearables), 5 marketing actions, 3 resource types, and 5 time intervals. Given the NP-hard nature of the model at this scale, exact solutions are infeasible; therefore, NSGA-II and MOPSO algorithms were applied to approximate the Pareto front.
Table 3 summarizes the numerical generation settings used for the large-scale synthetic scenario. As detailed in Section 4.1, the modeled parameter categories and their expected heterogeneity were informed by prior IoT-marketing, behavioral, and digital-resource literature, whereas the exact numerical ranges, probability-distribution parameters, and capacity-stress level were simulation-calibrated rather than directly estimated from enterprise observations. All large-scale observations were therefore synthetically generated, and no customer-level, campaign-level, or enterprise IoT-marketing dataset was used.
Table 3.
Parameter distributions and generation settings for the large-scale synthetic scenario.
5.2. Model Execution and Pareto Front Analysis
In the small-scale scenario, the model was solved exactly using GAMS. The resulting Pareto frontier, visualized in Figure 1, demonstrates a clear trade-off between increased customer interaction (Z1) and resource costs (Z2). As Z1 increases, Z2 also rises, revealing the cost-efficiency boundary for personalized engagement under constrained digital infrastructure.
Figure 1.
Pareto Front from GAMS (Small-Scale Scenario).
In the large-scale scenario, both NSGA-II and MOPSO were executed for 300 iterations per run. The resulting two-dimensional Z1–Z2 projections of the Pareto fronts (Figure 2) indicate that NSGA-II outperformed MOPSO in achieving higher engagement scores and more diversified solutions, while MOPSO demonstrated stronger performance in minimizing sustainability costs with lower computational overhead.
Figure 2.
Two-dimensional Z1–Z2 projection of the Pareto fronts: NSGA-II vs. MOPSO (Large-Scale Scenario).
From a managerial perspective, Figure 1 and Figure 2 should therefore not be interpreted as requiring decision-makers to choose an arbitrary point from a large set of mathematically equivalent alternatives. Each Pareto solution represents a different implementable balance among engagement, sustainability cost, and behavioral saturation. A solution toward the high-engagement region may be appropriate for acquisition or campaign-growth objectives but generally requires accepting greater resource use, whereas a solution emphasizing lower Z2 is more suitable when digital-resource efficiency is a dominant constraint. Solutions with lower Z3 become particularly relevant when customer-contact intensity and fatigue risk are managerial concerns. The fuzzy satisfaction and managerial-scoring procedure defined in the methodology converts these trade-offs into a ranked shortlist according to the organization’s current priorities.
The performance of the two algorithms across the 30 independent runs is summarized in Table 4 using mean ± SD values. NSGA-II achieved a higher mean hypervolume and customer engagement score and a lower mean over-engagement score, whereas MOPSO required less computational time and achieved a lower sustainability cost (Figure 3). The relatively small standard deviations observed across the repeated runs indicate that both algorithms maintained reasonably stable performance under stochastic initialization as shown in Table 4.
Table 4.
Performance Comparison of NSGA-II and MOPSO (Large-Scale).
Figure 3.
Execution Time Comparison: NSGA-II vs. MOPSO.
5.3. KPI-Based Evaluation
To enhance managerial relevance, the model was assessed against six key performance indicators (KPIs), covering engagement quality, resource efficiency, and behavioral experience:
- Customer Engagement Score (Z1);
- Sustainability Cost (Z2);
- Over-Engagement Score (Z3);
- Personalization Efficiency (%);
- IoT Channel Utilization (%);
- Expected Message Acceptance Rate (%).
Across the 30 independent runs, NSGA-II achieved higher mean performance than MOPSO in five of the six marketing-oriented KPIs, whereas MOPSO achieved a lower sustainability cost. In particular, NSGA-II produced higher customer engagement, personalization efficiency, IoT channel utilization, and message acceptance, while simultaneously maintaining a lower over-engagement score. The descriptive results and the corresponding inferential statistical comparisons are reported in Table 5.
Table 5.
Statistical comparison of marketing KPIs across 30 independent runs.
The Wilcoxon signed-rank test indicated statistically significant differences between NSGA-II and MOPSO across all six reported KPIs at the α = 0.05 significance level. The strongest advantages of NSGA-II were observed for personalization efficiency and customer engagement, whereas MOPSO showed a statistically significant advantage in sustainability cost. The Vargha–Delaney A12 statistics further indicate that these differences are not limited to small numerical shifts between mean values but are associated with substantial and consistent performance differences across repeated executions.
As reported in Table 5, the paired Wilcoxon tests yielded p < 0.001 for Customer Engagement Score, Personalization Efficiency, and IoT Channel Utilization, p = 0.002 for Sustainability Cost and Expected Message Acceptance Rate, and p = 0.004 for Over-Engagement Score. The corresponding Vargha–Delaney A12 values were 0.84, 0.23, 0.74, 0.88, 0.83, and 0.81, respectively, providing explicit effect-size evidence in addition to statistical significance.
Wilcoxon signed-rank tests were based on paired outcomes from 30 independent runs conducted using the same set of random seeds for both algorithms. The Vargha–Delaney A12 statistic was additionally used to quantify the magnitude and direction of the observed differences. Values above 0.50 indicate an advantage for NSGA-II, whereas values below 0.50 indicate an advantage for MOPSO after accounting for the preferred direction of each performance criterion. The effect-size results reinforce the inferential findings: customer engagement, personalization efficiency, IoT channel utilization, message acceptance rate, and over-engagement control all favor NSGA-II, indicating a high probability that an NSGA-II run produces a more desirable outcome than a corresponding MOPSO run. In contrast, the A12 value of 0.23 for sustainability cost confirms the advantage of MOPSO in resource-efficient optimization. Taken together, the statistical significance and effect-size results indicate that NSGA-II is generally more suitable for engagement- and personalization-oriented strategies, whereas MOPSO provides a stronger alternative when resource efficiency is the dominant managerial concern.
In Figure 4, this comparison is presented visually. The performance difference between the two algorithms is clearly visible in different dimensions.
Figure 4.
Comparison of mean marketing KPI values for NSGA-II and MOPSO across 30 independent runs.
These results demonstrate that the model not only delivers algorithmic robustness but also aligns well with strategic marketing objectives, balancing personalization with operational constraints.
5.4. Strategic Scenario Analysis
The managerial scenario results are presented in Table 6 and Figure 5 based on the evaluation procedure described in the methodology. The comparison examines the relative performance of NSGA-II and MOPSO under three alternative managerial priorities: customer engagement, sustainability efficiency, and a balanced strategy. These scenarios provide a decision-oriented interpretation of the optimization results by showing how algorithm performance changes when organizational priorities differ.
Table 6.
Model performance scores under different management scenarios.
Figure 5.
Comparison of algorithm performance in three management decision-making approaches.
As can be seen from the results in Table 6, in scenarios where the organization’s main focus is on increasing effective customer engagement, the NSGA-II algorithm performed better than MOPSO and achieved a higher aggregate score. In contrast, in a scenario where saving digital resources and sustainability are the priority decision-making factors, the MOPSO algorithm performed more economically and achieved a higher score by allocating fewer resources. In the balanced scenario, NSGA-II still remained in the leading position by a slight margin.
These findings indicate that algorithm selection can be aligned with managerial priorities. NSGA-II provides stronger performance when customer engagement or balanced objectives receive greater emphasis, whereas MOPSO becomes more attractive when sustainability efficiency is prioritized. Figure 5 summarizes these scenario-dependent differences and illustrates the managerial trade-off between engagement-oriented and resource-efficient optimization.
Table 7 illustrates the practical role of the fuzzy decision layer by translating the objective values of a representative balanced Pareto solution into comparable satisfaction degrees. The resulting Max–Min value indicates the minimum satisfaction level simultaneously achieved across the three objectives, thereby preventing a solution with strong performance in one dimension from being selected at the expense of an unacceptably weak outcome in another. This demonstrates that the fuzzy layer adds a preference-aware compromise mechanism to the Pareto analysis and supports the identification of an implementable managerial solution rather than merely presenting a set of nondominated alternatives.
Table 7.
Numerical illustration of the fuzzy compromise solution under the balanced-priority scenario.
5.5. Sensitivity Analysis
A sensitivity analysis was conducted to assess the robustness of the model to variations in key behavioral parameters:
- Customer Response Probability (P(ckt)), influencing Z1;
- Customer Fatigue Coefficient (δ(ckt)), influencing Z3.
Results in Table 8 and Figure 6 and Figure 7 show that the model responds systematically to variations in both behavioral parameters. A 20% increase in customer response probability raised the engagement score (Z1) from 78.2 to 84.3, corresponding to an increase of 6.1 points, or approximately 7.8% relative to the baseline. Increasing the customer fatigue coefficient also produced a monotonic increase in the over-engagement score (Z3), which rose from 0.15 at the baseline to 0.21 under the +20% perturbation. These results indicate that both engagement performance and behavioral saturation are sensitive to changes in their associated customer-behavior parameters.
Table 8.
One-at-a-time sensitivity of Z1 and Z3 to variations in their associated behavioral parameters.
Figure 6.
Changes in Z1 versus changes in customer response probability Pckt.
Figure 7.
Changes in Z3 relative to changes in customer behavioral sensitivity δckt.
These insights emphasize the need for behaviorally informed parameter estimation, potentially through real-time analytics or machine learning, to sustain performance in volatile environments.
To measure the stability of the proposed model in the face of changes in customer behavioral parameters, sensitivity analysis was conducted on two key parameters: first, the probability of customer response to messages, which is indicated by the symbol Pckt in the model and is directly related to the objective function Z1 (effective interaction); and second, the customer sensitivity coefficient to interaction saturation, which is indicated by the symbol δckt and is directly related to the function Z3 (behavioral saturation).
Analysis of customer response probability shows a clear positive relationship with the engagement objective. Relative to the baseline value of 78.2, a 20% increase in P(ckt) increased Z1 to 84.3, whereas a 20% decrease reduced Z1 to 70.2. Figure 6 therefore demonstrates that engagement performance is sensitive to changes in the estimated probability of customer response.
The sensitivity analysis of δ(ckt) reveals a similarly clear but adverse pattern. As customer sensitivity to repeated marketing exposure increases, the over-engagement score Z3 increases monotonically, from 0.10 under the −20% perturbation to 0.21 under the +20% perturbation, with a baseline value of 0.15. As illustrated in Figure 7, higher fatigue sensitivity therefore increases the behavioral penalty associated with marketing exposure, emphasizing the importance of accurately estimating customer-specific fatigue characteristics.
Overall, the sensitivity analysis demonstrates that the optimization outcomes are responsive to variations in the behavioral parameters governing customer response and fatigue. This finding reinforces the importance of reliable parameter estimation when the model is applied in operational settings. In practice, response probabilities and fatigue-sensitivity coefficients may be periodically updated using observed customer-interaction data or predictive analytics, allowing marketing strategies to adapt as behavioral patterns evolve. The results also show that improvements in potential engagement should be evaluated jointly with the accompanying risk of behavioral saturation rather than considering either dimension in isolation.
5.6. Distributional Robustness Analysis
To examine whether the principal computational findings depend strongly on the baseline distributional assumptions reported in Table 3, an additional distributional robustness analysis was conducted. Three alternative synthetic-data specifications were evaluated while preserving the original parameter ranges, problem dimensions, resource-capacity setting, algorithm configurations, and the same set of 30 random seeds used in the baseline experiments.
In Scenario , the uniform distribution of was replaced by a scaled (2,2) distribution over , and the truncated Normal distribution of δ_ckt was replaced by a scaled (2,2) distribution over [0.10, 0.80]. These alternatives preserve the original parameter bounds while increasing the concentration of observations around intermediate behavioral values. In Scenario , was generated from a triangular distribution with minimum = 40, mode = 70, and maximum = 100. Energy-related demand was generated from a bounded Lognormal distribution approximately matched to the mean and variance of the baseline Gamma distribution, whereas bandwidth and other digital-resource demands followed a triangular distribution with minimum = 1.0, mode = 4.5, and maximum = 8.0. Scenario simultaneously applied all alternative behavioral, utility, and resource distributions.
The results in Table 9 show that the principal conclusions remain stable under the alternative distributional specifications. Under the combined R3 scenario, mean decreased from 78.2 to 77.1 for NSGA-II and from 73.6 to 72.5 for MOPSO. Mean increased from 0.15 to 0.16 for NSGA-II and from 0.18 to 0.19 for MOPSO. Hypervolume decreased from 0.82 to 0.79 for NSGA-II and from 0.77 to 0.74 for MOPSO. Despite these moderate numerical changes, the relative algorithmic pattern remained unchanged: NSGA-II retained its advantage in customer engagement, behavioral-saturation control, and hypervolume, whereas MOPSO continued to achieve lower sustainability cost. The results therefore indicate that the main comparative findings are not dependent on a single synthetic-data distributional specification.
Table 9.
Distributional robustness results under alternative synthetic-data specifications (mean ± SD across 30 runs).
Overall, the distributional robustness analysis confirms that moderate changes in the synthetic-data generation assumptions do not materially alter the main comparative findings. The relative strengths of NSGA-II and MOPSO therefore remain stable across alternative behavioral, utility, and resource-distribution settings.
6. Discussion and Interpretation of Results
The results of this study offer multifaceted insights into the computational robustness and potential managerial relevance of the proposed fuzzy multi-objective optimization model for sustainable, IoT-enabled marketing. Drawing upon both algorithmic performance and behavioral modeling, the findings contribute not only to computational decision science but also to the strategic management of digital customer engagement. This alignment between personalization and sustainability is increasingly echoed in contemporary research. Kousar [39] emphasize the critical need for ethical and sustainable frameworks in AI-IoT marketing, reinforcing the relevance of our model’s sustainability and saturation dimensions. These priorities are embedded in our model’s objective structure and computational performance across multiple scenarios.
At the algorithmic level, comparative analysis between NSGA-II and MOPSO reveals a nuanced trade-off between solution quality and computational efficiency. While both algorithms successfully approximated the Pareto frontier in the large-scale scenario, NSGA-II consistently delivered superior performance in maximizing customer interaction (Z1) and minimizing behavioral saturation (Z3). These advantages were particularly pronounced in contexts where engagement quality and personalization were strategic priorities. In contrast, MOPSO demonstrated faster execution and greater efficiency in minimizing sustainability-related costs (Z2), positioning it as a practical alternative in environments where operational constraints outweigh personalization imperatives. The implications of this trade-off are critical: algorithm selection should align with the organization’s marketing strategy, whether the objective is to deepen engagement or streamline resource allocation. The engagement–saturation trade-off can be interpreted through the theoretical lenses introduced earlier. The use of heterogeneous IoT channels is consistent with an affordance perspective in which technologies enable different forms of customer interaction, while the explicit consideration of fatigue-related exposure is conceptually consistent with the IS Success literature’s broader concern with favorable user outcomes. These interpretations should be understood as theoretical linkages rather than as direct empirical tests of the corresponding constructs.
The model’s effectiveness becomes even more evident when examined through the lens of key performance indicators. NSGA-II outperformed MOPSO in five of six metrics, including engagement score, personalization efficiency, IoT channel utilization, and expected message acceptance rate. These results suggest that the proposed model—particularly when implemented with NSGA-II—facilitates more intelligent orchestration of marketing actions across diverse IoT channels. It supports adaptive personalization while mitigating the risk of over-saturation, thereby enhancing the customer experience. From a managerial standpoint, this computational pattern illustrates how the model can integrate data-driven optimization with behavior-aware decision logic under the simulated conditions; it should not be interpreted as empirical validation of the theoretical propositions. Further interpretive depth emerges from the scenario-based evaluation of managerial priorities. By adjusting the weights of the three objective functions, the model demonstrates flexibility across different strategic contexts. NSGA-II proved especially effective when customer interaction or balanced objectives were prioritized, while MOPSO was more suitable when the primary concern was sustainability and resource efficiency. These findings underscore the model’s value as an adaptive decision-support tool, capable of aligning optimization logic with the dynamic needs of different marketing strategies.
Sensitivity analysis adds an important behavioral dimension to the discussion. Changes in two key parameters (the probability of customer response and the fatigue sensitivity coefficient) had a significant impact on the model’s outputs. A 20% increase in response probability led to a substantial improvement in engagement outcomes, while even modest increases in fatigue sensitivity rapidly escalated saturation levels. These results emphasize the importance of capturing accurate behavioral profiles in IoT-based campaigns. They also highlight the potential for integrating machine learning techniques into the model to dynamically estimate such parameters, enabling real-time adaptation and enhancing predictive accuracy.
Taken together, the simulation results provide computational evidence regarding the internal behavior and comparative performance of the proposed optimization framework, but they do not empirically validate the theoretical propositions. The observed patterns are consistent with the design logic underlying the propositions and therefore provide illustrative computational support rather than empirical confirmation. The model balances rigor in mathematical modeling with flexibility in strategic application, making it a powerful tool for navigating the complexities of digital marketing in IoT ecosystems. Its ability to optimize across conflicting goals, adapt to managerial priorities, and incorporate behavioral dynamics positions it as a significant contribution to both the decision sciences and the field of digital transformation. This research contributes to emerging conversations at the intersection of computational intelligence and digital marketing strategy. As noted by Kousar et al. [39], the integration of fuzzy-MOO techniques in sustainability-centric domains reflects a growing need for optimization frameworks that accommodate behavioral uncertainty and environmental constraints. The present findings apply this broader optimization perspective to the IoT-enabled marketing context by illustrating how engagement-oriented decisions can be considered jointly with resource efficiency and behavioral saturation. The resulting framework is also consistent with calls for more responsible and sustainability-aware algorithmic marketing design [39]. Furthermore, the ability to reconsider objective priorities under different managerial scenarios is conceptually compatible with the configurational flexibility emphasized in the dynamic capabilities literature. These relationships provide theoretically informed interpretations of the framework rather than evidence of direct empirical validation of the underlying theories. Unlike prior fuzzy-MOO models in operational domains, this study introduces a tri-objective formulation tailored for digital personalization and cognitive saturation control.
The sensitivity results further demonstrate that the framework is responsive to variations in the behavioral parameters examined in this study. Higher customer response probabilities improve achievable engagement, whereas greater fatigue sensitivity increases the over-engagement penalty associated with repeated marketing exposure. These findings reinforce the importance of reliable behavioral parameter estimation in operational applications and suggest that response probabilities and fatigue-sensitivity coefficients should be updated as customer behavior evolves. More broadly, the results indicate that improvements in engagement potential should be evaluated jointly with the associated risk of behavioral saturation when designing adaptive IoT-enabled marketing strategies.
7. Conclusions
This research has introduced and computationally evaluated a fuzzy multi-objective decision-making model designed to optimize customer interaction within IoT-enabled marketing environments. By integrating behavioral considerations and operational constraints into a mathematically rigorous framework, the model addresses three strategic objectives: maximizing effective customer engagement (Z1), minimizing the consumption of sustainability-critical digital resources (Z2), and mitigating behavioral saturation (Z3). These objectives reflect both the technological imperatives and the experiential sensitivities inherent in contemporary marketing ecosystems.
The model is grounded in a fuzzy optimization approach, allowing it to accommodate uncertainty, subjective managerial preferences, and variability in customer behavior. Its structure is intentionally adaptable and was computationally evaluated across controlled small-scale instances and large-scale synthetic environments. Nevertheless, the exclusive reliance on synthetic data limits the external validity of the numerical findings. Although the parameter structure was informed by relevant empirical and domain literature and the distributional robustness analysis demonstrated stability under alternative synthetic-data specifications, the reported numerical outcomes should not be interpreted as empirical estimates of enterprise marketing performance. Future research should calibrate and validate and using longitudinal customer-level observations, real-time IoT interaction records, and operational enterprise marketing data. Through a dual-scale experimental design (employing GAMS for exact solutions in small datasets and two advanced metaheuristic algorithms (NSGA-II and MOPSO) for larger synthetic environments) the model’s computational robustness and strategic versatility were thoroughly evaluated. Under the simulation settings examined in this study, NSGA-II achieved better performance than MOPSO across key engagement-oriented metrics, including higher interaction scores, lower over-saturation levels, and enhanced personalization efficiency. MOPSO, in contrast, showed advantages in execution speed and sustainability-related resource efficiency under the same experimental conditions. These comparative outcomes are conditional on the current synthetic data, problem scale, population and particle sizes, iteration budget, and algorithmic parameter settings and should not be generalized to all IoT-marketing optimization problems. Different problem dimensions or computational configurations may alter the relative performance of the two algorithms; therefore, algorithm selection should ultimately be based on problem-specific testing and managerial priorities.
The marketing-oriented analysis further underscores the model’s practical relevance. NSGA-II consistently led in critical performance indicators such as expected message acceptance rate and IoT channel utilization, reaffirming its alignment with customer-centric and personalization-intensive strategies. Furthermore, the model’s responsiveness to varying managerial weightings of strategic objectives reveals a high degree of operational flexibility. This adaptability enables decision-makers to fine-tune the optimization process in accordance with shifting strategic goals whether the focus lies in engagement maximization, sustainability, or balanced trade-offs. Sensitivity analysis reinforced the significance of behavioral parameters (particularly customer response probabilities and fatigue sensitivity) in shaping optimization outcomes. This highlights the necessity of integrating real-time behavioral data and predictive analytics, potentially through machine learning, to enhance model precision and responsiveness in dynamic marketing environments.
In conclusion, the proposed fuzzy multi-objective optimization model offers a theoretically grounded and computationally implementable framework with potential application to the design of smart, sustainable marketing campaigns in IoT ecosystems. It bridges the gap between algorithmic intelligence and strategic decision-making, providing marketing managers with a scalable, adaptive, and behaviorally attuned decision support tool capable of thriving in complex, data-rich environments. As digital marketing continues to evolve toward hyper-personalization and ecological consciousness, such integrative models will become indispensable for aligning technological capabilities with customer-centric and sustainability-driven imperatives.
Author Contributions
Conceptualization, H.N. and Z.Y.; methodology, H.N.; software, H.N.; validation, H.N. and Z.Y.; formal analysis, H.N.; resources, H.N.; data curation, H.N.; writing—original draft preparation, H.N.; writing—review and editing, Z.Y.; visualization, H.N.; project administration, Z.Y.; funding acquisition, Z.Y. All authors have read and agreed to the published version of the manuscript.
Funding
This paper is financially supported by The Research program of the University of National and World Economy, Sofia.
Institutional Review Board Statement
Not applicable. This research did not involve any studies with human participants or animals performed by the author.
Informed Consent Statement
Not applicable. This study does not involve any human participants from whom informed consent would be required.
Data Availability Statement
The dataset associated with the manuscript has been uploaded and is publicly accessible via Kaggle: https://www.kaggle.com/datasets/hamednozari/behavior-aware-marketing-decisions (accessed on 25 September 2026). The same dataset has also been submitted to Harvard Dataverse and has been assigned the following https://doi.org/10.7910/DVN/SYNMXG.
Acknowledgments
The authors declare that no generative AI tools (such as ChatGPT, Bard, or similar technologies) were used in the writing, editing, data analysis, or interpretation of this manuscript. All content, including conceptual development, literature review, modeling, result interpretation, and textual expression, was entirely conceived, authored, and revised by the listed human authors. Where AI-assisted tools (e.g., grammar correction, reference formatting, or code debugging) may have been used in a supporting role, such tools did not contribute to intellectual content or authorship decisions.
Conflicts of Interest
The authors declare no conflicts of interest.
References
- Yerpude, S.; Singhal, T.K. “Custolytics”: Internet of Things-based customer analytics aiding customer engagement strategy in emerging markets—An empirical research. Int. J. Emerg. Mark. 2021, 16, 92–112. [Google Scholar] [CrossRef] [Scilit]
- Vermesan, O.; Bröring, A.; Tragos, E.; Serrano, M.; Bacciu, D.; Chessa, S.; Gallicchio, C.; Micheli, A.; Dragone, M.; Saffiotti, A.; et al. Internet of Robotic Things—Converging sensing/actuating, hyperconnectivity, artificial intelligence and IoT platforms. In Cognitive Hyperconnected Digital Transformation: Internet of Things Intelligence Evolution; Vermesan, O., Bacquet, J., Eds.; River Publishers: Gistrup, Denmark, 2017; pp. 97–155. [Google Scholar] [CrossRef] [Scilit]
- Khan, Y.; Su’ud, M.B.M.; Alam, M.M.; Ahmad, S.F.; Ahmad, A.Y.A.B.; Khan, N. Application of Internet of Things (IoT) in sustainable supply chain management. Sustainability 2023, 15, 694. [Google Scholar] [CrossRef] [Scilit]
- da Silva, A.; Cardoso, A.J.M. Enhancing customer satisfaction through IIoT-enabled coopetition: Strategic insights and impacts. Internet Things 2024, 28, 101408. [Google Scholar] [CrossRef] [Scilit]
- Nozari, H.; Szmelter-Jarosz, A.; Ghahremani-Nahr, J. The ideas of sustainable and green marketing based on the Internet of Everything—The case of the dairy industry. Future Internet 2021, 13, 266. [Google Scholar] [CrossRef] [Scilit]
- Malik, S. Data-driven decision-making: Leveraging the IoT for real-time sustainability in organizational behavior. Sustainability 2024, 16, 6302. [Google Scholar] [CrossRef] [Scilit]
- Upadhyay, U.; Kumar, A.; Sharma, G.; Sharma, S.; Arya, V.; Panigrahi, P.K.; Gupta, B.B. A systematic data-driven approach for targeted marketing in enterprise information system. Enterp. Inf. Syst. 2024, 18, 2356770. [Google Scholar] [CrossRef] [Scilit]
- Eslami, E.; Razi, N.; Lonbani, M.; Rezazadeh, J. Unveiling IoT customer behaviour: Segmentation and insights for enhanced IoT-CRM strategies: A real case study. Sensors 2024, 24, 1050. [Google Scholar] [CrossRef] [Scilit] [PubMed]
- Bocken, N.; Ingemarsdotter, E.; Gonzalez, D. Designing sustainable business models: Exploring IoT-enabled strategies to drive sustainable consumption. In Sustainable Business Models: Innovation, Implementation and Success; Springer: Berlin/Heidelberg, Germany, 2019; pp. 61–88. [Google Scholar] [CrossRef] [Scilit]
- Najafi, S.E.; Nozari, H.; Edalatpanah, S.A. Investigating the key parameters affecting sustainable IoT-based marketing. In Computational Intelligence Methodologies Applied to Sustainable Development Goals; Springer: Berlin/Heidelberg, Germany, 2022; pp. 51–61. [Google Scholar] [CrossRef] [Scilit]
- Suresh, C.; Nymeesha, V.; Prasath, R.; Lokeshwaran, K.; Raju, K.R.; Boopathi, S. AI-driven energy forecasting, optimization, and demand side management for consumer engagement. In Intelligent Solutions for Sustainable Power Grids; IGI Global Scientific Publishing: Hershey, PA, USA, 2024; pp. 112–131. [Google Scholar] [CrossRef] [Scilit]
- Movahed, A.B.; Movahed, A.B.; Nozari, H. Opportunities and challenges of Marketing 5.0. In Smart and Sustainable Interactive Marketing; Irani, H.R., Nozari, H., Eds.; IGI Global Scientific Publishing: Hershey, PA, USA, 2024; pp. 1–21. [Google Scholar] [CrossRef] [Scilit]
- Markus, M.L.; Silver, M.S. A foundation for the study of IT effects: A new look at DeSanctis and Poole’s concepts of structural features and spirit. J. Assoc. Inf. Syst. 2008, 9, 609–632. [Google Scholar] [CrossRef] [Scilit]
- DeLone, W.H.; McLean, E.R. The DeLone and McLean model of information systems success: A ten-year update. J. Manag. Inf. Syst. 2008, 19, 9–30. [Google Scholar] [CrossRef] [Scilit]
- Teece, D.J.; Pisano, G.; Shuen, A. Dynamic capabilities and strategic management. Strateg. Manag. J. 1997, 18, 509–533. [Google Scholar] [CrossRef] [Scilit]
- Hokmabadi, H.; Rezvani, S.M.H.S.; de Matos, C.A. Business resilience for small and medium enterprises and startups by digital transformation and the role of marketing capabilities—A systematic review. Systems 2024, 12, 220. [Google Scholar] [CrossRef] [Scilit]
- Mejjaouli, S. Internet of Things based decision support system for green logistics. Sustainability 2022, 14, 14756. [Google Scholar] [CrossRef] [Scilit]
- Jayadeva, S.M.; Krishnam, N.P.; Mannar, B.R.; Dabral, A.P.; Buddhi, D.; Garg, N. An investigation of IoT-based consumer analytics to assist consumer engagement strategies in evolving markets. In 2023 3rd International Conference on Advance Computing and Innovative Technologies in Engineering (ICACITE); IEEE: New York, NY, USA, 2023; pp. 487–491. [Google Scholar] [CrossRef] [Scilit]
- Revathi, S.; Ansari, A.; Jacophine Susmi, S.; Madhavi, M.; Gunavathie, M.A.; Sudhakar, M. Integrating machine learning-IoT technologies integration for building sustainable digital ecosystems. In Multidisciplinary Applications of Extended Reality for Human Experience; IGI Global Scientific Publishing: Hershey, PA, USA, 2024; pp. 259–291. [Google Scholar] [CrossRef] [Scilit]
- Movahed, A.B.; Movahed, A.B.; Nozari, H. Marketing 6.0 conceptualization. In Advanced Businesses in Industry 6.0; Oskounejad, M.M., Nozari, H., Eds.; IGI Global Scientific Publishing: Hershey, PA, USA, 2024; pp. 15–31. [Google Scholar] [CrossRef] [Scilit]
- Paiola, M.; Schiavone, F.; Grandinetti, R.; Chen, J. Digital servitization and sustainability through networking: Some evidences from IoT-based business models. J. Bus. Res. 2021, 132, 507–516. [Google Scholar] [CrossRef] [Scilit]
- Nozari, H.; Rahmaty, M.; Szmelter-Jarosz, A. A framework for AIoT-based smart sustainable marketing system. In Artificial Intelligence of Things for Achieving Sustainable Development Goals; Springer: Berlin/Heidelberg, Germany, 2024; pp. 255–271. [Google Scholar] [CrossRef] [Scilit]
- Kansal, S.; Singh, N. AI-driven real-time experimentation platforms for telecom customer engagement optimization. Int. J. All Res. Educ. Sci. Methods 2024, 12, 4312–4329. [Google Scholar]
- Taneja, A.; Rani, S. Robust resource control mechanism for connected support to IoT-based sustainable consumer electronics for Industry 5.0. IEEE Trans. Consum. Electron. 2024, 70, 1463–1470. [Google Scholar] [CrossRef] [Scilit]
- Dahmani, S. Energy optimization and smart grids: IoT-based smart grid solution and smart grids applications. In Harnessing High-Performance Computing and AI for Environmental Sustainability; IGI Global Scientific Publishing: Hershey, PA, USA, 2024; pp. 278–304. [Google Scholar] [CrossRef] [Scilit]
- Chae, I.; Bruno, H.A.; Feinberg, F.M. Wearout or weariness? Measuring potential negative consequences of online ad volume and placement on website visits. J. Mark. Res. 2019, 56, 57–75. [Google Scholar] [CrossRef] [Scilit]
- Jankowski, J.; Kazienko, P.; Wątróbski, J.; Lewandowska, A.; Ziemba, P.; Zioło, M. Fuzzy multi-objective modeling of effectiveness and user experience in online advertising. Expert Syst. Appl. 2016, 65, 315–331. [Google Scholar] [CrossRef] [Scilit]
- Pandey, A.; Rana, R.; Yadav, M.; Hung, T.H. Enhancing customer experience through geomarketing and IoT. In Digital Transformation Initiatives for Agile Marketing; IGI Global Scientific Publishing: Hershey, PA, USA, 2025; pp. 187–218. [Google Scholar] [CrossRef] [Scilit]
- Goodarzi, F.; Abdollahzadeh, V.; Zeinalnezhad, M. An integrated multi-criteria decision-making and multi-objective optimization framework for green supplier evaluation and optimal order allocation under uncertainty. Decis. Anal. J. 2022, 4, 100087. [Google Scholar] [CrossRef] [Scilit]
- Zadeh, L.A. Fuzzy sets. Inf. Control. 1965, 8, 338–353. [Google Scholar] [CrossRef] [Scilit]
- Tarnanidis, T.; Manda, V.K.; Sousa, B.B.; Vlachopoulou, M.; Papachristou, E. Marketing complexity of smart consumer products to global millennial segments. In Diversity and Inclusion-Driven Marketing for Multicultural Marketplaces; Tarnanidis, T., Sousa, B., Vlachopoulou, M., Papachristou, E., Kittu Manda, V., Eds.; IGI Global Scientific Publishing: Hershey, PA, USA, 2026; pp. 1–16. [Google Scholar] [CrossRef] [Scilit]
- Rosário, A.T.; Raimundo, R.J. The integration of AI and IoT in marketing: A systematic literature review. Electronics 2025, 14, 1854. [Google Scholar] [CrossRef] [Scilit]
- Peltier, J.W.; Dahl, A.J.; Drury, L.; Khan, T.; Wang, C. Where’s the interactive marketing in the interactive marketing literature? A state-of-the-art review and research agenda. J. Res. Interact. Mark. 2026, 20, 397–439. [Google Scholar] [CrossRef] [Scilit]
- Alam, M.F.B.; Bari, A.B.M.M.; Tushar, S.R.; Kabir, K.M.A. An interval-valued Pythagorean fuzzy approach to mitigate traffic congestion in densely populated cities with implications for sustainability. Decis. Anal. J. 2025, 15, 100558. [Google Scholar] [CrossRef] [Scilit]
- Vishnoi, S.K.; Sharma, S.; Mathur, S.; Virmani, N.; Singh, R.K.; Köles, B. Strategic framework to analyze critical success factors of Marketing 4.0 operations: Evidence from an emerging economy. Int. J. Innov. Sci. 2026, 18, 803–833. [Google Scholar] [CrossRef] [Scilit]
- Razdar, M.; Adibi, M.A.; Haleh, H. An optimization of multi-level multi-objective cloud production systems with meta-heuristic algorithms. Decis. Anal. J. 2025, 14, 100540. [Google Scholar] [CrossRef] [Scilit]
- Akhila, T.S.; Presskila, X.A.; Kalyanakumar, P.; Krishnan, R.S.; SahanaPreethi, M.; Sundaravadivel, P. Optimizing the shopping experience through smart trolleys with integrated deep learning techniques. In 2024 4th International Conference on Sustainable Expert Systems (ICSES); IEEE: New York, NY, USA, 2024; pp. 1885–1892. [Google Scholar] [CrossRef] [Scilit]
- Yordanova, Z. Barriers to organizations to adopt digital transformation for driving eco-innovation and sustainable performance. In Optimization, Learning Algorithms and Applications; Springer: Berlin/Heidelberg, Germany, 2024; pp. 162–171. [Google Scholar] [CrossRef] [Scilit]
- Kousar, S.; Alvi, A.; Kausar, N.; Garg, H.; Kadry, S.; Kim, J. Fuzzy multi-objective optimization model to design a sustainable closed-loop manufacturing system. PeerJ Comput. Sci. 2025, 11, e2591. [Google Scholar] [CrossRef] [Scilit] [PubMed]
- Carlile, P.R. A pragmatic view of knowledge and boundaries: Boundary objects in new product development. Organ. Sci. 2002, 13, 442–455. [Google Scholar] [CrossRef] [Scilit]
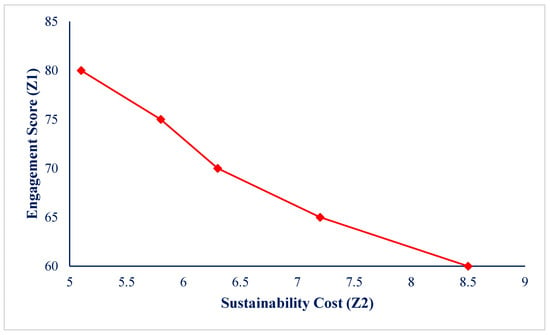
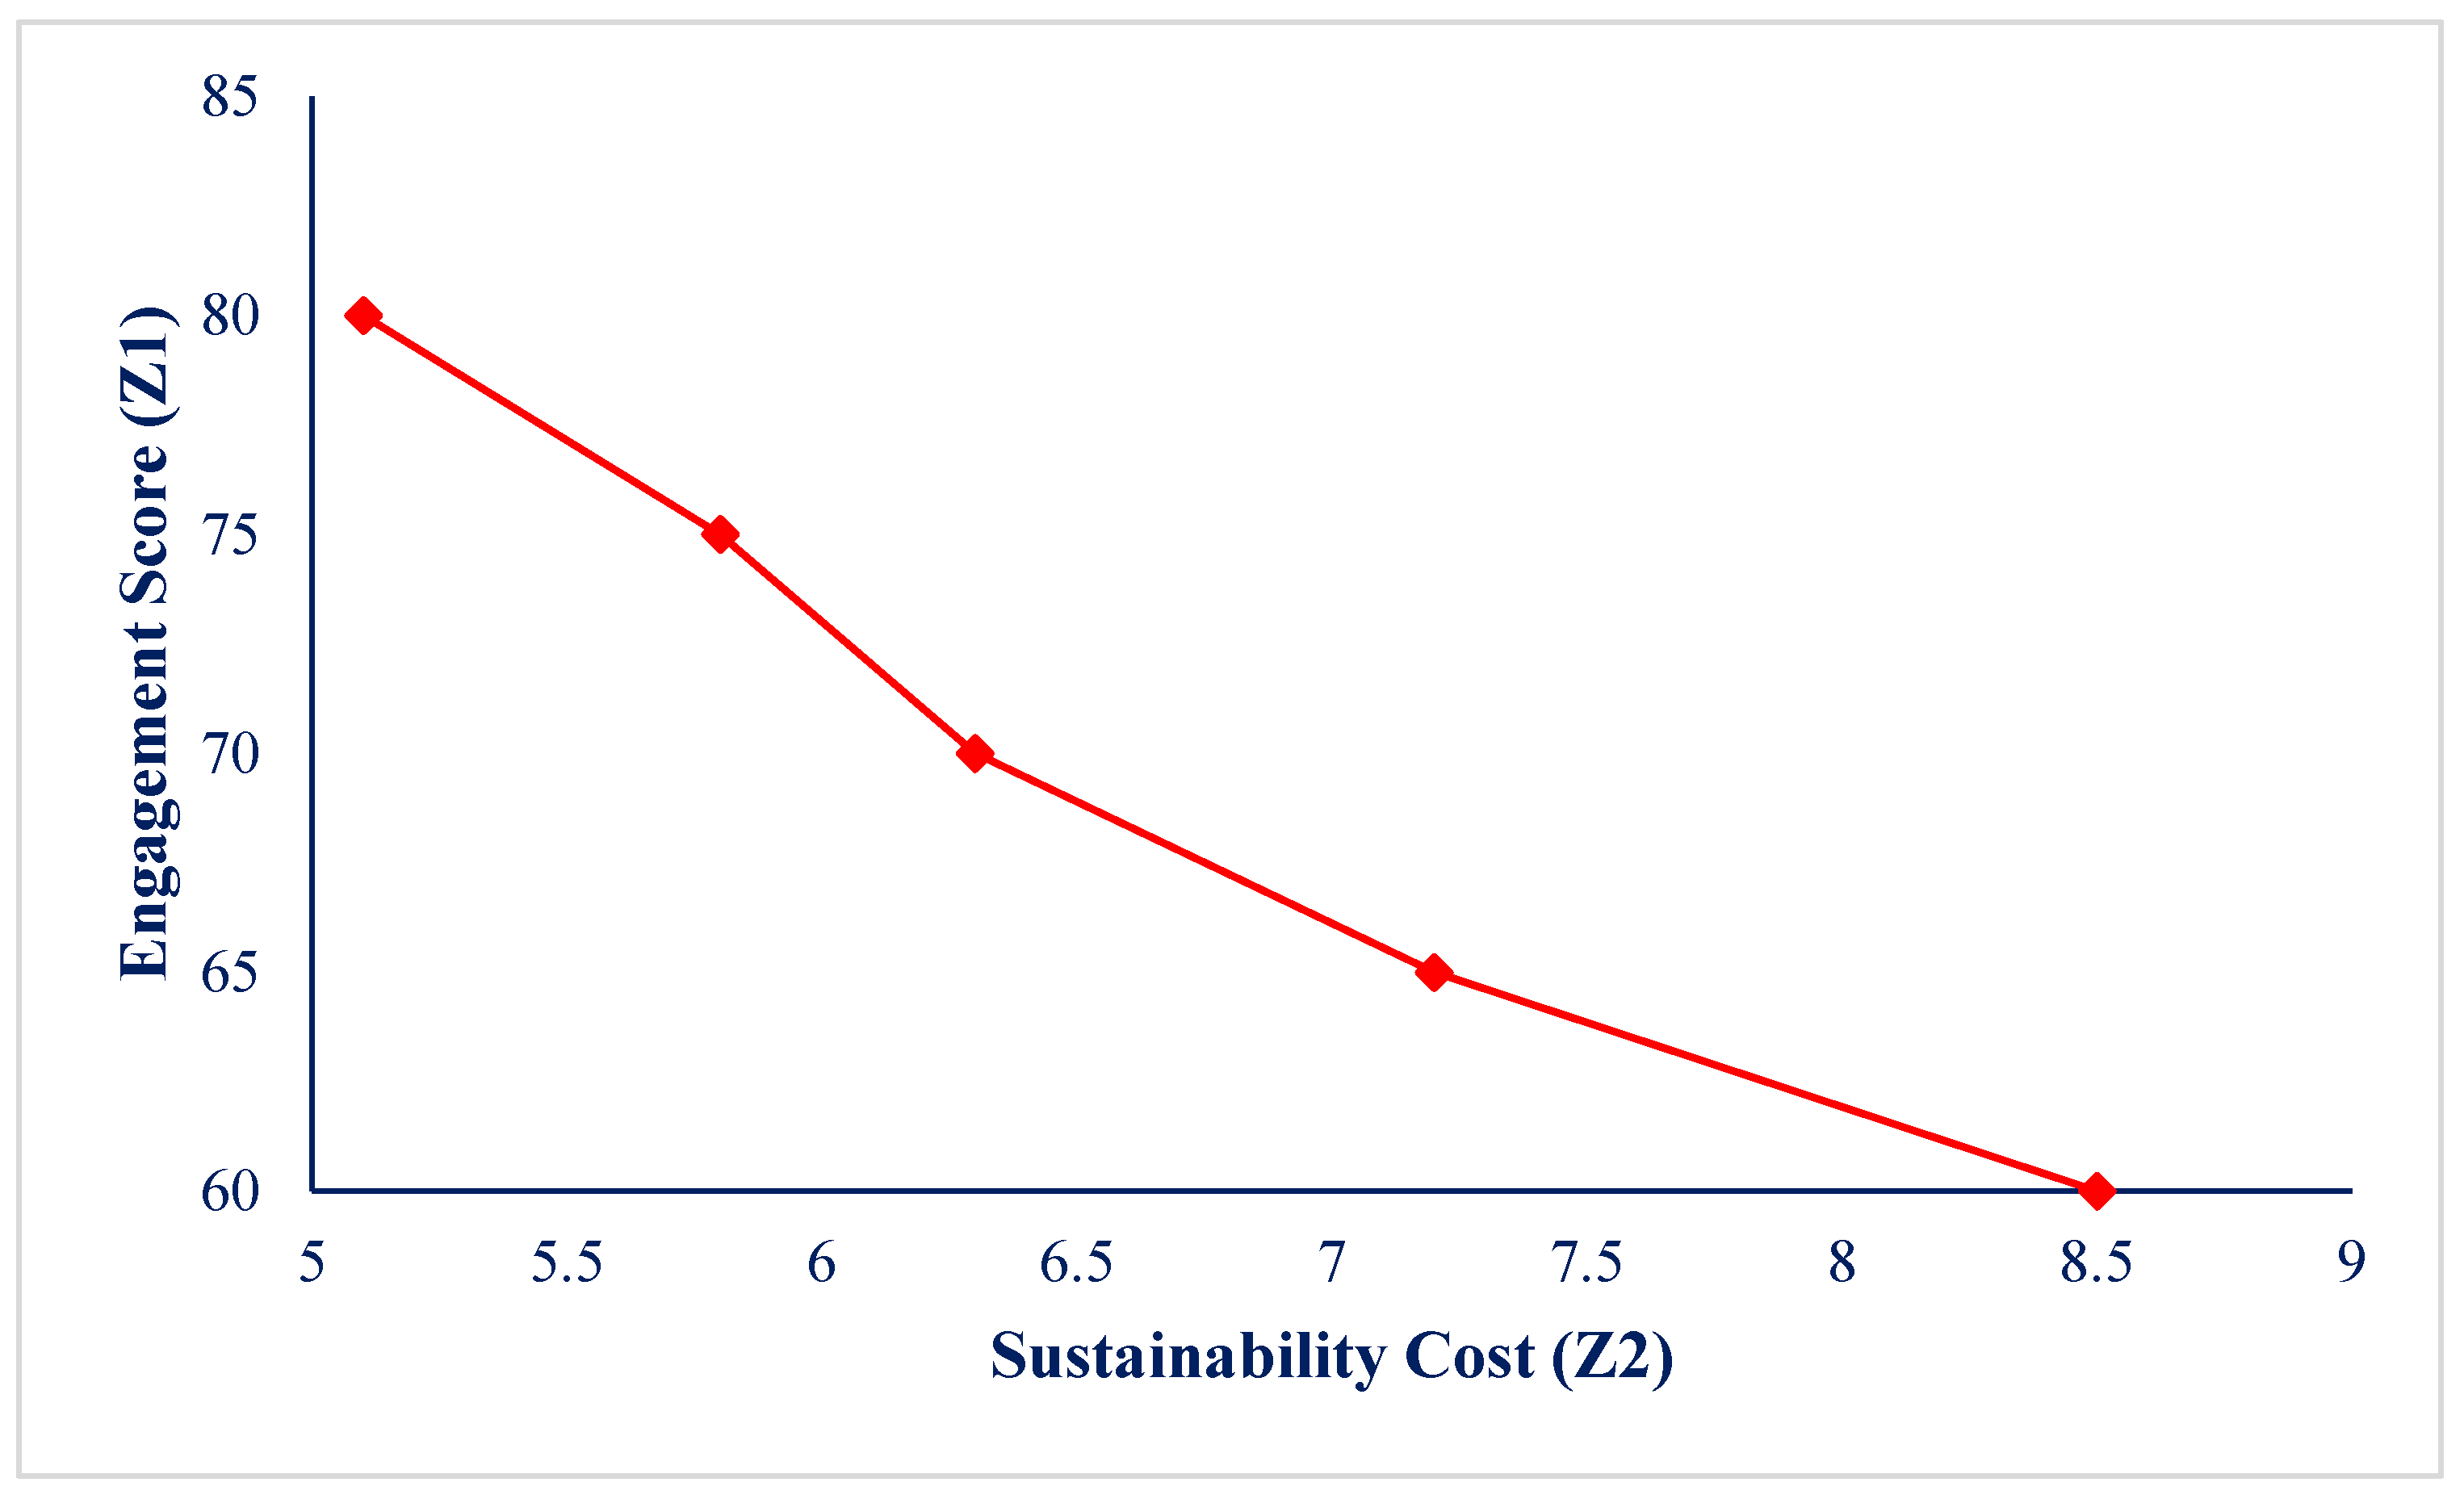
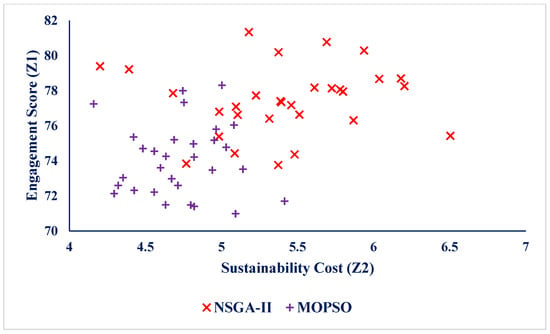
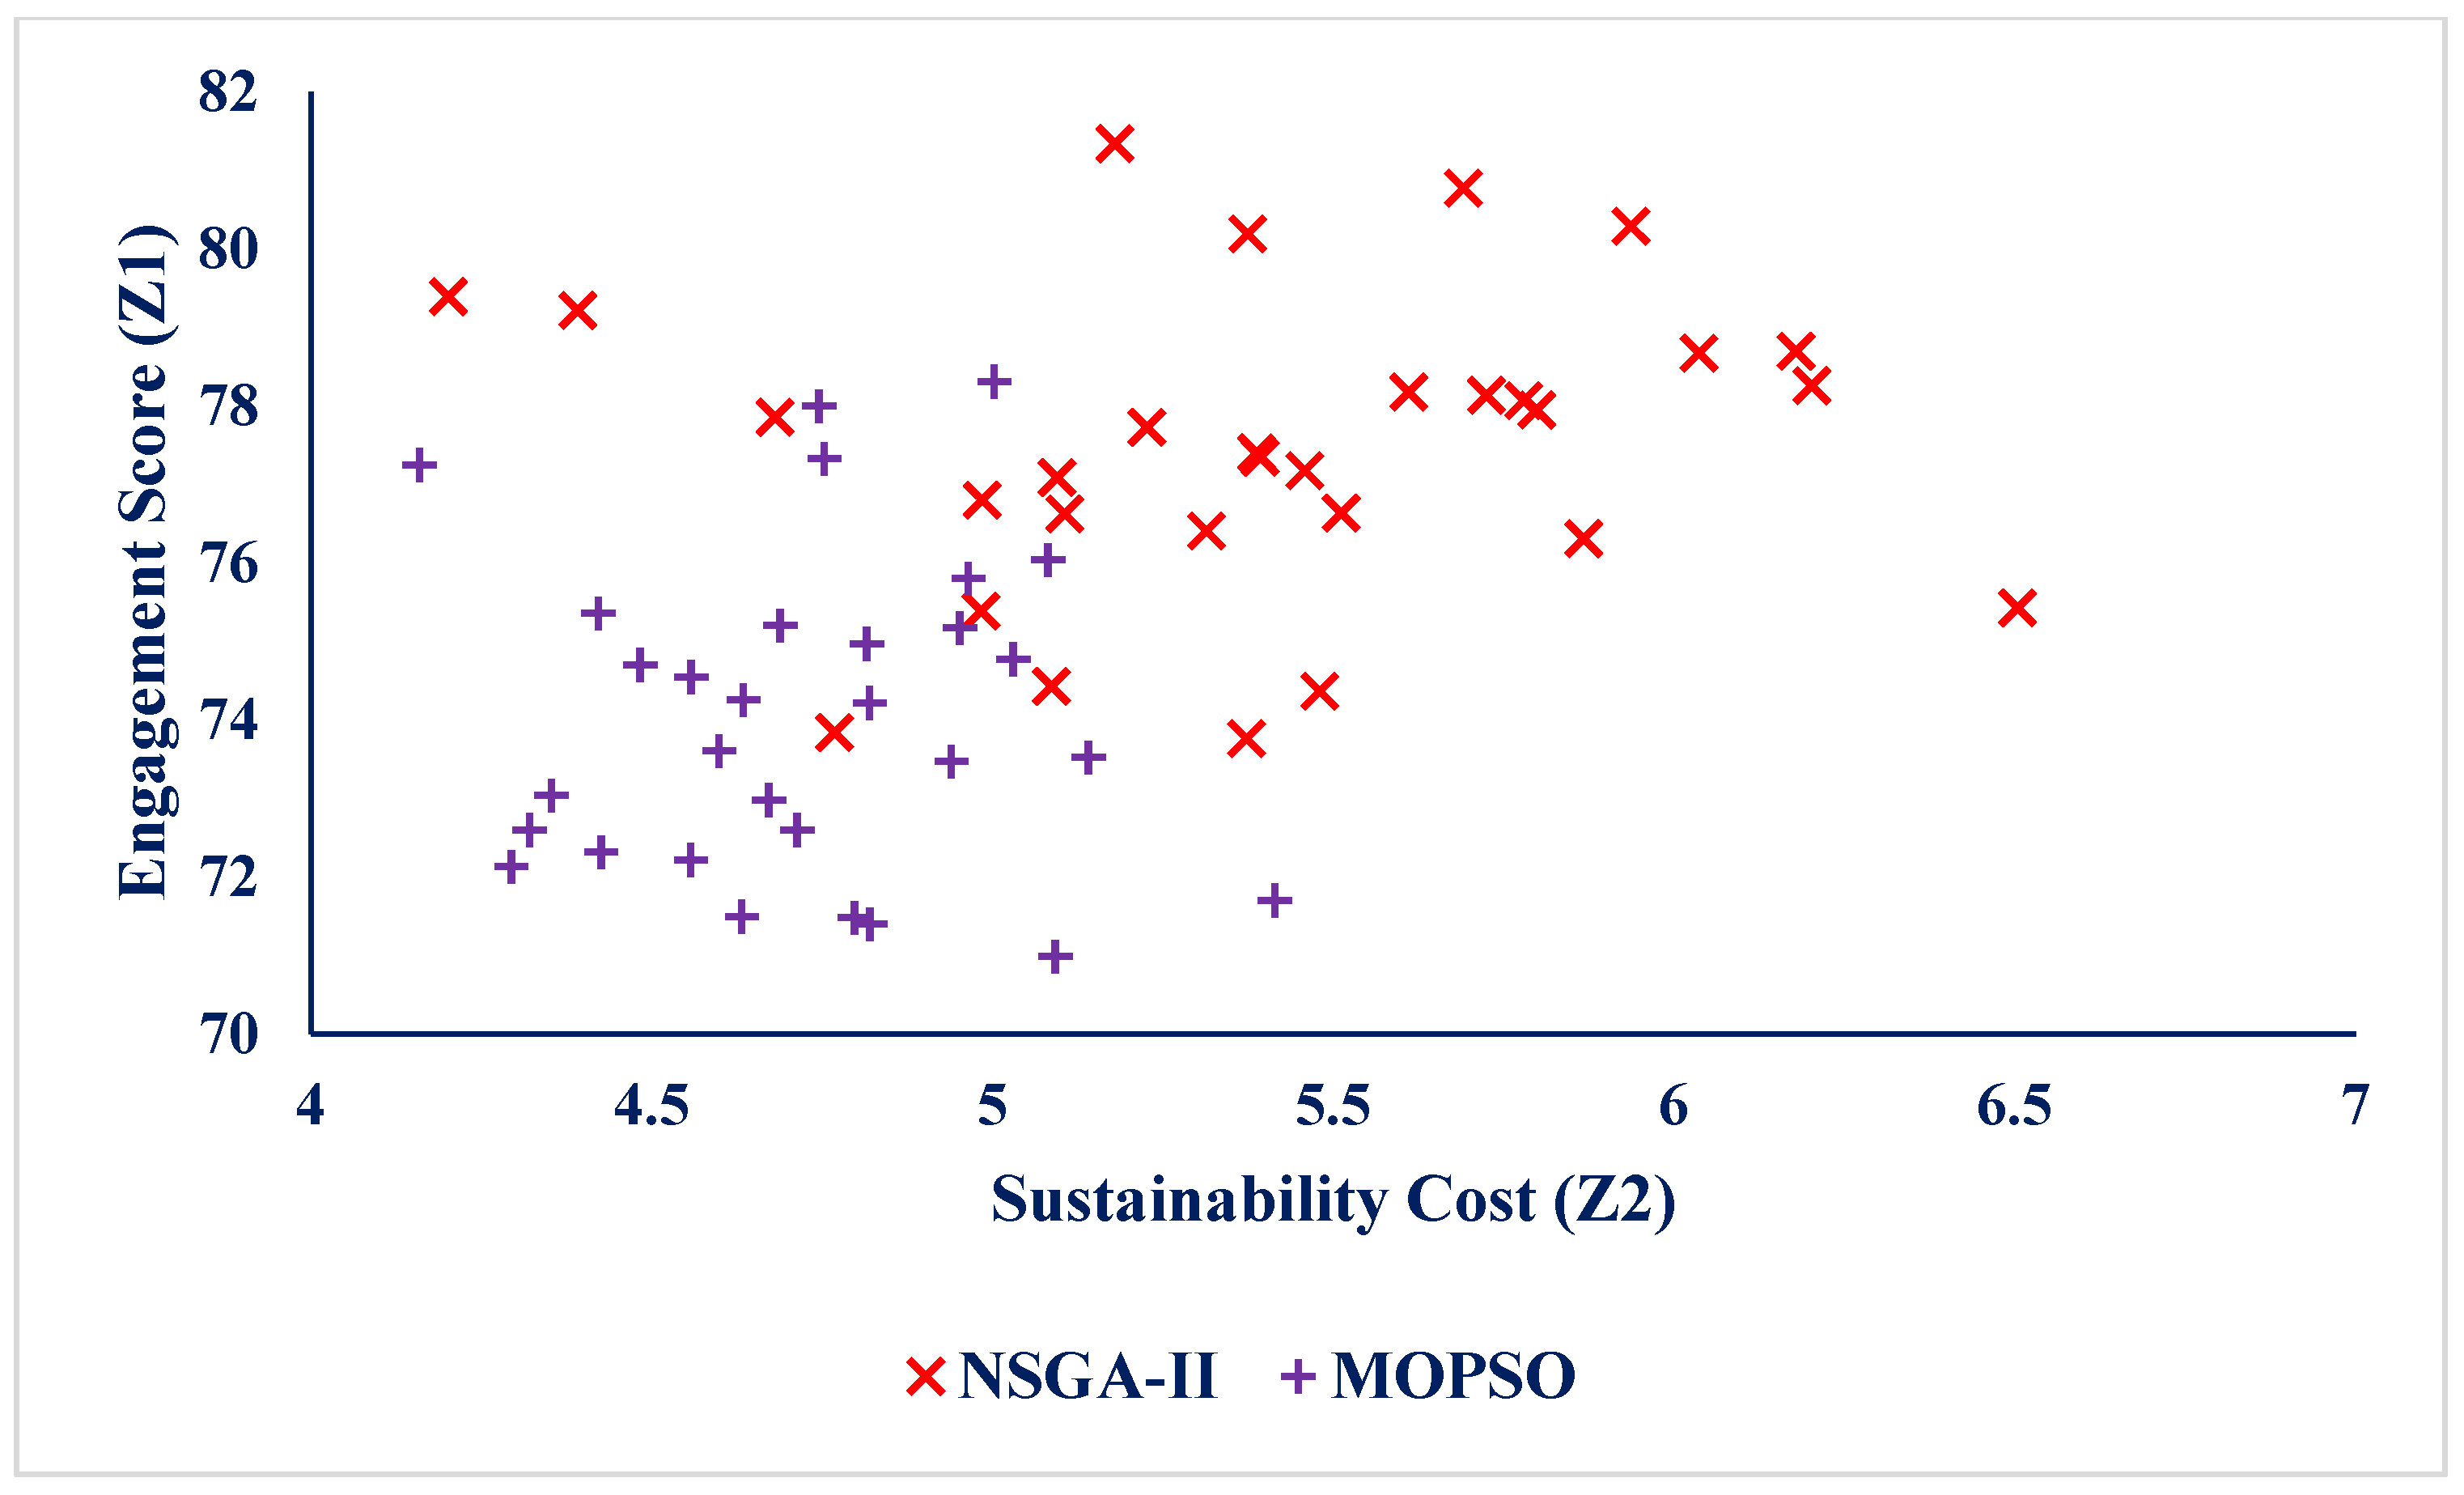
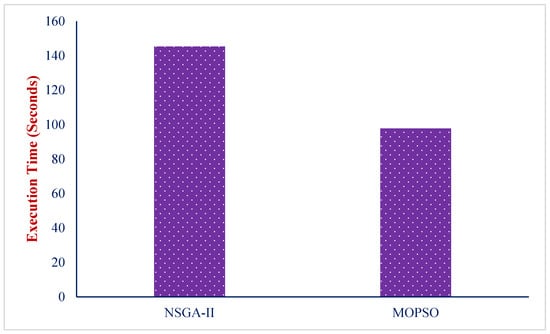
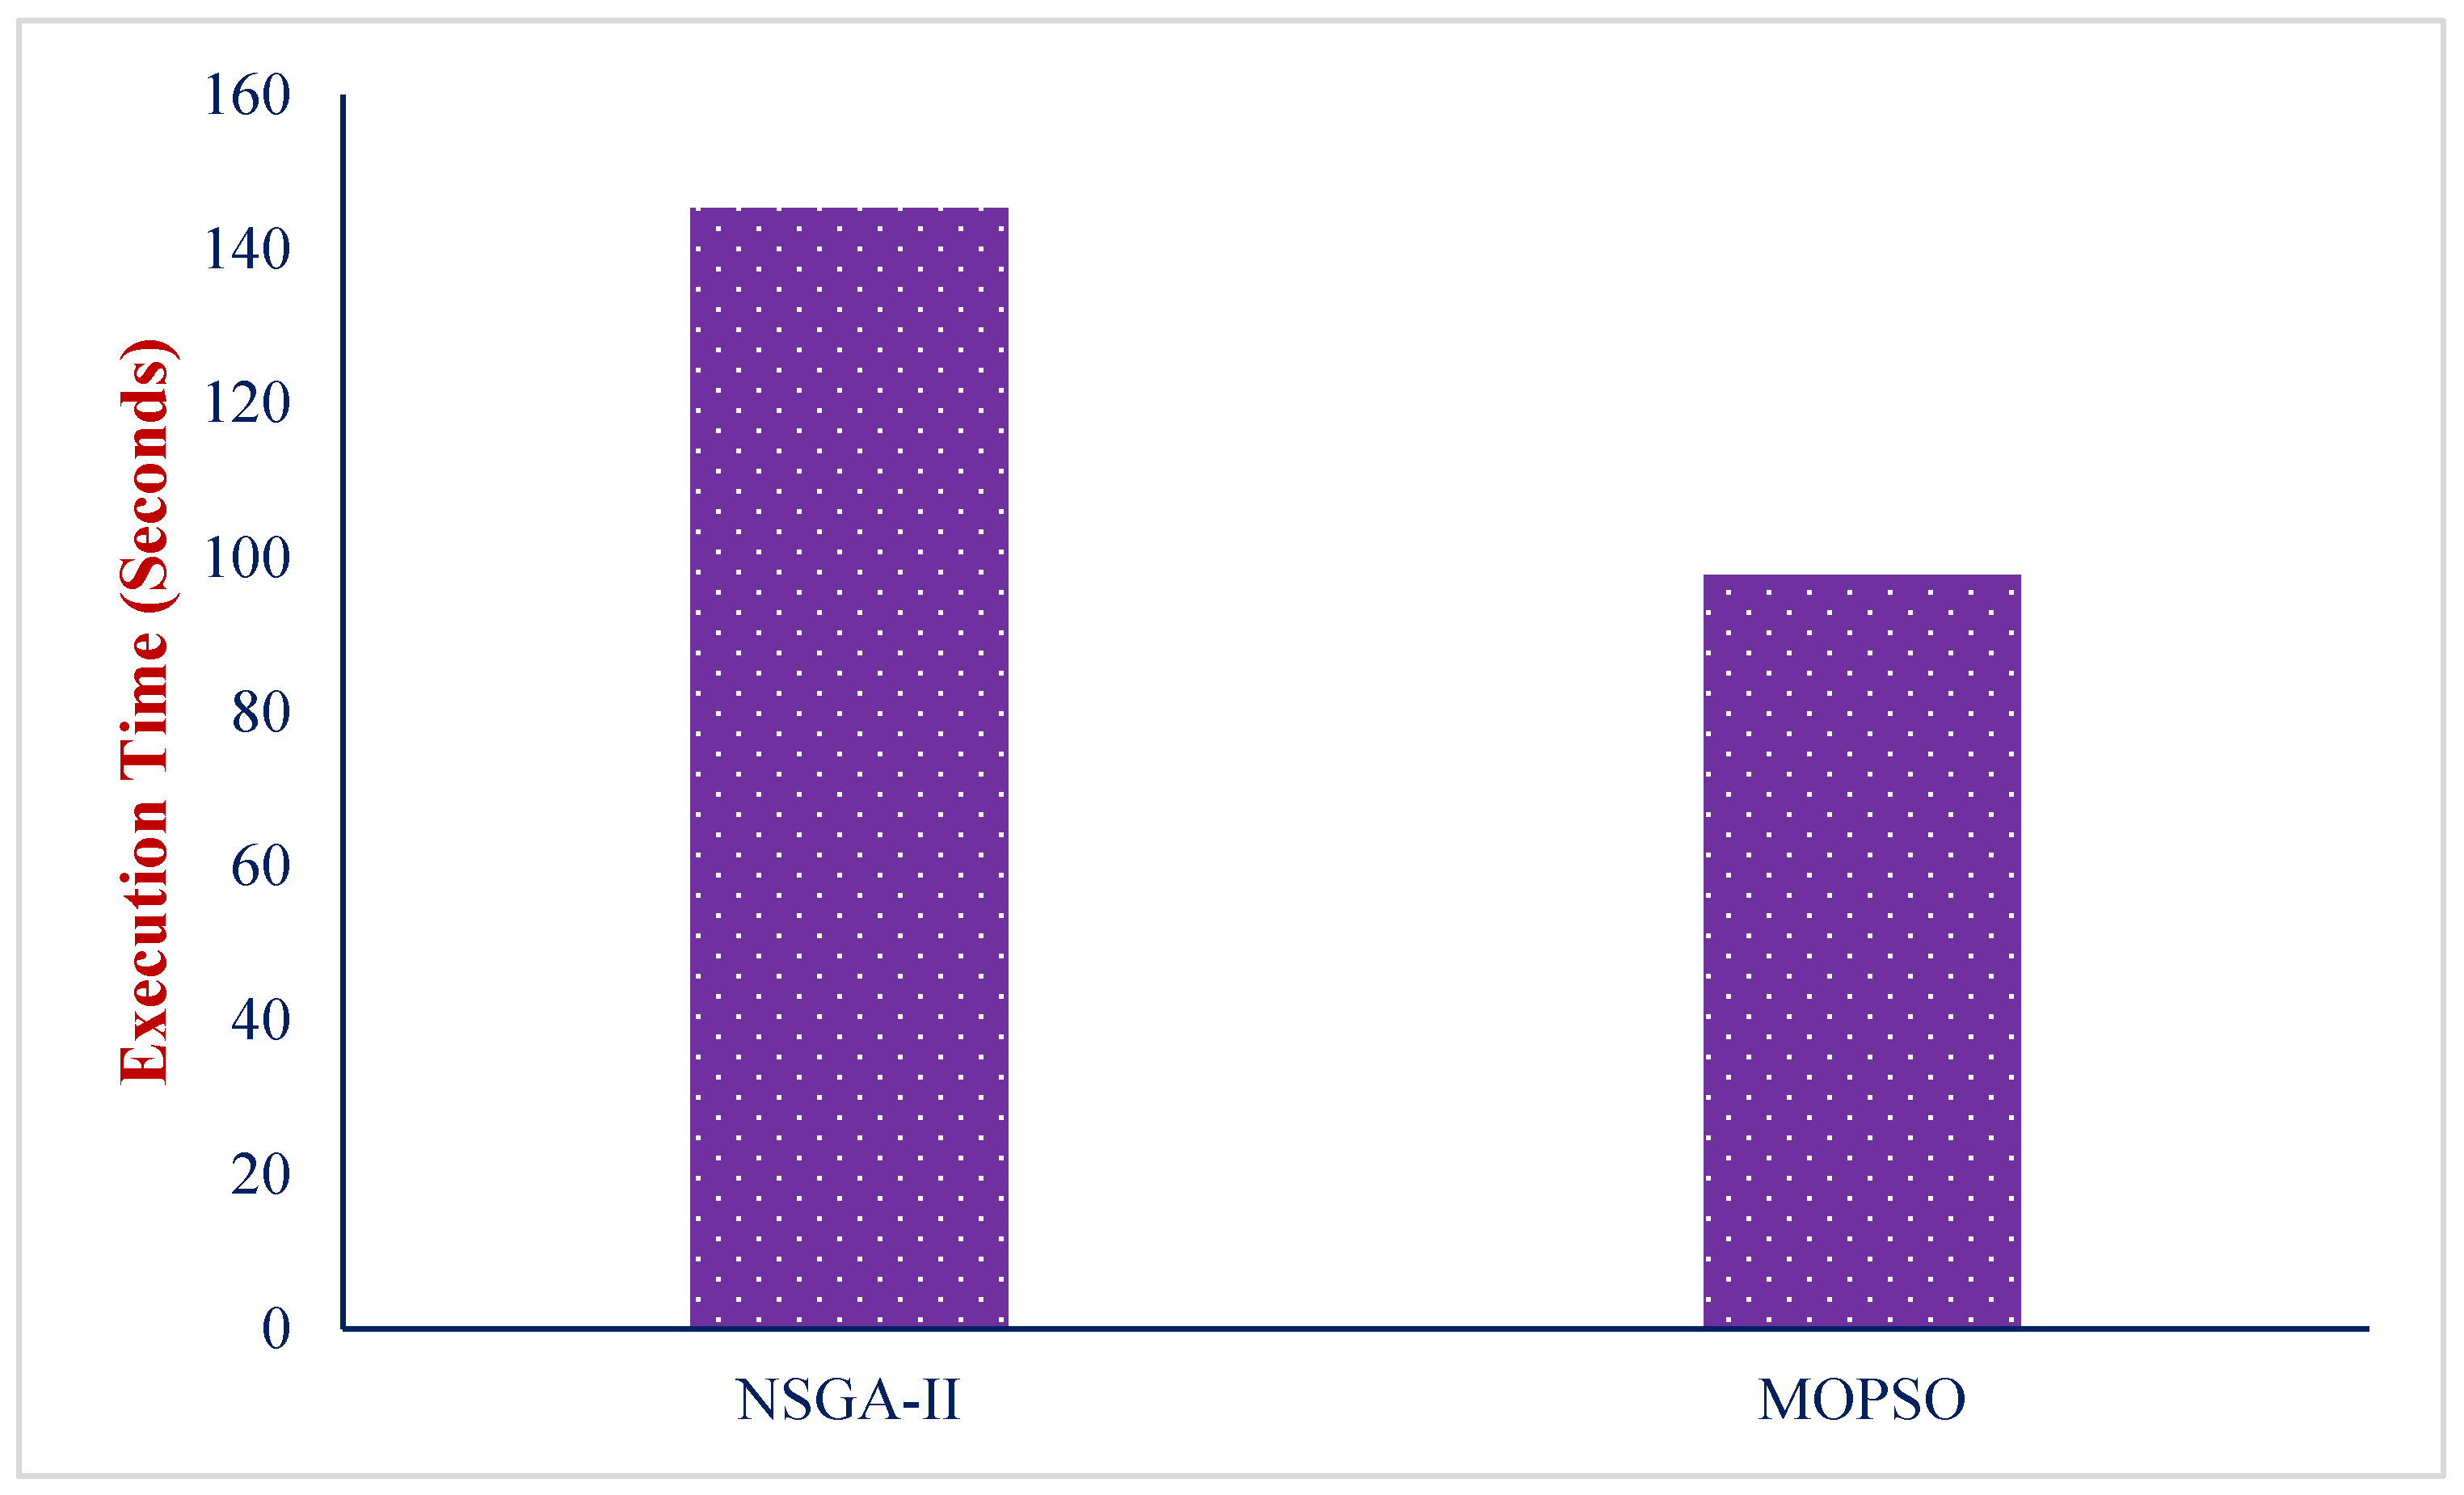
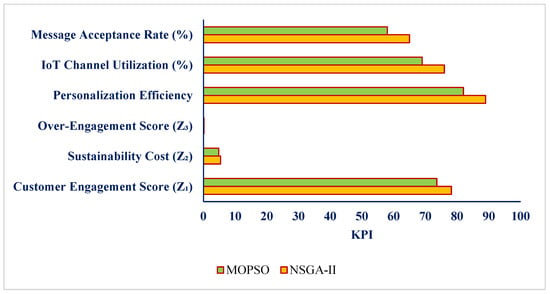
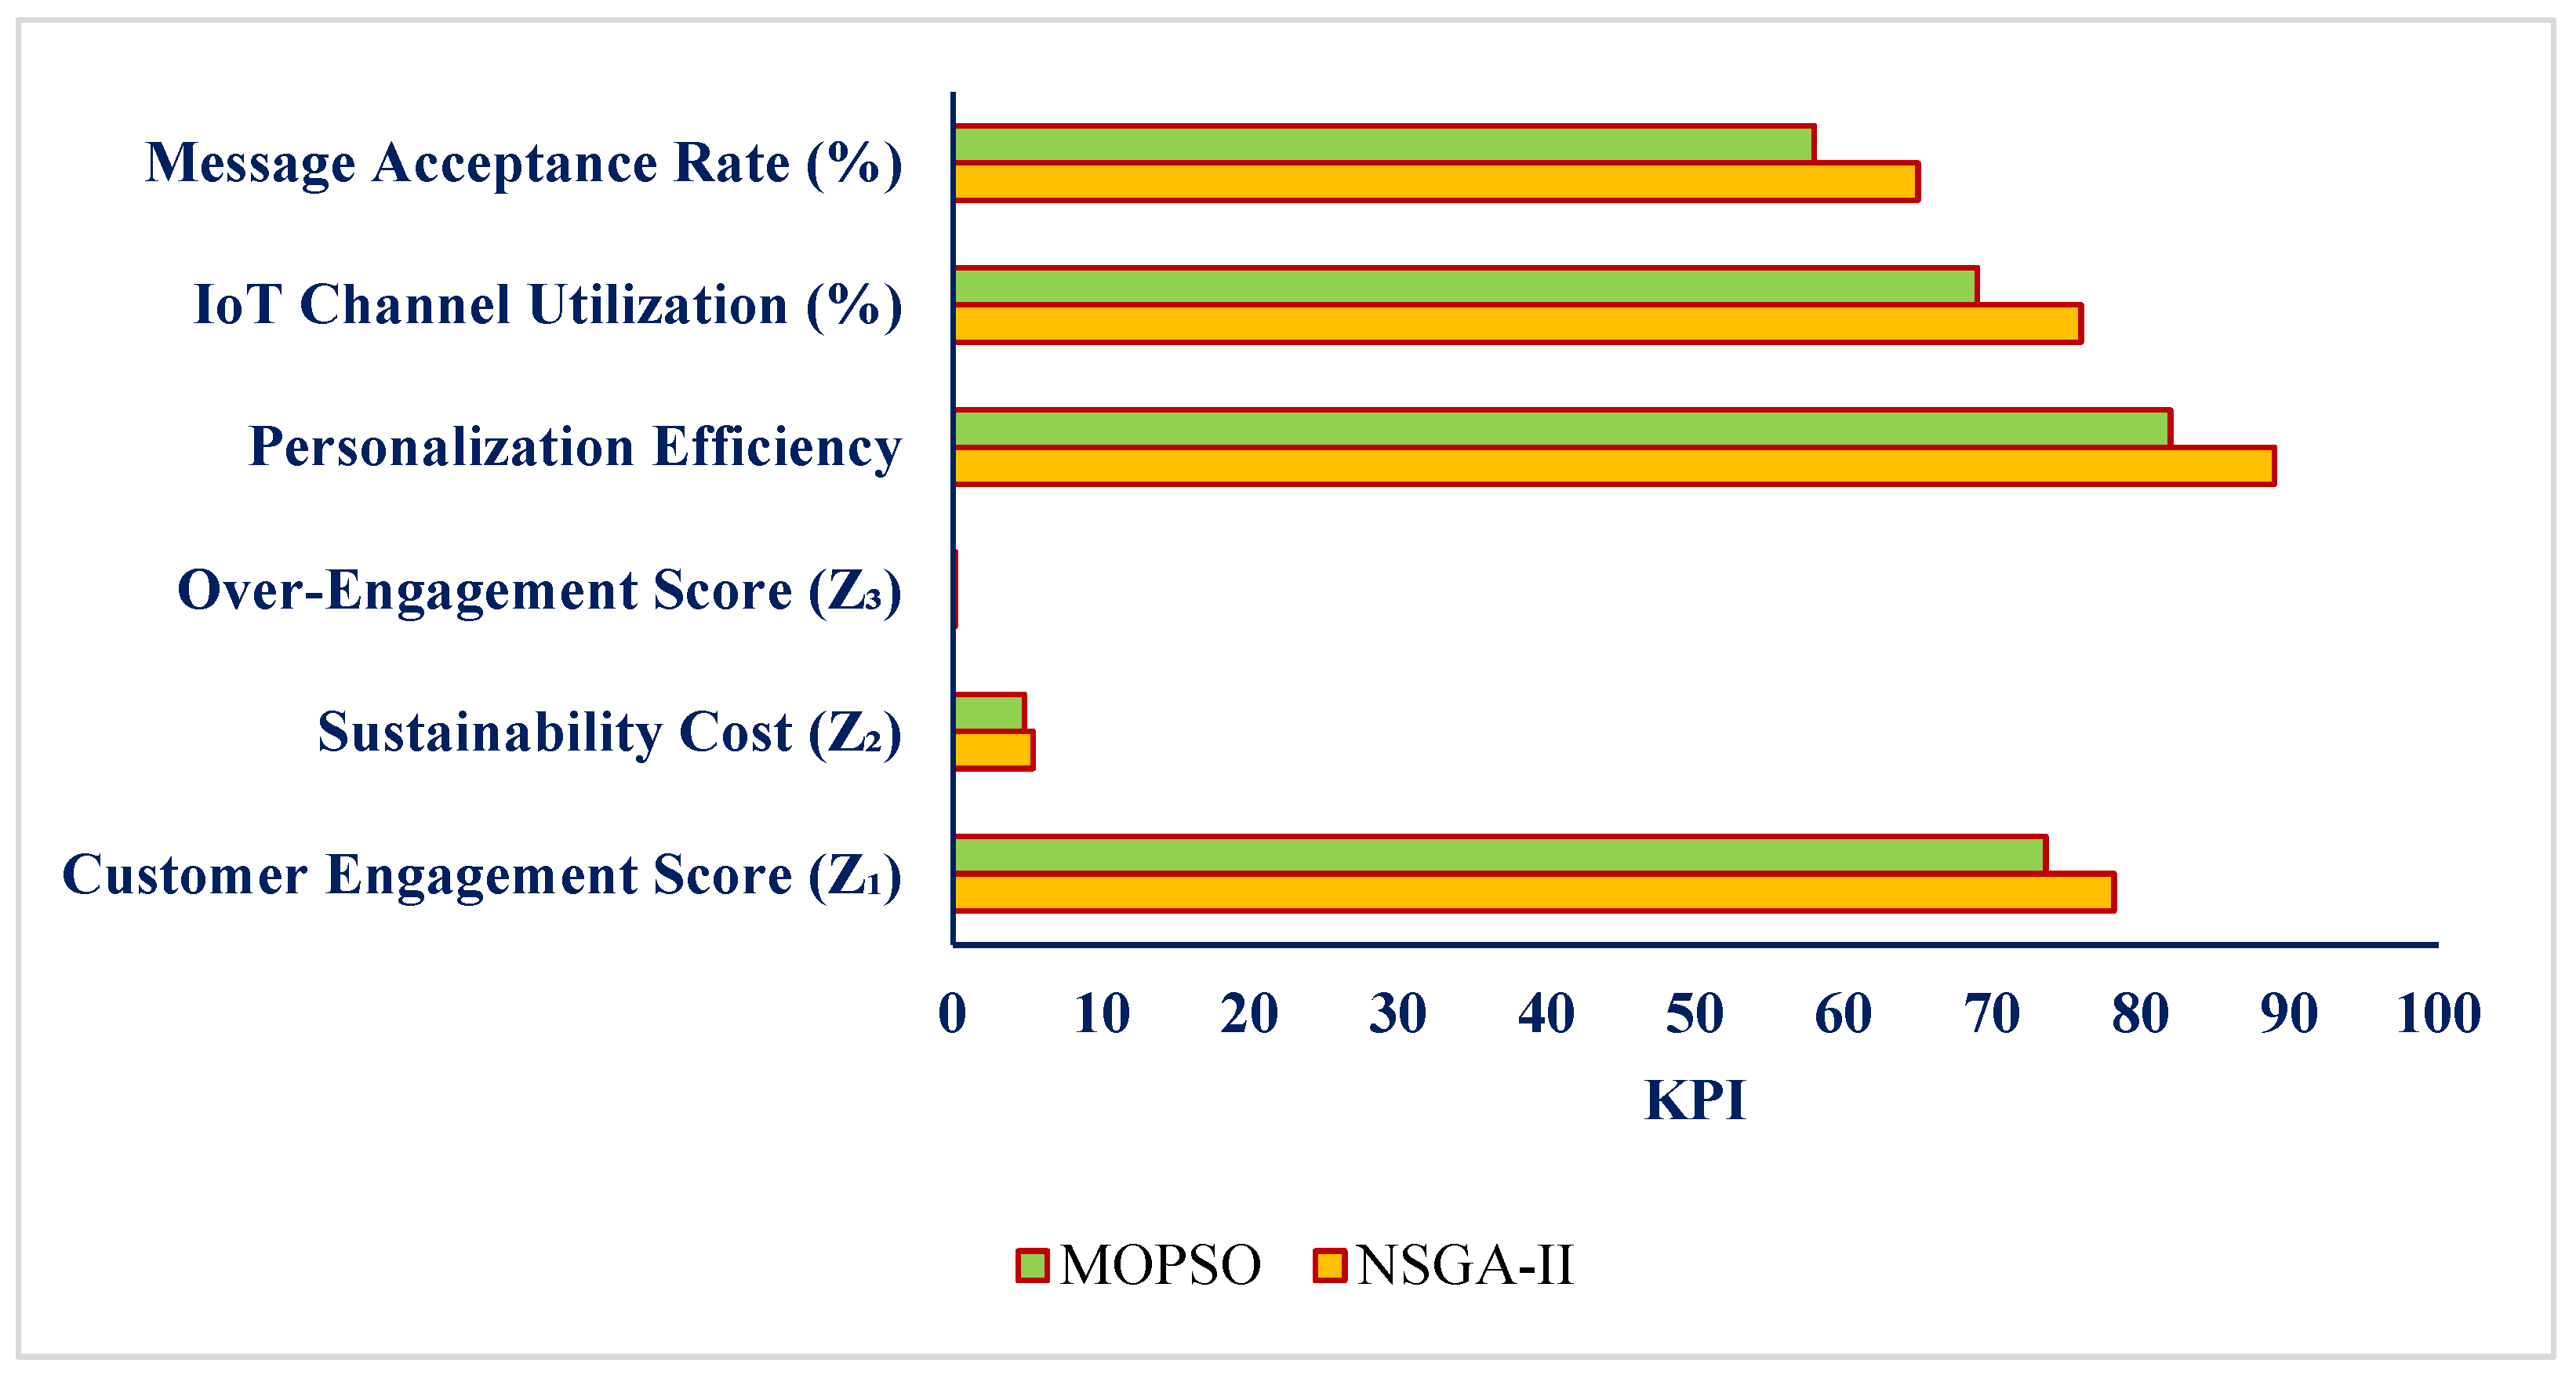
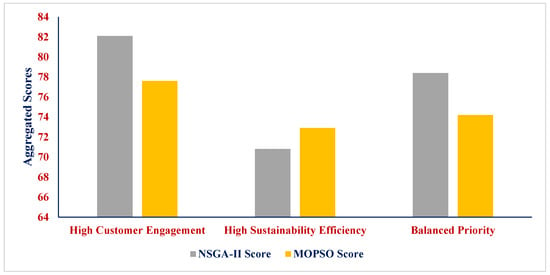
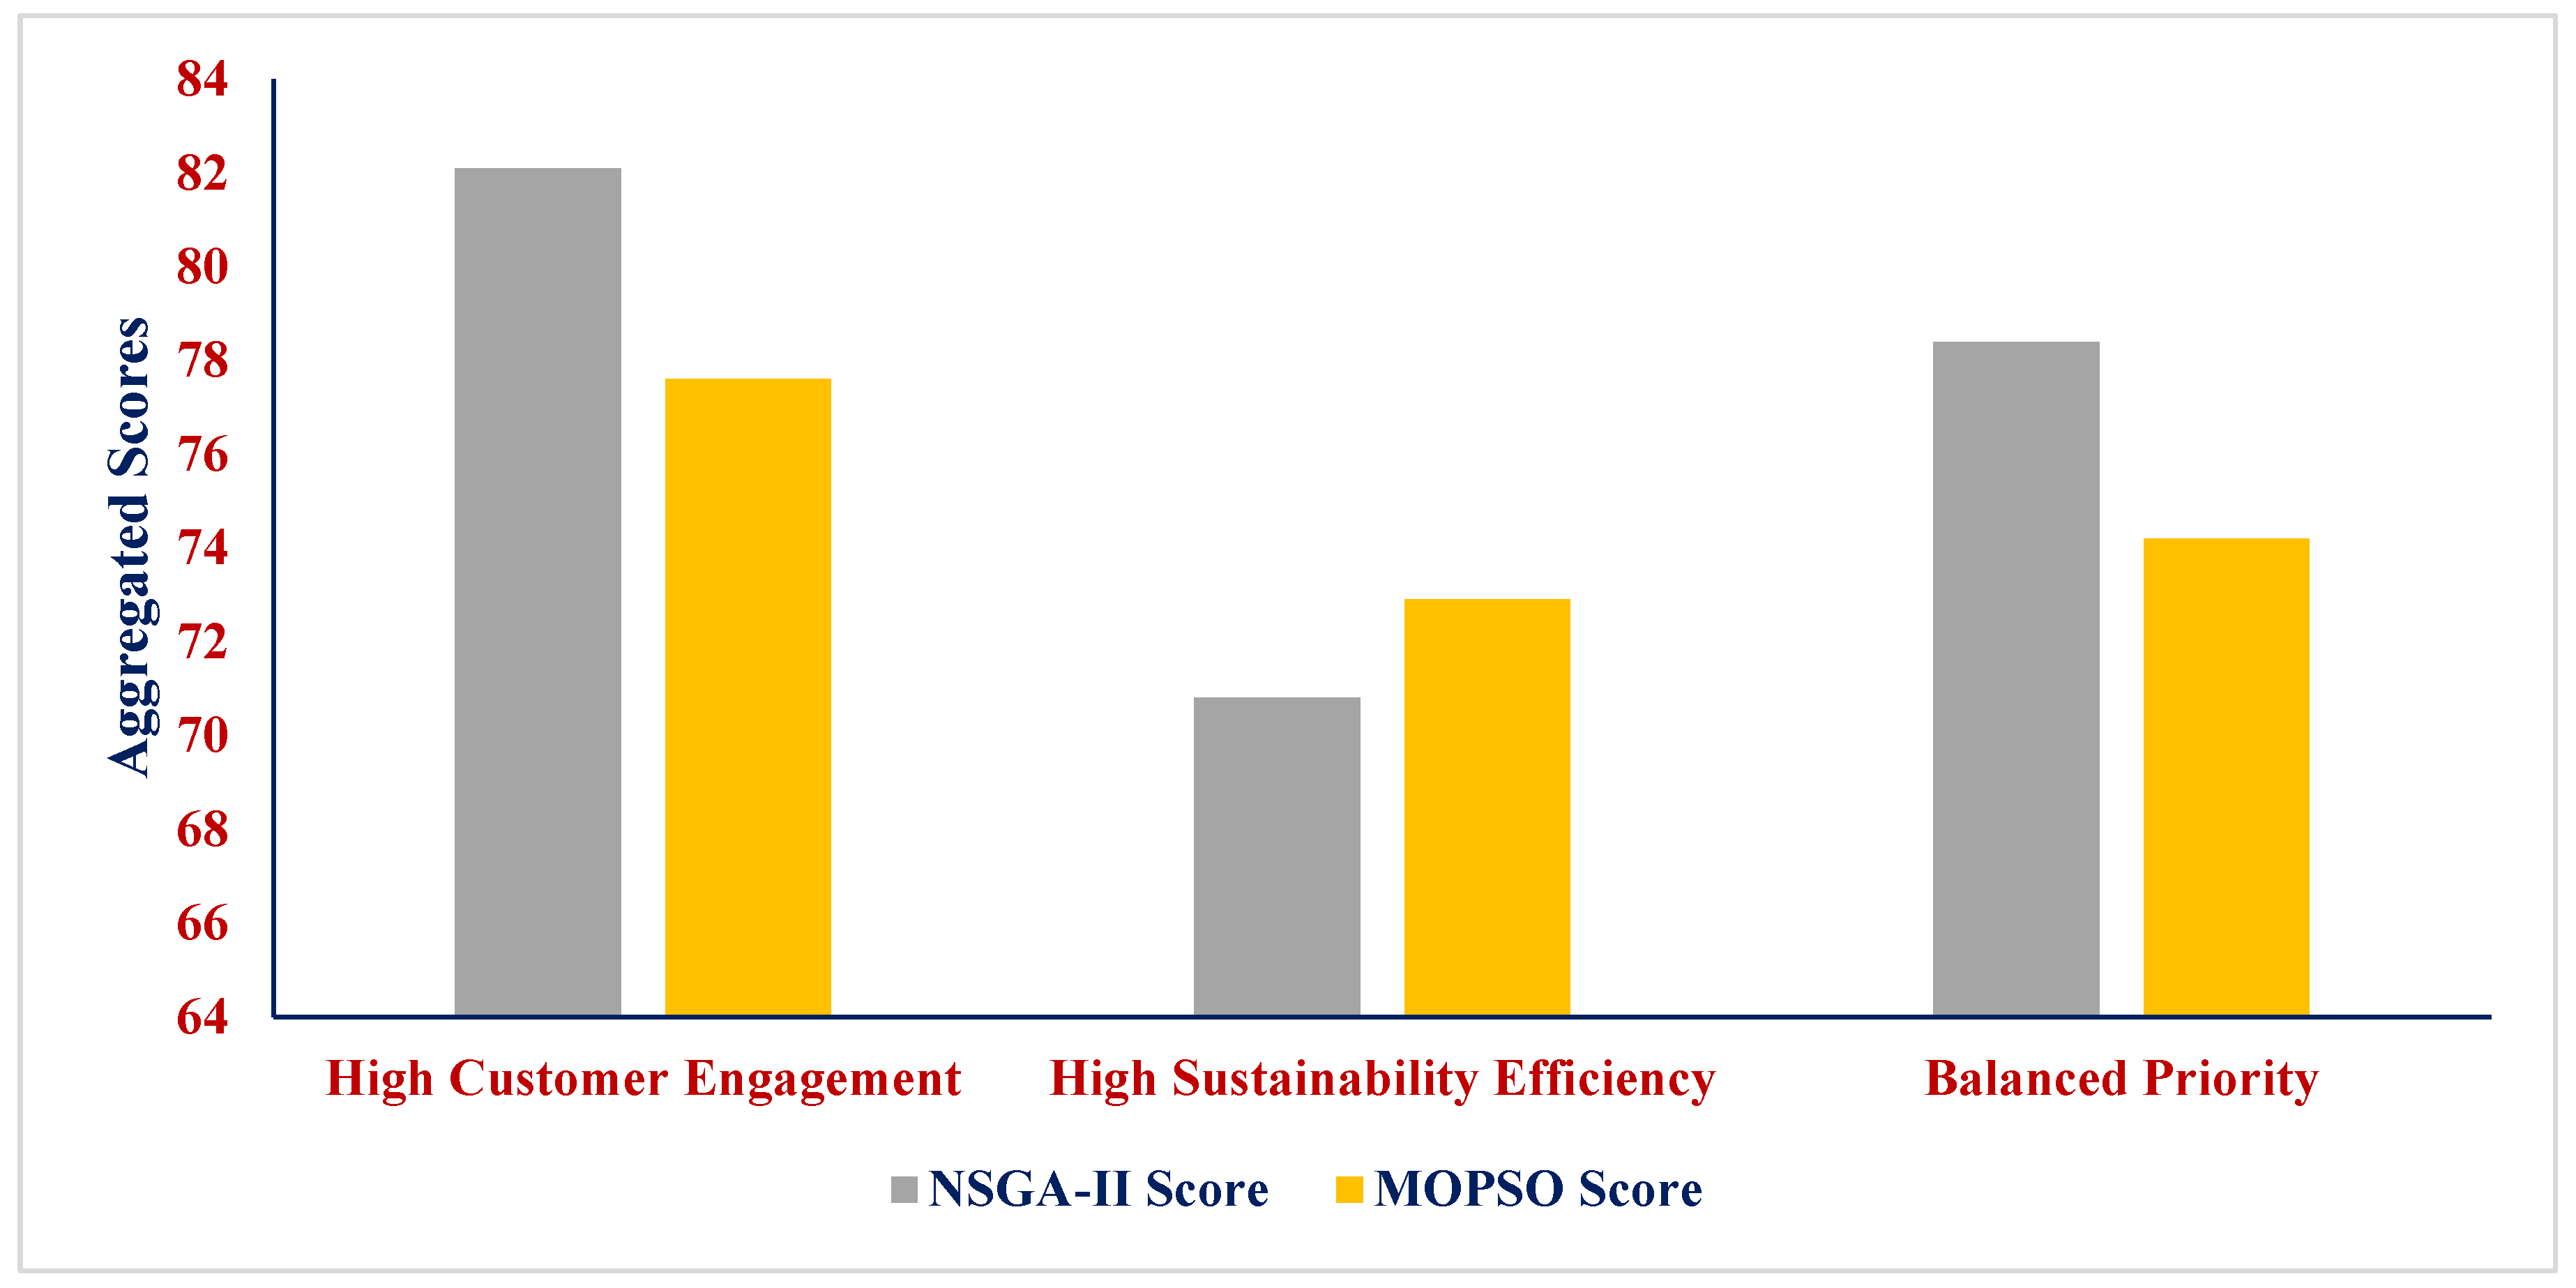
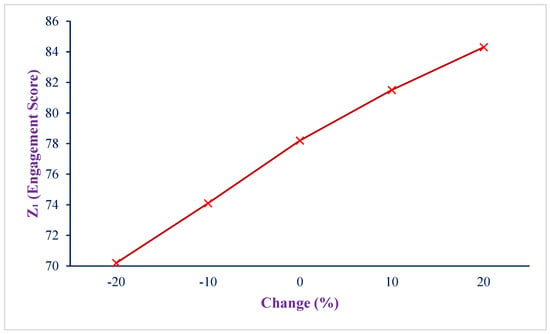
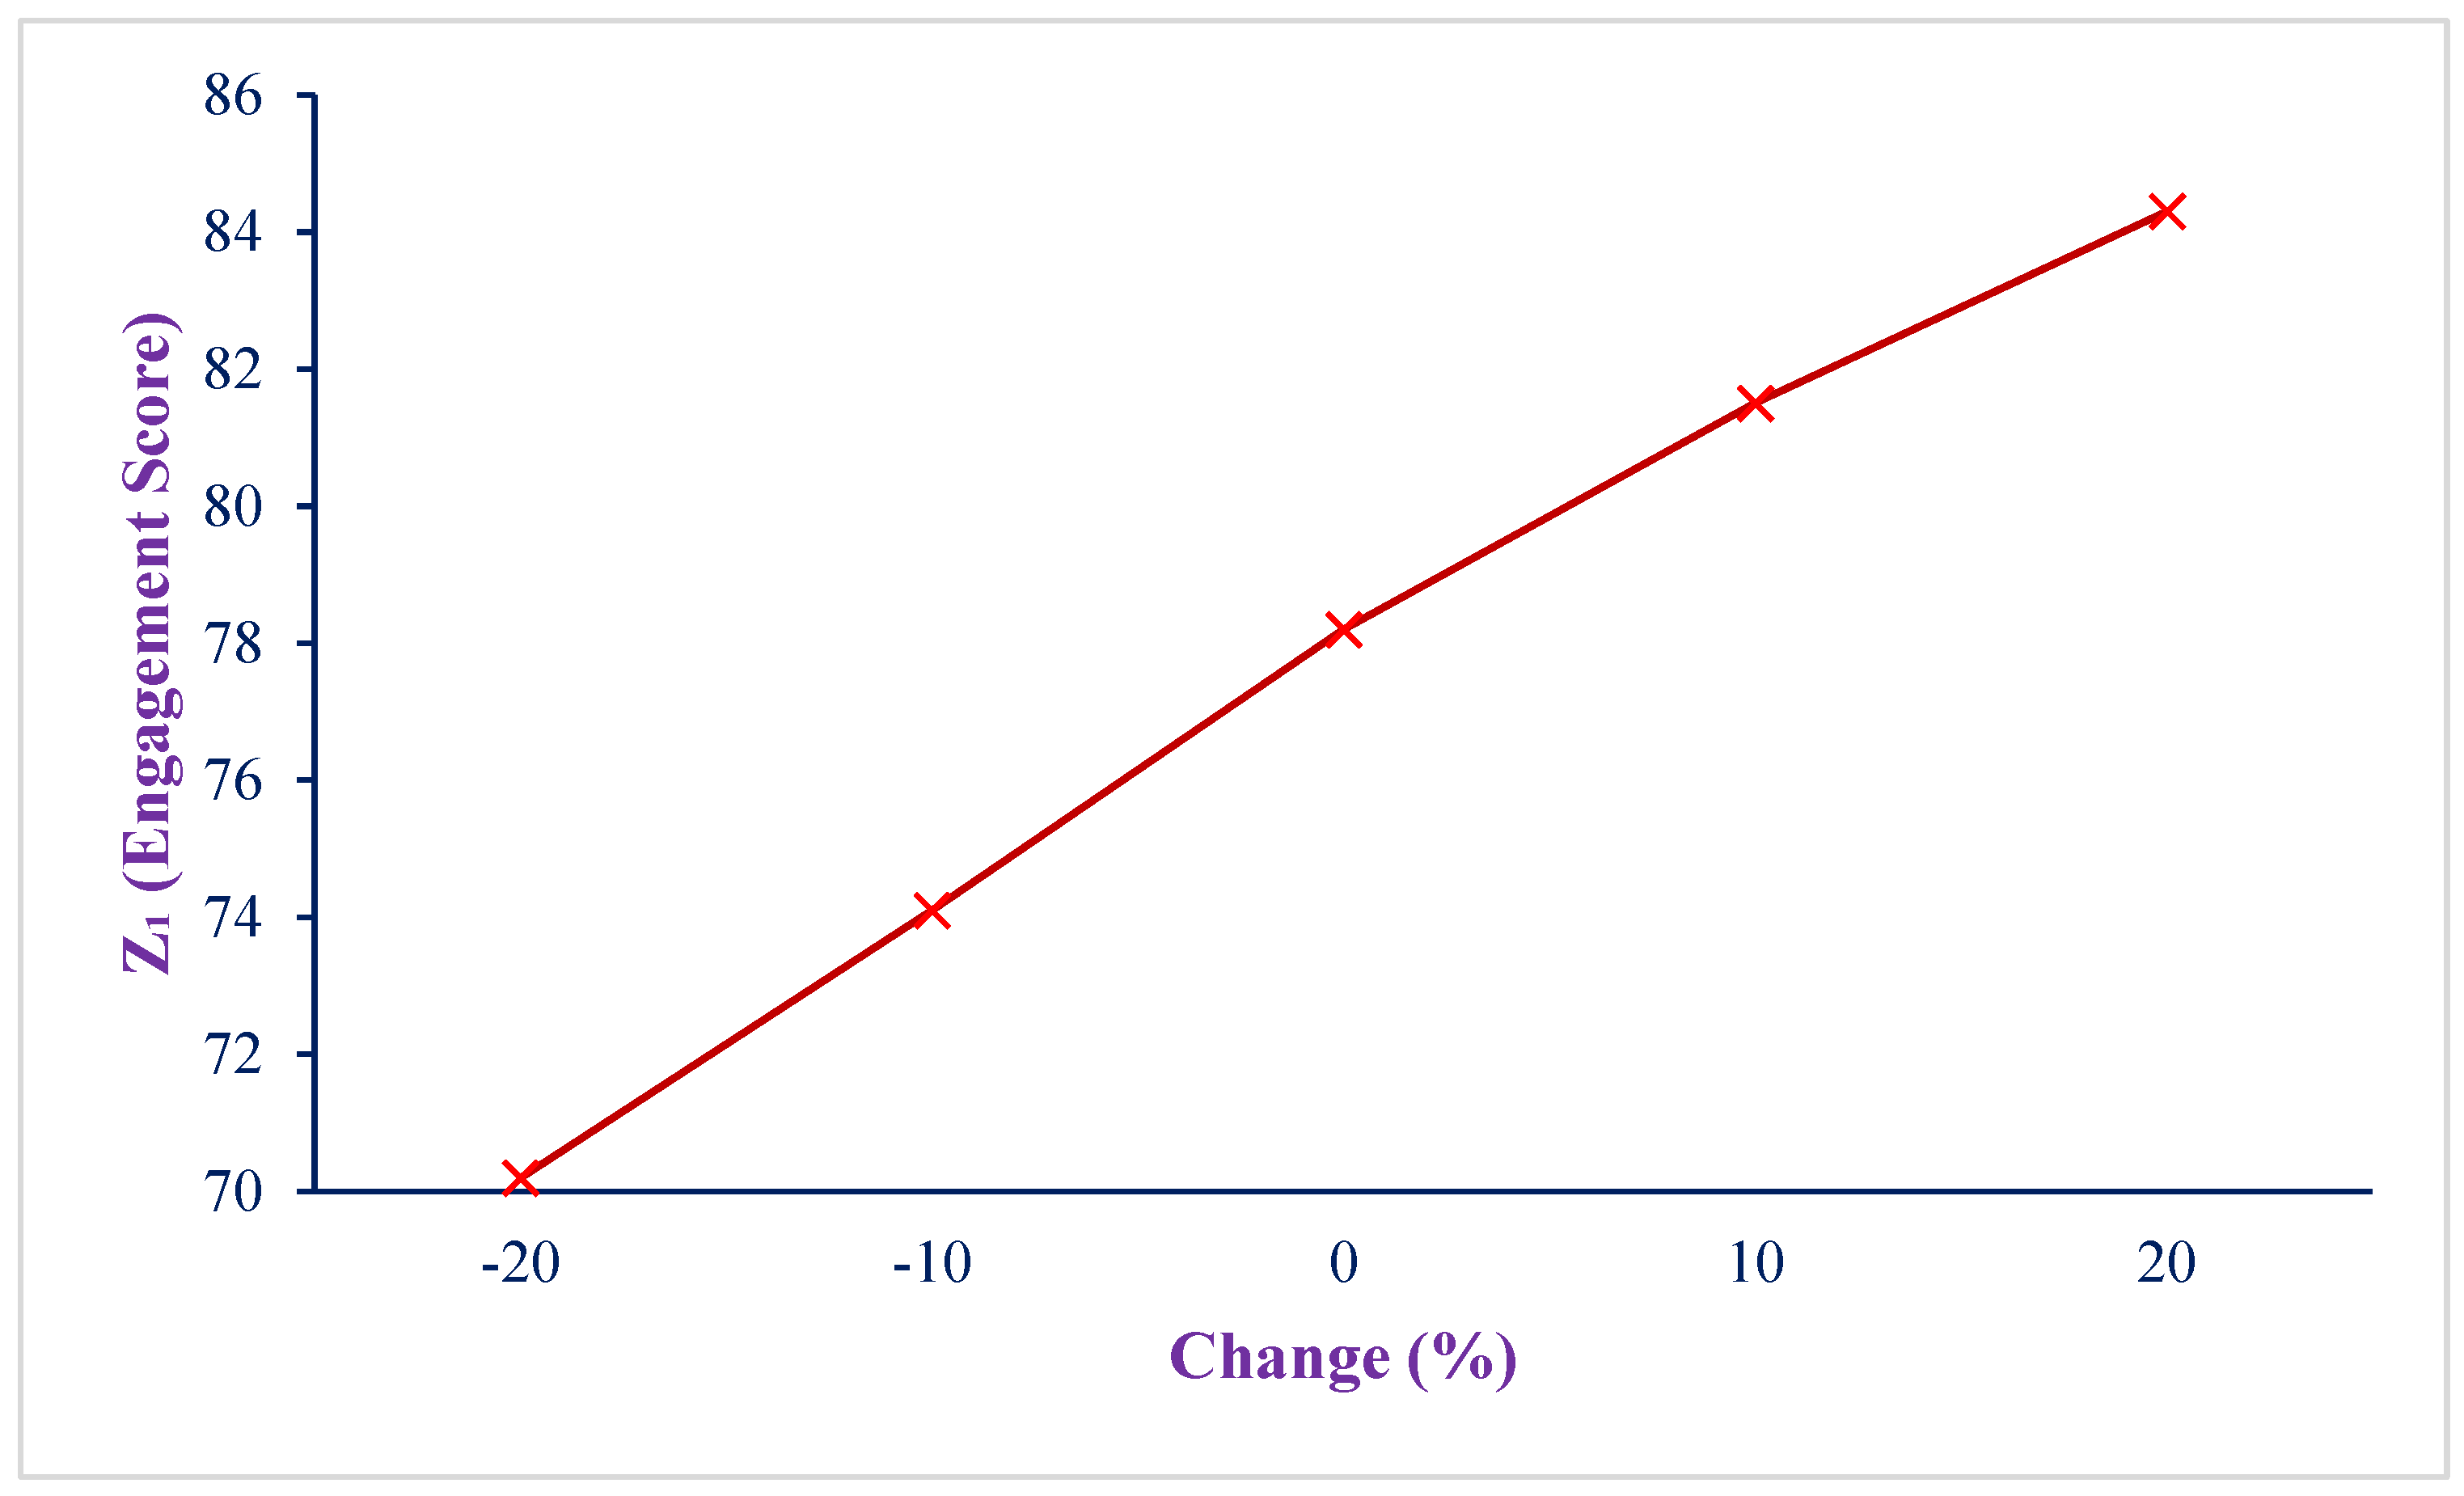
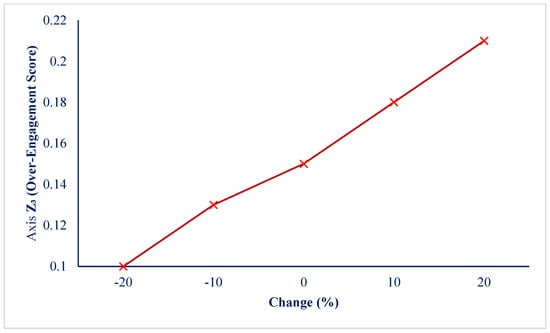

Disclaimer/Publisher’s Note: The statements, opinions and data contained in all publications are solely those of the individual author(s) and contributor(s) and not of MDPI and/or the editor(s). MDPI and/or the editor(s) disclaim responsibility for any injury to people or property resulting from any ideas, methods, instructions or products referred to in the content. |
© 2026 by the authors. Licensee MDPI, Basel, Switzerland. This article is an open access article distributed under the terms and conditions of the Creative Commons Attribution (CC BY) license.