


Abstract
The production and use of plastics have direct consequences on the environment, such as the greenhouse gas emissions (GHGs) they cause. Therefore, it is necessary to develop materials from renewable sources with a lower environmental impact to replace plastic. In this work, films with bioactive properties have been developed from cellulose nanofibers (CNFs) and natural phenolic compounds for food packaging applications. First, the optimization of the incorporation of three different natural phenolic compounds (tannic acid, p-coumaric acid, and acetosyringone) into nanocellulose was studied using a Box–Behnken design, with the phenols adsorbed by the nanocellulose as the output variable. Once the incorporation was optimized, films containing nanocellulose and phenolic compounds were produced and characterized. Tannic acid showed the best results with regard to the optical properties of the resulting films and achieved a complete blocking of UV-B radiation, as well as adding to nanocellulose antioxidant (4.32 mM TE/g film) and antibacterial capacity (log R of 6.6 ± 0.2 and 3.8 ± 0.1 for Staphylococcus aureus and Escherichia coli, respectively), making these films a promising material for use in contact with food as a packaging material, although more in-depth studies and measures are needed to make these films viable for use in food packaging.
1. Introduction
Fossil fuels are responsible for both 68% of greenhouse gas (GHG) and 90% of CO2 emissions, being the largest contributor to climate change [1]. Therefore, in a world constantly concerned about climate change, where 53.2 Gt CO2 eq were emitted into the atmosphere in 2024 [2], it is urgent to find alternatives to materials made from fossil fuels. In this regard, in 2021, 88% of plastic production in Europe was based on fossil resources, with only 35% being recycled [3]. Regarding GHG emissions in 2022 in the European Union from the plastic value chain, these reached 193 Mt of CO2 eq, and are estimated at 182 Mt of CO2 eq for 2025 [4,5]. In addition, of the 430 million tons of plastic produced annually, two-thirds are considered short-lived. The packaging sector is the largest generator of this type of plastic, which includes plastic for food packaging [6]. However, food packaging made from plastic is not just a pollution problem; it is also a human health issue, since small molecules of the plastic packaging can migrate to the food. So, when food comes into direct contact with plastic, the risk of substances transferring from the plastic or even reacting with the food increases. Some additives commonly found in plastics, such as bisphenol A and phthalates, can act as endocrine disruptors leading to hormonal imbalances, asthma, obesity, precocious puberty, carcinogenesis, and endometriosis [7,8].
Taking into account all of the above, it is necessary to find a more environmentally friendly and less harmful alternative to plastic used for food packaging, including the use of nanocellulose. This polymer is non-cytotoxic, biocompatible, and biodegradable, and it is obtained from renewable resources. It also has high mechanical resistance, high optical transparency, low density, good film-forming properties, and a high specific surface area that is easily functionalizable to provide them with additional properties. Nanocellulose is obtained by processing cellulose, which is a linear polysaccharide of glucose, and is the most abundant biopolymer on Earth [9,10,11,12,13]. Every year, nature produces between 1011 and 1012 tons of cellulose [14], so the raw material from which nanocellulose can be obtained is widely available. However, nanocellulose has its limitations for food packaging applications, such as its insufficient mechanical properties, and its low water vapor barrier [12] due to the hydrophilic nature of cellulose [15]. In this regard, in general, lower water vapor permeability is preferable to reduce moisture loss and to avoid spoilage in fresh foods (e.g., in fruit and vegetables) [16]. Therefore, for these type of applications, additives are often required to enhance the barrier and to provide additional properties, such as antioxidant capacity and antibacterial activity.
Natural phenolic compounds, which can be found in plants, have antioxidant activity equal to or greater than that of synthetic antioxidants [17]. Among them, tannic acid, p-coumaric acid, and acetosyringone are of particular interest. Tannic acid, the simplest hydrolysable tannin, is a natural polyphenol consisting of a central glucose molecule to which ten gallic acid units are linked by ester bonds and can be found in a wide variety of plants. It has known properties such as antioxidant, antitumor, antimicrobial and anti-inflammatory action and it is used in leather, as coating and adhesive, in surgery, and in pharmaceutical and food industries. Due to its polyphenolic structure, it is capable of acting as a crosslinker by forming hydrogen bonds, giving rise to polymeric networks [18,19,20,21]. In this regard, when it acts as a cross-linking agent with chitosan, gluten, gelatin, or polyvinyl alcohol (PVA), it improves the physical and biological properties of these compounds [22]. Likewise, tannic acid has also been used in combination with lignocellulose nanocrystals through the formation of hydrogen bonds to prepare Pickering stabilizers [23].
For its part, p-coumaric acid, present in plants and mushrooms, is a phenolic acid of the hydroxycinnamic acid family. It can be transformed into other phenolic acids and is one of the most important lignin precursors [24,25]. It has antitumor and antimutagenic properties, as well as antioxidant and anti-inflammatory activity, among others [24,26], and has potential for use as an active ingredient in cosmetics [27]. Furthermore, this phenolic compound has demonstrated an outstanding efficiency when used as a laccase mediator in the transformation of polycyclic aromatic hydrocarbons [28]. In the field of food packaging, it has been used in combination with cellulose nanocrystals by embedding it into a pectin coating to improve the barrier properties of the coating [29].
Finally, acetosyringone, a syringyl-type phenolic compound produced by plants in response to stress and pathogen infections [30,31], has also been studied as a laccase mediator for decolorization of recalcitrant dyes in pulp [32], for the bioremediation of mycotoxins [33], for the degradation of pesticides [34], as an activator of wood fibers in the production of medium-density fiberboards [35], to improve the hydrolysis of steam pre-treated spruce [36], and as a biocathode of microbial fuel cells [37].
It is interesting to study these three different natural compounds, as they differ in their molecular weight and internal molecular structure. Tannic acid is a polyphenol with a much higher molecular weight, while p-coumaric acid and acetosyringone are monophenols with a lower molecular weight. Regarding the two phenolic compounds with low molecular weight, they have different lateral changes: i.e., p-coumaric acid has a double bond at the Cα=Cβ position, while a α-C=O position is observed in the case of acetosyringone, which can influence their antioxidant and antibacterial activities. Moreover, the presence of ortho-methoxyl groups (acetosyringone) compared to p-coumaric acid (without the presence of methoxyl groups) can also modulate its antioxidant and antibacterial capacities [38].
Considering all of the above, this study optimizes the incorporation of tannic acid, p-coumaric acid, and acetosyringone, into nanocellulose using a Box–Behnken design. After optimization, nanocellulose-based films containing phenolic compounds were produced and characterized in terms of water vapor barrier and optical properties as well as the antioxidant and antibacterial activities. In addition, FTIR analysis was performed to evaluate the structural differences between films. Overall, this work aims to provide comparable data on the incorporation of the three phenolic compounds, avoiding other variations that can influence the properties of the films, such as the type and source of nanocellulose and the protocol followed to obtain the films.
2. Materials and Methods
2.1. Raw Material and Chemicals
Eucalyptus globulus Labill. bleached Kraft pulp used for the production of cellulose nanofibers (CNFs) was kindly provided by La Montañanesa pulp mill (Lecta, Zaragoza, Spain).
All reagents used in this work (HCl, NaClO, 2,2,6,6-Tetramethylpiperidine 1-oxyl (TEMPO), NaBr, NaOH. NaCl, Na2CO3, Folin-Ciocalteau, 2,2-Diphenyl-1-picrylhydrazyl (DPPH), (S)-6-Methoxy-2,5,7,8-tetramethylchromane-2-carboxylic acid (TROLOX), Methanol, Nutrient broth (NB), Lennox Luria Bertani broth (LB), and Ethanol) were acquired from Sigma-Aldrich (Madrid, Spain), Fisher Scientific (Madrid, Spain), and Scharlab (Barcelona, Spain).
2.2. Production of Cellulose Nanofibers (CNFs)
First, the bleached pulp was acid washed to remove metals. To do this, the pulp was stirred for 20 min at room temperature and 10% consistency, adjusting the pH to 2 with HCl. After that, the pulp was washed thoroughly with distilled water and subjected to a chemical pretreatment (TEMPO-mediated oxidation). This pretreatment was carried out with 10 mmol NaClO, 0.016 g TEMPO and 0.1 g NaBr per gram of dry pulp, at room temperature and 1% (w/v) pulp consistency. NaOH (0.5 M) was added until a pH of 10 was stably reached. After that, the pulp was washed again thoroughly with distilled water until reaching a pH value of 7 and pulp consistency was adjusted to 2% (w/v). Finally, a mechanical treatment in a high-pressure microfluidizer (Microfluidizer M-110EH, Microfluidics Corp., Westwood, MA, USA) was applied to the pulp, passing once through an interaction chamber of 100 µm (1000 bar) and three times through two sequential interaction chambers of 200 and 100 µm (2000 bar). The slurry obtained was stored at 4 °C.
The resulting CNF sample showed a fibrillation yield of 100%, a carboxylic group content of 1043 ± 150 µmol/g and a crystallinity index of 77 ± 2% [39].
2.3. Incorporation of Phenolic Compounds to Cellulose Nanofibers (CNFs)
Three different phenolic compounds (tannic acid, p-coumaric acid and acetosyringone) were added to CNFs following a Box–Behnken design in order to study and optimize their incorporation. Three input variables (pH of the experiment, additive concentration, and final CNF concentration in the mixture) were considered in the design at three levels (−1, 0, +1). The design consisted of fifteen runs (experiments) from which three were center points. The values of pH (minimum value, 4; medium value, 6; maximum value, 8), additive concentration (minimum value, 5 mM; medium value, 10 mM; maximum value, 15 mM) and final CNF concentration in the mixture (minimum value, 0.1%; medium value, 0.25%; maximum value, 0.4%) for the design were established based on preliminary experiments carried out in our laboratory (Table 1):
Table 1.
Experimental conditions of Box–Behnken design for the study and optimization of the addition of tannic acid, p-coumaric acid and acetosyringone considering three input variables (pH of the experiment, additive concentration, and final CNF concentration in the mixture) at three levels (−1, 0, +1).
To carry out the experiments, the additives, previously dissolved in ethanol, were mixed with three stock solutions of CNFs prepared at 0.45%, 0.30% and 0.12%, and were stirred for 24 h. After this time, each stock solution was divided into three parts, and each part was prepared at three different pHs (4, 6 and 8) by adding drops of NaOH or HCl and stirred for another 24 h. In turn, solutions of tannic acid, p-coumaric acid and acetosyringone were prepared at 0.14 M, 0.12 M and 0.12 M, respectively, and were mixed according to the conditions of each experiment, adding distilled water until the required CNF concentration was reached, if necessary. The solutions corresponding to the fifteen experiments were stirred in a Miccra D-1 homogenizer (MICCRA GmbH, Buggingen, Germany) for 2 min at 20,000 rpm and then they were magnetically stirred for 24 h.
The amount of phenols adsorbed in the CNFs of each of the fifteen experiments was chosen as the output variable of the experimental design. The design of the experiments and the plots obtained from modeling the equations by Response Surface Methodology were obtained using Minitab 19.1 software (Minitab Ltd., Coventry, UK).
2.4. Determination of the Amount of Phenols Adsorbed
The mixtures obtained according to the experimental design conditions were filtrated using a single use syringe filter (0.45 μm pore size) in order to separate the CNF sample to the supernatant and to analyze the phenolic content in the supernatant of each sample, accepting that the phenols not presented in the supernatant are adsorbed in the CNFs. The total phenolic content was determined following the Folin–Ciocalteu method with some modifications. Firstly, 100 µL of supernatant of each sample (diluted if necessary) was mixed with 500 µL of Folin–Ciocalteau reagent (diluted 1:10), after which 400 µL of 7.5% Na2CO3 was added and stirred. Then, the mixture was incubated at 50 °C for 10 min and absorbance was measured at 760 nm after cooling using a Lambda 365 UV–Vis spectrophotometer (PerkinElmer, Boston, MA, USA). The same procedure was followed for the control samples, which consisted of samples with the additive concentration and pH conditions of the experimental design, but without CNFs. The total phenolic content of supernatants and control samples was quantified using a calibration curve prepared from a standard solution of gallic acid (1–200 mg/L) and expressed as mg gallic acid equivalent (GAE)/L. The percentage of adsorbed phenols in each sample was calculated according to Equation (1):
where P1 are the phenols expressed as mg GAE/L presented in the supernatant of the sample, and P2 are the phenols expressed as mg GAE/L presented in the control sample in the same conditions of additive concentration and pH.
Adsorbed phenols (%) = 1 − (P1/P2)
2.5. Films Formation
Once the conditions of the mixture (pH of the experiment, additive concentration, and final CNF concentration) were optimized for every phenolic compound, the formation of films in the selected conditions was carried out. To do this, the amount needed for each film to have 28 mg of CNFs was calculated. The mixture was then vacuum filtrated with MF-Millipore nitrocellulose filter disks with 0.025 μm pore size (Merck KGaA, Darmstadt, Germany). After that, films were dried in a Rapid-Köthen Sheet Former at 80 °C for 10 min.
The thickness of the films was measured according to ISO 534 using the Messmer Büchel–Digital Micrometer (Venco S.A, Madrid, Spain).
2.6. Films Characterization
2.6.1. Water Vapor Barrier Properties of the Films
Water vapor permeability (WVP) was used to evaluate the water vapor barrier properties of the resulting films according to ASTM E96 standard test (desiccant method). Anhydrous calcium chloride was used to load test cells which had a lid with a circular hole of 1 cm diameter covered with a piece of film. The test cells were placed in an atmosphere with a relative humidity of 75%. The humidity inside the cell was 0%, resulting in a partial water vapor pressure difference between the outside and inside through the film. The experiment was carried out for four days at room temperature. The WVP was calculated according to Equation (2):
where G is the weight gain of the test cells (g), t is the time (days), A is the exposed film area (m2), L is the film thickness (mm) and ∆P is the partial water vapor pressure difference (kPa).
WVP = (G/t)·L/(A·∆P)
2.6.2. Optical Properties
Transmittance and opacity were measured for the resulting films. Transmittance (at 600 nm) of the films was estimated from their total transmittance between 200 and 800 nm using a Lambda 365 UV–Vis spectrophotometer (PerkinElmer, Boston, MA, USA) equipped with an integrating sphere. Opacity of films was calculated according to Equation (3) [40]:
where A600 is the absorbance at 600 nm and L is the film thickness (mm).
Opacity (mm−1) = A600/L
2.6.3. Fourier-Transform Infrared (FTIR) Spectroscopy
FTIR analyses of the films with additive were carried out in a JASCO FT/IR 460 Plus spectrometer (Jasco Inc., Tokyo, Japan) with ATR (attenuated total reflectance), in the 4000–600 cm−1 range with a resolution of 1 cm−1.
2.6.4. Antioxidant Activity
Antioxidant activity of the resulting films was calculated using DPPH (2,2-diphenyl-1-picrylhydrazyl) free radical scavenging assay. To do this, a known amount of each film was added to 1.5 mL DPPH 0.1 mM methanol solution. The mixture was stored at room temperature in the dark and measures were taken at 15 min, 30 min and 1 h at 517 nm using a Lambda 365 UV–Vis spectrophotometer (PerkinElmer, Boston, MA, USA). As a control, DPPH methanol was used. DPPH scavenging effect was calculated according to Equation (4) [41]:
where Ac is the absorbance control measure of DPPH methanol and At is the absorbance measure of samples at a known given time.
DPPH scavenging effect (%) = 100·(Ac − At)/Ac
The antioxidant capacity was quantified using a calibration curve with Trolox solutions and was expressed as mM Trolox equivalent (TE)/g film.
2.6.5. Antibacterial Capacity
Antibacterial activity of films was studied against a Gram-positive bacteria (Staphylococcus aureus, CECT 231) and a Gram-negative bacteria (Escherichia coli, CECT 433) using Nutrient broth (NB) and Lennox Luria Bertani broth (LB) as culture medium, respectively. In total, 20 mg of each film was mixed with 1.5 mL culture medium, inoculated with 30 μL of overnight inoculum and incubated at 37 °C and 140 rpm for 24 h. After this time, serial dilutions in sterilized phosphate buffer were prepared from each sample and 100 μL of them were spread over Petri dished with agar-culture medium. After 24 h of incubation at 37 °C, the number of colony forming units (CFUs) was counted on the Petri dishes. The same procedure was followed for the control sample, in which no film was added. CFU was used to calculate the Log reduction (LogR) according to Equation (5) [11]:
where CFUC is the CFUs counted in the control sample and CFUS is the CFUs counted in the samples.
Log R = log10(CFUC) − log10(CFUS)
2.6.6. Statistical Analysis
The data obtained in the characterization of the films were subjected to one factor analysis of variance (ANOVA). Tukey’s multiple comparison test (α = 0.05) was also performed to identify differences between the means of the values obtained. To indicate these differences, letters have been included in the data. If the data do not differ significantly from each other (p < 0.05), they have the same letter.
3. Results and Discussion
3.1. Effect of Input Variables of the Experiment in the Incorporation of Phenolic Compounds to Cellulose Nanofibers (CNFs)
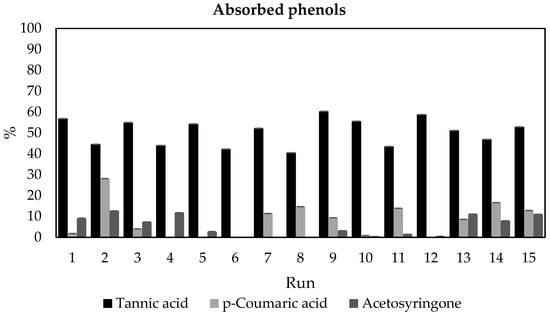
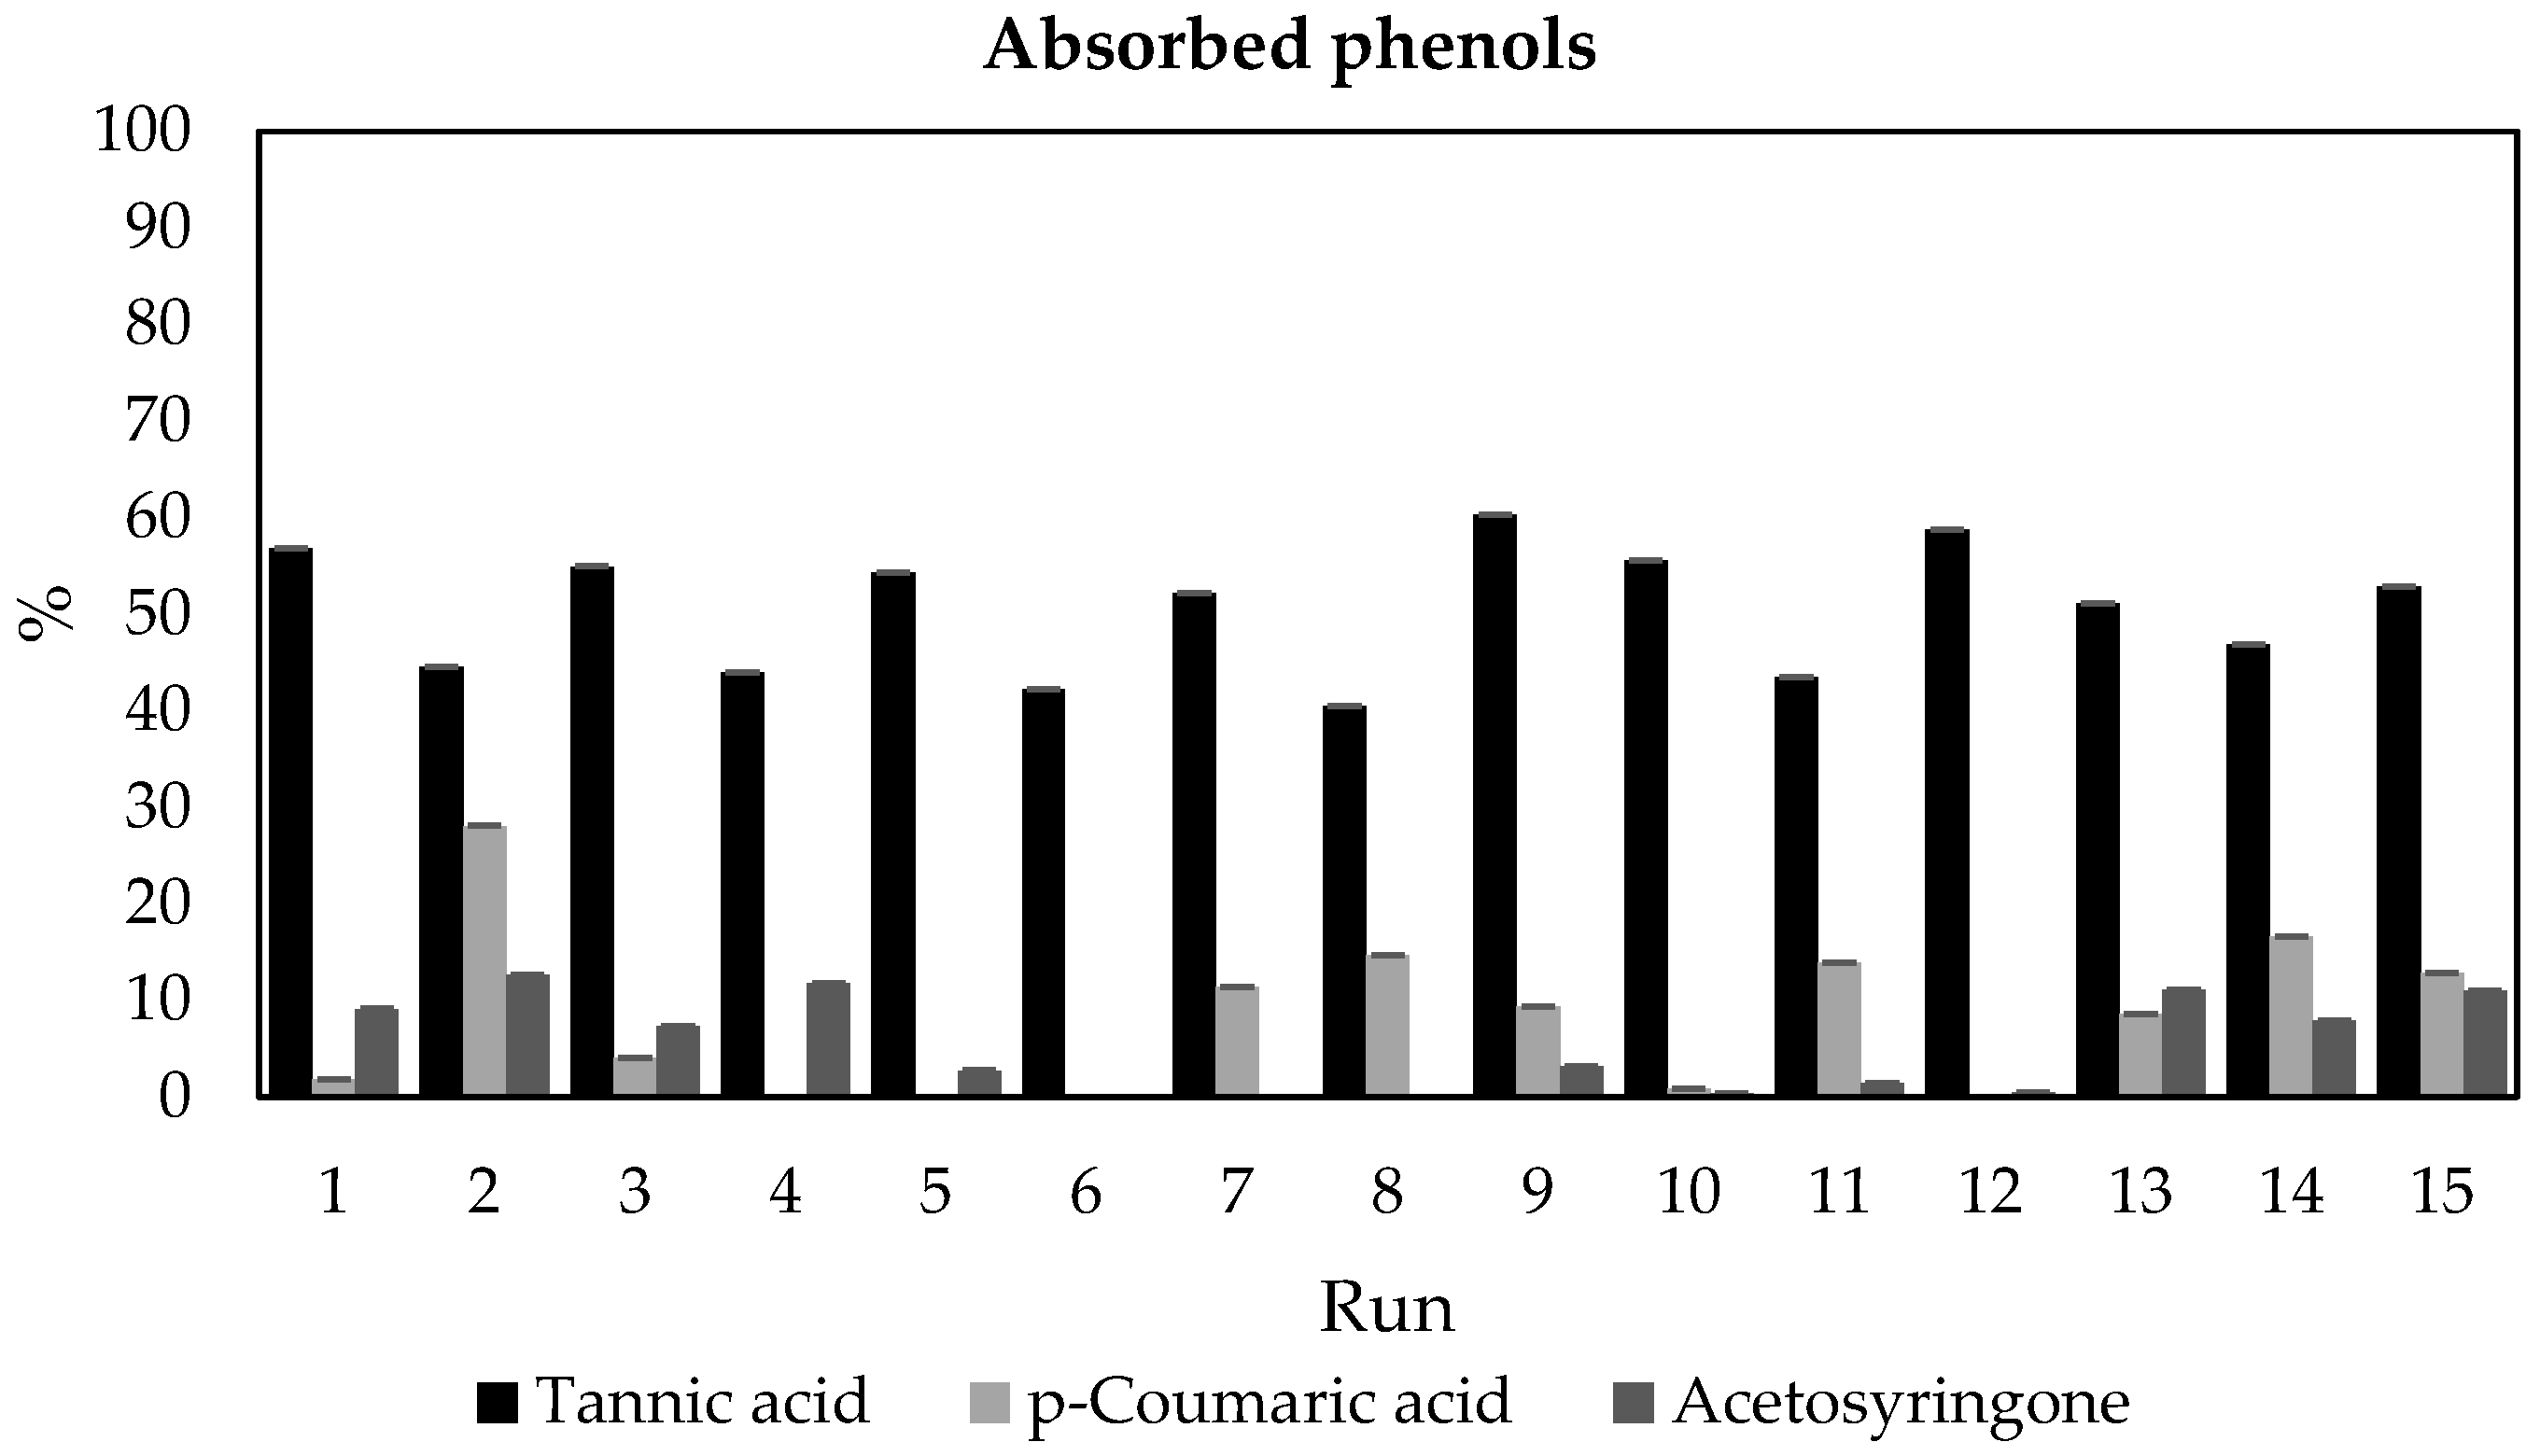
The percentages of incorporation of phenols to CNFs for the fifteen experiments established by the Box–Behnken design are shown in Figure 1 (numerical data are shown in Table S1 in Supplementary Materials):
Figure 1.
Adsorbed phenols (%) for the different phenolic compounds tested in the experimental design.
As can be seen, except in the case of tannic acid, not all the experimental conditions achieved the adsorption of phenols to CNFs, with tannic acid being the additive that adsorbed more phenols, as shown in all the fifteen runs (60.4% vs. 28.1% and 12.6% for p-coumaric acid and acetosyringone, respectively). This could be related to the fact that the affinity showed by phenols to cellulose is positively correlated with their molecular masses and the number of galloyl groups (among others) [42]. In this respect, tannic acid has a molecular weight much greater than the other two additives (1701.19 g/mol vs. 164.05 g/mol and 196.19 g/mol for p-coumaric acid and acetosyringone, respectively). In addition, tannic acid, unlike p-coumaric acid and acetosyringone, possesses galloyl groups. These galloyl groups can form bidentate or tridentate hydrogen bonds with nanocellulose, and these bonds are stronger than single-ligand hydrogen bonds [43]. Another possible explanation for the higher adsorption of phenols using tannic acid as additive is the fact than it has ten aromatic rings and consequently phenolic compounds with several aromatic rings tend to bind more strongly to cellulose through hydrogen bonds and hydrophobic interactions than compounds with only one aromatic ring, such as p-coumaric acid and acetosyringone [44].
Regarding the results obtained in the experimental design, the best results for tannic acid were obtained when values of pH, additive concentration, and final CNF concentration reached values of 6, 5 mM, and 0.1%, respectively (run 9 of the experiment). With regard to p-coumaric acid and acetosyringone, the best results were obtained in both cases when the pH, additive concentration, and final CNF concentration values reached 8, 5 mM, and 0.25%, respectively (run 2 of the experiment).
The quadratic regressions equations obtained from the adsorbed phenols (Figure 1) when using tannic acid, p-coumaric acid, and acetosyringone as additive, and their regression coefficients, are as follows (Equation (6), Equation (7) and Equation (8), respectively):
Adsorbed phenols (%) = 71.3 + 7.84 pH − 4.47 Additive Conc. (mM) − 99.9 Final CNF Conc. (%) − 0.932 pH∗pH + 0.1406 Additive Conc. (mM)∗Additive Conc. (mM) + 33.2 Final CNF Conc. (%)∗Final CNF Conc. (%) + 0.032 pH∗Additive Conc. (mM) + 0.32 pH∗Final CNF Conc. (%) + 6.67 Additive Conc. (mM)∗Final CNF Conc. (%)
R-squared = 91.10%
Adsorbed phenols (%) = −75.1 + 14.09 pH + 5.68 Additive Conc. (mM) + 122.3 Final CNF Conc. (%) − 0.466 pH∗pH − 0.094 Additive Conc. (mM)∗Additive Conc. (mM) − 192 Final CNF Conc. (%)∗Final CNF Conc. (%) − 0.759 pH∗Additive Conc. (mM) + 2.77 pH∗Final CNF Conc. (%) − 1.82 Additive Conc. (mM)∗Final CNF Conc. (%)
R-squared = 85.23%
Adsorbed phenols (%) = −8.6 + 0.18 pH − 0.80 Additive Conc. (mM) + 178.6 Final CNF Conc. (%) − 0.056 pH∗pH + 0.0178 Additive Conc. (mM)∗Additive Conc. (mM) − 403.8 Final CNF Conc. (%)∗Final CNF Conc. (%) + 0.024 pH∗Additive Conc. (mM) + 2.30 pH∗Final CNF Conc. (%) + 0.59 Additive Conc. (mM)∗Final CNF Conc. (%)
R-squared = 93.93%
Once the data were analyzed, optimal values according to the experimental design to maximize phenols adsorption were obtained for each additive (Table 2):
Table 2.
Optimized conditions of mixtures of CNF and phenolic compounds.
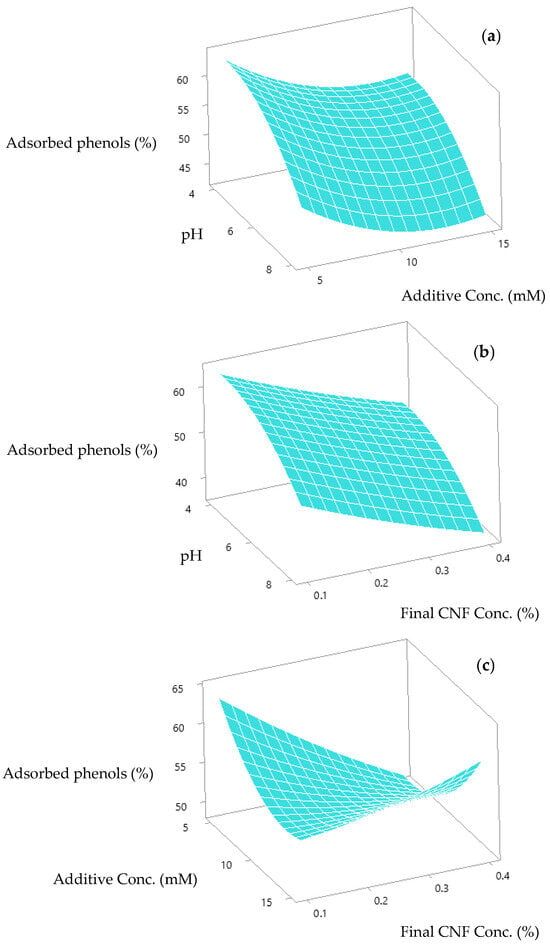
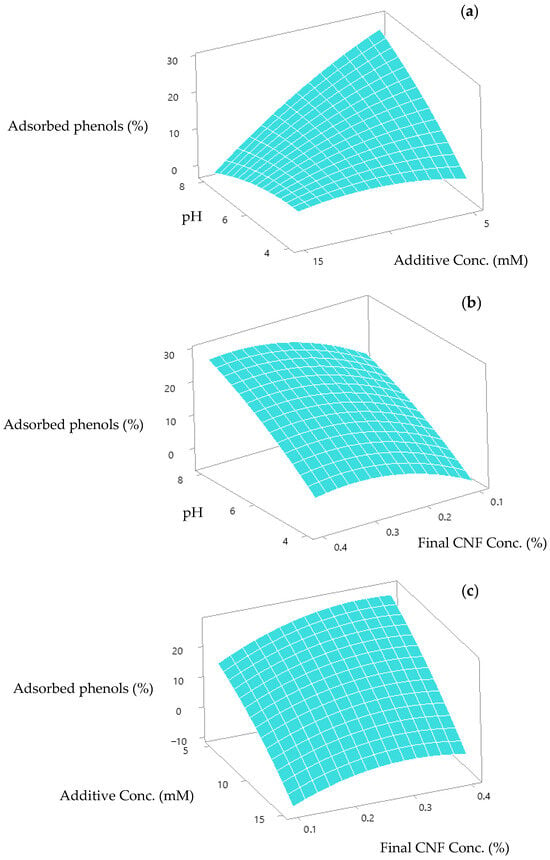
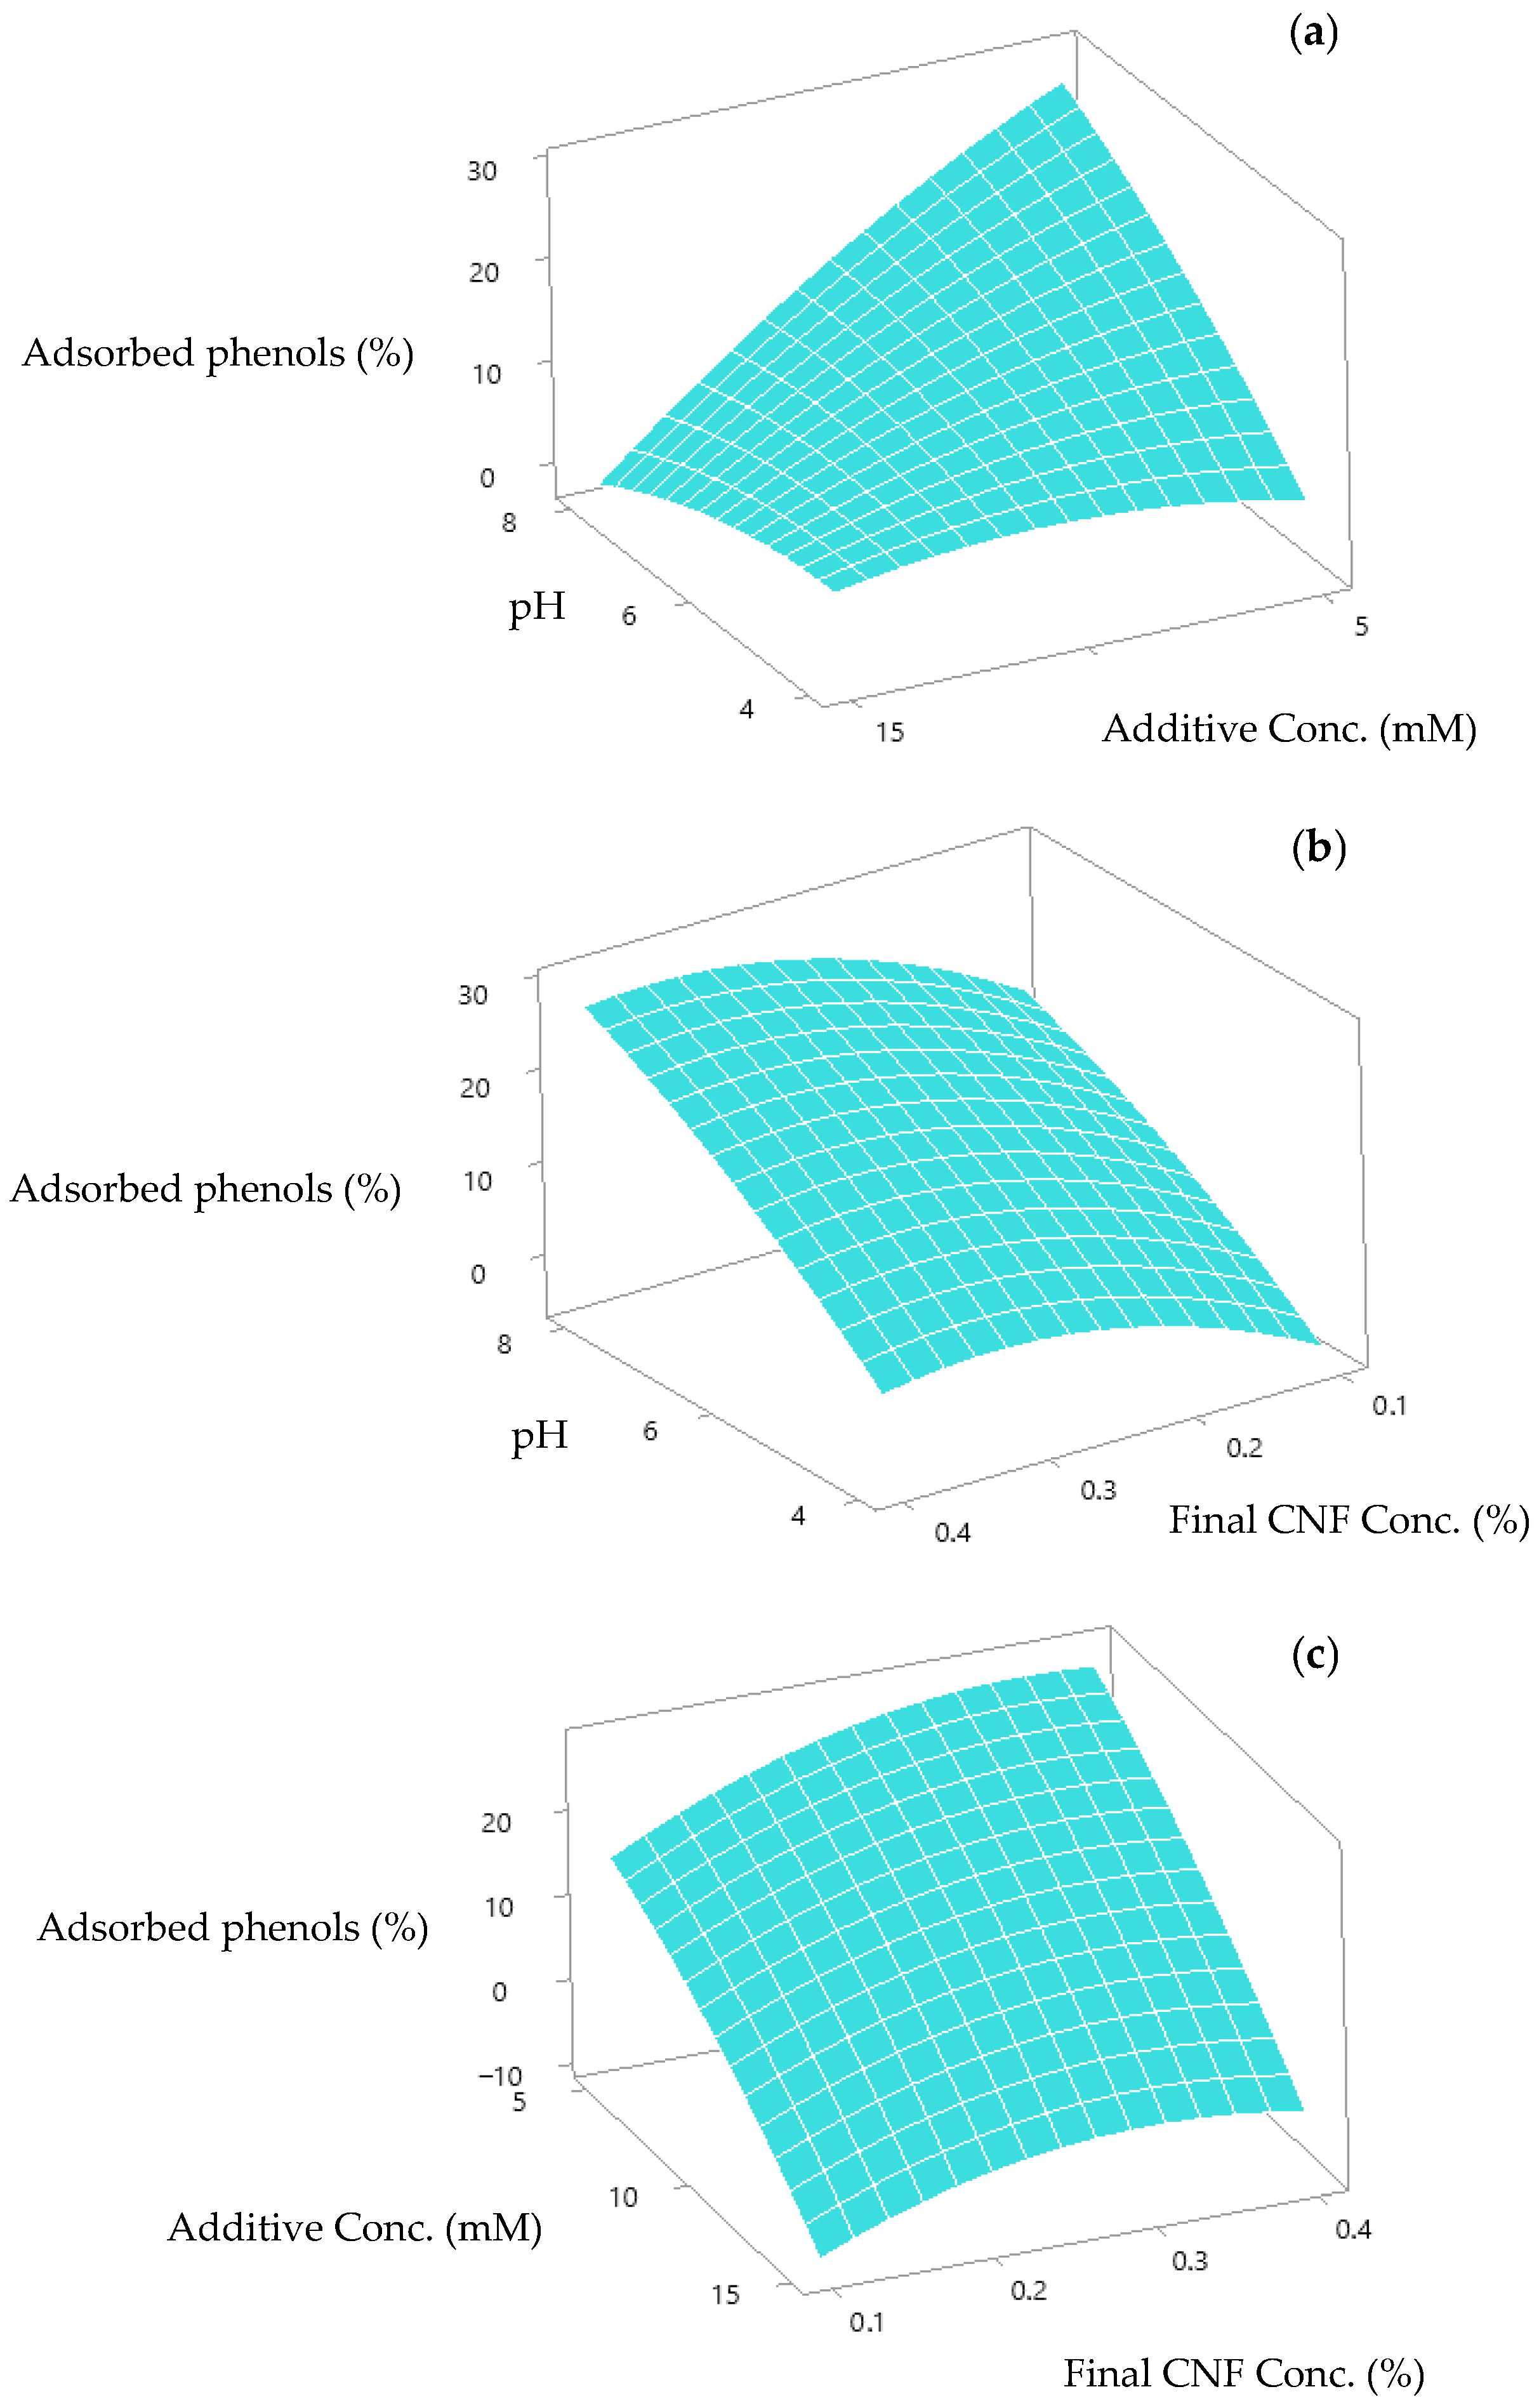
Once the optimized values for maximizing phenol adsorption were calculated for each additive (Table 2), response surfaces were obtained to see the interaction between the values of the input variables (pH, additive concentration, and final CNF concentration) and the output variable (phenols adsorbed). Figure 2a,b shows the response surface for tannic acid when fixing final CNF concentration at 0.1%, and additive concentration at 5 mM, respectively (the optimal values for these variables). As can be seen in both cases, adsorbed phenols increased when pH decreased. In the case of fixing the pH of the experiment at 4.3 (optimal value) (Figure 2c), adsorbed phenols increased when additive concentration and final CNF concentration both decreased.
Figure 2.
Response surface for the adsorption of tannic acid onto nanocellulose. Each panel shows the surface obtained by fixing one adsorption variable: (a) final CNF concentration at 0.1%; (b) additive concentration at 5 mM; (c) pH of the experiment at 4.3.
In the case of using p-coumaric acid as additive, Figure 3 shows the response surface when fixing final CNF concentration at 0.35% (optimal value). As can be seen, adsorbed phenols increased when pH increased and additive concentration decreased. In the case of fixing additive concentration at 5 mM (optimal value) (Figure 3b), adsorbed phenols increased when the pH of the experiment increased and final CNF concentration took high values. When the pH of the experiment was fixed at 8 (optimal value) (Figure 3c), adsorbed phenols increased when additive concentration decreased and final CNF concentration took high values.
Figure 3.
Response surface for the adsorption of p-coumaric acid onto nanocellulose. Each panel shows the surface obtained by fixing one adsorption variable: (a) final CNF concentration at 0.35%; (b) additive concentration at 5 mM; (c) pH of the experiment at 8.
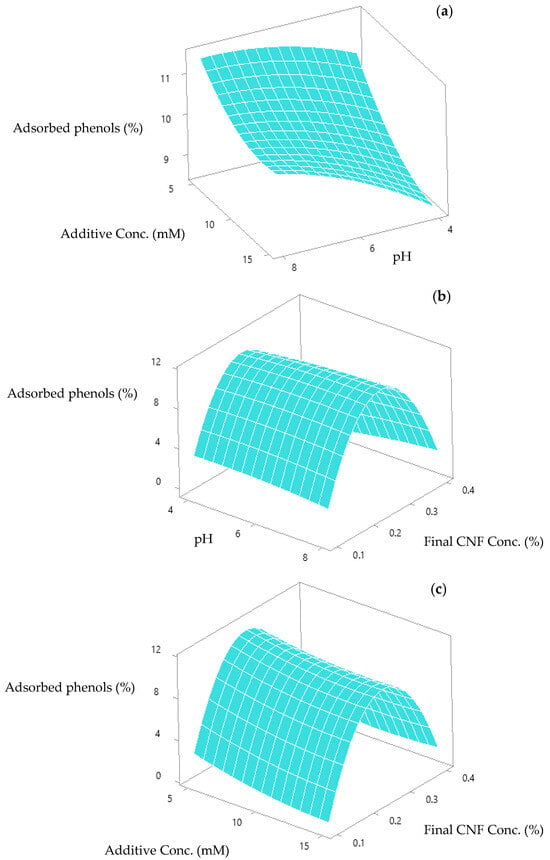
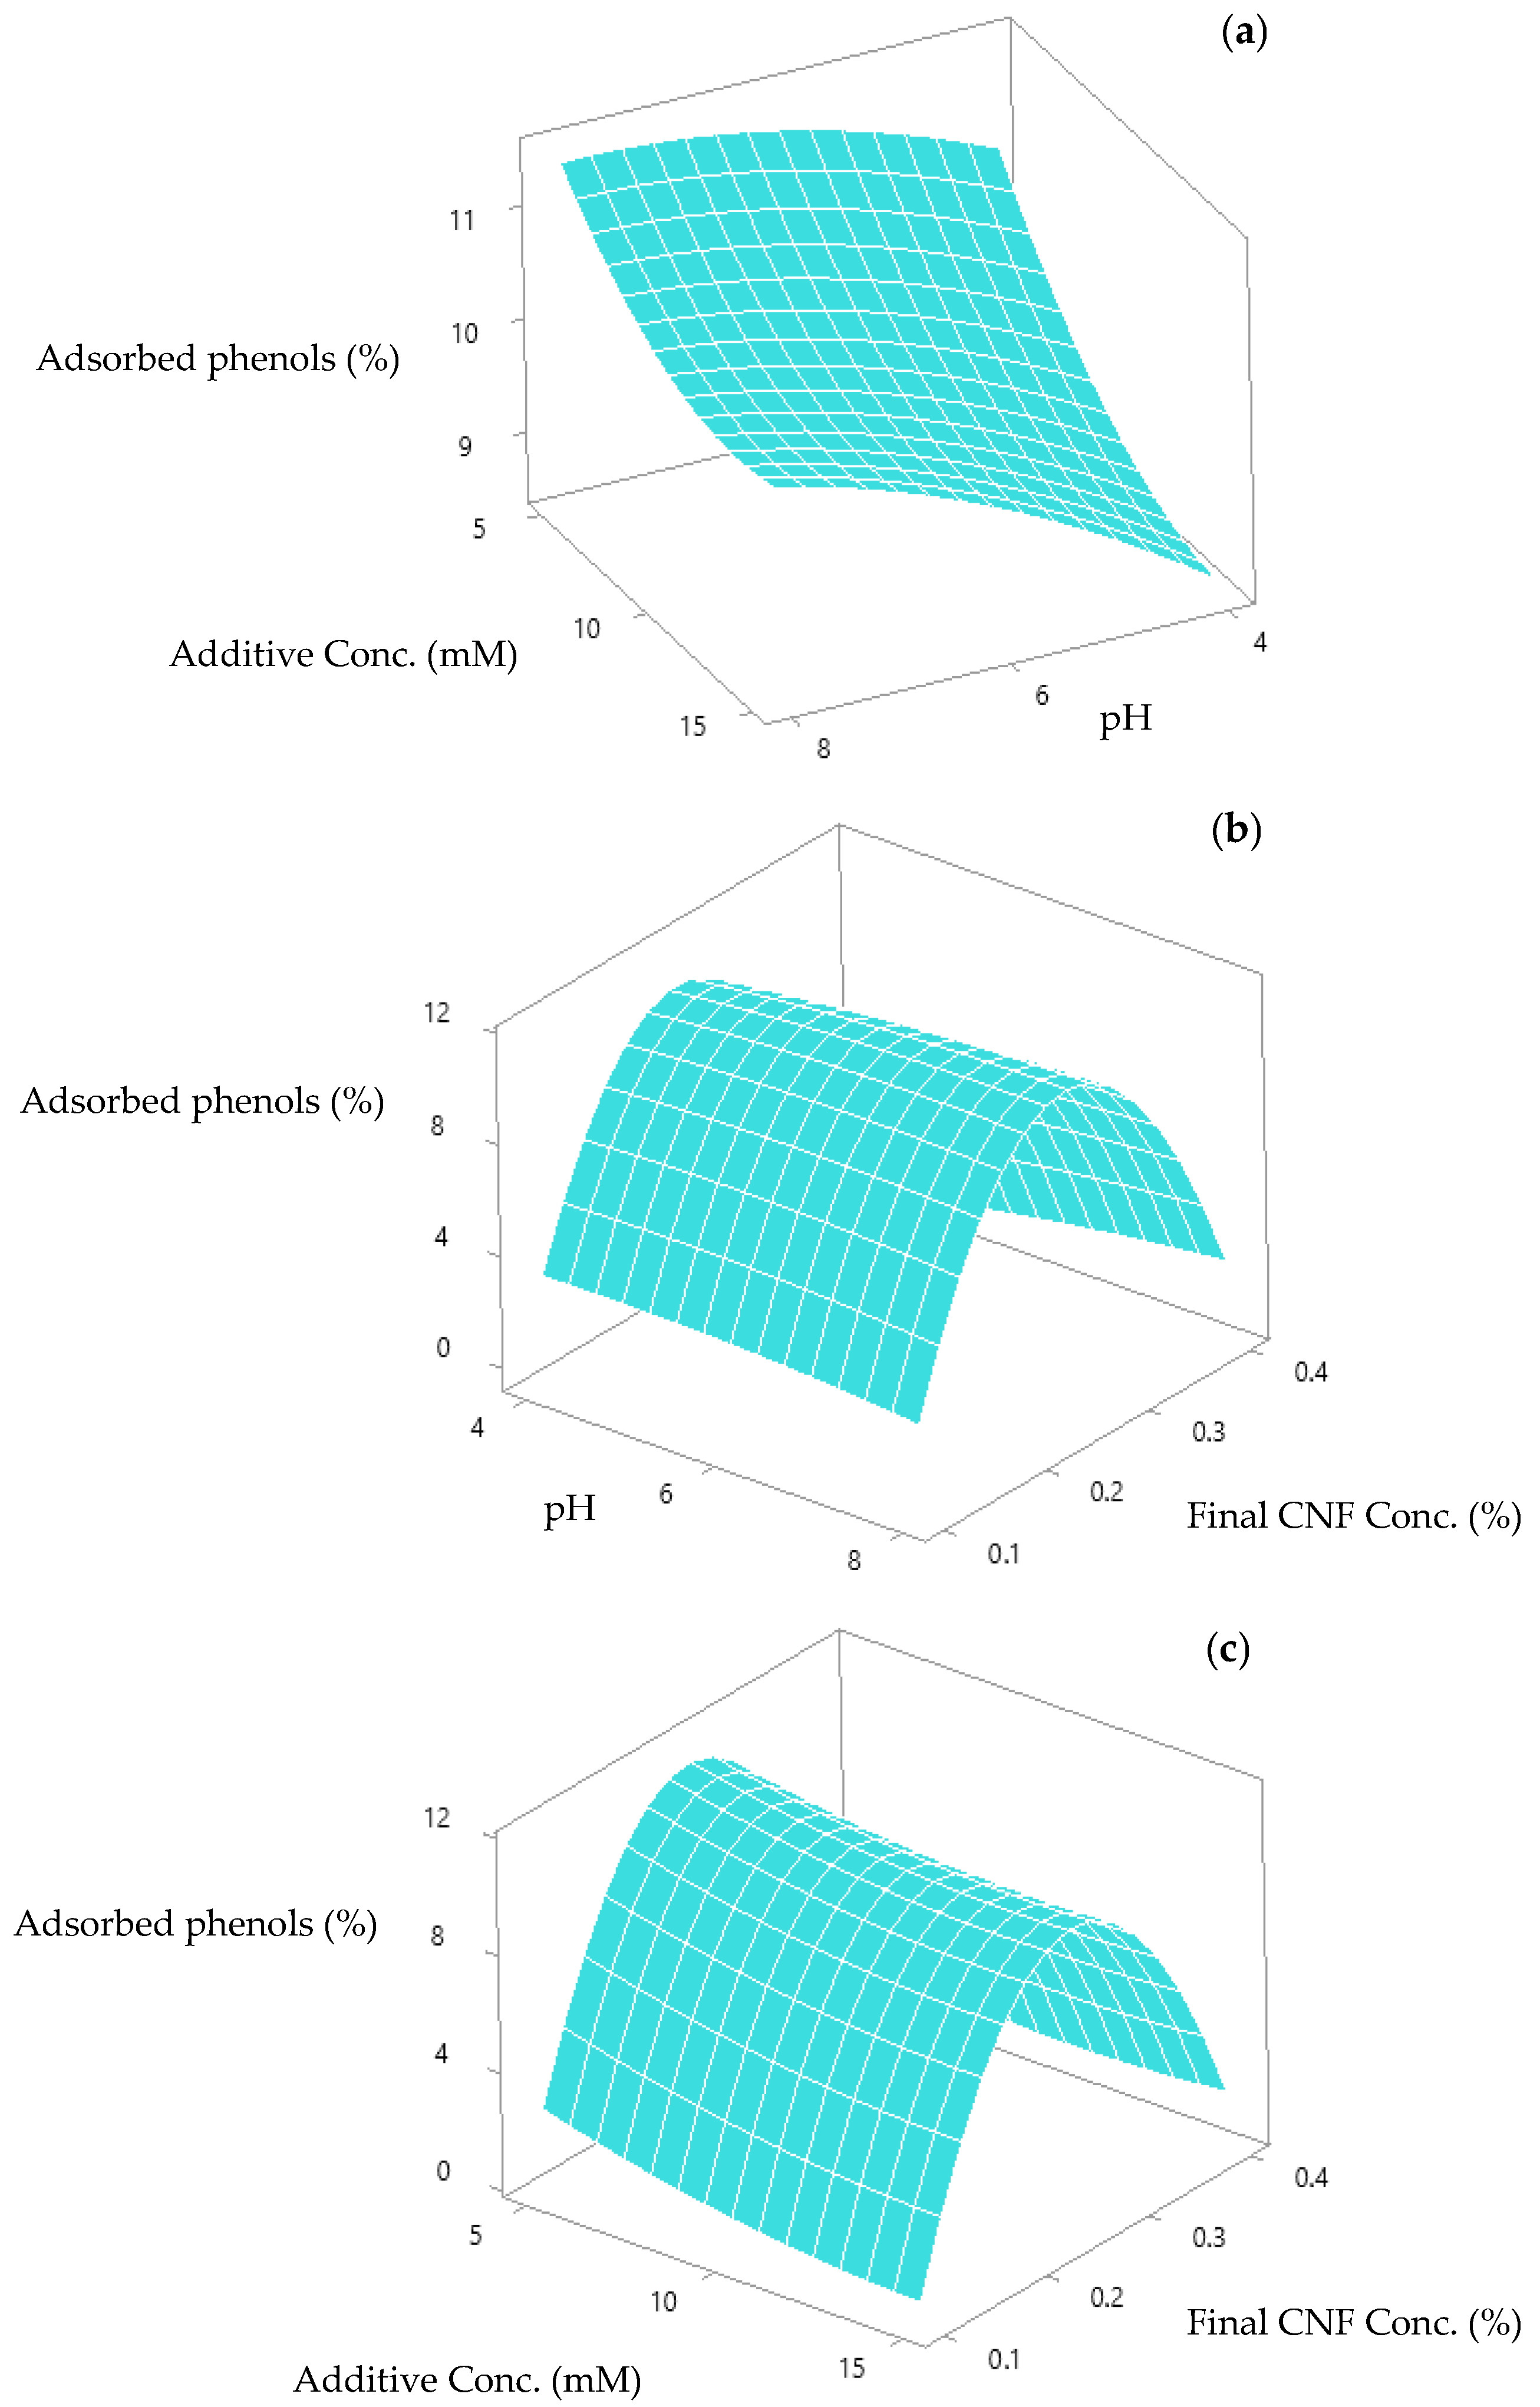
Regarding using acetosyringone as additive, Figure 4a shows the response surface when fixing final CNF concentration at 0.25% (optimal value). As can be seen, adsorbed phenols increased when pH increased, and additive concentration decreased. In the case of fixing additive concentration at 5 mM (optimal value) (Figure 4b), adsorbed phenols increased when the pH of the experiment slightly increased and final CNF concentration took medium values. When the pH of the experiment was fixed at 7.8 (optimal value) (Figure 4c), adsorbed phenols increased when additive concentration slightly decreased and final CNF concentration took medium values.
Figure 4.
Response surface for the adsorption of acetosyringone onto nanocellulose. Each panel shows the surface obtained by fixing one adsorption variable: (a) final CNF concentration at 0.25%; (b) additive concentration at 5 mM; (c) pH of the experiment at 7.8.
Other authors have studied the addition to different phenolic compounds to cellulose alone or as a reinforcement and the influence of parameters like temperature and pH on the adsorption of polyphenols onto cellulose [45,46,47,48]. In fact, the adsorption of these compounds in the plant cell membrane is also influenced by these parameters (among others) [39]. Shan et al. [49], who studied the adsorption of tannic acid onto bamboo cellulose fibers at different pH values (2, 3.5, 5, 6.5 and 8), obtained the maximum adsorption capacity of tannic acid at pH 5, because at higher pH values the phenolic groups of tannic acid oxidized, causing a decrease in the hydrogen bonds between this compound and cellulose [49]. Furthermore, at acidic pH, the phenolic groups of tannic acid are mostly protonated, acting as desirable hydrogen donors to couple with hydrogen acceptor sites [43]. In agreement, we found a similar optimal pH value (4.3) for tannic acid. The fact that the additive with the lowest molecular weight (as mentioned above) had the highest optimal CNF concentration value (0.35% vs. 0.1% and 0.25% for tannic acid and acetosyringone, respectively) may be related to the fact that a higher molecular weight can lead to greater aggregation of the suspension due to greater intermolecular attractions caused by highly branched structures, which leads to lower colloidal stability [50]. This is consistent with our results, since for the three additives tested, their molecular weight was inversely proportional to the optimal final CNF concentration value.
The optimal conditions (Table 2) were used for forming films with the three different phenolic compounds. As control, films were also formed under the same conditions as the optimal values but without additive. Films were labeled as X for films with additive and C-X for control films of each additive. X indicates the name of the additive.
3.2. Films Characterization
3.2.1. Water Vapor Barrier Properties of the Films
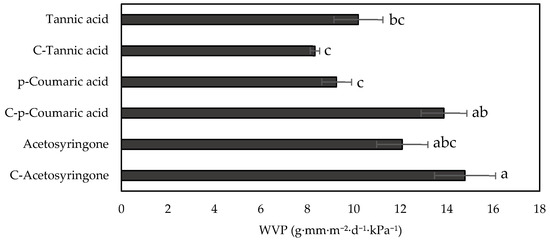
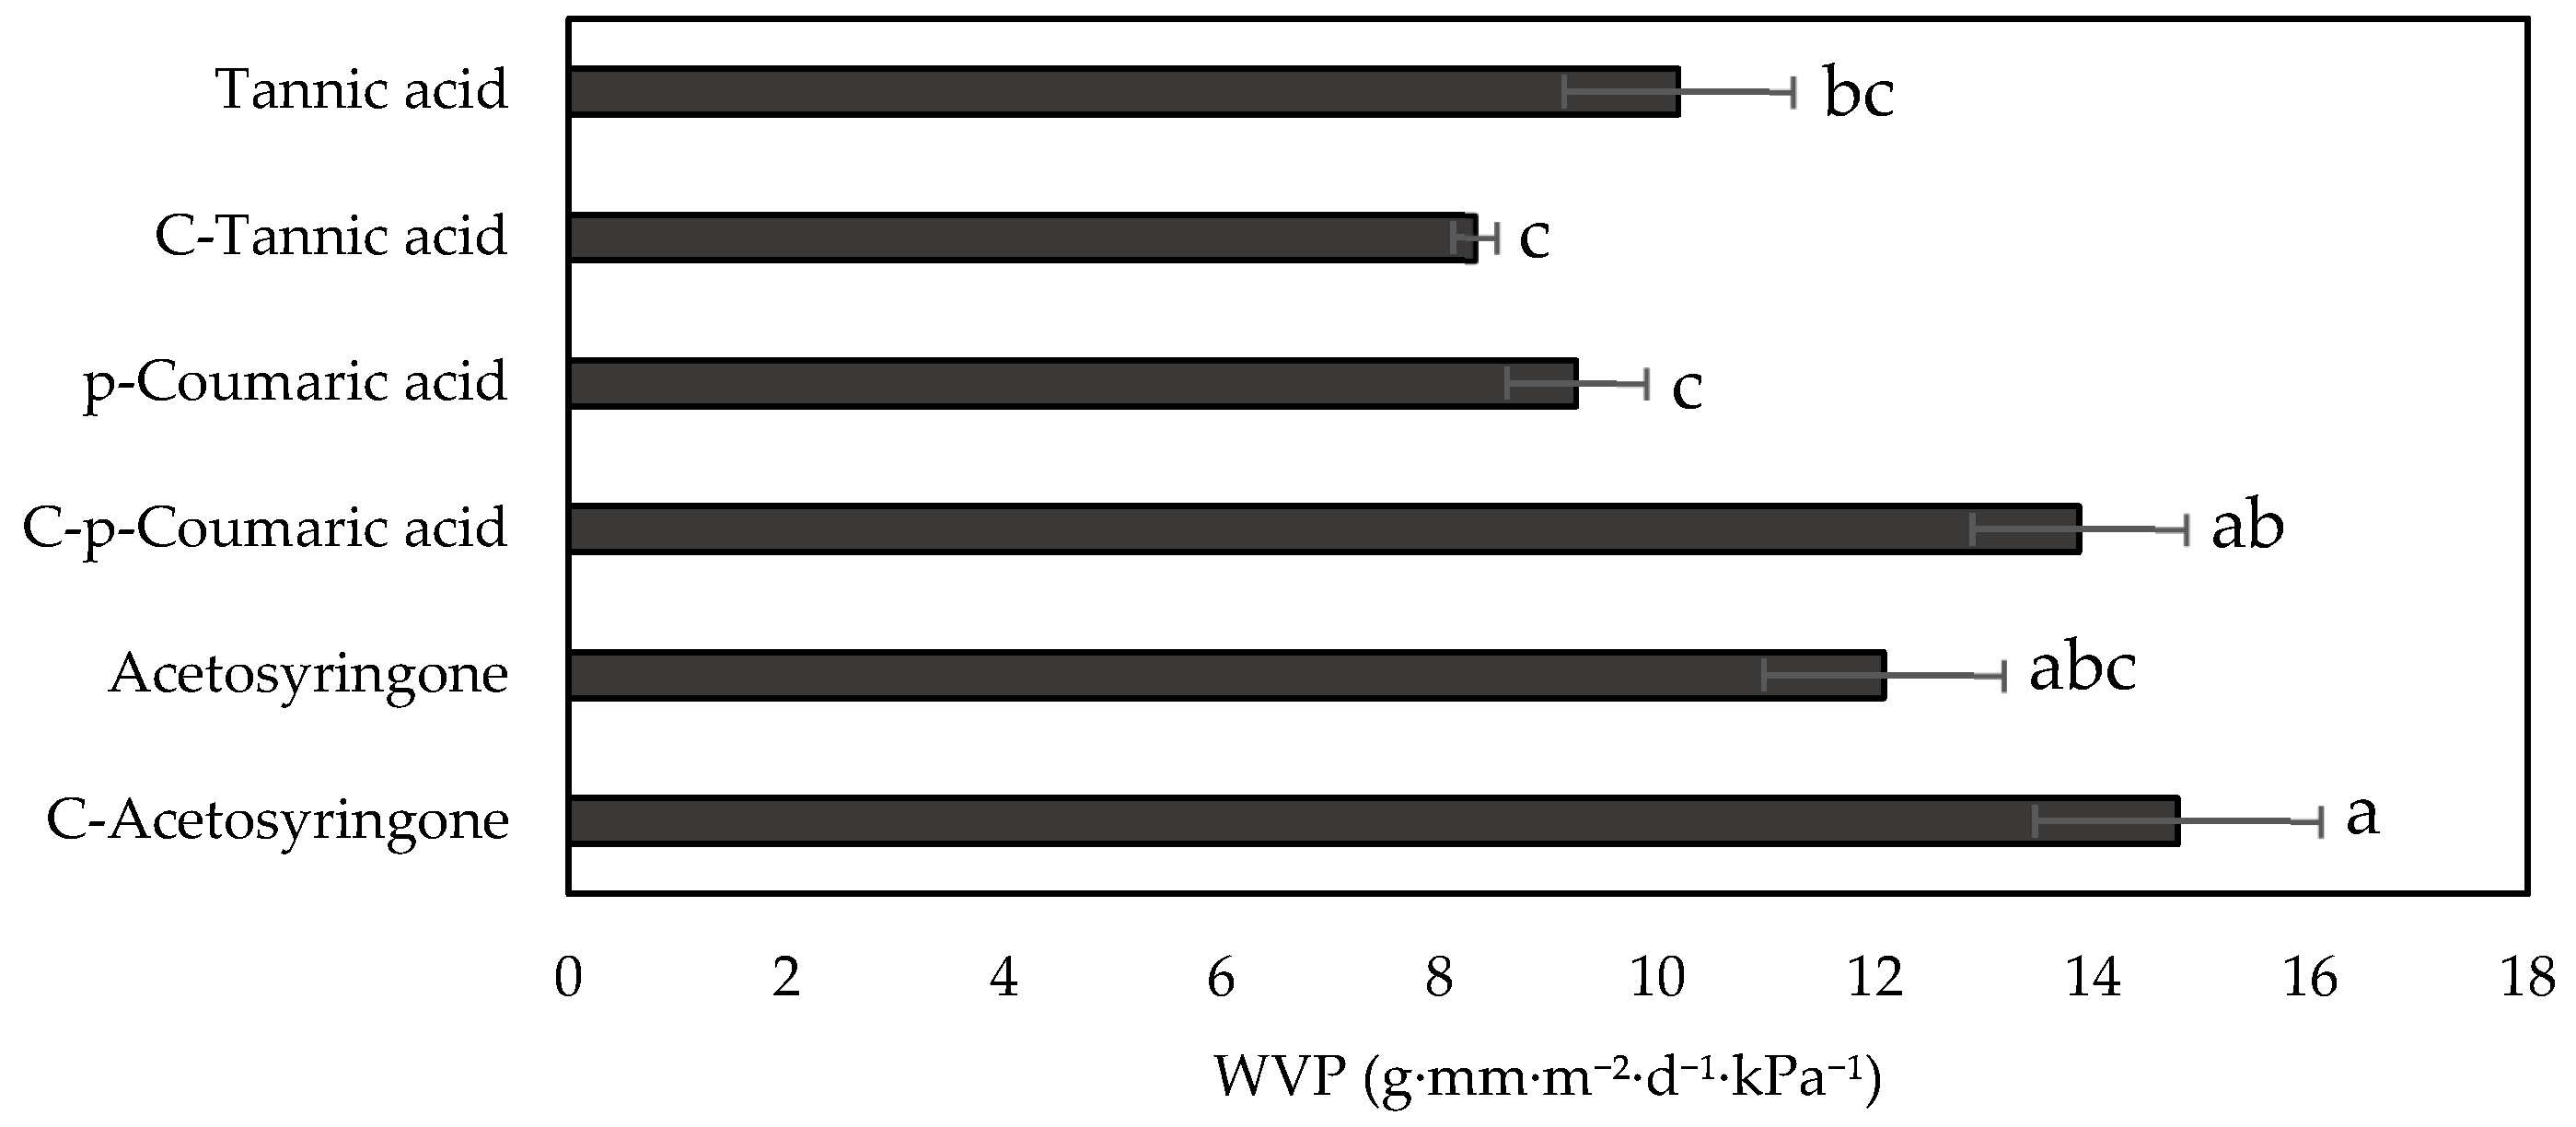
Water vapor permeability (WVP) was calculated for films and control films. Since this parameter measures the amount of vapor water that can pass through the film and consequently come into contact with the food, it is one of the most important parameters in a film whose intended application is food packaging [51]. This water vapor barrier property is affected by the presence of pores in the film and the degree of hydrophilicity of the compounds present in it, among others [52]. As can be seen in Figure 5, the addition of additives to CNFs improved the WVP values, except for the case of tannic acid where it was slightly higher. This may be related to the fact that the tannic acid molecule has a more hydrophilic nature than the other two compounds [53,54,55,56], and also to the higher amount of tannic acid added compared to the other two additives (8.5 g/L compared to 0.8 g/L and 1.0 g/L for p-coumaric acid and acetosyringone, respectively). This was also observed by Bian et al. [57], who noted that while adding a certain amount of polyphenols to lignin-reinforced cellulose nanofibrils films decreased WVP, an excess of these polyphenols increased the value of this property as it increased the content of hydroxyl groups present in this compound. Also, this phenomenon could be related to the larger size of the tannic acid molecule compared to p-coumaric acid and acetosyringone (with the molar mass of tannic acid being 1071.19 g/mol, and the molar masses of p-coumaric acid and acetosyringone being 164.05 g/mol and 196.19 g/mol, respectively). Then, molecules with a smaller size could have filled the interfibrillar gaps of the CNFs to a greater extent. This fact was already described by Garcia-Fuentevilla et al. [11] when they formed nanocellulose-lignin nanoparticle films, observing that the smaller the nanoparticle size, the lower the WVP. In this study, the greatest reduction in WVP relative to its control film is observed in films with p-coumaric acid (22%), which is the smallest molecule of the three additives used. The thicknesses of the films, necessary for calculating the WVP properties, are shown in Table 3 (ANOVA analysis data are shown in Table S2 in Supplementary Materials):
Figure 5.
Water vapor permeability (WVP) of films and control films. According to Tukey’s multiple comparison test, values followed by the same letter do not differ significantly (p < 0.05).
Table 3.
Thickness of films and control films. According to Tukey’s multiple comparison test, values followed by the same letter do not differ significantly (p < 0.05).
Nevertheless, films with tannic acid or p-coumaric acid as additives present a better behavior than acetosyringone with regard to WVP (Figure 5) (ANOVA analysis data are shown in Table S5 in Supplementary Materials). This may be due not only to the lower size of the additive (in the case of p-coumaric acid) but also to the pH of the different assays. Thus, the effect of pH was also observed for control films, observing higher WVP values for control films formed at pH 8 and 7.8 (C-p-coumaric acid and C-Acetosyringone, respectively) compared to the control film formed at pH 4.3 (C-Tannic acid). This could be related to the fact that pH affects nanofiber surface charge, since carboxylic groups become protonated under acidic conditions, reducing the surface charge and therefore the electrostatic repulsion between nanofibrils [58]. Thus, acidic pH favors a tighter compaction between nanofibers, which could explain the better barrier properties of C-Tannic acid [59]. The lowest value for these properties was obtained for the p-coumaric acid film. This could be due to the effect of the molecule size of the additive in the film, as explained above, which counteracted the effect of the pH of the solution, and to the fact that the amount of this additive in the films was the lowest (0.8 g/L compared to 8.5 g/L and 1.0 g/L for tannic acid and acetosyringone, respectively).
3.2.2. Optical Properties of the Films
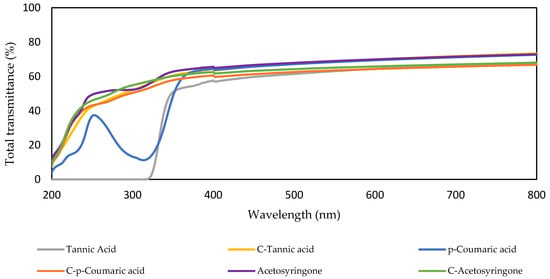
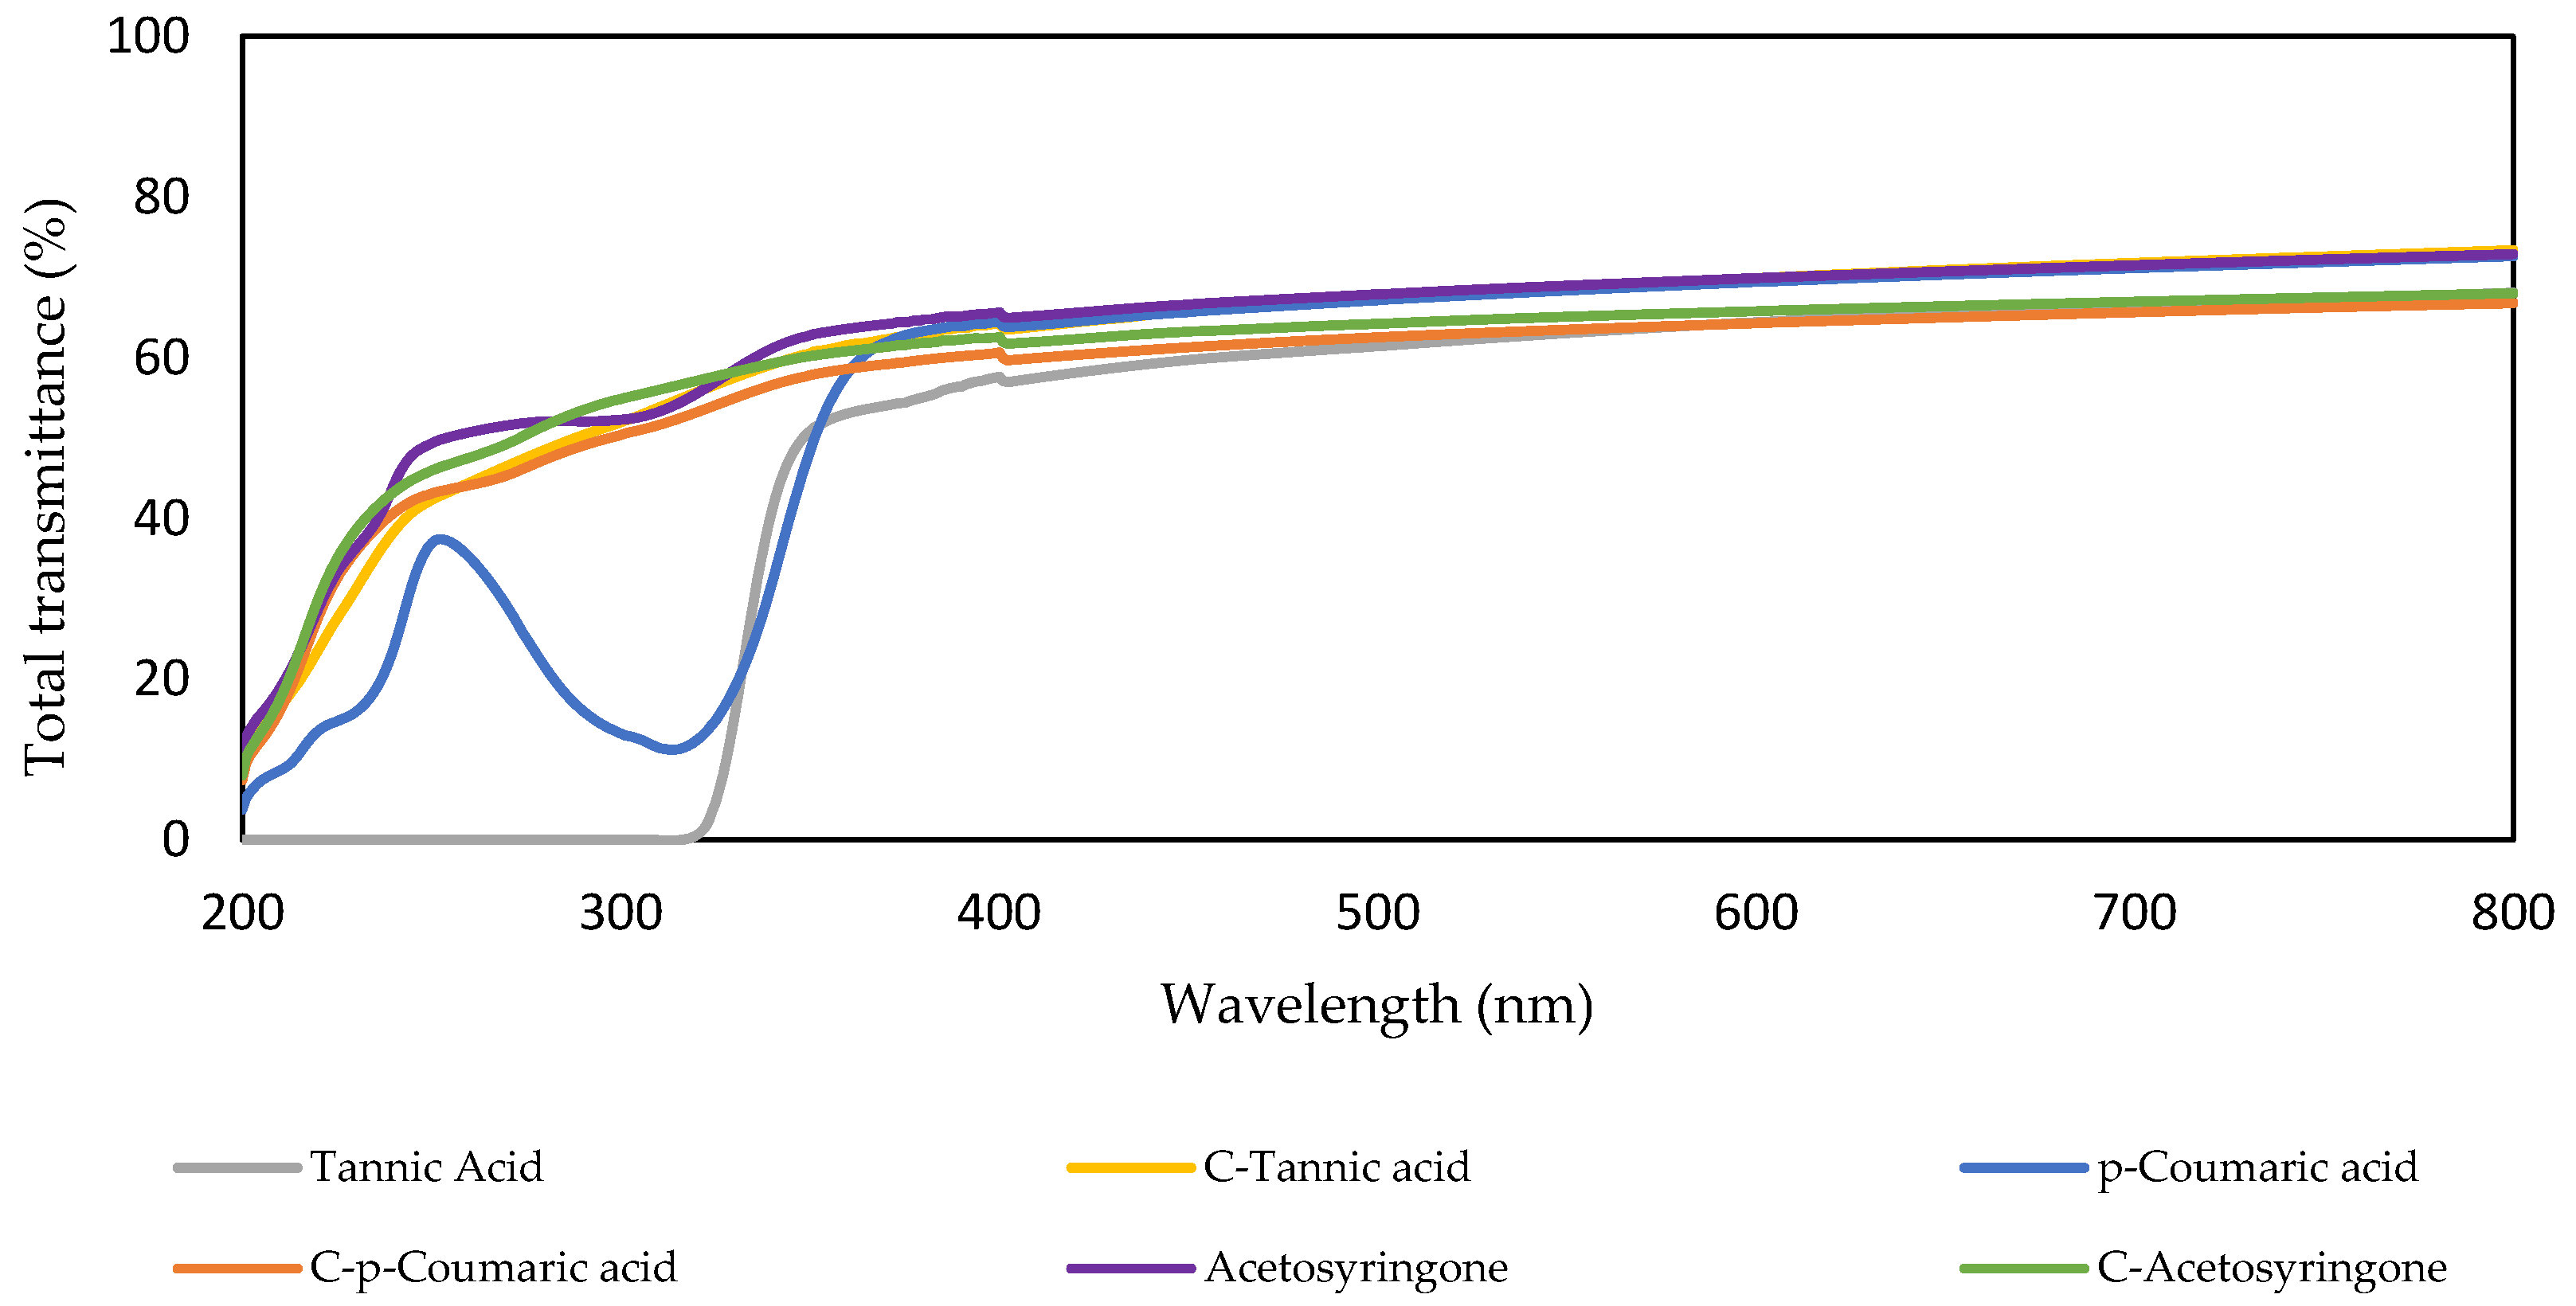
An important feature of materials designed for food packaging is the protection they offer against light exposure, since exposure to UV radiation causes lipid, protein, vitamins and flavors degradation, among others. Opacity is directly related to the amount of light that can pass through the film [60,61]. However, transparency is also important because consumers prefer to check the state of preservation of food before purchasing it [62]. Furthermore, exposure to ultraviolet radiation on food can cause photo-oxidation, which can lead to a change in the nutrients in food, a deterioration in its appearance, and the generation of harmful substances [63]. Therefore, transmittance was measured to evaluate the transparency, opacity and UV-blocking ability of the films in this study. In Figure 6, the total transmittance of the films in a wavelength range of 200–800 nm can be observed.
Figure 6.
Total transmittance of the films and control films in a wavelength range of 200–800 nm: Tannic acid (gray line), C-Tannic acid (yellow line), p-Coumaric acid (blue line), C-p-Coumaric acid (orange line), Acetosyringone (purple line) and C-Acetosyringone (green line).
With regard to transmittance and opacity at 600 nm (Table 4) (ANOVA analysis data of transmittance and opacity of the films are shown in Tables S3 and S4, respectively, in Supplementary Materials), all films showed similar values, demonstrating that the CNFs was barely affected by the addition of the additives. The transmittance values are lower than others published for films formed from nanocellulose with TEMPO-mediated oxidation pretreatment [64]; however, the raw material used, the size of the nanofibers and the film formation procedure could affect the transparency of the film. Thus, although some authors [65,66] consider a minimum of 80% optimum for transmittance values and a maximum of 5 u.a. mm−1 for opacity values, the values obtained in this study are close to these limits and would not be an impediment when using these films for food packaging.
Table 4.
Transmittance (T600) and opacity (O600) of the films and control films at 600 nm. According to Tukey’s multiple comparison test, values followed by the same letter do not differ significantly (p < 0.05).
Among the different types of radiation that reach the Earth’s surface, the one that arrives with the most energetic wavelength is UV-B radiation [67]. In this study, only the film with tannic acid as additive achieved a complete blocking of UV-B radiation (280–315 nm). In agreement, Zhang et al. [68] demonstrated the significant improvement provided by tannic acid in the anti-ultraviolet properties when added to the formulation of chitosan and gelatin composite films. Taking into account that tannic acid is composed by a glucose molecule with 10 units of gallic acid, the UV-blocking capacity of tannic acid is related to the large number of hydroxyl and chromophore groups present in gallic acid structure, according to Daré et al. [67]. As can be seen in Figure 6, the other films did not achieve complete protection against ultraviolet radiation, although p-coumaric acid did block part of the UV radiation, especially around 315.
3.2.3. FTIR Characterization
FTIR spectroscopy is a technique based on the fact that the bonds in a molecule vibrate at specific frequencies when exposed to infrared light, thanks to which FTIR spectra can be used to identify and characterize chemical compounds [69].
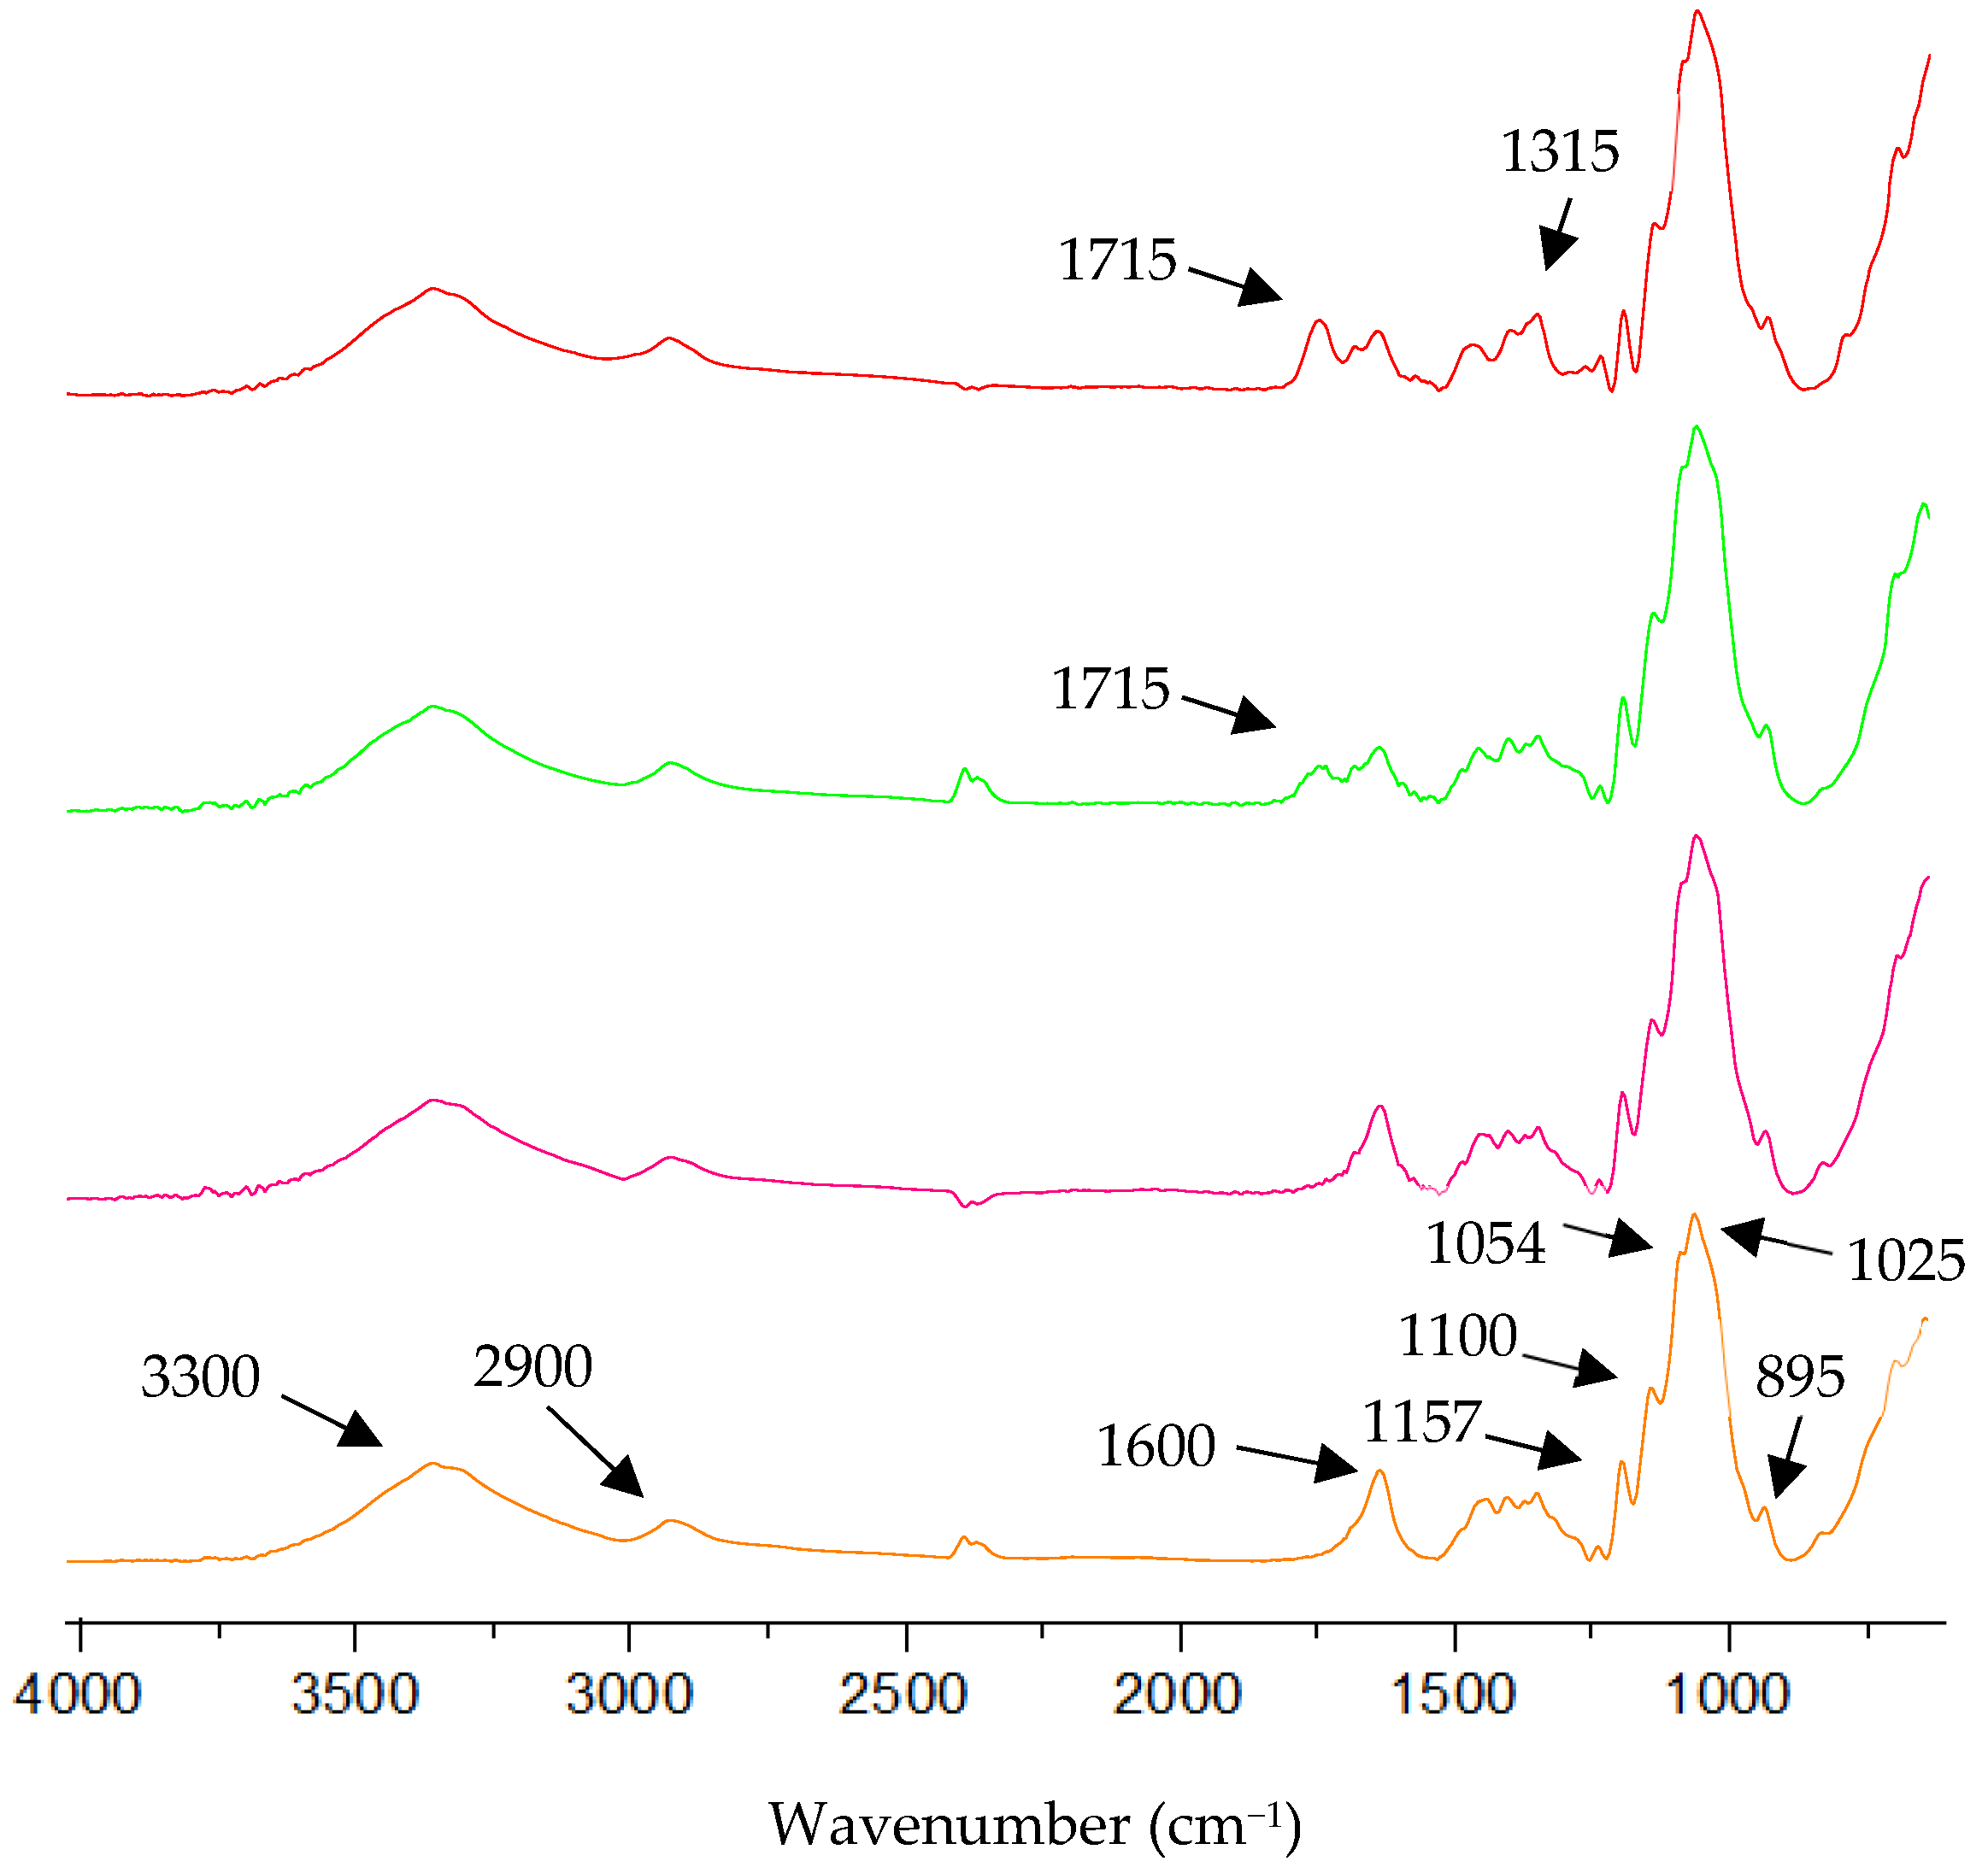
FTIR spectra of films and a control film of CNFs can be seen in Figure 7. As can be observed, all spectra have bands at 3330 cm−1 (O-H stretching vibration), 2900 cm−1 (C-H stretching vibration), 1157, 1100, 1054 and 1025 cm−1 (cellulose rings (C-O-C)), and 895 cm−1 (glycosidic bond vibration) [11]. In addition, a band is observed at 1600 cm−1, attributed to the carboxyl groups of TEMPO-oxidized nanocellulose [70]. For its part, the FTIR spectrum for tannic acid film has a more prominent band at 1715 cm−1 regarding the control film. This band can be attributed to the vibration of C=O stretching bonds of free gallic acid units [71]. The presence of free gallic units in the film can be attributed to the fact that under acidic conditions, tannic acid hydrolyzes to gallic acid units [72], and this film was formed at a pH of 4.3. At 1315 cm−1, a more prominent band of the control film can also be found. This band can be attributed to the presence of a hydrolysable tannin such as tannic acid [71]. In the case of the p-coumaric acid film, a band at 1715 cm−1 can be seen. This band is related to the existence of a carbonyl group in p-coumaric acid [73]. In the case of acetosyringone, no differences are observed between the film with acetosyringone and the control film, probably due to a lower mass concentration of this additive in the film.
Figure 7.
FTIR spectra, 4000–600 cm−1 region of the films and a control film of CNFs: Tannic acid (red line), p-Coumaric acid (green line), Acetosyringone (pink line), and control film of CNFs (orange line).
3.2.4. Antioxidant Activity
One of the main objectives of food packaging is to prevent the oxidation of lipids and proteins. The compounds generated by this oxidation can be harmful to humans once ingested, causing, for example, inflammatory damage to the intestines, liver, kidneys, and lungs [74,75,76]. The antioxidant capacity of tannic acid, p-coumaric acid, and acetosyringone has already been widely described. These natural phenols are especially interesting due to society’s demand for natural and safe compounds in contact with food [17,25,77,78,79].
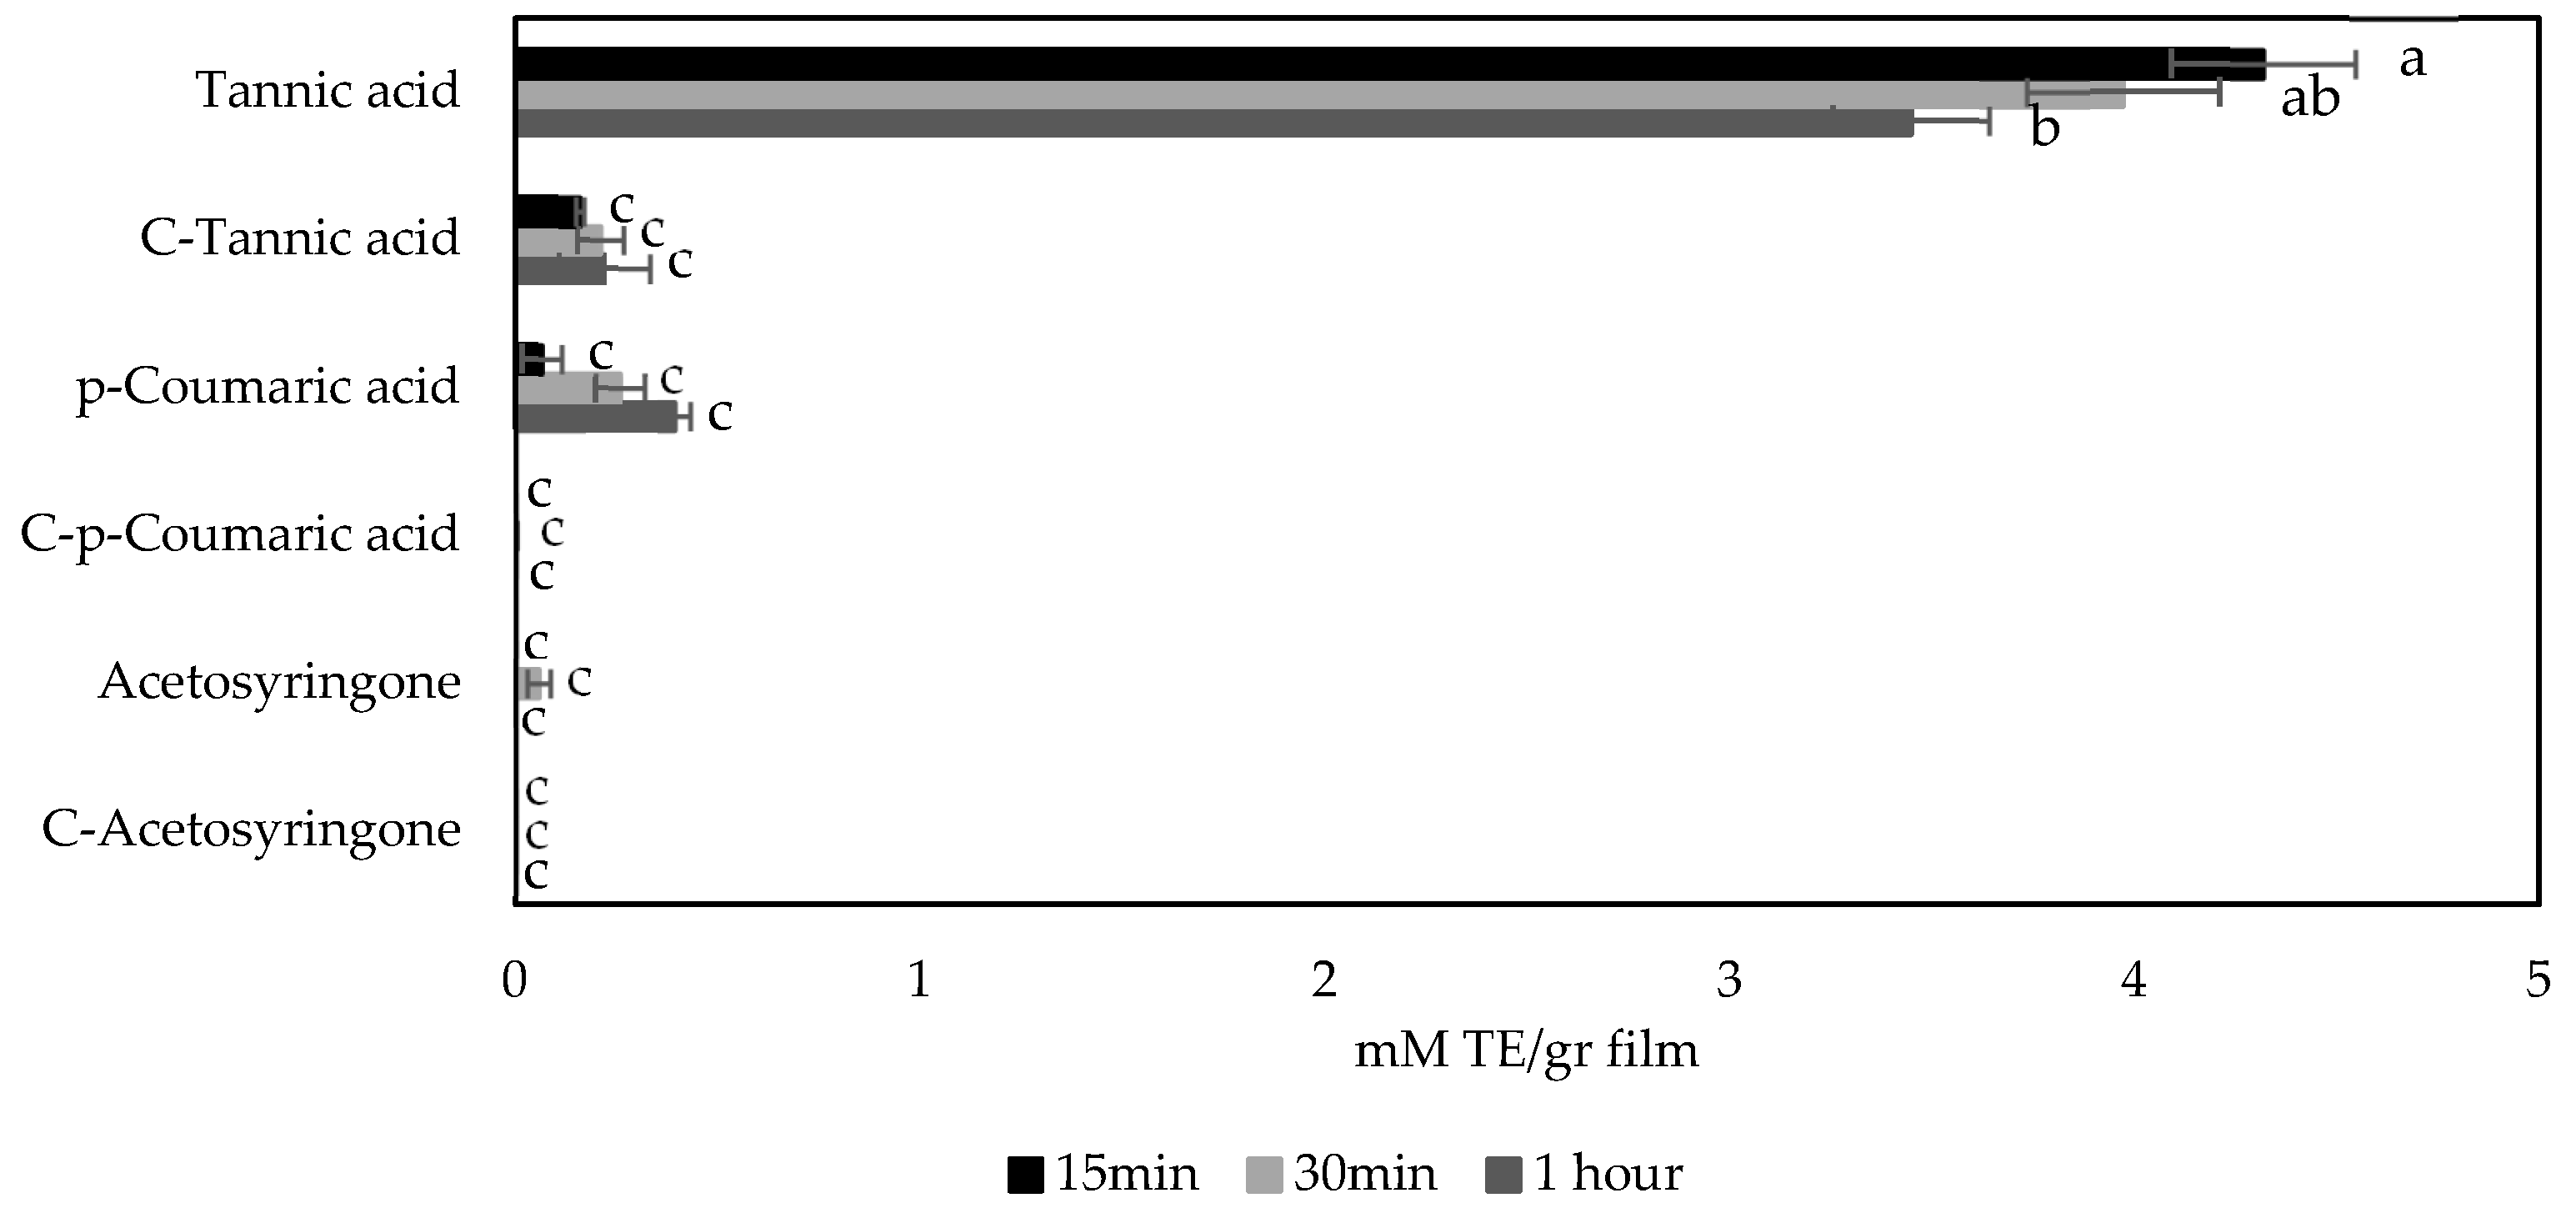
As can be seen in Figure 8, films containing tannic acid as an additive, known to have one of the highest antioxidant activities among polyphenols [21], showed greater antioxidant capacity than the other films tested. This could be due to the characteristics of the molecules since p-coumaric acid and acetosyringone are monohydroxylated structures and therefore have lower antioxidant activity than tannic acid due to the resonance stabilizing capacity of these structures [80]. For its part, tannic acid is a polyphenol consisting of a central glucose molecule to which ten gallic acid units are linked by ester bonds [20], which would explain the higher antioxidant capacity of this compound. Nevertheless, although the same molar concentration of the three additives was used in the films, the higher molecular weight of tannic acid resulted in much higher mass concentration of tannic acid (8.5 g/L compared to 0.8 g/L and 1.0 g/L for p-coumaric acid and acetosyringone, respectively), which probably played a main role in the higher antioxidant capacity of the tannic acid films.
Figure 8.
Antioxidant capacity of films and control films measured according to DPPH free radical scavenging assay. According to Tukey’s multiple comparison test, values followed by the same letter do not differ significantly (p < 0.05).
As for the control films, Figure 8 shows that the control film of tannic acid exhibited antioxidant activity (ANOVA analysis data are shown in Table S6 in Supplementary Materials). This could be due to the fact that this film was formed at acid pH (4.3) and could retain some of the acid used to adjust the pH, since measuring antioxidant capacity following DPPH assay under acidic conditions can lead to false positives [81].
3.2.5. Antibacterial Capacity
Foodborne illnesses such as vomiting, diarrheal, enteritis, and others affect around 600 million people worldwide [82]. These diseases can be caused by the microbial load of a food, which is why one of the major challenges for the food industry is to control the presence of pathogenic and putrefactive bacteria in food [83]. S. aureus and E. coli are among the species of bacteria that can cause these types of conditions [84,85,86,87].
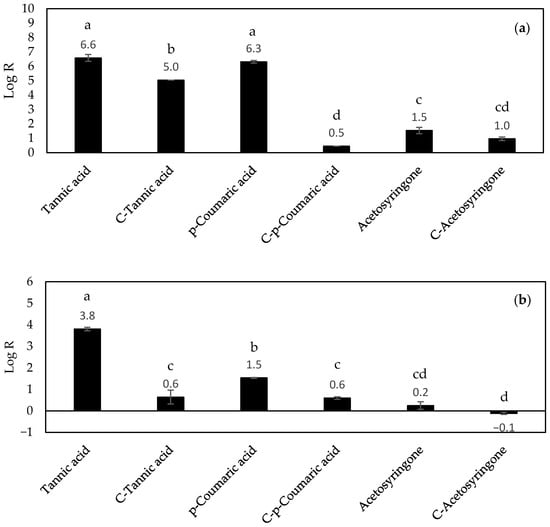
Phenolic compounds are known to have antimicrobial activity [88]. When they come into contact with food, they can inhibit the growth of pathogenic microorganisms [88]. For example, microorganisms that grow under aerobic conditions require iron to grow, and tannic acid can act as a siderophore by chelating iron and making it inaccessible to these microorganisms [89]. In the case of p-coumaric acid, it disrupts bacterial cell membranes and inhibits bacterial functions by binding to bacterial genomic DNA [90]. According to Fillat et al. [91], acetosyringone on its own appears to have lower antibacterial capacity than other phenols, although they have described some activity against S. aureus [91]. However, in combination with hydrogen peroxide and peroxidase, it appears to be more effective in terms of antimicrobial activity [30]. This is consistent with the results observed in Figure 9, where films with acetosyringone as additive showed the lowest antimicrobial activity among all the films with additives (Log R of 1.5 ± 0.2 and 0.2 ± 0.2 for S. aureus and E. coli, respectively). On the other hand, the films with tannic acid as an additive exhibited the highest level of antimicrobial activity compared to the other films (log R of 6.6 ± 0.2 and 3.8 ± 0.1 for S. aureus and E. coli, respectively) (Figure 9) (ANOVA analysis data are shown in Tables S7 and S8 for S. aureus and E. coli, respectively, in Supplementary Materials). Similarly, films with p-coumaric acid as additive also showed a high antibacterial capacity, especially against S. aureus (Log R values of 6.3 ± 0.1 and 1.5 ± 0.0 for S. aureus and E. coli, respectively). Other authors also reported high antibacterial capacity of tannic acid and p-coumaric acid against these two bacteria [90,92,93,94,95]. The higher antibacterial capacity obtained for films with tannic acid as additive could be related to the fact that the mass concentration of additive of these films was higher than that of p-coumaric and acetosyringone as mentioned above (8.5 g/L vs. 1–0.8 g/L). Furthermore, films formed with tannic acid as an additive had a pH of 4.3. Under acidic conditions, tannic acid hydrolyzes to gallic acid units, which appears to be more effective against microorganisms. This fact could contribute to the higher values obtained with the tannic acid films [72].
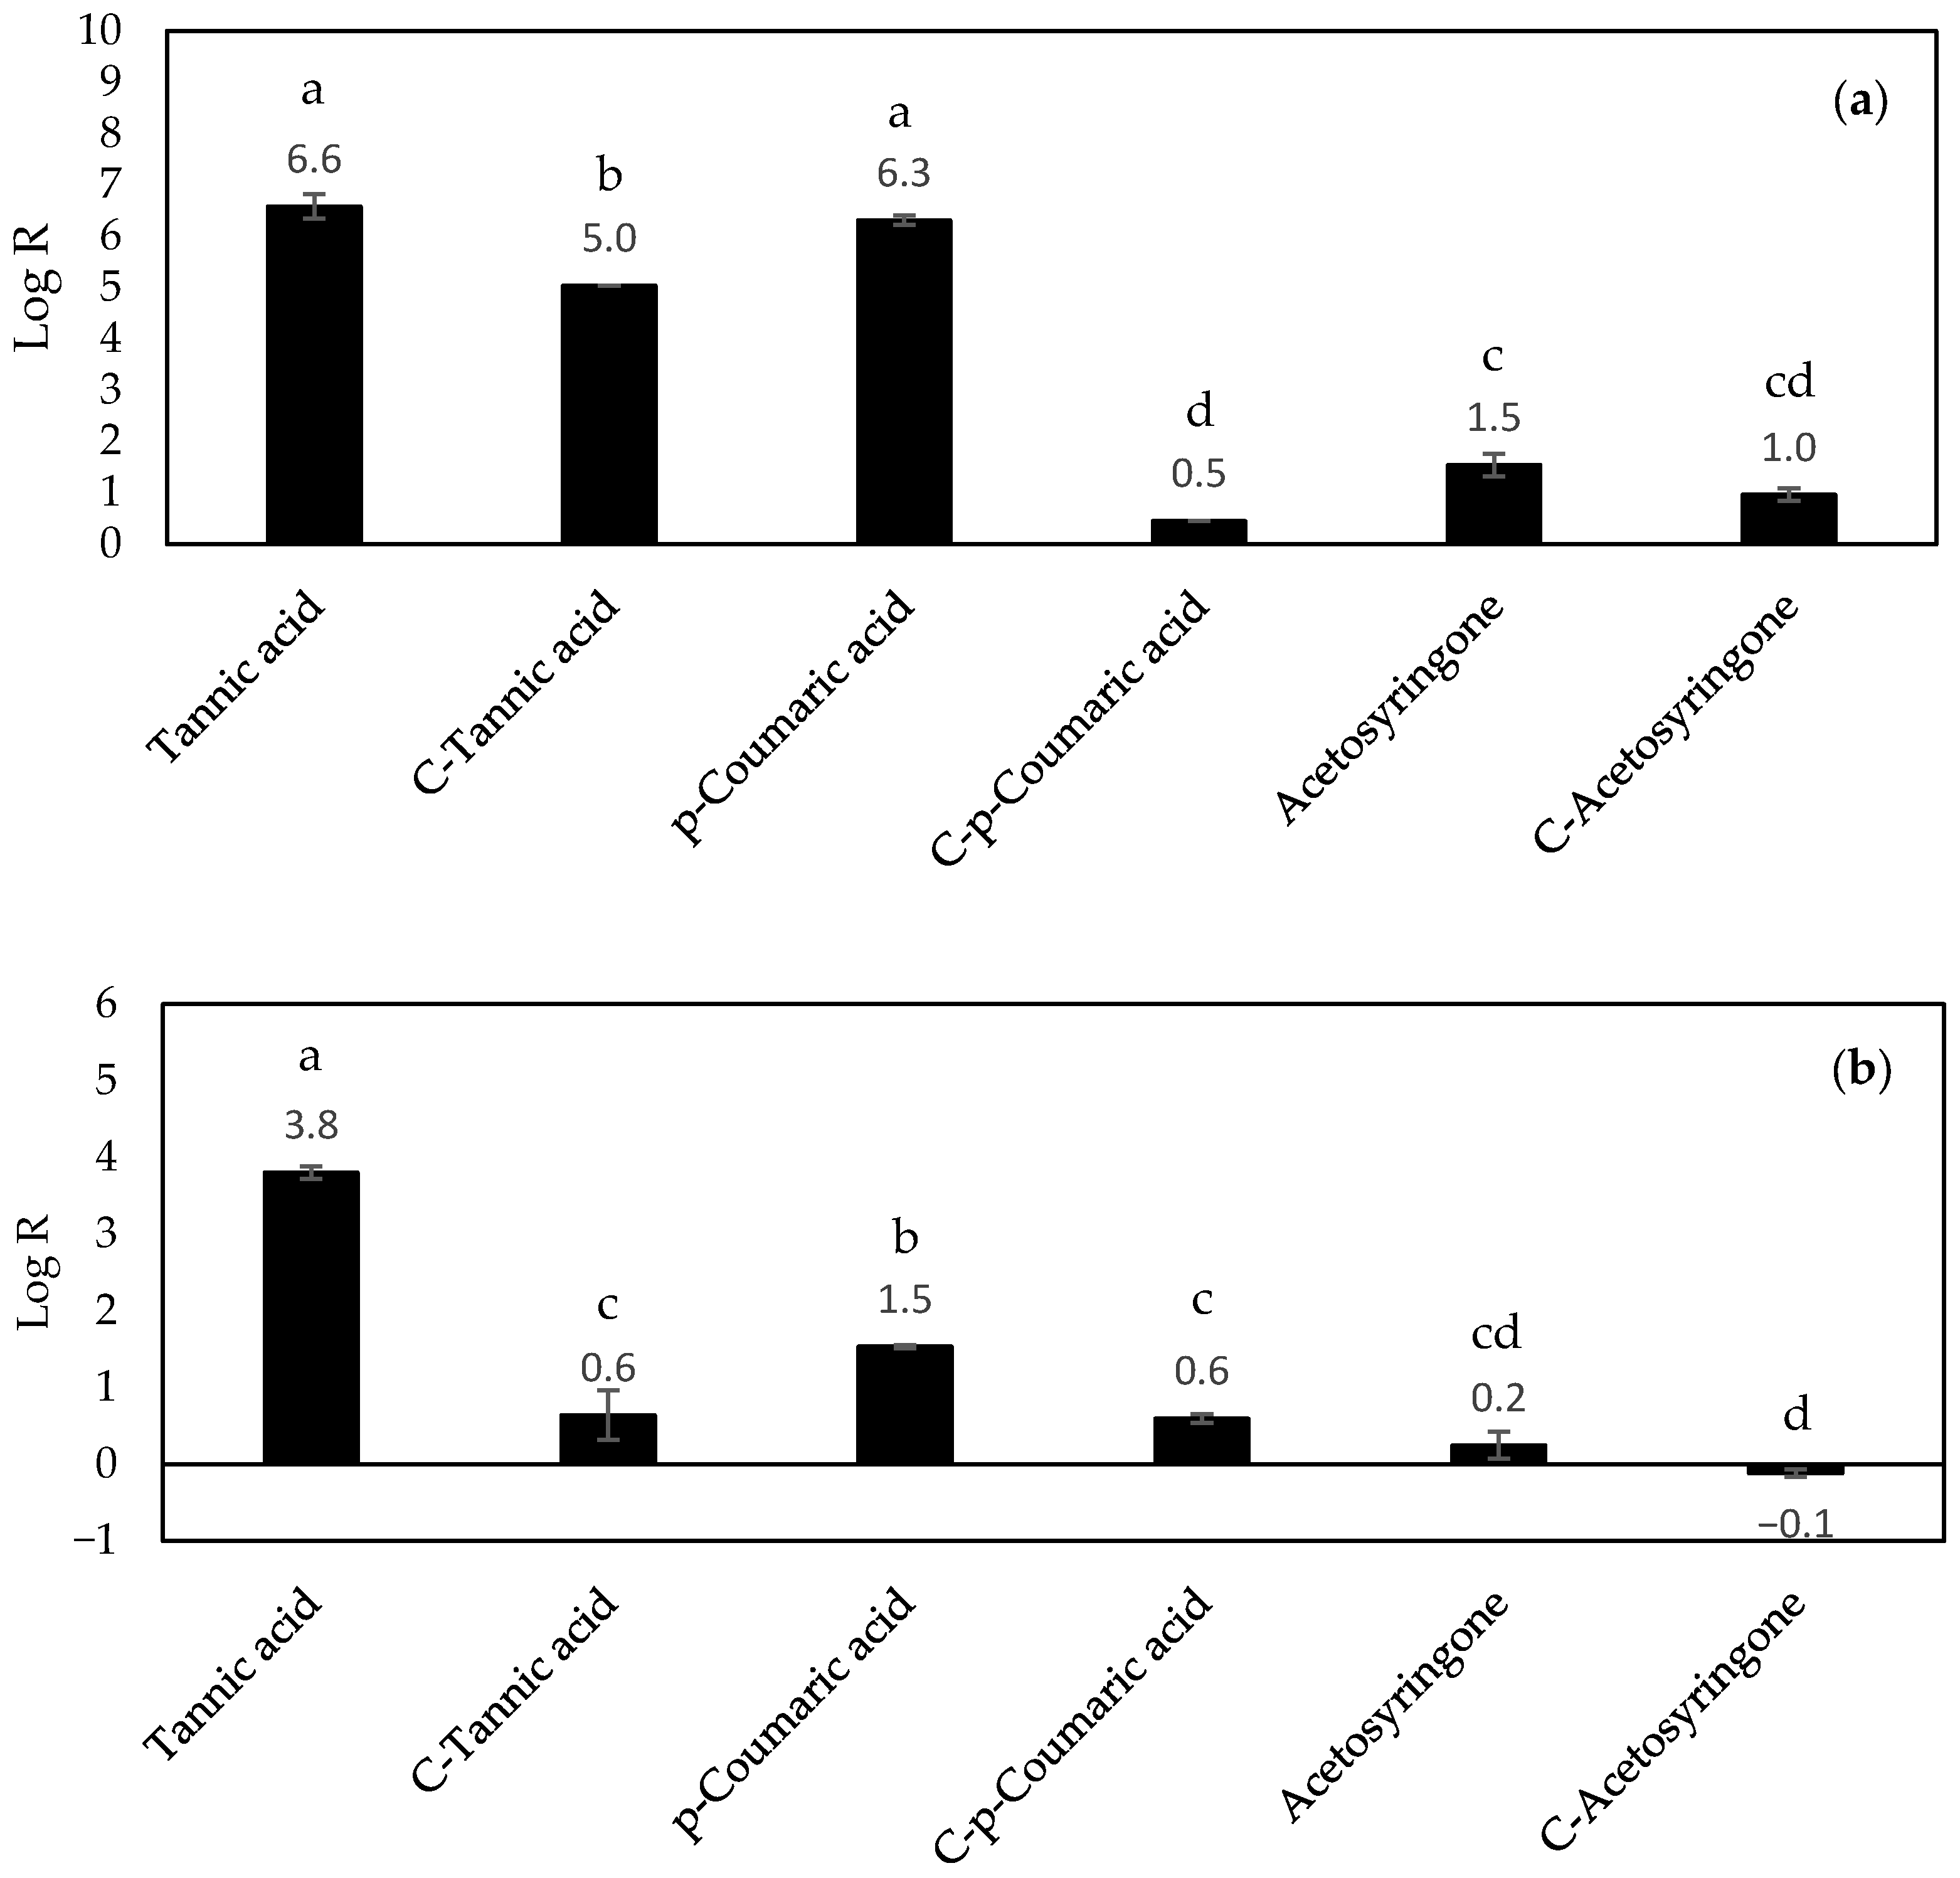
Figure 9.
Antibacterial capacity of films and control films expressed as Log R measured against (a) S. aureus and (b) E. coli. According to Tukey’s multiple comparison test, values followed by the same letter do not differ significantly (p < 0.05).
As can be seen, all films exhibited higher antimicrobial activity against S. aureus than E. coli (Figure 9a and Figure 9b, respectively). This is due to the cell wall of Gram-negative bacteria since it contains lipids, proteins, and lipopolysaccharides which act as protection against biocides. The cell wall of Gram-positive bacteria does not have lipopolysaccharides, which are the main contributors to the resistance of Gram-negative bacteria, so it has less protection against some antibacterial compounds [96,97]. On the other hand, the control films for each additive were tested too. As can be seen in Figure 9, the tannic acid control film showed antibacterial capacity against S. aureus. This could be related to the pH of the forming solution for this film, which was 4.3. This pH value is outside the pH range for the growth of S. aureus and E. coli. These ranges are 4–10 for S. aureus (the optimum being 6–7) [98], and 4.5–9 for E. coli (the optimum being 6.5–7.5) [99,100].
Although these results demonstrate the antibacterial capacity of these films against Gram-positive and Gram-negative bacteria, such as S. aureus and E. coli, respectively, these are preliminary results and a more comprehensive antibacterial analysis would be necessary to obtain more conclusive results including additional assays such as MIC/MBC determinations or time-kill curves.
4. Conclusions
The incorporation of three different phenolic compounds (tannic acid, p-coumaric acid, and acetosyringone) into nanocellulose was optimized using a Box–Behnken design in which pH, additive concentration, and final CNF concentration were chosen as input variables. The phenols adsorbed onto the CNFs were chosen as the output variable, with tannic acid being the additive that adsorbed more phenols (60.4% vs. 28.1% and 12.6% for p-coumaric acid and acetosyringone, respectively). Once the experimental design was completed, films were formed under the optimal conditions for each additive analyzed. The films and their controls were characterized in terms of water vapor barrier properties, optical properties, and antioxidant and antibacterial activities. In addition, FTIR analysis was performed on the films with additive revealing the incorporation of these compounds into the films in the case of tannic acid and p-coumaric acid. Regarding water vapor barrier properties, films with p-coumaric acid showed the lowest value (9.26 g·mm·m−2·d−1·kPa−1) due to the smaller size of the molecule. However, in the rest of the properties measured, it was the films with tannic acid that obtained the best results, achieving complete blocking of UV-B radiation and the highest antioxidant capacity (4.32 mM TE/g film) and antibacterial capacity (log R of 6.6 ± 0.2 and 3.8 ± 0.1 for S. aureus and E. coli, respectively). Furthermore, the results of the antioxidant and antibacterial properties observed in these films and their UV-blocking capacity are consistent with those observed in the FTIR analysis.
Taking all of the above into account, although the films with tannic acid developed in this study cannot compete with packaging made from traditional plastics in terms of mechanical properties or barrier properties, they can, however, provide antioxidant and antibacterial properties that traditional plastics lack. Nevertheless, more in-depth studies and measurements of other properties are needed to make these films viable for use in food packaging. In this regard, future work will study the incorporation of other additives and biopolymers into these films to improve their properties and achieve the requirements for food packaging applications. It will also be necessary to evaluate their compliance with current food-contact legislation, as well as the possible migration of phenolic compounds into food. In addition, the long-term stability of the phenol-loaded films should be investigated. Finally, although the industrial production of nanocellulose-based films is feasible [101], further research is needed to determine whether the incorporation of different additives and biopolymers is compatible with large-scale manufacturing.
Supplementary Materials
The following supporting information can be downloaded at: https://www.mdpi.com/article/10.3390/macromol6020022/s1, Table S1: Adsorbed phenols (%) for the different phenolic compounds tested in the experimental design; Table S2: ANOVA analysis of the thickness of the films; Table S3: ANOVA of the transmittance of the films; Table S4: ANOVA of the opacity of the films; Table S5: ANOVA of the WVP properties of the films; Table S6: ANOVA of the antioxidant properties of the films; Table S7: ANOVA of the antibacterial capacity of films and control films against S. aureus; Table S8: ANOVA of the antibacterial capacity of films and control films against E. coli.
Author Contributions
Conceptualization, D.I., M.E.E. and R.M.-S.; methodology, L.L.G.-F.; software, L.L.G.-F.; validation, L.L.G.-F.; formal analysis, L.L.G.-F.; investigation, L.L.G.-F., D.I., M.E.E. and R.M.-S.; resources, D.I. and M.E.E.; data curation, L.L.G.-F., D.I., M.E.E. and R.M.-S.; writing—original draft preparation, L.L.G.-F.; writing—review and editing, L.L.G.-F., D.I., M.E.E. and R.M.-S.; visualization, L.L.G.-F.; supervision, D.I., M.E.E. and R.M.-S.; project administration D.I. and M.E.E.; funding acquisition, D.I. and M.E.E. All authors have read and agreed to the published version of the manuscript.
Funding
This research was funded by MCIN/AEI/10.13039/501100011033 and by the “European UnionNextGenerationEU/PRTR” via project TED2021-132122B-C21; MCIN/AEI/10.13039/501100011033 and by “ERDF A way of making Europe” via project PID2022-141965OB-C21; and by Comunidad de Madrid via project AgroSUSTEC-CM (TEC-2024/BIO-27).
Institutional Review Board Statement
Not applicable.
Data Availability Statement
The raw data supporting the conclusions of this article will be made available by the authors on request.
Acknowledgments
Authors are also grateful for the support of the Interdisciplinary Platform for Sustainable Plastics towards a Circular Economy (SusPlast-CSIC), Madrid, Spain; Interdisciplinary Platform for Sustainability and Circular Economy (SosEcoCir-CSIC), Madrid, Spain; Interdisciplinary Platform Horizonte Verde (CSIC), Madrid, Spain; and RED LIGNOCEL (RED2024-153800-T) funded by MICIU/AEI/10.13039/501100011033.
Conflicts of Interest
The authors declare no conflicts of interest.
Abbreviations
The following abbreviations are used in this manuscript:
| CNF | Cellulose Nanofibers |
| FTIR | Fourier-Transform Infrared |
| GHG | Greenhouse Gases |
| WVP | Water Vapor Permeability |
References
- United Nations Causes and Effects of Climate Change. Available online: https://www.un.org/en/climatechange/science/causes-effects-climate-change (accessed on 12 October 2025).
- European Commission: Joint Research Centre. GHG Emissions of All World Countries—2025; Publications Office of the European Union: Luxembourg, 2025. [Google Scholar]
- Jürgens, M.; Mudersbach, M.; Endres, H.-J. Circular Economy Implementation for Plastic Products in SMEs: Framework Development and Practical Application in Case Studies. Circ. Econ. Sustain. 2025, 5, 4629–4658. [Google Scholar] [CrossRef] [Scilit]
- European Environment Agency. GHG Emissions from EU’s Plastics Value Chain. Available online: https://www.eea.europa.eu/en/circularity/sectoral-modules/plastics/ghg-emissions-from-eus-plastics-value-chain (accessed on 12 October 2025).
- Tenhunen-Lunkka, A.; Rommens, T.; Vanderreydt, I.; Mortensen, L. Greenhouse Gas Emission Reduction Potential of European Union’s Circularity Related Targets for Plastics. Circ. Econ. Sustain. 2023, 3, 475–510. [Google Scholar] [CrossRef] [Scilit] [PubMed]
- The United Nations Environment Programme. Everything You Need to Know about Plastic Pollution. Available online: https://www.unep.org/news-and-stories/story/everything-you-need-know-about-plastic-pollution (accessed on 12 October 2025).
- Najahi, H.; Banni, M.; Nakad, M.; Abboud, R.; Assaf, J.C.; Operato, L.; Belhassen, M.; Gomes, L.; Hamd, W. Plastic Pollution in Food Packaging Systems: Impact on Human Health, Socioeconomic Considerations and Regulatory Framework. J. Hazard. Mater. Adv. 2025, 18, 100667. [Google Scholar] [CrossRef] [Scilit]
- Jadhav, E.B.; Sankhla, M.S.; Bhat, R.A.; Bhagat, D.S. Microplastics from Food Packaging: An Overview of Human Consumption, Health Threats, and Alternative Solutions. Environ. Nanotechnol. Monit. Manag. 2021, 16, 100608. [Google Scholar] [CrossRef] [Scilit]
- Yang, J.; Guo, P. Review of the Application of Nanocellulose in Food. J. Nat. Fibers 2025, 22, 2510452. [Google Scholar] [CrossRef] [Scilit]
- Janeni, J.; Adassooriya, N.M. Chapter 3—Nanocellulose Biopolymer-Based Biofilms: Applications and Challenges. In Biopolymer-Based Nano Films; Rai, M., dos Santos, C.A., Eds.; Elsevier: Amsterdam, The Netherlands, 2021; pp. 43–62. [Google Scholar]
- García-Fuentevilla, L.L.; Martín-Sampedro, R.; Darder, M.; Ibarra, D.; Eugenio, M.E. Bioactive Nanocellulose Films by Incorporation of Enzymatically Polymerized Lignin Nanoparticles. Int. J. Biol. Macromol. 2025, 299, 140051. [Google Scholar] [CrossRef] [Scilit]
- Wang, X.; Guo, J.; Ren, H.; Jin, J.; He, H.; Jin, P.; Wu, Z.; Zheng, Y. Research Progress of Nanocellulose-Based Food Packaging. Trends Food Sci. Technol. 2024, 143, 104289. [Google Scholar] [CrossRef] [Scilit]
- Zennifer, A.; Senthilvelan, P.; Sethuraman, S.; Sundaramurthi, D. Key Advances of Carboxymethyl Cellulose in Tissue Engineering & 3D Bioprinting Applications. Carbohydr. Polym. 2021, 256, 117561. [Google Scholar] [CrossRef] [Scilit]
- Quintana, E.; Valls, C.; Roncero, M.B. Dissolving-Grade Pulp: A Sustainable Source for Fiber Production. Wood Sci. Technol. 2024, 58, 23–85. [Google Scholar] [CrossRef] [Scilit]
- Dhali, K.; Ghasemlou, M.; Daver, F.; Cass, P.; Adhikari, B. A Review of Nanocellulose as a New Material towards Environmental Sustainability. Sci. Total Environ. 2021, 775, 145871. [Google Scholar] [CrossRef] [Scilit]
- Long, J.; Zhang, W.; Zhao, M.; Ruan, C.-Q. The Reduce of Water Vapor Permeability of Polysaccharide-Based Films in Food Packaging: A Comprehensive Review. Carbohydr. Polym. 2023, 321, 121267. [Google Scholar] [CrossRef] [Scilit] [PubMed]
- Olszowy, M. What Is Responsible for Antioxidant Properties of Polyphenolic Compounds from Plants? Plant Physiol. Biochem. 2019, 144, 135–143. [Google Scholar] [CrossRef] [Scilit] [PubMed]
- Jing, W.; Xiaolan, C.; Yu, C.; Feng, Q.; Haifeng, Y. Pharmacological Effects and Mechanisms of Tannic Acid. Biomed. Pharmacother. 2022, 154, 113561. [Google Scholar] [CrossRef] [Scilit] [PubMed]
- Gülçin, İ.; Huyut, Z.; Elmastaş, M.; Aboul-Enein, H.Y. Radical Scavenging and Antioxidant Activity of Tannic Acid. Arab. J. Chem. 2010, 3, 43–53. [Google Scholar] [CrossRef] [Scilit]
- Chen, C.; Yang, H.; Yang, X.; Ma, Q. Tannic Acid: A Crosslinker Leading to Versatile Functional Polymeric Networks: A Review. RSC Adv. 2022, 12, 7689–7711. [Google Scholar] [CrossRef] [Scilit]
- de Lima, G.G.; Zakaluk, I.C.B.; Artner, M.A.; Pedro, A.C.; Gonzalez de Cademartori, P.H.; Muniz, G.I.B.d.; Magalhães, W.L.E. Enhancing Barrier and Antioxidant Properties of Nanocellulose Films for Coatings and Active Packaging: A Review. ACS Appl. Nano Mater. 2025, 8, 4397–4421. [Google Scholar] [CrossRef] [Scilit]
- Osolnik, U.; Vek, V.; Korošec, R.C.; Oven, P.; Poljanšek, I. Integration of Wood-Based Components—Cellulose Nanofibrils and Tannic Acid—Into a Poly(Vinyl Alcohol) Matrix to Improve Functional Properties. Int. J. Biol. Macromol. 2024, 256, 128495. [Google Scholar] [CrossRef] [Scilit]
- Dai, H.; Chen, Y.; Zhang, S.; Feng, X.; Cui, B.; Ma, L.; Zhang, Y. Enhanced Interface Properties and Stability of Lignocellulose Nanocrystals Stabilized Pickering Emulsions: The Leading Role of Tannic Acid. J. Agric. Food Chem. 2021, 69, 14650–14661. [Google Scholar] [CrossRef] [Scilit]
- Pei, K.; Ou, J.; Huang, J.; Ou, S. p-Coumaric Acid and Its Conjugates: Dietary Sources, Pharmacokinetic Properties and Biological Activities. J. Sci. Food Agric. 2016, 96, 2952–2962. [Google Scholar] [CrossRef] [Scilit]
- Ferreira, P.S.; Victorelli, F.D.; Fonseca-Santos, B.; Chorilli, M. A Review of Analytical Methods for p-Coumaric Acid in Plant-Based Products, Beverages, and Biological Matrices. Crit. Rev. Anal. Chem. 2019, 49, 21–31. [Google Scholar] [CrossRef] [Scilit]
- Liu, C.; Ma, X.; Zhuang, J.; Liu, L.; Sun, C. Cardiotoxicity of Doxorubicin-Based Cancer Treatment: What Is the Protective Cognition that Phytochemicals Provide Us? Pharmacol. Res. 2020, 160, 105062. [Google Scholar] [CrossRef] [Scilit] [PubMed]
- Boo, Y.C. p-Coumaric Acid as An Active Ingredient in Cosmetics: A Review Focusing on Its Antimelanogenic Effects. Antioxidants 2019, 8, 275. [Google Scholar] [CrossRef] [Scilit] [PubMed]
- Cañas, A.I.; Alcalde, M.; Plou, F.; Martínez, M.J.; Martínez, Á.T.; Camarero, S. Transformation of Polycyclic Aromatic Hydrocarbons by Laccase Is Strongly Enhanced by Phenolic Compounds Present in Soil. Environ. Sci. Technol. 2007, 41, 2964–2971. [Google Scholar] [CrossRef] [Scilit]
- Wu, Y.; Wu, W.; Farag, M.A.; Shao, P. Functionalized Cellulose Nanocrystal Embedded into Citrus Pectin Coating Improves Its Barrier, Antioxidant Properties and Potential Application in Food. Food Chem. 2023, 401, 134079. [Google Scholar] [CrossRef] [Scilit] [PubMed]
- Szatmári, Á.; Móricz, Á.M.; Schwarczinger, I.; Kolozsváriné Nagy, J.; Alberti, Á.; Pogány, M.; Bozsó, Z. A Pattern-Triggered Immunity-Related Phenolic, Acetosyringone, Boosts Rapid Inhibition of a Diverse Set of Plant Pathogenic Bacteria. BMC Plant Biol. 2021, 21, 153. [Google Scholar] [CrossRef] [Scilit]
- Zakaria, F.R.; Chen, C.-Y.; Li, J.; Wang, S.; Payne, G.F.; Bentley, W.E. Redox Active Plant Phenolic, Acetosyringone, for Electrogenetic Signaling. Sci. Rep. 2024, 14, 9666. [Google Scholar] [CrossRef] [Scilit]
- Camarero, S.; Ibarra, D.; Martínez, M.J.; Martínez, A.T. Lignin-Derived Compounds as Efficient Laccase Mediators for Decolorization of Different Types of Recalcitrant Dyes. Appl. Environ. Microbiol. 2005, 71, 1775–1784. [Google Scholar] [CrossRef] [Scilit]
- Loi, M.; Fanelli, F.; Zucca, P.; Liuzzi, V.C.; Quintieri, L.; Cimmarusti, M.T.; Monaci, L.; Haidukowski, M.; Logrieco, A.F.; Sanjust, E.; et al. Aflatoxin B1 and M1 Degradation by Lac2 from Pleurotus pulmonarius and Redox Mediators. Toxins 2016, 8, 245. [Google Scholar] [CrossRef] [Scilit]
- Jin, X.; Yu, X.; Zhu, G.; Zheng, Z.; Feng, F.; Zhang, Z. Conditions Optimizing and Application of Laccase-Mediator System (LMS) for the Laccase-Catalyzed Pesticide Degradation. Sci. Rep. 2016, 6, 35787. [Google Scholar] [CrossRef] [Scilit]
- Euring, M.; Rühl, M.; Ritter, N.; Kües, U.; Kharazipour, A. Laccase Mediator Systems for Eco-Friendly Production of Medium-Density Fiberboard (MDF) on a Pilot Scale: Physicochemical Analysis of the Reaction Mechanism. Biotechnol. J. 2011, 6, 1253–1261. [Google Scholar] [CrossRef] [Scilit]
- Moilanen, U.; Kellock, M.; Várnai, A.; Andberg, M.; Viikari, L. Mechanisms of Laccase-Mediator Treatments Improving the Enzymatic Hydrolysis of Pre-Treated Spruce. Biotechnol. Biofuels 2014, 7, 177. [Google Scholar] [CrossRef] [Scilit] [PubMed]
- Mani, P.; Fidal Kumar, V.T.; Keshavarz, T.; Chandra, T.S.; Kyazze, G. The Role of Natural Laccase Redox Mediators in Simultaneous Dye Decolorization and Power Production in Microbial Fuel Cells. Energies 2018, 11, 3455. [Google Scholar] [CrossRef] [Scilit]
- Ullah, I.; Chen, Z.; Xie, Y.; Khan, S.S.; Singh, S.; Yu, C.; Cheng, G. Recent Advances in Biological Activities of Lignin and Emerging Biomedical Applications: A Short Review. Int. J. Biol. Macromol. 2022, 208, 819–832. [Google Scholar] [CrossRef] [Scilit] [PubMed]
- Jiménez-López, L.; Eugenio, M.E.; Ibarra, D.; Darder, M.; Martín, J.A.; Martín-Sampedro, R. Cellulose Nanofibers from a Dutch Elm Disease-Resistant Ulmus minor Clone. Polymers 2020, 12, 2450. [Google Scholar] [CrossRef] [Scilit]
- Li, K.; Zhu, J.; Guan, G.; Wu, H. Preparation of Chitosan-Sodium Alginate Films through Layer-by-Layer Assembly and Ferulic Acid Crosslinking: Film Properties, Characterization, and Formation Mechanism. Int. J. Biol. Macromol. 2019, 122, 485–492. [Google Scholar] [CrossRef] [Scilit]
- Siripatrawan, U.; Harte, B.R. Physical Properties and Antioxidant Activity of an Active Film from Chitosan Incorporated with Green Tea Extract. Food Hydrocoll. 2010, 24, 770–775. [Google Scholar] [CrossRef] [Scilit]
- Tang, H.R.; Covington, A.D.; Hancock, R.A. Structure–Activity Relationships in the Hydrophobic Interactions of Polyphenols with Cellulose and Collagen. Biopolymers 2003, 70, 403–413. [Google Scholar] [CrossRef] [Scilit]
- Hosseini, M.; Moghaddam, L.; Barner, L.; Cometta, S.; Hutmacher, D.W.; Medeiros Savi, F. The Multifaceted Role of Tannic Acid: From Its Extraction and Structure to Antibacterial Properties and Applications. Prog. Polym. Sci. 2025, 160, 101908. [Google Scholar] [CrossRef] [Scilit]
- Phan, A.D.T.; Netzel, G.; Wang, D.; Flanagan, B.M.; D’Arcy, B.R.; Gidley, M.J. Binding of Dietary Polyphenols to Cellulose: Structural and Nutritional Aspects. Food Chem. 2015, 171, 388–396. [Google Scholar] [CrossRef] [Scilit]
- Li, Z.; Renneckar, S.; Barone, J.R. Nanocomposites Prepared by in Situ Enzymatic Polymerization of Phenol with TEMPO-Oxidized Nanocellulose. Cellulose 2010, 17, 57–68. [Google Scholar] [CrossRef] [Scilit]
- Taokaew, S.; Chiaoprakobkij, N.; Siripong, P.; Sanchavanakit, N.; Pavasant, P.; Phisalaphong, M. Multifunctional Cellulosic Nanofiber Film with Enhanced Antimicrobial and Anticancer Properties by Incorporation of Ethanolic Extract of Garcinia Mangostana Peel. Mater. Sci. Eng. C 2021, 120, 111783. [Google Scholar] [CrossRef] [Scilit]
- Espinosa, E.; Rincón, E.; Morcillo-Martín, R.; Rabasco-Vílchez, L.; Rodríguez, A. Orange Peel Waste Biorefinery in Multi-Component Cascade Approach: Polyphenolic Compounds and Nanocellulose for Food Packaging. Ind. Crops Prod. 2022, 187, 115413. [Google Scholar] [CrossRef] [Scilit]
- Phan, A.D.T.; D’Arcy, B.R.; Gidley, M.J. Polyphenol–Cellulose Interactions: Effects of PH, Temperature and Salt. Int. J. Food Sci. Technol. 2016, 51, 203–211. [Google Scholar] [CrossRef] [Scilit]
- Shan, S.; Ji, W.; Zhang, S.; Huang, Y.; Yu, Y.; Yu, W. Insights into the Immobilization Mechanism of Tannic Acid on Bamboo Cellulose Fibers. Ind. Crops Prod. 2022, 182, 114836. [Google Scholar] [CrossRef] [Scilit]
- Koo, M.S.; Wu, Q.; Lee, S.-Y.; Hubbe, M.A. Rheological Properties of Lignocellulosic Nanomaterial Aqueous Suspensions as Influenced by Water-Soluble Biopolymer Additives. ACS Sustain. Chem. Eng. 2021, 9, 17049–17060. [Google Scholar] [CrossRef] [Scilit]
- Fazeli, M.; Keley, M.; Biazar, E. Preparation and Characterization of Starch-Based Composite Films Reinforced by Cellulose Nanofibers. Int. J. Biol. Macromol. 2018, 116, 272–280. [Google Scholar] [CrossRef] [Scilit]
- Taheri, P.; Jahanmardi, R.; Koosha, M.; Abdi, S. Physical, Mechanical and Wound Healing Properties of Chitosan/Gelatin Blend Films Containing Tannic Acid and/or Bacterial Nanocellulose. Int. J. Biol. Macromol. 2020, 154, 421–432. [Google Scholar] [CrossRef] [Scilit]
- Zou, Y.; Guo, J.; Yin, S.-W.; Wang, J.-M.; Yang, X.-Q. Pickering Emulsion Gels Prepared by Hydrogen-Bonded Zein/Tannic Acid Complex Colloidal Particles. J. Agric. Food Chem. 2015, 63, 7405–7414. [Google Scholar] [CrossRef] [Scilit]
- Bai, Z.; Jia, K.; Liu, C.; Wang, L.; Lin, G.; Huang, Y.; Liu, S.; Liu, X. A Solvent Regulated Hydrogen Bond Crosslinking Strategy to Prepare Robust Hydrogel Paint for Oil/Water Separation. Adv. Funct. Mater. 2021, 31, 2104701. [Google Scholar] [CrossRef] [Scilit]
- Saravanakumar, T.; Park, H.-S.; Mo, A.-Y.; Choi, M.-S.; Kim, D.-H.; Park, S.-M. Detoxification of Furanic and Phenolic Lignocellulose Derived Inhibitors of Yeast Using Laccase Immobilized on Bacterial Cellulosic Nanofibers. J. Mol. Catal. B Enzym. 2016, 134, 196–205. [Google Scholar] [CrossRef] [Scilit]
- Stamatis, H.; Sereti, V.; Kolisis, F.N. Enzymatic Synthesis of Hydrophilic and Hydrophobic Derivatives of Natural Phenolic Acids in Organic Media. J. Mol. Catal. B Enzym. 2001, 11, 323–328. [Google Scholar] [CrossRef] [Scilit]
- Bian, H.; Luo, D.; Shi, J.; Zhou, X.; Xu, T.; Xiao, H.; Dai, H.; Li, T.; Huang, C.; Ragauskas, A.J. Cellulose Nanofibrils-Based Packaging Films Synergistically Reinforced by Lignin and Tea Polyphenols for Strawberry Preservation. Chem. Eng. J. 2024, 502, 157843. [Google Scholar] [CrossRef] [Scilit]
- Sanchez-Salvador, J.L.; Monte, M.C.; Batchelor, W.; Garnier, G.; Negro, C.; Blanco, A. Characterizing Highly Fibrillated Nanocellulose by Modifying the Gel Point Methodology. Carbohydr. Polym. 2020, 227, 115340. [Google Scholar] [CrossRef] [Scilit] [PubMed]
- Patterson, G.D.; McManus, J.D.; Orts, W.J.; Hsieh, Y.-L. Protonation of Surface Carboxyls on Rice Straw Cellulose Nanofibrils: Effect on the Aerogel Structure, Modulus, Strength, and Wet Resiliency. Biomacromolecules 2023, 24, 2052–2062. [Google Scholar] [CrossRef] [Scilit] [PubMed]
- Pradhan, D.; Jaiswal, A.K.; Jaiswal, S. Nanocellulose Based Green Nanocomposites: Characteristics and Application in Primary Food Packaging. Food Rev. Int. 2023, 39, 7148–7179. [Google Scholar] [CrossRef] [Scilit]
- Alizadeh Sani, M.; Khezerlou, A.; Tavassoli, M.; Abedini, A.H.; McClements, D.J. Development of Sustainable UV-Screening Food Packaging Materials: A Review of Recent Advances. Trends Food Sci. Technol. 2024, 145, 104366. [Google Scholar] [CrossRef] [Scilit]
- Kim, M.; Lim, T.; Park, H.; Baek, K.-Y.; Jeong, Y.; Sohn, D.; Cho, K.Y.; Cho, S. Nanocellulose-Based Optical and Radio Frequency Transparent Barrier Coating for Food Packaging. Cellulose 2024, 31, 5185–5197. [Google Scholar] [CrossRef] [Scilit]
- Shao, X.; Xie, Y.; Chen, A.; Lan, L.; Zhao, Q.; Ma, L.; Chen, Z.; Long, J.; Chen, W.; Hu, D. Sustainable Lignocellulosic Nanofibers-Based Films with Sensitive Humidity and PH Response for UV-Blocking Food Preservation. Int. J. Biol. Macromol. 2025, 309, 143115. [Google Scholar] [CrossRef] [Scilit]
- Kaschuk, J.J.; Al Haj, Y.; Valdez Garcia, J.; Kamppinen, A.; Rojas, O.J.; Abitbol, T.; Miettunen, K.; Vapaavuori, J. Processing Factors Affecting Roughness, Optical and Mechanical Properties of Nanocellulose Films for Optoelectronics. Carbohydr. Polym. 2024, 332, 121877. [Google Scholar] [CrossRef] [Scilit]
- Guzman-Puyol, S.; Benítez, J.J.; Heredia-Guerrero, J.A. Transparency of Polymeric Food Packaging Materials. Food Res. Int. 2022, 161, 111792. [Google Scholar] [CrossRef] [Scilit]
- Lei, Y.; Mao, L.; Yao, J.; Zhu, H. Improved Mechanical, Antibacterial and UV Barrier Properties of Catechol-Functionalized Chitosan/Polyvinyl Alcohol Biodegradable Composites for Active Food Packaging. Carbohydr. Polym. 2021, 264, 117997. [Google Scholar] [CrossRef] [Scilit] [PubMed]
- Daré, R.G.; Nakamura, C.V.; Ximenes, V.F.; Lautenschlager, S.O.S. Tannic Acid, a Promising Anti-Photoaging Agent: Evidences of Its Antioxidant and Anti-Wrinkle Potentials, and Its Ability to Prevent Photodamage and MMP-1 Expression in L929 Fibroblasts Exposed to UVB. Free Radic. Biol. Med. 2020, 160, 342–355. [Google Scholar] [CrossRef] [Scilit] [PubMed]
- Zhang, C.; Yang, Z.; Shi, J.; Zou, X.; Zhai, X.; Huang, X.; Li, Z.; Holmes, M.; Daglia, M.; Xiao, J. Physical Properties and Bioactivities of Chitosan/Gelatin-Based Films Loaded with Tannic Acid and Its Application on the Preservation of Fresh-Cut Apples. LWT 2021, 144, 111223. [Google Scholar] [CrossRef] [Scilit]
- Al-Amin, K.; Kawsar; Mamun, T.R.B.; Hossain, S. Fourier Transform Infrared Spectroscopic Technique for Analysis of Inorganic Materials: A Review. Nanoscale Adv. 2025, 7, 6677–6702. [Google Scholar] [CrossRef] [Scilit] [PubMed]
- Kaya, M. Characterization of TEMPO-Oxidized Cellulose Nanofiber From Biowaste and Its Influence on Molecular Behavior of Fluorescent Rhodamine B Dye in Aqueous Suspensions. J. Fluoresc. 2025, 35, 4053–4063. [Google Scholar] [CrossRef] [Scilit]
- Koochakzaei, A.; Sabaghian, M. Tannin Characterization and Sourcing in Historical Leathers through FTIR Spectroscopy and PCA Analysis. Collagen Leather 2023, 5, 21. [Google Scholar] [CrossRef] [Scilit]
- Sahiner, N.; Sagbas, S.; Sahiner, M.; Silan, C.; Aktas, N.; Turk, M. Biocompatible and Biodegradable Poly(Tannic Acid) Hydrogel with Antimicrobial and Antioxidant Properties. Int. J. Biol. Macromol. 2016, 82, 150–159. [Google Scholar] [CrossRef] [Scilit]
- Celina, M.C.; Linde, E.; Martinez, E. Carbonyl Identification and Quantification Uncertainties for Oxidative Polymer Degradation. Polym. Degrad. Stab. 2021, 188, 109550. [Google Scholar] [CrossRef] [Scilit]
- Gómez-Estaca, J.; López-de-Dicastillo, C.; Hernández-Muñoz, P.; Catalá, R.; Gavara, R. Advances in Antioxidant Active Food Packaging. Trends Food Sci. Technol. 2014, 35, 42–51. [Google Scholar] [CrossRef] [Scilit]
- Estévez, M.; Li, Z.; Soladoye, O.P.; Van-Hecke, T. Chapter Two—Health Risks of Food Oxidation. In Advances in Food and Nutrition Research; Toldrá, F., Ed.; Academic Press: Cambridge, MA, USA, 2017; Volume 82, pp. 45–81. [Google Scholar]
- Kanner, J. Dietary Advanced Lipid Oxidation Endproducts Are Risk Factors to Human Health. Mol. Nutr. Food Res. 2007, 51, 1094–1101. [Google Scholar] [CrossRef] [Scilit]
- Andrade, R.G.; Dalvi, L.T.; Silva, J.M.C.; Lopes, G.K.B.; Alonso, A.; Hermes-Lima, M. The Antioxidant Effect of Tannic Acid on the in Vitro Copper-Mediated Formation of Free Radicals. Arch. Biochem. Biophys. 2005, 437, 1–9. [Google Scholar] [CrossRef] [Scilit] [PubMed]
- Kiliç, I.; Yeşiloğlu, Y. Spectroscopic Studies on the Antioxidant Activity of p-Coumaric Acid. Spectrochim. Acta A Mol. Biomol. Spectrosc. 2013, 115, 719–724. [Google Scholar] [CrossRef] [Scilit] [PubMed]
- Bortolomeazzi, R.; Sebastianutto, N.; Toniolo, R.; Pizzariello, A. Comparative Evaluation of the Antioxidant Capacity of Smoke Flavouring Phenols by Crocin Bleaching Inhibition, DPPH Radical Scavenging and Oxidation Potential. Food Chem. 2007, 100, 1481–1489. [Google Scholar] [CrossRef] [Scilit]
- LakshmiBalasubramaniam, S.; Patel, A.S.; Nayak, B.; Howell, C.; Skonberg, D. Antioxidant and Antimicrobial Modified Cellulose Nanofibers for Food Applications. Food Biosci. 2021, 44, 101421. [Google Scholar] [CrossRef] [Scilit]
- Ferri, M.; Gianotti, A.; Tassoni, A. Optimisation of Assay Conditions for the Determination of Antioxidant Capacity and Polyphenols in Cereal Food Components. J. Food Compos. Anal. 2013, 30, 94–101. [Google Scholar] [CrossRef] [Scilit]
- Zhu, T.; Yang, C.; Bao, X.; Chen, F.; Guo, X. Strategies for Controlling Biofilm Formation in Food Industry. Grain Oil Sci. Technol. 2022, 5, 179–186. [Google Scholar] [CrossRef] [Scilit]
- Liu, X.; Yao, H.; Zhao, X.; Ge, C. Biofilm Formation and Control of Foodborne Pathogenic Bacteria. Molecules 2023, 28, 2432. [Google Scholar] [CrossRef] [Scilit]
- Cabrera-Sosa, L.; Ochoa, T.J. 46—Escherichia coli Diarrhea. In Hunter’s Tropical Medicine and Emerging Infectious Diseases, 10th ed.; Ryan, E.T., Hill, D.R., Solomon, T., Aronson, N.E., Endy, T.P., Eds.; Elsevier: London, UK, 2020; pp. 481–485. [Google Scholar]
- Mumbo, M.T.; Nyaboga, E.N.; Kinyua, J.K.; Muge, E.K.; Mathenge, S.G.K.; Rotich, H.; Muriira, G.; Njiraini, B.; Njiru, J.M. Antimicrobial Resistance Profiles of Salmonella spp. and Escherichia coli Isolated from Fresh Nile Tilapia (Oreochromis niloticus) Fish Marketed for Human Consumption. BMC Microbiol. 2023, 23, 306. [Google Scholar] [CrossRef] [Scilit]
- Kodama, T.; Santo, T.; Yokoyama, T.; Takesue, Y.; Hiyama, E.; Imamura, Y.; Murakami, Y.; Tsumura, H.; Shinbara, K.; Tatsumoto, N.; et al. Postoperative Enteritis Caused by Methicillin-Resistant Staphylococcus Aureus. Surg. Today 1997, 27, 816–825. [Google Scholar] [CrossRef] [Scilit]
- Bennett, M.R.; Thomsen, I.P. Epidemiological and Clinical Evidence for the Role of Toxins in S. Aureus Human Disease. Toxins 2020, 12, 408. [Google Scholar] [CrossRef] [Scilit]
- Delgado-Adámez, J.; Fernández-León, M.F.; Velardo-Micharet, B.; González-Gómez, D. In Vitro Assays of the Antibacterial and Antioxidant Activity of Aqueous Leaf Extracts from Different Prunus salicina Lindl. Cultivars. Food Chem. Toxicol. 2012, 50, 2481–2486. [Google Scholar] [CrossRef] [Scilit]
- Akiyama, H.; Fujii, K.; Yamasaki, O.; Oono, T.; Iwatsuki, K. Antibacterial Action of Several Tannins against Staphylococcus aureus. J. Antimicrob. Chemother. 2001, 48, 487–491. [Google Scholar] [CrossRef] [Scilit]
- Lou, Z.; Wang, H.; Rao, S.; Sun, J.; Ma, C.; Li, J. p-Coumaric Acid Kills Bacteria through Dual Damage Mechanisms. Food Control 2012, 25, 550–554. [Google Scholar] [CrossRef] [Scilit]
- Fillat, A.; Gallardo, O.; Vidal, T.; Pastor, F.I.J.; Díaz, P.; Roncero, M.B. Enzymatic Grafting of Natural Phenols to Flax Fibres: Development of Antimicrobial Properties. Carbohydr. Polym. 2012, 87, 146–152. [Google Scholar] [CrossRef] [Scilit]
- Kraipok, A.; Chutimasakul, T.; Intawin, P.; Leenakul, W.; Pengpat, K.; Buachumthamrongsuk, C.; Weerasuk, B.; Rattanawongwiboon, T.; Laksee, S.; Sangtawesin, T. Engineering Antibacterial Tannic Acid/Polyethyleneimine Coatings on Lithium Disilicate Glass-Ceramics for Dental Applications. J. Mater. Res. Technol. 2024, 30, 7575–7584. [Google Scholar] [CrossRef] [Scilit]
- Kaczmarek, B. Tannic Acid with Antiviral and Antibacterial Activity as A Promising Component of Biomaterials—A Minireview. Materials 2020, 13, 3224. [Google Scholar] [CrossRef] [Scilit] [PubMed]
- Dabbaghi, A.; Kabiri, K.; Ramazani, A.; Zohuriaan-Mehr, M.J.; Jahandideh, A. Synthesis of Bio-Based Internal and External Cross-Linkers Based on Tannic Acid for Preparation of Antibacterial Superabsorbents. Polym. Adv. Technol. 2019, 30, 2894–2905. [Google Scholar] [CrossRef] [Scilit]
- Zulkarnain, M.Z.; Tong, W.Y.; Tan, W.-N.; Leong, C.R.; Md Yusof, F.A.; Wahidin, S.; Attifah, N.R.; Zubaidah, S. p-Coumaric Acid Quantum Dots Inhibit Beta Lactam Resistant Foodborne Microorganisms. Mater. Today Proc. 2020, 31, 48–53. [Google Scholar] [CrossRef] [Scilit]
- Sahiner, M.; Sagbas, S.; Bitlisli, B.O. P(AAm/TA)-Based IPN Hydrogel Films with Antimicrobial and Antioxidant Properties for Biomedical Applications. J. Appl. Polym. Sci. 2015, 132, 41876. [Google Scholar] [CrossRef] [Scilit]
- Bertani, B.; Ruiz, N. Function and Biogenesis of Lipopolysaccharides. EcoSal Plus 2018, 8. [Google Scholar] [CrossRef] [Scilit] [PubMed] [PubMed Central]
- Walia, K.; Kapoor, A.; Farber, J.M. Qualitative Risk Assessment of Cricket Powder to Be Used to Treat Undernutrition in Infants and Children in Cambodia. Food Control 2018, 92, 169–182. [Google Scholar] [CrossRef] [Scilit]
- Wilks, J.C.; Slonczewski, J.L. PH of the Cytoplasm and Periplasm of Escherichia coli: Rapid Measurement by Green Fluorescent Protein Fluorimetry. J. Bacteriol. 2007, 189, 5601–5607. [Google Scholar] [CrossRef] [Scilit]
- Philip, P.; Kern, D.; Goldmanns, J.; Seiler, F.; Schulte, A.; Habicher, T.; Büchs, J. Parallel Substrate Supply and PH Stabilization for Optimal Screening of E. coli with the Membrane-Based Fed-Batch Shake Flask. Microb. Cell Fact. 2018, 17, 69. [Google Scholar] [CrossRef] [Scilit]
- Peresin, M.S.; Vartiainen, J.; Kunnari, V.; Kaljunen, T.; Tammelin, T.; Qvintus, P. Large-Scale Nanofibrillated Cellulose Film: An Overview on Its Production, Properties, and Potential Applications. In Proceedings of the 4th International Conference on Pulping, Papermaking and Biotechnology (ICPPB ’12), Nanjing, China, 7–9 November 2012; pp. 891–895. [Google Scholar]

Disclaimer/Publisher’s Note: The statements, opinions and data contained in all publications are solely those of the individual author(s) and contributor(s) and not of MDPI and/or the editor(s). MDPI and/or the editor(s) disclaim responsibility for any injury to people or property resulting from any ideas, methods, instructions or products referred to in the content. |
© 2026 by the authors. Licensee MDPI, Basel, Switzerland. This article is an open access article distributed under the terms and conditions of the Creative Commons Attribution (CC BY) license.