


Simple Summary
This study presents an integrative machine learning-based evaluation of flight performance in racing pigeons raised in the South Marmara region of Türkiye. Using data from 166 pigeons and 781 race records, the study analyzed three major flight traits: flight duration, speed, and distance. A composite Flight Performance Score (FPS) was constructed, and multiple statistical and machine learning approaches, including principal component analysis (PCA), k-means clustering, and Random Forest classification, were applied to investigate performance patterns and potential sex-related differences. The results demonstrated that male and female pigeons showed substantial overlap in flight performance traits, with no significant sex-dependent differences detected across analytical methods. Random Forest classification also failed to predict sex above chance level, suggesting that sex is not a major determinant of flight capacity in this population. In contrast, unsupervised pattern analysis identified four biologically distinct flight-performance profiles characterized by different trade-offs between speed, endurance, and distance. These findings indicate that individual performance strategies, rather than sex, represent the main source of variation among racing pigeons. Overall, the study highlights the multidimensional and individual-specific nature of flight performance and demonstrates the usefulness of machine learning approaches for characterizing complex locomotor traits in avian species.
Abstract
Racing pigeons (Columba livia domestica) have been selectively bred for centuries for superior flight capacity. Yet, the quantitative structure of flight performance traits and the extent to which sex influences these parameters remain poorly characterized, particularly in Turkish populations. This study aimed to evaluate flight performance in racing pigeons raised in the South Marmara region of Türkiye using three key kinematic traits (flight duration, speed, and distance) and to explore the multivariate structure and individual variation of these parameters through an integrative machine learning framework. Data were compiled from 166 individually registered pigeons (77 females, 89 males), totaling 781 race records used for pattern analysis. A composite Flight Performance Score (FPS) was constructed using min–max normalized component variables, and its internal consistency was assessed via Cronbach’s alpha and principal component analysis. Univariate comparisons revealed no statistically significant sex-related differences in any of the three flight parameters (p > 0.05 for all traits). Principal component analysis confirmed substantial overlap between male and female individuals in multivariate trait space, and Random Forest classification failed to discriminate between sexes above chance level (accuracy = 0.490; ROC-AUC = 0.500), collectively indicating that sex is not a dominant determinant of flight performance in this population. Internal consistency analysis revealed that flight duration, speed, and distance are functionally independent dimensions (Cronbach’s α = 0.135; r = −0.749 between duration and speed), with PCA of the FPS component variables indicating an effectively two-dimensional variance structure (PC1: 60.1%; PC2: 39.7%). Pattern analysis of race records identified four biologically distinct flight performance profiles, characterized by differential trade-offs among flight duration, speed, and distance, suggesting that individual-level performance strategy, rather than sex, is the primary axis of variation in this dataset. These findings challenge common breeder assumptions about sex-based differences in performance and highlight the multidimensional, individual-specific nature of flight performance in racing pigeons.
1. Introduction
Pigeons (Columba livia) are an important model in biological research due to their morphological diversity and superior flight abilities. The domestication process, which began approximately 3000 years ago, and subsequent intensive selective breeding efforts have led to the emergence of hundreds of different pigeon breeds that differ from their ancestors both morphologically and behaviorally [1,2,3]. During this process, racing pigeons were selected for specific parameters such as speed, endurance, and long-distance flight capacity, which is thought to have led to the development of distinct morphological and physiological adaptations [3].
Flight performance is a complex interplay of aerodynamic structure, metabolic capacity, and muscle physiology. From an aerodynamic perspective, morphometric characteristics such as wing length, tail structure, and fuselage size directly determine flight speed and maneuverability [4]. However, details such as beak morphology have been found to indirectly affect flight safety and hunting skills by influencing the field of vision [5]. Physiological aspects of performance, including muscle structure and energy metabolism, play a decisive role. In pigeons, large, rapidly contracting chest muscles (pectoralis) combined with a high oxygen-carrying capacity provide high aerobic endurance [6]. These physiological adaptations allow the bird to resist fatigue and maintain a sustainable speed, especially in races of hundreds of kilometers [7,8].
In addition to good muscle function, numerous factors determine a bird’s suitability for speed-based competitions, most notably wing quality [9]. The wing structure and its associated characteristics, along with other anatomical components, play a significant role in determining a bird’s racing capacity [10]. A pigeon’s speed is a key determinant not only of its ability to overcome various obstacles but also of its performance in returning home. Environmental factors and breeds with different genomic backgrounds may influence the quantitative traits of pigeons. Notably, there is limited information about these phenotypic traits to perform an adequate comparison [11]. Furthermore, the tail structure is a key morphological feature in flying birds, playing an important role in regulating aerodynamic drag and flight velocity [7,8,11,12]. Therefore, in racing pigeons, flight performance is a combination of biological characteristics such as body structure, muscle mass, and physiological capacity, which can be directly or indirectly influenced by gender [13].
Although sex has long been considered a potentially important determinant of athletic performance in birds, the available evidence remains inconsistent. Previous studies have suggested that males and females may differ in traits related to flight capacity, including body morphology, muscle mass, energy metabolism, and physiological performance [8,9,10,11,12]. These biological differences have led to the expectation that sex-related variation may also be reflected in racing performance. However, direct evidence linking sex to superior racing outcomes in pigeons remains limited, and the magnitude of any potential advantage appears to vary among populations and performance traits evaluated. Furthermore, most previous investigations have focused on individual morphological or physiological characteristics rather than the multivariate structure of flight-performance traits [6,9,13]. Consequently, it remains unclear whether sex represents a major source of variation in racing performance or whether individual performance profiles outweigh sex-related differences. This uncertainty provided an important rationale for the present study.
Despite the long-standing practical and cultural importance of pigeon breeding in Türkiye, particularly in relation to flight-oriented breeds and postal pigeons, the scientific characterization of flight performance traits in these populations remains remarkably limited. In particular, there is a clear lack of systematic data on how core performance parameters, such as flight duration, speed, and distance, are structured within Turkish pigeon populations and whether these traits meaningfully express measurable patterns. Hence, this study aimed to evaluate flight performance in pigeons raised in Türkiye using key flight-related traits, including flight duration, speed, and distance, and to explore the overall structure and variations in these parameters within the population using machine learning approaches. This knowledge gap is important not only from a biological perspective but also from a practical standpoint of performance evaluation. In racing pigeon breeding, sex is sometimes considered in selection and performance-evaluation decisions (with some breeders reportedly favoring male birds for competitive racing), although the extent to which such practices are supported by objective performance data remains unclear. Thus, quantitative evaluation of potential sex-related variation is needed to provide an evidence-based framework for assessing flight performance. The present study was necessary to provide an objective statistical framework for evaluating flight-related variation in pigeons and to determine whether flying patterns contribute meaningfully to the observed performance structure. In this respect, the study addresses an important gap in the literature. It provides a more data-driven basis for understanding flight performance in pigeons and for determining whether flying patterns contribute meaningfully to the observed performance structure. Therefore, the present study aimed to investigate the structure of flight performance in racing homing pigeons raised in the South Marmara region of Türkiye using three key flight-related traits: flight duration, speed, and distance. We hypothesized that sex-related differences would be relatively small compared with overall individual variation and that distinct flight-performance patterns would emerge regardless of sex classification. Specifically, we tested whether these traits differ between males and females, whether sex can be predicted from flight-performance data using multivariate and machine learning approaches, and whether biologically meaningful flight-performance profiles can be identified independently of sex. To address these questions, principal component analysis, k-means clustering, Random Forest classification, and a composite Flight Performance Score (FPS) were applied to characterize variation within the study population. We hypothesized that individual flight-performance strategies would contribute more strongly to overall variation than sex-related differences.
2. Materials and Methods
2.1. Data Collection
The data were compiled from 166 racing pigeons raised in the South Marmara region of Türkiye, with each race assigned an identification number. All of the pigeons were registered with the Turkish Avian DNA Institute. Flight performance data were collected for each pigeon and included speed, flight distance, flight duration, and sex. These parameters were obtained from available flight or race records maintained for the study population. Flight duration represented the total recorded duration of the flight event for each bird, whereas speed values (meters/minutes) were derived from the corresponding performance records. Flight distance was based on the documented flight route or the official distance assigned to the flight event. Sex was recorded according to breeder-provided information and/or individual identification records. After collection, all variables were organized into a single analytical dataset. The data were then screened for missing values, formatting inconsistencies, and outliers for statistical analysis.
Each animal in the study had a unique identification number, enabling accurate matching and individual verification of records throughout data preparation. To minimize potential bias from familial similarity, related animals were excluded from the final analytical population. In this context, pedigree records available for the registered racing pigeons were reviewed during data curation. To minimize the potential influence of genetic relatedness on the analyses, individuals within two generations of each other were excluded from the study population. In addition, records with missing or inconsistent identification data, birds that did not complete the race, entries originating from different breeds, and records obtained from races conducted outside the target geographical region were excluded from further analysis. During data curation, all records were carefully evaluated for both performance and identity information, and individuals with missing, incomplete, inconsistent, or erroneous data were excluded from further analysis. This filtering procedure included removing animals with problematic identity records and those with insufficient or unreliable flight-performance measurements. As a result, although the study dataset initially consisted of 350 animals, only 166 pigeons met all inclusion criteria. They were retained in the final population used for statistical and machine learning analyses. Race distance was defined as the official race distance between the release point and the home loft, as recorded in the competition database. Distance values were expressed in kilometers and used directly in all analyses.
All pigeons included in the study belonged to the Turkish Racing Homer population and participated in officially organized racing events conducted during the same racing season. Consequently, potential confounding effects related to breed differences and major seasonal variations were minimized. Participation in racing competitions is subject to eligibility criteria defined by the governing racing organization, resulting in a relatively homogeneous age category among competing birds. However, exact individual age records were not consistently available and therefore could not be included as a covariate in the analyses. Likewise, detailed information regarding training intensity and loft management practices was unavailable for all individuals.
For pattern analysis, the unit of observation was the individual race record rather than the individual bird. Since each pigeon participated in multiple races during the study period, the total number of race records available for analysis (n = 781) exceeded the number of individual birds (n = 166). Each race record contained independently measured values for flight duration, speed, and distance and was therefore treated as a separate analytical unit. This approach was adopted to capture within-individual variation across races and to maximize the dataset’s informative content for unsupervised pattern identification. It should be noted that this analytical design introduces a degree of non-independence among observations, as multiple records originating from the same individual may share underlying biological characteristics. This limitation is acknowledged, and the identified patterns should be interpreted as flight performance profiles across race events rather than as individual-level phenotypic categories.
No invasive procedures, manipulations, or experimental treatments were performed on the animals in this study. Written or verbal informed consent was obtained from the bird owners for the use of these data in scientific analyses. The compiled dataset was subsequently checked for completeness, consistency, and suitability for downstream statistical and machine learning analyses.
2.2. Statistical Analysis
Descriptive statistics were calculated for all analyzed flight-related variables to summarize the central tendency and dispersion within each group. For each parameter, the number of observations (n), mean, standard deviation (SD), minimum, maximum, and, where appropriate, median values were determined. These descriptive summaries provided an overall overview of the dataset’s distributional characteristics before inferential statistical analyses.
Prior to ANOVA, the assumptions of normality and homogeneity of variances were evaluated. Normality of the residual distributions was assessed using the Shapiro–Wilk test, whereas homogeneity of variances among groups was examined using Levene’s test. Only after confirming the suitability of the data for parametric analysis were one-way ANOVA and subsequent Tukey’s HSD multiple-comparison procedures applied.
To test for differences among groups, one-way analysis of variance (ANOVA) was performed for each flight parameter separately. Each dependent variable was analyzed independently. A one-way ANOVA was used to determine whether the means of the measured traits differed significantly across groups. Before conducting ANOVA, variables were examined for suitability for parametric testing, including inspection of data distribution and variance structure. Statistical significance was assessed at p < 0.05. When the overall ANOVA result was statistically significant, Tukey’s honestly significant difference (HSD) post hoc test was applied for pairwise multiple comparisons between groups. Tukey’s test was used to identify which specific group pairs differed significantly while controlling for the family-wise error rate associated with multiple testing. Adjusted p-values obtained from the Tukey procedure were used to interpret pairwise group differences.
The Flight Performance Score (FPS) was defined as a secondary descriptive index to quantify the overall flight ability of each individual using the following formula. Equal weighting was selected because no validated biological or performance-based evidence exists to justify assigning greater importance to any of the three constituent variables. Furthermore, PCA results indicated that flight duration, speed, and distance represented partially independent dimensions of performance rather than a single dominant latent trait, limiting the justification for a PCA-derived composite score. For each individual i, FPS was calculated by integrating three key flight-related variables: flight duration (Di), speed (Si), and distance (Li). To ensure comparability across variables measured on different numerical scales, each variable was normalized using min–max scaling based on the observed minimum and maximum values within the dataset. Specifically, Dmin and Dmax represent the minimum and maximum flight duration values, Smin and Smax represent the minimum and maximum speed values, and Lmin and Lmax represent the minimum and maximum distance values. The normalized values were then averaged to obtain a composite score for each individual, which was subsequently rescaled to a 0–100 range. Thus, higher FPS values indicate better overall flight performance by simultaneously accounting for endurance, velocity, and displacement capacity. This approach allows the integration of multiple performance dimensions into a single standardized metric suitable for comparative and downstream statistical analyses.
To evaluate the internal consistency of the Flight Performance Score, Cronbach’s alpha was calculated for the three min–max normalized component variables following outlier exclusion. Cronbach’s alpha was computed as
where k denotes the number of items (k = 3), σ2ᵢ represents the variance of each normalized component variable, and σ2total represents the variance of their summed scores. Inter-item Pearson correlation coefficients were calculated between all variable pairs to assess the degree of linear association among components. In addition, a principal component analysis was performed on the standardized component variables to examine the variance structure underlying the composite score, and the proportion of total variance explained by each principal component was reported. These analyses were conducted to provide empirical justification for the equal-weighting scheme applied in FPS calculation and to characterize the dimensionality of the composite index.
α = (k/k − 1) × (1 − Σσ2ᵢ/σ2total)
Principal component analysis (PCA) was performed to explore the multivariate distribution of flight performance traits and to assess whether male and female individuals formed distinct clusters based on these parameters. The analysis used flight-related variables, including flight duration, speed, and distance. Only individuals with known sex classification (male or female) and complete records for all analyzed variables were included in the PCA. Before analysis, the dataset was curated to ensure numerical consistency. In particular, decimal separators in the speed column were standardized where necessary, and all variables were converted to numeric format. Records containing missing values in any of the selected variables were excluded from the analysis. PCA was initially performed on the full dataset (raw data). In addition, to evaluate the potential influence of extreme observations, a second PCA was carried out after excluding outliers using the interquartile range (IQR) method. For each variable, values below Q1 − 1.5 × IQR or above Q3 + 1.5 × IQR were considered outliers and removed. A total of 9 records (1.2% of the dataset) were identified as outliers and removed prior to statistical analyses. Because the analyzed variables were measured on different numerical scales, all variables were standardized to a mean of 0 and a variance of 1 before PCA. The PCA was then computed on the standardized data matrix, and the first two principal components (PC1 and PC2) were retained for visualization. These components were used to generate two-dimensional ordination plots showing the spatial distribution of male and female individuals in multivariate trait space.
To aid visual interpretation of group structure, male and female individuals were displayed with separate symbols, and group-level dispersion was illustrated using ellipse overlays around each sex. Variable loadings were projected as arrows onto the PCA biplot to indicate the relative contribution and direction of each trait in shaping the ordination pattern. In the final figure layout, the variables flight duration, speed, and distance were displayed as labels. PCA was implemented in Python v3.12.3 (Python Software Foundation, Wilmington, DE, USA) using the scikit-learn package, first standardizing with StandardScaler (scikit-learn v1.8.0) and then reducing dimensionality with the PCA function. Graphical outputs were generated in Matplotlib v3.10.8 (Matplotlib Development Team, USA). The percentage of total variance explained by PC1 and PC2 was reported on the corresponding axes.
A Random Forest classification analysis was performed to assess whether sex (male vs. female) could be predicted from flight performance variables. For this purpose, individuals with known sex classification and complete measurements for the analyzed traits were included. In the final model, the predictor variables consisted of flight duration, speed, and distance. Individuals with missing values in any of these variables were excluded before analysis. The final outlier-filtered dataset used for Random Forest classification consisted of 153 individuals, including 82 males (53.6%) and 71 females (46.4%). Although class frequencies were relatively balanced, the parameter class_weight = “balanced” was used during model training to account for a slight imbalance in class sizes. Random Forest classification was implemented in Python using the scikit-learn library. Sex was treated as a binary response variable, with male and female individuals representing the two target classes. The Random Forest model was fitted with 500 decision trees, using class_weight = “balanced” to account for class imbalance and min_samples_leaf = 2 to reduce overfitting and improve generalizability. Model performance was evaluated using 5-fold stratified cross-validation, in which the dataset was partitioned into 5 subsets, preserving the proportions of males and females within each fold. In each iteration, four folds were used for training and one fold for validation, and this procedure was repeated until all folds had served once as the validation set. Classification performance was summarized using the mean values of accuracy, balanced accuracy, F1 score, and area under the receiver operating characteristic curve (ROC-AUC) across cross-validation folds. To further assess classification behavior, cross-validated predictions were used to generate a confusion matrix, showing the number of correctly and incorrectly classified male and female individuals. In addition, feature importance scores were extracted from the fitted Random Forest model to estimate the relative contribution of flight duration, speed, and distance to sex discrimination. All calculations were performed in Python (version 3.12.3) using the NumPy (v2.4.4), scikit-learn (v1.8.0), and matplotlib (v3.10.8) libraries.
For analyses evaluating sex-related differences (ANOVA, PCA, and Random Forest classification), only one record per uniquely identified pigeon was retained (Figure S1), yielding a dataset of 166 individuals (77 females and 89 males). Consequently, repeated observations of the same individual were not present in these analyses, and pseudoreplication associated with multiple race records per bird was avoided. The details of the evaluation are presented in Table S1.
3. Results
A total of 166 pigeons, including 77 females and 89 males, were evaluated for flight duration, speed, and distance (Table 1). Descriptive statistics showed some numerical variation between sexes; however, none of the analyzed traits differed significantly between female and male pigeons. Flight duration did not vary significantly between sexes (p = 0.305), and similarly, no significant sex-related difference was detected for speed (p = 0.559) or distance (p = 0.145). These findings indicate that although female and male pigeons exhibited slight differences in mean performance, sex was not a major source of variation in the analyzed flight-performance traits.
Table 1.
Descriptive statistics of flight performance parameters by gender.
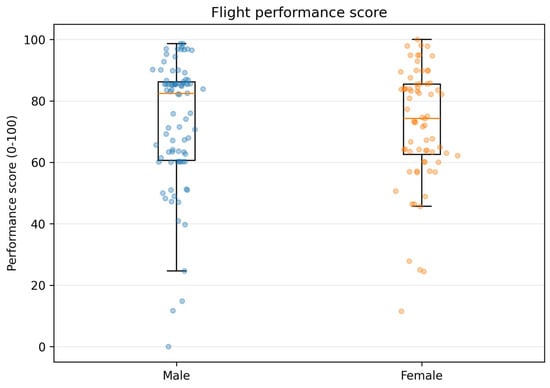
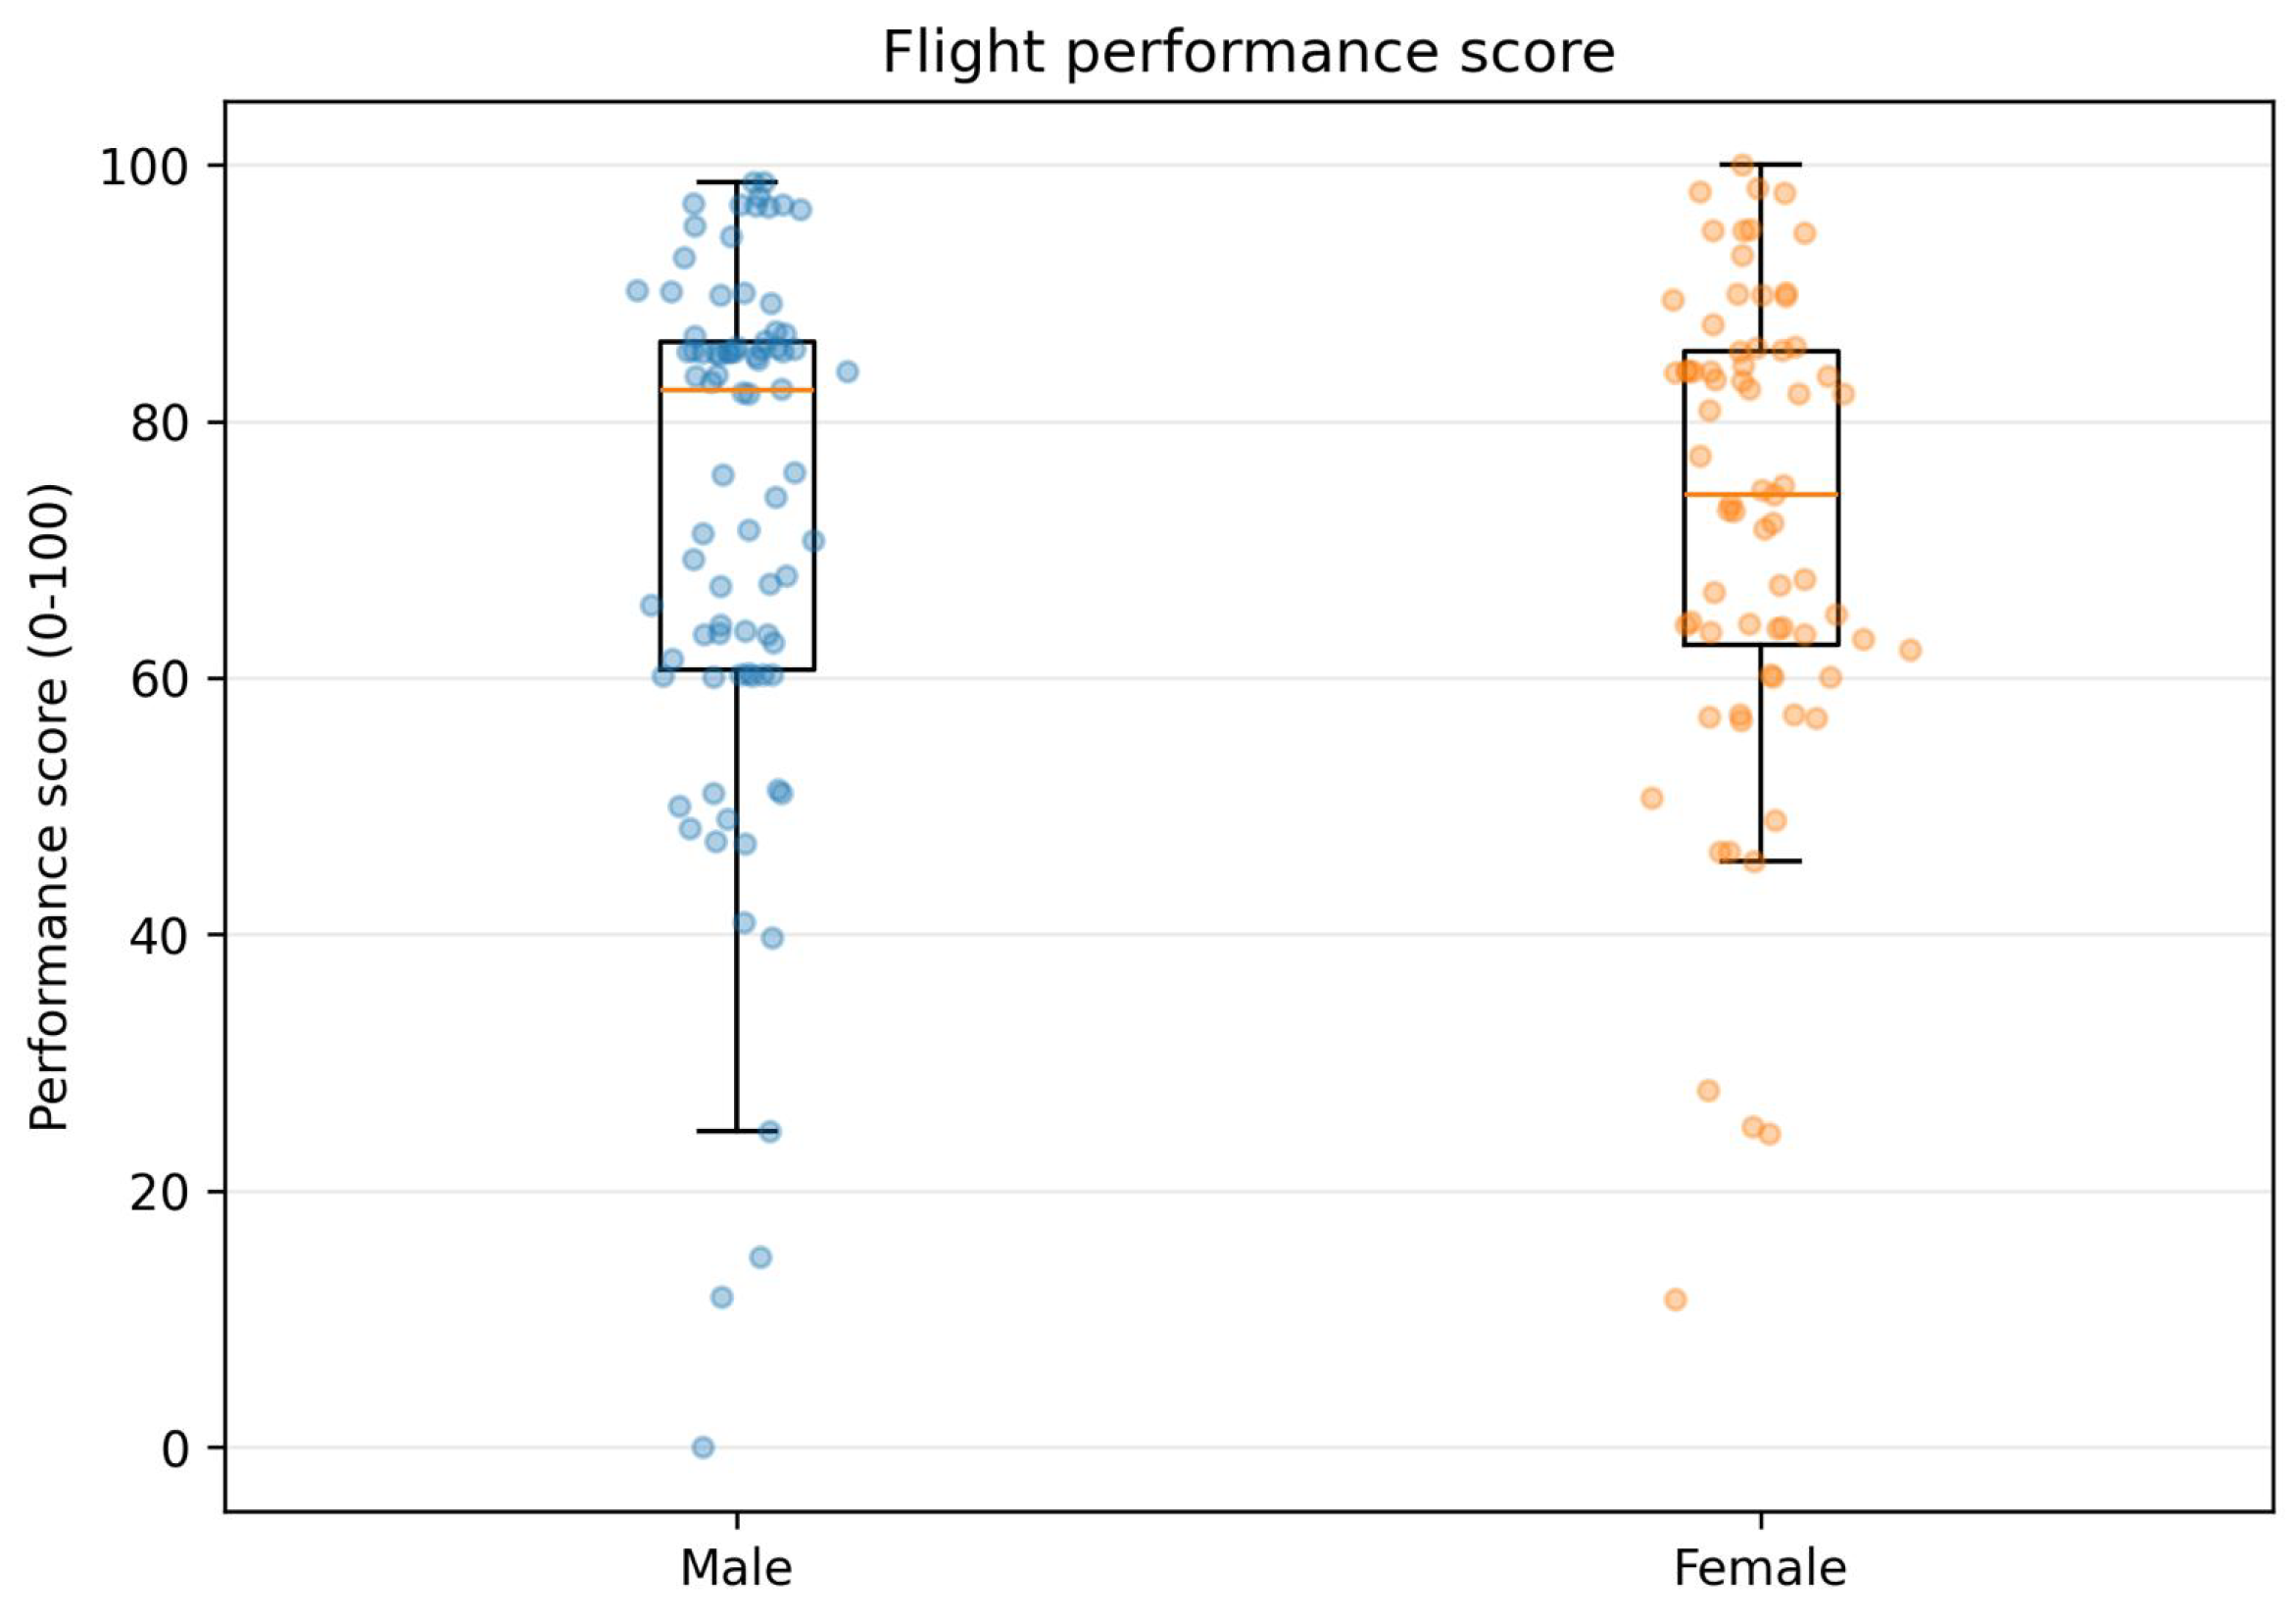
When comparing flight performance scores between males and females, males had a higher median score (≈80) than females (≈70). However, males also showed greater overall variability, with several low-scoring outliers, including one individual approaching a score of zero. Females demonstrated a narrower interquartile range, yet the upper whisker, which extends to approximately 100, indicates the presence of high-performing individuals within this group. In short, these results suggest that composite flight performance shows substantial individual variation in both sexes and that sex may contribute to the observed distribution of performance scores (Figure 1).
Figure 1.
Flight performance scores of male and female individuals. Box plots display the distribution of composite flight performance scores (scale: 0–100) for males (blue) and females (orange), with individual data points overlaid. The box represents the interquartile range (IQR; 25th–75th percentiles), the horizontal line within the box indicates the median, and whiskers extend to 1.5 × IQR.
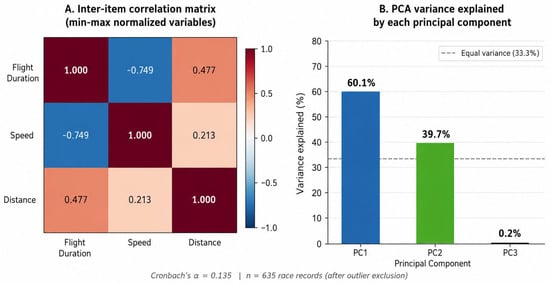
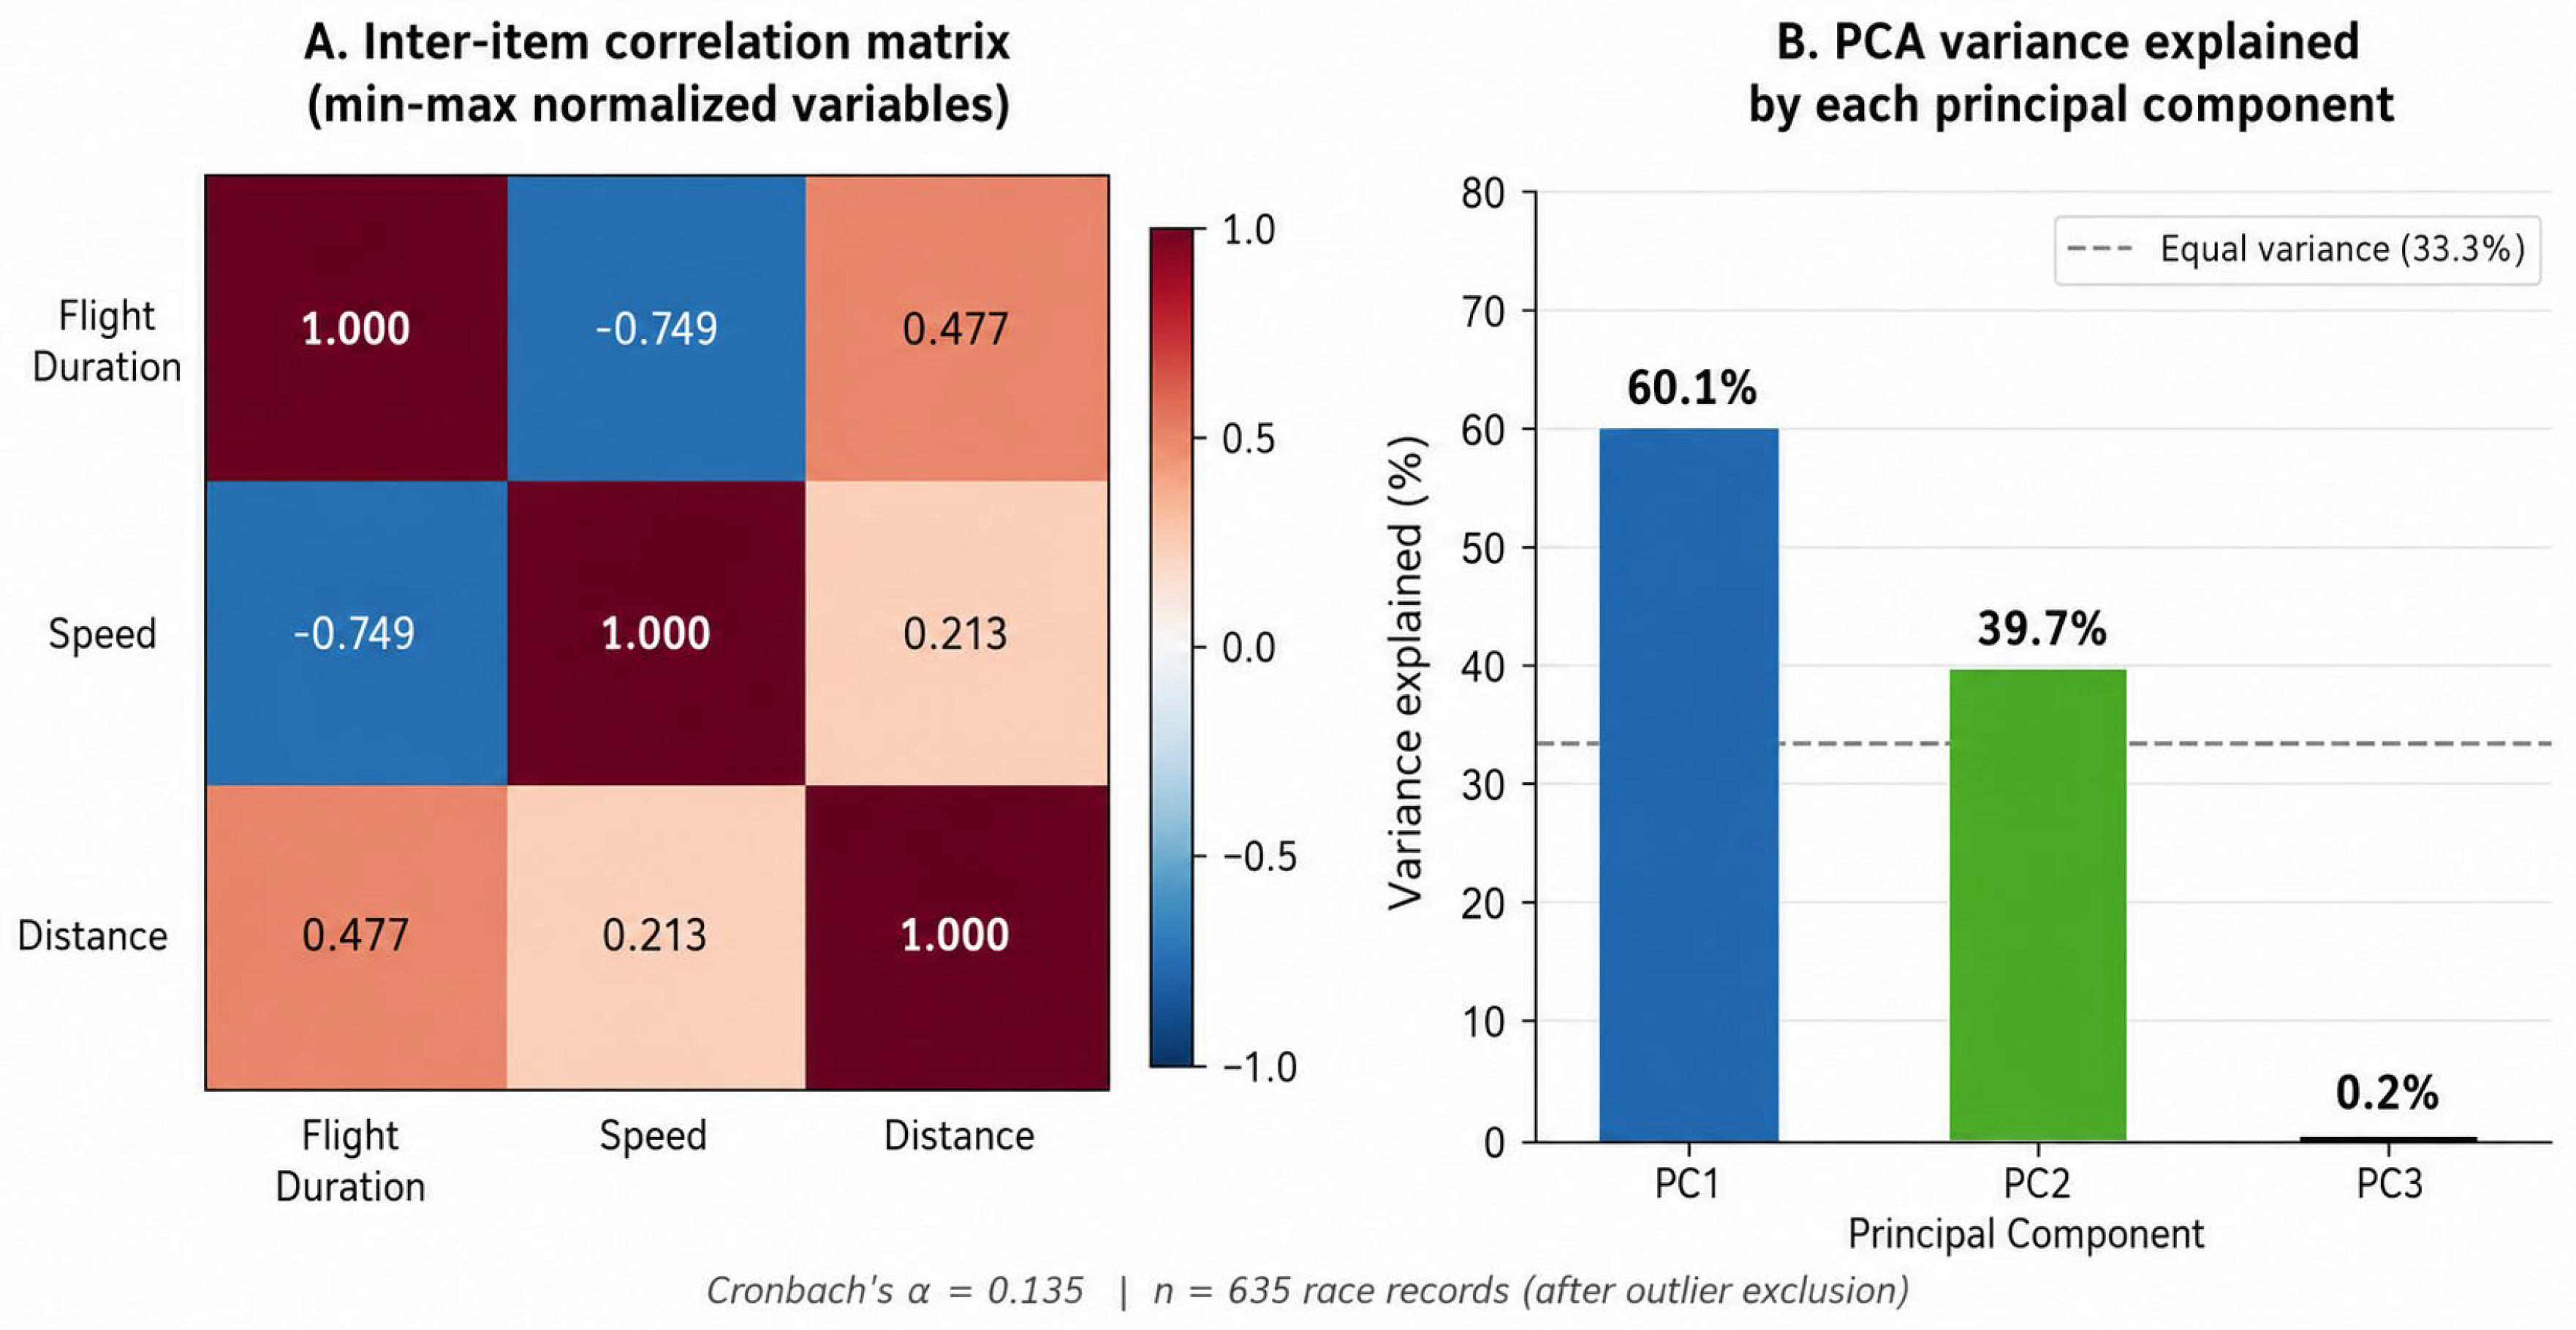
To assess the construct validity of the Flight Performance Score, the internal consistency and dimensionality of its three normalized component variables were evaluated for downstream analyses. Cronbach’s alpha calculated across flight duration, speed, and distance yielded a coefficient of 0.135, which falls below the conventional threshold of 0.70 typically required for composite indices measuring a single latent construct (Figure 2A). Flight duration and speed exhibited a moderate negative correlation (r = −0.749), indicating that individuals with longer flight durations tended to fly at lower speeds. A moderate positive association was observed between flight duration and distance (r = 0.477), while speed and distance showed only a weak positive correlation (r = 0.213). The mixed directionality and variable magnitude of these associations confirm that the three variables capture distinct and partially opposing aspects of flight performance rather than converging on a shared underlying trait (Figure 2).
Figure 2.
Internal consistency and dimensionality analysis of the Flight Performance Score (FPS) components (n = 635 race records): (A) Pearson correlation matrix of flight duration, speed, and distance. (B) Scree plot showing the variance explained by principal components derived from the standardized FPS variables. Cronbach’s α = 0.135.
Principal component analysis of the standardized component variables revealed a two-dimensional variance structure, with PC1 and PC2 accounting for 60.1% and 39.7% of the total variance, respectively, while PC3 contributed only 0.2% (Figure 2B). The dominant contribution of PC1 reflects the strong inverse relationship between flight duration and speed, which emerged as the primary axis of individual variation in the dataset. The near-zero contribution of PC3 indicates that virtually all meaningful variance in the three-variable system is captured within a two-dimensional space. In this respect, these findings demonstrate that flight duration, speed, and distance represent functionally distinct and partially antagonistic performance dimensions and provide empirical support for the equal-weighting scheme applied in FPS construction, as no single variable emerged as a dominant or redundant contributor to the composite index. The low Cronbach’s alpha value observed for the FPS components is therefore not unexpected, as flight duration, speed, and distance capture different aspects of racing performance rather than interchangeable manifestations of a single underlying trait.
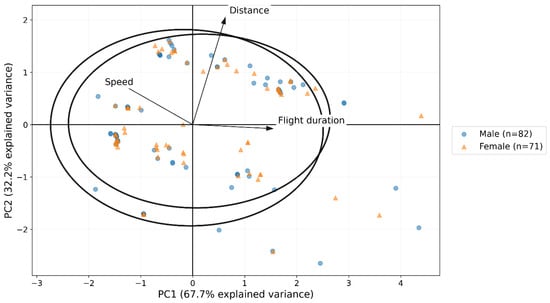
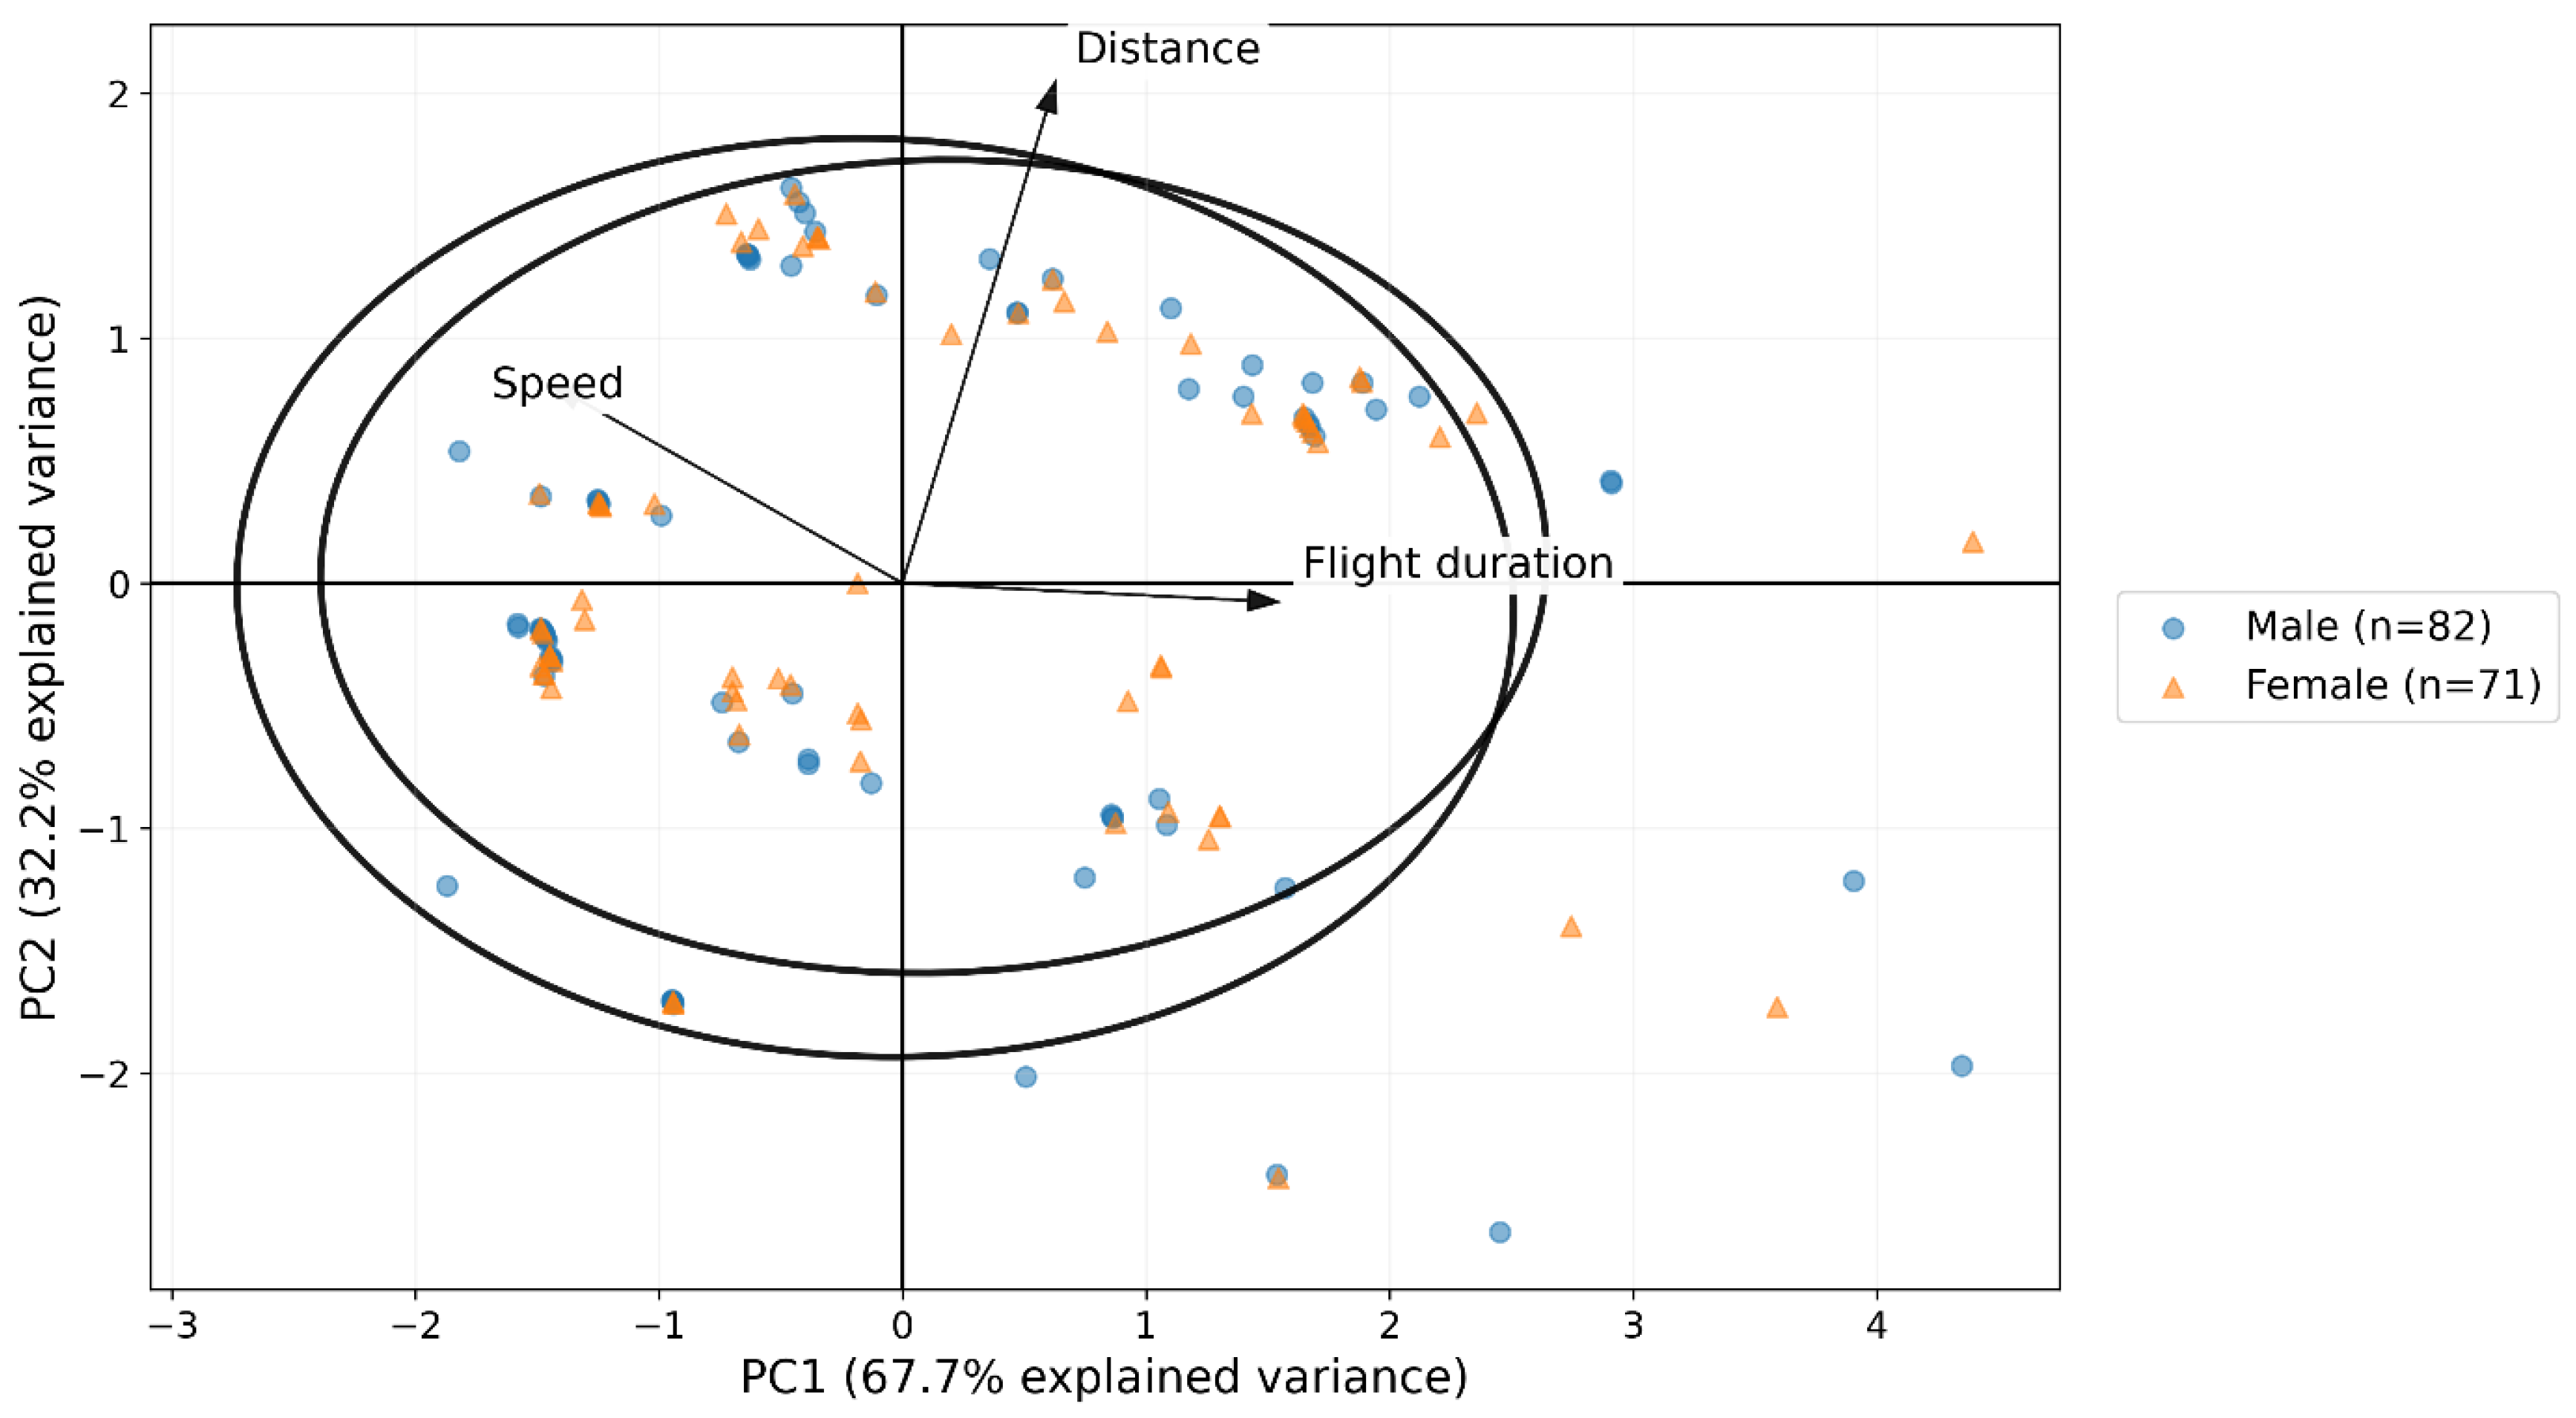
We next performed PCA to evaluate whether male and female individuals showed any multivariate separation based on the measured flight traits (Figure 3). The analysis included flight duration, speed, and distance and was performed both in the raw dataset and after outlier exclusion. In the raw dataset, 89 males and 77 females were included, whereas after outlier filtering, the analysis was based on 82 males and 71 females. Overall, the PCA plots did not reveal a clear separation between male and female individuals. Instead, the two groups showed substantial overlap in the multivariate trait space defined by the first two principal components. Although minor shifts in the central distributions of males and females could be visually apparent in some figure versions, these differences were not strong enough to indicate a robust sex-specific clustering pattern. The wide overlap between the ellipse boundaries further supported the lack of a distinct multivariate structure separating the two sex groups. This pattern suggests that the variation observed in flight performance traits is largely shared between males and females, rather than being structured primarily by sex. In other words, while individual-level variation in duration, speed, and distance was evident, this variation did not organize into two clearly distinguishable sex-based groups. Thus, sex does not appear to be a dominant source of variation across the measured flight parameters in this dataset (Figure 3).
Figure 3.
Principal component analysis (PCA) biplot of flight kinematic traits in male (n = 82) and female (n = 71) racing pigeons. Samples are projected onto PC1 (67.7%) and PC2 (32.2%). Arrows represent variable loadings, and ellipses indicate the 95% confidence regions for each sex group.
The PCA results were also informative regarding data quality. In the raw dataset, the distribution of individuals was somewhat more dispersed, likely reflecting the influence of extreme observations. After outlier removal, the ordination became visually more compact and stable. Yet, the general interpretation remained unchanged: male and female individuals still overlapped extensively, and no obvious sex-dependent clustering emerged. This indicates that the lack of separation was not simply an artifact of a few extreme values but rather reflects the overall structure of the dataset. From a biological perspective, these findings imply that the measured flight traits alone may not be sufficient to differentiate males from females at a multivariate level. Even though subtle group tendencies may exist for individual variables, these tendencies are not strong enough, when considered jointly, to generate a distinct sex-specific pattern in the ordination space. Therefore, PCA supports the interpretation that flight duration, speed, and distance do not collectively produce a strong sex-discriminatory signal in the present dataset.
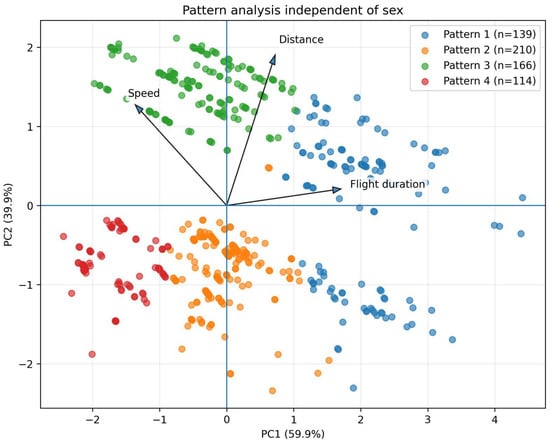
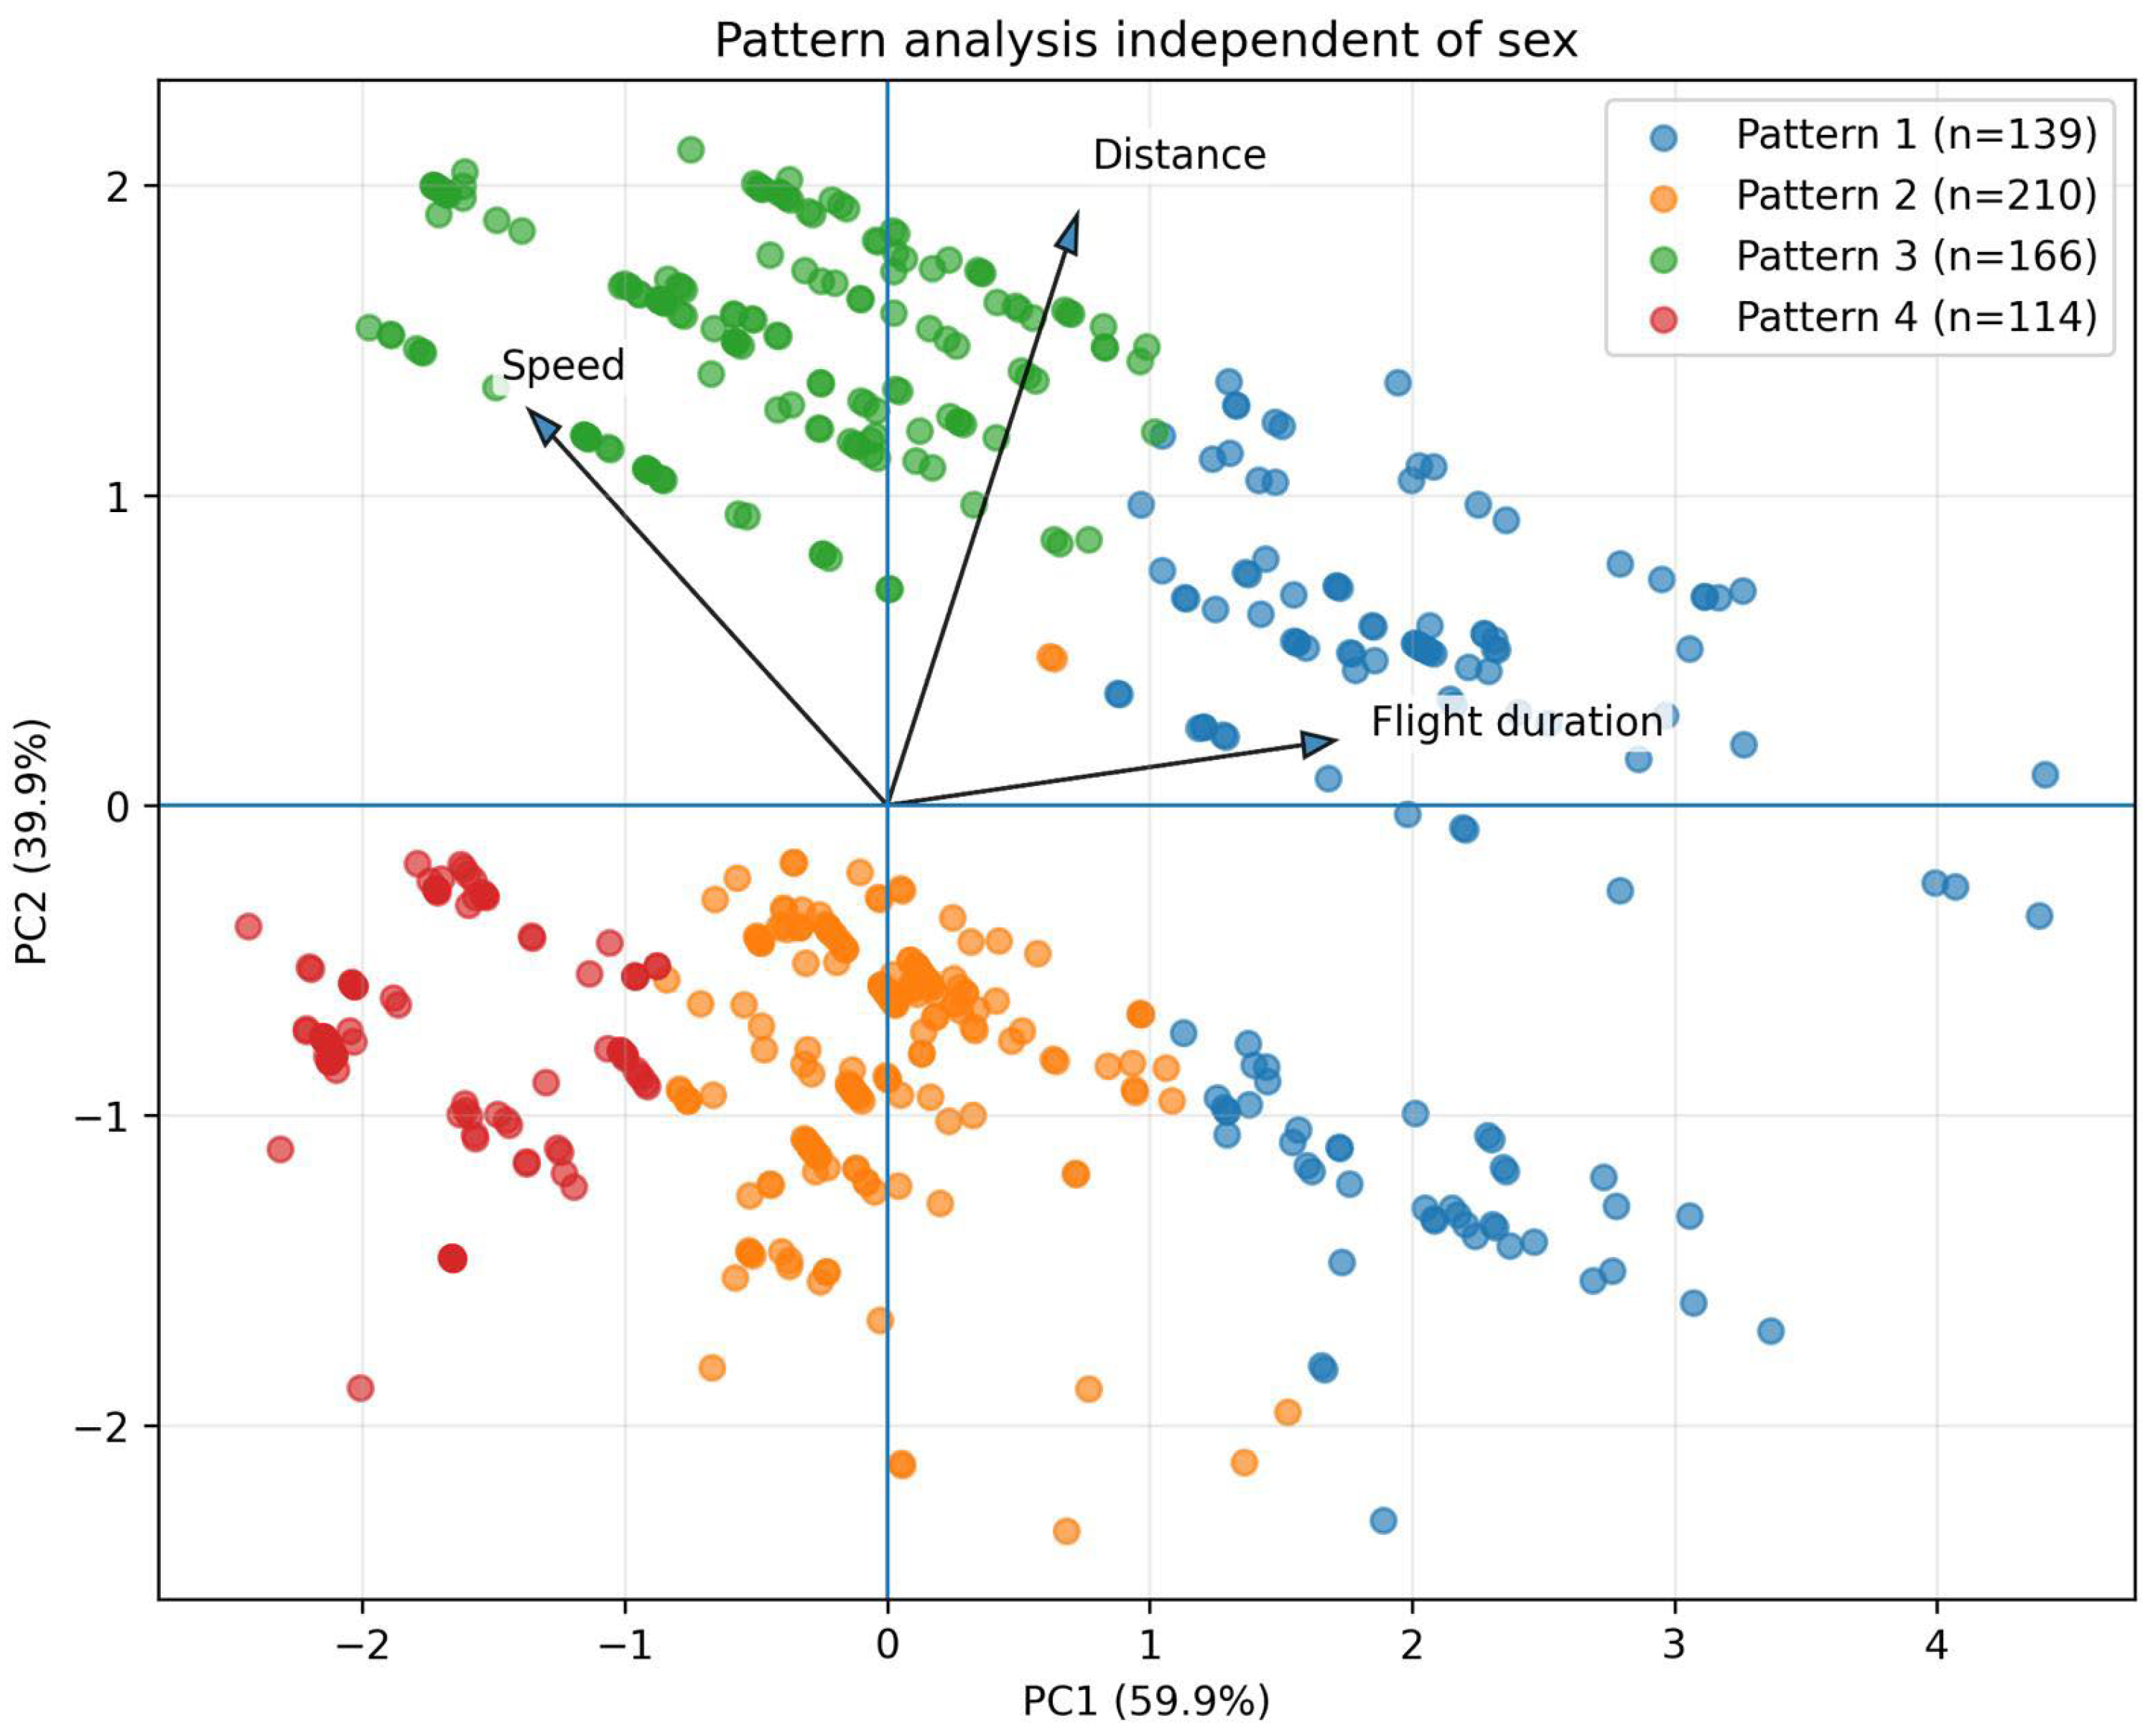
To characterize individual variation in flight behavior independently of sex-related effects, a pattern analysis was performed on three kinematic traits: flight duration, speed, and distance. Principal component analysis (PCA) revealed that the first two components collectively explained 99.8% of the total variance (PC1: 59.9%; PC2: 39.9%), indicating that this two-dimensional representation captured the majority of the multivariate structure in the data. Four discrete flight behavior patterns were identified and are visualized in the PCA biplot (Figure 4). The loading vectors indicate that flight duration contributed predominantly to PC1, while speed and distance loaded positively on PC2 and negatively on PC1, suggesting that these two traits are largely independent of flight duration but closely associated with each other.
Figure 4.
Principal component analysis (PCA) biplot of flight-performance patterns. Samples are projected onto PC1 (59.9%) and PC2 (39.9%). Colors indicate the four identified patterns: Pattern 1 (n = 139), Pattern 2 (n = 210), Pattern 3 (n = 166), and Pattern 4 (n = 114). Arrows represent variable loadings for flight duration, speed, and distance.
The four patterns were clearly separated in multivariate space, with limited overlap, supporting the distinctiveness of the identified behavioral groupings (Figure 4). Pattern 1 (n = 139) was distributed toward positive PC1 values, consistent with individuals exhibiting prolonged flight duration. Pattern 2 (n = 210) was the most numerically abundant group and occupied a central to lower-left position in the biplot, reflecting near-average to below-average values across all traits. Pattern 3 (n = 166) clustered in the upper region of the plot, corresponding to individuals with high speed and distance scores. Pattern 4 (n = 114) concentrated in the lower-left quadrant, suggesting uniformly below-average flight performance across all three kinematic variables.
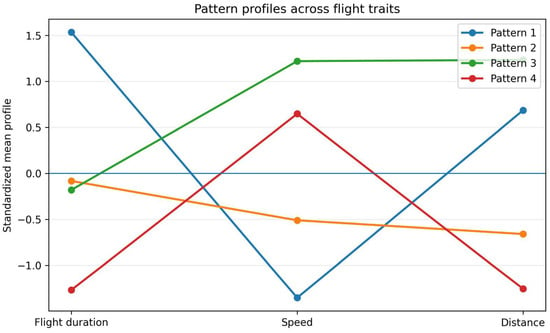
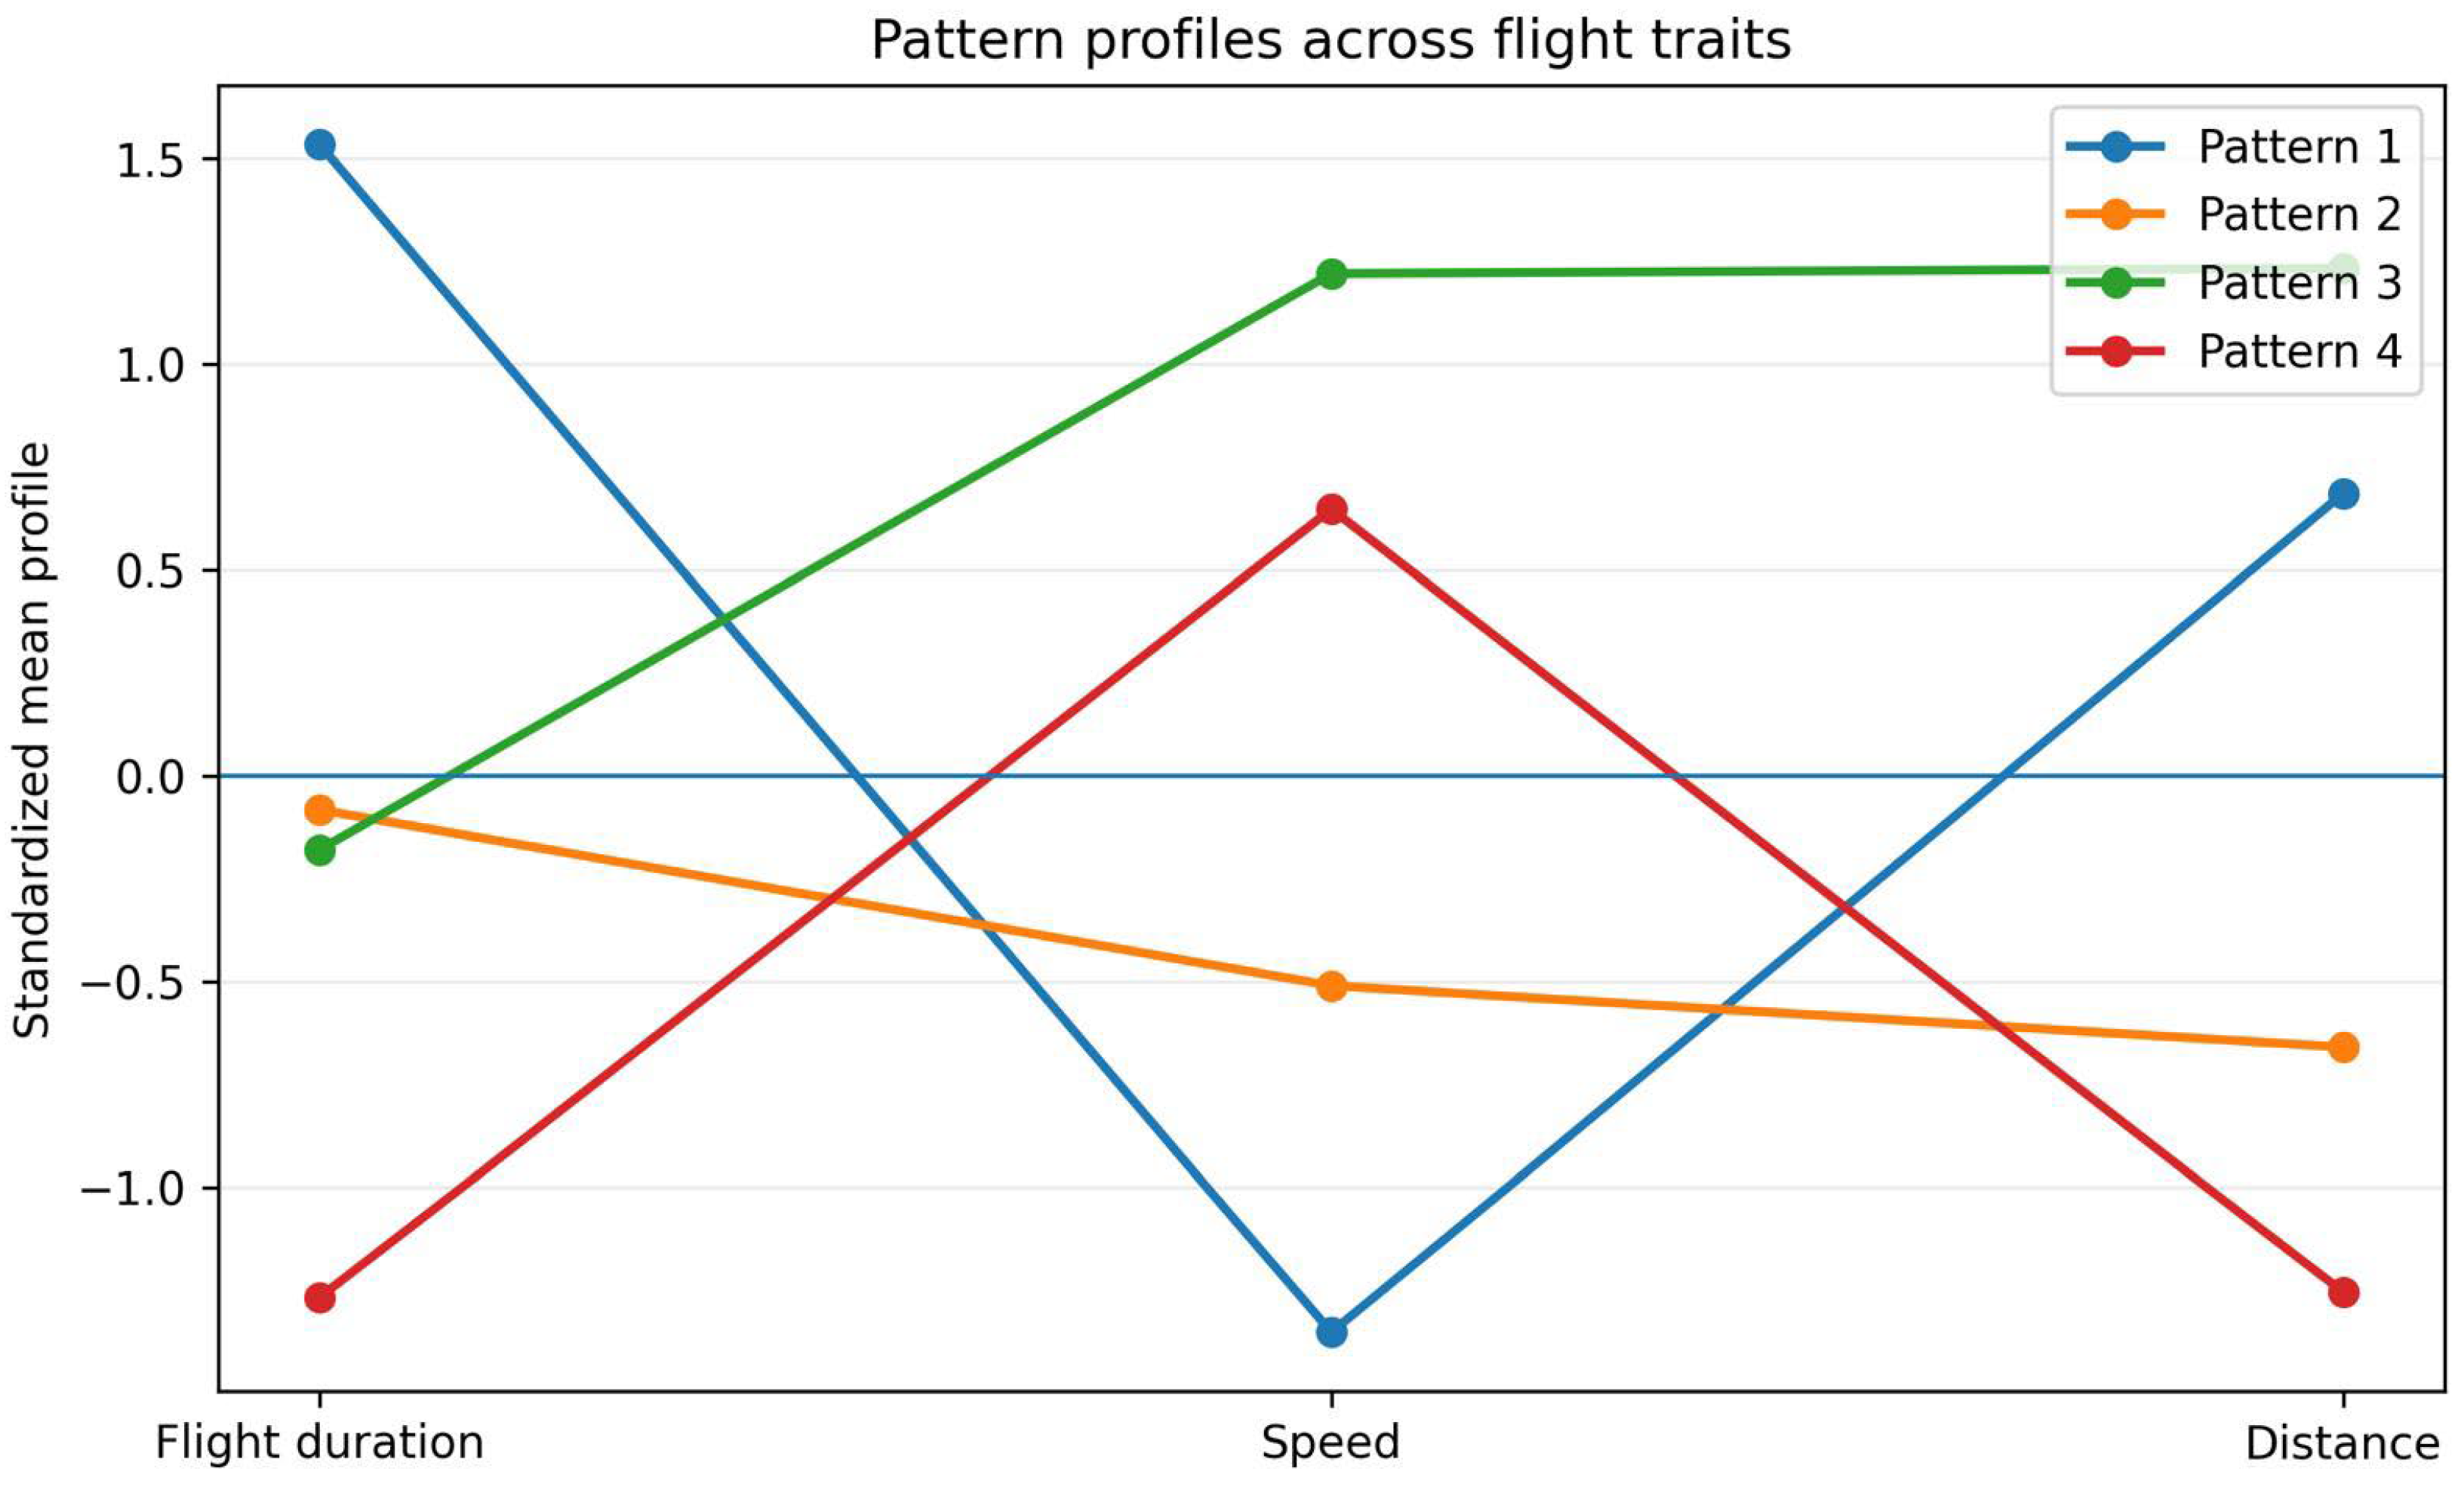
The standardized mean profiles of the four patterns across flight traits further clarified the biological interpretation of these groupings (Figure 5). Pattern 1 was characterized by markedly above-average flight duration (z ≈ 1.5), sharply below-average speed (z ≈ −1.2), and moderately above-average distance (z ≈ 0.65), indicating individuals capable of sustained but relatively slow flight. Pattern 2 exhibited near-mean flight duration, mildly below-average speed, and the lowest distance scores among all patterns (z ≈ −0.65), representing individuals with consistently modest flight performance. Pattern 3 displayed near-mean flight duration alongside the highest speed (z ≈ 1.2) and distance values, indicative of fast, far-ranging flight behavior. Pattern 4 showed the lowest flight duration (z ≈ −1.1), a moderate peak in speed (z ≈ 0.65), and a sharp decline in distance (z ≈ −1.1), suggesting brief but moderately fast flight bouts covering a limited spatial range. The crossing trajectories observed among pattern profiles (Figure 4) highlight functional trade-offs between flight kinematic traits, particularly between flight duration and speed, and support the existence of discrete, biologically meaningful flight strategies within the study population that are independent of sex.
Figure 5.
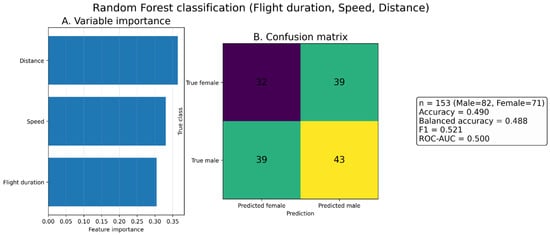
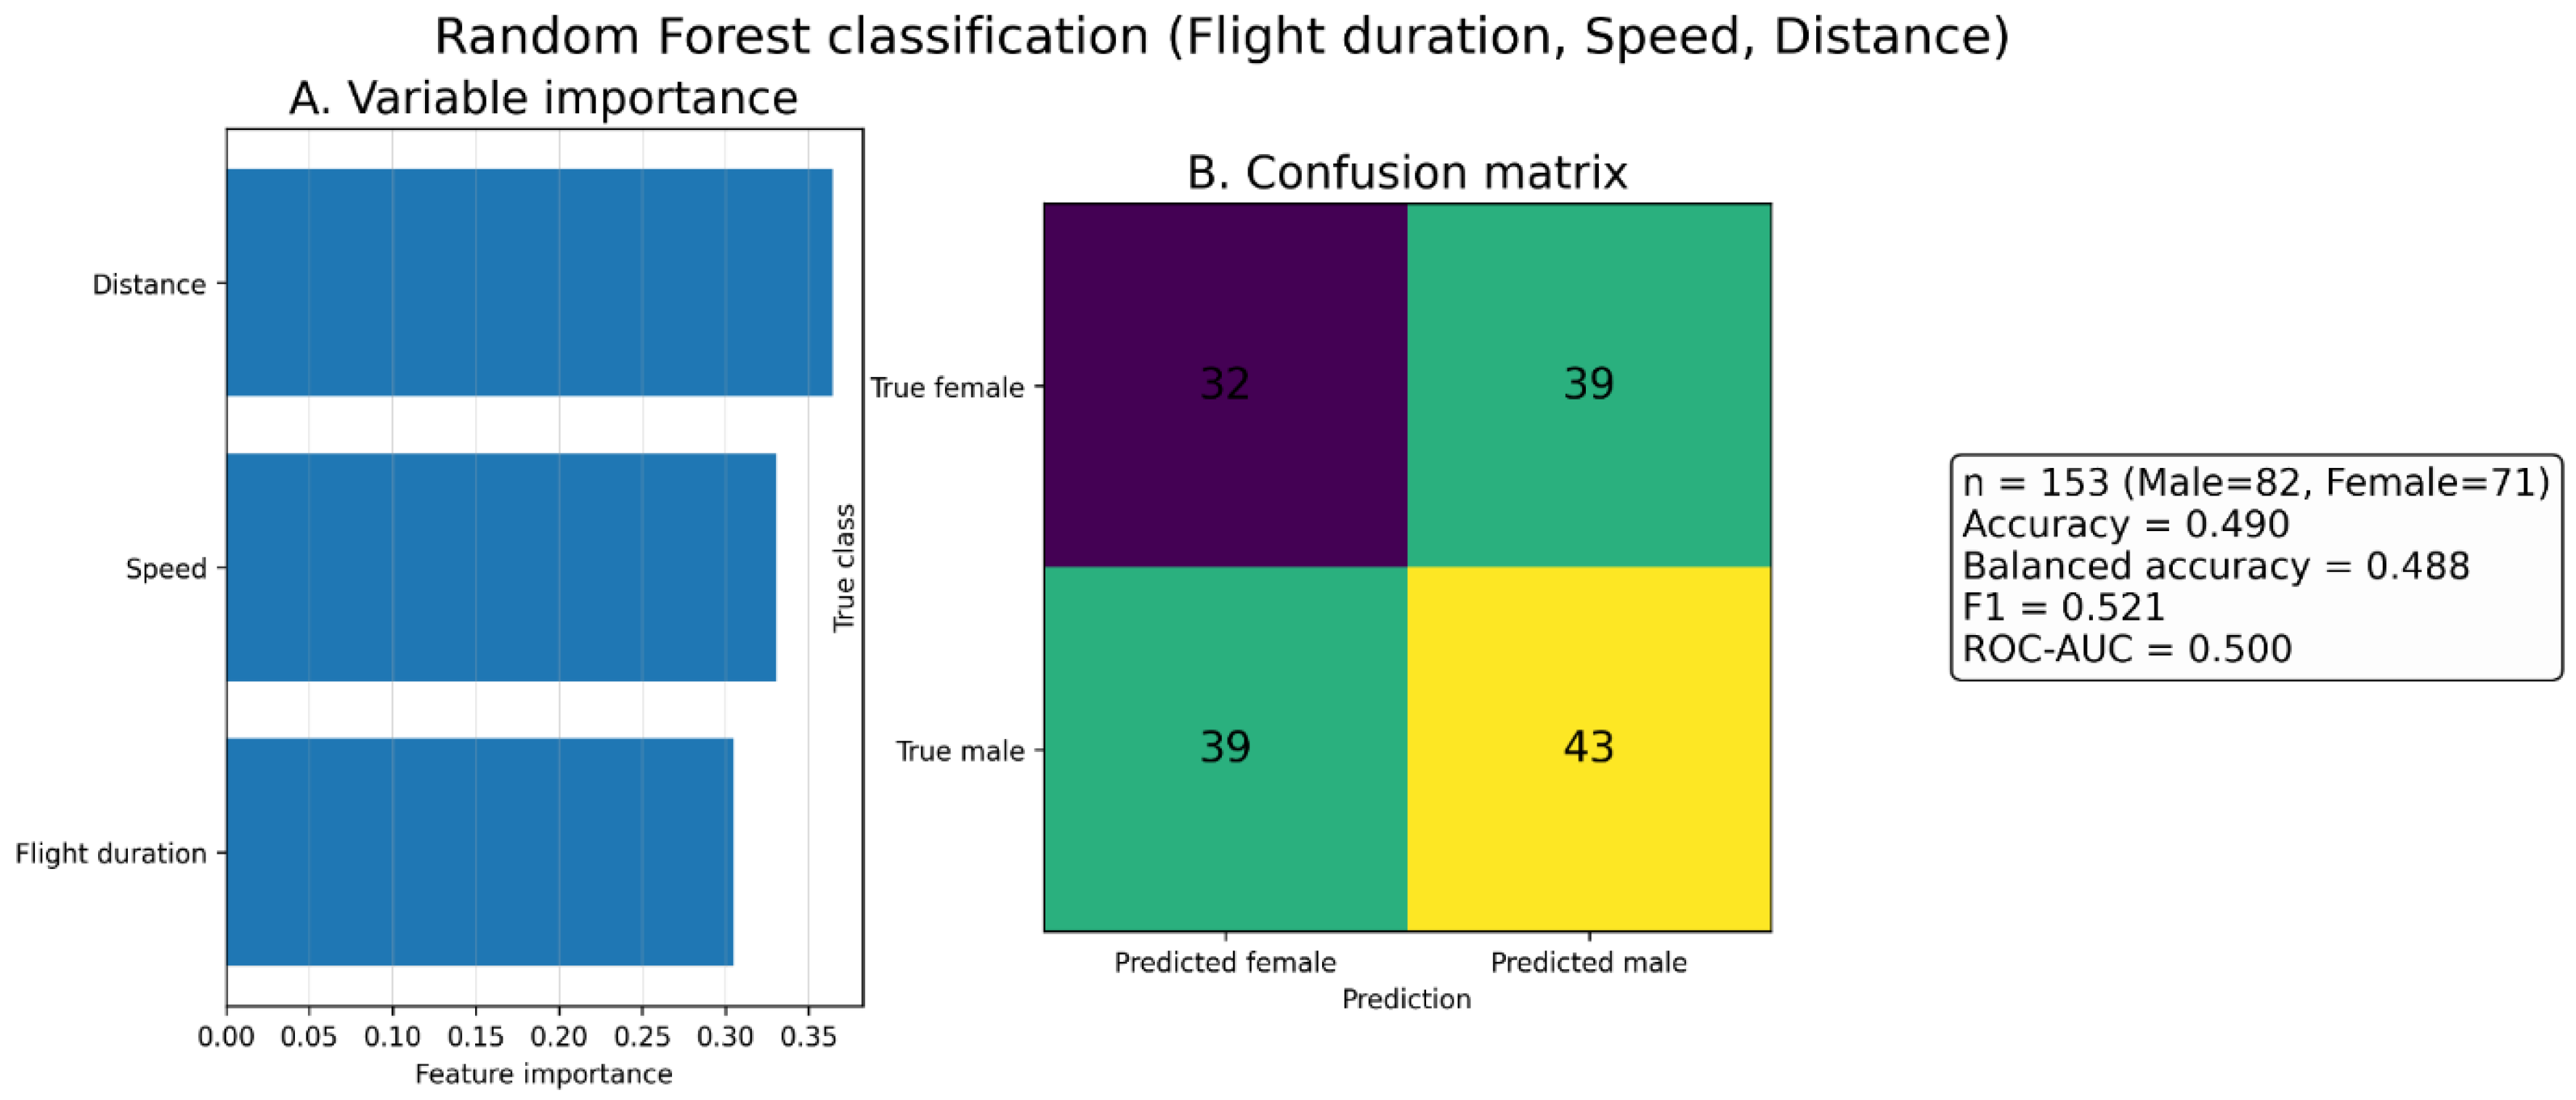
Standardized mean profiles of the four identified flight-performance patterns. The plot shows the mean standardized values (z-scores) of flight duration, speed, and distance for Pattern 1 (n = 139), Pattern 2 (n = 210), Pattern 3 (n = 166), and Pattern 4 (n = 114). A Random Forest classifier was applied to test whether sex could be predicted from flight duration, speed, and distance (Figure 6). The model was trained and evaluated on the outlier-filtered dataset, comprising 153 individuals (82 males and 71 females). Model performance was assessed using 5-fold stratified cross-validation. The Random Forest classifier showed poor discriminative performance. The Random Forest classifier demonstrated limited predictive ability for sex classification. Across five-fold stratified cross-validation, the model achieved an accuracy of 0.518 ± 0.055, a balanced accuracy of 0.513 ± 0.062, an F1 score of 0.508 ± 0.047, and an ROC-AUC of 0.513 ± 0.043. The relatively small variation observed across cross-validation folds indicates that model performance was consistent and stable, despite remaining close to chance level. These results suggest that flight duration, speed, and distance do not provide sufficient discriminatory information to reliably distinguish male and female individuals in the studied population. The confusion matrix further supported this interpretation by showing that misclassification occurred frequently across both classes. Rather than producing a stable separation between males and females, the classifier assigned predictions that were only marginally informative, if at all. This suggests that the relationship between sex and the analyzed variables is either extremely weak or too inconsistent to be captured by a supervised machine learning approach under the present dataset conditions. Feature importance analysis indicated that the included predictors contributed to the model to varying degrees; however, these contributions should be interpreted with caution. Even if one variable appeared relatively more important than the others, the model’s overall predictive performance remained very low. Therefore, variable importance in this context does not imply biologically meaningful sex discrimination but rather reflects relative contribution within a model that itself lacks robust predictive power.
The results obtained from descriptive comparisons, principal component analysis, and Random Forest classification were consistent in indicating limited sex-related variation in the analyzed flight-performance traits. PCA revealed substantial overlap between male and female individuals in multivariate trait space, whereas Random Forest classification showed poor discrimination and failed to reliably distinguish between sexes based on flight duration, speed, and distance (Figure 6). Collectively, these findings provide no evidence of a strong sex-dependent pattern in the analyzed flight-performance variables.
Figure 6.
Random Forest classification of sex using flight kinematic traits: (A) Variable importance scores for flight duration, speed, and distance. (B) Confusion matrix showing predicted and observed classifications for male (n = 82) and female (n = 71) pigeons. Overall model performance was evaluated using accuracy, balanced accuracy, F1 score, and ROC-AUC metrics.
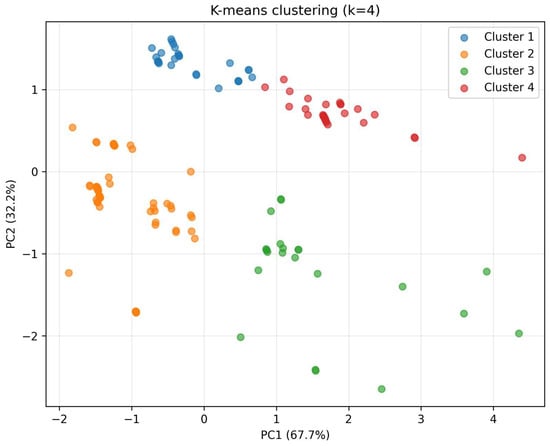
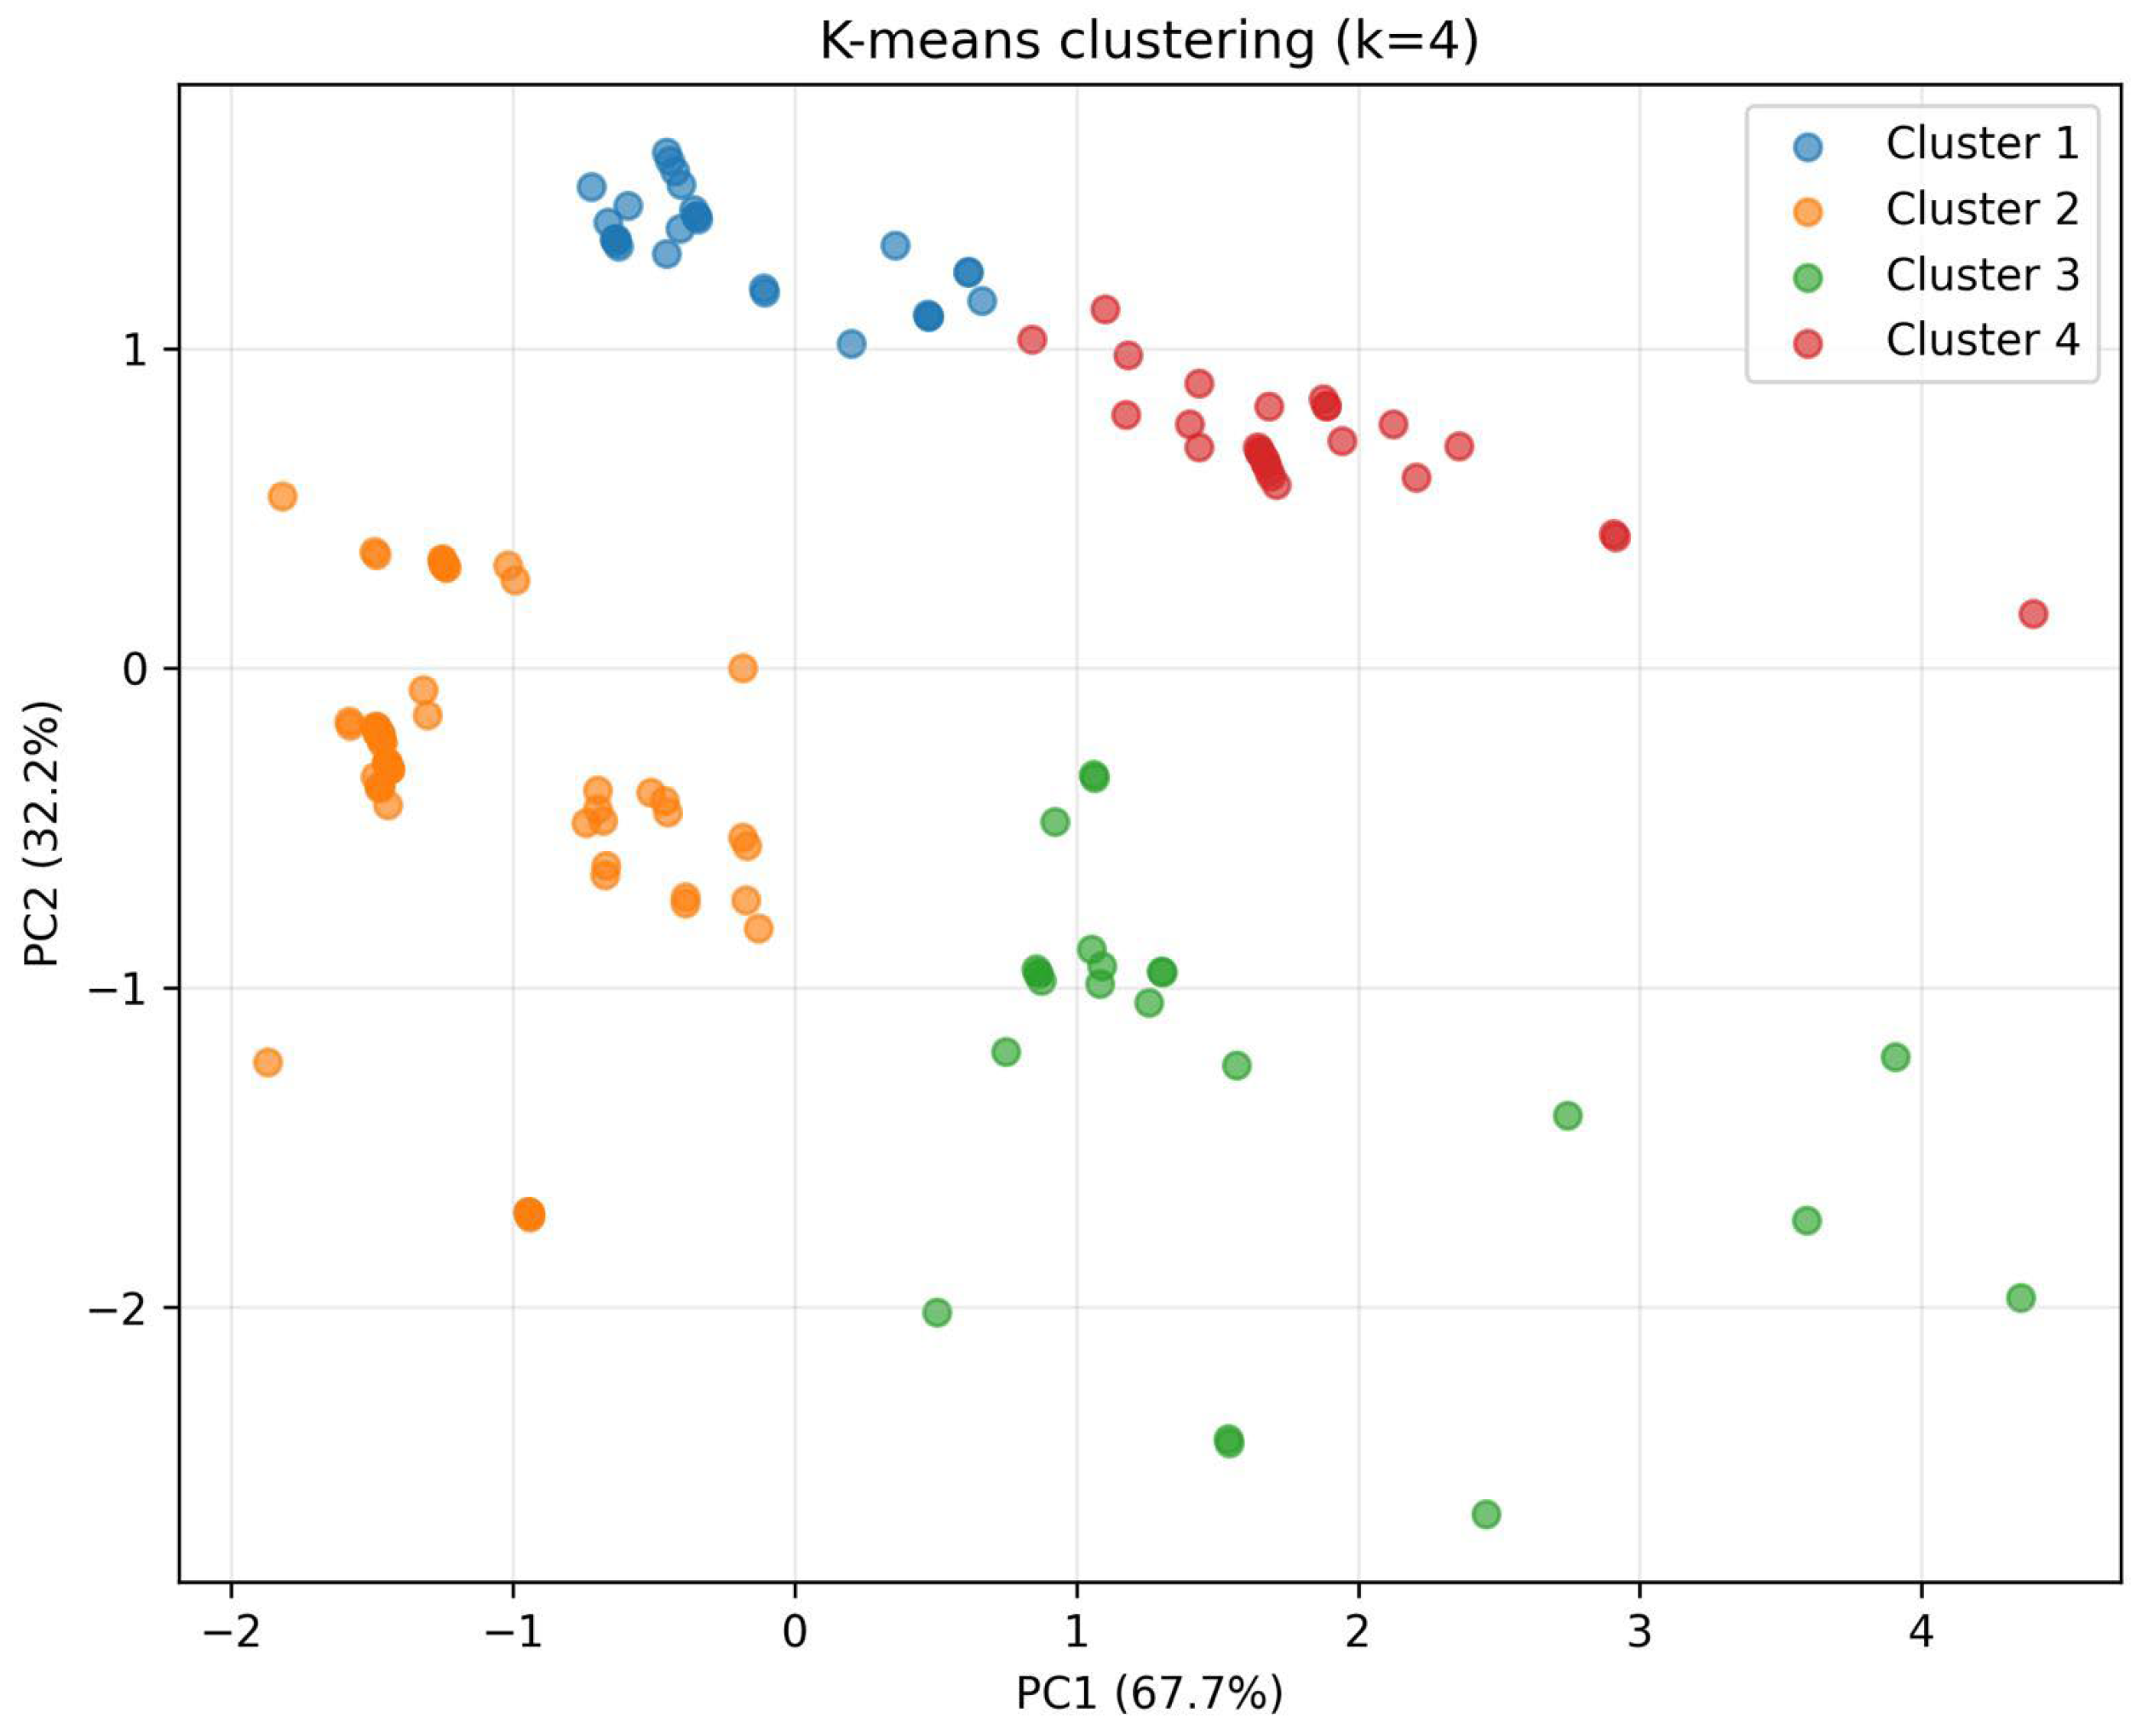
Although sex-based analyses did not reveal a strong discriminatory pattern, unsupervised clustering identified distinct flight-performance subgroups within the population. K-means clustering based on flight duration, speed, and distance supported a four-cluster structure, with the identified groups occupying partially distinct regions in multivariate space (Figure 7). This finding indicates that the major source of variation in the dataset is more closely related to the performance profile than to sex.
Figure 7.
Principal component analysis (PCA) visualization of K-means clustering results (k = 4). Samples are projected onto the first two principal components, PC1 (67.7%) and PC2 (32.2%), which together explain 99.9% of the total variance. Colors denote the four identified clusters.
4. Discussion
Recent advances in artificial intelligence and machine learning have demonstrated considerable promise in avian biology, enabling the extraction of biologically meaningful patterns from complex, multidimensional datasets that may be less readily apparent when flight-performance traits are evaluated individually rather than within a multivariate framework. In wild bird species, machine learning methods have been successfully applied to classify flight modes, predict behavioral states from accelerometer data, and infer ecological lifestyle from morphological traits, consistently revealing structure in avian datasets that conventional statistical methods failed to detect [14,15]. The application of machine learning approaches to racing pigeons remains limited. By integrating PCA, k-means clustering, pattern analysis, and Random Forest classification, this study provides a data-driven assessment of flight-performance variation in a domesticated avian population.
Under normal circumstances, some differences between male and female individuals in flight performance might be expected, as sex can directly or indirectly influence several biological traits related to flight, including body structure, muscle mass [16,17,18], energy utilization [17,19], behavioral tendencies, and physiological capacity [20]. Therefore, at least partial differentiation between the sexes in parameters such as speed, distance, and flight duration would appear biologically plausible. However, in the present study, the absence of a clear separation between males and females in both the PCA and Random Forest analyses represents an interesting and noteworthy finding, as the anticipated biological pattern was not clearly observed. This result suggests that flight performance may be shaped less by sex itself and more by individual variation, environmental conditions, physical condition, training history, or other unmeasured factors. Accordingly, the lack of a distinct sex-based pattern should not be viewed merely as a negative result, but rather as an informative observation indicating that the mechanisms underlying flight performance may be more complex and multifactorial than initially expected.
The moderate negative correlation observed between flight duration and speed (r = −0.749) is particularly noteworthy from a biological standpoint (Figure 2), as it suggests the existence of a fundamental performance trade-off in racing pigeons analogous to the speed–endurance antagonism documented across vertebrate taxa. Such trade-offs between burst performance and sustained locomotion are thought to be underpinned by muscle-level physiological constraints, particularly the co-variation of myosin isoform expression and oxidative capacity across muscle fiber types, whereby fast-contracting, glycolytic fibers favor high power output at the cost of fatigue resistance. In contrast, slow-twitch oxidative fibers support sustained effort at reduced velocity [21]. In racing pigeons, the pectoralis muscle (which accounts for approximately 11% of total body weight) plays a central role in determining both speed and endurance capacity. Transcriptomic analyses have demonstrated that genes involved in fatty acid metabolism, mitochondrial function, and muscle remodeling are differentially regulated following competition flights, highlighting the physiological demands of reconciling speed and endurance within a single athletic phenotype [22]. The positive association between flight duration and distance (r = 0.477) further suggests that endurance-type individuals can cover greater total distances despite lower velocities, potentially representing a distinct adaptive strategy relevant to long-distance racing performance.
The four flight performance patterns identified in the present study are consistent with the existence of distinct locomotor strategies that reflect fundamental trade-offs between speed, endurance, and distance capacity in racing pigeons. Pattern 1, characterized by prolonged flight duration and below-average speed, resembles an endurance-type locomotor strategy in which individuals sustain aerobic effort over extended periods at reduced velocity, a profile analogous to what aerodynamic theory predicts for birds flying at minimum power speed (Vmps), where metabolic cost per unit time is minimized rather than cost per unit distance [23]. In contrast, Pattern 3, exhibiting the highest speed and distance values, is consistent with birds operating near the maximum range speed (Vmrs), the speed at which distance covered per unit energy is maximized, which has been proposed as the preferred flight speed in well-trained racing pigeons [23]. Pattern 4, with uniformly low values across all three kinematic traits, may represent individuals in suboptimal physical condition, at an early stage of training, or those yet to reach peak athletic capacity, consistent with observations that flight performance in young racing pigeons improves substantially across training stages and is sensitive to prior health conditions [9]. The identification of these distinct performance profiles has direct implications for selective breeding: birds exhibiting Pattern 3 profiles may represent the most athletically versatile individuals, while Pattern 1 birds may be preferentially suited to long-distance race categories. Transcriptomic analyses of racing pigeons have demonstrated that genes involved in fuel selection and muscle maintenance during flight are differentially regulated following competition, suggesting that variations in these pathways may underlie population-level differences in performance profiles and could be exploited for genetic improvement targeting specific race categories [22].
The absence of a significant sex effect on flight performance in the present study warrants consideration in the broader avian locomotor literature. In wild bird species, sex-related differences in locomotor performance are frequently reported and are typically attributed to sexual dimorphism in body mass, muscle composition, and reproductive investment. For instance, studies on domesticated galliform birds have shown that males exhibit higher maximum sustainable speeds and greater incremental metabolic costs of locomotion than females, with these differences arising concomitantly with the development of secondary sex characteristics at sexual maturation [16]. However, such dimorphism is largely driven by divergent selection pressures acting on the two sexes in wild populations, particularly through sexual selection and sex-specific reproductive costs. In domesticated species subject to artificial selection for performance traits (rather than for reproductive or display characteristics), sex-related differences in locomotor capacity may be substantially reduced or absent. Genomic analyses of racing pigeons have shown that superior flight performance arises from a polygenic architecture leveraging standing genetic variation, with no single locus acting as a master switch for performance [24]. This polygenic architecture, shared across both sexes and shaped by centuries of performance-oriented artificial selection, may effectively homogenize flight capacity between males and females, rendering sex a poor predictor of individual performance in this breed. Furthermore, the application of machine learning classification in the present study revealed that three kinematic traits (flight duration, speed, and distance) were entirely insufficient to discriminate between sexes (ROC-AUC = 0.500), a finding consistent with the interpretation that these variables reflect individual athletic capacity rather than sex-specific phenotypic divergence. Comparable limitations in sex prediction from behavioral or locomotor features alone have been reported in other avian contexts, where the inclusion of navigational, spatial, or morphometric variables was necessary to achieve above-chance classification accuracy [25,26].
The Random Forest classifier’s failure to predict sex above chance level (ROC-AUC = 0.500, accuracy = 0.490) is a particularly informative negative result that merits explicit discussion. A ROC-AUC of 0.500 is mathematically equivalent to random guessing, indicating that the three flight kinematic variables included in the model carry zero discriminatory information with respect to biological sex. This outcome is consistent with the univariate and multivariate analyses. It reinforces the conclusion that sex does not structure the variation captured by flight duration, speed, and distance in this population. The near-perfect balanced accuracy (0.488) further confirms that this failure is not attributable to class imbalance between male and female groups. From a methodological perspective, this result highlights both the strengths and limitations of the analytical approach: the convergence of multiple independent methods on the same conclusion substantially increases confidence in the finding, yet the available feature set constrains the model’s predictive capacity. Machine learning approaches applied to avian datasets have demonstrated that the predictive accuracy of classification models is highly sensitive to the biological relevance and completeness of the input feature set [15]. Future models incorporating additional variables, including morphometric measurements such as wing length and body mass, physiological indicators such as hematocrit and muscle condition scores, or behavioral traits such as navigational accuracy and loft return fidelity, may achieve greater predictive power and reveal sex-related patterns that are not detectable from kinematic data alone.
The absence of a strong sex effect observed in the present study is consistent with the growing recognition that flight performance in birds emerges from the interaction of multiple biomechanical, physiological, and behavioral factors rather than from a single biological attribute. Recent investigations have highlighted the complexity of avian flight systems, demonstrating that wing kinematics, acceleration dynamics, and biomechanical adaptations collectively influence locomotor performance across a range of contexts [27,28,29,30]. Likewise, detailed analyses of the flight behavior of pigeons and wild birds have shown that movement patterns are shaped by both intrinsic characteristics and external environmental conditions, including landscape features encountered during flight [27,28,29,30,31,32]. Together, these findings suggest that variation in flight performance is likely governed by a multidimensional network of interacting factors, which may explain why sex alone provided little discriminatory power in the present dataset. The Random Forest model’s inability to classify males and females above chance level further supports the interpretation that the analyzed kinematic variables primarily reflect individual variation in flight capacity rather than sex-specific performance signatures.
The identification of distinct performance profiles within the dataset is also consistent with evidence from studies of wild bird species, which show that flight capacity cannot be adequately described by a single performance metric. Investigations of migratory warblers have demonstrated that variation in wing morphology is closely associated with ecological specialization and migratory behavior, indicating that different combinations of flight-related traits may confer alternative performance advantages under different environmental conditions [33]. Similarly, studies of flight formations and aerodynamic interactions in free-flying birds have highlighted multiple strategies for optimizing energy expenditure and locomotor efficiency during sustained flight [34]. Research integrating behavioral and biomechanical approaches has further emphasized that avian flight performance emerges from the interaction of morphology, movement patterns, and environmental context rather than from a single dominant trait [28,35]. In racing pigeons, genetic studies have likewise suggested that athletic performance is influenced by a polygenic architecture and substantial inter-individual variation [36]. Indeed, the clusters identified in the present study should not be interpreted as definitive biological categories but rather as data-driven multivariate performance profiles that summarize recurring patterns of variation among individuals.
Beyond their immediate scientific contribution, the findings of the present study carry important practical and conservation-related implications. Racing and postal pigeons represent a unique category of domesticated birds in which performance traits are directly linked to the purpose of breeding. Yet, quantitative, data-driven evaluations of these traits have remained scarce in the scientific literature. The application of machine learning and multivariate statistical frameworks to flight performance data, as demonstrated here, offers breeders and researchers a more objective, reproducible, and scalable basis for performance assessment compared to experience-based selection criteria alone. By statistically delineating distinct flight performance profiles and quantifying inter-trait relationships, such approaches provide the kind of structured phenotypic data that can serve as a critical foundation for subsequent molecular investigations. Integration of the performance patterns identified here with genomic or transcriptomic data (for instance, through genome-wide association studies targeting speed- or endurance-related quantitative trait loci) could substantially advance the identification of superior candidates and accelerate progress in performance-oriented selection programs.
From a conservation perspective, the Turkish postal and racing pigeon populations studied here represent indigenous breeds that constitute a meaningful component of domestic avian biodiversity. These breeds have been shaped by centuries of selective breeding within specific geographic and cultural contexts, resulting in genetically distinct populations whose preservation carries inherent scientific and cultural value [11,37,38]. The continuation of pigeon keeping as a hobby plays a non-trivial role in maintaining viable population sizes for these breeds and in sustaining the knowledge systems and practices associated with their husbandry. In regions where traditional pigeon breeding is declining, breed-specific genetic erosion represents a tangible risk. Scientific engagement with these populations (through phenotypic characterization, performance monitoring, and ultimately genomic documentation) can provide the empirical basis needed to support formal conservation strategies. In this sense, the present study contributes not only to the quantitative understanding of flight performance but also to the broader effort to document and preserve the biological heritage represented by indigenous pigeon breeds in Türkiye.
Several limitations of the present study should be acknowledged when interpreting the findings. First, the dataset was derived from a single racing season, which restricts the generalizability of the observed performance patterns across years and potentially different environmental or meteorological conditions. Longitudinal data spanning multiple seasons would be necessary to determine whether the identified flight performance profiles represent stable individual characteristics or context-dependent responses to specific race conditions. Second, sex classification in the present study was based on breeder-provided records and/or individual identification data rather than molecular sexing. Although this approach is common in field-based studies of racing pigeons, it introduces the possibility of misclassification, particularly in species where morphological sex determination can be ambiguous. Future studies should incorporate PCR-based or other molecular methods to verify sex assignment and ensure the accuracy of sex-based comparisons [39,40]. Third, the pattern analysis was conducted at the level of individual race records rather than individual birds, as each pigeon contributed a variable number of records to the dataset. This unequal contribution of individuals to the analytical pool introduces a degree of non-independence among observations. It may bias the identified performance patterns toward the behavioral profiles of more frequently recorded birds. Aggregating records at the individual level or applying mixed-effects modeling approaches that explicitly account for the hierarchical structure of the data would provide a more statistically rigorous framework for future analyses. Furthermore, although all pigeons belonged to the same racing population and were evaluated within a single racing season, detailed records regarding exact age, training intensity, and management conditions were unavailable. They may have contributed to unexplained variation in flight performance. In addition, because the analytical unit of the present study was the race record rather than the individual bird, repeated contributions from the same pigeons may have introduced a degree of dependency among observations, which should be explicitly addressed in future studies using mixed-effects or hierarchical modeling approaches. To facilitate interpretation of these limitations, Table S1 provides a detailed summary of the datasets, analytical units, and sample sizes used for each statistical analysis, explicitly distinguishing between individual-level and race-record-level analyses and clarifying the potential non-independence among observations.
Finally, several biologically relevant covariates known to influence flight performance, including age, body condition, training history, nutritional status, and health records, were unavailable for the present study population and could therefore not be controlled for in the analyses. The absence of these variables limits the extent to which the observed individual variation in flight performance can be attributed to specific biological determinants. These factors may have contributed to some of the unexplained variation observed among individuals. Their inclusion represents an important avenue for future investigation. Incorporating such covariates into multivariate models would substantially enhance the explanatory power of the analytical framework. The FPS was used as a secondary descriptive composite index rather than as a replacement for trait-level analyses. Equal weighting was selected because no validated biological or performance-based evidence currently supports assigning greater weight to flight duration, speed, or distance. Therefore, the primary interpretations of the study were based on the individual component traits and multivariate analyses rather than on FPS alone. It would also facilitate a more mechanistic interpretation of the performance profiles identified in the present study.
5. Conclusions
This paper provides a comprehensive, multi-framework evaluation of flight performance in racing pigeons (Columba livia domestica) raised in Türkiye, integrating descriptive statistics, multivariate ordination, unsupervised clustering, and supervised machine learning approaches. Across all analytical levels, a highly consistent pattern emerged: sex was not a dominant determinant of flight duration, speed, or distance in the studied population. Univariate comparisons revealed no statistically significant sex-related differences in any of the three flight parameters, and this finding was independently corroborated by PCA, which demonstrated substantial overlap between male and female individuals in multivariate trait space, and by Random Forest classification, which failed to discriminate between sexes at above-chance accuracy. The convergence of unsupervised and supervised approaches to the same conclusion substantially strengthens the reliability of this interpretation. It reduces the likelihood that the absence of a sex effect is an artifact of any single analytical method. Despite the lack of a sex-based signal, the dataset revealed meaningful internal structure when analyzed independently of sex. Pattern analysis of individual race records identified four biologically distinct flight performance profiles characterized by differential trade-offs among flight duration, speed, and distance. These patterns suggest that the primary axis of variation in flight performance is not sex but rather individual-level performance strategy, which may reflect differences in training history, physical condition, environmental exposure, or other unmeasured biological factors. The identification of these discrete performance profiles has practical implications for breeding and selection decisions, suggesting that performance-based grouping may be a more informative criterion than sex alone when evaluating racing potential. These findings also carry practical implications for breeding programs, as the quantified flight profiles identified here provide a phenotypic foundation for future genomic investigations targeting performance-related traits. Additionally, the indigenous pigeon populations studied here represent an important component of avian biodiversity, and their scientific characterization contributes to both their documentation and long-term conservation.
Supplementary Materials
The following supporting information can be downloaded at: https://www.mdpi.com/article/10.3390/birds7020037/s1, Table S1. Summary of datasets, analytical units, and sample sizes used for each statistical analysis; Figure S1. Workflow summarizing the analytical framework and datasets used throughout the study. The figure distinguishes analyses performed at the individual-pigeon level (ANOVA, PCA, and Random Forest classification; n = 166 pigeons) from those conducted at the race-record level (pattern analyses; n = 781 race records). The workflow illustrates the analytical pathways used for sex-related analyses and flight-performance pattern characterization.
Author Contributions
Conceptualization, O.C. and S.A.; Methodology, S.A.; Software, F.A. and S.A.; Validation, F.A. and S.A.; Formal Analysis, N.S., O.C., F.A. and S.A.; Investigation, N.S., O.C. and S.A.; Resources, N.S., O.C. and S.A.; Data Curation, N.S., O.C. and S.A.; Writing—Original Draft Preparation, N.S., O.C. and S.A.; Writing—Review and Editing, N.S., O.C., F.A. and S.A.; Visualization, F.A. and S.A.; Supervision, S.A. All authors have read and agreed to the published version of the manuscript.
Funding
This research received no external funding.
Institutional Review Board Statement
Ethical approval was waived for this study because no invasive procedures, experimental manipulations, biological sampling, or direct animal interventions were performed. Permission to use the data for scientific purposes was obtained from the Turkish Avian DNA Institute, where all pigeons included in the study were registered..
Informed Consent Statement
Not applicable.
Data Availability Statement
The raw data supporting the conclusions of this article will be made available by the authors on request.
Acknowledgments
The authors thank the Turkish Avian DNA Institute for their help in data collection.
Conflicts of Interest
The authors declare no conflicts of interest.
Abbreviations
The following abbreviations are used in this manuscript:
| ANOVA | Analysis of Variance |
| FPS | Flight Performance Score |
| HSD | Honestly Significant Difference |
| IQR | Interquartile Range |
| PCA | Principal Component Analysis |
| PC1 | First Principal Component |
| PC2 | Second Principal Component |
| PC3 | Third Principal Component |
| ROC-AUC | Receiver Operating Characteristic Area Under the Curve |
| RF | Random Forest |
| SD | Standard Deviation |
| Vmps | Minimum Power Speed |
| Vmrs | Maximum Range Speed |
| km | Kilometer |
| m/min | Meters per Minute |
| m.s | Minute.Second |
| DNA | Deoxyribonucleic Acid |
| PCA biplot | Principal Component Analysis Biplot |
| IQR method | Interquartile Range Method |
| z-score | Standardized Score |
References
- Driscoll, C.A.; Macdonald, D.W.; O’Brien, S.J. From wild animals to domestic pets, an evolutionary view of domestication. Proc. Natl. Acad. Sci. USA 2009, 106, 9971–9978. [Google Scholar] [CrossRef] [Scilit] [PubMed]
- Sossinka, R. Domestication in birds. Avian Biol. 1982, VI, 373–397. [Google Scholar] [CrossRef] [Scilit]
- Stringham, S.A.; Mulroy, E.E.; Xing, J.; Record, D.; Guernsey, M.W.; Aldenhoven, J.T.; Osborne, E.J.; Shapiro, M.D. Divergence, convergence, and the ancestry of feral populations in the domestic rock pigeon. Curr. Biol. 2012, 22, 302–308. [Google Scholar] [CrossRef] [Scilit] [PubMed]
- Hedenström, A. Aerodynamics, evolution and ecology of avian flight. Trends Ecol. Evol. 2002, 17, 415–422. [Google Scholar] [CrossRef] [Scilit]
- Özkan, E.; Günay, E.; Deveci, E.İ.; Manuta, N.; Çakar, B. Geometric morphometric analysis of beak shape of Columbimorphae (Columbas, Van, Mardin and Dönek). Anat. Histol. Embryol. 2024, 53, e13094. [Google Scholar] [CrossRef] [Scilit] [PubMed]
- Speakman, J.R.; Selman, C. Physical activity and resting metabolic rate. Proc. Nutr. Soc. 2003, 62, 621–634. [Google Scholar] [CrossRef] [Scilit] [PubMed]
- Berg, A.M.; Biewener, A.A. Kinematics and power requirements of ascending and descending flight in the pigeon (Columba livia). J. Exp. Biol. 2008, 211, 1120–1130. [Google Scholar] [CrossRef] [Scilit] [PubMed]
- Tobalske, B.W.; Dial, K.P. Flight kinematics of black-billed magpies and pigeons over a wide range of speeds. J. Exp. Biol. 1996, 199, 263–280. [Google Scholar] [CrossRef] [Scilit] [PubMed]
- Scullion, F.; Scullion, M. Profiling Flight Performance of Young Racing Pigeons (Columba livia) in Training. J. Vet. Healthc. 2018, 1, 1–19. [Google Scholar] [CrossRef] [Scilit]
- Dial, K.; Kaplan, S.; Goslow, G., Jr.; Jenkins, F., Jr. A functional analysis of the primary upstroke and downstroke muscles in the domestic pigeon (Columba lima) during flight. J. Exp. Biol. 1988, 134, 1–16. [Google Scholar] [CrossRef] [Scilit] [PubMed]
- Balcı, F.; Ardıçlı, S.; Alpay, F.; Dinçel, D.; Soyudal, B.; Er, M. The determination of some morphological characteristics of Bursa Oynarı pigeon breed. Ank. Univ. Vet. Fac. J. 2018, 65, 349–355. [Google Scholar] [CrossRef] [Scilit]
- Bartels, T. Variations in the morphology, distribution, and arrangement of feathers in domesticated birds. J. Exp. Zool. Part B Mol. Dev. Evol. 2003, 298, 91–108. [Google Scholar] [CrossRef] [Scilit] [PubMed]
- Mercieca, S.; Jilly, B.; Gáspárdy, A. Connection among body measurements and flying speed of racing pigeon. Int. J. Agric. Sci. Food Technol. 2017, 3, 9–18. [Google Scholar] [CrossRef] [Scilit]
- Leos-Barajas, V.; Photopoulou, T.; Langrock, R.; Patterson, T.A.; Watanabe, Y.Y.; Murgatroyd, M.; Papastamatiou, Y.P. Analysis of animal accelerometer data using hidden Markov models. Methods Ecol. Evol. 2017, 8, 161–173. [Google Scholar]
- Madrigal-Roca, L.J. Assessing the predictive value of morphological traits on primary lifestyle of birds through the extreme gradient boosting algorithm. PLoS ONE 2024, 19, e0295182. [Google Scholar] [CrossRef] [Scilit] [PubMed]
- Rose, K.; Bates, K.; Nudds, R.; Codd, J. Ontogeny of sex differences in the energetics and kinematics of terrestrial locomotion in leghorn chickens (Gallus gallus domesticus). Sci. Rep. 2016, 6, 24292. [Google Scholar] [CrossRef] [Scilit] [PubMed]
- Rose, K.A.; Nudds, R.L.; Butler, P.J.; Codd, J.R. Sex differences in gait utilization and energy metabolism during terrestrial locomotion in two varieties of chicken (Gallus gallus domesticus) selected for different body size. Biol. Open 2015, 4, 1306–1315. [Google Scholar] [CrossRef] [Scilit] [PubMed]
- Wang, Y.; Yin, Y.; Ge, S.; Li, M.; Zhang, Q.; Li, J.; Wu, Y.; Li, D.; Dudley, R. Limits to load-lifting performance in a passerine bird: The effects of intraspecific variation in morphological and kinematic parameters. PeerJ 2019, 7, e8048. [Google Scholar] [CrossRef] [Scilit] [PubMed]
- Bishop, C.M. Circulatory variables and the flight performance of birds. J. Exp. Biol. 2005, 208, 1695–1708. [Google Scholar] [CrossRef] [Scilit] [PubMed]
- Santema, P.; Eberhart-Hertel, L.; Valcu, M.; Kempenaers, B. Sexual selection for extreme physical performance in a polygynous bird is associated with exceptional sex differences in oxygen carrying capacity. Biol. Lett. 2023, 19, 20230391. [Google Scholar] [CrossRef] [Scilit] [PubMed]
- Castro, A.A.; Garland, T., Jr.; Ahmed, S.; Holt, N.C. Trade-offs in muscle physiology in selectively bred high runner mice. J. Exp. Biol. 2022, 225, jeb244083. [Google Scholar] [CrossRef] [Scilit] [PubMed]
- Stefaniuk-Szmukier, M.; Szmatoła, T.; Pustelnik, A.; Ropka-Molik, K. First transcriptomic insight into the working muscles of racing pigeons during a competition flight. Mol. Biol. Rep. 2024, 51, 625. [Google Scholar] [CrossRef] [Scilit] [PubMed]
- Pennycuick, C. Actual and ‘optimum’flight speeds: Field data reassessed. J. Exp. Biol. 1997, 200, 2355–2361. [Google Scholar] [CrossRef] [Scilit] [PubMed]
- Gazda, M.A.; Andrade, P.; Afonso, S.; Dilytė, J.; Archer, J.P.; Lopes, R.J.; Faria, R.; Carneiro, M. Signatures of selection on standing genetic variation underlie athletic and navigational performance in racing pigeons. Mol. Biol. Evol. 2018, 35, 1176–1189. [Google Scholar] [CrossRef] [Scilit] [PubMed]
- Fayzur, D. Ensemble learning applied to classify gps trajectories of birds into male or female. arXiv 2018, arXiv:1808.08613. [Google Scholar]
- Wilcox, S.C.; Clark, C.J. Sexual selection for flight performance in hummingbirds. Behav. Ecol. 2022, 33, 1093–1106. [Google Scholar] [CrossRef] [Scilit]
- Böhm, C.; Wilberger, M.; Landmann, A. Hazards to wild birds associated with anthropogenic structures and human activities—Results of a long-term study in an urbanised area of the Alps. Birds 2025, 6, 25. [Google Scholar] [CrossRef] [Scilit]
- Forconi, F.; De Meis, I.; Dell’Omo, G.; Camomilla, V.; Vannozzi, G.; Schmid, M.; Conforto, S.; Bibbo, D. Multi-Sensor Assessment of Pigeon Flight Behavior: Role of Biomechanical and Landscape Characteristics. Sensors 2026, 26, 916. [Google Scholar] [CrossRef] [Scilit] [PubMed]
- Itay, M.; Haim, A. Artificial light at night increases growth and impairs reproductive success in budgerigars (Melopsittacus undulatus) in a duration dose-dependent manner. Birds 2024, 5, 352–362. [Google Scholar] [CrossRef] [Scilit]
- Rose, P. Evidence for aviculture: Identifying research needs to advance the role of ex situ bird populations in conservation initiatives and collection planning. Birds 2021, 2, 77–95. [Google Scholar] [CrossRef] [Scilit]
- Li, S.; Tang, Z.; Li, M.; Yang, L.; Shang, Z. Neural Correlates of Flight Acceleration in Pigeons: Gamma-Band Activity and Local Functional Network Dynamics in the AId Region. Animals 2025, 15, 1851. [Google Scholar] [CrossRef] [Scilit] [PubMed]
- Shen, Y.; Zhang, S.; Huang, W.; Shang, C.; Sun, T.; Shi, Q. Characterization of wing kinematics by decoupling joint movement in the pigeon. Biomimetics 2024, 9, 555. [Google Scholar] [CrossRef] [Scilit] [PubMed]
- Agtzidis, A.; Barboutis, C.; Giokas, S. Wing Shape and Size Variation in Migratory Sylviid Warblers: Links to Ecology and Migration. Birds 2026, 7, 18. [Google Scholar] [CrossRef] [Scilit]
- Beaumont, F.; Murer, S.; Bogard, F.; Polidori, G. Aerodynamics of flight formations in birds: A quest for energy efficiency. Birds 2025, 6, 15. [Google Scholar] [CrossRef] [Scilit]
- De Resende, N.C.; Teixeira, C.P.; de Azevedo, C.S. Flight initiation distance in an urban bird: Influence of the number of people, gaze orientation, and bird behavior. Birds 2024, 5, 255–264. [Google Scholar] [CrossRef] [Scilit]
- Dybus, A.; Kulig, H.; Yu, Y.-H.; Lanckriet, R.; Proskura, W.; Cheng, Y.-H. CRY1 gene polymorphism and racing performance of homing pigeons. Animals 2021, 11, 2632. [Google Scholar] [CrossRef] [Scilit] [PubMed]
- Çelik, R. Morphological characteristics of Şebap Pigeons (Columba livia domestica). J. Istanb. Vet. Sci. 2023, 7, 27–33. [Google Scholar] [CrossRef] [Scilit]
- Erdem, E.; Özbaşer, F.T.; Gürcan, E.K.; Soysal, M.I. The morphological and morphometric characteristics of Alabadem pigeons. Turk. J. Vet. Anim. Sci. 2021, 45, 372–379. [Google Scholar] [CrossRef] [Scilit]
- Şentürk, N.; Taşkın, S.D.; Çobanoğlu, Ö.; Ardıclı, S. Individual Identification and Assessment of Genetic Diversity Using Microsatellite Markers in Racing Pigeons Raised in Turkiye. J. Res. Vet. Med. 2024, 43, 76–84. [Google Scholar] [CrossRef] [Scilit]
- Çobanoğlu, Ö.; Şentürk, N.; Ardıclı, S. Efficiency of DNA Extractions Methods from Pigeons and Cockatiels Feathers. Black Sea J. Agric. 2023, 6, 636–642. [Google Scholar] [CrossRef] [Scilit]

Disclaimer/Publisher’s Note: The statements, opinions and data contained in all publications are solely those of the individual author(s) and contributor(s) and not of MDPI and/or the editor(s). MDPI and/or the editor(s) disclaim responsibility for any injury to people or property resulting from any ideas, methods, instructions or products referred to in the content. |
© 2026 by the authors. Licensee MDPI, Basel, Switzerland. This article is an open access article distributed under the terms and conditions of the Creative Commons Attribution (CC BY) license.