


Highlights
What are the main findings?
- Tourism intensity was associated with different pressure profiles across the three islands. Mykonos recorded the highest resource and tourism-demand scores and the most extensive built-up and coastal development, while Patmos and Spetses showed greater wastewater-system limitations.
- The Mykonos results are consistent with partial, pressure-specific infrastructure buffering, although the available evidence does not establish a causal effect. Evidence gaps also affected the confidence of the assessment.
What are the implications of the main findings?
- Destination assessment should consider tourism pressure together with infrastructure performance, environmental conditions, spatial development, and evidence availability.
- The framework can identify different management and monitoring priorities, but further technical, spatial, or stakeholder assessment is needed before specific planning decisions are taken.
Abstract
Overtourism is often assessed through visitor intensity, although its effects also depend on infrastructure performance, resource demand, spatial development, and evidence availability. This study develops a comparative diagnostic framework and applies it to Mykonos, Patmos, and Spetses, representing three contrasting Greek island tourism models. Ten indicators were classified according to their analytical role. Seven indicators were scored within three dimensions—resource pressure, infrastructure system, and tourism demand—while coastal water quality was treated as environmental-state evidence and built-up and coastal development as descriptive spatial evidence. Evidence confidence was assessed separately. Sensitivity analysis included leave-one-indicator-out tests, omission of indicators based on shared tourism data, threshold variation, and alternative standardization. Mykonos recorded the highest resource-pressure (4.00) and tourism-demand (3.50) scores, together with extensive built-up and coastal development, but its centralized wastewater treatment system operated within reported compliance limits. Patmos recorded lower tourism pressure but documented wastewater treatment underperformance, while Spetses lacked centralized wastewater treatment and had important monitoring gaps. The Mykonos results are consistent with pressure-specific infrastructure buffering, although the available data do not support causal attribution. The framework provides a comparative diagnosis without producing a single overtourism score and helps identify areas where further monitoring and assessment are needed.
1. Introduction
Coastal tourism is a major economic activity across the Mediterranean, where visitor flows are strongly concentrated in coastal destinations and depend on environmental quality and natural-resource availability (Drius et al., 2019; Mejjad et al., 2022). This spatial and seasonal concentration intensifies demand for land, freshwater, and infrastructure in already-constrained coastal zones. Tourism-driven coastal urbanization accelerates land conversion and increases pressure at the land–sea interface, while seasonal water demand, waste generation, and pollution may degrade habitats and ecosystem services (Gössling et al., 2012; Lagarias & Stratigea, 2023; Drius et al., 2019). These pressures reflect a structural tension between tourism growth and the ecological capacity of the coastal systems on which destination attractiveness and long-term economic viability depend (Drius et al., 2019; Mejjad et al., 2022).
Overtourism can be understood as a destination-specific sustainability imbalance in which the scale and spatial and temporal concentration of tourism place ecological, social, and infrastructural systems under pressure, affecting residents, visitors, and destination functioning (Koens et al., 2018; Mihalic, 2020). It cannot be diagnosed from visitor numbers alone, because its effects also depend on seasonality, infrastructure capacity, environmental sensitivity, spatial development, and governance responses (Mihalic, 2020; Leka et al., 2022). Although the literature has expanded rapidly, it remains concentrated around a limited set of themes, while fixed thresholds and highly aggregated indices may obscure the context-dependent interactions among tourism demand, infrastructure, land use, and environmental conditions (Chaney & Séraphin, 2023; Mihalic, 2020). Social effects, including housing pressure, resident perceptions, quality of life, and tourism acceptance, are also central to overtourism debates (Goodwin, 2017; Milano et al., 2019; Dodds & Butler, 2019).
Coastal ecosystems underpin island tourism by providing water purification, shoreline protection, habitat support, landscape quality, and recreational opportunities. These services sustain both human well-being and destination attractiveness but may be weakened by resource overuse, pollution, land conversion, and cumulative coastal development (Barbier et al., 2011; Drius et al., 2019; Pournara & Sakellariadou, 2022). When combined with climate-related stressors, such pressures may reduce ecosystem resilience and the long-term capacity of coastal systems to support tourism and local communities (Cramer et al., 2018; Gissi et al., 2021). Despite extensive research on overtourism, tourism carrying capacity, and sustainable destination management, three issues remain insufficiently integrated in comparative assessments of island destinations. First, tourism intensity does not translate uniformly into environmental degradation, because infrastructure capacity and performance may buffer some operational pressures. Second, effective infrastructure does not eliminate cumulative pressures associated with resource demand, land conversion, and coastal transformation. Third, fragmented data and uneven monitoring may create diagnostic blind spots, limiting both the identification of appropriate interventions and the evaluation of their effectiveness (EC, 2016; Ivars-Baidal et al., 2023; Leka et al., 2022).
These issues are particularly relevant in Greece, where tourism has major economic and spatial significance and island destinations operate within a common national institutional setting but differ substantially in tourism models, accessibility, development intensity, environmental sensitivity, and infrastructure provision. They are also timely in the context of the proposed new Special Spatial Framework for Tourism, which was presented in 2026 as a national planning instrument intended to promote more balanced and environmentally sustainable tourism development, with particular attention to islands and destinations under high tourism pressure (HMEE, 2026). The effectiveness of such planning, however, depends on sufficiently detailed destination-level evidence to distinguish tourism intensification from infrastructure underperformance, structural service deficits, and cumulative coastal pressure.
Against this background, the study adopts a maximum-variation comparative design involving three contrasting forms of Greek island tourism. Mykonos represents an internationally oriented, high-intensity leisure and luxury destination; Patmos represents a cultural and religious heritage destination characterized by environmental sensitivity; and Spetses represents a mature, proximity-based destination dominated by short-break and seasonal tourism. Rather than producing a single overtourism ranking, this study examines how tourism demand is translated into coastal-system sustainability pressure under different infrastructure-buffering and monitoring conditions. It further distinguishes operational pressures that may be partly mitigated through infrastructure from resource pressures and spatial development concerns that remain even where wastewater infrastructure performs adequately.
RQ1. How does the translation of tourism intensity into coastal-system sustainability pressure vary across three contrasting island tourism models?
RQ2. What patterns are consistent with pressure-specific infrastructure buffering, and which resource pressures and spatial development concerns remain unresolved?
RQ3. How do differences in data availability and monitoring capacity affect diagnostic confidence and the identification of priorities for further assessment and management?
2. Materials and Methods
2.1. Conceptual Framework for Destination-Level Diagnosis of Overtourism-Related Coastal Sustainability Pressure
This study conceptualizes overtourism as a destination-specific sustainability imbalance within island coastal socio-ecological systems. Tourism intensity constitutes an important source of pressure, but its environmental consequences depend on how visitor demand interacts with infrastructure capacity, resource availability, spatial development patterns, environmental sensitivity, and destination-management conditions (Koens et al., 2018; Mihalic, 2020). The framework, therefore, does not treat visitor numbers as a sufficient diagnostic measure and does not assume that equivalent tourism volumes produce equivalent outcomes across destinations. This interpretation is particularly relevant to islands, where limited land availability, freshwater constraints, ecological sensitivity, and pronounced seasonal fluctuations can intensify the relationship between tourism demand and system capacity (Leka et al., 2022; Drius et al., 2019). Tourism generates operational pressures through water consumption, waste and wastewater production, passenger flows, and accommodation use. It also generates cumulative pressures through land conversion, built-up expansion, and long-term coastal transformation (Mejjad et al., 2022; Lagarias & Stratigea, 2023).
A central proposition of the framework is that environmental infrastructure may buffer some operational pressures without eliminating the broader sustainability consequences of tourism intensification. Effective wastewater collection and treatment, for example, may reduce the immediate transfer of microbiological and organic loads to coastal waters. It cannot, however, compensate for high water demand, increasing waste generation, extensive built-up development, or the irreversible transformation of coastal land. Infrastructure buffering is, therefore, treated as pressure-specific and partial rather than as evidence of overall destination sustainability. The framework distinguishes between a scored diagnostic core and complementary evidence used to support interpretation. The scored component comprises three dimensions: resource pressure, infrastructure system, and tourism demand. Resource pressure captures tourism-related water demand and municipal solid-waste generation. The infrastructure-system dimension combines accommodation-use and transport pressure with wastewater-system capacity. The tourism-demand dimension captures the scale and seasonal concentration of tourism activity.
Coastal water quality is treated separately as an observed environmental-state indicator rather than as a direct measure of tourism pressure. This distinction is important because water quality conditions may reflect the combined influence of tourism pressure, infrastructure performance, environmental processes, and other local factors. Keeping coastal water quality outside the pressure score also avoids using the same environmental condition both to define pressure and to interpret patterns that may be consistent with infrastructure buffering.
Built-up intensity and coastal development intensity are also retained in the framework but as descriptive spatial evidence rather than scored indicators. The available spatial information allows comparison of development patterns across the three islands, but it does not provide a standardized quantitative measure on a common spatial basis. The spatial indicators are, therefore, used to support the interpretation of destination profiles and are not included in dimension-level aggregation.
Evidence confidence is assessed separately from the diagnostic scores. It reflects the availability, recency, completeness, and consistency of the evidence supporting each indicator and is used to identify where interpretation should remain cautious or where additional monitoring is needed. The scored dimensions, environmental-state evidence, spatial evidence, and evidence confidence assessment are considered together when interpreting each destination. No overall overtourism score is calculated.
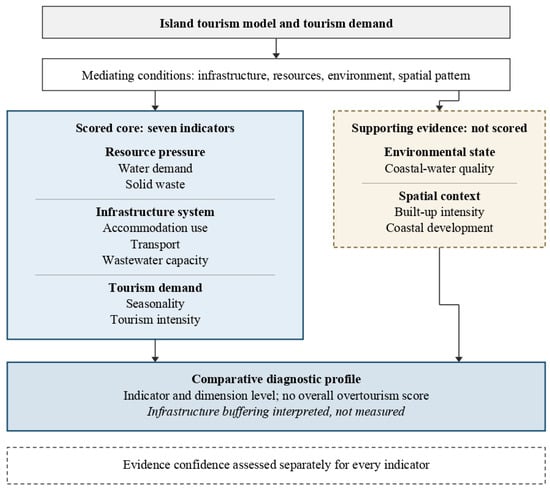
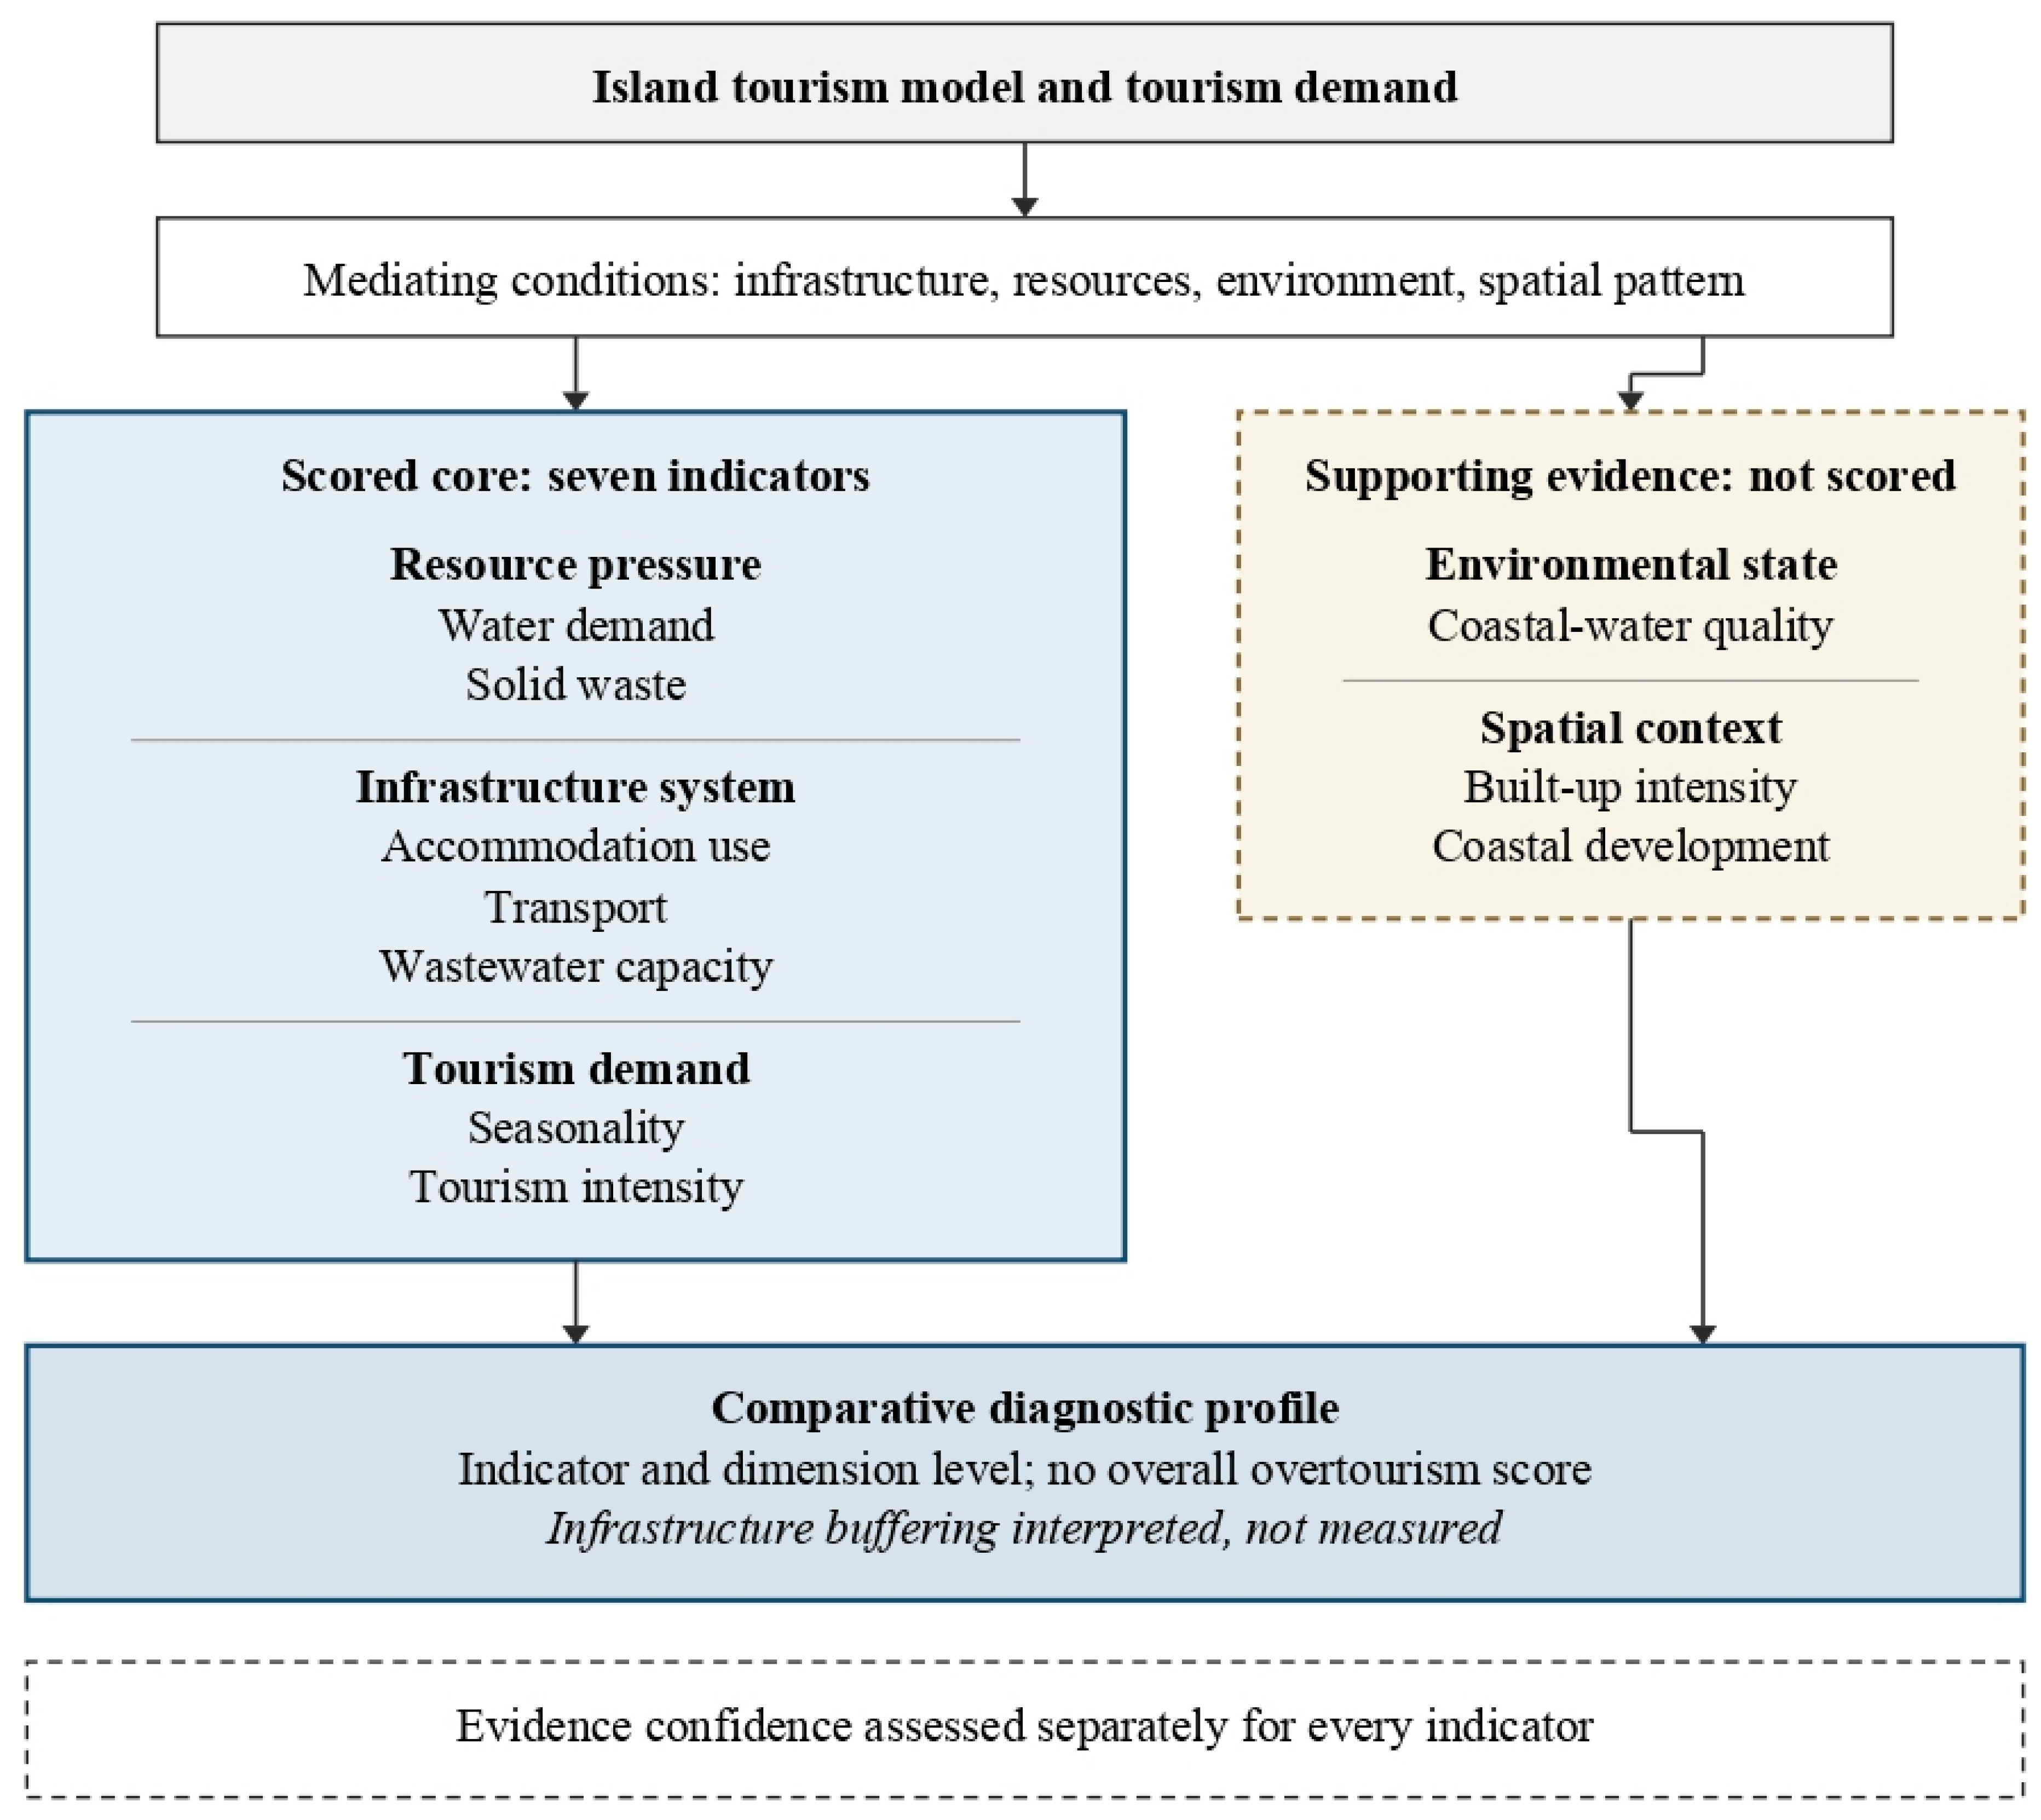
Ecosystem services are not included as an additional scoring dimension because the indicators assess tourism-related pressures, infrastructure-system conditions, environmental state, and spatial development patterns rather than ecosystem-service supply directly. Instead, ecosystem services provide an interpretative lens linking the diagnostic findings to potentially affected provisioning, regulating, habitat-supporting, and cultural benefits (MEA, 2005; Drius et al., 2019; Pournara et al., 2023). The analytical output is, therefore, not a ranking of destinations but a comparative diagnosis that combines the scored diagnostic profile with environmental-state and spatial evidence under different infrastructure and monitoring conditions. Figure 1 summarizes the conceptual structure and analytical flow of the framework.
Figure 1.
Conceptual framework for the destination-level diagnosis of overtourism-related coastal sustainability pressure, showing tourism demand, destination-specific mediating conditions, the scored diagnostic core, supporting evidence, and evidence confidence.
2.2. Indicator Selection and Analytical Classification
Following the conceptual structure described in Section 2.1, candidate indicators were identified through a targeted review of the literature on overtourism, tourism carrying capacity, island infrastructure, coastal environmental pressure, and sustainable destination assessment. They were screened according to four criteria: conceptual relevance to the framework, availability of evidence for all three case studies, cross-case comparability, and potential reproducibility in other data-constrained island destinations. This process resulted in ten indicators, which were subsequently classified according to their analytical role and the type of evidence available.
Seven indicators form the scored diagnostic component of the framework and are organized into three dimensions: resource pressure, infrastructure system, and tourism demand. Coastal water quality is retained separately as observed environmental-state evidence, while built-up intensity and coastal development intensity are retained as descriptive spatial evidence. These three indicators are not included in dimension-level scoring. This distinction ensures that numerical aggregation is limited to indicators for which the available evidence supports a consistent comparative assessment, while environmental-state and spatial information remains available for interpretation of the destination profiles. Table 1 summarizes the indicators, their analytical role, assessment basis, and the supporting literature.
Table 1.
Indicators, analytical use, assessment basis, and supporting literature.
The conceptual framework guided both indicator selection and the treatment of the available evidence. Data were collected from official statistical sources, administrative and infrastructure records, environmental monitoring datasets, and spatial information for the three destinations. Indicators were classified according to whether they represented tourism-related resource or system pressure, infrastructure conditions, environmental state, or spatial context. Comparable numerical data were processed into the six quantitative indicators reported in Table 1, while wastewater-system capacity was assessed from documented infrastructure and operational conditions. Coastal water quality and the two spatial indicators were retained as supporting evidence because the available data did not support equivalent quantitative treatment across the three cases. The resulting evidence was then assessed, standardized where appropriate, aggregated within the three scored dimensions, and examined together with evidence confidence and the sensitivity analyses described below.
After indicator selection, the analysis proceeded in four stages. Evidence was collected for each island and indicator and checked for comparability. The seven scored indicators were standardized and aggregated within the three dimensions, while coastal water quality and the two spatial indicators were retained as non-scored evidence. Evidence confidence was assessed separately for each island–indicator pair. The resulting profiles were then compared across cases and tested through the sensitivity analyses described in Section 2.7.
Several indicators draw on the same underlying tourism statistics but capture different aspects of tourism pressure. Estimated water demand is derived from overnight stays, whereas accommodation-use pressure relates overnight stays to the permanent population. Similarly, transport pressure is based on total passenger arrivals, while tourism intensity relates arrivals to the resident population. Although these indicators represent different aspects of destination pressure, they are not fully independent because they share the same underlying data. They were retained because absolute load and pressure relative to destination size provide different information. To assess whether this dependence affects the results, the related indicators were omitted in turn in an additional robustness analysis (Section 2.7). Municipal solid-waste pressure represents the total annual load managed by each destination, as comparable tourism-specific waste data were not available. Passenger arrivals likewise represent recorded passenger movements rather than unique visitors. These indicators are, therefore, used as comparative measures rather than direct estimates of tourism-generated waste or visitor numbers.
The cut-off date for evidence searches and infrastructure-status information was 31 May 2026. Indicator reference years vary according to the most recent comparable evidence available for all three destinations and are reported explicitly in a separate table later in the manuscript. Differences in reference years are considered when interpreting cross-indicator patterns and limit causal or strictly contemporaneous comparisons.
2.3. Evidence and Monitoring Assessment
The evidence supporting each island–indicator assessment was evaluated separately according to four attributes: source authority, spatial specificity, temporal alignment, and continuity or coverage. Evidence confidence was classified as high, moderate, or limited. High confidence was assigned where recent, destination-specific, and directly relevant official measurements or administrative records were available. Moderate confidence was assigned where the evidence was official but temporally incomplete, spatially restricted, dependent on a modeling coefficient, or based on a limited number of observations. Limited confidence was assigned where the assessment relied primarily on indirect proxies, single-assessor qualitative spatial classification without quantitative measurement, fragmented documentation, or evidence that did not permit reliable attribution of the observed condition to a specific pressure source.
Evidence confidence was kept analytically separate from the scored assessment and from the interpretation of non-scored environmental-state and spatial indicators. A limited evidence base did not automatically imply either low or high pressure; it indicated that the magnitude, source, or persistence of the pressure could not be established with the same degree of confidence. This distinction was used to identify diagnostic blind spots and the additional monitoring required before major infrastructure, tourism development, or spatial-planning decisions are taken. At the destination level, the analysis also identified the principal monitoring limitations affecting the interpretation of each pressure profile. These included insufficient peak-season coverage, limited continuity of coastal water monitoring, incomplete traceability of decentralized wastewater systems, inconsistent reference years, and the absence of standardized high-resolution spatial measurements. A distinction was made between monitoring as a characteristic of the management system and evidence availability as a characteristic of the assessment. The operational rules used to distinguish documented management-system limitations from limitations in the evidence available for assessment are summarized in Table 2.
Table 2.
Operational treatment of management-system conditions and evidence limitations.
Documented absence of operational monitoring, inspection, or traceability was treated as a weakness in system oversight. By contrast, incomplete information on whether such monitoring was performed reduced evidence confidence. This distinction prevents missing information from being interpreted as evidence of either adequate or inadequate system performance.
2.4. Comparative Case-Study Design and Study Areas
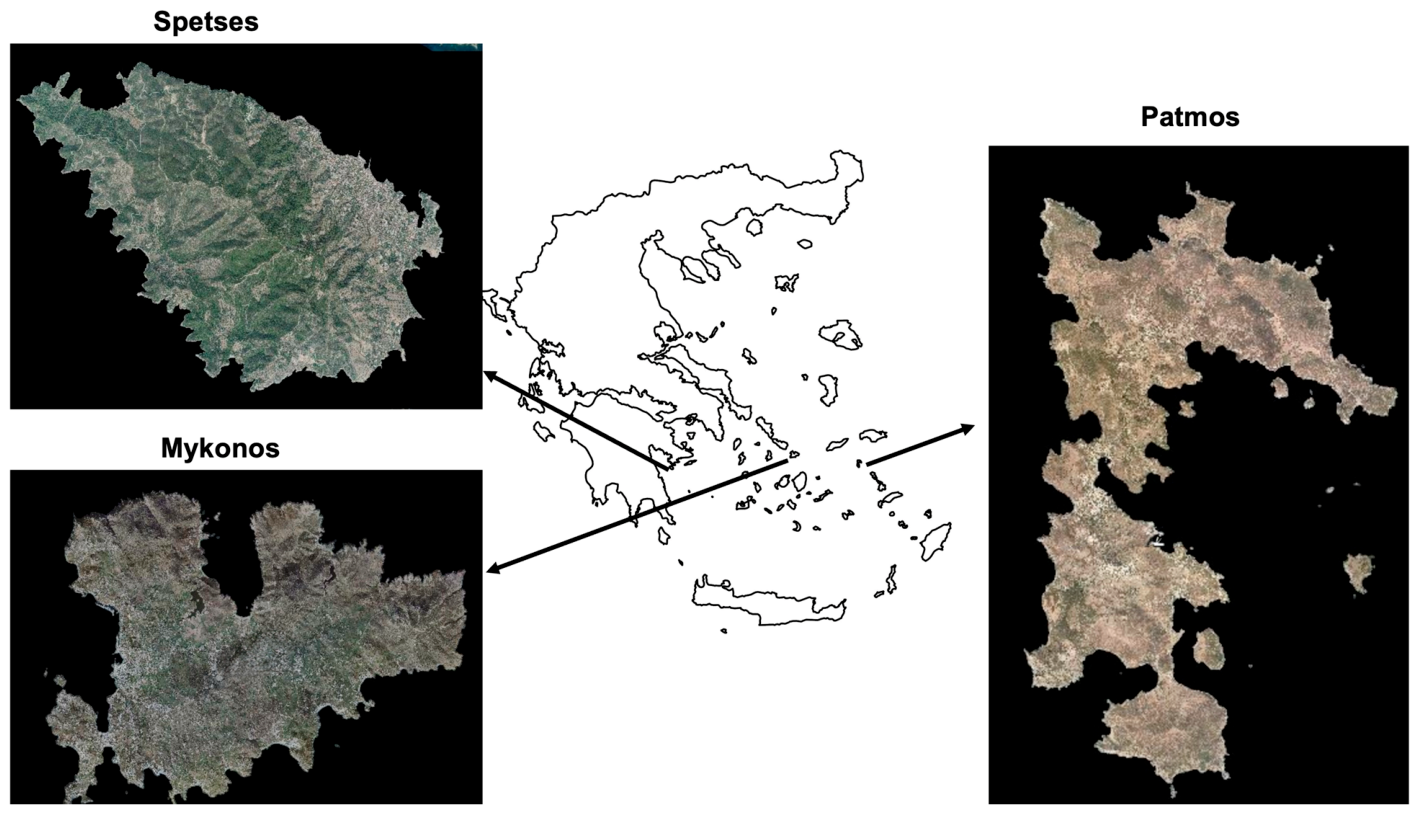
A maximum-variation comparative case-study design was adopted to examine how different island tourism models are associated with different patterns of tourism pressure and infrastructure conditions. Mykonos, Patmos, and Spetses were selected because they differ substantially in tourism intensity, market orientation, accessibility, development history, environmental sensitivity, and infrastructure provision. Mykonos represents a high-intensity international leisure and luxury destination; Patmos a cultural and religious heritage destination with significant environmental sensitivity; and Spetses a mature destination characterized mainly by short-break, weekend, and seasonal tourism linked to the Athens metropolitan area. The three cases were selected to provide contrasting conditions for comparative analysis rather than to support statistical generalization or represent the full range of Greek island destinations. Their geographical location is shown in Figure 2.
Figure 2.
Location of Mykonos, Patmos, and Spetses within Greece. Map produced by the author using the Hellenic Cadastre basemap (HC, 2026).
2.4.1. Mykonos
Mykonos is located in the central Aegean Sea and covers approximately 105 km2, with a permanent population of 10,704 residents (HSA, 2023; Monokrousou et al., 2025). It is an internationally oriented, high-intensity tourism destination and recorded approximately 1.91 million overnight stays in 2024, the value used in the present indicator calculations (HSA, 2024). Tourism development has contributed to extensive built-up expansion and increasing pressure on water resources (Cillis et al., 2025; Ntalakos et al., 2025). Water supply relies on desalination and reservoir storage, including the Marathias and Ano Mera dams (SSW, 2015). The island also operates a sanitary landfill and a centralized wastewater treatment plant with a nominal capacity of approximately 48,000 population equivalent; official records indicated operation within reported environmental limits in 2025 (RAWEW, 2026; RSA, 2025; SSW, 2026). Mykonos also includes protected coastal and marine ecosystems within the Natura 2000 network (EEA, 2026). Mykonos combines exceptionally high tourism demand with comparatively strong wastewater infrastructure and extensive built-up and coastal development.
2.4.2. Patmos
Patmos is located in the southeastern Aegean Sea and has a permanent population of 3283 residents and an area of approximately 34 km2 (HSA, 2023; Boehm et al., 2023). It is internationally recognized for its religious and cultural significance and hosts the UNESCO World Heritage Site “The Historic Centre (Chorá) with the Monastery of Saint John the Theologian and the Cave of the Apocalypse” (UNESCO, 2026). The island is characterized by a rugged coastline, numerous bays, and extensive semi-natural areas (MoP, 2026). Although tourism intensity is substantially lower than in Mykonos, Patmos faces important environmental-service constraints. Municipal waste is compacted and transported to facilities on other islands, while regional waste-planning documents record the historical operation of an uncontrolled disposal site and continuing limitations in final disposal and recycling infrastructure (FODSA, 2022; RSA, 2023). The centralized wastewater treatment plant, with a nominal capacity of approximately 6000 population equivalent, operated outside reported environmental compliance limits in 2025 (SSW, 2026). Water supply depends mainly on the Livadi reservoir and supplementary external transfers. The island also includes protected marine ecosystems under the Natura 2000 network (EEA, 2026). In Patmos, moderate tourism demand coexists with documented problems in wastewater treatment performance.
2.4.3. Spetses
Spetses is located in the Argosaronic Gulf, close to Athens and the Peloponnese mainland. The island has a permanent population of 3748 residents and covers approximately 22.5 km2 (HSA, 2023; Chasiotis et al., 2026). Its proximity to the Athens metropolitan area and frequent maritime connections support a mature tourism model characterized by weekend, short-stay, and seasonal travel. Spetses also has a long-established residential pattern and a strong cultural and maritime identity associated with the Greek War of Independence (MoS, 2026). The island does not operate a centralized wastewater collection and treatment system; wastewater management depends mainly on septic or holding tanks and tanker transport (MoS, 2020). Municipal solid waste is transferred to mainland facilities, while water supply also depends partly on external sources. Spetses is characterized by mature, proximity-based tourism, the absence of centralized wastewater treatment, and limited monitoring and traceability of decentralized wastewater flows.
The environmental sensitivity of the selected islands is additionally reflected in the presence of protected coastal and marine ecosystems, particularly in Mykonos and Patmos, where Natura 2000 protected areas coexist with increasing tourism and coastal development pressures. Table 3 summarizes the main protected ecosystem characteristics and the dominant environmental pressures identified in each case study.
Table 3.
Natura 2000 protection status, ecological features, and dominant coastal pressures in the three case studies.
2.5. Scoring and Standardization
The seven indicators included in the scored component were converted into a common four-level scale ranging from 1 (low) to 4 (very high). Standardization was required because the indicators differ in their units and ranges (OECD et al., 2008). The scale was used to support comparison across the three destinations while retaining the individual indicator results. Coastal water quality and the two spatial indicators were not scored, as described in Section 2.2. The scores represent relative positions within the three-case comparison and should not be interpreted as universal thresholds of overtourism or sustainability. This is particularly important given the small number of cases and the context-specific nature of overtourism (Peeters et al., 2018). Two scoring approaches were used: median-referenced scoring for the six quantitative indicators and evidence-based categorical scoring for wastewater-system capacity.
2.5.1. Scoring of Quantitative Indicators
For the six indicators represented by comparable numerical values, a median-referenced scoring procedure was applied. The procedure was selected because universally accepted numerical thresholds for overtourism have not been established, while the limited number of case studies makes conventional min–max standardization particularly sensitive to extreme values (Peeters et al., 2018). For each quantitative indicator j, the value recorded for island i, Xij, was divided by the median value Mj calculated across the three case studies:
Rij = Xij/Mj
The resulting ratio was converted into the four-level pressure scale using the thresholds presented in Table 4. The 25% interval around the median was used to prevent minor numerical differences from producing different pressure scores, while a score of 4 was reserved for values exceeding twice the cross-case median. These thresholds are study-specific and must be recalculated when the framework is applied to a different destination sample. With only three cases, the median necessarily corresponds to one observed value for each indicator. The resulting scores should, therefore, be interpreted as relative positions within this comparison rather than as empirically established sustainability thresholds. Because the median corresponds to one of the three observed values, one destination necessarily receives a score of 2 for each quantitative indicator. As a result, 6 of the 18 quantitative island–indicator scores are fixed at 2 by construction. Two ratios were also close to the 0.75 threshold: transport pressure in Patmos (0.737) and seasonality pressure in Spetses (0.738). The procedure was applied to estimated tourism-related water demand, municipal solid-waste pressure, accommodation-use pressure, transport pressure, seasonality pressure, and tourism intensity relative to residents. Estimated tourism-related water demand was calculated using a coefficient of 0.4 m3 per tourist-night. This value was selected as a conservative estimate within the broader range of approximately 0.3–2.0 m3 per tourist per day reported for European tourism. The resulting values represent comparative demand proxies rather than measured destination-level water consumption (EEA, 2025). Arrival- and overnight-based intensity measures are widely used in overtourism assessment, while peak-to-low-period ratios are established measures of tourism seasonality (Peeters et al., 2018; Ruggieri & Platania, 2024).
Table 4.
Conversion of median-referenced ratios into pressure scores.
2.5.2. Wastewater-System Capacity
Wastewater-system capacity was assessed separately because comparable continuous data were not available across the three islands. The assessment considered infrastructure coverage, operational performance, environmental compliance, capacity under seasonal demand, and documented monitoring and maintenance. Centralized and decentralized systems were assessed according to their documented performance and level of environmental protection, rather than on system type alone. This is consistent with European legislation, which allows individual or other appropriate systems where they provide an equivalent level of environmental and human health protection (EPC, 2024).
A score of 1 indicates an adequate and compliant system, while higher scores indicate increasing limitations in capacity, performance, or management, with 4 representing the most constrained condition. The scoring criteria are provided in Table S1. Where information on system performance or monitoring was incomplete, this was reflected in evidence confidence rather than automatically resulting in a higher score (Section 2.3). For Spetses, the wastewater-system score was based on the documented absence of centralized wastewater collection and treatment and the island’s dependence on decentralized storage and tanker transport. Incomplete information on the operation and traceability of these decentralized flows affected evidence confidence but did not independently increase the wastewater-system score.
2.6. Aggregation and Comparative Analysis
Indicator scores were averaged within each of the three scored dimensions to obtain a dimension-level score for each destination:
where Did is the mean score for destination i in dimension d, Sijd is the score of indicator j, and nd is the number of scored indicators in that dimension. Indicators were equally weighted within each dimension. No weighting was applied across dimensions, and no overall composite overtourism score was calculated. Because the dimension scores are arithmetic means of ordinal indicator scores, they are used as descriptive summaries rather than as metric measures of sustainability pressure. In particular, the infrastructure-system mean is a mixed load–capacity diagnostic summary and should not be interpreted as an independent measure of infrastructure adequacy or buffering. Infrastructure buffering is interpreted from the indicator-level wastewater-system and environmental-state evidence in relation to tourism demand.
Did = (1/nd) × Σ Sijd
Dimension-level scores were used to summarize the comparative profiles of the three destinations, while indicator-level results were retained to show the pressures and system conditions underlying each score. Coastal water condition and spatial development indicators were considered separately and did not contribute to dimension-level aggregation.
2.7. Sensitivity and Robustness Procedures
Four robustness checks were used. First, the scoring thresholds were varied to examine whether small changes in the classification boundaries affected the results. Second, each scored indicator was removed in turn, and the corresponding dimension mean was recalculated. Third, indicators based on the same underlying tourism statistics were omitted in turn. Water demand and accommodation-use pressure both depend on overnight stays, while transport pressure and tourism intensity both depend on passenger arrivals. This was used to assess whether these shared data sources affected the comparative results. Finally, the quantitative indicators were standardized using min–max and rank-based methods and the resulting dimension profiles were compared with the baseline results. The full results are reported in Table S3. These procedures assess specification sensitivity and reproducibility rather than statistical validation of the scoring framework.
3. Results
3.1. Indicator-Level Assessment
The indicator-level assessment revealed clear differences among the three destinations in resource pressure, infrastructure conditions, tourism demand, environmental state, and spatial development. Table 5 presents the original indicator values or documented conditions, the corresponding scores for the seven scored indicators, and the principal data sources. Coastal water quality and the two spatial indicators are reported without scores. Evidence confidence classifications and their justification are provided separately in Table S2.
Table 5.
Indicator-level results and data sources for the three case-study destinations.
Mykonos recorded the highest scores for water demand, municipal waste, accommodation use, transport, seasonality, and tourism intensity. It also showed the most extensive built-up and coastal development among the three islands. At the same time, its centralized wastewater treatment system was reported to operate within compliance limits, while the available coastal water data showed low microbiological concentrations. Patmos recorded lower scores for most indicators but showed documented underperformance of its wastewater treatment system. Spetses also had lower tourism-demand scores but lacked centralized wastewater collection and treatment, while the available coastal water data showed higher microbiological concentrations.
3.2. Dimension-Level Results
The seven scored indicators were aggregated within the three dimensions using equal-weighted arithmetic means. Coastal water quality and the two spatial indicators were not included in the calculation. The resulting dimension-level scores are presented in Table 6.
Table 6.
Dimension-level scores for the three island destinations.
Mykonos recorded the highest score in all three dimensions, with resource pressure reaching 4.00 and tourism demand 3.50. Patmos and Spetses both recorded a resource-pressure score of 1.50, while their tourism-demand scores were 2.00 and 1.50, respectively. The infrastructure-system score was higher in Spetses (2.33) than in Patmos (2.00), mainly because of the absence of centralized wastewater collection and treatment. In Patmos, the dimension mean also masks the higher wastewater-system score associated with the documented operational problems of the existing treatment system. For this reason, the dimension means are interpreted together with the individual indicator results in Table 5.
3.3. Cross-Case Comparison: Patterns Consistent with Infrastructure Buffering
The cross-case comparison showed three different combinations of tourism demand, infrastructure conditions, environmental state, spatial development, and evidence availability. Mykonos combined the highest tourism intensity with compliant centralized wastewater treatment. Patmos had lower tourism intensity but documented underperformance of its centralized wastewater treatment system. Spetses combined lower tourism intensity with the absence of centralized wastewater collection and treatment and more limited evidence on decentralized systems.
3.3.1. Mykonos: High Tourism Intensity and Compliant Wastewater Treatment
Mykonos recorded the highest scores for water demand, municipal waste, accommodation use, transport, seasonality, and tourism intensity. It also showed the most extensive built-up and coastal development. At the same time, the centralized wastewater treatment system was reported to operate within compliance limits, while the available coastal water data showed low microbiological concentrations. This pattern suggests that wastewater infrastructure may help limit some pollution pressures despite high tourism intensity. However, because the infrastructure and water quality data refer to different years, the analysis cannot establish a causal buffering effect.
3.3.2. Patmos: Moderate Tourism and Wastewater Treatment Underperformance
Patmos recorded lower scores than Mykonos for most tourism-related indicators and comparatively limited built-up and coastal development. However, its centralized wastewater treatment system was reported to operate outside environmental compliance limits. This shows that the presence of centralized infrastructure does not necessarily ensure adequate performance. The available evidence does not establish the duration, causes, peak-season severity, or receiving-water effects of the reported non-compliance.
3.3.3. Spetses: Lower Tourism Demand and Wastewater System Deficit
Spetses recorded lower tourism-demand scores than Mykonos but had no centralized wastewater collection or treatment system and relied on septic or holding tanks and tanker transport. The available coastal water data showed higher microbiological concentrations than in Mykonos and Patmos. However, the available evidence does not identify the source of these concentrations. Information on the operation and traceability of decentralized wastewater systems was also incomplete, limiting further assessment of wastewater management on the island.
3.4. Sensitivity and Robustness Results
A leave-one-indicator-out analysis was used to examine the sensitivity of the dimension-level results to individual indicators. Each scored indicator was removed in turn, and the corresponding dimension mean was recalculated. Table 7 reports the baseline scores and the resulting ranges.
Table 7.
Baseline dimension scores and leave-one-indicator-out sensitivity ranges.
Mykonos remained stable in resource pressure because both indicators received a score of 4. Its infrastructure-system score ranged from 2.50 to 4.00, while the tourism-demand score ranged from 3.00 to 4.00. Patmos and Spetses showed greater variation in resource pressure because this dimension contains only two indicators. Spetses showed the widest range in the infrastructure-system dimension, from 1.50 to 3.00. Removing the wastewater-system indicator reduced its infrastructure-system mean from 2.33 to 1.50. A separate check was made for indicators derived from the same underlying tourism statistics. Excluding water demand changed the resource-pressure scores to 4.00, 1.00, and 2.00 for Mykonos, Patmos, and Spetses, respectively. Excluding accommodation use changed the infrastructure-system scores to 2.50, 2.00, and 3.00. Excluding transport pressure produced identical infrastructure-system scores of 2.50 for all three islands. Excluding tourism intensity resulted in tourism-demand scores of 3.00, 2.00, and 1.00. These results show that some dimension-level differences are sensitive to indicator selection, particularly within the infrastructure-system dimension.
The threshold sensitivity and alternative standardization analyses were also repeated using the revised three-dimension structure (Table S3). Mykonos remained the highest-scoring destination in all three dimensions under the tested specifications, while differences between Patmos and Spetses were less stable.
3.5. Evidence Gaps and Monitoring Needs
The comparison also showed differences in evidence availability and monitoring coverage. Mykonos had relatively strong official data on tourism activity and wastewater treatment performance, but limited information was available on peak-season infrastructure loads, long-term ecosystem condition, and land-use change. In Patmos, wastewater non-compliance was documented, but its duration, causes, seasonal variation, and effects on receiving waters were not sufficiently established. Spetses had the largest evidence gaps, particularly regarding the operation, emptying, transport, and final treatment of decentralized wastewater systems and the continuity of coastal water monitoring. These gaps affect how confidently the observed conditions can be interpreted. Documented shortcomings in monitoring or traceability were treated as management-system weaknesses, whereas missing or incomplete information was treated as an evidence limitation. In the latter case, evidence confidence was reduced without automatically changing the indicator score. Table S2 reports the indicator-level evidence confidence classifications, while Table 8 summarizes the main gaps and priorities for further assessment.
Table 8.
Main evidence gaps and priorities for further assessment.
Overall, the three islands showed different pressure profiles despite operating within the same national context. The Mykonos results are consistent with pressure-specific infrastructure buffering, although the available evidence does not establish a causal effect. Differences in data availability and monitoring also affected the confidence of the assessment and the priorities identified for further investigation.
4. Discussion
4.1. Tourism Models and the Translation of Intensity into Coastal Pressure
The results show that tourism intensity alone does not explain differences in coastal-system pressure. Mykonos recorded the highest tourism-demand and resource-pressure scores and showed the most extensive built-up and coastal development. At the same time, its wastewater treatment system operated within reported compliance limits, and the available coastal water data showed low microbiological concentrations. Patmos and Spetses had lower tourism-demand scores but remained vulnerable because of wastewater-system underperformance or the absence of centralized treatment. This supports the view that overtourism is context-dependent and cannot be inferred from visitor numbers alone (Koens et al., 2018; Mihalic, 2020). The comparison also shows the importance of considering tourism demand together with infrastructure performance, resource use, spatial development, and evidence availability (Leka et al., 2022; Blázquez-Salom et al., 2023).
4.2. Infrastructure Buffering and Its Sustainability Limits
Infrastructure buffering is understood here as partial and pressure-specific. In Mykonos, very high tourism demand coincided with reported compliance of the centralized wastewater treatment system and low microbiological concentrations in the available coastal water data. Since these observations refer to different years, they do not demonstrate a causal relationship. They do, however, show that very high tourism intensity coexisted with reported compliant wastewater treatment and low microbiological concentrations in the available Mykonos evidence. This pattern is compatible with pressure-specific buffering but does not constitute an estimate or causal test of a buffering effect. This pressure-specific interpretation is also consistent with destination resilience approaches that focus on the capacity to maintain function under changing pressures (Hung & Tsou, 2026).
The comparison with Patmos and Spetses also shows why buffering cannot be inferred from the presence of infrastructure alone. Patmos has centralized wastewater infrastructure, but the system was reported to operate outside environmental compliance limits. In Spetses, wastewater management depends on decentralized systems and tanker transport, while information on their operation and traceability remains incomplete. The issue is, therefore, not whether a system is centralized or decentralized but whether it provides adequate environmental protection and can be monitored effectively. This is consistent with European wastewater legislation, which allows individual or other appropriate systems where they provide an equivalent level of environmental and human health protection (EPC, 2024). Even where wastewater infrastructure performs well, it cannot address other pressures associated with tourism growth, such as water demand, municipal waste, transport load, or continued built-up and coastal development. Infrastructure can, therefore, reduce specific operational pressures, but it should not be interpreted as evidence of overall destination sustainability.
4.3. Evidence Gaps and Destination Governance
Differences in evidence availability also affect destination governance. Reliable and regularly updated data are needed to identify pressures, assess infrastructure performance, and evaluate the effectiveness of management measures. Where evidence is incomplete, it becomes difficult to distinguish temporary operational problems from more persistent conditions and to assess their causes and extent. This is particularly relevant to overtourism, where management responses need to reflect local conditions rather than tourism intensity alone (Goodwin, 2017; Milano et al., 2019; Dodds & Butler, 2019). In the present framework, evidence confidence is reported separately from the indicator scores so that these limitations remain visible. Lower evidence confidence does not indicate higher pressure but points to areas where further monitoring or technical assessment is needed (EC, 2016; Ivars-Baidal et al., 2023).
4.4. Implications for Coastal Ecosystems and Ecosystem Services
The pressures identified in the three islands may also affect coastal ecosystems and the services they provide. Freshwater availability, clean coastal waters, habitat quality, shoreline protection, landscape values, and recreation are particularly important in island destinations. Increased water demand, waste generation, wastewater problems, and continued coastal development may place additional pressure on these services (Drius et al., 2019; Mejjad et al., 2022). Ecosystem services were not measured directly in this study and were not included in the scoring. Table 9, therefore, presents only the main links that may exist between the assessed pressures or conditions and the ecosystem services potentially affected. These links should be interpreted as indicative rather than as measured effects.
Table 9.
Practical interpretation of assessed pressures and conditions in relation to coastal ecosystem services.
Water demand is especially important on islands with limited freshwater resources, while wastewater performance and coastal water quality are closely related to the ecological and recreational condition of coastal waters (Grizzetti et al., 2019). Built-up and coastal development may also affect habitats, hydrological processes, landscape quality, and shoreline functions over longer periods (de Andrés et al., 2018; Balzan et al., 2018). In Mykonos, adequate wastewater performance does not remove the wider pressures associated with high resource use and extensive development. In Patmos and Spetses, wastewater-system limitations remain more prominent in the present assessment.
4.5. Management and Planning Priorities
The three cases point to different management priorities. In Mykonos, the main concern is the combination of high tourism demand, resource use, and extensive development. In Patmos, attention is needed to the performance of the existing wastewater treatment system. In Spetses, the main issue is wastewater management in the absence of a centralized system and the limited monitoring of decentralized arrangements. Table 10 summarizes the main priorities identified for each destination.
Table 10.
Management priorities indicated by the diagnostic profiles.
The priorities in Table 10 should be interpreted as areas for further assessment rather than as prescriptive planning measures. In Mykonos, more restrictive planning measures, where considered, would require detailed spatial analysis and stakeholder assessment. In Patmos and Spetses, infrastructure and tourism development decisions likewise require further technical assessment of wastewater-system performance and capacity. The findings are also relevant to the 2026 draft Special Spatial Framework for Tourism. Mykonos, Patmos, and Spetses are included in the same island group, although they differ considerably in tourism demand, infrastructure conditions, environmental pressures, and monitoring needs. The comparison, therefore, shows the value of destination-level evidence alongside broader national spatial classifications (HMEE, 2026).
4.6. Methodological Contribution, Transferability and Limitations
The framework separates tourism-related pressure, infrastructure conditions, environmental state, spatial context, and evidence confidence. Seven indicators are included in the three scored dimensions, while coastal water quality and spatial development are used as supporting evidence. This allows the three destinations to be compared without reducing the results to a single overtourism score. The framework is intended as a diagnostic tool and does not replace more detailed carrying-capacity, resilience, spatial, ecological, or stakeholder assessments (Leka et al., 2022; Hung & Tsou, 2026).
This study has several limitations. Only three islands were examined, and the results should not be generalized to Greek island destinations as a whole. The scores are relative to the three cases and do not represent universal sustainability or overtourism thresholds. Reference years also differ among indicators, which limits direct comparison and causal interpretation. Water demand is estimated rather than measured, and some indicators rely on the same underlying tourism statistics. The sensitivity analysis showed that this affects some dimension-level results. The spatial indicators were based on a qualitative assessment and were, therefore, retained as descriptive evidence rather than included in the scoring. Coastal water quality was also treated separately as an environmental-state indicator, since the available data do not identify the source of the observed conditions. More generally, this study cannot establish causal relationships between tourism activity, infrastructure performance, and environmental outcomes.
The framework also does not cover important social aspects of overtourism, including resident perceptions, housing affordability, tourism acceptance, and quality of life. These should be included in future applications where comparable data are available. Future research should also test the framework on a larger number of destinations and use more consistent time periods, quantitative spatial data, and repeated environmental and infrastructure monitoring.
4.7. Interpretation of Cross-Case Differences
The cross-case differences should be interpreted with some caution. Several findings come directly from the available evidence, including the much higher tourism intensity in Mykonos, the reported wastewater treatment non-compliance in Patmos, and the absence of centralized wastewater treatment in Spetses. Other differences, particularly the dimension-level scores, depend partly on the scoring procedure and indicator selection. The sensitivity analysis showed that Mykonos remained the highest-scoring destination across the tested specifications, whereas differences between Patmos and Spetses were less stable.
The findings are, therefore, diagnostic rather than causal. In Mykonos, high tourism intensity coexists with reported compliant wastewater treatment and low microbiological concentrations in the available coastal water data, a pattern consistent with pressure-specific infrastructure buffering. However, the different reference years and observational design do not allow a causal effect to be established. The framework is intended to identify contrasting pressure profiles, infrastructure conditions, and evidence gaps, rather than to provide universal rankings or causal estimates.
5. Conclusions
The comparison of Mykonos, Patmos, and Spetses shows that tourism intensity alone does not explain the sustainability pressures faced by island destinations. Mykonos recorded the highest resource-pressure and tourism-demand scores and the most extensive built-up and coastal development but also had a centralized wastewater treatment system operating within reported compliance limits. Patmos had lower tourism pressure but documented problems in wastewater treatment performance, while Spetses lacked centralized wastewater collection and treatment and had important gaps in the monitoring of decentralized systems. The results also show that infrastructure performance matters, but its role is pressure-specific. In Mykonos, the available evidence is consistent with some buffering of wastewater-related pressure, although the different reference years do not allow a causal relationship to be established. At the same time, high water demand, waste generation, transport load, and extensive development remain relevant concerns. The comparison, therefore, supports the use of infrastructure buffering as a limited diagnostic concept rather than as an indication of overall destination sustainability.
The proposed framework separates scored pressures and infrastructure conditions from environmental-state and spatial evidence, while evidence confidence is assessed independently. This allows the main pressures and the main evidence gaps to be identified without producing a single overtourism score. The framework is intended as a first-stage diagnostic tool that can support further monitoring and assessment rather than determine specific planning decisions. Application to a larger number of destinations, with more consistent environmental, spatial, and social data, would help test its wider applicability.
Supplementary Materials
The following supporting information can be downloaded at: https://www.mdpi.com/article/10.3390/tourhosp7090285/s1, Table S1: Evaluation criteria for wastewater-system capacity; Table S2: Evidence confidence classification and principal limitations for each island–indicator assessment; Table S3: Sensitivity and alternative-standardization analyses of the revised three-dimension-level scores; Code S1: Python script used to reproduce the leave-one-indicator-out, shared-data indicator-exclusion, threshold sensitivity, min–max, and rank-based analyses.
Funding
This research received no external funding.
Institutional Review Board Statement
Not applicable.
Informed Consent Statement
Not applicable.
Data Availability Statement
The data supporting the findings of this study are provided within the article, its cited sources, and the Supplementary Materials. The Python code used for the sensitivity analyses is provided as Code S1.
Acknowledgments
During the preparation of this manuscript, the author used ChatGPT (GPT-5.5, OpenAI, accessed in July 2026) solely to assist in the visual development of Figure 1. The figure was subsequently reviewed and revised by the author, who takes full responsibility for its final content.
Conflicts of Interest
The author declares no conflicts of interest.
References
- Balzan, M. V., Caruana, J., & Zammit, A. (2018). Assessing the capacity and flow of ecosystem services in multifunctional landscapes: Evidence of a rural–urban gradient in a Mediterranean small island state. Land Use Policy, 75, 711–725. [Google Scholar] [CrossRef] [Scilit]
- Barbier, E. B., Hacker, S. D., Kennedy, C., Koch, E. W., Stier, A. C., & Silliman, B. R. (2011). The value of estuarine and coastal ecosystem services. Ecological Monographs, 81, 169–193. [Google Scholar] [CrossRef] [Scilit]
- Blázquez-Salom, M., Cladera, M., & Sard, M. (2023). Identifying the sustainability indicators of overtourism and undertourism in Majorca. Journal of Sustainable Tourism, 31(7), 1694–1718. [Google Scholar] [CrossRef] [Scilit]
- Boehm, K. M., Kuiper, K. F., Uzel, B., Vroon, P. Z., & Wijbrans, J. R. (2023). Volcanism straddling the Miocene–Pliocene boundary on Patmos and Chiliomodi islands (southeastern Aegean Sea): Insights from new 40Ar/39Ar ages. Geochronology, 5, 391–403. [Google Scholar] [CrossRef] [Scilit]
- Chaney, D., & Séraphin, H. (2023). A systematic literature review and lexicometric analysis on overtourism: Towards an ambidextrous perspective. Journal of Environmental Management, 347, 119123. [Google Scholar] [CrossRef] [Scilit] [PubMed]
- Chasiotis, A., Mathiou, P., Bousdeki, M., Pappa, A., Manthos, T., & Nastos, P. T. (2026). Municipal carbon footprint and water infrastructure: A comparative assessment of emission reduction plans in three Greek municipalities. Water, 18(9), 1020. [Google Scholar] [CrossRef] [Scilit]
- Cillis, G., Coluzzi, R., Salvati, L., Colantoni, A., Nosava, B., Imbrenda, V., & Lanfredi, M. (2025). Water resource management in tourism hotspot: A cost-effective, semi-automatic method for monitoring the diffusion of residential swimming pools. Ecological Informatics, 90, 103333. [Google Scholar] [CrossRef] [Scilit]
- Council of Ministers of the Hellenic Republic. (2020, September 29). Approval of the national waste management plan (NWMP) (Act No. 39 of 31 August 2020; Series A, No. 185). Government Gazette of the Hellenic Republic. Available online: https://ypen.gov.gr/wp-content/uploads/2021/02/%CE%B5%CE%B3%CE%BA%CF%81%CE%B9%CF%83%CE%B7-%CE%95%CE%A3%CE%94%CE%91.pdf (accessed on 10 May 2026).
- Cramer, W., Guiot, J., Fader, M., Garrabou, J., Gattuso, J. P., Iglesias, A., Lange, M. A., Lionello, P., Llasat, M. C., Paz, S., Peñuelas, J., Snoussi, M., Toreti, A., Tsimplis, M. N., & Xoplaki, E. (2018). Climate change and interconnected risks to sustainable development in the Mediterranean. Nature Climate Change, 8, 972–980. [Google Scholar] [CrossRef] [Scilit]
- de Andrés, M., Barragán, J. M., & García Sanabria, J. (2018). Ecosystem services and urban development in coastal social-ecological systems: The Bay of Cádiz case study. Ocean & Coastal Management, 154, 155–167. [Google Scholar] [CrossRef] [Scilit]
- Díaz-Farina, E., Díaz-Hernández, J. J., & Padrón-Fumero, N. (2020). The contribution of tourism to municipal solid waste generation: A mixed demand-supply approach on the island of Tenerife. Waste Management, 102, 587–597. [Google Scholar] [CrossRef] [Scilit] [PubMed]
- Dodds, R., & Butler, R. W. (Eds.). (2019). Overtourism: Issues, realities and solutions. De Gruyter. [Google Scholar] [CrossRef] [Scilit]
- Drius, M., Bongiorni, L., Depellegrin, D., Menegon, S., Pugnetti, A., & Stifter, S. (2019). Tackling challenges for mediterranean sustainable coastal tourism: An ecosystem service perspective. Science of the Total Environment, 652, 1302–1317. [Google Scholar] [CrossRef] [Scilit] [PubMed]
- European Commission, Directorate-General for Internal Market, Industry, Entrepreneurship and SMEs. (2016). The European tourism indicator system: ETIS toolkit for sustainable destination management. Publications Office of the European Union. [Google Scholar] [CrossRef]
- European Environment Agency. (2025). Water savings for a water-resilient Europe (EEA Briefing No. 05/2025). European Environment Agency. [Google Scholar] [CrossRef]
- European Environment Agency. (2026). Natura 2000 standard data forms and site information. Available online: https://natura2000.eea.europa.eu/ (accessed on 27 April 2026).
- European Parliament and Council. (2006). Directive 2006/7/EC of the European parliament and of the council of 15 February 2006 concerning the management of bathing water quality and repealing directive 76/160/EEC. Official Journal of the European Union, L64, 37–51. [Google Scholar]
- European Parliament and Council. (2024). Directive (EU) 2024/3019 of the European parliament and of the council of 27 November 2024 concerning urban wastewater treatment (recast). Official Journal of the European Union, L 2024/3019, 1–59. [Google Scholar]
- FODSA of South Aegean S.A. (2022). Revision of the regional waste management plan (PESDA) of the South Aegean. Available online: https://wastefreeaegean.gr/wp-content/uploads/2023/04/%CE%A0%CE%9B%CE%97%CE%A1%CE%95%CE%A3-%CE%A0%CE%95%CE%A3%CE%94%CE%91-%CE%9D%CE%9F%CE%A4%CE%99%CE%9F%CE%A5-%CE%91%CE%99%CE%93%CE%91%CE%99%CE%9F%CE%A5_signed.pdf (accessed on 26 May 2026).
- Gissi, E., Manea, E., Mazaris, A. D., Fraschetti, S., Almpanidou, V., Bevilacqua, S., Coll, M., Guarnieri, G., Lloret-Lloret, E., Pascual, M., Petza, D., Rilov, G., Schonwald, M., Stelzenmüller, V., & Katsanevakis, S. (2021). A review of the combined effects of climate change and other local human stressors on the marine environment. Science of the Total Environment, 755, 142564. [Google Scholar] [CrossRef] [Scilit] [PubMed]
- Goodwin, H. (2017, October). The challenge of overtourism. Responsible Tourism Partnership Working Paper 4. Available online: https://haroldgoodwin.info/wp-content/uploads/2020/08/rtpwp4overtourism012017.pdf (accessed on 24 August 2026).
- Gössling, S. (2015). New performance indicators for water management in tourism. Tourism Management, 46, 233–244. [Google Scholar] [CrossRef] [Scilit]
- Gössling, S., Peeters, P., Hall, C. M., Ceron, J.-P., Dubois, G., Lehmann, L. V., & Scott, D. (2012). Tourism and water use: Supply, demand, and security—An international review. Tourism Management, 33, 1–15. [Google Scholar] [CrossRef] [Scilit]
- Grizzetti, B., Liquete, C., Pistocchi, A., Vigiak, O., Zulian, G., Bouraoui, F., De Roo, A., & Cardoso, A. C. (2019). Relationship between ecological condition and ecosystem services in European rivers, lakes and coastal waters. Science of the Total Environment, 671, 452–465. [Google Scholar] [CrossRef] [Scilit] [PubMed]
- Hellenic Cadastre. (2026). Basemap viewer. Available online: https://gis.ktimanet.gr/wms/ktbasemap/default.aspx (accessed on 3 May 2026).
- Hellenic Ministry of Environment and Energy. (2021). Bathing-water monitoring data. Available online: https://ypen.gov.gr/perivallon/ydatikoi-poroi/aktes-kolymvisis/ (accessed on 27 May 2026).
- Hellenic Ministry of Environment and Energy. (2026, May 11). Spatial planning: Planning development with rules [Press Release]. Available online: https://ypen.gov.gr/eidiko-chorotaxiko-plaisio-gia-ton-tourismo/ (accessed on 3 May 2026).
- Hellenic Ministry of Tourism. (2024). 2024 key figures of travel activity. Smart Tourism Greece. Available online: https://smt.mintour.gov.gr/dedomena/vasika-megethi-taxidiotikis-kinisis/ (accessed on 3 May 2026).
- Hellenic Statistical Authority. (2023). Population and housing census 2021: Resident population by municipality. Hellenic Statistical Authority. Available online: https://elstat-outsourcers.statistics.gr/Census2022_GR.pdf (accessed on 8 April 2026).
- Hellenic Statistical Authority. (2024). Hotels, campsites and short-stay accommodation. Available online: https://www.statistics.gr/el/statistics/-/publication/STO12/2024 (accessed on 3 May 2026).
- Hung, Y.-T., & Tsou, C.-T. (2026). From carrying capacity to destination resilience: An indicator framework for island tourism. Tourism Geographies, 28(2), 141–162. [Google Scholar] [CrossRef] [Scilit]
- Ivars-Baidal, J. A., Vera-Rebollo, J. F., Perles-Ribes, J. F., Femenia-Serra, F., & Celdrán-Bernabéu, M. A. (2023). Sustainable tourism indicators: What’s new within the smart city/destination approach? Journal of Sustainable Tourism, 31(7), 1556–1582. [Google Scholar] [CrossRef] [Scilit]
- Koens, K., Postma, A., & Papp, B. (2018). Is overtourism overused? Understanding the impact of tourism in a city context. Sustainability, 10, 4384. [Google Scholar] [CrossRef] [Scilit]
- Lagarias, A., & Stratigea, A. (2023). Coastalization patterns in the Mediterranean: A spatiotemporal analysis of coastal urban sprawl in tourism destination areas. GeoJournal, 88, 2529–2552. [Google Scholar] [CrossRef] [Scilit]
- Leka, A., Lagarias, A., Panagiotopoulou, M., & Stratigea, A. (2022). Development of a tourism carrying capacity index (TCCI) for sustainable management of coastal areas in Mediterranean islands—Case study Naxos, Greece. Ocean & Coastal Management, 216, 105978. [Google Scholar] [CrossRef] [Scilit]
- Leka, A., Lagarias, A., Stratigea, A., & Prekas, P. (2025). A methodological framework for assessing overtourism in insular territories—Case study of Santorini Island, Greece. ISPRS International Journal of Geo-Information, 14, 106. [Google Scholar] [CrossRef] [Scilit]
- Mateu-Sbert, J., Ricci-Cabello, I., Villalonga-Olives, E., & Cabeza-Irigoyen, E. (2013). The impact of tourism on municipal solid waste generation: The case of Menorca Island (Spain). Waste Management, 33, 2589–2593. [Google Scholar] [CrossRef] [Scilit] [PubMed]
- Mejjad, N., Rossi, A., & Pavel, A. B. (2022). The coastal tourism industry in the Mediterranean: A critical review of the socio-economic and environmental pressures and impacts. Tourism Management Perspectives, 44, 101007. [Google Scholar] [CrossRef] [Scilit]
- Mihalic, T. (2020). Conceptualising overtourism: A sustainability approach. Annals of Tourism Research, 84, 103025. [Google Scholar] [CrossRef] [Scilit]
- Milano, C., Novelli, M., & Cheer, J. M. (2019). Overtourism and tourismphobia: A journey through four decades of tourism development, planning and local concerns. Tourism Planning & Development, 16(4), 353–357. [Google Scholar] [CrossRef] [Scilit]
- Millennium Ecosystem Assessment. (2005). Ecosystems and human well-being: Synthesis. Island Press. [Google Scholar]
- Monokrousou, K., Makropoulos, C., Eleftheriou, A., Vasilakos, I., Styllas, M., Dimitriadis, K., Kouris, N., Nyktari, E., & Malamis, S. (2025). From rain to resilience: Rainwater harvesting coupled with subsurface storage and recovery as a nature-based solution for arid communities—The case of Mykonos. Urban Water Journal, 22, 820–832. [Google Scholar] [CrossRef] [Scilit]
- Municipality of Patmos. (2026). Official website of the municipality of Patmos. Available online: https://patmos.gov.gr/ (accessed on 30 May 2026).
- Municipality of Spetses. (2020). Update of the local solid waste management plan of the municipality of Spetses. Available online: https://edsna.gr/wp-content/uploads/2024/11/46_%CE%A4%CE%A3%CE%94%CE%91-%CE%94%CE%97%CE%9C%CE%9F%CE%A3-%CE%A3%CE%A0%CE%95%CE%A4%CE%A3%CE%A9%CE%9D.pdf (accessed on 6 April 2026).
- Municipality of Spetses. (2026). Official website of the municipality of Spetses. Available online: https://spetses.gov.gr/ (accessed on 15 May 2026).
- Mustafaraj, M., Kjerstad, Ø. K., & Zhang, H. (2026). Water quality indices and their impact on coastal pollution and tourist satisfaction: A systematic review. Regional Studies in Marine Science, 98, 105057. [Google Scholar] [CrossRef] [Scilit]
- Ntalakos, A., Skagias, K., Belias, D., & Rossidis, I. (2025). Navigating sustainable features: A comparative analysis of sustainable tourism in Santorini, Mykonos, and Paros. Tourism and Hospitality, 6(4), 183. [Google Scholar] [CrossRef] [Scilit]
- OECD, European Union & European Commission, Joint Research Centre. (2008). Handbook on constructing composite indicators: Methodology and user guide. OECD Publishing. [Google Scholar] [CrossRef] [Scilit]
- Peeters, P., Gössling, S., Klijs, J., Milano, C., Novelli, M., Dijkmans, C., Eijgelaar, E., Hartman, S., Heslinga, J., Isaac, R., Mitas, O., Moretti, S., Nawjin, J., Papp, B., & Postma, A. (2018). Research for TRAN committee—Overtourism: Impact and possible policy responses (PE 629.184). European Parliament, Policy Department for Structural and Cohesion Policies. Available online: https://www.europarl.europa.eu/RegData/etudes/STUD/2018/629184/IPOL_STU(2018)629184_EN.pdf (accessed on 28 April 2026).
- Pournara, A., & Sakellariadou, F. (2022). Development of a protocol for a sustainable blue economy in the coastal zone: Case study and preliminary results in a coastal industrial area in the Eastern Mediterranean. Sustainability, 14, 10323. [Google Scholar] [CrossRef] [Scilit]
- Pournara, A., Sakellariadou, F., & Kitsiou, D. (2023). Toward a sustainable blue economy in the coastal zone: Case study of an industrialized coastal ecosystem in Greece. Sustainability, 15, 11333. [Google Scholar] [CrossRef] [Scilit]
- Region of South Aegean. (2023). Annex I—Technical description and budget: Regional waste management plan (PESDA South Aegean). Available online: https://wastefreeaegean.gr/wp-content/uploads/2023/05/%CE%A0%CE%91%CE%A1%CE%91%CE%A1%CE%A4%CE%97%CE%9C%CE%91-%CE%99-%CE%A4%CE%95%CE%A7%CE%9D%CE%99%CE%9A%CE%97-%CE%A0%CE%95%CE%A1%CE%99%CE%93%CE%A1%CE%91%CE%A6%CE%97-%CE%A0%CE%A1%CE%9F%CE%A5%CE%A0%CE%9F%CE%9B%CE%9F%CE%93%CE%99%CE%A3%CE%9C%CE%9F%CE%A3_signed.pdf (accessed on 30 April 2026).
- Region of South Aegean. (2025). Announcement regarding the operation of the Mykonos landfill [Government Announcement]. Available online: https://www.pnai.gov.gr/wp-content/uploads/2025/08/21-8-%CE%91%CE%9D%CE%91%CE%9A.-%CE%A7%CE%A5%CE%A4%CE%91-%CE%9C%CE%A5%CE%9A%CE%9F%CE%9D%CE%9F%CE%A5.pdf (accessed on 10 May 2026).
- Regulatory Authority for Waste, Energy and Water. (2026). Waste geoportal. Available online: https://geo.rae.gr/apovlita/ (accessed on 3 May 2026).
- Ruggieri, G., & Platania, M. (2024). Islands’ tourism seasonality: A data analysis of Mediterranean islands’ tourism comparing seasonality indicators (2008–2018). Sustainability, 16, 3674. [Google Scholar] [CrossRef] [Scilit]
- Special Secretariat for Water. (2015). River basin management plan of the Aegean islands river basin district (GR14). Ministry of Environment and Energy. Available online: https://wfdver.ypeka.gr/wp-content/uploads/2017/04/FEK_2019.B.2015_GR14-1.pdf (accessed on 30 April 2026).
- Special Secretariat for Water. (2026). National database of urban wastewater treatment plants. Ministry of Environment and Energy. Available online: https://astikalimata.ypeka.gr/wtp (accessed on 24 April 2026).
- UNESCO World Heritage Centre. (2026). Patmos world heritage site (property no. 942). Available online: https://whc.unesco.org/en/list/942/ (accessed on 29 April 2026).

Disclaimer/Publisher’s Note: The statements, opinions and data contained in all publications are solely those of the individual author(s) and contributor(s) and not of MDPI and/or the editor(s). MDPI and/or the editor(s) disclaim responsibility for any injury to people or property resulting from any ideas, methods, instructions or products referred to in the content. |
© 2026 by the author. Licensee MDPI, Basel, Switzerland. This article is an open access article distributed under the terms and conditions of the Creative Commons Attribution (CC BY) license.