


Abstract
Historic urban districts face growing challenges in balancing visitor activity with the needs of residents, local businesses, accessibility, and mobility. This study investigates whether short-term visitor forecasts can support destination management and planning in these complex environments. Unlike most visitor-forecasting studies, which focus on large cities and major tourist destinations, this study examines forecasting in a small historic urban district where visitor activity is more variable and management resources are limited. Using hourly pedestrian counts, weather data, and temporal data from the historic urban district of Fredrikstad, Norway, this research forecasts pedestrian activity up to 24 h in advance. The sensors record all pedestrians and do not distinguish tourists from residents or other users. Consequently, pedestrian counts are treated as an operational proxy for overall visitor activity at this heritage destination. Forecasting performance was evaluated using statistical, machine-learning, deep-learning, and benchmark forecasting models. Random Forest achieved the strongest overall forecasting performance (MAE = 209.52; RMSE = 357.18), outperforming the seasonal naïve benchmark (MAE = 247.44; RMSE = 421.70). Random Forest and GRU both outperformed the seasonal naïve benchmark on MAE, demonstrating the value of incorporating weather, temporal, and sensor variables into short-term forecasting. The findings suggest that short-term visitor forecasts may support operational planning, mobility management, service coordination, and other day-to-day destination management decisions. By anticipating periods of increased visitor activity, destination managers, local authorities, and government officials will be better able to allocate resources and coordinate services. This study demonstrates the potential of predictive analytics and sensor technology to support visitor management and operational planning in historic urban districts.
1. Introduction
There has been growing interest in historic urban districts and city-based tourism, creating new challenges for managing visitor activity in these areas. In particular, many historic urban districts and urban attractions throughout Europe and other parts of the world face challenges such as unpredictable visitor numbers and periodic fluctuations in visitor activity, which can strain local infrastructure, services, and visitor experiences. In addition, historic urban districts face broader management challenges, including changing commercial activity, differing expectations among residents, businesses, and visitors, as well as debates about how these areas should develop in the future (Chen et al., 2025). Short-term forecasting is a practical lever for operational decision-making in these settings, enabling proactive rather than reactive decisions.
Variable visitor numbers pose a significant challenge for many destinations, and experiences from other destinations illustrate why proactive visitor management can be valuable. Two well-documented cases illustrate the consequences of sustained visitor pressure. One example is Hanauma Bay Nature Preserve in Hawaii, where authorities implemented a daily visitor limit (Leonard, 2025; Linnes et al., 2022a; Walters, 2020). Hanauma Bay Nature Preserve’s popularity grew in the 1970s and 1980s, when visitor attendance peaked at an estimated 10,000 people a day (Agrusa, 1994; Pennybacker, 2020). A management plan implemented in 1990 helped mitigate this human impact by reducing visitation, improving facilities, establishing an education program, and banning the feeding of fish. In 2019, average daily attendance was approximately 2300 people, with nearly 845,000 tourists and residents visiting the nature preserve that year (City and County of Honolulu, 2026). According to 2025 article in the local newspaper Honolulu Civil Beat, Hanauma Bay received 1400 visitors per day in 2025 (Leonard, 2025). Another example is Maya Bay in Thailand, known as the most beautiful bay in Thailand and made famous by Leonardo DiCaprio’s movie The Beach. As a result of tourists’ fascination with this movie, Thai officials had to close the beach for an extended period to allow the reef ecosystem to recover from overtourism (Koh & Fakfare, 2020; Rithdee, 2022). These examples demonstrate how visitor management interventions may become necessary when sustained visitor pressure exceeds a destination’s or attraction’s capacity. By contrast, this study focuses on routine surges in small urban districts, asking how day-ahead forecasts can help schedule services and coordinate activity without resorting to blunt restrictions.
This study examines the historic urban district of Fredrikstad, Norway. Fredrikstad was founded in 1567 and is the largest and best-preserved fortress town in Northern Europe (Britannica, 2026). According to Visit Norway, the town offers a strong sense of history as a tourist destination, with cobbled stone streets, galleries, museums, local shops, and charming cafés (Visit Norway, 2026). As urban destinations and tourist attractions become increasingly complex, information and communication technologies, along with machine learning, are reshaping how destination managers and local authorities predict demand and respond to change. The growing use of digital technologies has enabled more data-driven approaches to destination governance, management, and tourism planning. Smart tourism refers to the application of digital technologies, data, and information systems to support destination management, visitor experiences, and tourism planning (Gajdošík, 2022). In service-oriented environments supported by digital infrastructure and emerging technologies, real-time mobile applications provide new opportunities to generate data and facilitate communication among stakeholders. Within this framework, pedestrian-count sensors, weather, and calendar variables are combined to produce 24-h-ahead forecasts that may support operational planning.
The Smart Tourism Destination paradigm conceptualizes destinations as interconnected sociotechnical ecosystems that leverage digital infrastructure to improve visitor management, allocate resources more efficiently, and strengthen service delivery. Bibri and Krogstie (2017) contend that genuine intelligence emerges when technological innovation is aligned with sustainability objectives and delivers tangible gains in quality of life for both residents and visitors. Continuous monitoring of the destination provides planners with robust evidence to understand visitor activity patterns, support operational planning, and refine visitor experience design at both operational and strategic levels. Digital technologies are employed to enhance experiences for residents and tourists, allocate scarce resources more efficiently, and reinforce destination competitiveness. In this study, short-term forecasting is presented as one practical application of this broader paradigm, providing operational decision support for destination managers.
In historic urban districts, data-informed destination management increasingly relies on predictive analytics to support visitor management, anticipate periods of elevated visitor activity, and inform operational and long-term planning. Short-horizon forecasting serves as a decision-support layer within data-informed destination management, linking real-time sensing to day-ahead operational decisions.
This study has practical relevance for destination managers and local planners by supporting data-informed planning, operational decision-making, and the long-term vitality of historic urban districts. Most applied forecasting work of this kind has been completed for large cities and major attractions, where sensor networks are dense and visitor numbers are high enough to smooth out noise. Small historic urban districts are a more difficult and less studied case. These districts experience sharp fluctuations in visitor activity that are often influenced by weather, calendar effects, and other local conditions. These constraints shape what a forecasting tool must deliver: it must run on modest, openly available data; it must provide sufficiently accurate short-term forecasts using readily available sensor, weather, and calendar data; and its outputs must be legible enough for a small municipal team to act on. This study addresses these constraints by implementing a lean data stack (fixed-location crowd sensors combined with weather and calendar signals) to make predictive analytics practical for small historic urban districts (Chang et al., 2024; Lu et al., 2021).
This study investigates whether pedestrian-count sensor data can be used to forecast short-term pedestrian activity in a historic urban district. These pedestrian counts are interpreted as an operational proxy for overall visitor activity when discussing destination-management implications. Using approximately nine months of hourly observations from eight crowd sensors in the historic urban district of Fredrikstad, the study compares statistical, machine learning, and deep learning models for predicting visitor activity 24 h in advance. The results are interpreted in terms of how short-term visitor forecasts can support operational planning, resource allocation, service scheduling, and other day-to-day destination management decisions. Throughout this paper, pedestrian counts recorded by the sensor network are treated as an operational proxy for overall visitor activity within the historic urban district. While the sensors cannot distinguish tourists from residents or other users, the forecasts are intended to support destination management in a heritage setting where overall activity levels are of primary operational interest.
The contribution is twofold. The study presents one of the few visitor-flow forecasting studies grounded in a small historic urban district rather than a large city, and it demonstrates where predictive accuracy and model transparency pull in different directions for the public-sector destination managers who would actually use these tools. The study is situated within the broader Smart Tourism Destination literature but specifically examines how short-horizon forecasting can support data-informed destination management and operational planning in historic urban districts. This proxy aligns with the study’s scope: decisions concern when and where activity peaks occur, so aggregate counts are fit for operational purposes.
Historic urban districts require practical forecasting tools that can operate using readily available sensor, weather, and calendar data to support day-to-day destination management operations. Existing forecasting research has focused primarily on larger destinations, while comparatively insufficient attention has been paid to smaller historic urban districts where management resources are more limited. This study addresses that gap by evaluating statistical, machine-learning, and deep-learning approaches for advanced 24-h pedestrian-activity forecasting and discussing how these forecasts may support operational planning within a destination-management context.
2. Theoretical Framework
This study adopts the Smart City lens (Chan, 2024; Chourabi et al., 2012; Kitchin, 2014), which views cities as data-driven systems that leverage information and communication technologies to enhance governance, planning, and service provision. Applied to tourism, this perspective aligns with the Smart Tourism Destination (STD) paradigm (Boes et al., 2016; Gretzel et al., 2015), which integrates ICT with predictive tourism analytics to elevate the visitor experience, professionalize destination management, and enable forecasting-driven, sustainable, and efficient tourism operations.
In this framework, digital infrastructure generates continuous data streams that are transformed into actionable intelligence through predictive analytics, supporting data-informed planning and proactive visitor management (Kitchin, 2014). As Chan (2024) observes, the idea of a smart city, and its application to tourism destinations, carries different meanings for technology providers, municipal authorities, tourism businesses, residents, and visitors. Within this paradigm, machine learning serves as the analytical core that turns multisource signals into operational forecasts for visitor management.
In historic urban districts, this matters more than usual because the same streets are both a living community and a space that visitors come to explore. This framework treats people, public authorities, and technology as components of a single system that must be coordinated to support effective destination management, long-term destination vitality, and a high-quality of the visitor experience.
This study investigates how integrating sensors, open data, and machine learning models can deliver predictive tourism analytics that support data-informed destination planning and proactive visitor flow management in the historic urban district of Fredrikstad, Norway, and similar districts, with a day-ahead forecasting horizon.
- RQ1: How accurately can statistical, machine-learning, and deep-learning models forecast pedestrian activity 24 h ahead using sensor, weather, and calendar data, and which model family performs best?
- RQ2: How can 24 h ahead visitor activity forecasts inform operational planning and management decisions in historic urban districts, and what trade-offs do destination managers face between predictive accuracy and interpretability when selecting forecasting tools?
Together, these questions rest on the premise that advanced ICT and tourism intelligence systems can enable more informed, adaptive, and efficient destination governance and visitor flow management in historic urban districts. They operationalize the Smart Tourism Destination paradigm by evaluating whether predictive analytics can provide actionable day-ahead decision support for destination management.
3. Literature Review
The concept of smart destinations is now recognized as an integrated sociotechnical system rather than a purely technology-centric model. According to Chourabi et al. (2012), smart systems leverage ICT and data analytics to enhance sustainability, efficiency, and governance. Wright et al. (2025) defined smart cities as entities that use information and communication technology to increase operational efficiency, disseminate information to the public, and improve the standard of public services and social welfare. These principles are now increasingly applied to data-informed destination management, with an emphasis on predictive analytics and forecasting to support operational planning and visitor management (Gretzel et al., 2015; Wright et al., 2025).
Kitchin (2014) argues that ongoing data collection and analysis are essential for real-time, short-horizon destination management and for visitor activity and mobility. Later, governance and ethical considerations were added (Hollands, 2015; Kitchin, 2016; Meijer et al., 2016; Nam & Pardo, 2011; Vanolo, 2014), which emphasized inclusivity and social equity, both crucial for responsible destination management and evidence-based tourism governance. For historic districts, this implies light-touch data practices that still deliver timely, usable insights.
The concept of the smart sustainable destination builds on ideas of sustainability and social progress (Bibri & Krogstie, 2017). An expanded conception of smart destinations extends beyond energy and transport to embrace visitor experience design, tourism mobility management, and the quality and livability of urban places (Mora et al., 2019). Recent work translates these principles into applied frameworks for destination governance and tourism informatics that prioritize transparency, stakeholder participation, and accountability across tourism operations (Kourtit et al., 2020). At the same time, communities and destination management organizations (DMOs) are adopting data-informed destination planning and tourism intelligence systems to improve decision-making and cultivate public trust. Advances in privacy-preserving machine learning enable these technologies to uphold ethical standards while supporting forecasting-driven tourism analytics (Kairouz et al., 2021).
The ability to convert sensor and digital data into actionable insights is essential for predictive, data-driven destination management. Combining open data, AI, and IoT technology provides new perspectives on visitor behavior, tourism mobility, and visitor activity patterns (Batty et al., 2012). Using predictive analytics, including short-term forecasting, destination planners can anticipate fluctuations in tourism demand, visitor flows, and overall visitation patterns, allowing them to improve operational planning, allocate resources more effectively, and support proactive destination management. For small districts, the most useful predictors are observable and exogenous (weather, holidays, and day-of-week), because they enable advance planning without invasive data collection.
Smaller historic urban districts, characterized by fine-grained street networks, mixed resident–visitor use, and tighter operational constraints, have been understudied compared to large tourism destinations (Kourtit et al., 2020; Mora et al., 2019). Understanding visitor patterns and mobility in historic urban districts supports evidence-based destination management and motivates the use of machine learning for short-term visitor-activity forecasting (Chang et al., 2024; Lu et al., 2021).
3.1. Smart City and Smart Destination
Technological advancement has propelled the expansion of the tourism sector, with Information and Communication Technology (ICT) and data analytics and successive innovations enabling organizational and service transformation and allowing the industry to adapt to new market frontiers (Buhalis & O’Connor, 2005). Through the growing linkage of the term “smart” to modern technologies, it has become possible to conceptualize smart tourism, that is, tourism that is technologically, economically, and socially developed through the integration of advanced digital solutions, including predictive analytics and machine learning (Akdu, 2020).
The rise of smart tourism destinations (STDs) marks a major evolution of the smart city concept within the field of destination management. These destinations use ICT, tourism intelligence systems, and data-driven decision support and short-horizon forecasting to enhance the visitor experience, support data-informed destination management, and improve operational decision-making (Cavalheiro et al., 2020; Della Corte et al., 2017).
Early definitions framed smartness as the deployment of sophisticated technological infrastructure in urban settings to advance economic, social, and ecological well-being (Meijer et al., 2016). This conception now extends to smart tourism destinations, where the intelligent use of digital technologies optimizes resource allocation, supports visitor activity management, and strengthens destination governance to deliver more informed and adaptive visitor activity management. In practice, these tools support short-term forecasting, operational planning, and data-informed decision-making within destinations (Caragliu et al., 2013; Townsend, 2013).
For smart tourism destinations to be sustainable and well developed, they must exhibit core qualities: environments that are livable for residents and attractive for visitors, efficient tourism mobility, effective destination management, equitable access to tourism resources, and a high-quality visitor experience (Giffinger et al., 2007; Caragliu et al., 2011). Conceived as integrated ecosystems, such destinations balance visitor activity, community needs, and long-term destination objectives, ensuring that both residents and visitors benefit from data-driven destination planning (Albino et al., 2015; Dameri, 2013; Lai et al., 2020; Toli & Murtagh, 2020). When applied to historic urban districts, these qualities are strengthened by embedding predictive analytics into governance, thereby enabling proactive management within constrained, mixed-use environments (Chang et al., 2024; Lu et al., 2021; Wright et al., 2025).
3.2. Smart Tourism Destinations and Visitor Intelligence
The Smart Tourism Destination paradigm applies Smart City principles into destination management through tourism analytics and digital technologies. Its backbone consists of intelligent transportation systems, IoT infrastructures, and data-driven monitoring, including short-horizon forecasting, enabling destinations to deploy digital technologies that enrich visitor experience, streamline tourism operations, and support data-informed destination management (Gretzel et al., 2015; Boes et al., 2016).
Through the use of real-time tourism intelligence systems, destination managers can analyze visitor mobility patterns and tourism demand to make data-informed decisions. For instance, by utilizing sensor data, geolocation, and social media analytics, managers can guide visitor activity and mobility, anticipate short-term changes in demand, and distribute visitors more effectively across destinations. Nevertheless, short-horizon predictive analytics in tourism remains underused, as the field continues to lean largely on descriptive or reactive approaches (Gričar, 2023; Miah et al., 2017; Song et al., 2019). Beyond dashboards, this research examines how forecasts may inform operational planning, including staffing, service scheduling, and other day-to-day management decisions. In this study, the focus is on 24-h visitor activity forecasts to support day-ahead operational decisions in historic urban districts.
Implementing predictive analytics enables destination management organizations (DMOs) to forecast next-day visitation levels, anticipate fluctuations in demand, and support proactive destination planning and management. This approach bolsters destinations’ capacity to improve operational decision-making and visitor experiences, while providing a stronger basis for data-informed planning. However, the use of such data-driven systems necessitates adherence to ethical and privacy standards. Predictive models that handle visitor data must conform to responsible data governance standards, including privacy-preserving aggregation and data minimization, and rigorously protect personal information (Bygrave, 2017; Jamal et al., 2024; Politou et al., 2022).
By combining machine learning and AI-driven tourism analytics, destinations can deliver enhanced visitor experiences and improve tourism planning processes through short-horizon forecasting and operational planning. This integration transforms how destination planners, tourism policymakers, and destination managers understand and manage visitor mobility, ultimately advancing data-informed destination planning, operational decision-making, and destination governance, particularly in small historic urban districts.
3.3. Predictive Analytics for Visitor Activity Forecasting
Predictive analytics empowers destination managers to forecast short-horizon visitor activity (24 h ahead) and improve data-informed destination management. This approach can be used to allocate resources more effectively, anticipate tourism demand, and support operational planning and visitor activity management in historic urban districts (Alotaibi, 2020; Cherenkov et al., 2024).
Machine learning, as a subset of artificial intelligence, enables destination managers in historic urban districts to analyze complex datasets to reveal patterns in tourism mobility and visitor activity. These insights can inform data-driven destination planning, support operational decision-making, and improve visitor activity management. By identifying correlations between weather, holidays, and visitation trends, predictive models assist DMOs in implementing visitor activity management systems that anticipate fluctuations in visitor activity and support proactive, day-ahead planning. Together, predictive analytics and machine learning provide the foundation for tourism intelligence systems that support day-ahead operational planning and destination management. This study emphasizes a minimal, non-proprietary data stack to enhance replicability and adoption by small municipal teams.
3.4. Destination Governance and Visitor Management
A crucial aspect of effective destination management in a historic urban district is ensuring effective governance, data-informed decision-making, and social inclusivity (Chang et al., 2024; Lu et al., 2021). Through predictive tourism analytics, destination managers and local authorities can improve resource allocation, support day-ahead operational planning, and foster social inclusion. These practices support data-informed destination management, which aims to balance visitor satisfaction with community well-being and long-term destination vitality (Appio et al., 2019; Bibri & Krogstie, 2017). Previous research has shown that visitors increasingly value sustainability and responsible destination management, reinforcing the need for planning approaches that consider both visitor experiences and local community needs (Linnes et al., 2022b).
Visitor-activity forecasting and management enable destination managers and local authorities to better understand and respond to fluctuations in visitor activity within historic urban districts, thereby supporting day-ahead planning and service coordination while maintaining positive visitor experiences. Ethical principles such as transparency, participation, and privacy (including data minimization and privacy-preserving aggregation) are vital for building public trust and sustaining long-term success in destination governance (Hollands, 2015; Komninos, 2013).
Furthermore, pedestrian-count data and day-ahead forecasting outputs can be used to measure visitor-activity patterns, accessibility, and operational performance. By combining data-informed destination planning and visitor intelligence systems, destination managers can monitor performance and guide adaptive management practices that reinforce both visitor experience and effective destination governance. In this study, these principles are instantiated through 24-h visitor-activity forecasting to inform destination management in a historic urban district.
3.5. Predictive Analytics for Destination Management
The application of machine learning and predictive tourism analytics in this study highlights the growing potential for data-informed destination management using short-horizon (24-h) forecasts. The findings provide actionable insights for destination governance, particularly regarding how destination managers and local authorities can use machine-learning forecasts to predict visitor activity, anticipate short-term peaks, and support data-informed destination planning and management.
The results suggest that destination managers can leverage technological innovation not only to enhance visitor experiences but also to establish visitor intelligence systems and data-informed planning tools to support long-term strategy. Such approaches promote more informed decision-making, effective resource allocation, and long-term destination vitality, which are important objectives of destination management. Similar findings have been reported in studies of historic tourism sites, where data-driven approaches have been used to support destination competitiveness, sustainability, and management decision-making (Linnes et al., 2021).
By integrating tourism intelligence systems into day-to-day management, destinations can transition from reactive management to predictive, adaptive governance, strengthening operational decision-making and visitor satisfaction. Despite these advances in destination intelligence, visitor analytics, and predictive forecasting, several important gaps remain in the literature, particularly for small historic urban districts and resource-constrained contexts, including the practical trade-offs between predictive accuracy and interpretability and the need for minimal-data approaches to 24-h visitor-activity forecasting (Alotaibi, 2020; Chang et al., 2024; Cherenkov et al., 2024; Lu et al., 2021).
3.6. Research Gap and Contribution
Three gaps follow from the work reviewed above. First, predictive analytics in tourism is still applied unevenly; much of the field remains descriptive or reactive, and the studies that do forecast demand cluster around large cities and flagship attractions rather than the small historic urban districts where spatial constraints and management challenges are often more pronounced (Kourtit et al., 2020; Miah et al., 2017; Mora et al., 2019). Second, applied forecasting work tends to report accuracy in aggregate and stops short of translating model output into the specific operational decisions a destination team makes, such as day-ahead staffing, servicing, event coordination, or selective rerouting. Third, the literature on smart and data-driven destinations stresses transparency and accountability for destination governance (Hollands, 2015; Kitchin, 2016) yet rarely confronts the practical tension this creates: the most accurate models are usually the least interpretable (Wright et al., 2025).
This study addresses all three gaps. It applies and compares statistical, machine-learning, and deep-learning forecasts to predict visitor activity 24 h in advance within a single small historic urban district, using a lean data stack (fixed-location crowd sensors enriched with weather and calendar signals). It discusses potential day-ahead operational applications of the forecasts, and treats the predictive-accuracy versus interpretability trade-off as a governance question rather than a purely technical one for data-informed destination management.
The contribution of this study is not merely a comparison of forecasting models, but a demonstration of how predictive analytics can support destination management. The results illustrate potential applications for planning, staffing, communication, and resource allocation.
4. Method
Guided by this framework and literature review, this study implements a lean, 24-h forecasting pipeline using crowd sensors, weather, and calendar signals and benchmarks machine-learning models against two statistical reference models—a seasonal naïve baseline and a classical ARIMA model—to evaluate predictive accuracy while maintaining model interpretability. This study is based on hourly pedestrian count observations collected from eight fixed IMAS Technologies sensors installed at the principal entrances to the historic urban district of Fredrikstad, Norway. Each sensor records the hourly number of pedestrians passing the monitored location. These observations constitute the primary dataset used to develop and evaluate the short-term forecasting models. A ninth aggregate (“Totalt”) channel sums the counts across the individual sensors. Throughout this research manuscript, the term “visitor activity” is used in an operational sense to describe overall activity within the historic urban district, while acknowledging that the sensor observations represent all pedestrians passing the monitored locations and cannot distinguish between tourists, local residents, employees, or other pedestrians. Records were retrieved from the IMAS web portal using a Python scraper that paged through the site day by day and wrote the hourly readings to a spreadsheet, after which weekend and public holiday flags were manually added.
Fredrikstad provides a useful test case because it represents a small historic urban district operating with limited resources, a context that is common yet underrepresented in predictive tourism research. Hourly weather observations for the same location and period were obtained from OpenWeatherMap (https://openweathermap.org/, accessed on 25 July 2026), covering temperature, pressure, wind speed, humidity, precipitation, snow, and a categorical weather description. The pedestrian count series and the weather series were joined on the hourly timestamp. The dataset covered the period from 1 October through 8 July, yielding 7110 hourly observations. To construct the 24 h-ahead forecasting task, the response variable was shifted forward by 24 h, reducing the usable dataset to 7086 observations because the final 24 h no longer had corresponding target values. The resulting dataset was divided chronologically, with the first 90% (6377 observations; 1 October–16 June) used for model development and the remaining 10% (709 observations; 17 June–8 July) reserved as an untouched test set. Each observation represents one hour of pedestrian counts recorded by the sensor network, along with the corresponding weather and temporal variables. For model evaluation, each model predicted the pedestrian count for a single hour exactly 24 h ahead. A 24 h forecasting horizon was selected because it provides destination managers with sufficient lead time to support operational planning for the following day. At the time a forecast is generated, the models use the most recent pedestrian-count observations together with calendar variables known in advance (e.g., hour, weekday, weekend, and public holidays) and weather information assumed to be available from operational day-ahead weather forecasts. Potential applications include staffing, visitor information, and resource allocation. The predicted values were then compared with the observed sensor counts recorded for the corresponding future hours in the chronological test period. The sensors record all pedestrians passing the monitored entrances and cannot distinguish between tourists, residents, employees, commuters, or other pedestrian groups. The forecasting models predict overall pedestrian activity within the historic urban district. In this study, these pedestrian counts serve as an operational proxy for overall activity within the historic urban district.
Time-series data typically exhibit recurring patterns at daily, weekly, monthly, and yearly intervals. Figure 1 illustrates hourly pedestrian counts recorded by the eight individual sensors together with the aggregate “Total” channel. Peaks in the series generally coincide with weekends, public holidays, and favorable weather conditions associated with increased visitor activity. Although some peaks may coincide with local events, no event dataset was available for this study. Consequently, event information was not included as a predictor variable, and any influence of local events could only be reflected indirectly through the observed pedestrian counts. An absence in those peaks when they are expected is usually caused by bad weather conditions. What is unique here is that the historic urban district is surrounded by waterways, making it easy to monitor all entrances to the historic place.
Figure 1.
Hourly pedestrian counts recorded by the nine sensor channels.
Eight sensors were installed in the fortified town to monitor pedestrian traffic in and out of the area. The locations are (a) Ferjeleia, (b) Glasshytta, (c) Isegran, (d) Kasernen, (e) Laboratoriegaten, (f) Magenta, (g) Mormors, (h) Pumpehuset. The old town is enclosed by a wall and surrounded by water; therefore, it serves as an excellent laboratory for monitoring the foot traffic in and out of the area.
The independent variable in a time series is time, which is also the data’s index. To improve model performance, additional data sources that were correlated with the target variables were incorporated. Weather conditions are expected to influence visitor activity patterns and were therefore incorporated as predictor variables. Figure 2 shows changes in temperature data over a year compared with changes in pedestrian-count data recorded by a particular sensor. The data were not resampled to compute average values over a 24-h period. Instead, the original hourly observations were retained to preserve detailed temporal patterns and improve forecasting accuracy throughout the day.
Figure 2.
Relationship between temperature and pedestrian counts.
4.1. Combining Data Sources
The temperature data in Figure 2 is part of the weather dataset containing 22 different measurements, such as pressure, wind speed, humidity, snow levels, etc. Figure 3 shows the weather variables selected for the forecasting models: temperature, snow, and rain.
Figure 3.
Selected weather variables used in the forecasting models.
At this stage, the dataset contained only the timestamp index as a temporal representation. Although the sequential index preserves the chronological order of observations, it does not explicitly encode recurring temporal patterns such as hour of day, day of week, or month of year (Figure 4).
Figure 4.
Weekly periodic patterns in pedestrian counts.
Additional temporal variables were included to enable the model to learn relationships between time intervals and changes in visitor activity. The temporal variables included year, day of the month, day of the year, day of the week, hour, weekends, and public holidays, as shown in Figure 5. Continuous predictor variables were normalized using parameters estimated from the training data only. The fitted normalization was subsequently applied unchanged to the chronological test data to prevent information leakage. No explicit event dataset was available for this study. Consequently, the forecasting models relied solely on sensor, weather, and calendar variables, and any effects of local events were captured only indirectly if reflected in the observed visitor counts.
Figure 5.
Temporal predictor variables used in the forecasting models.
4.2. Data Cleaning
The weather dataset contained one categorical variable, weather description, which was converted into binary indicator variables using one-hot encoding prior to model training. The continuous weather channels, such as temperature and pressure, contained no missing hourly readings. The remaining NaN entries appeared only in precipitation fields such as rain_1h, where a NaN denotes “no rain recorded” rather than a failed measurement; these were therefore treated as structural zeros and imputed with zero, rather than discarding the rows. No missing values were observed in the temperature and pressure variables, whereas the remaining missing values were confined to precipitation-related variables and represented structural zeros rather than missing measurements. In addition, columns that were almost entirely empty, such as rain_24h, carried no usable signal and were dropped. High-count hours were not capped or smoothed as outliers because periods of high pedestrian activity are precisely the conditions that destination managers need to anticipate and plan for. Likewise, unusually low visitor counts were retained because they may reflect genuine variations in visitor activity associated with weather or other real-world conditions rather than sensor errors.
4.3. Feature Selection
In terms of feature selection, variables that are highly sparse and/or largely redundant with other variables in the dataset were excluded, such as rain_3h, which contains only one non-zero value. Second, the relationships between candidate features and visitor activity were evaluated using a correlation matrix (Figure 6). The correlation matrix suggests that visitor activity is associated with several weather variables, particularly temperature and precipitation. Based on this analysis, the final dataset comprised 28 predictor variables, including sensor counts, weather variables, one-hot encoded weather categories, and temporal variables. Machine-learning models were trained to predict pedestrian counts 24 h ahead using weather, temporal, and sensor variables. The final predictor set comprised sensor counts, weather variables, one-hot encoded weather categories, and temporal variables (year, month, day, weekday, hour, weekend, and public holiday), while the response variable was the total pedestrian count 24 h ahead.
Figure 6.
Final dataset structure with meteorological and temporal predictors.
4.4. Proposed Pipelines
Although multi-output regressors often outperform single-output models by learning relationships among multiple outputs (Borchani et al., 2015), this advantage is limited in the present study because the sensor readings were already included as input variables. Consequently, a single-output regression pipeline was adopted, in which one or more sensor, weather, and temporal variables were used to predict pedestrian counts for a single target sensor. The predictor variables were shifted 24 h relative to the response variable, enabling day-ahead forecasting in which information available at time was used to predict pedestrian counts at time . Several pipeline configurations were considered, including single-input single-output, multi-input single-output, and multi-input multi-output architectures.
The final analysis used a multi-input single-output pipeline, combining sensor, weather, and temporal variables to predict pedestrian counts at a single target sensor. For the conventional machine-learning models, hyperparameters were selected using time-aware cross-validation applied exclusively to the training data. The final model was then retrained using the complete training set and evaluated once on the untouched chronological test set.
The forecasting problem was formulated as a supervised regression task. Although some predictors exhibit approximately linear relationships with pedestrian activity, nonlinear relationships are also expected. Therefore, both linear and nonlinear regression models were evaluated. All models were implemented using the scikit-learn Python library 3.12. Linear Regression, Ridge Regression, and Lasso Regression were included as linear benchmark models, whereas Random Forest Regression and Support Vector Regression were evaluated to capture nonlinear relationships. Recurrent neural networks (RNNs) are well suited to sequential data because they can model temporal dependencies between successive observations. They achieve this by propagating information through successive observations. Several extensions of the basic RNN architecture have been developed to improve the learning of long-term temporal dependencies through gating mechanisms. Gated Recurrent Unit (GRU) and Long Short-Term Memory (LSTM) networks are among the most widely used recurrent neural network architectures. The recurrent neural network consisted of one or two stacked recurrent layers followed by a dropout layer and a dense output layer. The recurrent cell type (GRU or LSTM), the number of layers, hidden units, dropout rate, sequence length, batch size, and optimizer were treated as hyperparameters. The final GRU architecture was selected through Bayesian Optimization HyperBand (BOHB). The selected hyperparameter configuration is summarized in Appendix C. The selected GRU model was then retrained using the complete training dataset before being evaluated once on the untouched chronological test set. Model training used the default stochastic behavior of the underlying machine-learning libraries, without specifying a fixed random seed.
4.5. Seasonal Naïve Baseline
To provide a simple reference for model performance, a seasonal naïve forecasting baseline was also evaluated. This benchmark predicts each hourly pedestrian count using the observed count from the corresponding hour on the previous day (24-h seasonal persistence). The seasonal naïve model requires no parameter estimation or model training and therefore serves as a transparent benchmark against which more complex forecasting methods can be compared. Although this approach cannot incorporate weather, calendar, or other predictor variables, it captures the strong daily periodicity that characterizes pedestrian activity in the historic urban district. Performance improvements over this baseline therefore indicate the value of incorporating weather variables, calendar effects, and machine-learning algorithms beyond simple daily repetition.
4.6. ARIMA Model
As a classical univariate time-series forecasting approach, an Autoregressive Integrated Moving Average (ARIMA) model was also evaluated. Unlike the machine-learning models, ARIMA is a univariate forecasting method that relies solely on historical observations of pedestrian counts and does not incorporate weather or calendar predictor variables. Figure 7 illustrates the decomposition of the pedestrian-count time series into trend, seasonal, and residual components.
Figure 7.
ARIMA decomposition of the pedestrian-count time series into trend, seasonal, and residual components.
The trend component represents the long-term evolution of the pedestrian-count series after removing seasonal and residual variation. The trend broadly follows the annual temperature pattern shown in Figure 2, suggesting a relationship between seasonal weather conditions and pedestrian activity. Using these decomposed components, ARIMA forecasts future observations based solely on previous values of the pedestrian-count series. Although ARIMA models have been successfully applied in many forecasting applications, their reliance on historical observations alone may limit their ability to capture changes associated with weather and calendar variables compared with models that incorporate these additional predictors.
5. Results
The final dataset contained 7086 hourly observations after constructing the 24 h-ahead forecasting task. The first 90% of the observations were used for model development, and the remaining 10% were reserved as an untouched chronological test set. Following hyperparameter optimization using time-aware validation on the training data, the final models were retrained on the complete training set and evaluated once on the chronological test period. Model performance was assessed using Mean Squared Error (MSE), Root Mean Squared Error (RMSE), and Mean Absolute Error (MAE).
5.1. Machine-Learning Comparison
After model development and hyperparameter selection, all forecasting models were evaluated on the untouched chronological test dataset. Figure 8 compares the observed pedestrian counts for the aggregated (“Totalt”) sensor with the corresponding 24-h-ahead predictions produced by the evaluated models. The x-axis represents the chronological test period, while the y-axis shows the observed and predicted pedestrian counts.
Figure 8.
Comparison of predicted versus actual visitor volumes.
Figure 8 shows that all evaluated models capture the overall temporal pattern of pedestrian activity, although their ability to reproduce periods of rapidly changing activity varies.
Table 1 summarises the quantitative forecasting performance of each model on the chronological test set. Random Forest achieved the lowest prediction error across all reported metrics, indicating the strongest overall forecasting performance. Ridge Regression and Linear Regression produced very similar results. GRU achieved the second-lowest MAE among the evaluated models, although Ridge Regression and Linear Regression produced lower RMSE and MSE values. The seasonal naïve baseline outperformed Lasso Regression and Support Vector Regression but remained less accurate than Random Forest and GRU. These findings suggest that incorporating weather, temporal, and sensor variables can improve forecasting accuracy beyond simple daily persistence.
Table 1.
Performance of forecasting models on the chronological test set.
The seasonal naïve baseline performed better than several conventional regression models but remained less accurate than Random Forest and GRU. This indicates that incorporating weather, calendar, and sensor variables improves forecasting accuracy beyond simple daily persistence.
Although Random Forest achieved the lowest overall MSE, Figure 9 illustrates qualitative differences in the prediction behavior of the two models. Random Forest generally produces smoother forecasts, whereas the GRU model exhibits a different response pattern over portions of the test period. These visual differences are descriptive only. Because no formal peak-detection analysis was conducted, the figure should not be interpreted as evidence that either model is superior at identifying periods of elevated pedestrian activity.
Figure 9.
Comparison of Random Forest and GRU predictions against observed visitor activity.
5.2. ARIMA Results
Figure 10 presents the ARIMA predictions over the chronological test period using hourly observations. The model captures the recurring daily pattern in pedestrian activity but is less responsive to abrupt changes than the machine-learning models.
Figure 10.
ARIMA predictions for the chronological test period.
Figure 11 illustrates forecasts generated over longer prediction horizons. As the forecasting horizon increases, ARIMA increasingly follows the dominant seasonal pattern while becoming less responsive to short-term fluctuations. Consequently, the model reproduces the general daily cycle but becomes less responsive to short-term changes in pedestrian activity as the forecasting horizon increases.
Figure 11.
ARIMA forecasts over longer prediction horizons.
Figure 12 compares the 24-h-ahead forecasts produced by ARIMA and GRU with the observed pedestrian counts. ARIMA captures the recurring daily pattern but is less responsive to abrupt changes than the GRU model. The figure illustrates qualitative differences in model behavior only. Because no formal peak-detection analysis was performed, no conclusions can be drawn regarding either model’s ability to identify periods of elevated pedestrian activity. ARIMA nevertheless remains a transparent and interpretable statistical reference for comparison with the more complex GRU model.
Figure 12.
Comparison of ARIMA and GRU 24-h forecasts.
5.3. Discussion of the Research Questions
The ARIMA model was retained as an interpretable statistical reference to evaluate the trade-off between predictive performance and model transparency.
RQ1: The results indicate that pedestrian activity can be forecast with useful accuracy 24 h in advance using sensor, weather, and calendar data. Among the evaluated models, Random Forest achieved the lowest prediction error on the chronological test set, providing the strongest overall forecasting performance under the evaluation framework used in this study. The GRU model also produced competitive forecasts while exhibiting a different prediction pattern. The ARIMA model reproduced the general daily cycle but was less responsive to abrupt changes in pedestrian activity. This qualitative comparison illustrates the limitations of relying solely on historical observations without additional predictor variables.
RQ2: The findings suggest that 24-h-ahead forecasts can support operational planning by helping destination managers anticipate changes in pedestrian activity and improve staffing, service coordination, and resource allocation. The comparison also highlights a practical trade-off between predictive accuracy and interpretability. Random Forest achieved the highest forecasting accuracy, whereas ARIMA provides a transparent statistical reference that is easier to interpret and explain. GRU offers a competitive deep-learning alternative but, like Random Forest, is less transparent than ARIMA. This trade-off is particularly relevant in public-sector destination management, where forecasting models should support decisions that are both effective and explainable.
Taken together, the findings suggest that predictive analytics can support data-informed destination governance by helping managers anticipate changes in pedestrian activity and improve operational planning and resource allocation.
6. Conclusions
The fortified town faces management challenges that extend beyond forecasting visitor activity. It must remain attractive to visitors while also functioning as a place where people live, work, and operate businesses. In many cases, the central challenge is not excessive visitor pressure but maintaining economic vitality, accessibility, and a balance among the needs of residents, visitors, businesses, and public authorities. In this context, visitor-activity forecasts and sensor-based mobility data can contribute to more informed destination management by providing a clearer understanding of how public spaces are used throughout the day. Such information can support decisions related to service provision, mobility, accessibility, business activity, and future development.
6.1. Forecasting Visitor Activity in Historic Urban Districts
Addressing RQ1, the findings indicate that visitor activity in a historic urban district can be forecast with useful accuracy using sensor, weather, and calendar data. Among the evaluated models, Random Forest achieved the strongest overall forecasting performance, while GRU provided a competitive deep-learning alternative. ARIMA remained a useful and transparent statistical benchmark. Qualitative comparisons indicated that it reproduced the general daily pattern but was less responsive to abrupt changes in pedestrian activity than the machine-learning models, reflecting its reliance on historical observations rather than additional predictor variables.
The central finding of this study is that visitor activity in a small historic urban district can be forecast with useful accuracy using a combination of sensor, weather, and temporal data. These findings suggest that predictive analytics may support operational planning in smaller historic urban districts with limited resources, extending previous research that has focused primarily on large cities and major tourist destinations.
For destination managers, local businesses, and municipal authorities, the forecasting framework provides practical decision support for planning services, allocating resources, and coordinating day-to-day operations. Because the approach relies on sensor, weather, and temporal data that are already available or relatively easy for many municipalities to obtain, it is well suited to smaller destinations with limited analytical resources. Rather than requiring complex or proprietary data infrastructures, the framework can be integrated into routine operational planning and destination management.
6.2. Implications for Destination Management and Governance
Addressing RQ2, the findings suggest that 24-h-ahead visitor activity forecasts can support operational planning by informing staffing, service planning, mobility management, and stakeholder communication. The results also highlight an important trade-off between predictive accuracy and interpretability that destination managers should consider when selecting forecasting tools, particularly in public-sector contexts where forecasting-informed decisions must remain transparent and accountable.
The value of forecasting in historic urban districts is not limited to anticipating busy periods; it also lies in helping managers understand how the district functions as a shared space for residents, visitors, and businesses.
Table 2 summarizes the practical characteristics of the evaluated forecasting models. In addition to predictive accuracy, it compares their interpretability and potential operational applications, illustrating the trade-offs that destination managers should consider when selecting forecasting tools.
Table 2.
Practical comparison of the evaluated forecasting models for destination management.
Random Forest achieved the strongest overall forecasting performance, while GRU provided the second-lowest MAE among the evaluated models. Ridge Regression and Linear Regression offered a balance between predictive performance and interpretability, whereas ARIMA remained the most transparent statistical reference. The more complex models, particularly Random Forest and GRU, are more difficult to interpret than the statistical and linear approaches, illustrating the practical trade-off between predictive performance and explainability. For private organizations, this may be a smaller concern than for public authorities, which often need to justify decisions to residents, elected officials, and oversight bodies. A capacity limit or a road closure driven by a forecast no one can interrogate is harder to defend than one a manager can trace to weather, a holiday, or a scheduled event. Two practical responses follow. First, accuracy and explainability need not be an either-or choice: a smaller, interpretable model such as ARIMA or a linear baseline can run alongside the deep learning forecast as a transparent reference that managers and the public can reason about, with the higher-accuracy model used to flag the days that warrant closer attention. Second, post-hoc explanation tools and clear documentation of the input features can make machine learning outputs auditable enough for public-sector use. Treating interpretability as a governance requirement rather than a technical afterthought is, in our view, central to deploying predictive analytics responsibly in historic urban districts (Hollands, 2015; Kitchin, 2016; Zhou et al., 2021).
The significance of these findings extends beyond forecasting accuracy. Historic urban districts are not only places that attract visitors; they are also places where people live, work, and run businesses. Smart tourism research has long argued that successful destinations must balance the needs of visitors with those of residents while ensuring accessibility, mobility, and effective management. Previous studies have also shown that sustainability, destination competitiveness, and the long-term viability of historic tourism sites depend on understanding both visitor preferences and broader destination dynamics (Linnes et al., 2021, 2022a, 2022b).
In many historic urban districts, the challenge is not excessive visitor numbers but maintaining activity, supporting local businesses, and ensuring that the area remains attractive and usable for different groups of people. This is particularly relevant in districts where commercial activity has changed over time and where residents, visitors, businesses, and public authorities may have different expectations about future development. In this context, visitor-activity forecasts can help local authorities and destination managers better understand how the district is used throughout the day and across different conditions.
Such information can support decisions about services, events, mobility, and other planning activities. Rather than serving only as a tool for managing congestion, predictive analytics can help support the continued development and everyday functioning of historic urban districts. Pedestrian count data can also contribute to a better understanding of mobility and accessibility within historic urban districts. The sensor network used in this study provides insight into when and where people move through the district, helping identify streets, routes, and areas that experience different levels of activity throughout the day. The sensor data provide insight into how people move through the district, showing that some streets attract considerably more activity than others. Such differences can have important implications for local businesses, accessibility, and future planning decisions. Such information can support decisions related to pedestrian access, functions, service provision, and the allocation of municipal resources. In historic urban districts, where residents, visitors, and businesses often share the same public spaces, understanding movement patterns can help local authorities balance accessibility, quality of life, and economic activity while maintaining the character of the district.
From a management perspective, the results suggest that three practical recommendations emerge from this study. First, visitor-activity forecasts should be incorporated into routine operational planning to support staffing, service scheduling, and resource allocation. Second, forecasting outputs should be combined with sensor-based mobility data to better understand how visitors use different parts of the district and to identify opportunities to support local businesses and services. Third, forecasting systems should be implemented alongside transparent reporting and communication practices so that decisions informed by predictive models remain understandable and accountable to residents, businesses, and other stakeholders.
6.3. Concluding Remarks and Future Research
When used effectively, predictive analytics can help destination managers and local authorities move beyond simply monitoring visitor activity toward anticipating and planning for it. In these settings, where residents, visitors, businesses, and public authorities share the same urban space, short-term forecasting provides an opportunity to support more proactive, data-informed destination management. Although this study focused on the historic urban district of Fredrikstad, the forecasting framework relies on sensor, weather, and temporal data that are already available or relatively easy for many municipalities to obtain, making the approach applicable to similar historic urban districts.
This study has several limitations. It was conducted in a single historic urban district using approximately ten months of data, and no explicit event dataset was available. Consequently, the generalizability of the findings and the influence of local events on visitor activity could not be evaluated directly. Future research should investigate hybrid forecasting models that combine the predictive performance of machine-learning approaches with the transparency of statistical methods, evaluate the framework across multiple historic urban districts, and extend the observation period beyond a full year to capture complete seasonal variation. Incorporating event information and additional contextual variables would further improve understanding of how policy changes, special events, and environmental conditions influence visitor activity and forecasting performance.
By demonstrating that accurate short-term visitor forecasting is feasible in a resource-constrained historic urban district, this study contributes to the growing role of predictive analytics as a practical decision-support tool for smart, data-informed destination management.
Author Contributions
Conceptualization, C.L., G.R. and R.S.M.; methodology, C.L. and R.S.M.; validation, C.L., G.R., R.S.M., B.G., J.L. and J.A.; formal analysis, C.L., G.R., R.S.M., B.G., J.L. and J.A.; investigation, C.L., G.R. and R.S.M.; writing—original draft preparation, C.L., G.R. and R.S.M.; writing—review and editing, C.L., G.R., R.S.M., B.G., J.L. and J.A. All authors have read and agreed to the published version of the manuscript.
Funding
This research received no external funding.
Institutional Review Board Statement
Not applicable.
Informed Consent Statement
Not applicable.
Data Availability Statement
The data were obtained from the Tourist Authority. Any request can contact the corresponding author.
Conflicts of Interest
The authors declare no conflicts of interest.
Appendix A. Data Dictionary
Table A1.
Data dictionary.
Appendix B. Python-Style Pseudocode for the Forecasting Framework
Appendix B.1. Data Loading and Preprocessing
# Load hourly pedestrian-count and weather dataset
import pandas as pd
import numpy as np

dataset = pd.read_csv(
 “weather-traffic-dummy.csv”,
 index_col=“DateIndex”,
 parse_dates=True
)

dataset = dataset.sort_index()

precipitation_columns = [“rain_1h”, “snow_1h”]
for column in precipitation_columns:
 if column in dataset.columns:
 dataset[column] = dataset[column].fillna(0)

columns_to_drop = [“rain_3h”, “rain_24h”]
dataset = dataset.drop(columns=[c for c in columns_to_drop if c in dataset.columns])

dataset = pd.get_dummies(
 dataset,
 columns=[“weather_description”],
 prefix=“weather”,
 dtype=int
)

predictor_columns = sensor_columns + weather_columns + weather_indicator_columns + temporal_columns
Appendix B.2. Target Construction, Chronological Split, and Scaling
SHIFT_HOURS = 24
target_column = “target_24h”

dataset[target_column] = dataset[“Totalt”].shift(-SHIFT_HOURS)
dataset = dataset.dropna(subset=[target_column])

X = dataset[predictor_columns]
y = dataset[target_column]

split_index = int(len(dataset) * 0.90)

X_train = X.iloc[:split_index]
X_test = X.iloc[split_index:]
y_train = y.iloc[:split_index]
y_test = y.iloc[split_index:]

from sklearn.preprocessing import MinMaxScaler

X_scaler = MinMaxScaler()
y_scaler = MinMaxScaler()

X_train_scaled = X_scaler.fit_transform(X_train)
X_test_scaled = X_scaler.transform(X_test)

y_train_scaled = y_scaler.fit_transform(y_train.to_numpy().reshape(−1,1)).ravel()
y_test_scaled = y_scaler.transform(y_test.to_numpy().reshape(−1,1)).ravel()
Appendix B.3. Conventional Machine-Learning Models
from sklearn.model_selection import TimeSeriesSplit, RandomizedSearchCV

time_series_cv = TimeSeriesSplit(n_splits=5)

# Tune hyperparameters using training data only
# Retrain best model on complete training set
# Evaluate once on untouched chronological test set
Appendix B.4. GRU Model
# Create sequential samples
X_train_seq, y_train_seq = create_sequences(
 X_train_scaled,
 y_train_scaled,
 sequence_length=24
)

# Select best architecture using BOHB
best_configuration = BOHB_search(…)

# Train final GRU
gru_model.fit(
 X_train_seq,
 y_train_seq,
 validation_split=0.20,
 shuffle=False
)
scaled_predictions = gru_model.predict(X_test_seq)
Appendix B.5. Seasonal Naïve Baseline
# Predict each hour using the corresponding
# observation from the previous day

seasonal_naive_predictions = dataset[“Totalt”].shift(24)

seasonal_naive_test = seasonal_naive_predictions.loc[test_index]
Appendix B.6. Model Evaluation
from sklearn.metrics import (
 mean_squared_error,
 mean_absolute_error
)

predictions = y_scaler.inverse_transform(
 scaled_predictions.reshape(−1,1)
).ravel()

mse = mean_squared_error(y_test, predictions)
rmse = np.sqrt(mse)
mae = mean_absolute_error(y_test, predictions)

print(mse, rmse, mae)
Appendix C. Final GRU Architecture and Hyperparameter Configuration
This appendix summarizes the final hyperparameter configuration selected through Bayesian Optimization HyperBand (BOHB) using time-aware validation on the training dataset. The selected configuration was used to train the final GRU model evaluated in the 24 h-ahead pedestrian-count forecasting experiments reported in the manuscript.
Table A2.
Final GRU architecture and training configuration.
References
- Agrusa, J. (1994). Group tours in Hawaii; a survey and analysis. Annals of Tourism Research, 21(1), 146–147. [Google Scholar] [CrossRef] [Scilit]
- Akdu, U. (2020). Smart tourism: Issues, challenges and opportunities. In The emerald handbook of ICT in tourism and hospitality (pp. 291–308). Emerald Publishing Limited. [Google Scholar]
- Albino, V., Berardi, U., & Dangelico, R. M. (2015). Smart cities: Definitions, dimensions, performance, and initiatives. Journal of Urban Technology, 22(1), 3–21. [Google Scholar] [CrossRef] [Scilit]
- Alotaibi, E. (2020). Application of machine learning in the hotel industry: A critical review. Journal of Association of Arab Universities for Tourism and Hospitality, 18(3), 78–96. [Google Scholar]
- Appio, F. P., Lima, M., & Paroutis, S. (2019). Understanding smart cities: Innovation ecosystems, technological advancements, and societal challenges. Technological Forecasting and Social Change, 142, 1–14. [Google Scholar] [CrossRef] [Scilit]
- Batty, M., Axhausen, K. W., Giannotti, F., Pozdnoukhov, A., Bazzani, A., Wachowicz, M., Ouzounis, G., & Portugali, Y. (2012). Smart cities of the future. The European Physical Journal Special Topics, 214, 481–518. [Google Scholar] [CrossRef] [Scilit]
- Bibri, S. E., & Krogstie, J. (2017). Smart sustainable cities of the future: An extensive interdisciplinary literature review. Sustainable Cities and Society, 31, 183–212. [Google Scholar] [CrossRef] [Scilit]
- Boes, K., Buhalis, D., & Inversini, A. (2016). Smart tourism destinations: Ecosystems for tourism destination competitiveness. International Journal of Tourism Cities, 2(2), 108–124. [Google Scholar] [CrossRef] [Scilit]
- Borchani, H., Varando, G., Bielza, C., & Larranaga, P. (2015). A survey on multi-output regression. Wiley Interdisciplinary Reviews: Data Mining and Knowledge Discovery, 5(5), 216–233. [Google Scholar] [CrossRef] [Scilit]
- Britannica. (2026). Fredrikstad. Encyclopaedia Britannica. Available online: https://www.britannica.com/place/Fredrikstad (accessed on 15 June 2026).
- Buhalis, D., & O’Connor, P. (2005). Information communication technology revolutionizing tourism. Tourism Recreation Research, 30(3), 7–16. [Google Scholar] [CrossRef] [Scilit]
- Bygrave, L. A. (2017). Data protection by design and by default: Deciphering the EU’s legislative requirements. Oslo Law Review, 4(2), 105–120. [Google Scholar] [CrossRef] [Scilit]
- Caragliu, A., Del Bo, C., & Nijkamp, P. (2011). Smart cities in Europe. Journal of Urban Technology, 18(2), 65–82. [Google Scholar] [CrossRef] [Scilit]
- Caragliu, A., Del Bo, C., & Nijkamp, P. (2013). Smart cities in Europe. In Creating smarter cities (pp. 65–82). Routledge. [Google Scholar]
- Cavalheiro, M. B., Joia, L. A., & Cavalheiro, G. M. D. C. (2020). Towards a smart tourism destination development model: Promoting environmental, economic, socio-cultural and political values. Tourism Planning & Development, 17(3), 237–259. [Google Scholar]
- Chan, B. (2024, December 2). The smart city ecosystem framework—A model for planning smart cities. IoT For All. Available online: https://www.iotforall.com/smart-city-ecosystem-framework-model-for-planning-smart-cities (accessed on 15 June 2026).
- Chang, K. Y., Chen, C. D., & Ku, E. C. (2024). Enhancing smart tourism and smart city development: Evidence from Taoyuan smart aviation city in Taiwan. International Journal of Tourism Cities, 10(1), 146–165. [Google Scholar]
- Chen, J., Li, X., Chen, J., Xu, L., Feng, H., & Zhu, R. (2025). Identifying and prioritising public space demands in historic districts: Perspectives from tourists and local residents in Yangzhou. Land, 14(9), 1921. [Google Scholar] [CrossRef] [Scilit]
- Cherenkov, E., Benga, V., Lee, M., Nandwani, N., Raguin, K., Sueur, M. C., & Sun, G. (2024). From machine learning algorithms to superior customer experience: Business implications of machine learning-driven data analytics in the hospitality industry. Journal of Smart Tourism, 4(2), 5–14. [Google Scholar] [CrossRef] [Scilit]
- Chourabi, H., Nam, T., Walker, S., Gil-Garcia, J. R., Mellouli, S., Nahon, K., Pardo, T. A., & Scholl, H. J. (2012, January). Understanding smart cities: An integrative framework. In Proceedings of the 45th Hawaii international conference on system sciences (HICSS-45) (pp. 2289–2297). IEEE. [Google Scholar] [CrossRef] [Scilit]
- City and County of Honolulu, Department of Parks and Recreation. (2026). Hanauma bay nature preserve. Available online: https://www.honolulu.gov/dpr/hanauma-bay-nature-preserve/ (accessed on 15 June 2026).
- Dameri, R. P. (2013). Searching for smart city definition: A comprehensive proposal. International Journal of Computers & Technology, 11(5), 2544–2551. [Google Scholar] [CrossRef] [Scilit]
- Della Corte, V., D’Andrea, C., Savastano, I., & Zamparelli, P. (2017). Smart cities and destination management: Impacts and opportunities for tourism competitiveness. European Journal of Tourism Research, 17, 7–27. [Google Scholar] [CrossRef] [Scilit]
- Gajdošík, T. (2022). Smart tourism destination governance technology and design-based approach. Routledge. [Google Scholar] [CrossRef] [Scilit]
- Giffinger, R., Fertner, C., Kramar, H., Kalasek, R., Pichler-Milanović, N., & Meijers, E. (2007). Smart cities: Ranking of European medium-sized cities. Centre of Regional Science, Vienna University of Technology. Available online: https://www.smart-cities.eu/download/smart_cities_final_report.pdf (accessed on 15 June 2026).
- Gretzel, U., Sigala, M., Xiang, Z., & Koo, C. (2015). Smart tourism: Foundations and developments. Electronic Markets, 25(3), 179–188. [Google Scholar] [CrossRef] [Scilit]
- Gričar, S. (2023). Tourism forecasting of “unpredictable” future shocks. Journal of Risk and Financial Management, 16(12), 493. [Google Scholar] [CrossRef] [Scilit]
- Hollands, R. G. (2015). Critical interventions into the corporate smart city. Cambridge Journal of Regions, Economy and Society, 8(1), 61–77. [Google Scholar] [CrossRef] [Scilit]
- Jamal, H., Algeelani, N. A., & Al-Sammarraie, N. (2024). Safeguarding data privacy: Strategies to counteract internal and external hacking threats. Computer Science and Information Technologies, 5(1), 46–54. [Google Scholar] [CrossRef] [Scilit]
- Kairouz, P., McMahan, H. B., Avent, B., Bellet, A., Bennis, M., Bhagoji, A. N., Bonawitz, K., Charles, Z., Cormode, G., Cummings, R., D’Oliveira, R. G. L., Eichner, H., El Rouayheb, S., Evans, D., Gardner, J., Garrett, Z., Gascón, A., Ghazi, B., Gibbons, P. B., … Zhao, S. (2021). Advances and open problems in federated learning. Foundations and Trends in Machine Learning, 14(1–2), 1–210. [Google Scholar] [CrossRef] [Scilit]
- Kitchin, R. (2014). The real-time city? Big data and smart urbanism. GeoJournal, 79(1), 1–14. [Google Scholar] [CrossRef] [Scilit]
- Kitchin, R. (2016). The ethics of smart cities and urban science. Philosophical Transactions of the Royal Society A: Mathematical, Physical and Engineering Sciences, 374(2083), 20160115. [Google Scholar] [CrossRef] [Scilit] [PubMed]
- Koh, E., & Fakfare, P. (2020). Overcoming “over-tourism”: The closure of Maya Bay. International Journal of Tourism Cities, 6(2), 279–296. [Google Scholar] [CrossRef] [Scilit]
- Komninos, N. (2013). Intelligent cities: Innovation, knowledge systems and digital spaces. Routledge. [Google Scholar] [CrossRef] [Scilit]
- Kourtit, K., Nijkamp, P., & Stimson, R. (Eds.). (2020). The routledge handbook of smart cities. Routledge. [Google Scholar]
- Lai, C. S., Jia, Y., Dong, Z., Wang, D., Tao, Y., Lai, Q. H., Wong, R. T. K., Zobaa, A. F., Wu, R., & Lai, L. L. (2020). A review of technical standards for smart cities. Clean Technologies, 2(3), 290–310. [Google Scholar] [CrossRef] [Scilit]
- Leonard, M. (2025, May 14). Honolulu eyes changes to Hanauma Bay reservation system. Honolulu Civil Beat. Available online: https://www.civilbeat.org/2025/05/hanauma-bay-reservation-system-major-overhaul (accessed on 15 June 2026).
- Linnes, C., Agrusa, J., Ronzoni, G., & Lema, J. (2022a). What tourists want, a sustainable paradise. Tourism and Hospitality, 3(1), 164–183. [Google Scholar] [CrossRef] [Scilit]
- Linnes, C., Itoga, H., Agrusa, J., & Lema, J. (2021). Sustainable tourism empowered by social network analysis to gain a competitive edge at a historic site. Tourism and Hospitality, 4(2), 332–346. [Google Scholar] [CrossRef] [Scilit]
- Linnes, C., Weinland, J. T., Ronzoni, G., Lema, J., & Agrusa, J. (2022b). The local food supply, willingness to pay and the sustainability of an island destination. Journal of Hospitality and Tourism Insights, 6(3), 1328–1356. [Google Scholar] [CrossRef] [Scilit]
- Lu, C. W., Huang, J. C., Chen, C., Shu, M. H., Hsu, C. W., & Bapu, B. T. (2021). An energy-efficient smart city for sustainable green tourism industry. Sustainable Energy Technologies and Assessments, 47, 101494. [Google Scholar] [CrossRef] [Scilit]
- Meijer, A. J., Gil-Garcia, J. R., & Bolívar, M. P. R. (2016). Smart city research: Contextual conditions, governance models, and public value assessment. Social Science Computer Review, 34(6), 647–656. [Google Scholar]
- Miah, S. J., Vu, H. Q., Gammack, J., & McGrath, M. (2017). A big data analytics method for tourist behaviour analysis. Information & Management, 54(6), 771–785. [Google Scholar] [CrossRef] [Scilit]
- Mora, L., Deakin, M., & Reid, A. (2019). Strategic principles for smart city development. Technological Forecasting and Social Change, 142, 61–74. [Google Scholar] [CrossRef] [Scilit]
- Nam, T., & Pardo, T. A. (2011). Conceptualizing smart city with dimensions of technology, people, and institutions. In Proceedings of the 12th annual international digital government research conference (pp. 282–291). ACM. [Google Scholar] [CrossRef] [Scilit]
- Pennybacker, M. (2020, December 3). Visitors welcomed back to Hanauma Bay with new fees and restrictions. Star Advertiser. Available online: https://www.staradvertiser.com/2020/12/03/hawaii-news/visitors-welcomed-back-to-hanauma-bay-with-new-fees-and-restrictions (accessed on 15 June 2026).
- Politou, E., Alepis, E., Virvou, M., & Patsakis, C. (2022). Privacy and data protection challenges in the distributed era (Vol. 26, pp. 1–185). Springer. [Google Scholar]
- Rithdee, K. (2022, January 13). Return to paradise. Bangkok Post. Available online: https://www.bangkokpost.com/life/travel/2246735/return-to-paradise (accessed on 15 June 2026).
- Song, H., Qiu, R. T., & Park, J. (2019). A review of research on tourism demand forecasting: Launching the annals of tourism research curated collection on tourism demand forecasting. Annals of Tourism Research, 75, 338–362. [Google Scholar] [CrossRef] [Scilit]
- Toli, A. M., & Murtagh, N. (2020). The concept of sustainability in smart city definitions. Frontiers in Built Environment, 6, 77. [Google Scholar] [CrossRef] [Scilit]
- Townsend, A. M. (2013). Smart cities: Big data, civic hackers, and the quest for a new utopia. WW Norton & Company. [Google Scholar]
- Vanolo, A. (2014). Smartmentality: The smart city as disciplinary strategy. Urban Studies, 51(5), 883–898. [Google Scholar] [CrossRef] [Scilit]
- Visit Norway. (2026). Fredrikstad and hvaler: Summer charm in a historical setting. Visit Norway. Available online: https://www.visitnorway.com/places-to-go/eastern-norway/fredrikstad/ (accessed on 15 June 2026).
- Walters, T. (2020). Resolution 20–207: Urging the city administration to establish a visitor reservation system for the hanauma bay nature preserve. City and County of Honolulu. Available online: https://hnldoc.ehawaii.gov/hnldoc/document-download?id=7436 (accessed on 15 June 2026).
- Wright, G., Shea, S., & Burns, E. (2025, March 4). What is a smart city?|Definition from TechTarget. TechTarget. Available online: https://www.techtarget.com/iotagenda/definition/smart-city (accessed on 15 June 2026).
- Zhou, J., Gandomi, A. H., Chen, F., & Holzinger, A. (2021). Evaluating the quality of machine learning explanations: A survey on methods and metrics. Electronics, 10(5), 593. [Google Scholar] [CrossRef] [Scilit]
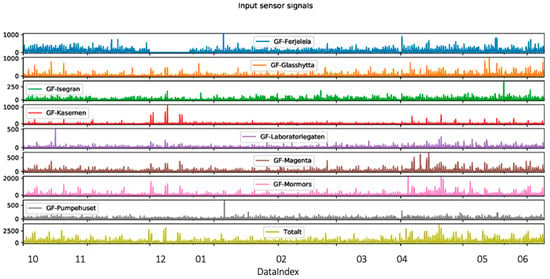
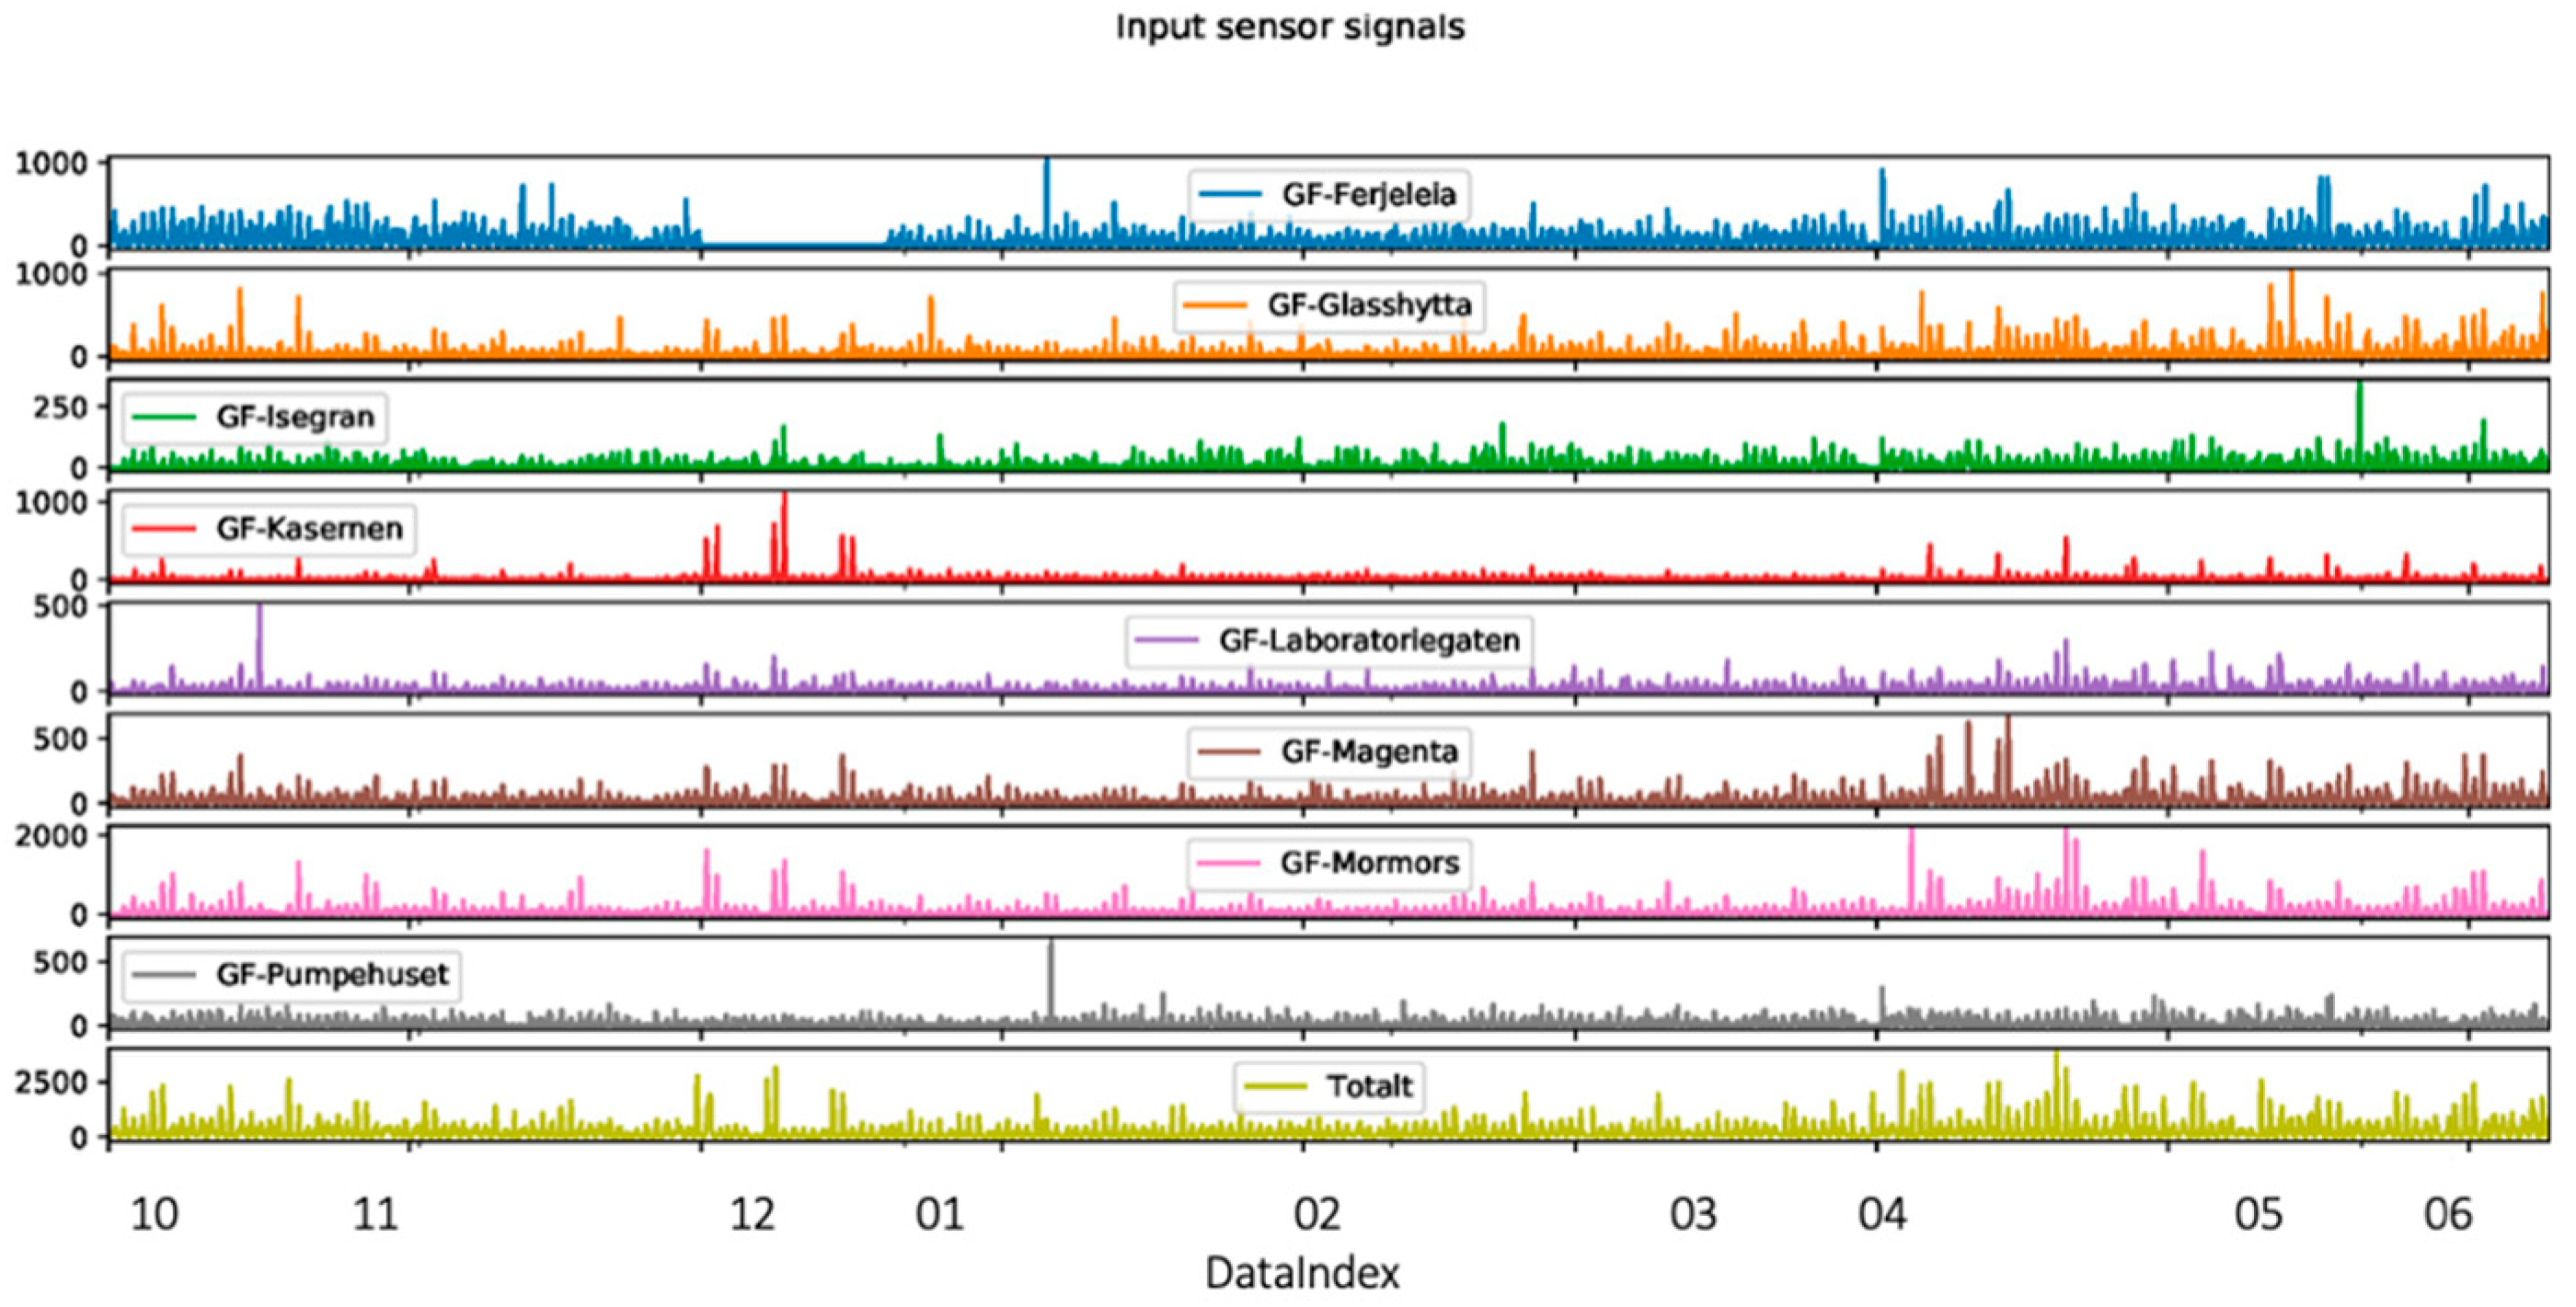
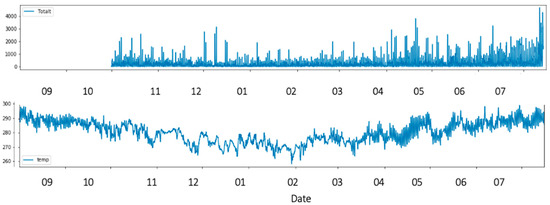
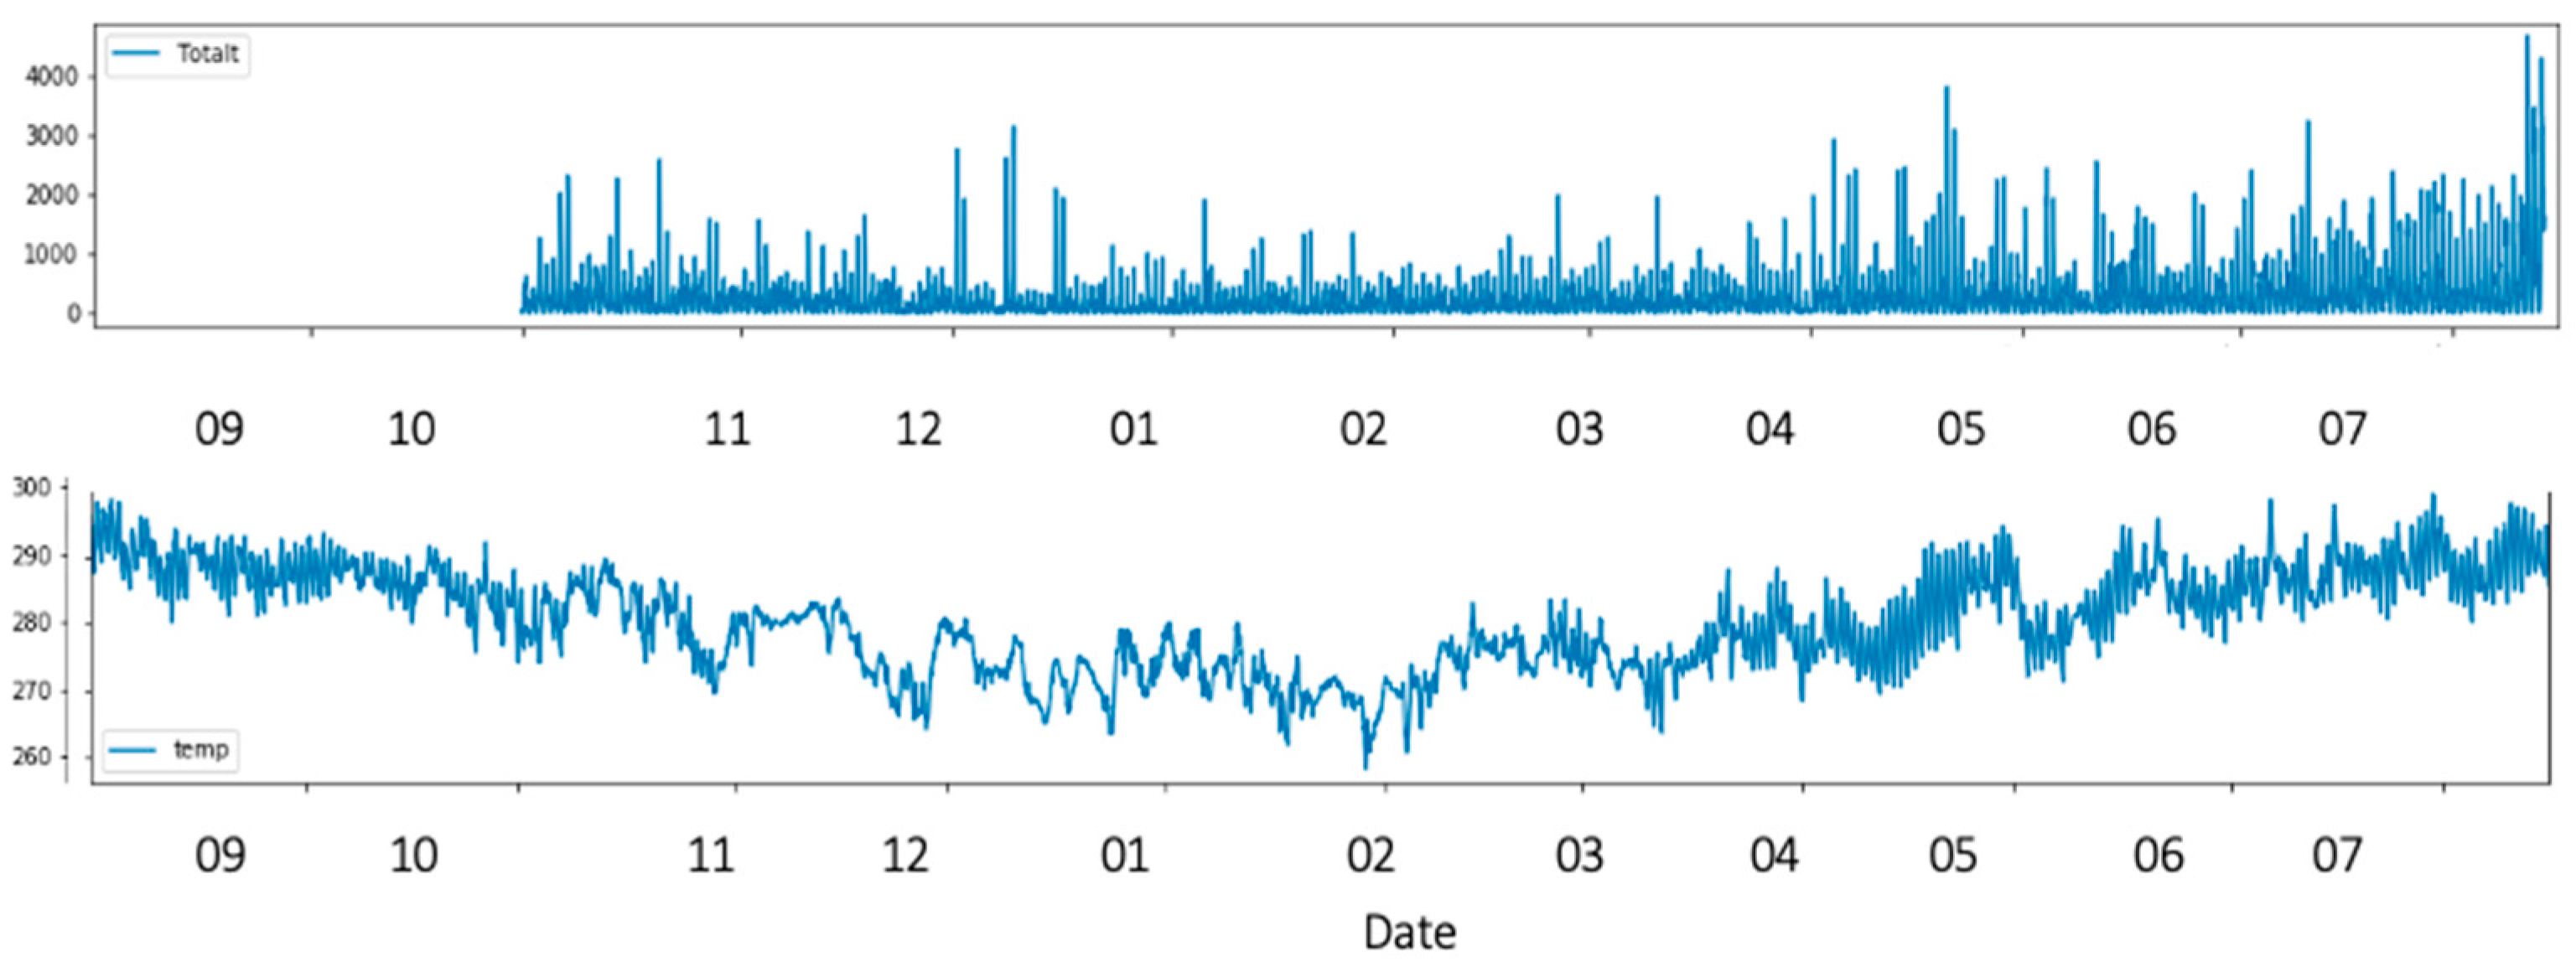
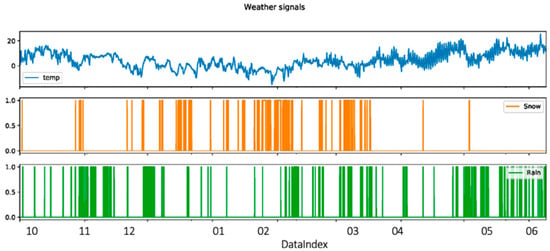
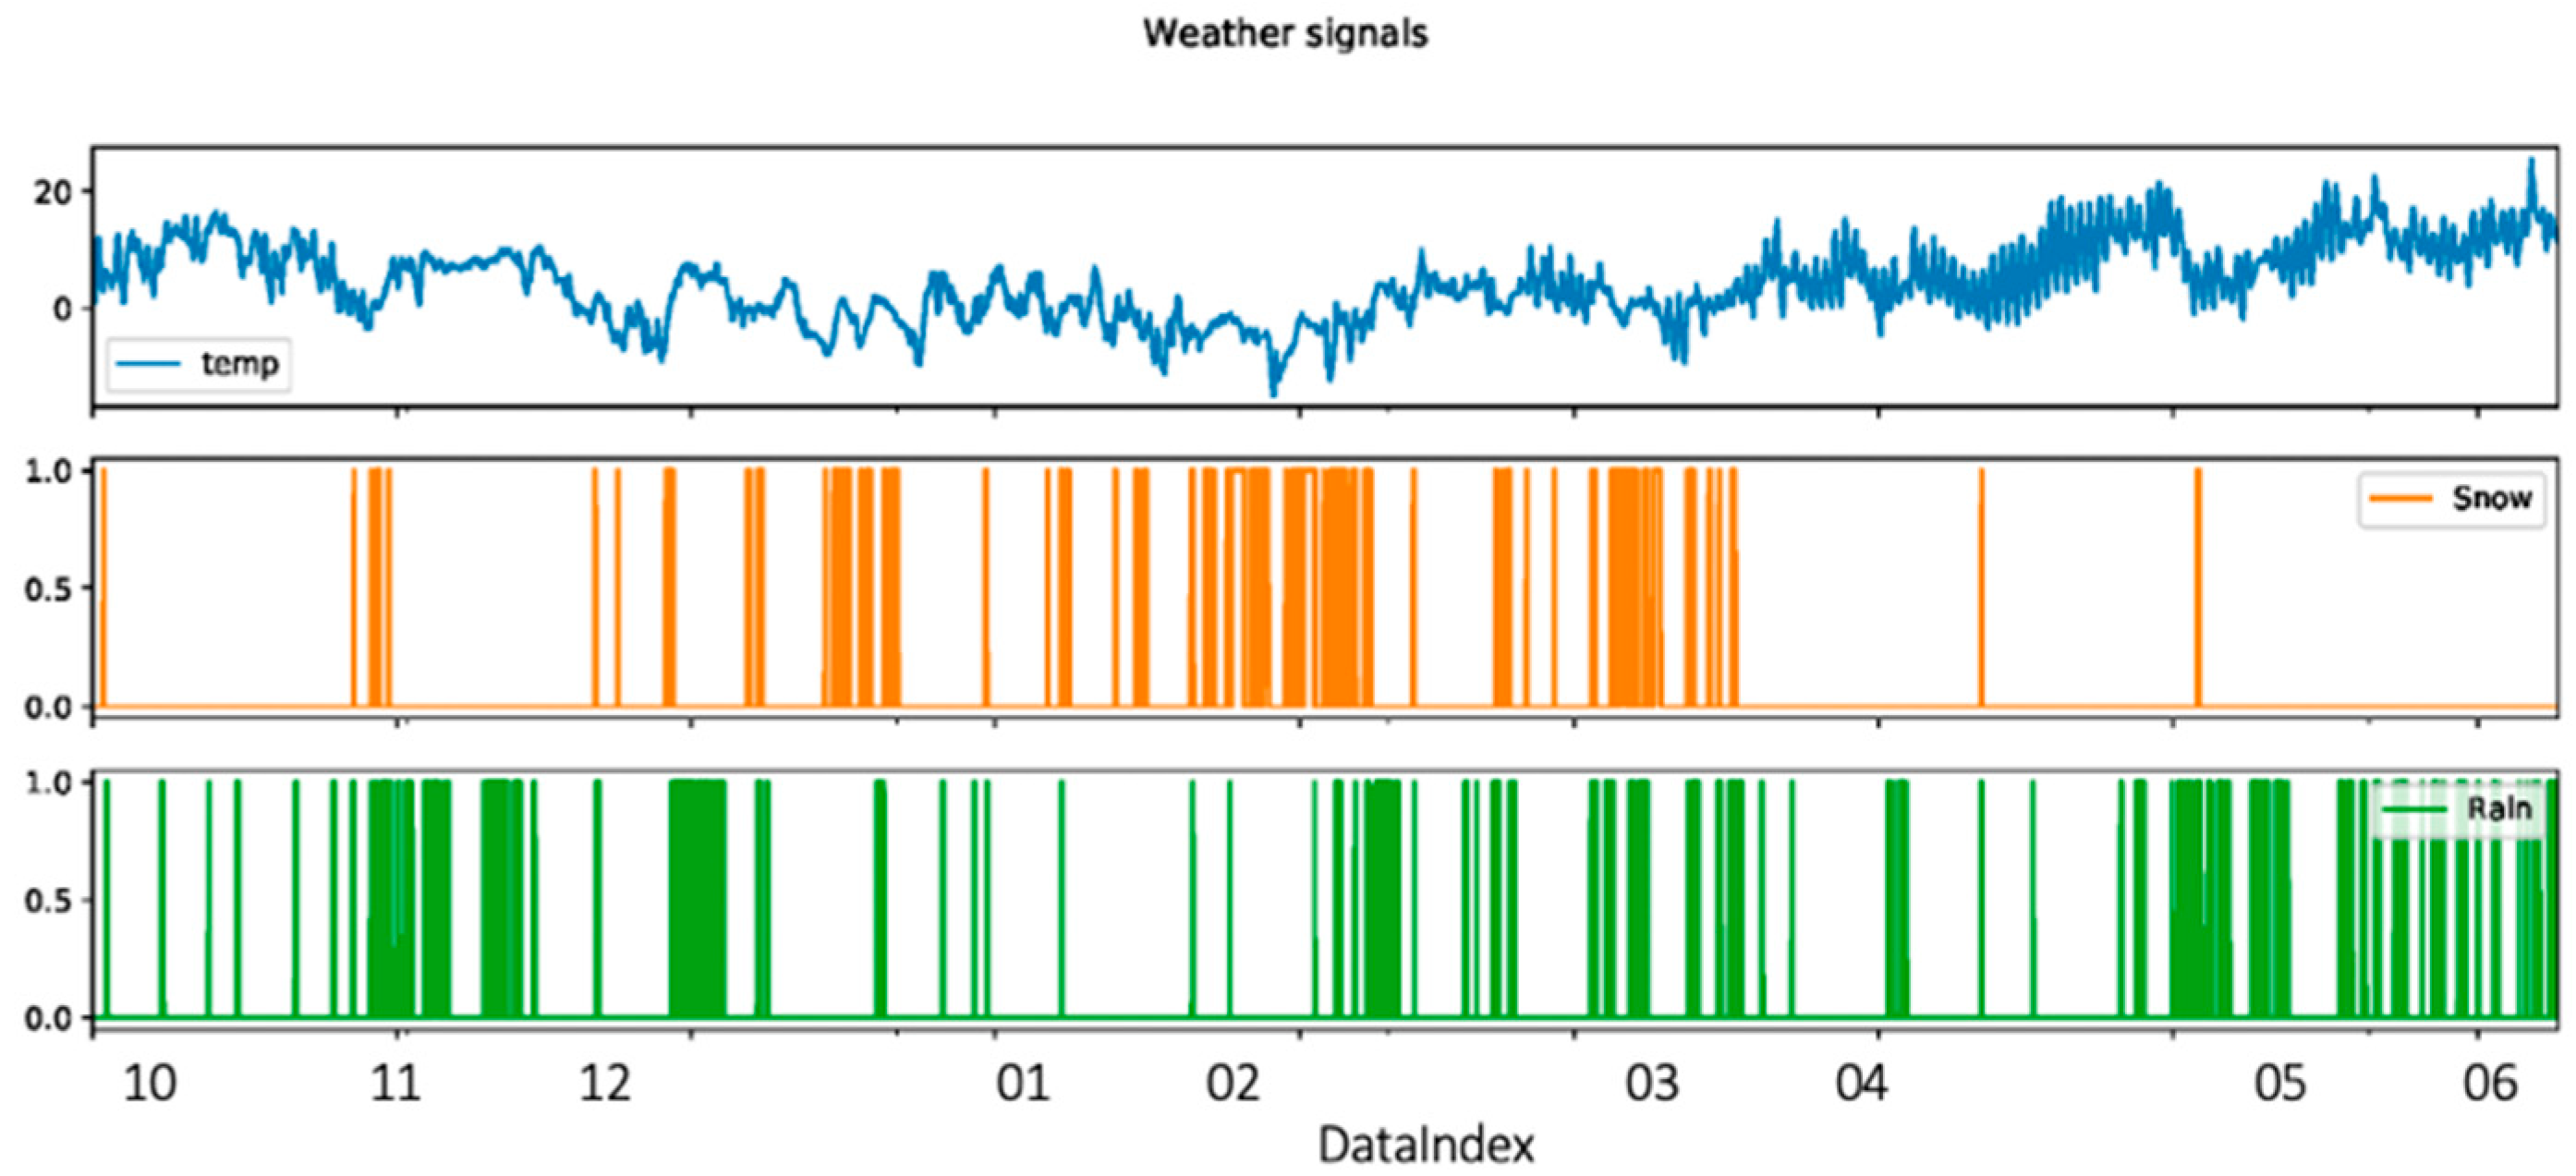
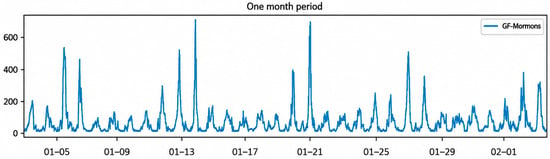
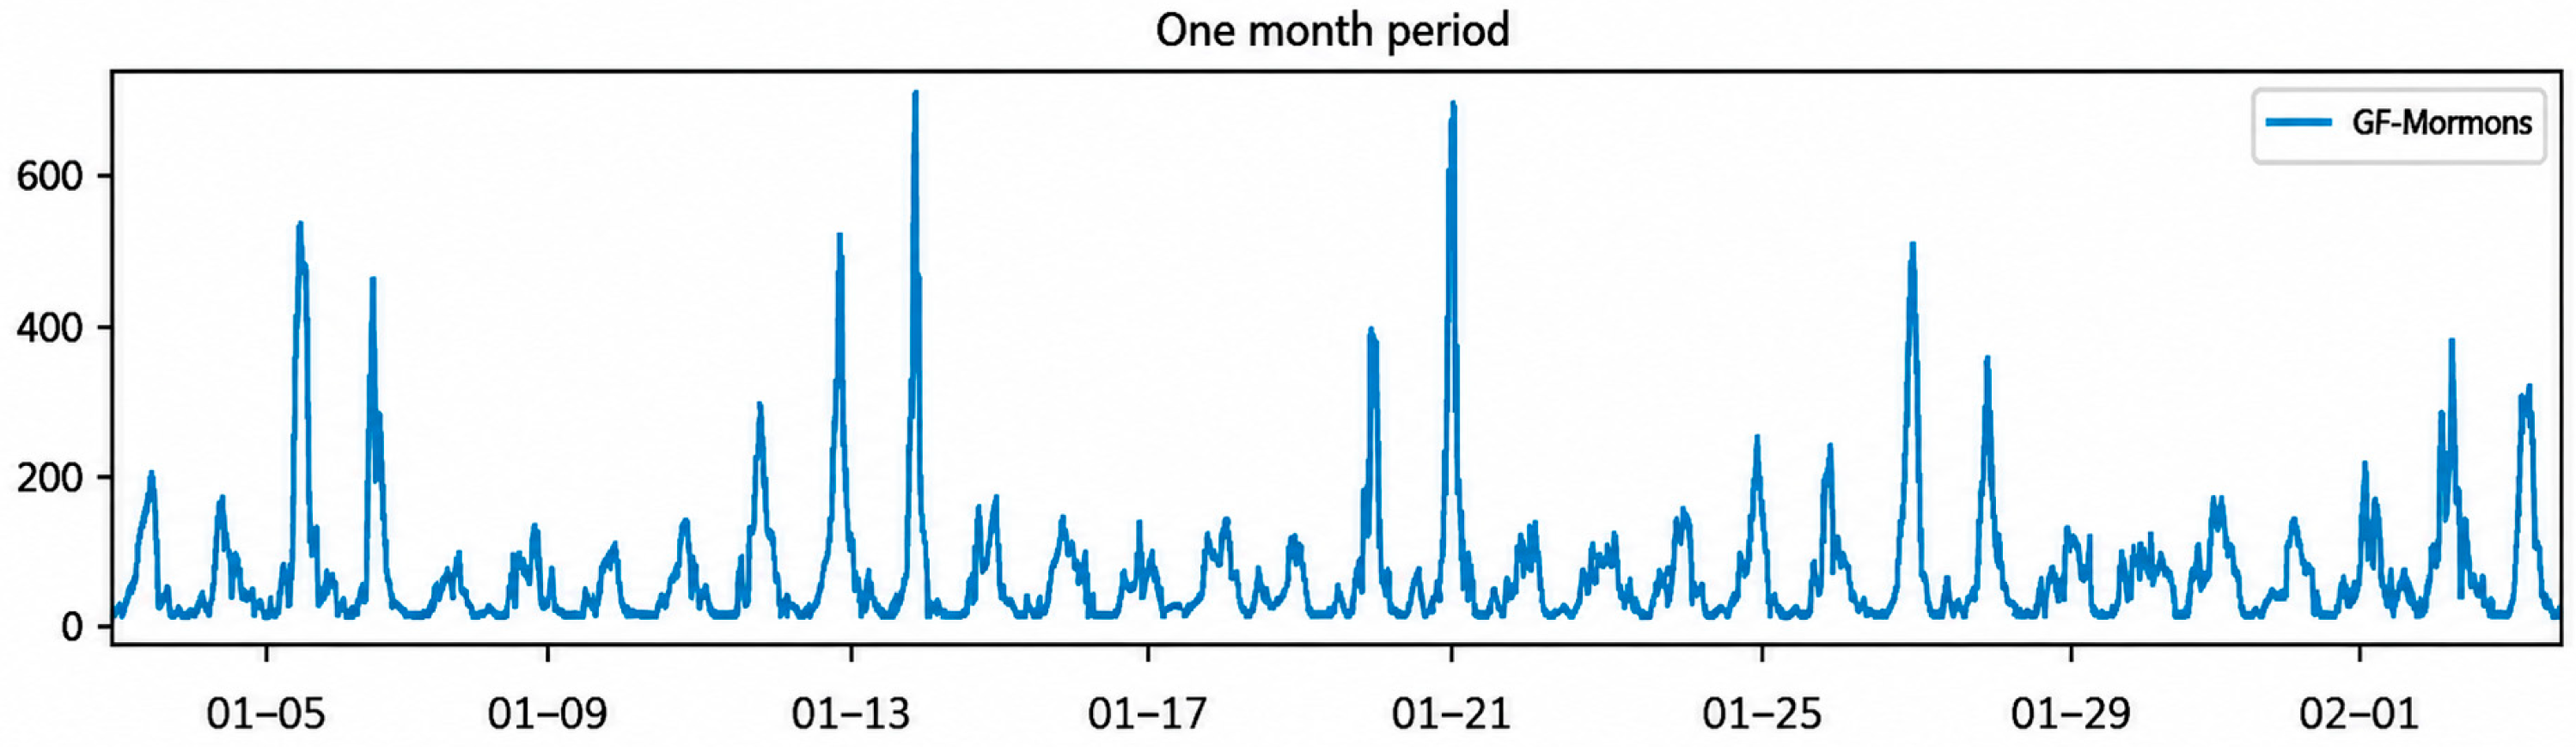
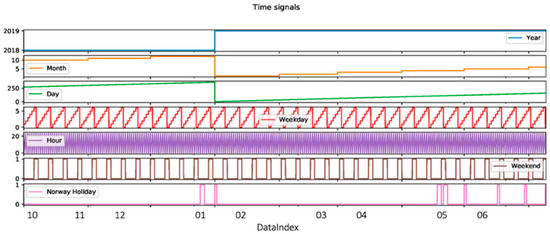
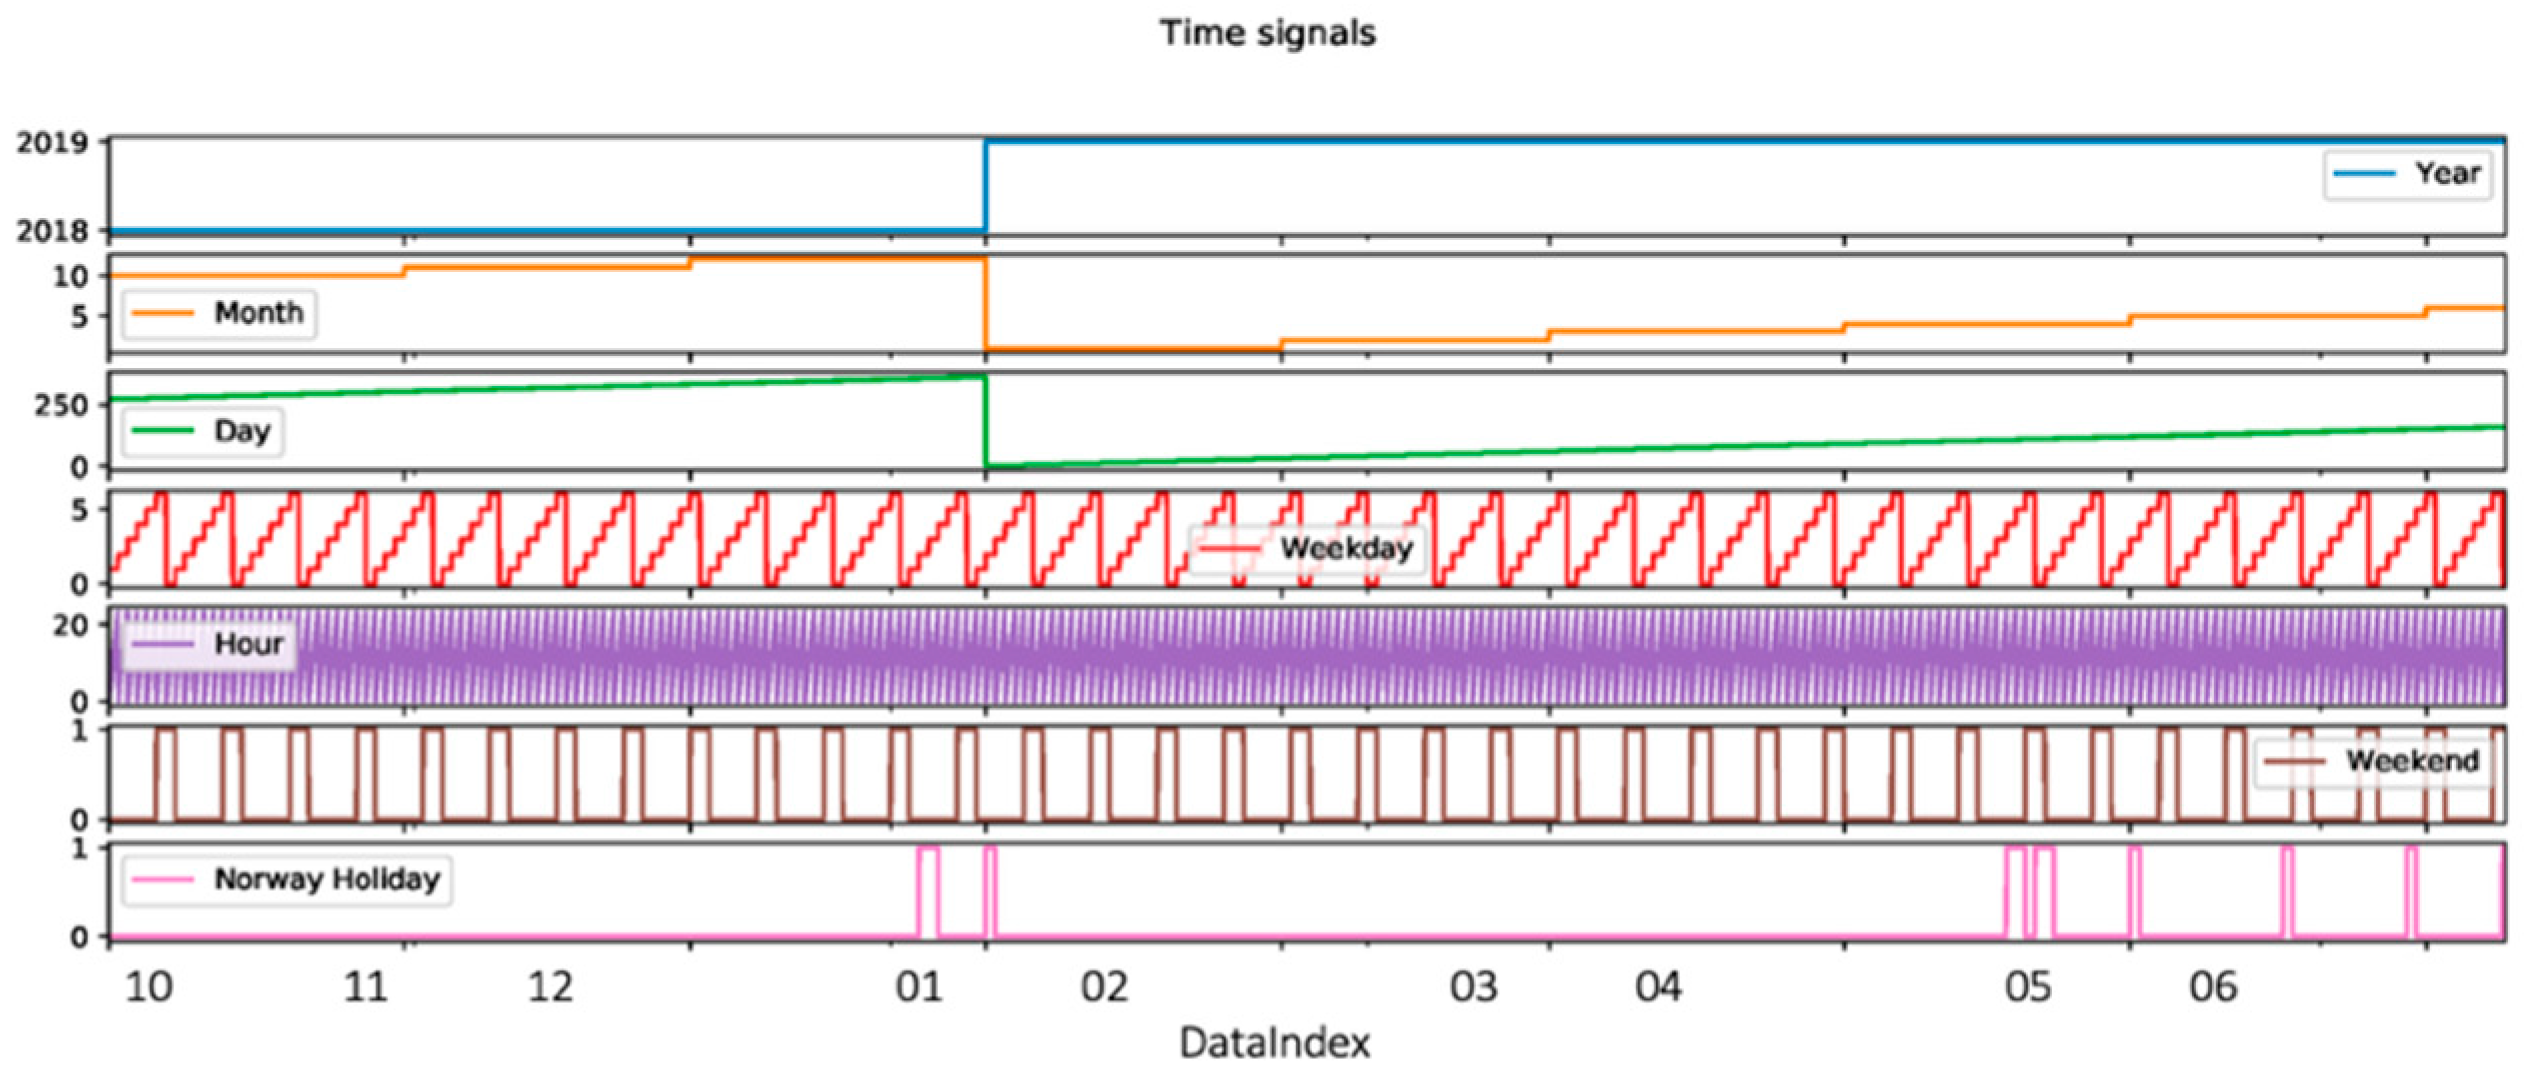
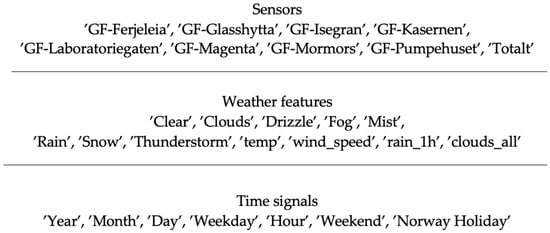
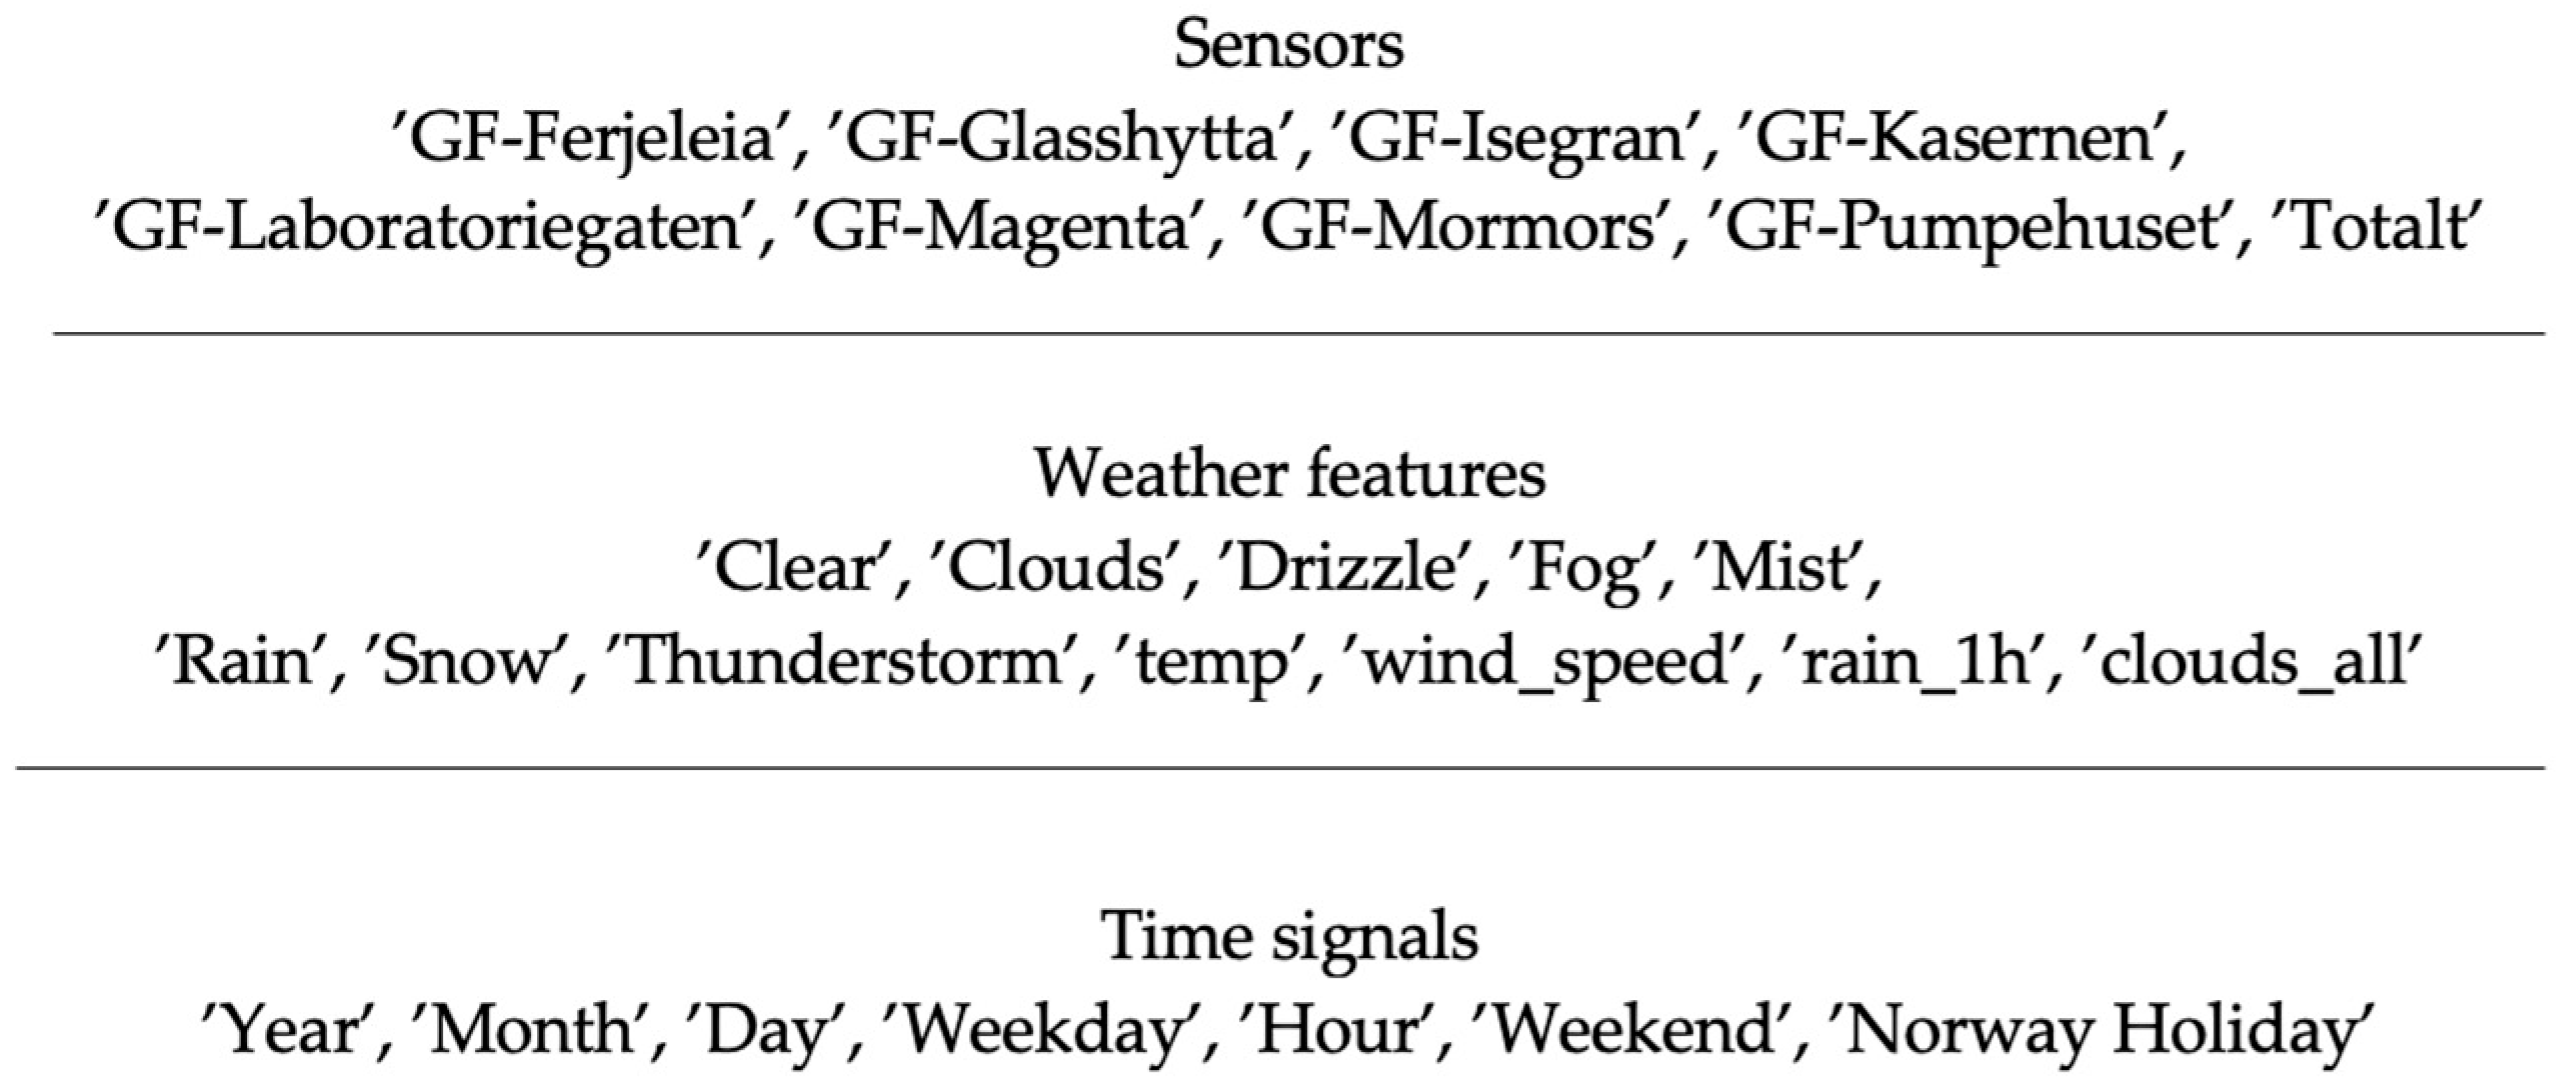
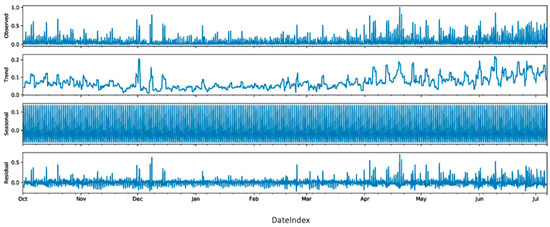
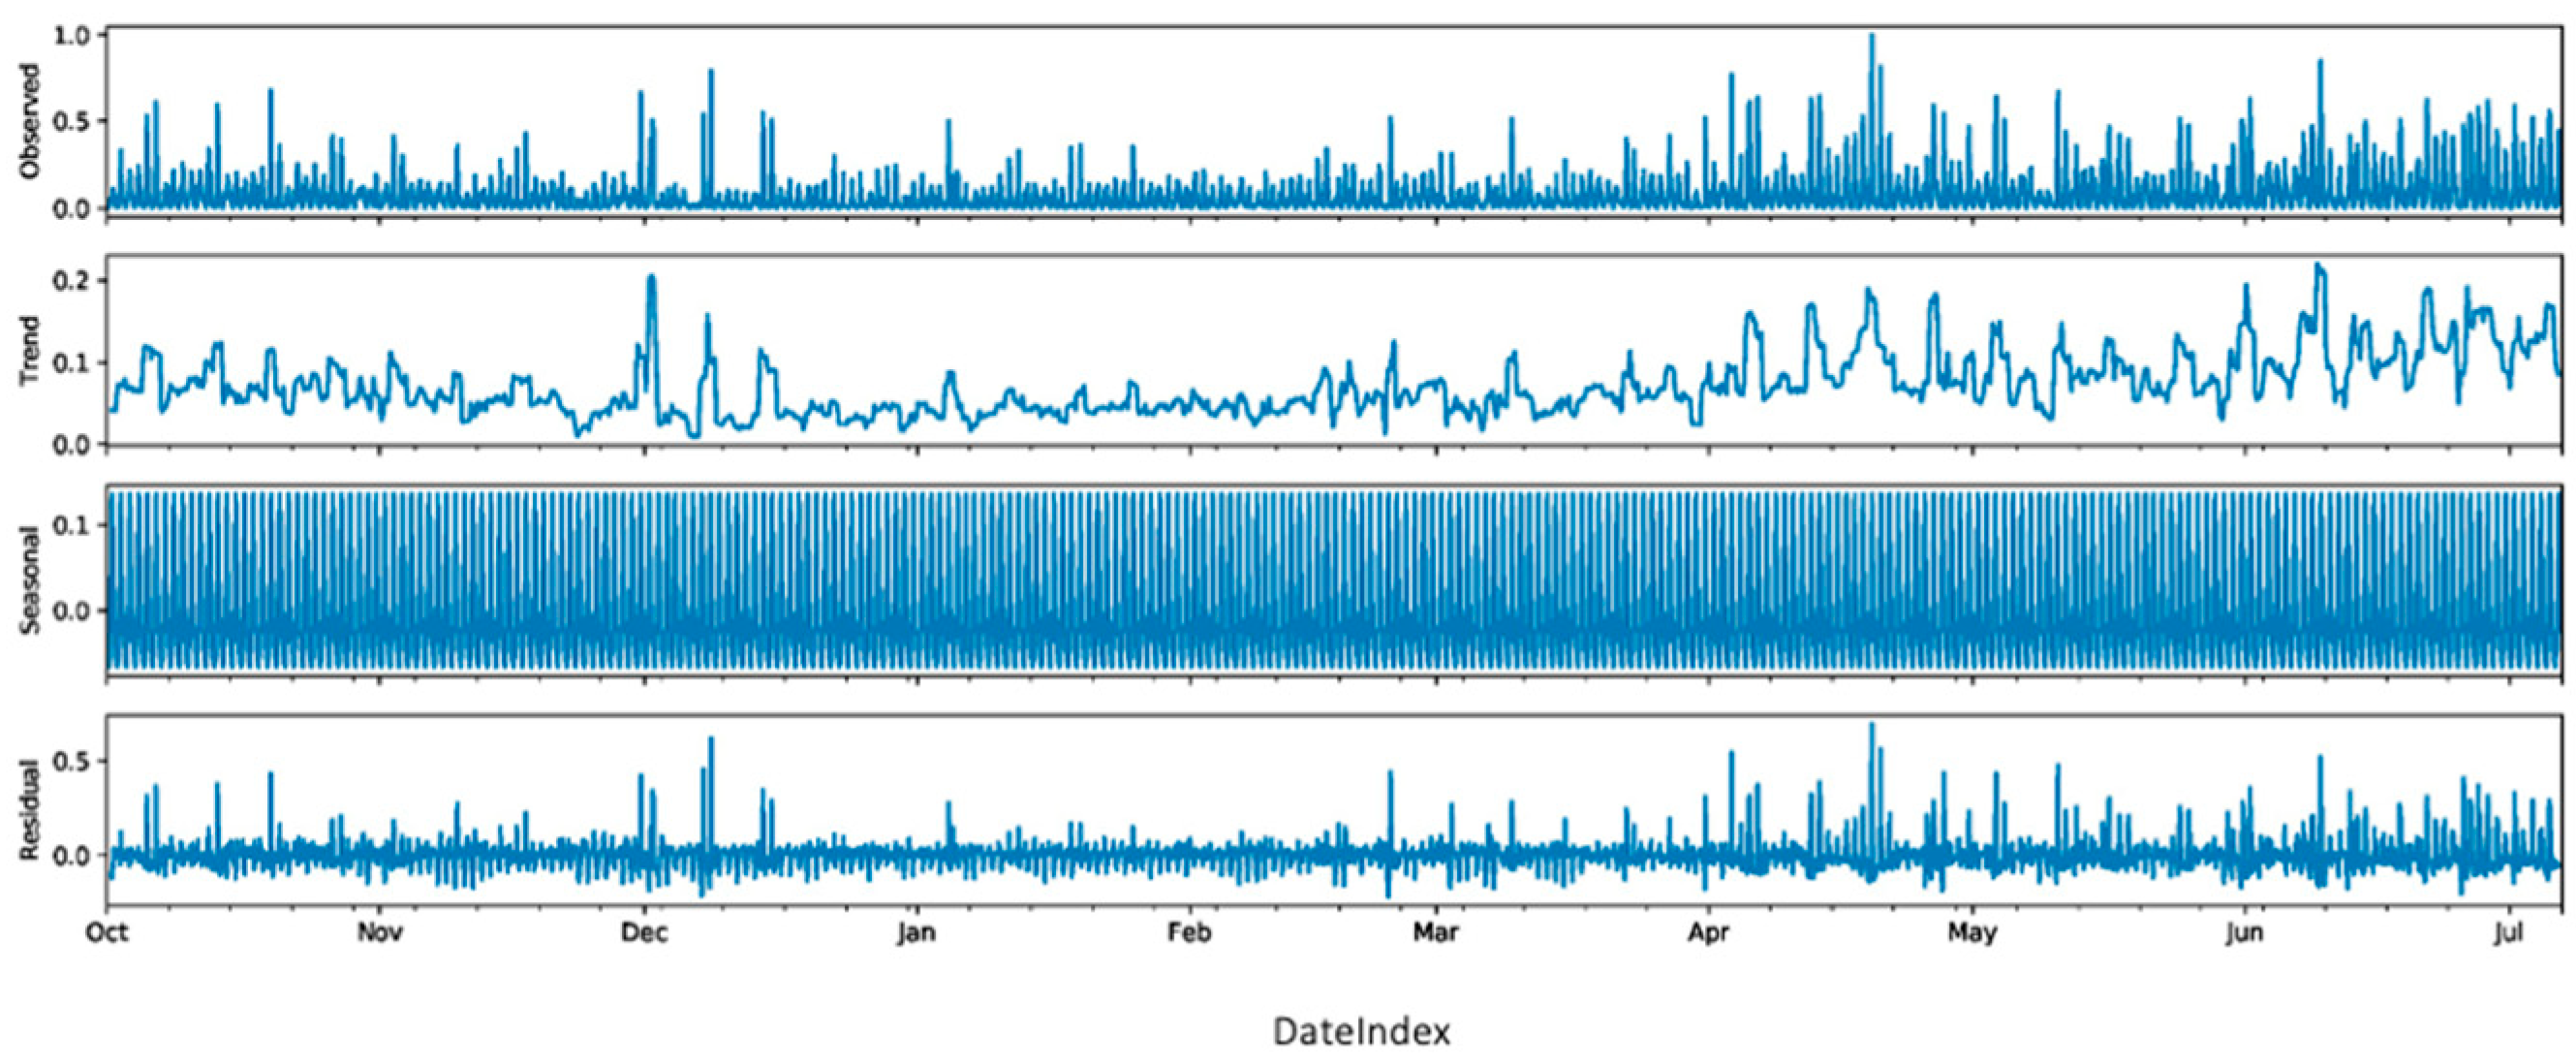
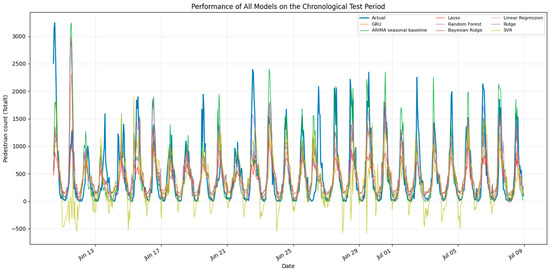
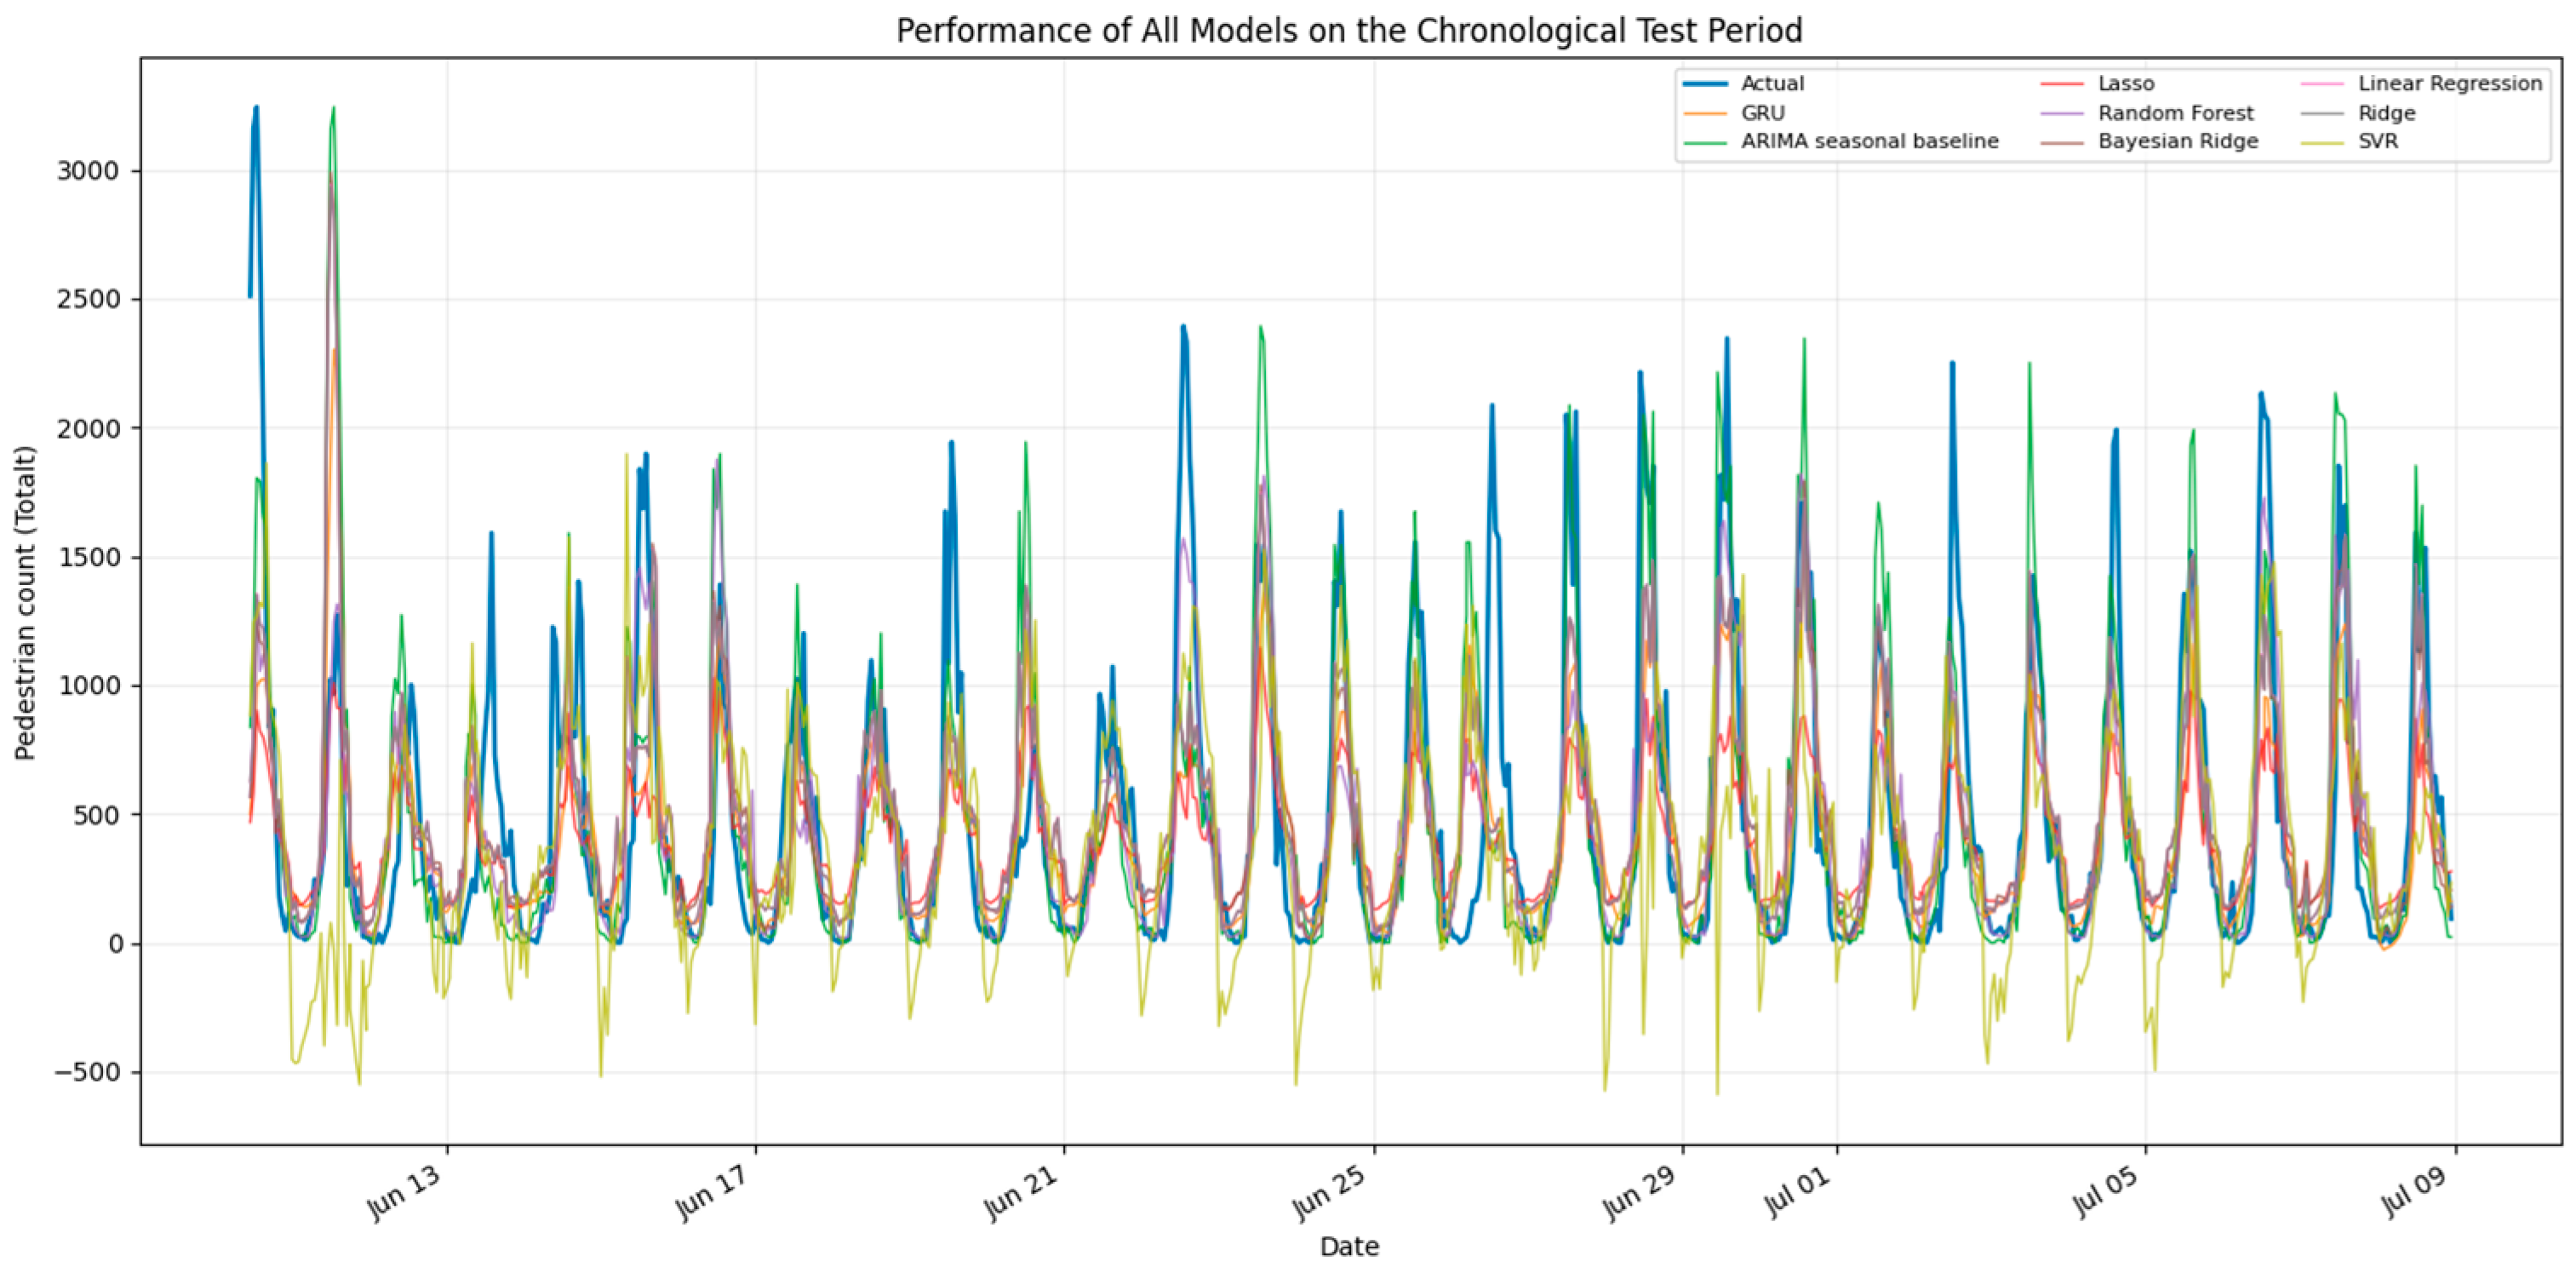
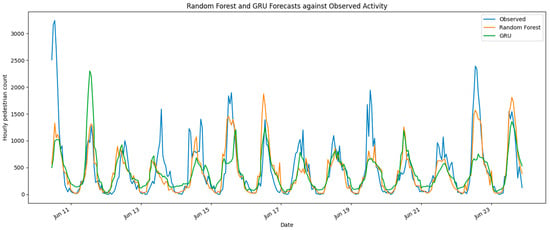
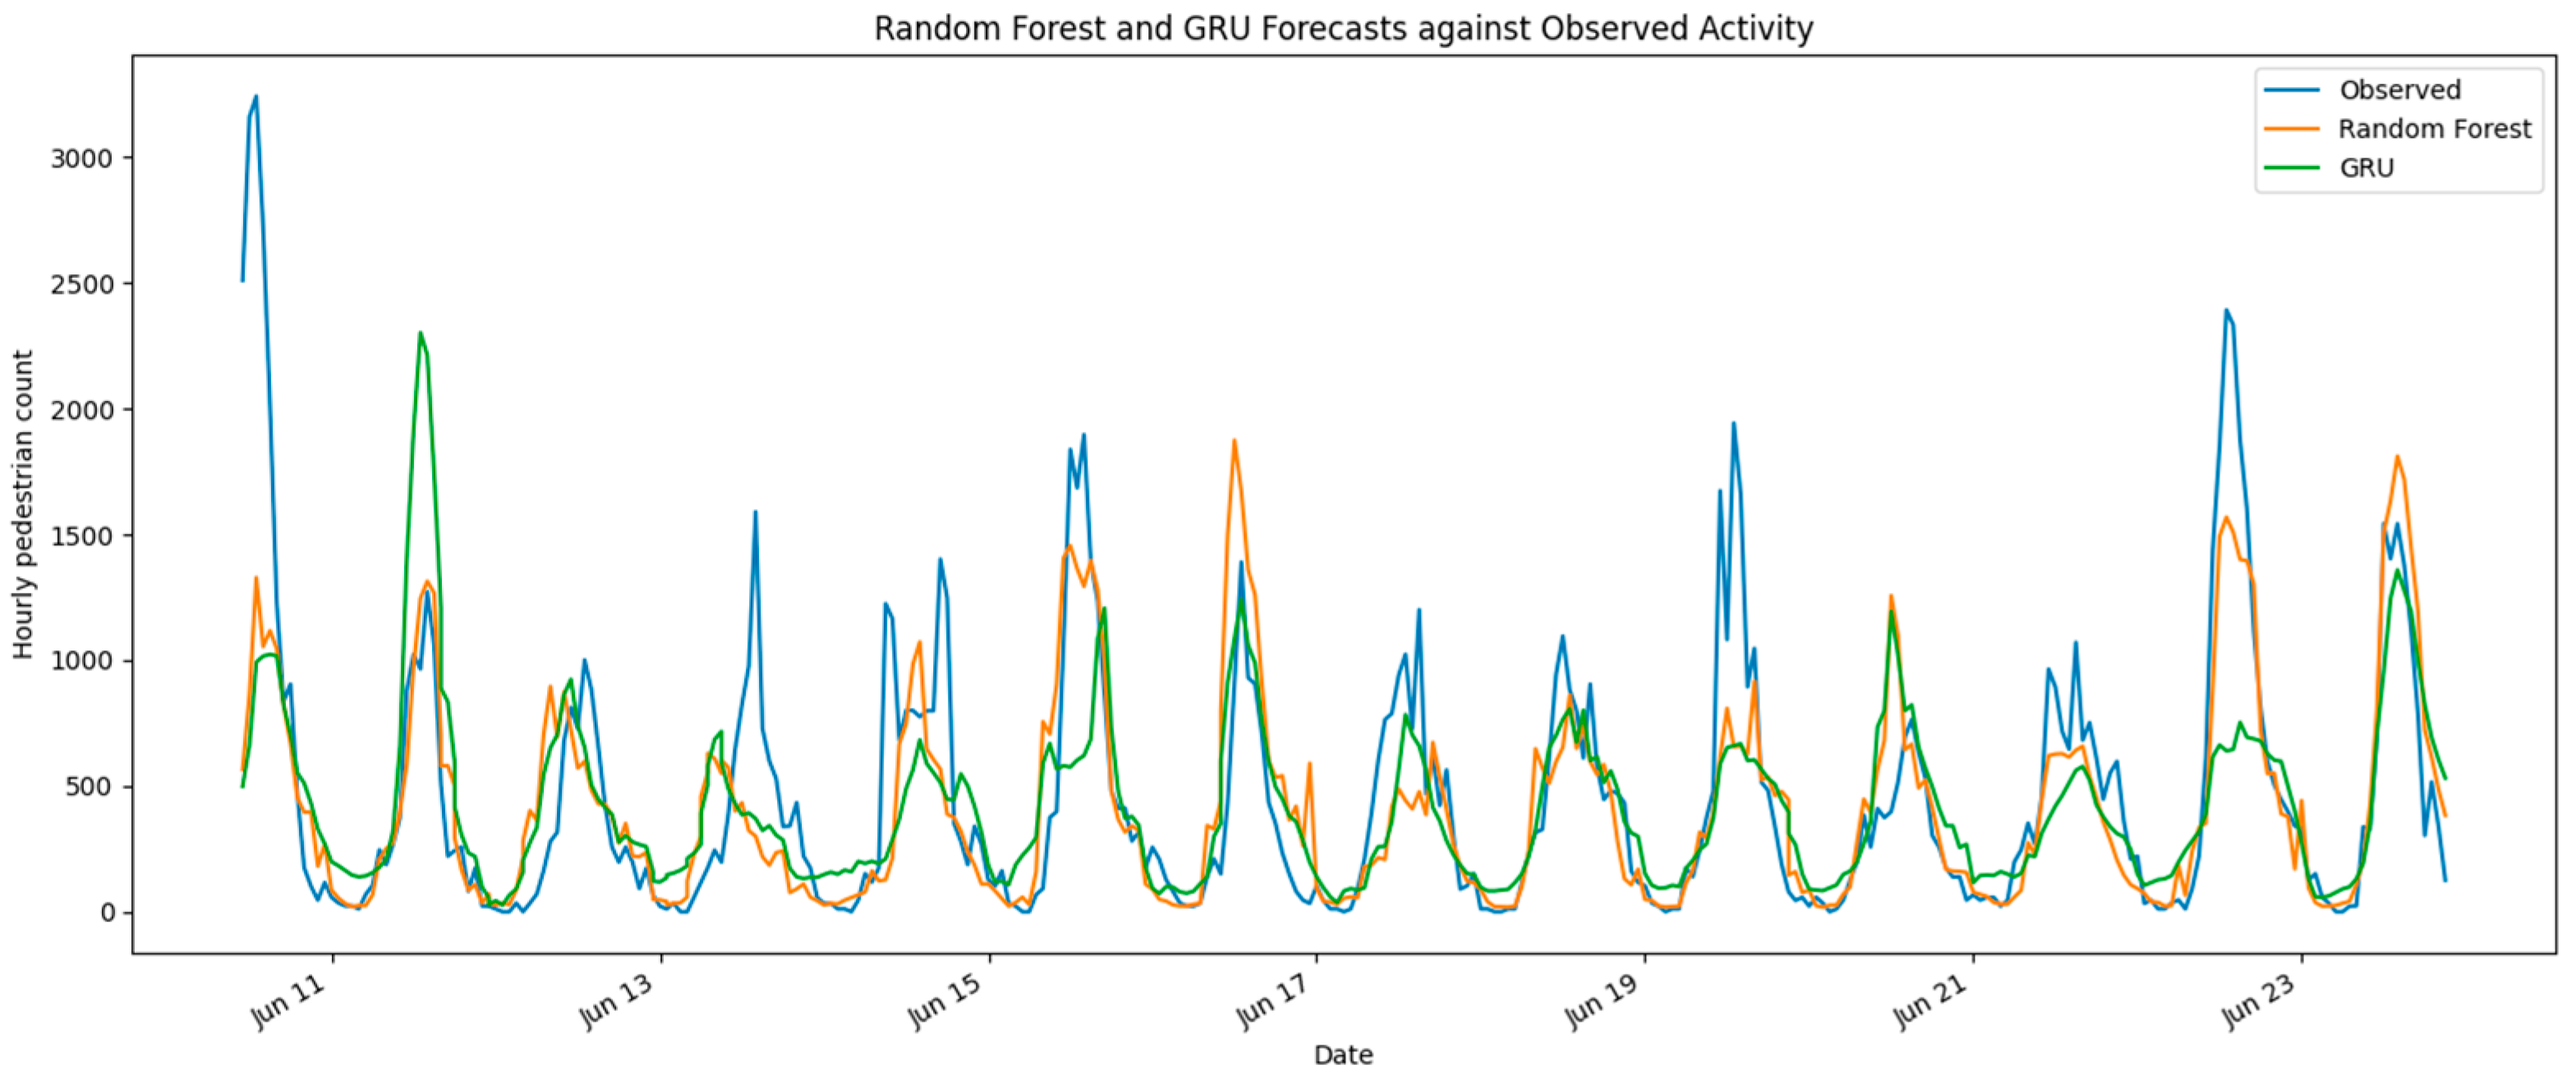
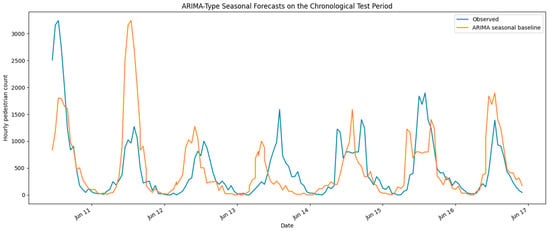
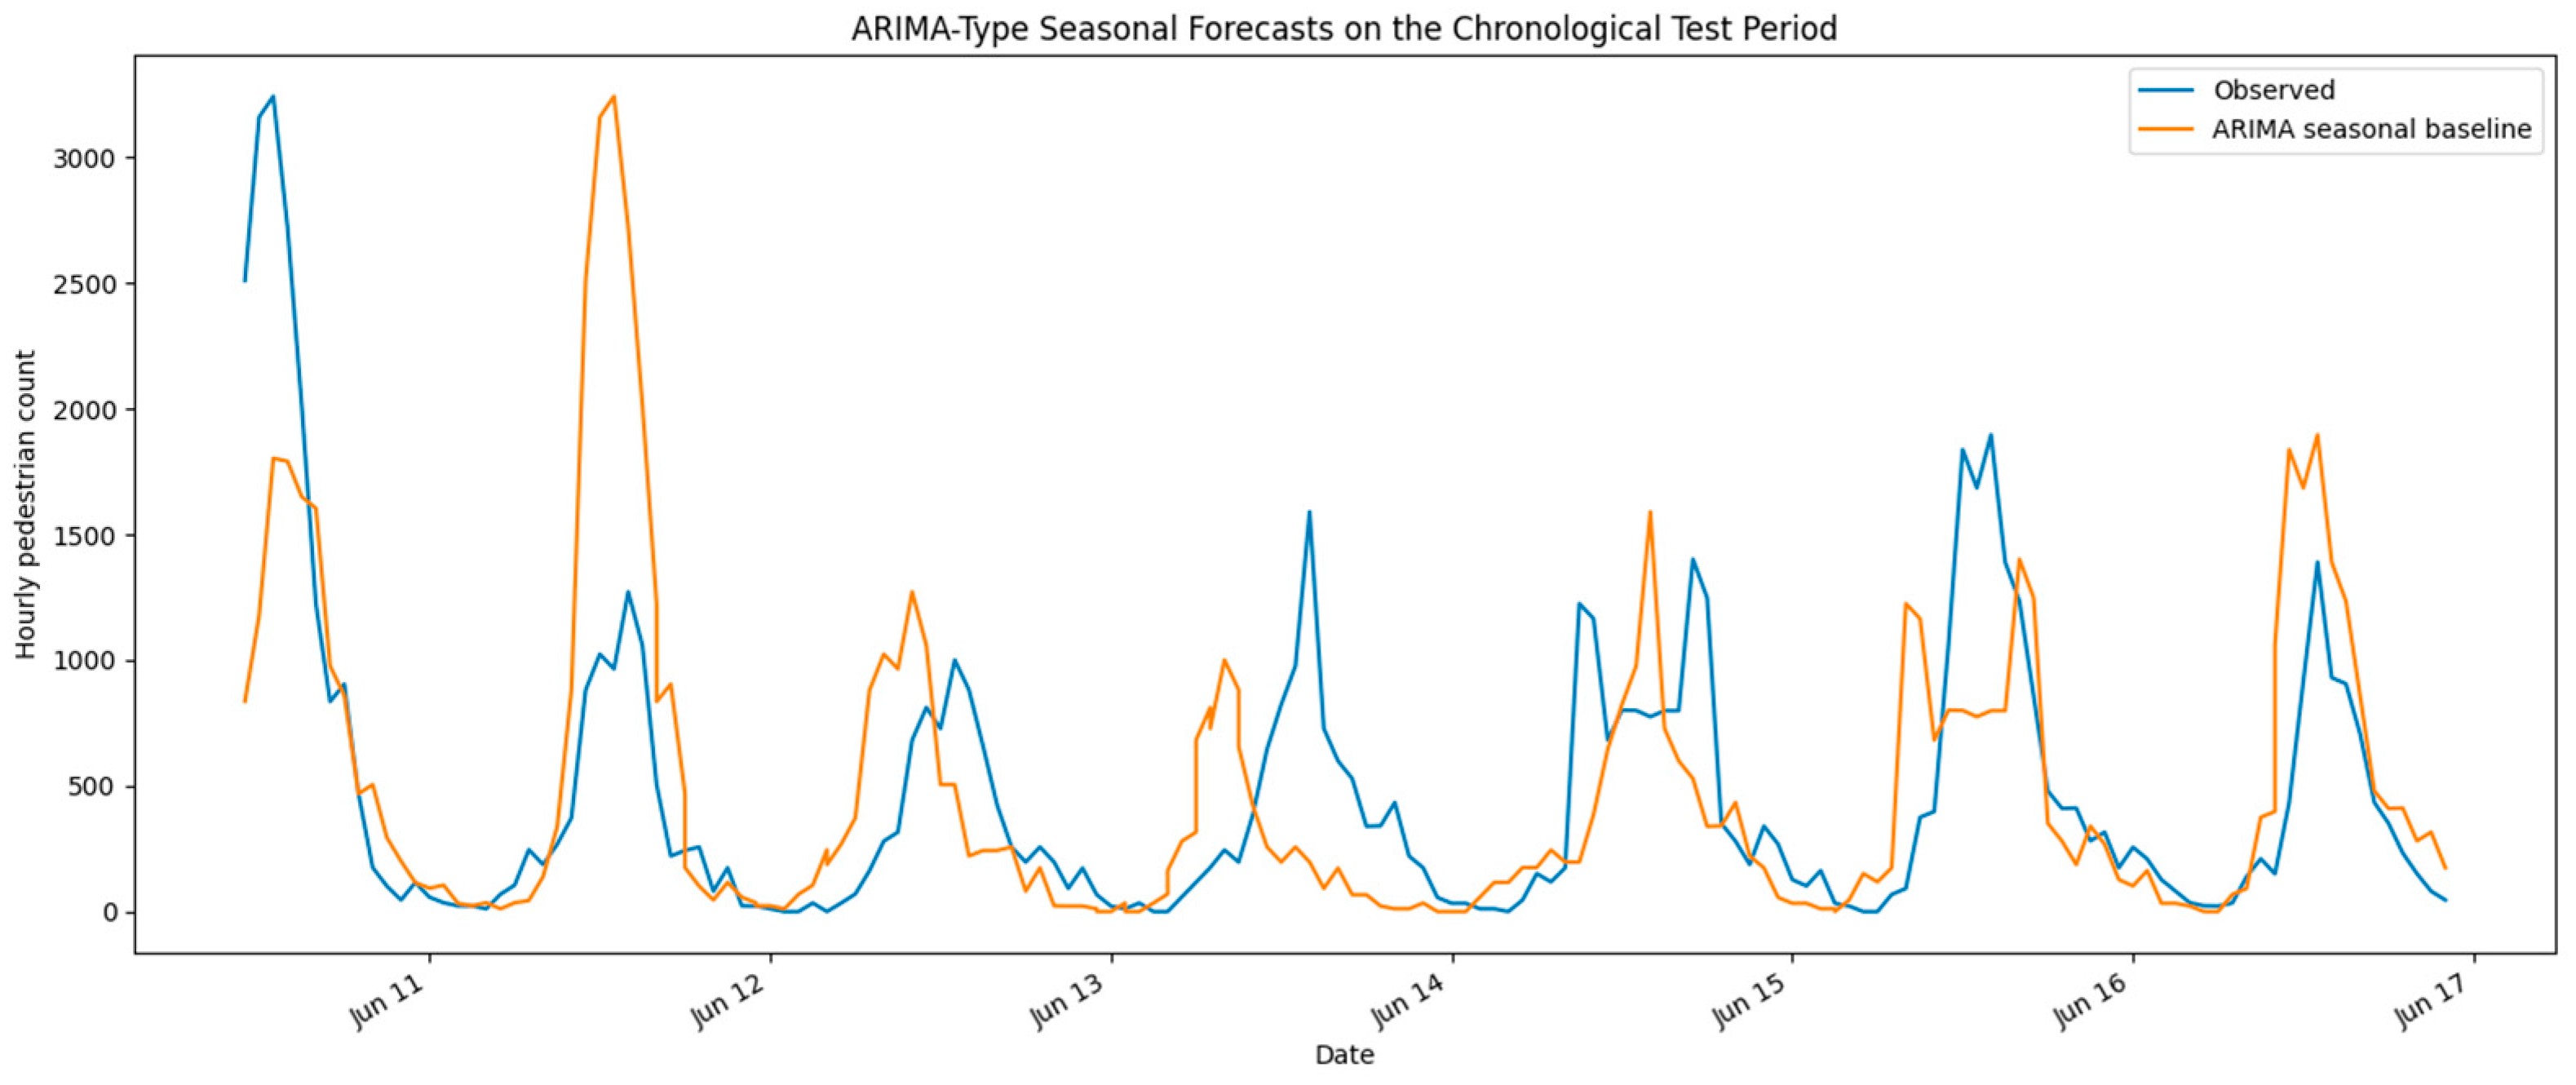
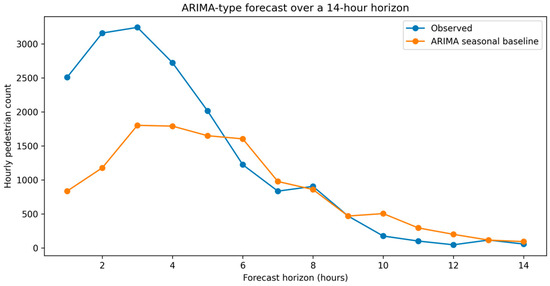
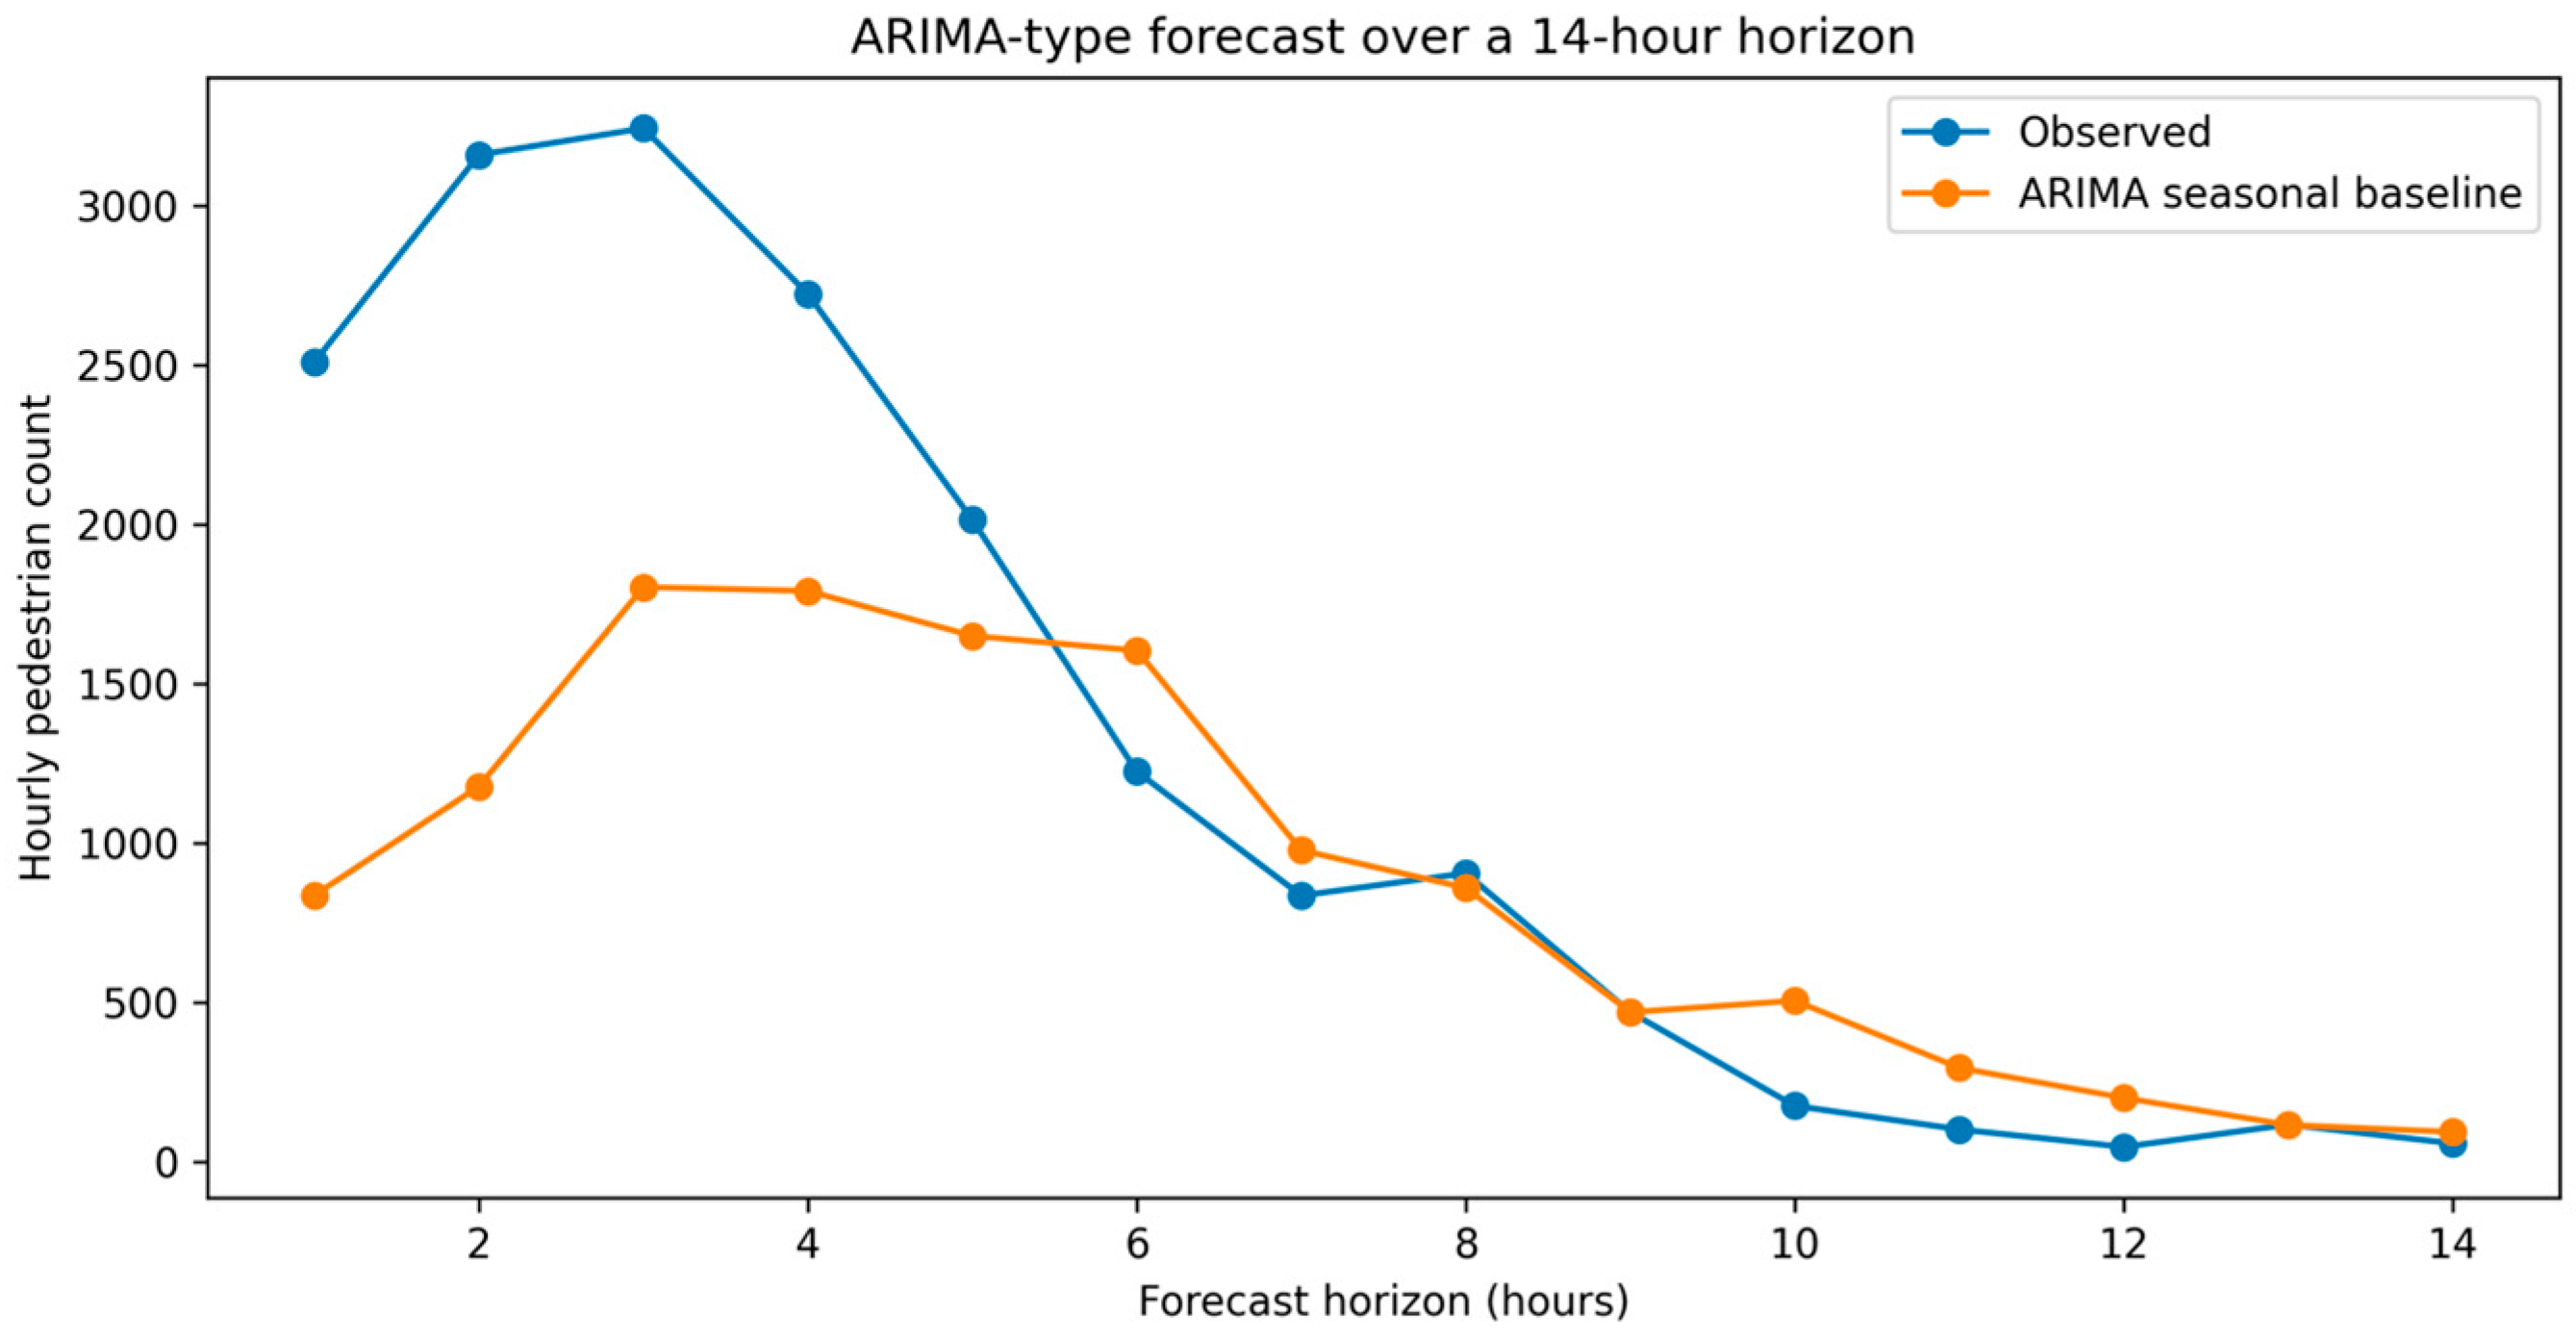
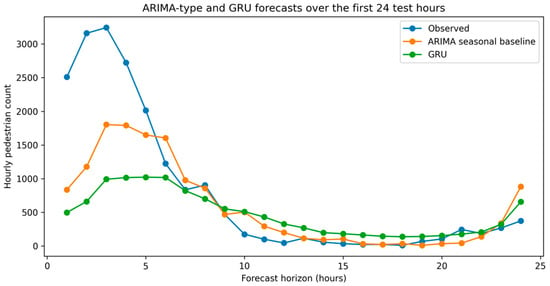
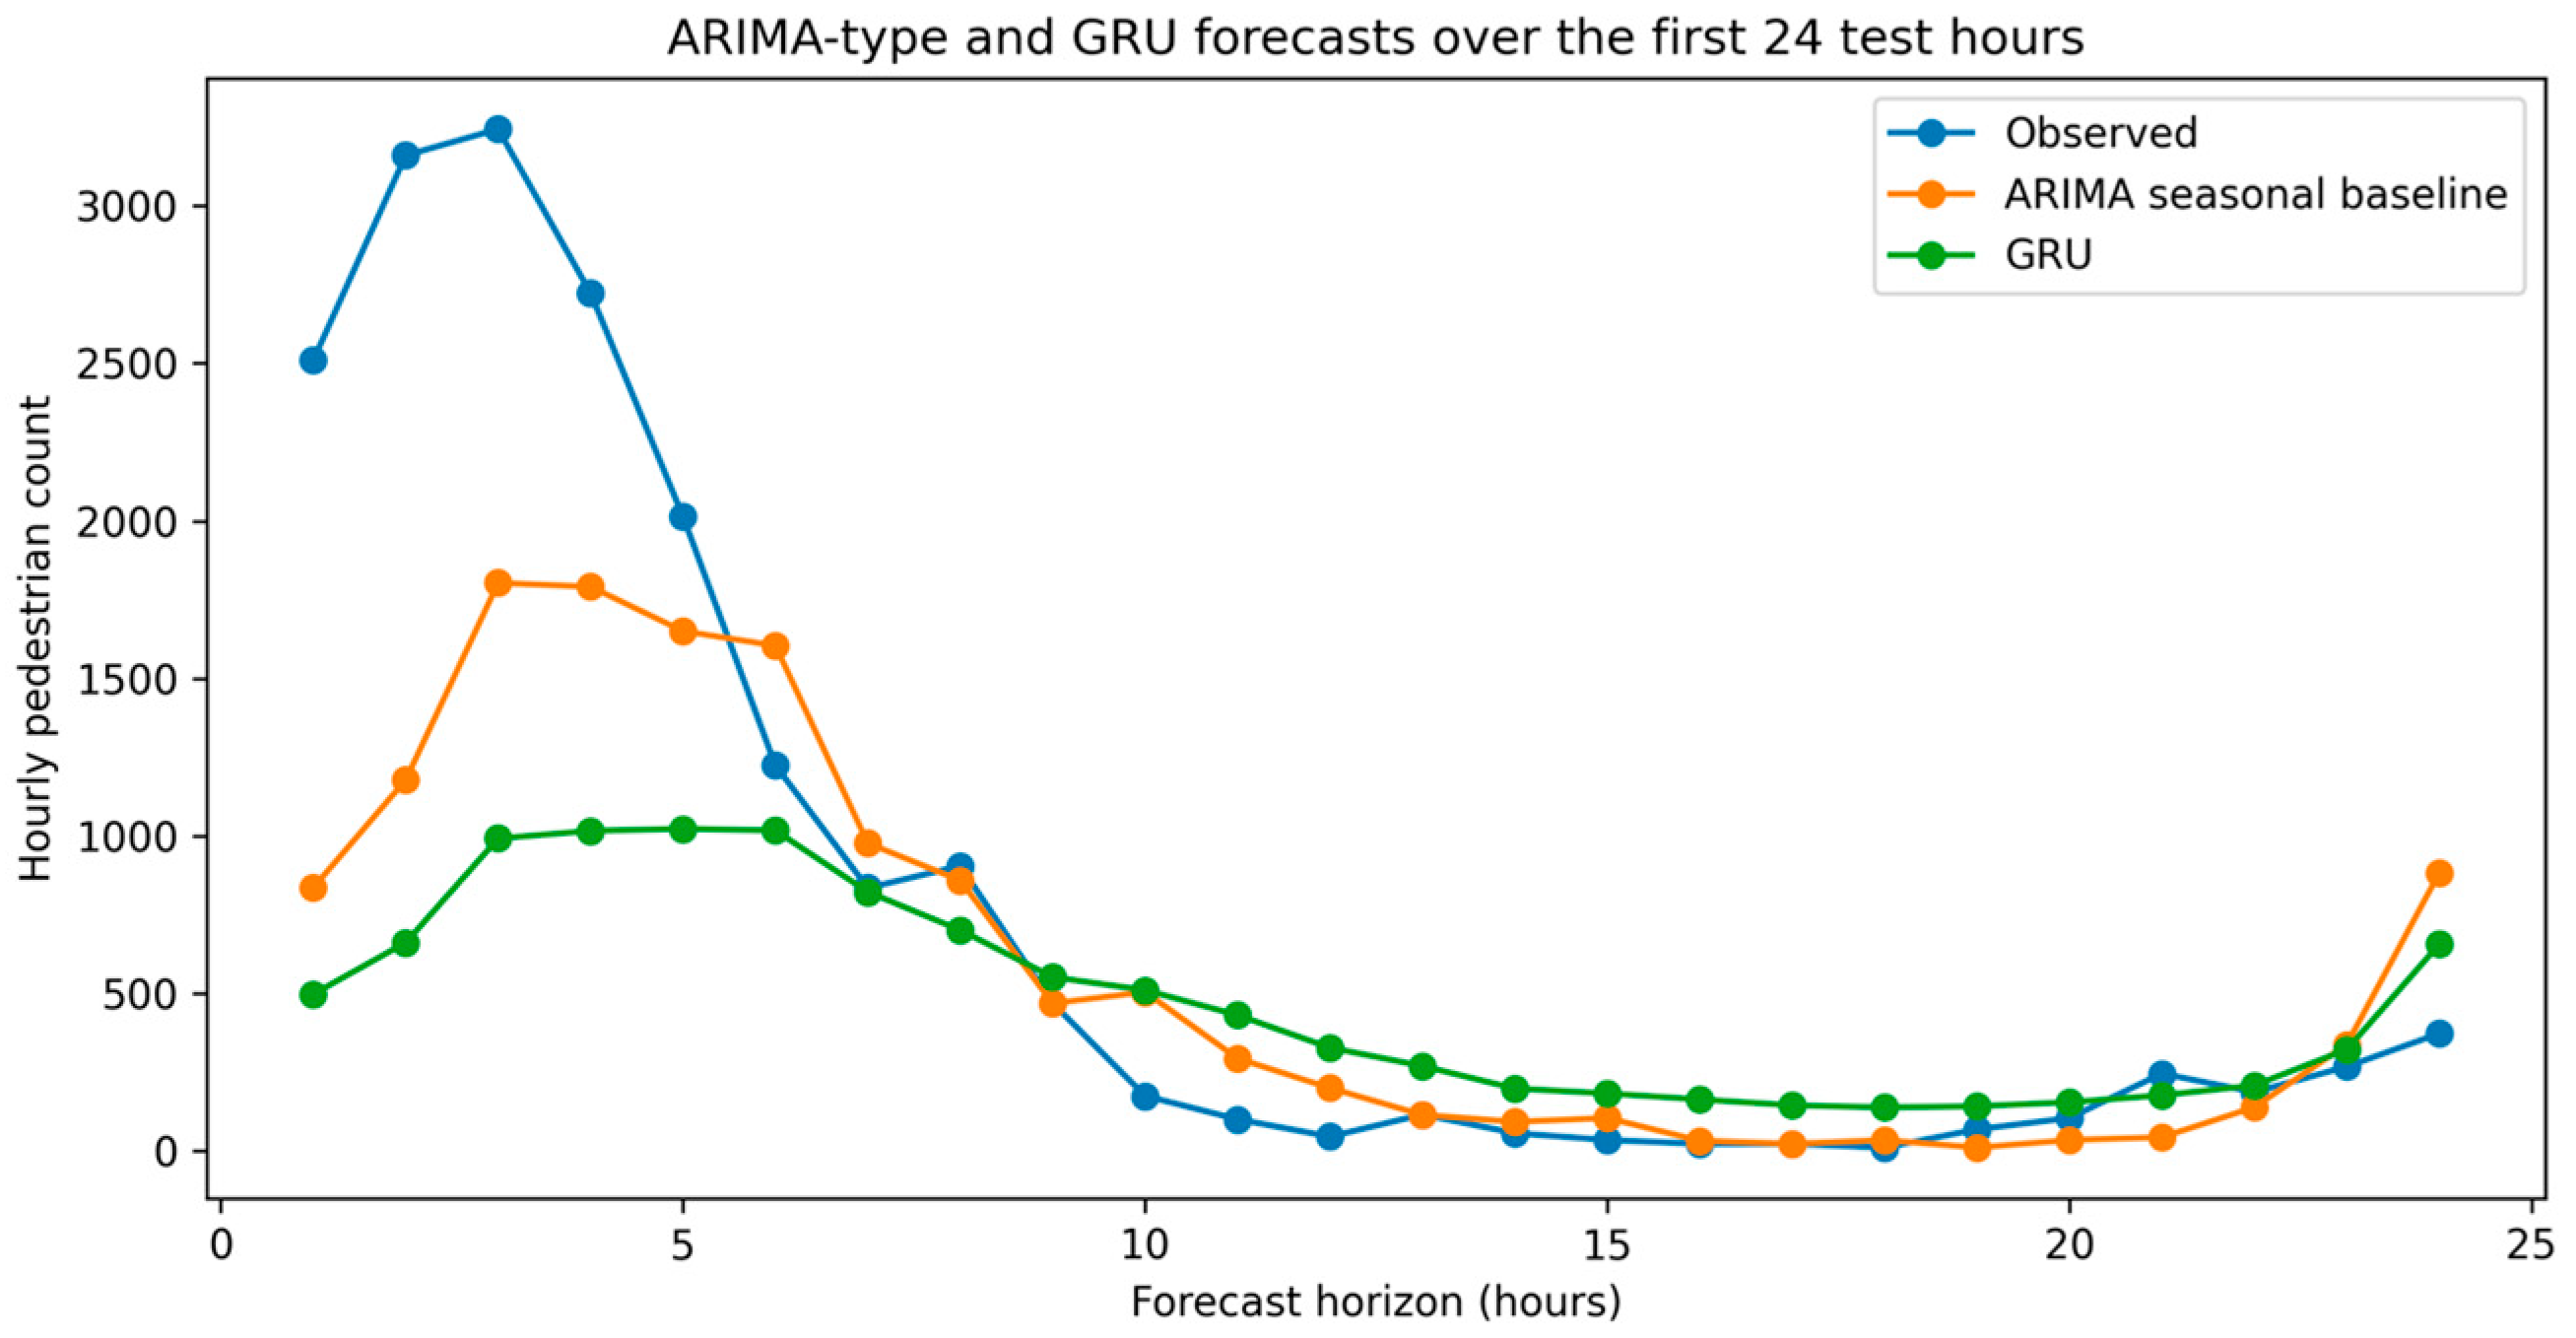

Disclaimer/Publisher’s Note: The statements, opinions and data contained in all publications are solely those of the individual author(s) and contributor(s) and not of MDPI and/or the editor(s). MDPI and/or the editor(s) disclaim responsibility for any injury to people or property resulting from any ideas, methods, instructions or products referred to in the content. |
© 2026 by the authors. Licensee MDPI, Basel, Switzerland. This article is an open access article distributed under the terms and conditions of the Creative Commons Attribution (CC BY) license.