


Abstract
High-speed railway services represent complex service environments in which customers evaluate both functional performance and lived experience. Thus, this study investigates how high-speed railway service quality influences customer satisfaction, and further examines whether consumer emotions affect the relationship between them. Data were collected via an online survey of 558 customers with recent travel experience at major high-speed railway stations in Guangzhou. Service quality was captured via reliability, responsiveness, empathy, tangibility, and compensation; emotions were measured as positive and negative affects. Main and interaction effects were estimated using hierarchical regression. Findings suggest a strong positive link between overall service quality and satisfaction. Four of the five dimensions have significant positive effects, whereas compensation is not significant. In addition, positive emotions amplify the effects of all five service quality dimensions on satisfaction, while negative emotions reduce the effects of empathy, tangibility, and compensation on satisfaction but do not significantly affect the effects of reliability or responsiveness. Overall, satisfaction in a high-demand hub depends on dependable operations, timely support, considerate encounters, and well-maintained facilities, alongside emotional experience management to improve service management across the overall journey.
1. Introduction
Driven by national development strategies, high-speed railway has expanded rapidly, with policy documents emphasizing network extension, operational efficiency, and service quality improvement (National Development and Reform Commission [NDRC], 2022; CPC Central Committee & State Council of the People’s Republic of China, 2019). As a major transportation hub in China, Guangzhou handles large customer flows and represents a meaningful context for examining how customers evaluate service encounters across the travel process. Prior studies have widely used the SERVQUAL and SERVPERF frameworks to investigate the effects of perceived service quality dimensions on salient customer-related outcomes (Cronin & Taylor, 1992). Nevertheless, prior studies in high-speed railway settings have mainly focused on operational indicators. Given that experience-oriented aspects appear important, the multidimensional service features that customers perceive could show relevance during travel (Wei, 2023).
Despite the consistent findings of previous studies on the importance of service quality as an antecedent of customer satisfaction, the following issues are still poorly addressed in the high-speed railway context: (1) Most of the previous literature investigated the service quality–satisfaction relationship in general service environments, whereas high-speed railway is a more time-sensitive, journey-wide, and high-contact transport service environment. Recent studies further pointed out that understanding customer satisfaction with railway and intercity transport is better achieved by integrating service attributes, customer needs, and whole-process experience than through overall service evaluation alone (Zeng et al., 2024; Yang et al., 2025); (2) Although railway and transport studies have increasingly focused on service quality, most of them have concentrated on selected operational or environmental indicators and have paid relatively less attention to the comparative effects of multiple service quality dimensions within an integrated framework. This issue is particularly important because recent studies pointed out that different service items, such as environment, service facilities, information support, and operation assistance were not equally important to customer satisfaction (Jomnonkwao et al., 2020; Güner et al., 2024; W. Dong et al., 2025); (3) Customer emotions play an important role in satisfaction formation; however, recent evidence indicated that positive and negative emotions should not be treated as a single undifferentiated affective response because their effects on customer evaluation might be different in magnitude and direction. Recent tourism and service studies also highlighted the emotional heterogeneity in service experiences and suggested that affective responses could work as differentiated evaluative conditions instead of only background reactions (Li et al., 2023; Caruelle et al., 2024; De Cleen et al., 2025). In summary, these issues indicate that previous studies have not yet clarified how different dimensions of high-speed railway service quality influence customer satisfaction or how these relationships differ across emotional conditions.
Accordingly, this study closes the gaps mentioned above by investigating customer satisfaction with high-speed railway services using a multidimensional service quality model including reliability, responsiveness, empathy, tangibility, and compensation while also incorporating positive and negative emotions as moderating variables. The contribution of this study does not lie in merely revisiting the aforementioned constructs, but in offering an explanation that is more context-specific and granular as to how customer satisfaction is formed in high-speed railway services. First, this study extends the service quality–satisfaction framework to a journey-based transport context, which is highly time sensitive and includes multiple customer touchpoints. Second, this study does not treat service quality as a single aggregate construct but compares the effects of five specific service quality dimensions using one integrated model. Third, this study distinguishes positive emotions and negative emotions into two separate moderators and shows that their effects are not uniformly exerted on the five service quality dimensions. Thus, unlike previous studies, this study not only explains whether service quality impacts customer satisfaction, but also explains under what emotional conditions different service quality dimensions are more or less likely to impact customer satisfaction.
2. Literature Review
2.1. High-Speed Railway Service Quality
High-speed railway service quality can be defined as the quality of services customers perceive during their whole journey from buying tickets to getting off at the station, including ticketing, station, boarding, train services and post-travel services (Parasuraman et al., 1988). In this study, we adopt a performance-based concept of perceived service quality that belongs to the SERVPERF tradition and focuses on customers’ evaluations of service performance throughout the journey. Because high-speed railway services are highly time-sensitive, operationally standardized, and characterized by multiple service touchpoints, conventional service quality models should be adapted rather than applied directly. This is in line with the recent transport research trend which tends to treat railway service quality as a multidimensional journey-based concept rather than a generic service quality evaluation.
In the context of high-speed railway, researchers have gradually extended the definition of service quality from narrow focus on basic service performance to a broader view encompassing both functional and experiential dimensions. The dimensions generally include reliability, responsiveness, empathy, tangibility and compensation. Reliability refers to the consistency and accuracy of service performance; responsiveness is the swiftness and efficiency of employees to meet customers’ needs; empathy is individualized consideration and care from employees; tangibility is the physical environment and facilities, such as cleanliness, comfort and signage; compensation is the effectiveness of remedial actions when service failures happen. All of these dimensions cover tangible and intangible aspects of travel experience and reflect the basis of customers’ perception, cognition and evaluation of service quality (Seriani et al., 2024).
Moreover, recent research indicates that service quality of railway and public transport should not be evaluated merely with “hard” indicators like punctuality, seat comfort, and cleanliness. People’s attention has gradually shifted to process-related factors and environmental factors, such as service interaction, information support, the station environment, digital competence, and more generally, product–service integration (Nilsson et al., 2025; Yang et al., 2025). In addition, based on evidence from high-speed railway stations, it is found that environmental factors, service facilities, and support of operation are not equally important for customer satisfaction, which means that service quality should be regarded as a multidimensional concept instead of just aggregating summatively (W. Dong et al., 2025). Furthermore, based on crowdsourced and heterogeneous customer data, the authors concluded that the effects of service quality attributes may vary across individual levels, regions, and time periods, which also supports the necessity of a dimension-by-dimension analysis (Luo et al., 2023). Therefore, more studies are expected to explore the impact of different dimensions of high-speed railway service quality on customer satisfaction using one model.
2.2. Consumer Emotions in High-Speed Railway
Consumer emotions are transient positive and negative emotional feelings that consumers experience during a service encounter. In the context of high-speed railway, consumer emotions may be triggered by time pressure, crowding, service information uncertainty, waiting environment, service staff and service technology encounters (Drouet et al., 2023). These emotional responses are not standalone; they usually co-exist with customers’ cognitive evaluations of service performance and jointly influence customers’ overall service experience and subsequent satisfaction judgments. In this regard, consumer emotions should be regarded as customers’ dynamic psychological responses to environmental stimuli and service processes. Given that high-speed railway travel is a multi-contact process involving ticket purchase, security check, waiting environment, boarding, real-time information release, and service encounters with technologies and service staff along the train, emotional reactions may aggregate along the whole journey and become an important component of customers’ overall evaluations.
An increasing stream of literature has demonstrated the connection between customer satisfaction and consumer emotions. In service contexts, emotional responses affect consumers’ perceptions of service cues, their processing of service encounters, and their post-consumption judgments. However, the above literature mostly treated emotion as a state and conceptualized it as a dynamic process that would change during service consumption (Caruelle et al., 2024). Furthermore, in transport context, emotional expressions derived from customer evaluation and transport service review in online platforms were also found to be strongly associated with railway-related satisfaction judgment, i.e., positive and negative emotions are presented in transport service experience (Song et al., 2024). Relatedly, the recent literature on mobility and commuting research also revealed that emotional experiences are processual and touchpoint-dependent instead of instant and isolated reactions (Sandberg et al., 2024). In addition, recent literature has also indicated that emotional signals can be used to better understand perceived service quality itself; that is, emotion is not only a consequence of service performance but is also closely related to service evaluation (Guo et al., 2024).
Therefore, this study defines consumer emotions as customers’ overall positive and negative feelings during the high-speed railway journey and measures consumers’ emotions with two sub-dimensions instead of one overall affective score. There are two reasons for using a two-dimensional conceptualization of emotions. First, positive and negative emotions are not simply two opposite ends of a single dimension; they may coexist in the same journey and affect evaluation through different psychological processes. Recently, tourism and service research has also emphasized customer emotional heterogeneity, which argues that the emotional response to a service experience is both similar and different in terms of its structural characteristics and consequential outcomes across experiences (Li et al., 2023). Second, emotional influence is not necessarily symmetric. Most recent evidence has shown that positive and negative emotions may have different impacts on satisfaction and recommendation outcomes, indicating that customers in different affective states may perceive the same level of service performance differently (De Cleen et al., 2025). Hence, consumer emotions should not be treated simply as an outcome of service encounters; evaluative conditions differentiated from service encounters should also be viewed as factors that may influence customers’ assessment of service quality and satisfaction.
2.3. Customer Satisfaction
Customer satisfaction with high-speed railway service can be defined as customers’ total perception of their travel experience, which is the outcome of the comparison between customers’ expectations and high-speed railway service delivery during the whole trip (Oliver, 1993). The travel experience could be related to the whole trip from buying the ticket, waiting at the station, boarding the train, the journey experience, using the facilities in the train, communicating with the staff, the information of delay during the trip and complaint after the trip. In this sense, the customer satisfaction with high-speed railway should not be confined to the moment of service encounter, but should be viewed as the whole trip, and the whole-process concept of customer satisfaction with high-speed railway.
Recent studies in railway and intercity transport context increasingly support the idea that customer satisfaction should be regarded as an evaluation of multiple contact experiences instead of only one single service event. Particularly, recent evidence reveals that travel experience satisfaction and smart travel services significantly influence intercity travel satisfaction along the whole process, and that customer satisfaction in high-speed railway has gradually been expanded to an integrated concept of product and service (Z. Dong et al., 2024; Yang et al., 2025). Recently, public transport research also reveals that travelers’ satisfaction depends not only on traditional service characteristics, but also on experiential and informational conditions around the service experience such as digital competence, environmental attitudes, and real-time information (Nilsson et al., 2025). Recent studies based on crowdsourced transit data reveal that the importance of satisfaction drivers might differ across individuals, places, and time, which implies that customer satisfaction is heterogeneous rather than homogeneous (Luo et al., 2023). Furthermore, recent rail transit research based on a consumption values perspective reveals that customer satisfaction might be influenced by not only performance judgments, but also by other forms of values, such as functional value, emotional value, and situational value (Wahab et al., 2025).
Customer satisfaction is typically treated as a single dependent variable; however, it may be a composite of service quality, perceived value, and consumer emotions. While service marketing literature typically defines satisfaction as a global evaluation of service quality (Oliver, 1993; Hu et al., 2009), all experiences before, during, and after service consumption are aggregated together in forming this global evaluation (Kotler & Keller, 2009). Satisfied customers are more loyal, more likely to repurchase the service, and more likely to recommend the service to others. Accordingly, this study defines customer satisfaction as customers’ overall post-consumption evaluation of whether the high-speed railway service experience satisfies their expectations at multiple service stages. This definition is consistent with classical satisfaction theory and recent experiential transport research.
2.4. Hypotheses on the Relationship Between Service Quality and Customer Satisfaction
Service quality and customer satisfaction are two related but analytically distinct concepts. In the classical service literature, service quality is typically taken to be a multi-dimensional evaluation of service performance, while customer satisfaction is viewed as a more global post-consumption judgment formed by customers after they evaluate the overall service. Early service studies found that customers evaluate service through multiple dimensions rather than through a single undifferentiated overall impression (Parasuraman et al., 1985, 1988). Subsequent refinements clarified that customers’ judgments are formed through comparisons, evaluations, and accumulated service cues across the service process (Parasuraman et al., 1991, 1994). Later studies also reinforced the view that service quality is an important antecedent of satisfaction and other post-consumption responses (Cronin & Taylor, 1992; Oliver, 1993). This logic was extended by studies emphasizing the combined effects of service performance, value, and service experience in customers’ evaluations (Cronin et al., 2000; Brady & Cronin, 2001). Furthermore, meta-analytic evidence has shown that service quality has a strong positive relationship with customer-related outcomes across service settings (Carrillat et al., 2009).
In transport and railway contexts, this general relationship remains valid. Reviews of public transport service research have demonstrated that customer satisfaction is influenced by a set of service attributes rather than by a single service characteristic (de Oña & de Oña, 2015; van Lierop et al., 2018). Similarly, railway service studies have also demonstrated that passengers consider service quality throughout the journey process and that different service attributes make different contributions to customer satisfaction judgments (Eboli & Mazzulla, 2015; de Oña, 2020). Furthermore, the latest studies also confirm that the perceived service quality is one of the most important precursors of passenger satisfaction in railway-based public transportation (Ismael & Duleba, 2021; Ibrahim et al., 2025). Thus, in the high-speed railway context, better service quality is expected to lead to greater customer satisfaction.
At the dimensional level, reliability and responsiveness appear to be particularly important in high-speed railway services. Passengers are very sensitive to reliability, consistency, accuracy of information, and speed of response from staff or systems to their needs. Previous transport studies have consistently found that reliability, waiting time, service frequency, information and service provision, and operational assistance are major explanatory variables of passenger satisfaction (Jomnonkwao et al., 2020). Most recently, transport studies have shown that operational conditions, such as speed and punctuality, as well as real-time service status, strongly influence passengers’ service evaluations (Weng et al., 2023; Ruiz et al., 2024). In railway contexts, service use decisions and customer evaluations have also been linked to perceptions of operational quality and helpful assistance (Lieophairot & Rojniruttikul, 2023; Güner et al., 2024). In the Chinese railway context, station support, information quality, and operational assistance have also been found to influence passenger satisfaction (Zeng et al., 2024; W. Dong et al., 2025). Consequently, reliability and responsiveness are expected to positively affect customer satisfaction.
Empathy and tangibility are also theoretically important as railway travel is not solely judged by its technical performance. Passengers also judge their experience based on how they are treated and how they feel and how they perceive the tangible aspects of the journey such as train environment (van Hagen & Bron, 2014; van Lierop et al., 2018). Recent studies on railway and transport also revealed that cleanliness, facilities, smart travel services and the physical service environment are important components of the overall journey evaluation (Vasanthi et al., 2023; Z. Dong et al., 2024). This conclusion is also supported by the recent high-speed railway and public transport studies focusing on product–service integration, digital support, and experiential conditions as important determinants of satisfaction (Yang et al., 2025; Nilsson et al., 2025). Furthermore, the recent research using a consumption values perspective revealed that passenger satisfaction in the railway sector is not only influenced by functional judgments of the journey but also by the experiential and situational aspects of the journey (Wahab et al., 2025). Hence, empathy and tangibility are anticipated to positively affect customer satisfaction.
Compensation is retained in this study as a context-specific dimension of high-speed railway service quality. This is because high-speed railway services are disruption-prone, and passengers may not only evaluate routine service quality but also how the operator overcomes delays, cancellations, complaints, and other unexpected inconveniences. Research on train journey experience has demonstrated that emotionally salient “moments of truth” can significantly influence customer evaluations, especially during irregular trips (van Hagen & Bron, 2014; Song et al., 2024). Relatedly, research on railway delays has demonstrated that passenger dissatisfaction increases significantly when travelers face disruption, insufficient information, and poor handling of service failures (Monsuur et al., 2021). Recently, high-speed railway studies have also shown that achieving passenger satisfaction is not limited to fulfilling core service requirements but also includes meeting support and recovery-related requirements throughout the entire trip (W. Dong et al., 2025; Yang et al., 2025). Therefore, although compensation may be a more salient attribute in irregular situations compared with routine travel, it is still theoretically reasonable to expect a positive association between compensation and customer satisfaction.
Overall service quality as well as reliability, responsiveness, empathy, tangibility, and compensation have positive effects on customers’ satisfaction. Table 1 shows the hypotheses.
Table 1.
Proposed hypotheses on the effects of service quality on customer satisfaction.
2.5. Hypotheses on the Moderating Role of Consumer Emotions
Customer satisfaction is not generated by cognitive appraisal only. Recent studies in railway and intercity transport contexts increasingly support the view that customer satisfaction should be regarded as an evaluation of multiple contact experiences rather than a single service encounter (Caruelle et al., 2024; De Cleen et al., 2025). Rather than being seen as background feelings, emotions are increasingly recognized as meaningful psychological states that influence how customers interpret service cues and arrive at overall satisfaction judgments. Similarly, in service analytics research, results have shown that emotion-based indicators can add to the understanding of perceived service quality and other evaluative outcomes (Guo et al., 2024). In transport and travel settings, recent studies likewise show that emotional experiences develop over the journey and are associated with passengers’ judgments of service quality and satisfaction (Sandberg et al., 2024; Gerou, 2024). In railway-related settings, the evidence based on online reviews also shows that passenger emotions are significantly related to satisfaction judgments and experience evaluations (Song et al., 2024).
Positive emotions are anticipated to enhance the relationship between service quality and customer satisfaction since positive affective states would make passengers more likely to interpret service quality cues in an encouraging and appreciative manner. Based on the research on emotional arousal, we argue that emotions are not passive by-products of service encounters but important components of customer experience formation (Caruelle et al., 2024; Gerou, 2024). In addition, many studies on customer emotion and service quality have revealed that emotions as signals affect how service performance is perceived, interpreted and evaluated (Guo et al., 2024). When passengers feel stronger positive emotions, dependable operations would be perceived as more reassuring, help in times of need would be seen as more helpful, care from staff would be understood as more meaningful, the physical setting would be felt as more pleasant, and recovery efforts would be judged more fairly. In summary, positive emotions are anticipated to enhance the impact of service quality dimensions on customer satisfaction.
Negative emotions are therefore expected to weaken the service quality–customer satisfaction relationship because negative affective states make passengers more sensitive to travel inconvenience, uncertainty, crowding, disruption, and unmet expectations during the travel process. Research on emotional heterogeneity has demonstrated that customers may experience diverse affective reactions that do not operate symmetrically and may lead to different evaluative outcomes (Li et al., 2023). Previous studies on emotional commuting and the onboard journey also demonstrated that negative emotional episodes can alter the meaning and weight of service encounters across touchpoints (Sandberg et al., 2024). In railway-related online review studies, negative emotions are related to negative evaluations of travel experience in general and service handling evaluations in particular (Song et al., 2024; Monsuur et al., 2021). Consequently, when passengers experience stronger negative emotions, the positive impacts of service quality dimensions on customer satisfaction should decrease.
This moderating logic is especially reasonable in the context of high-speed railways because not all dimensions of service quality are emotion sensitive. Reliability and responsiveness are mostly related to operational and informational performance, while empathy, tangibility, and compensation are more related to interpersonal care, environmental performance, and remedial action. In addition, recent studies on customer emotional heterogeneity and railway journey experiences indicate that the latter two dimensions are more likely to be filtered through passengers’ affective states during the journey process (Li et al., 2023). Thus, it is theoretically proper to distinguish positive emotions and negative emotions as two different moderators instead of aggregating them into one differentiated affective construct. Table 2 shows the hypotheses.
Table 2.
Hypotheses on the moderating role of consumer emotions.
2.6. Conceptual Framework
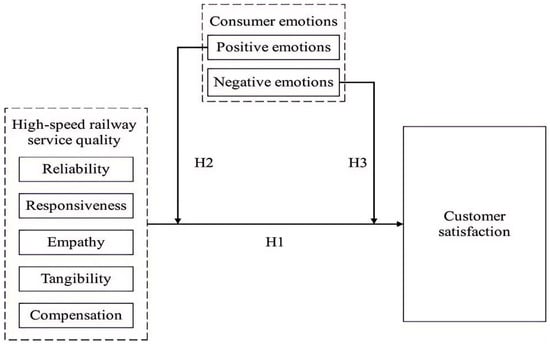
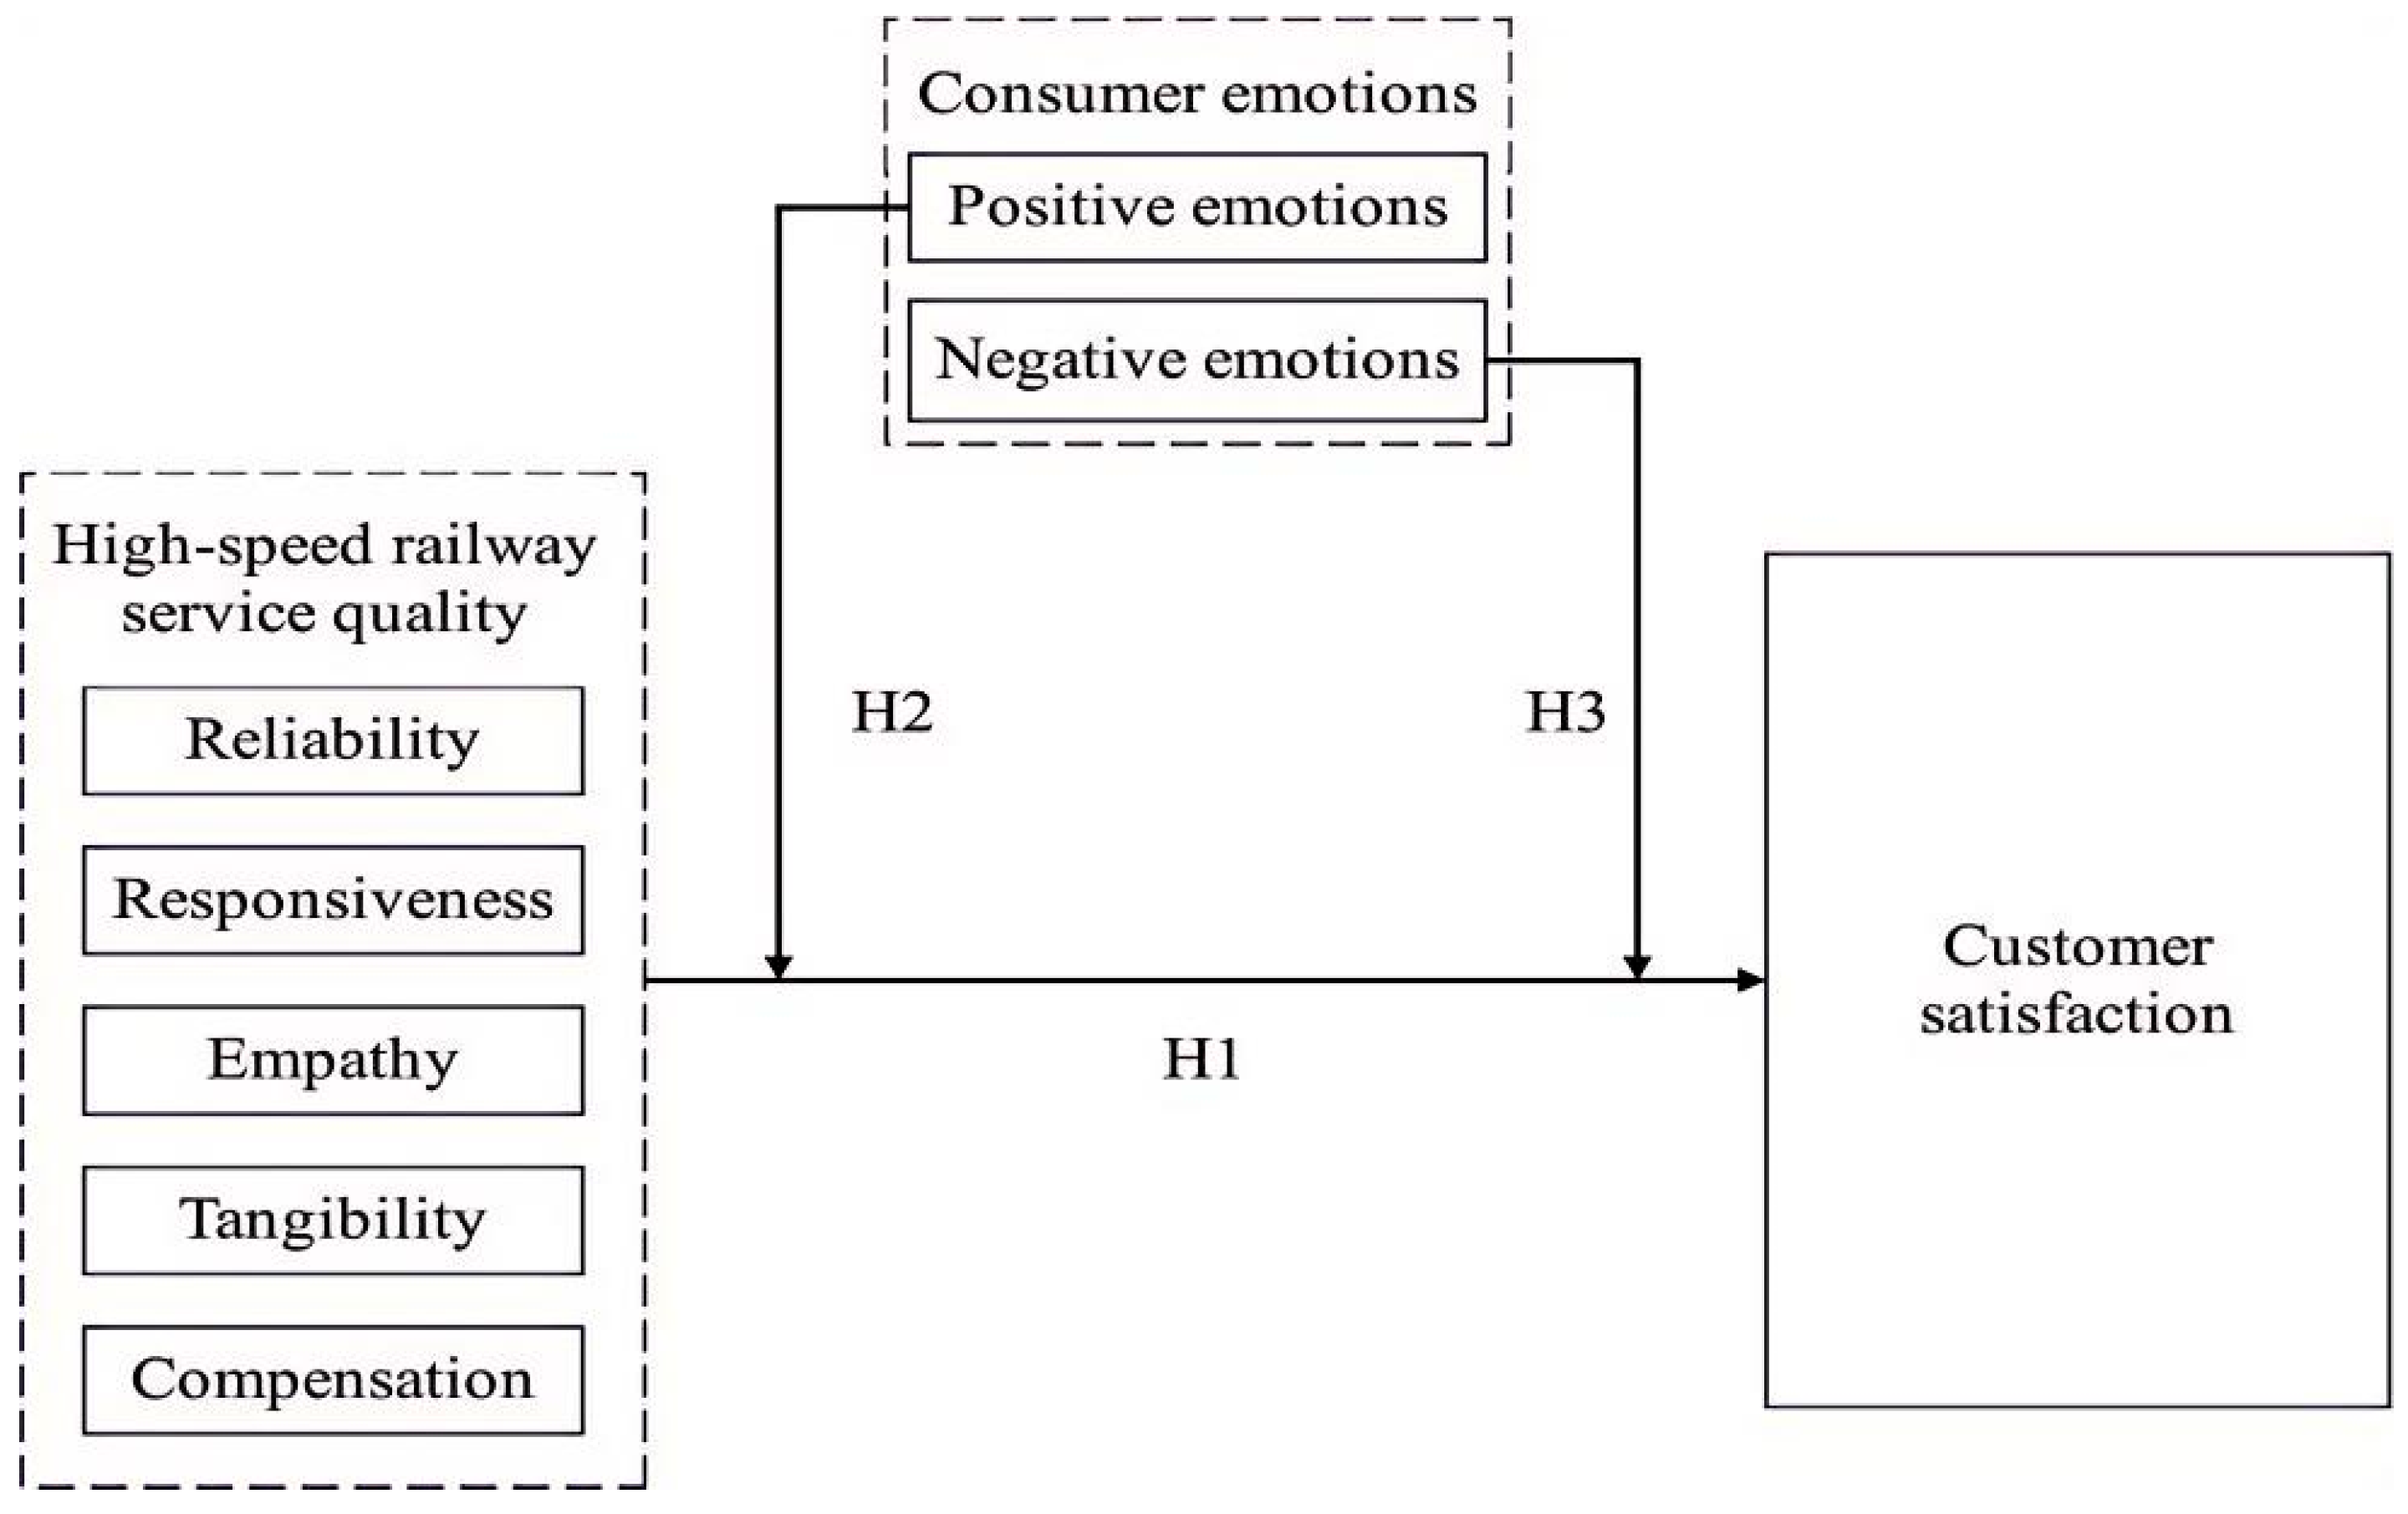
In this study, we conceptualize service quality as a multidimensional performance-based construct. Its original theoretical basis can be traced back to the SERVQUAL and SERVPERF models. In the original SERVQUAL model, Parasuraman et al. (1985) defined service quality as a multidimensional construct and proposed five dimensions of service quality, including reliability, responsiveness, assurance, empathy, and tangibles. Subsequently, SERVPERF also maintained the multidimensional logic of measuring service quality; however, it focused on customers’ perceived service performance rather than the expectation–perception gap. Following this line of reasoning, we adopt a performance-based definition and adapt the dimensional structure into the context of high-speed railways. We retained reliability, responsiveness, empathy, and tangibility as dimensions because customers would evaluate service reliability, timely assistance, individualized care, and service environment throughout the high-speed railway journey. We did not retain assurance as a separate dimension because, in the context of high-speed railway services, customers’ confidence and trust are generally attached to system reliability, standardized operations, and service staff responsiveness. We introduced a compensation dimension as a context-specific dimension to reflect customers’ evaluations of remedial handling and compensation support when there are delays, disruptions, or other service failures during the journey. This definition is reasonable because high-speed railway services are time-sensitive, journey-based, disruption-sensitive transport services comprising multiple service touchpoints rather than generic service encounters. On this basis, we examine how these five dimensions are associated with customer satisfaction and whether customers’ positive and negative emotions would condition the strength of these five effects. The conceptual framework is illustrated in Figure 1.
Figure 1.
Conceptual framework.
3. Methodology
3.1. Population, Sample Size and Sampling
The target population consisted of customers with recent high-speed railway travel experience involving major stations in Guangzhou. This population was considered appropriate because these participants were assumed to have first-hand and relatively recent service experiences, which enabled them to offer informed assessments of service quality, perceived value, emotional reactions, and satisfaction. Data were gathered through an online questionnaire administered on the Wenjuanxing platform, and the survey link was distributed through relevant online channels across multiple days and time windows to broaden coverage and increase the diversity of respondents. Such an approach helped capture participants with different travel purposes, schedules, and demographic backgrounds, thereby improving the representativeness of the sample within the practical limits of online data collection.
Following data screening and quality checks, 558 valid questionnaires were included in the final dataset. The screening process involved removing incomplete responses, questionnaires with obvious response patterns, and cases that did not meet the study requirements. This sample size was sufficient for the planned regression and moderation analyses. However, because the study used voluntary online non-probability sampling, a response rate could not be calculated and nonresponse bias cannot be fully ruled out. In addition, because the data were collected through self-report measures in a specific regional setting, the findings should be interpreted as context-specific evidence and generalized with caution to other railway contexts or broader transport environments.
3.2. Instruments
The questionnaire consisted of two parts. The first part was used to collect respondents’ demographic information and travel characteristics, such as sex, age, education level and travel frequency. The second part measured the constructs in this study using multi-item scales.
High-speed railway service quality was measured by five dimensions: reliability, responsiveness, empathy, tangibility and compensation. The measurement design was based on traditional service quality literature and adapted for the high-speed railway context. In particular, the original SERVQUAL framework developed by Parasuraman et al. (1988) identified five dimensions of service quality: reliability, responsiveness, assurance, empathy, and tangibles, whereas later performance-based approaches, especially SERVPERF, emphasized customers’ perceived service performance. In line with this tradition, this study adopted a performance-based measurement logic and selected five dimensions that were more appropriate to reflect the operational characteristics of high-speed railway service. Reliability, responsiveness, empathy, and tangibility were adopted from the traditional service quality framework because they remain important to customers when evaluating service dependability, helpful assistance in times of need, individualized care, and the service environment. In addition, compensation was adopted as a context-specific dimension to reflect customers’ evaluations of remedial handling and service recovery when there are delays, disruptions and other service failures.
Most of the measurement items used to measure high-speed railway service quality were adopted from Parasuraman et al. (1988) and then extended to the high-speed railway context by Yu and Li (2010). Based on these sources, we revised the wording of the items to make them fit the high-speed railway context and to ensure greater consistency with customers’ travel experiences. To help respondents better understand the questions and to improve the consistency between the conceptual definitions and the questionnaire items, each item was followed by an explanatory statement.
Consumer emotions were measured by two dimensions: positive emotions and negative emotions. This study mainly referred to the scale design and measurement items reported by Wen et al. (2003), Laros and Steenkamp (2005) and He and Zhang (2006). Based on these established scales, we selected dimensions that were more appropriate to the high-speed railway context and then appropriately revised them. To help respondents better understand the questions and to ensure greater consistency between the conceptual definitions and the questionnaire items, each emotional item was followed by an explanatory statement. Specifically, positive emotions were measured by pleasant, joyful, surprised, grateful, relaxed, satisfied and warm, and negative emotions were measured by angry, regretful, dissatisfied, sad, fearful, lonely and disappointed.
Customer satisfaction was measured by three items adapted from Taylor (1997) and Lee et al. (2000). The wording of the items was revised to fit the high-speed railway service context while remaining consistent with the original conceptual meaning.
All items were measured using a five-point Likert scale ranging from 1 = strongly disagree to 5 = strongly agree, and a higher score indicated a stronger agreement. For methodological transparency, all measurement items and their related literature are summarized in Table 3.
Table 3.
Measurement items and sources of the study constructs.
4. Results
4.1. Demographic Characteristics of the Respondents
A total of 558 valid questionnaires were collected for data analysis. We imported them into SPSS 27 and performed descriptive statistics analysis through this software to understand the basic characteristics of the participants. Table 4 shows the sample’s demographic features and travel-related attributes, which gives us some insight into the overall sample composition.
Table 4.
Analysis of the basic information of the respondents.
In the sample, 60.0% of respondents were male (n = 335) and 40.0% were female (n = 223). The age profile was concentrated in the 25–34 (35.7%) and 35–44 (26.0%) groups, suggesting that the respondents were largely working-age adults. Regarding education, 42.3% reported a bachelor’s or associate degree, and 9.5% held a master’s degree or above. Monthly income was most frequently reported in the RMB 3001–9000 range, comprising RMB 3001–6000 (20.6%) and RMB 6001–9000 (38.5%), followed by RMB 9001–12,000 (19.9%); only a small share earned below RMB 3000 (3.2%).
In terms of occupation, the largest groups were corporate employees (45.5%) and government employees (17.0%), indicating that the respondents came from diverse occupational backgrounds. In terms of the number of trips made in the past year, 40.7% of respondents reported 1–3 trips and 18.5% of respondents reported 4–6 trips. This result indicates that most respondents had recently traveled by high-speed railway. Finally, respondents reported using ticket purchasing channels such as online ticket booking platforms (50.5%) and travel agencies or sales agents (30.8%). These sample characteristics provide an appropriate basis for the subsequent measurement and regression analyses.
4.2. Reliability and Validity Analysis
4.2.1. Reliability Analysis
Internal consistency was evaluated using Cronbach’s alpha (α). Following commonly adopted criteria, α values above 0.70 indicate acceptable reliability, around 0.80 indicate good reliability, and values exceeding 0.90 indicate excellent reliability. As reported in Table 5, the five dimensions of high-speed railway service quality demonstrate good internal consistency (α = 0.825–0.879), and customer satisfaction also shows good reliability (α = 0.867). Since consumer emotions were operationalized as two dimensions, the reliability of consumer emotions needs to be tested at the subscale level. Both positive and negative emotions have high reliability (positive emotions: α = 0.884; negative emotions: α = 0.929). Therefore, five dimensions of service quality and two emotion subscales will be used in further analysis rather than total scores.
Table 5.
Reliability analysis.
4.2.2. Validity Analysis
The adequacy of the data for validity assessment was examined through tests of sampling adequacy and factorability prior to exploratory factor analysis. Each construct and subscale was analyzed separately to verify approximate unidimensionality. According to Table 6, KMO values ranged from 0.724 to 0.887, and Bartlett’s test of sphericity was significant for all constructs (p < 0.001), suggesting that exploratory factor analysis was appropriate. For the five service quality dimensions, each subscale was characterized by one predominant factor (eigenvalues = 2.624–2.938), explaining 65.608–73.457% of the variance. The emotion subscales also showed one-factor solutions (positive emotions: eigenvalue = 4.134, variance explained = 59.052%; negative emotions: eigenvalue = 4.919, variance explained = 70.267%). Customer satisfaction exhibited a one-factor solution (eigenvalue = 2.380) explaining 79.318% of the variance. Overall, these results support the factorability and approximate unidimensionality of the constructs for subsequent regression and moderation analyses.
Table 6.
Validity analysis.
4.2.3. Common Method Bias Test
According to the scholars’ research, common method variance occurs when variables are measured with a common method, thereby resulting in variance in the variables (Spector & Brannick, 2009). Therefore, Harman’s single-factor test was first performed based on SPSS 27.0 software to test common method bias. All items from the variables in this study, service quality (reliability, responsiveness, empathy, tangibility, and compensation), consumer emotions (positive emotions and negative emotions), and customer satisfaction, were submitted to the factor analysis method using the principal component method, extracting factors with eigenvalues larger than 1.
According to Table 7, a total of 7 common factors with eigenvalues larger than 1 were extracted. The variance contribution rate of the first common factor was 32.326%, which was lower than the threshold of 40%. Therefore, serious common method bias did not exist in the sample data in this study.
Table 7.
Common method bias analysis.
4.2.4. Multicollinearity Diagnostics
To test collinearity among measurement indicators beyond the PLS-SEM framework, the variance inflation factor (VIF) values were calculated with the aid of SmartPLS 4.0. In structural equation modeling, VIF is frequently used to determine whether collinearity among indicators is high enough to threaten the stability of parameter estimation.
As presented in Table 8, the VIF values of all indicators were between 1.609 and 4.841 and all were below the critical value of 5. Hence, multicollinearity is not a major issue in the measurement model that also supports the robustness of the SEM results.
Table 8.
Variance inflation factor (VIF) results.
4.3. Regression Analysis
4.3.1. Regression Analysis of Service Quality on Customer Satisfaction
Effect of service quality on customer satisfaction:
H1 was examined using a linear regression with overall service quality as the predictor and customer satisfaction as the outcome. Table 9 shows a significant positive effect of service quality on satisfaction (β = 0.691, t = 22.536, p < 0.001). The model explained 47.7% of the variance in customer satisfaction (R2 = 0.477) and was statistically significant overall (F = 507.855, p < 0.001). Therefore, H1 is supported.
Table 9.
The regression coefficient and significance test of high-speed railway overall service quality on customer satisfaction.
Effect of different service quality dimensions on customer satisfaction:
To assess the predictive contributions of the five service quality dimensions, we estimated a multiple regression model with customer satisfaction as the dependent variable. As shown in Table 10, the overall model was statistically significant (F = 110.820, p < 0.001) and accounted for 50.1% of the variance in customer satisfaction (R2 = 0.501; adjusted R2 = 0.496).
Table 10.
Effects of service quality dimensions on customer satisfaction.
At the dimension level, reliability, responsiveness, empathy, and tangibility all emerged as significant positive predictors of customer satisfaction, with coefficients of 0.259, 0.293, 0.177, and 0.179, respectively (all p < 0.001). Compensation was not statistically significant in the model (β = 0.031, p = 0.374). Comparing the standardized coefficients suggests that responsiveness contributed most strongly, followed by reliability, tangibility, and empathy. Therefore, H1a to H1d were supported, while H1e was rejected.
Notably, compensation does not contribute uniquely to the full five-dimension model. Because the service quality dimensions are correlated, the multivariate model estimates each dimension’s incremental contribution to satisfaction; under this specification, compensation appears to overlap with core process dimensions (e.g., responsiveness and empathy), so its added explanatory power is limited once those dimensions are controlled. However, the dimension-specific moderation models reported later indicate that compensation remains consequential when emotional states are salient: higher positive emotions strengthen the compensation–satisfaction linkage, whereas higher negative emotions weaken it. In other words, service recovery matters most when consumers’ affect shapes how remedial actions are perceived and evaluated.
4.3.2. Moderating Effect Analysis of Consumer Emotions
Moderating effect of positive emotions:
To examine whether positive emotions condition the effects of service quality dimensions on customer satisfaction, hierarchical regression analyses were conducted. The corresponding results are reported in Table 11, Table 12, Table 13, Table 14 and Table 15.
Table 11.
Positive emotions as a moderator between reliability and customer satisfaction.
Table 12.
Positive emotions as a moderator between responsiveness and customer satisfaction.
Table 13.
Positive emotions as a moderator between empathy and customer satisfaction.
Table 14.
Positive emotions as a moderator between tangibility and customer satisfaction.
Table 15.
Positive emotions as a moderator between compensation and customer satisfaction.
Table 11 shows that the interaction term of Reliability * Positive emotions is statistically significant (β = 0.111, p = 0.004), suggesting that positive emotions amplify the effect of reliability on customer satisfaction. Therefore, H2a is supported.
Table 12 shows that the interaction term of Responsiveness * Positive emotions is statistically significant (β = 0.086, p = 0.010), indicating that higher positive emotions amplify the impact of responsiveness on customer satisfaction. Thus, H2b is supported.
Table 13 shows that the interaction term Empathy * Positive emotions is positively significant (β = 0.156, p < 0.001), suggesting that empathy has a stronger association with customer satisfaction when positive emotions are higher. Consequently, H2c is supported.
Table 14 shows that the interaction term of Tangibility * Positive emotions is significantly positive (β = 0.128; p < 0.001), indicating that positive emotions strengthen the effect of tangibility on customer satisfaction. Accordingly, H2d is supported.
Table 15 shows that the interaction term of Compensation * Positive emotions is significantly positive (β = 0.111, p = 0.003), suggesting that higher positive emotions amplify the effect of compensation on customer satisfaction. Therefore, H2e is supported.
Overall, positive emotions strengthen the relationships between all five service quality dimensions and customer satisfaction. That is, if customers have more positive feelings during the service process, the impact of reliability, responsiveness, empathy, tangibility, and compensation on overall satisfaction will be greater. Therefore, H2 is supported.
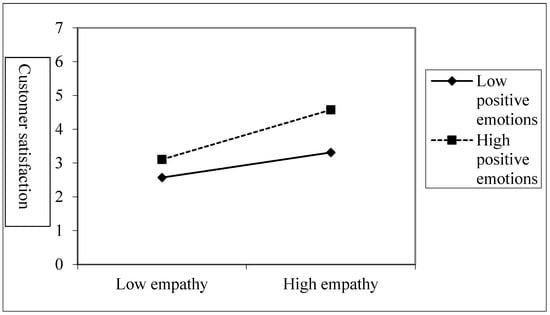
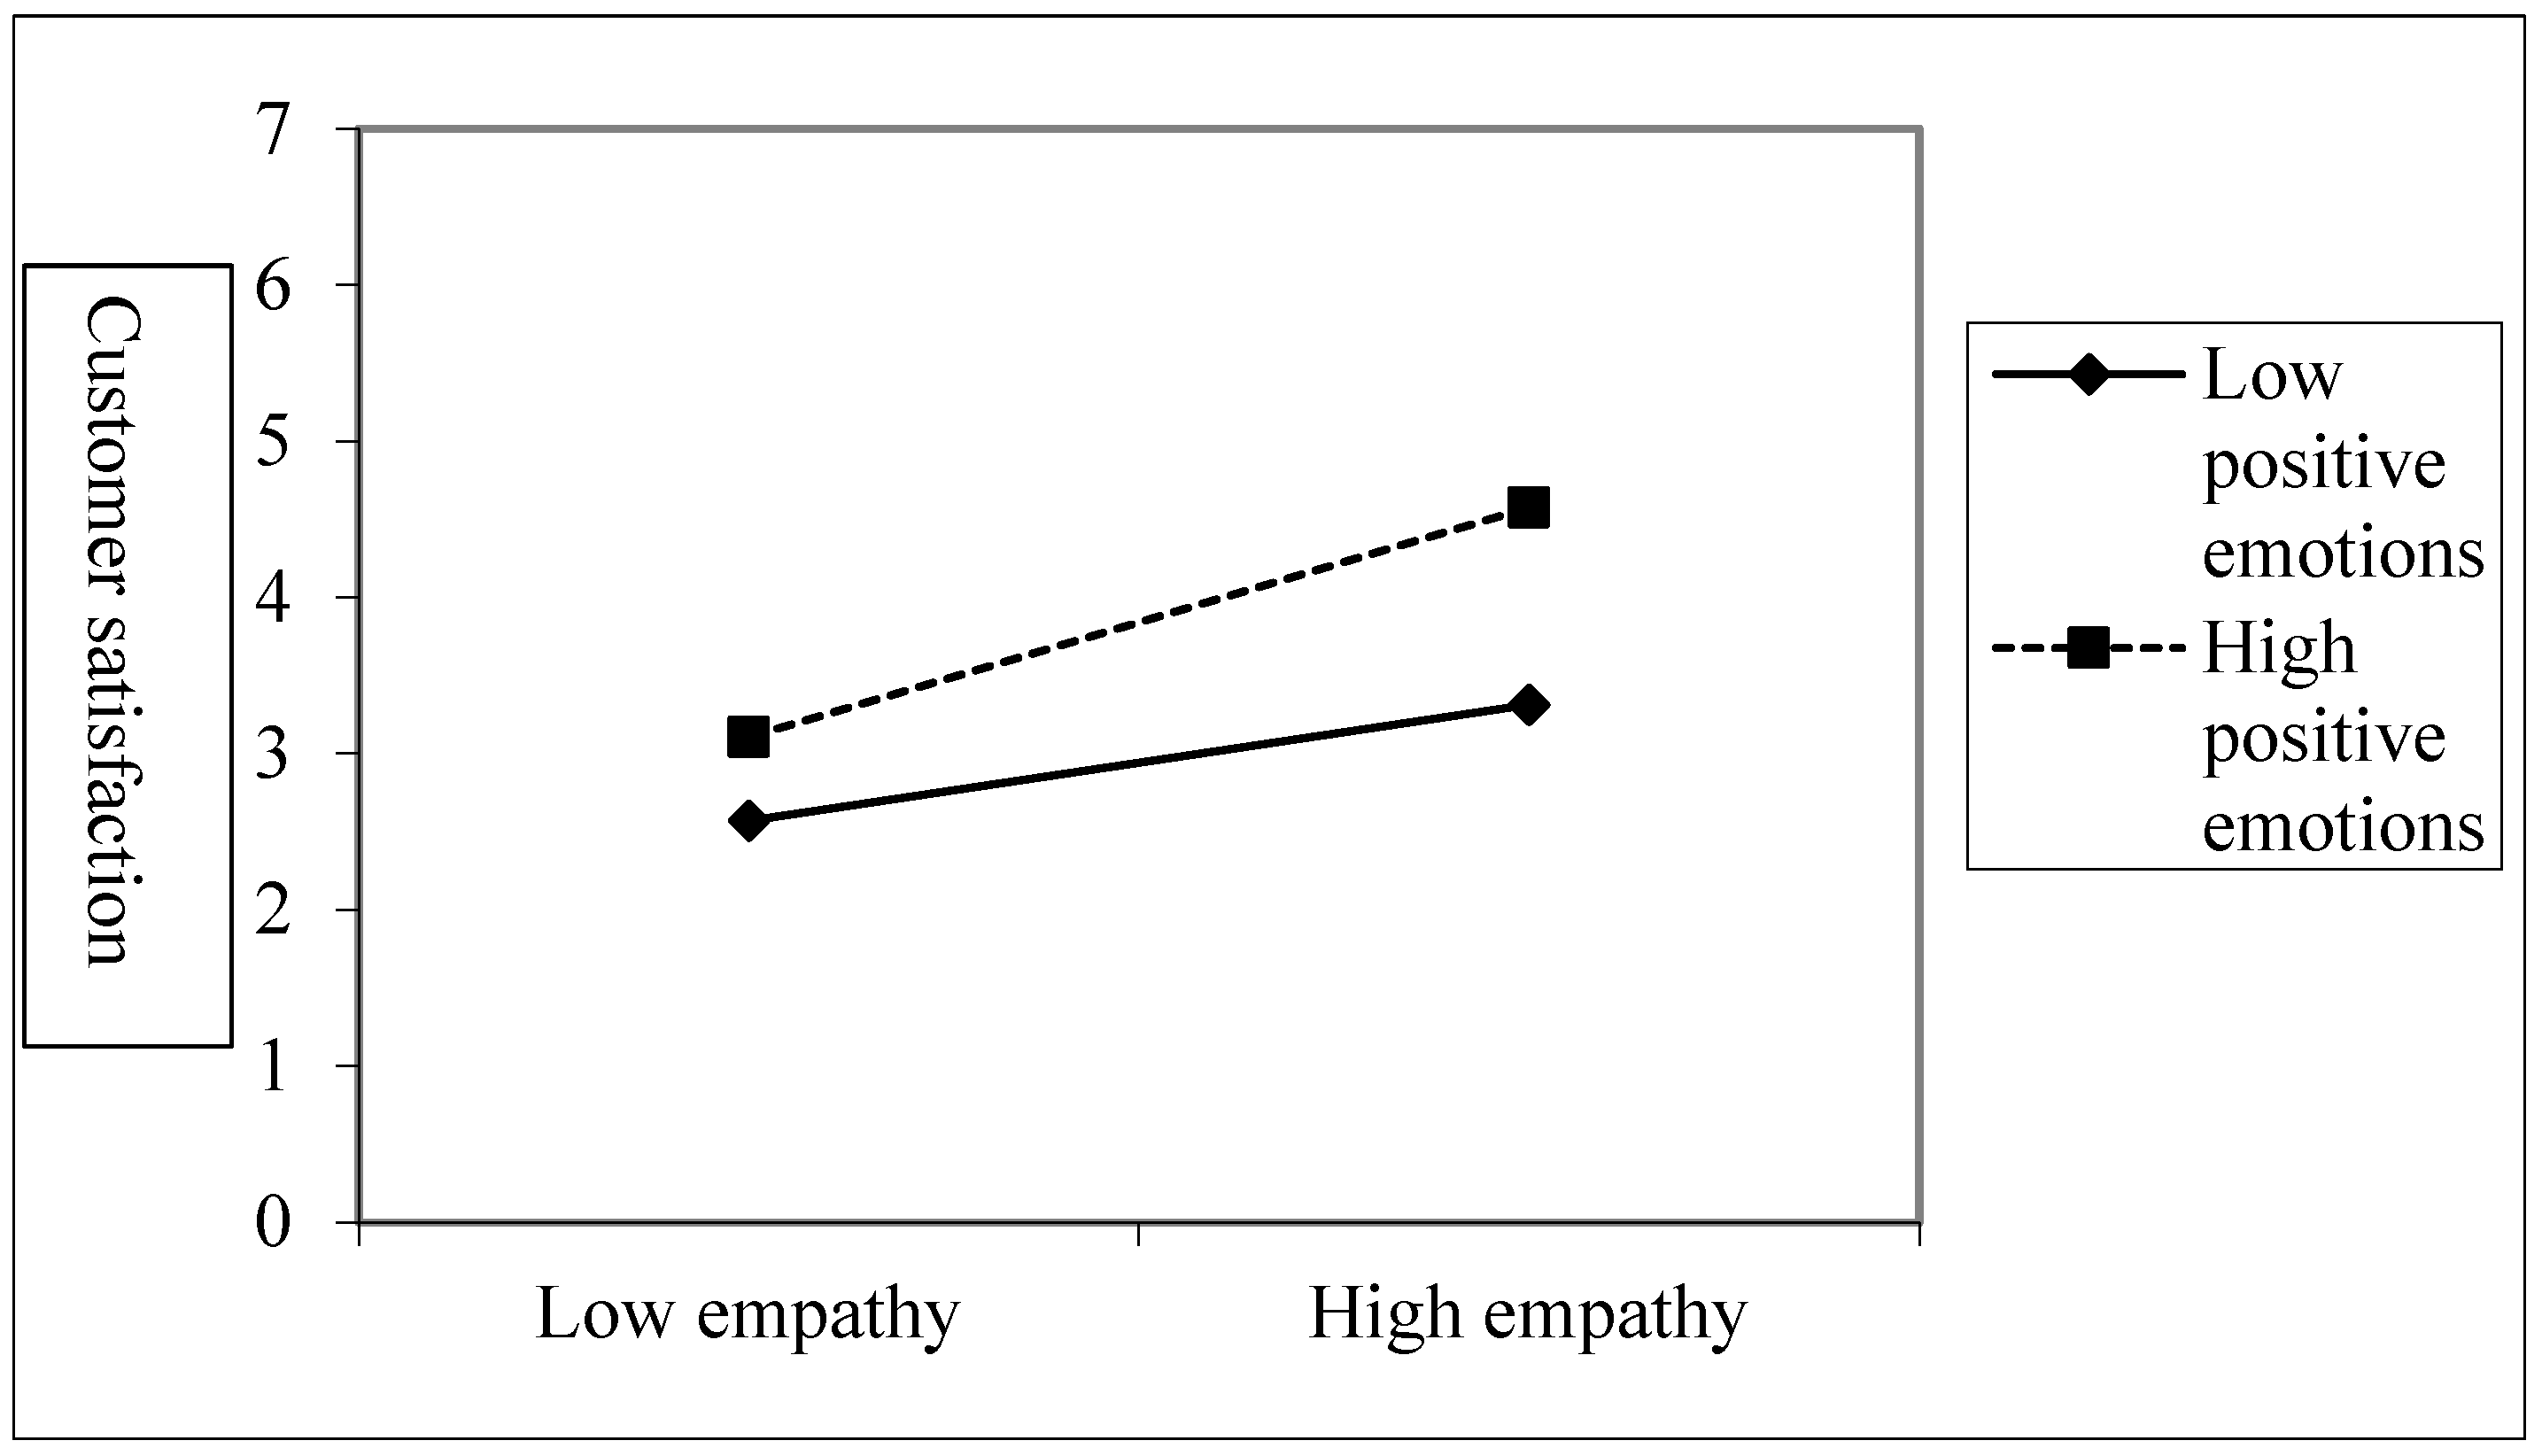
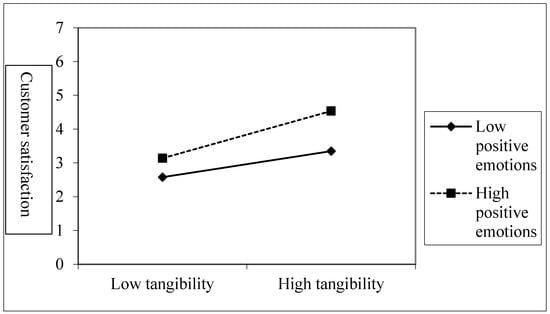
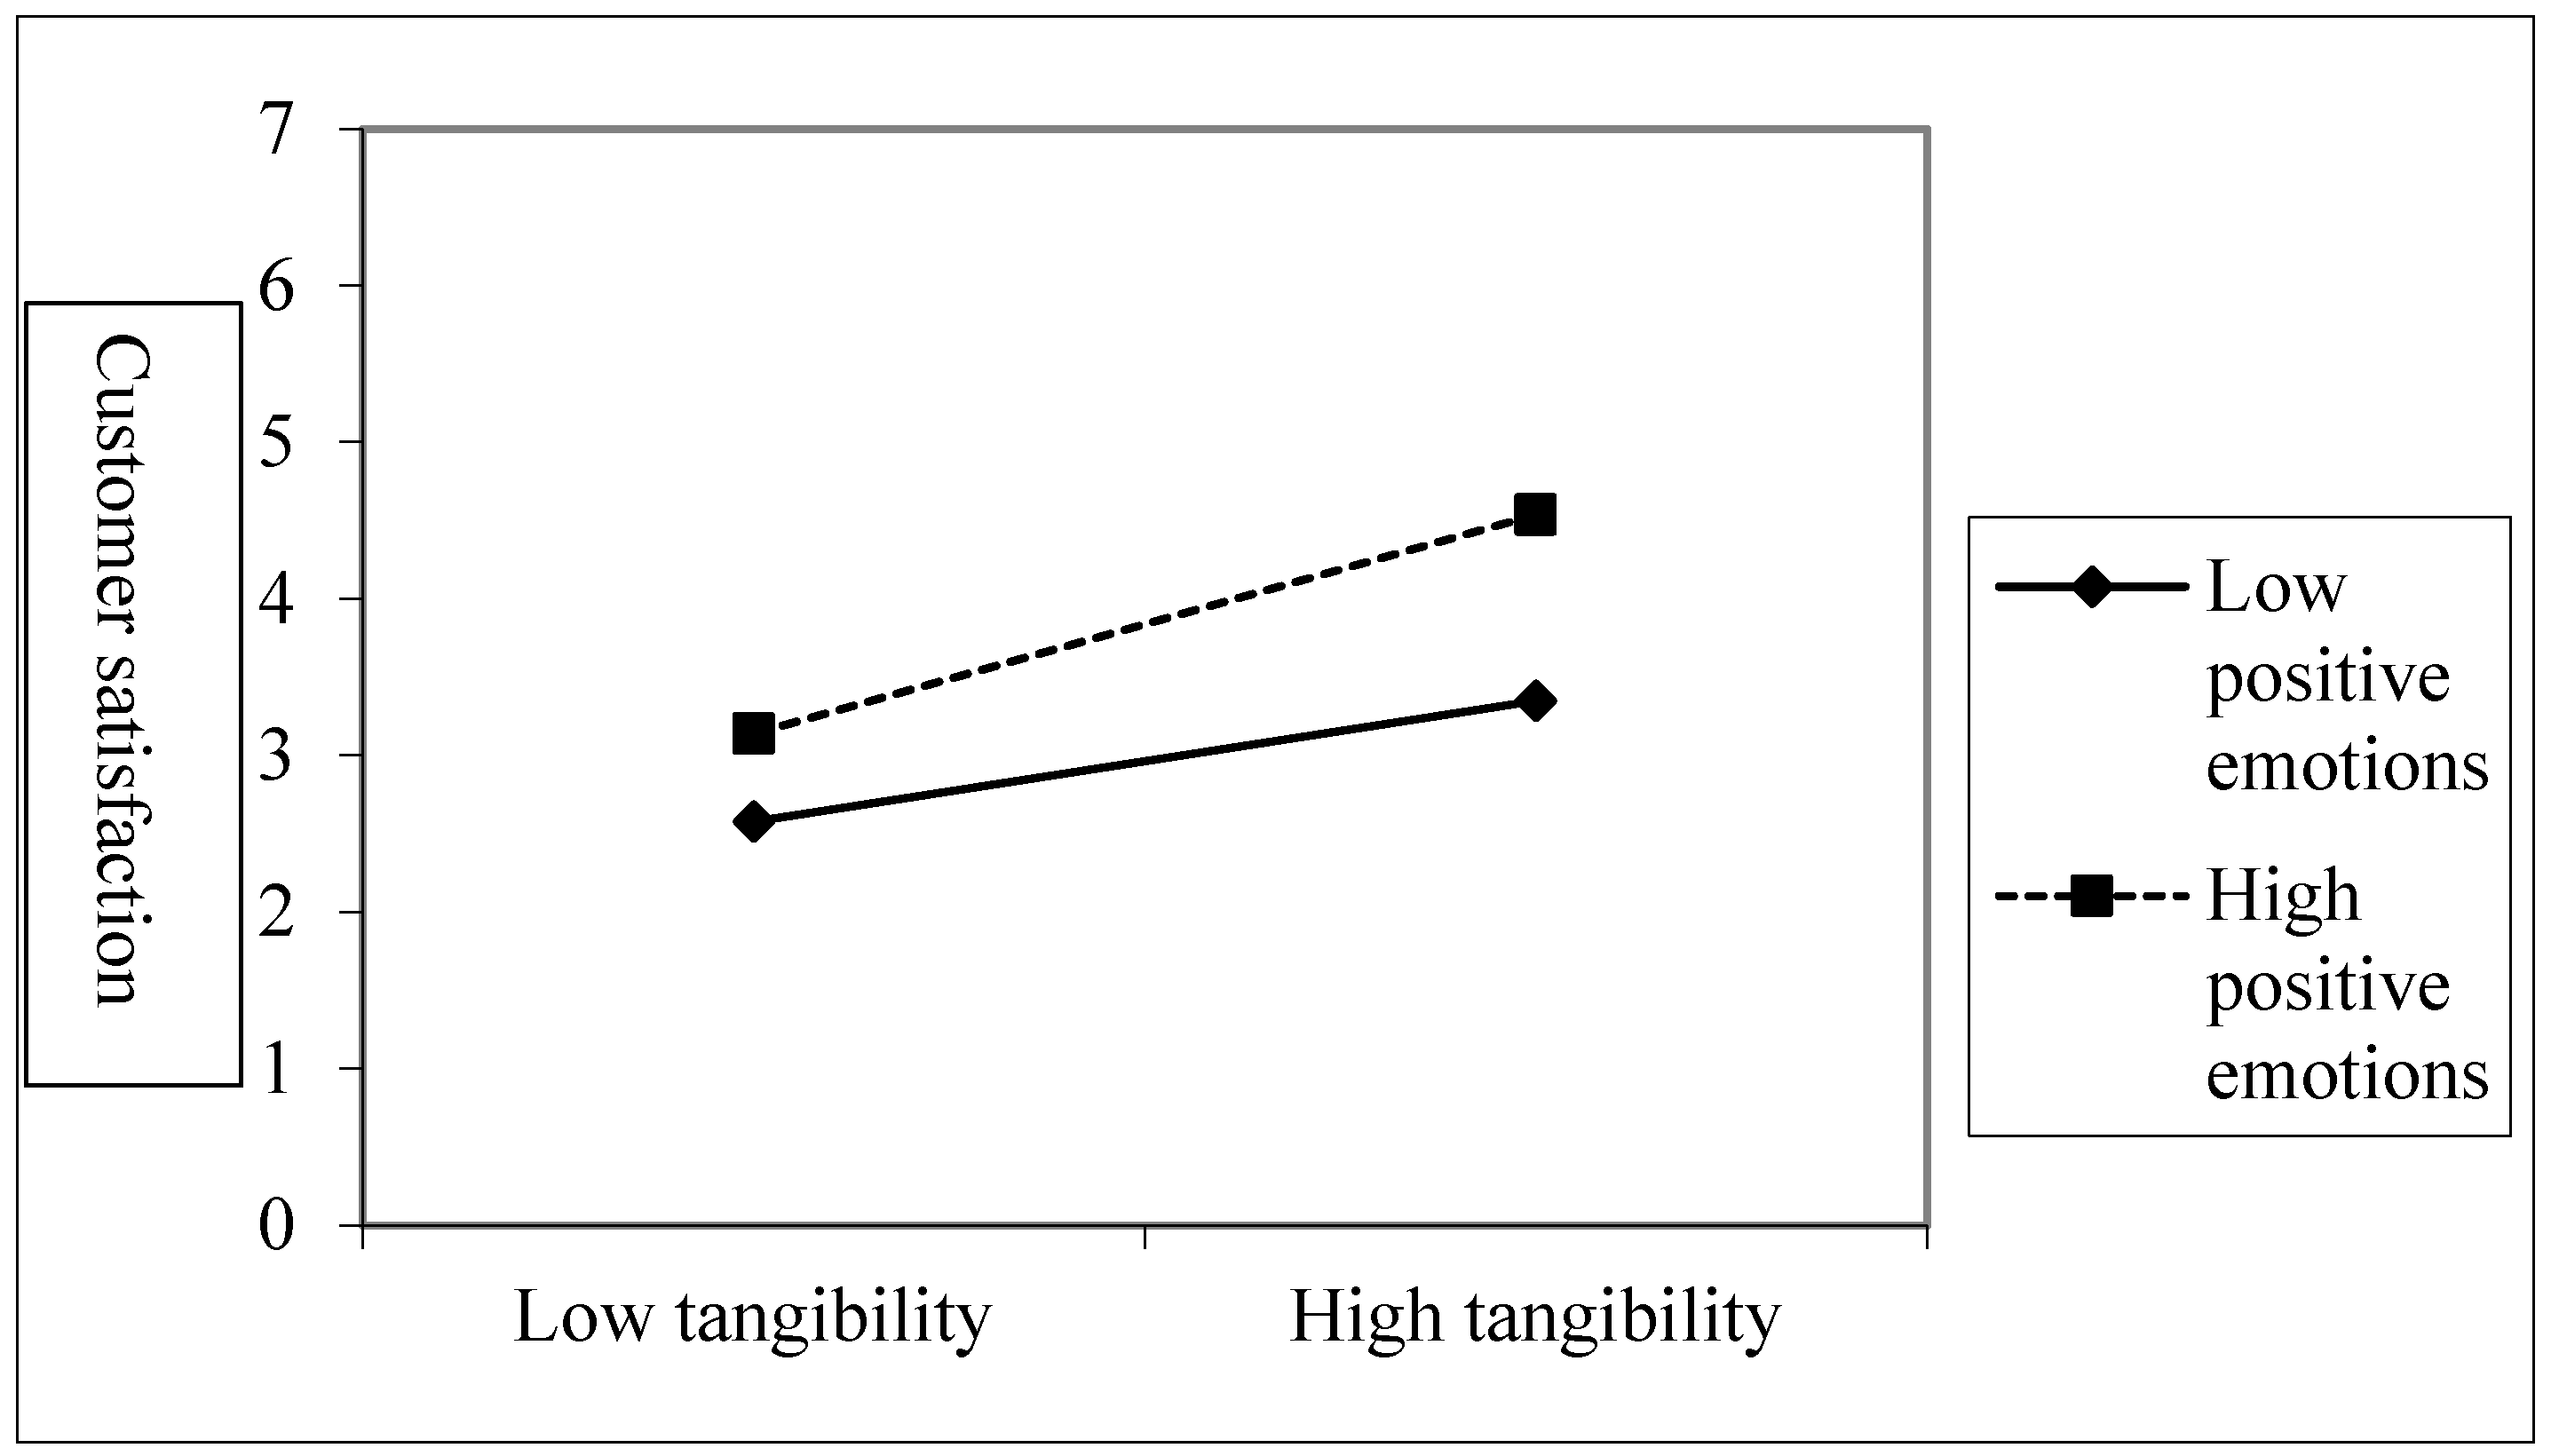
In order to offer a more meaningful explanation of the moderated relationships discovered in the hierarchical regression analysis, the interaction plots were also constructed for the significant interaction terms. Figure 2 and Figure 3 depict the simple slope pattern for two representative positive interaction effects. These two figures give a more intuitive explanation of how positive emotions improve the positive effect of service quality dimensions on customer satisfaction.
Figure 2.
Moderating effect of positive emotions on the relationship between empathy and customer satisfaction.
Figure 3.
Moderating effect of positive emotions on the relationship between tangibility and customer satisfaction.
As shown in Figure 2, the slope of high positive emotions is much steeper than that of low positive emotions, which suggests that positive emotions enhance the positive relationship between empathy and customer satisfaction. In other words, when customers feel more positive emotions, the positive impact of empathy on customer satisfaction gets steeper. This result can be corroborated with the results in Table 13, where the value of Empathy * Positive emotions is positive and significant, and the explained variance increases from 0.372 to 0.394 after the interaction term is added.
Figure 3 shows that the impact of tangibility on customer satisfaction is more positive (or in other words, the slope is steeper) when positive emotions are high. The steeper slope when the positive emotions are high is visually confirmed as positive emotions increase the positive impact of tangibility on customer satisfaction. The visual trend is consistent with Table 14 which shows positive and significant Tangibility * Positive emotions interaction and increase in explained variance from 0.351 to 0.363 after including interaction term.
In general, the interaction plots for positive emotions are consistent with the regression results. That is, higher positive emotions increase the positive effects of service quality dimensions on customer satisfaction.
Moderating effect of negative emotions:
To test whether negative emotions condition the effects of service quality dimensions on customer satisfaction, we ran hierarchical regression analyses. The detailed results are presented in Table 16, Table 17, Table 18, Table 19 and Table 20.
Table 16.
Negative emotions as a moderator between reliability and customer satisfaction.
Table 17.
Negative emotions as a moderator between responsiveness and customer satisfaction.
Table 18.
Negative emotions as a moderator between empathy and customer satisfaction.
Table 19.
Negative emotions as a moderator between tangibility and customer satisfaction.
Table 20.
Negative emotions as a moderator between compensation and customer satisfaction.
Table 16 indicates that the Reliability * Negative emotions interaction is not significant (β = −0.039, p = 0.271), suggesting no moderating effect. Therefore, H3a is not supported.
As shown in Table 17, the interaction term Responsiveness * Negative emotions is not significant (β = −0.051, p = 0.125), indicating no moderating effect; thus, Hypothesis H3b is not supported.
Table 18 reports a negative and significant Empathy * Negative emotions interaction (β = −0.094, p = 0.007), indicating that negative emotions reduce the effect of empathy on customer satisfaction. Accordingly, H3c is supported.
Table 19 shows a negative and significant Tangibility * Negative emotions (β = −0.078, p = 0.026), suggesting that negative emotions weaken the effect of tangibility on customer satisfaction. Therefore, H3d is supported.
Table 20 reports a significantly negative Compensation * Negative emotions interaction (β = −0.138, p < 0.001), indicating that negative emotions weaken the effect of compensation on customer satisfaction. Therefore, H3e is supported.
Overall, negative emotions show a partial moderating effect. More precisely, negative emotions considerably weaken the relationships of empathy, tangibility, and compensation with customer satisfaction, whereas negative emotions do not moderate the relationships of reliability and responsiveness. Hence, Hypothesis H3 is partially supported (H3c–H3e supported; H3a–H3b not supported).
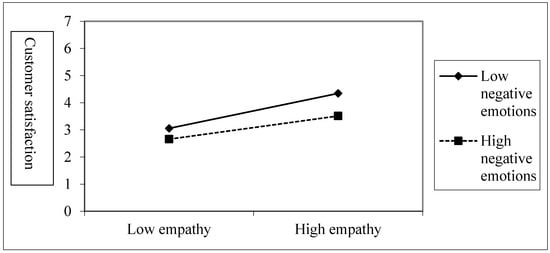
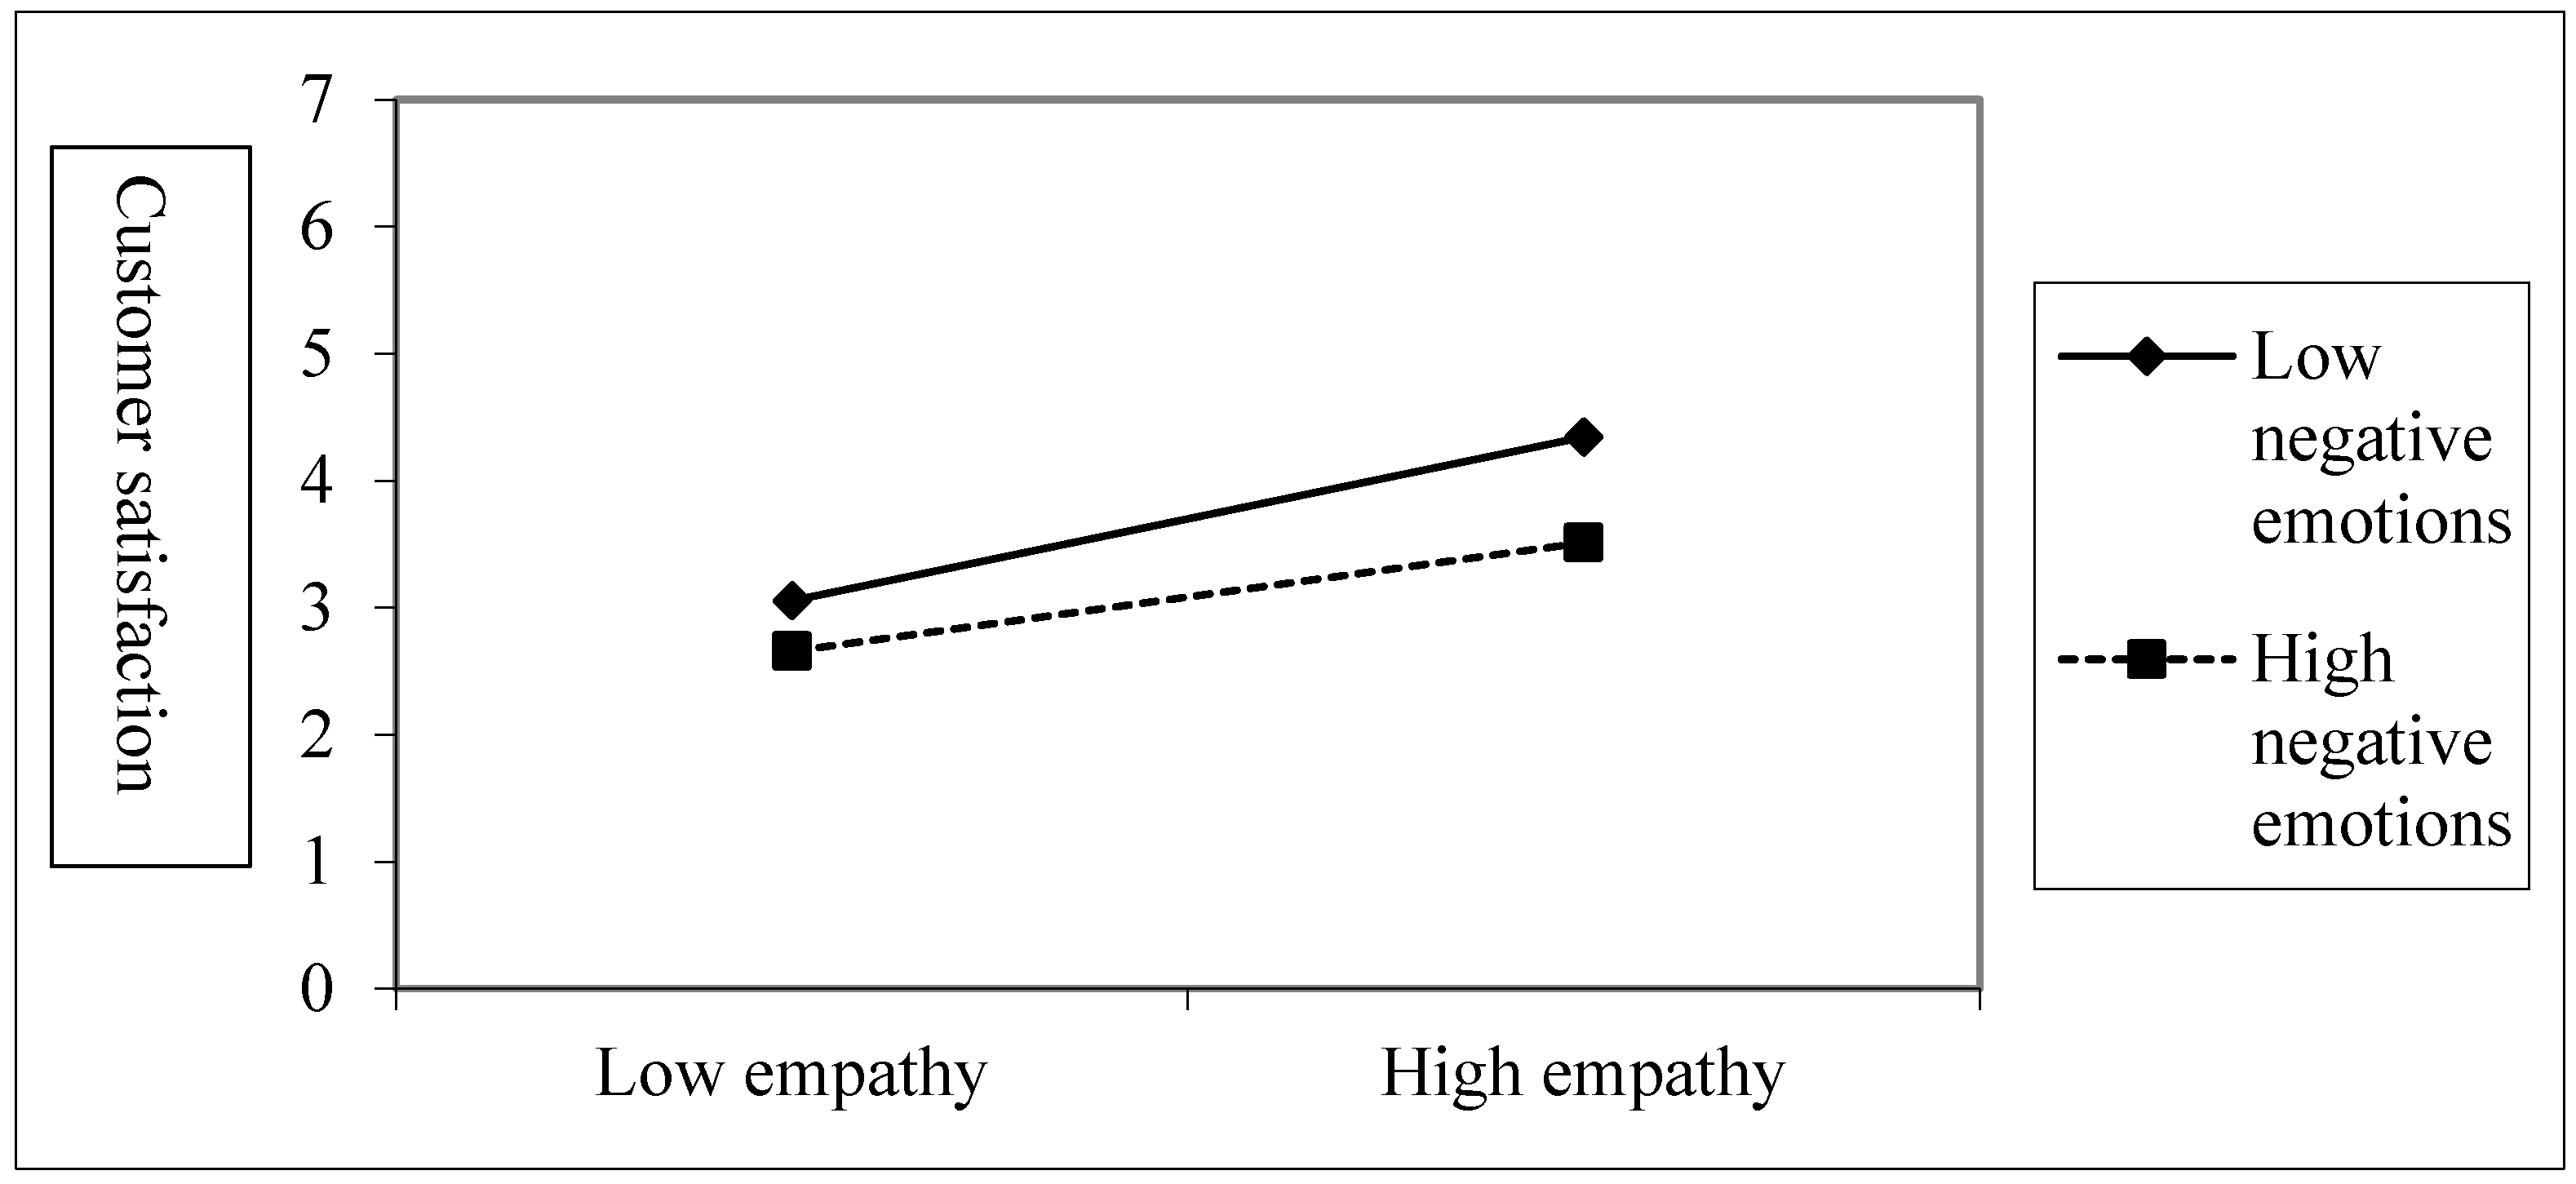
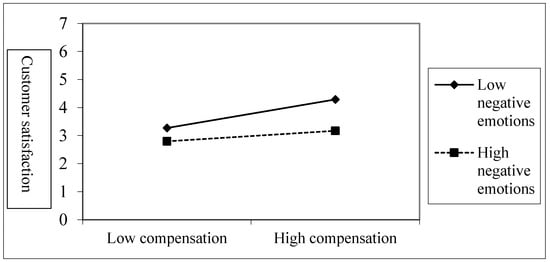
To demonstrate the moderating effects even more clearly, we also constructed the interaction plots for the two representative negative interaction terms; that is, Figure 4 and Figure 5 are the plots for two representative negative moderating effects which are more intuitive to explain the attenuating effect of negative emotions.
Figure 4.
Moderating effect of negative emotions on the relationship between empathy and customer satisfaction.
Figure 5.
Moderating effect of negative emotions on the relationship between compensation and customer satisfaction.
As shown in Figure 4, the slope under high negative emotions is flatter than that under low negative emotions. This means that negative emotions reduce the positive relationship between empathy and customer satisfaction. In other words, the impact of empathy on customer satisfaction is weakened when customers have stronger negative emotions. This result is also consistent with Table 18. That is, the Empathy * Negative emotions interaction is negative and significant, and the explained variance increases from 0.336 to 0.345 after the interaction term is added.
Figure 5 also shows that the positive effect of compensation on customer satisfaction is weaker when negative emotions are high. The flattest slope when negative emotions are high supports the negative moderating effect of negative emotions in the compensation and customer satisfaction relationship. This result is consistent with the result in Table 20 that reports a negative and significant Compensation * Negative emotions interaction. Also, the explained variance increases from 0.245 to 0.265 after the interaction term is added.
In total, the interaction plots for negative emotions support the regression results that negative emotions attenuate the positive effects of specific service quality dimensions on customer satisfaction.
4.4. Research Findings
The results of this study further explain how high-speed railway service quality influences customer satisfaction in Guangzhou’s context. Overall, service quality has a positive impact on customer satisfaction. Previous service and transport research has indicated that perceived service performance is still an important antecedent of satisfaction. It has been extensively documented in both general service contexts and railway and public transport contexts that service quality affects customers’ evaluations, loyalty, and overall trip experiences (Cronin & Taylor, 1992; Carrillat et al., 2009; van Lierop et al., 2018; Zhen et al., 2018).
At the dimensional level, reliability, responsiveness, empathy, and tangibility show positive and significant impacts on satisfaction. This result is consistent with many previous studies which argue that reliability, assistance, staff consideration, cleanliness and the physical environment are important in the evaluation of transport services. In the case of high-speed railway services, customers usually consider a lot whether the service will be on time, whether the problems can be solved well, whether the train is comfortable and the service is well organized. The results of this study support the multidimensional concept of service quality in the SERVQUAL/SERVPERF tradition and some more recent rail-based service research (van Lierop et al., 2018; Vasanthi et al., 2023; Ibrahim et al., 2025; International Union of Railways [UIC], 2024).
However, compensation does not exhibit a significant direct effect in the complete model. Unlike the other four dimensions, this finding indicates that compensation may play less the role of a routine service-quality attribute and more of a recovery-related attribute that is salient mainly when delays, disruptions, or service failures happen. In ordinary travel situations, customers are more likely to ask themselves whether the journey is reliable, responsive, comfortable, and well managed. This result is also consistent with the railway experience research, in which it was found that customers’ evaluations are more likely to be based on core journey attributes and emotional moments of truth, and the importance of individual remedial actions more depends on the occurrence of irregular and problematic services (van Hagen & Bron, 2014; Zhen et al., 2018; Song et al., 2024).
The results of the moderating analysis also support this conclusion. Overall, positive emotions significantly strengthen the effects of the five service quality dimensions on customer satisfaction, which is consistent with previous studies that reported that favorable emotional states increase the customers’ responses to positive service cues and lead to better evaluations of their journeys. By contrast, negative emotions only weaken the effects of empathy, tangibility, and compensation but not reliability and responsiveness. That is, reliability and responsiveness appear to be more stable attributes related to performance rather than the other three service quality dimensions, which are more affected by emotional states because they are more closely related to interpersonal care, environmental factors, and remedial actions. Therefore, the results of this study indicate that the service quality–customer satisfaction relationship is multidimensional and emotionally contingent (van Hagen & Bron, 2014; Song et al., 2024; Vasanthi et al., 2023).
5. Conclusions
This study shows that high-speed railway service quality is an important predictor of customer satisfaction in Guangzhou. Reliability, responsiveness, empathy, and tangibility influence customer satisfaction, but compensation does not significantly influence customers directly. Furthermore, positive emotions positively moderate all five service quality–satisfaction relationships, but negative emotions only weaken the service quality effects on satisfaction from empathy, tangibility, and compensation. Thus, customer satisfaction for high-speed railway services is conditional on service performance and emotion.
This study supports a multidimensional view of high-speed railway service quality and shows that positive and negative emotions should be considered as two distinct moderating conditions. Practically, the results indicate that railway operators should focus on reliable services, on time assistance, on empathic service, and on improving the tangible service environment. In addition, they should pay attention to consumers’ emotional experiences.
There are some limitations to this study. First of all, the data were collected from customers from major high-speed railway stations in Guangzhou, so it is possible that the results of this study cannot be generalized to customers in other cities/regions or railway systems with different service environments and passengers’ characteristics. Second, the design of this study was cross-sectional; thus, the results should be interpreted as associative rather than causally related. Third, all variables were collected by self-report questionnaires, which might result in perceptual bias. However, the results of the common method bias test revealed that common method bias was not a serious concern in this study. Fourth, the empirical model in this study mainly considered service quality dimensions and consumer emotions; however, there are still many other related variables that should be considered, such as perceived value, loyalty intention, complaint behavior, service recovery expectations and travel purpose.
Future research could generalize this study in various directions. First, researchers could apply the proposed model in other geographic contexts and test different railway hubs, routes, or transport contexts to see whether similar relationships exist across service contexts. Second, longitudinal or multi-wave designs could be applied to mitigate the limitation of the cross-sectional design used in this study and to capture the dynamics of customer emotions and satisfaction formation at different stages of the travel journey better. Third, future studies could also include other mediating or moderating variables, such as perceived value, service fairness, loyalty, trust, or travel purpose, to offer a more explanatory account of passenger evaluations. Finally, although compensation did not display a meaningful direct effect in the full model, it did show an effect under specific emotional conditions. Future studies could therefore focus on service recovery situations and delay experiences to further investigate disruption scenarios and to understand when and how compensation-related practices influence customer satisfaction.
Author Contributions
Conceptualization, J.C. and C.K.; methodology, J.C.; software, J.C.; validation, J.C., C.K. and L.Z.; formal analysis, J.C.; investigation, J.C. and L.Z.; resources, J.C. and C.K.; data curation, J.C.; writing—original draft preparation, J.C.; writing—review and editing, J.C. and C.K.; visualization, J.C. and L.Z.; supervision, C.K.; project administration, J.C. and C.K. All authors have read and agreed to the published version of the manuscript.
Funding
This study was supported by the Guangzhou Philosophy and Social Science Development “14th Five-Year Plan” 2025 Co-Construction Project “Research on Warm Touchpoint of Smart Community Service Quality Based on Emotional Perspective—A Case Study of Guangzhou City” (Project Number: 2025GZGJ257).
Institutional Review Board Statement
This study complied with the principles of the Declaration of Helsinki and received ethical approval from the Human Research Ethics Committee of Walailak University (approval no. WUEC-25-200-01; approved on 12 June 2025).
Informed Consent Statement
All participants provided written informed consent before taking part in the data collection.
Data Availability Statement
The data supporting the findings of this study can be obtained from the corresponding author upon reasonable request.
Conflicts of Interest
The authors report no conflicts of interest.
References
- Brady, M. K., & Cronin, J. J., Jr. (2001). Some new thoughts on conceptualizing perceived service quality: A hierarchical approach. Journal of Marketing, 65(3), 34–49. [Google Scholar] [CrossRef] [Scilit]
- Carrillat, F. A., Jaramillo, F., & Mulki, J. P. (2009). Examining the impact of service quality: A meta-analysis of empirical evidence. Journal of Marketing Theory and Practice, 17(2), 95–110. [Google Scholar] [CrossRef] [Scilit]
- Caruelle, D., Shams, P., Gustafsson, A., & Lervik-Olsen, L. (2024). Emotional arousal in customer experience: A dynamic view. Journal of Business Research, 170, 114344. [Google Scholar] [CrossRef] [Scilit]
- CPC Central Committee & State Council of the People’s Republic of China. (2019). Outline for building China’s strength in transport. State Council Gazette, 2019(28), 63. [Google Scholar]
- Cronin, J. J., Brady, M. K., & Hult, G. T. M. (2000). Assessing the effects of quality, value, and customer satisfaction on consumer behavioral intentions in service environments. Journal of Retailing, 76(2), 193–218. [Google Scholar] [CrossRef] [Scilit]
- Cronin, J. J., & Taylor, S. A. (1992). Measuring service quality: A reexamination and extension. Journal of Marketing, 56(3), 55–68. [Google Scholar] [CrossRef] [Scilit]
- De Cleen, T., Baecke, P., & Goedertier, F. (2025). The influence of emotions and communication style on customer satisfaction and recommendation in a call center context: An NLP-based analysis. Journal of Business Research, 189, 115192. [Google Scholar] [CrossRef] [Scilit]
- de Oña, J. (2020). The role of involvement with public transport in the relationship between service quality, satisfaction and behavioral intentions. Transportation Research Part A: Policy and Practice, 142, 296–318. [Google Scholar] [CrossRef] [Scilit]
- de Oña, J., & de Oña, R. (2015). Quality of service in public transport based on customer satisfaction surveys: A review and assessment of methodological approaches. Transportation Science, 49(3), 605–622. [Google Scholar] [CrossRef] [Scilit]
- Dong, W., Qi, R., Wang, D., Zhang, W., & Liu, X. (2025). Service quality assessment and optimization of high-speed railway waiting halls using a Kano model and multidimensional questionnaire analysis. Buildings, 15(8), 1212. [Google Scholar] [CrossRef] [Scilit]
- Dong, Z., Zhang, J., Gong, X., & Wang, L. (2024). The role of smart travel service in intercity travel satisfaction: Does traveler heterogeneity matter? Sustainability, 16(17), 7448. [Google Scholar] [CrossRef] [Scilit]
- Drouet, L., Lallemand, C., Koenig, V., Viti, F., & Bongard-Blanchy, K. (2023). Uncovering factors influencing railway passenger experiences through love and breakup declarations. Applied Ergonomics, 111, 104030. [Google Scholar] [CrossRef] [Scilit] [PubMed]
- Eboli, L., & Mazzulla, G. (2015). Relationships between rail passengers’ satisfaction and service quality: A framework for identifying key service factors. Public Transport, 7(2), 185–201. [Google Scholar] [CrossRef] [Scilit]
- Gerou, A. (2024). Monitoring emotions throughout the onboard customer journey: Evidence from the travel and tourism industry. Cogent Social Sciences, 10(1), 2318883. [Google Scholar] [CrossRef] [Scilit]
- Guo, Y., Li, Y., Liu, D., & Xu, S. X. (2024). Measuring service quality based on customer emotion: An explainable AI approach. Decision Support Systems, 176, 114051. [Google Scholar] [CrossRef] [Scilit]
- Güner, S., Taşkın, K., Cebeci, H. İ., & Aydemir, E. (2024). Service quality in rail systems: Listen to the voice of social media. Transportation Research Record, 2678(6), 824–847. [Google Scholar] [CrossRef] [Scilit]
- He, Y., & Zhang, X. (2006). Preliminary research of classification of Chinese consumers’ consumption emotions. Consumer Economics, 22(4), 16–19. [Google Scholar]
- Hu, H.-H., Kandampully, J., & Juwaheer, T. D. (2009). Relationships and impacts of service quality, perceived value, customer satisfaction, and image: An empirical study. The Service Industries Journal, 29(2), 111–125. [Google Scholar] [CrossRef] [Scilit]
- Ibrahim, S., Zhang, Y., & Ahmad, A. (2025). Rail-based public transportation service quality and customer satisfaction: A decade of insights and advances. Public Transport, 17(1), 45–69. [Google Scholar] [CrossRef] [Scilit]
- International Union of Railways [UIC]. (2024). How to measure and improve customer experience by rail. UIC. [Google Scholar]
- Ismael, K., & Duleba, S. (2021). Investigation of the relationship between the perceived public transport service quality and satisfaction: A PLS-SEM technique. Sustainability, 13(23), 13018. [Google Scholar] [CrossRef] [Scilit]
- Jomnonkwao, S., Champahom, T., & Ratanavaraha, V. (2020). Methodologies for determining the service quality of the intercity rail service based on users’ perceptions and expectations in Thailand. Sustainability, 12(10), 4259. [Google Scholar] [CrossRef] [Scilit]
- Kotler, P., & Keller, K. L. (2009). Marketing management (13th ed.). Pearson Prentice Hall. [Google Scholar]
- Laros, F. J. M., & Steenkamp, J.-B. E. M. (2005). Emotions in consumer behavior: A hierarchical approach. Journal of Business Research, 58(10), 1437–1445. [Google Scholar] [CrossRef] [Scilit]
- Lee, H., Lee, Y., & Yoo, D. (2000). The determinants of perceived service quality and its relationship with satisfaction. Journal of Services Marketing, 14(3), 217–231. [Google Scholar] [CrossRef] [Scilit]
- Li, R., Li, Y.-Q., Ruan, W.-Q., Zhang, S.-N., & Wang, M.-Y. (2023). Sentiment mining of online reviews of peer-to-peer accommodations: Customer emotional heterogeneity and its influencing factors. Tourism Management, 96, 104704. [Google Scholar] [CrossRef] [Scilit]
- Lieophairot, C., & Rojniruttikul, N. (2023). Factors affecting state railway of Thailand (SRT) passenger train service use decision: A structural equation model. Heliyon, 9(5), e15660. [Google Scholar] [CrossRef] [Scilit] [PubMed]
- Luo, S., He, S. Y., Grant-Muller, S., & Song, L. (2023). Influential factors in customer satisfaction of transit services: Using crowdsourced data to capture the heterogeneity across individuals, space and time. Transport Policy, 131, 173–183. [Google Scholar] [CrossRef] [Scilit]
- Monsuur, F., Enoch, M., Quddus, M., & Meek, S. (2021). Modelling the impact of rail delays on passenger satisfaction. Transportation Research Part A: Policy and Practice, 152, 19–35. [Google Scholar] [CrossRef] [Scilit]
- National Development and Reform Commission [NDRC]. (2022). The outline of the 14th five-year plan for economic and social development (2021–2025) and long-range objectives through the year 2035 of the People’s Republic of China. Available online: https://en.ndrc.gov.cn/policies/202203/P020220315511326748336.pdf (accessed on 31 January 2026).
- Nilsson, J., Jansson, J., Nicholas, K., & Zhao, C. (2025). Traveler perceived service quality and satisfaction with public transport: The influence of digital competence and environmental attitudes. Transport Policy, 172, 103741. [Google Scholar] [CrossRef] [Scilit]
- Oliver, R. L. (1993). Cognitive, affective, and attribute bases of the satisfaction response. Journal of Consumer Research, 20(3), 418–430. [Google Scholar] [CrossRef] [Scilit]
- Parasuraman, A., Berry, L. L., & Zeithaml, V. A. (1991). Refinement and reassessment of the SERVQUAL scale. Journal of Retailing, 67(4), 420–450. [Google Scholar]
- Parasuraman, A., Zeithaml, V. A., & Berry, L. L. (1985). A conceptual model of service quality and its implications for future research. Journal of Marketing, 49(4), 41–50. [Google Scholar] [CrossRef] [Scilit]
- Parasuraman, A., Zeithaml, V. A., & Berry, L. L. (1988). SERVQUAL: A multiple-item scale for measuring consumer perceptions of service quality. Journal of Retailing, 64(1), 12–40. [Google Scholar]
- Parasuraman, A., Zeithaml, V. A., & Berry, L. L. (1994). Reassessment of expectations as a comparison standard in measuring service quality: Implications for further research. Journal of Marketing, 58(1), 111–124. [Google Scholar] [CrossRef] [Scilit]
- Ruiz, E., Yushimito, W. F., Aburto, L., & de la Cruz, R. (2024). Predicting passenger satisfaction in public transportation using machine learning models. Transportation Research Part A: Policy and Practice, 181, 103995. [Google Scholar] [CrossRef] [Scilit]
- Sandberg, B., Hurmerinta, L., Helminen, V., & Leino, H. (2024). A new tramway and the formation of emotional commuting experiences. Transportation Research Part F: Traffic Psychology and Behaviour, 104, 31–41. [Google Scholar] [CrossRef] [Scilit]
- Seriani, S., Aprigliano, V., Gonzalez, S., Baeza, G., López, A., & Fujiyama, T. (2024). The effect of seat layout on the interaction of passengers inside the train carriage: An experimental approach for urban services. Sustainability, 16(3), 998. [Google Scholar] [CrossRef] [Scilit]
- Song, R., Shi, W., Qin, W., Xue, X., & Jin, H. (2024). Exploring passengers’ emotions and satisfaction: A comparative analysis of airport and railway station through online reviews. Sustainability, 16(5), 2108. [Google Scholar] [CrossRef] [Scilit]
- Spector, P. E., & Brannick, M. T. (2009). Common method variance or measurement bias? The problem and possible solutions. In D. A. Buchanan, & A. Bryman (Eds.), The SAGE handbook of organizational research methods (pp. 346–362). SAGE. [Google Scholar]
- Taylor, K. A. (1997). A regret theory approach to assessing consumer satisfaction. Marketing Letters, 8(2), 229–238. [Google Scholar] [CrossRef] [Scilit]
- van Hagen, M., & Bron, P. (2014). Enhancing the experience of the train journey: Changing the focus from satisfaction to emotional experience of customers. Transportation Research Procedia, 1, 253–263. [Google Scholar] [CrossRef] [Scilit]
- van Lierop, D., Badami, M. G., & El-Geneidy, A. M. (2018). What influences satisfaction and loyalty in public transport? A review of the literature. Transport Reviews, 38(1), 52–72. [Google Scholar] [CrossRef] [Scilit]
- Vasanthi, M. G., Soundararajan, V., Nawaz, N., Gajendran, V., & Parayitam, S. (2023). Passenger satisfaction with cleanliness and other service quality dimensions and gender as a moderator: Evidence from Indian Railways. Cogent Business & Management, 10(1), 2183568. [Google Scholar] [CrossRef] [Scilit]
- Wahab, S. N., Hamzah, M. I., Suki, N. M., Chong, Y. S., & Kua, C. P. (2025). Unveiling passenger satisfaction in rail transit through a consumption values perspective. Multimodal Transportation, 4(2), 100196. [Google Scholar] [CrossRef] [Scilit]
- Wei, B. (2023). User experience-driven digital transformation strategy for high-speed railway. Advance in Sustainability, 3(1), 7–14. [Google Scholar] [CrossRef] [Scilit]
- Wen, B. Y., Han, X. Y., & Wu, X. Y. (2003). An empirical study on the relationship between consumer emotions and customer satisfaction. Tourism Science, 17(4), 1–6. [Google Scholar]
- Weng, J., Yu, J., Di, X., Lin, P., Wang, J.-J., & Mao, L.-Z. (2023). How does the state of bus operations influence passengers’ service satisfaction? A method considering the differences in passenger preferences. Transportation Research Part A: Policy and Practice, 174, 103734. [Google Scholar] [CrossRef] [Scilit]
- Yang, Q., Liu, M., Chen, Z.-S., Yan, W.-M., Jiang, W.-H., & Deveci, M. (2025). How to sustainably improve passenger satisfaction of high-speed rail in China? A text mining and product-service system integrated approach. Transport Policy, 168, 244–262. [Google Scholar] [CrossRef] [Scilit]
- Yu, W. Y., & Li, J. X. (2010). The impact of airline service quality and consumption emotion on customer satisfaction. Tourism Tribune, 25(10), 49–56. [Google Scholar]
- Zeng, Z., Wang, M., Gao, X., & Wang, N. (2024). Exploring passenger satisfaction in multimodal railway hubs: A social media-based analysis of travel behavior in China’s major rail stations. Sustainability, 16(12), 4881. [Google Scholar] [CrossRef] [Scilit]
- Zhen, F., Cao, J., & Tang, J. (2018). Exploring correlates of passenger satisfaction and service improvement priorities of the Shanghai–Nanjing high-speed rail. Journal of Transport and Land Use, 11(1), 559–573. [Google Scholar] [CrossRef] [Scilit]

Disclaimer/Publisher’s Note: The statements, opinions and data contained in all publications are solely those of the individual author(s) and contributor(s) and not of MDPI and/or the editor(s). MDPI and/or the editor(s) disclaim responsibility for any injury to people or property resulting from any ideas, methods, instructions or products referred to in the content. |
© 2026 by the authors. Licensee MDPI, Basel, Switzerland. This article is an open access article distributed under the terms and conditions of the Creative Commons Attribution (CC BY) license.