


Abstract
This study develops a comprehensive evaluation index system for assessing the sports tourism destination competitiveness (STDC) of the Guangdong–Hong Kong–Macao Greater Bay Area (GBA). A three-round expert survey was conducted with a panel of 12 experts from academic, industry, and government backgrounds, comprising two Fuzzy Delphi rounds for indicator screening and one Analytic Hierarchy Process round for weight determination. The proposed index comprises 4 dimensions, 20 factors, and 36 indicators, grounded in Dwyer and Kim’s integrated model of tourism destination competitiveness and adapted to the sports tourism context. The Fuzzy Delphi results demonstrate expert consensus on the relevance and comprehensiveness of the retained indicators. The Analytic Hierarchy Process reveals that “endowed and created resources” (weight: 0.281) and “supporting factors” (weight: 0.278) are the highest-weighted dimensions, while “number of international and national sports events” (0.0663) and “number of natural scenic spots offering sports activities” (0.0621) rank as the top two indicators. The findings contribute a systematic framework for evaluating STDC across the 11 GBA cities and offer practical guidance for future strategic planning and policy coordination.
1. Introduction
The intersection of sports and tourism has given rise to sports tourism, a rapidly expanding sector that serves as a key driver of economic diversification and destination sustainability (Morfoulaki et al., 2023). In recent years, competition among sports tourism destinations has intensified, driven by the rapid globalization of the sports industry (Orunbayev, 2023), the diversification of tourism demand (Bortolotti et al., 2024), and the strategic positioning of sports events as catalysts for tourism development and destination branding (Ziakas, 2023). Sports tourism destinations must clearly understand and systematically evaluate their competitiveness to engage in the rapidly growing sports tourism sector (Moradi et al., 2022). One popular approach in the TDC literature to address the evaluation process is through the construction of an evaluation index system composed of an appropriate set of factors and indicators (Lee et al., 2021; Salinas Fernández et al., 2020; Font et al., 2023). However, given the distinct characteristics of the sports tourism sector, generic factors and indicators of the existing TDC evaluation index may not be specific and suitable enough. It is, therefore, necessary to develop an evaluation index tailored to sports tourism destinations to benefit from it properly.
The Guangdong–Hong Kong–Macao Greater Bay Area (GBA) comprises 11 cities across Guangdong, Hong Kong, and Macao. As a major economic hub, it has strong sports tourism resources (Tian et al., 2023). Its mountains, 1479.9 km of coastline, 850 islands, and subtropical monsoon climate support outdoor sports throughout the year, including paragliding, sailing, surfing, cycling, riding, and rock climbing. It also has sports folk culture such as dragon boat racing, martial arts, and lion dance, as well as international events and leading global venues. National and regional policies promote sports tourism integration and international event hosting. The 15th National Games, co-hosted by Guangdong, Hong Kong, and Macao in 2025, further advanced cross-regional sports tourism collaboration. Among the few existing studies, Tian et al. (2023) constructed an evaluation index of sports tourism competitiveness and applied it empirically to the 11 GBA cities, comprising three dimensions and 18 indicators. However, their framework is not explicitly grounded in a classic TDC model, and its indicator coverage is relatively limited. A detailed comparison between their framework and our proposed index is presented in Section 2.3 to clarify our specific contribution.
Despite these strengths and policy endorsements, the absence of a comprehensive evaluation system hinders some issues, such as the big gap in sports tourism development and increasingly fierce competition within the 11 cities of the GBA (Yuan et al., 2022). Given the above, this study aims to: (1) propose an STDC evaluation framework tailored to the sports tourism context, (2) establish a comprehensive evaluation index for STDC of the GBA using an integrated FDM and AHP approach, and (3) provide practical guidelines that can potentially be used for evaluating and comparing the STDC levels of individual cities, thereby facilitating policy coordination across the region.
2. Literature Review
2.1. TDC and STDC
Research on STDC is predominantly grounded in TDC studies, which focus on identifying the factors and indicators that drive and evaluate tourism destination competitiveness. Researchers (Ritchie & Crouch, 2003; Dwyer & Kim, 2003; Heath, 2002) have developed TDC models to identify and explain the factors driving tourism destination competitiveness. Dwyer and Kim’s (2003) Integrated Model (IM), for instance, identifies 25 factors and classifies these factors into four dimensions: (1) endowed and created resources; (2) supporting factors; (3) destination management; (4) situational condition. Researchers have adopted relevant evaluation indicators based on the influencing factors of tourism destination competitiveness, categorizing them into “objective indicators” and “subjective indicators” (Zehrer et al., 2017). “Subjective indicators” rely mainly on market research data, struggle to collect data in a timely and ongoing manner, and suffer from lower reliability, validity, and operational challenges. Given these limitations, researchers often prioritize “objective indicators” to measure and compare destination competitiveness, as their concrete, measurable nature ensures greater operability and makes them a more commonly used benchmark in TDC assessments.
While TDC frameworks provide a general foundation, they may not fully capture the specific characteristics of sports tourism. Sports tourism destinations rely heavily on sport-specific resources such as sports events, sports infrastructure, and sports heritage that are not explicitly included in generic TDC models. Therefore, adapting the TDC framework to the sports tourism context is necessary to reflect the distinct drivers of sports tourism competitiveness.
Unlike TDC, relatively few research works have been performed on STDC. Current research has primarily focused on identifying factors affecting STDC and indicators measuring STDC within niche sports tourism destinations, such as scuba diving destinations (Queiroz Neto et al., 2017), ski destinations (Mlađenović & Virijević Jovanović, 2019), and surf destinations (Martín-González et al., 2021), or in specific contexts like small islands (Moradi et al., 2022). However, as most of them focus on the niche sports tourism market, the factors and indicators of these niche sports tourism destinations are too specific and not applicable to those destinations at the city level or above, which offer a variety of sports tourism activities. Hence, there has not yet been a comprehensive evaluation index for STDC.
2.2. Previous Research on Sports Tourism in the GBA
Within the GBA, sports tourism begins to attract scholarly interest. Existing studies have examined the convergence of sports and tourism industries (Yuan et al., 2022), sports tourism resource development (Wang et al., 2021), and PEST analysis on the development of sports tourism (Cui, 2021). These studies are predominantly contextual or descriptive in nature, offering useful insights into the region’s sports tourism potential but without providing a systematic evaluation framework for assessing and comparing competitiveness across cities.
Among the few exceptions, Tian et al. (2023) constructed an evaluation index of sports tourism competitiveness and applied it empirically to the 11 GBA cities, comprising 3 dimensions and 18 indicators. While their study offers a valuable empirical reference, two limitations should be noted. First, the three dimensions are not explicitly grounded in a recognized tourism destination competitiveness (TDC) framework, which limits the theoretical interpretability of the index structure. Second, the indicator coverage is relatively limited and may not fully capture the multidimensional nature of sports tourism competitiveness.
In contrast to Tian et al.’s structure, our proposed index is adapted from Dwyer and Kim’s (2003) integrated TDC model. In addition, our framework includes service quality, destination management, sports-specific infrastructure and enterprises, and situational conditions such as price competitiveness and technology and innovation, which are not separately measured in Tian et al.’s index. As shown in Table 1, the two frameworks differ across several key aspects.
Table 1.
Comparison between Tian et al. (2023) and the proposed framework.
As shown in Table 1, while Tian et al. (2023) offer an empirical advantage, our framework provides broader theoretical grounding, more comprehensive indicator coverage, and a systematic expert-based screening and weighting process. The present study thus fills the gap left by the limited theoretical grounding and the absence of expert-based validation in the existing evaluation index for assessing the STDC of the 11 GBA cities.
2.3. Framework for Sports Tourism Destination Competitiveness
In constructing the evaluation index for STDC, the study primarily references the TDC model of Dwyer and Kim. There are three main reasons. First, the terminology is clearer. Compared with metaphors such as “roof” and “cement,” terms such as “endowed resources” and “supporting factors” in Dwyer and Kim are easier to use academically and interpret practically. Second, its structure is more stable and suitable for empirical operationalization; for example, Ritchie and Crouch’s model includes 36 factors, while Heath’s model involves complex dynamic mechanisms, both of which are more difficult to operationalize. Third, it is more easily adaptable to the sports tourism context. For instance, “cultural resources” can be directly modified into “cultural sports resources” and “special events” into “sports events,” which is less straightforward with the other models.
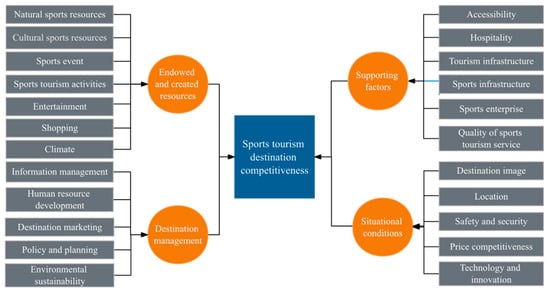
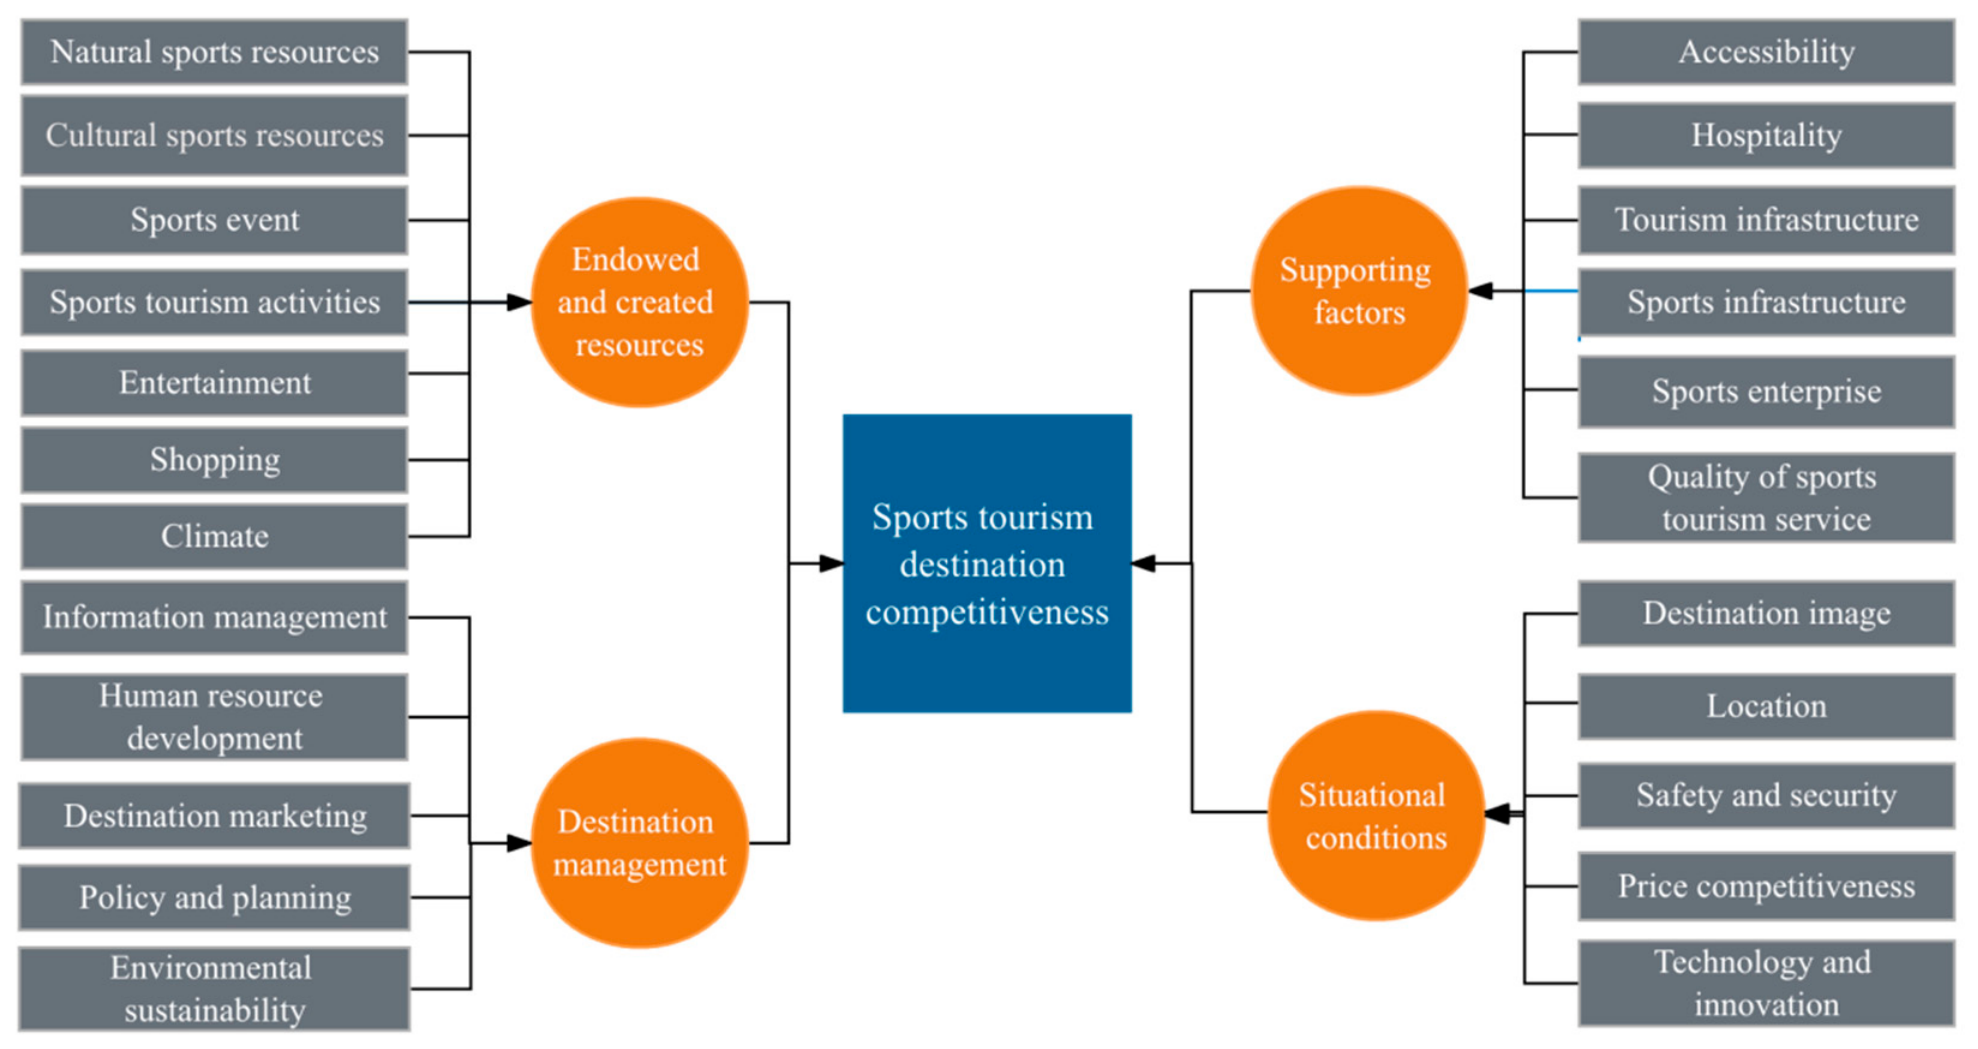
According to Dwyer and Kim’s model, TDC comprises four core dimensions (endowed and created resources, supporting factors, destination management, and situational conditions) and two additional components (demand factors and market performance indicators). This study omits the latter two. Demand factors (tourists’ awareness, perceptions, and preferences) are highly subjective and difficult to quantify across the 11 GBA cities. Market performance indicators (e.g., visitor numbers, expenditure, and economic contribution) measure competitiveness outcomes, but sports tourism data cannot be reliably isolated because sports tourists are not separately recorded in official statistics and their spending is embedded in broader categories. Such data are not currently available in official statistics. The proposed index thus focuses on structural and contextual conditions that are potentially comparable across cities. Accordingly, taking into consideration the unique features of sports tourism destinations, some adjustments and refinement have been made. As shown in Figure 1, the proposed framework comprises 4 dimensions and 23 factors, conceptualized as follows:
Figure 1.
The proposed framework for sports tourism destination competitiveness.
Endowed and created resources refer to “the primary motivation for destination appeal”(Dwyer & Kim, 2003). In this study, they consist of natural sports resources, climate, cultural sports resources, sports events, sports tourism activities, entertainment, and shopping. Supporting factors are essential capabilities provided by both the public and private sector that underpin destination competitiveness (Dwyer & Kim, 2003). Such factors in this study include accessibility, hospitality, tourism infrastructure, sports infrastructure, and sports enterprise. Destination management involves factors that boost the attractiveness of core resources and attractors, improve the quality and efficiency of supporting factors, and navigate the limitations set by situational conditions (Dwyer & Kim, 2003). Destination management is a complex factor; it consists of information management, human resource development, destination marketing, policy and planning, and environmental sustainability. Situational conditions are external forces that can strengthen or weaken destination competitiveness (Crouch & Ritchie, 1999). This dimension comprises destination image, location, security and safety, price competitiveness, technology and innovation.
3. Materials and Methods
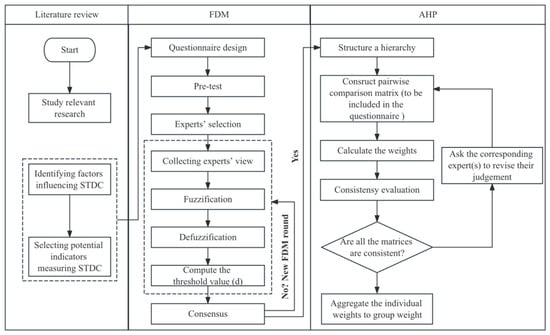
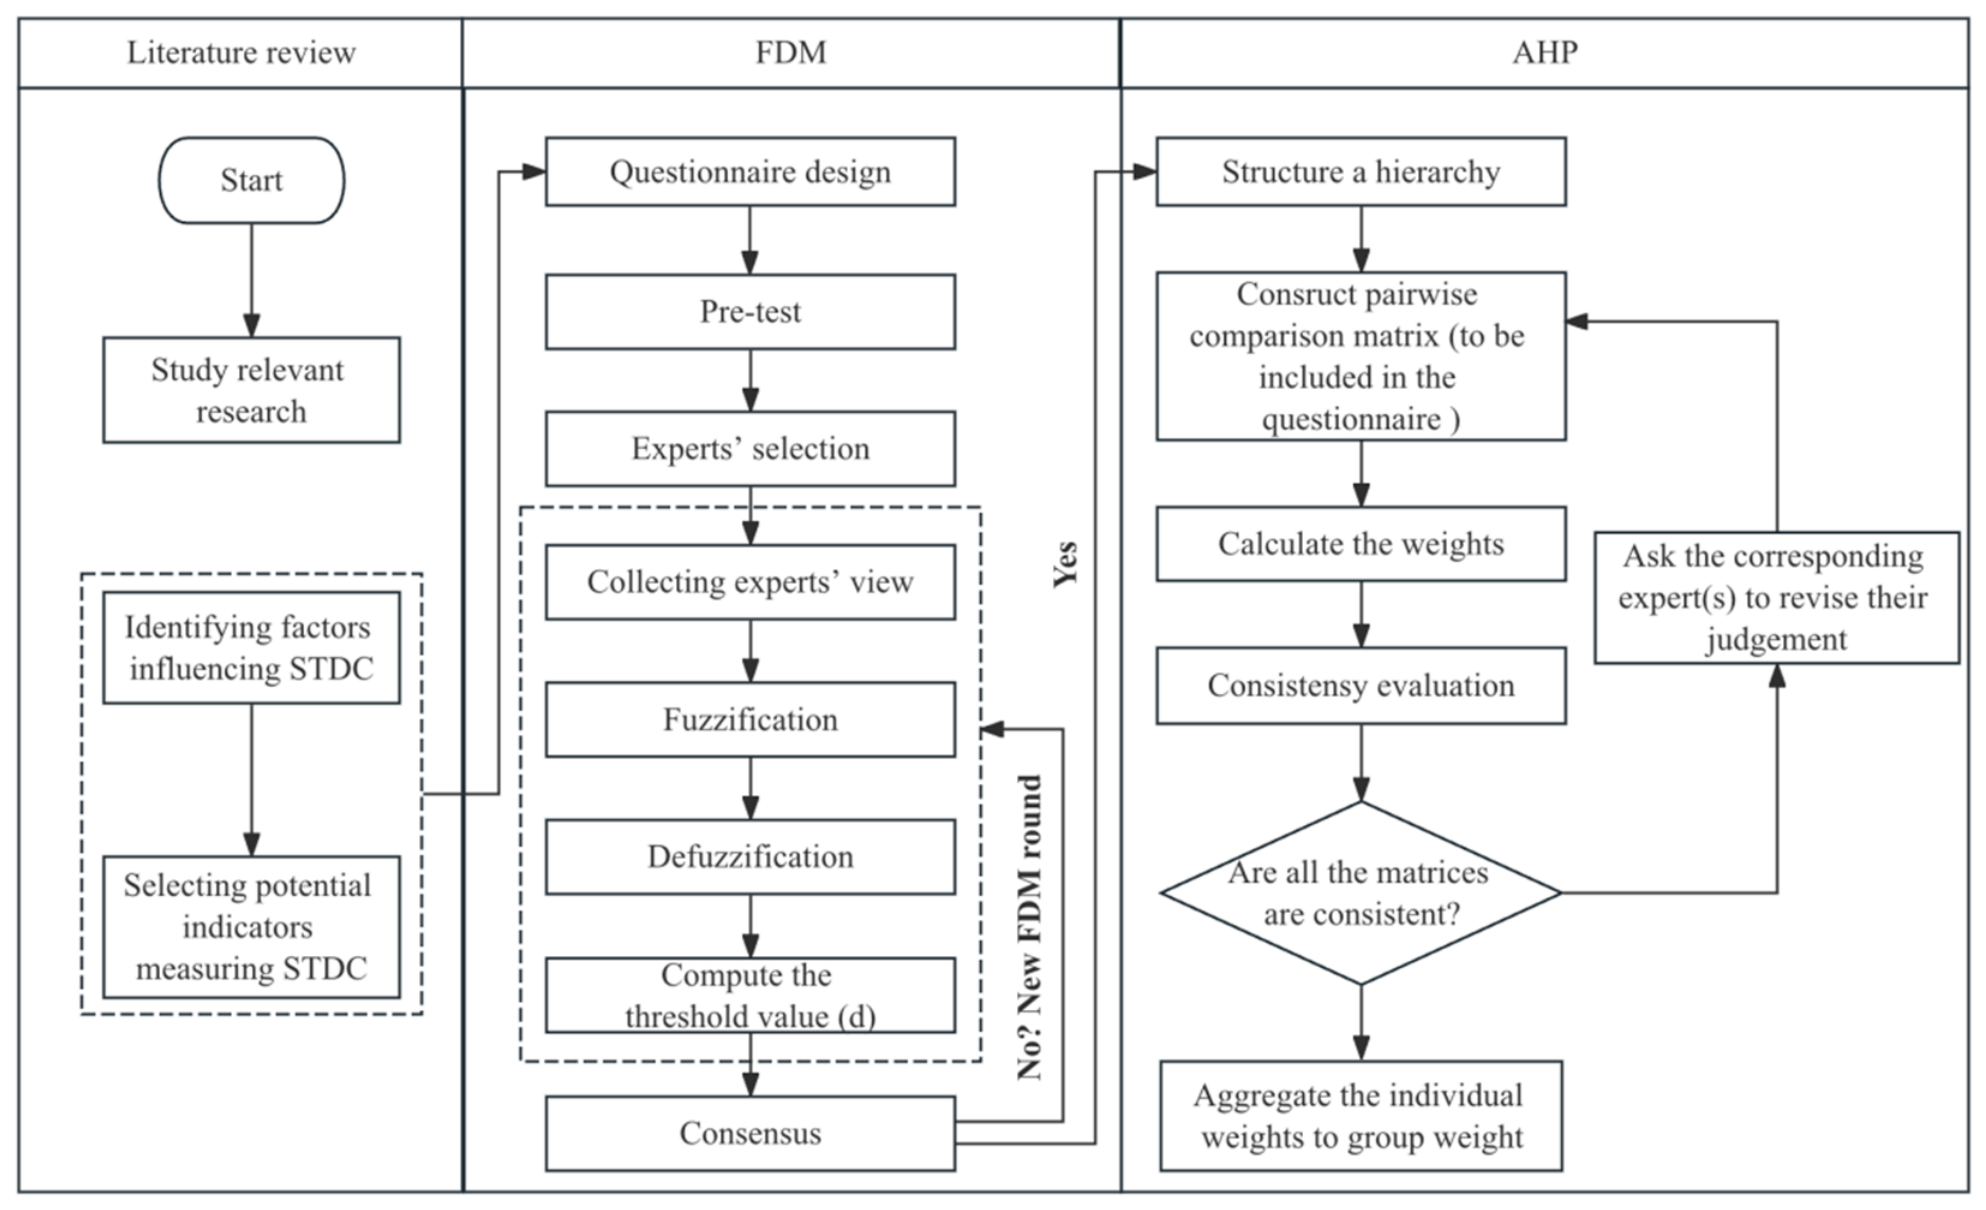
This study adopted an integrated FDM-AHP method and administered three rounds of expert surveys to construct the evaluation index for STDC of the GBA. The paper is structured as follows (Figure 2): (1) identification of the factors influencing STDC and the corresponding indicators to measure the STDC based on a literature review, (2) validating the factors and indicators for STDC of the GBA by using the FDM, and (3) determining the weight for each dimension, factor and indicator of STDC by the AHP.
Figure 2.
Research methodology for developing an evaluation index for STDC of the GBA.
The FDM improves on the traditional Delphi method. Although traditional Delphi structures expert consensus, its iterative rounds are time-consuming and often leave expert judgments uncertain (Roldán López De Hierro et al., 2021). By integrating fuzzy set theory, FDM quantifies linguistic ambiguity, thereby minimizing expert subjectivity and uncertainty, improving consensus efficiency, and retaining all expert inputs (Saffie et al., 2016). Given the multifaceted nature of STDC and the need to screen numerous context-specific indicators for the GBA, FDM proves particularly advantageous in refining the initial assessment framework (Ocampo et al., 2018).
The AHP then complements the FDM by establishing mathematically precise weight relationships through pairwise comparisons (Dolan, 2008; Darko et al., 2019). It converts expert judgments into ratio-scale priorities and checks consistency, enabling rigorous prioritization. The novelty of this sequential integration is that the FDM first reduces uncertainty in indicator validation, while the AHP then establishes mathematically precise, consistency-checked weight. It has been shown to offer a more robust framework for indicator prioritization (Elkadry et al., 2025; Amoushahi et al., 2022) and has been applied in tourism research (Kim et al., 2022; Georgios, 2022). Hence, it is particularly appropriate to apply a combination of the FDM-AHP method for constructing an STDC evaluation index tailored to the GBA’s context.
3.1. Systematic Review and Initial Indicator Extraction
Based on the STDC framework in Section 2.3, a systematic literature review was conducted to identify potential indicators for evaluating the STDC of the GBA. The review followed a pre-defined protocol with explicit inclusion and exclusion criteria (Knoll et al., 2018).
The systematic literature search was conducted between 10 January and 25 January 2026, covering publications from 2003 to 2025. Web of Science Core Collection and Google Scholar were searched. The Web of Science search string was: TS = (“tourism competitiveness” OR “destination competitiveness” OR “tourism destination competitiveness”) AND (“tourism” OR “sport tourism” OR “sports tourism” OR “sustainable tourism”) AND (evaluation OR indicator OR index). Google Scholar was searched using the same terms, with four separate queries sorted by relevance and the first 200 results per query screened. Inclusion criteria were: (1) focus on TDC or STDC evaluation indicators or frameworks; (2) extractable indicators or dimensions; (3) English language; (4) publication between 2003 and 2025. Exclusion criteria were: (1) non-journal articles; (2) no full text; (3) non-English; (4) not focused on indicator development or identification.
Two reviewers independently screened titles, abstracts, and full texts using a standardized screening form, and disagreements were resolved through discussion. No formal quality appraisal was applied. To reduce bias from low-quality literature, only peer-reviewed journal articles were included, and articles that did not clearly define their indicators or provide a theoretical linkage were excluded.
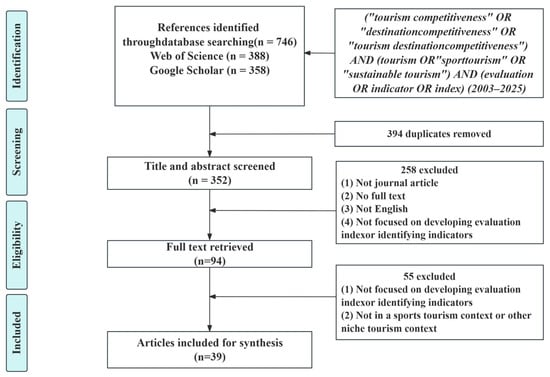
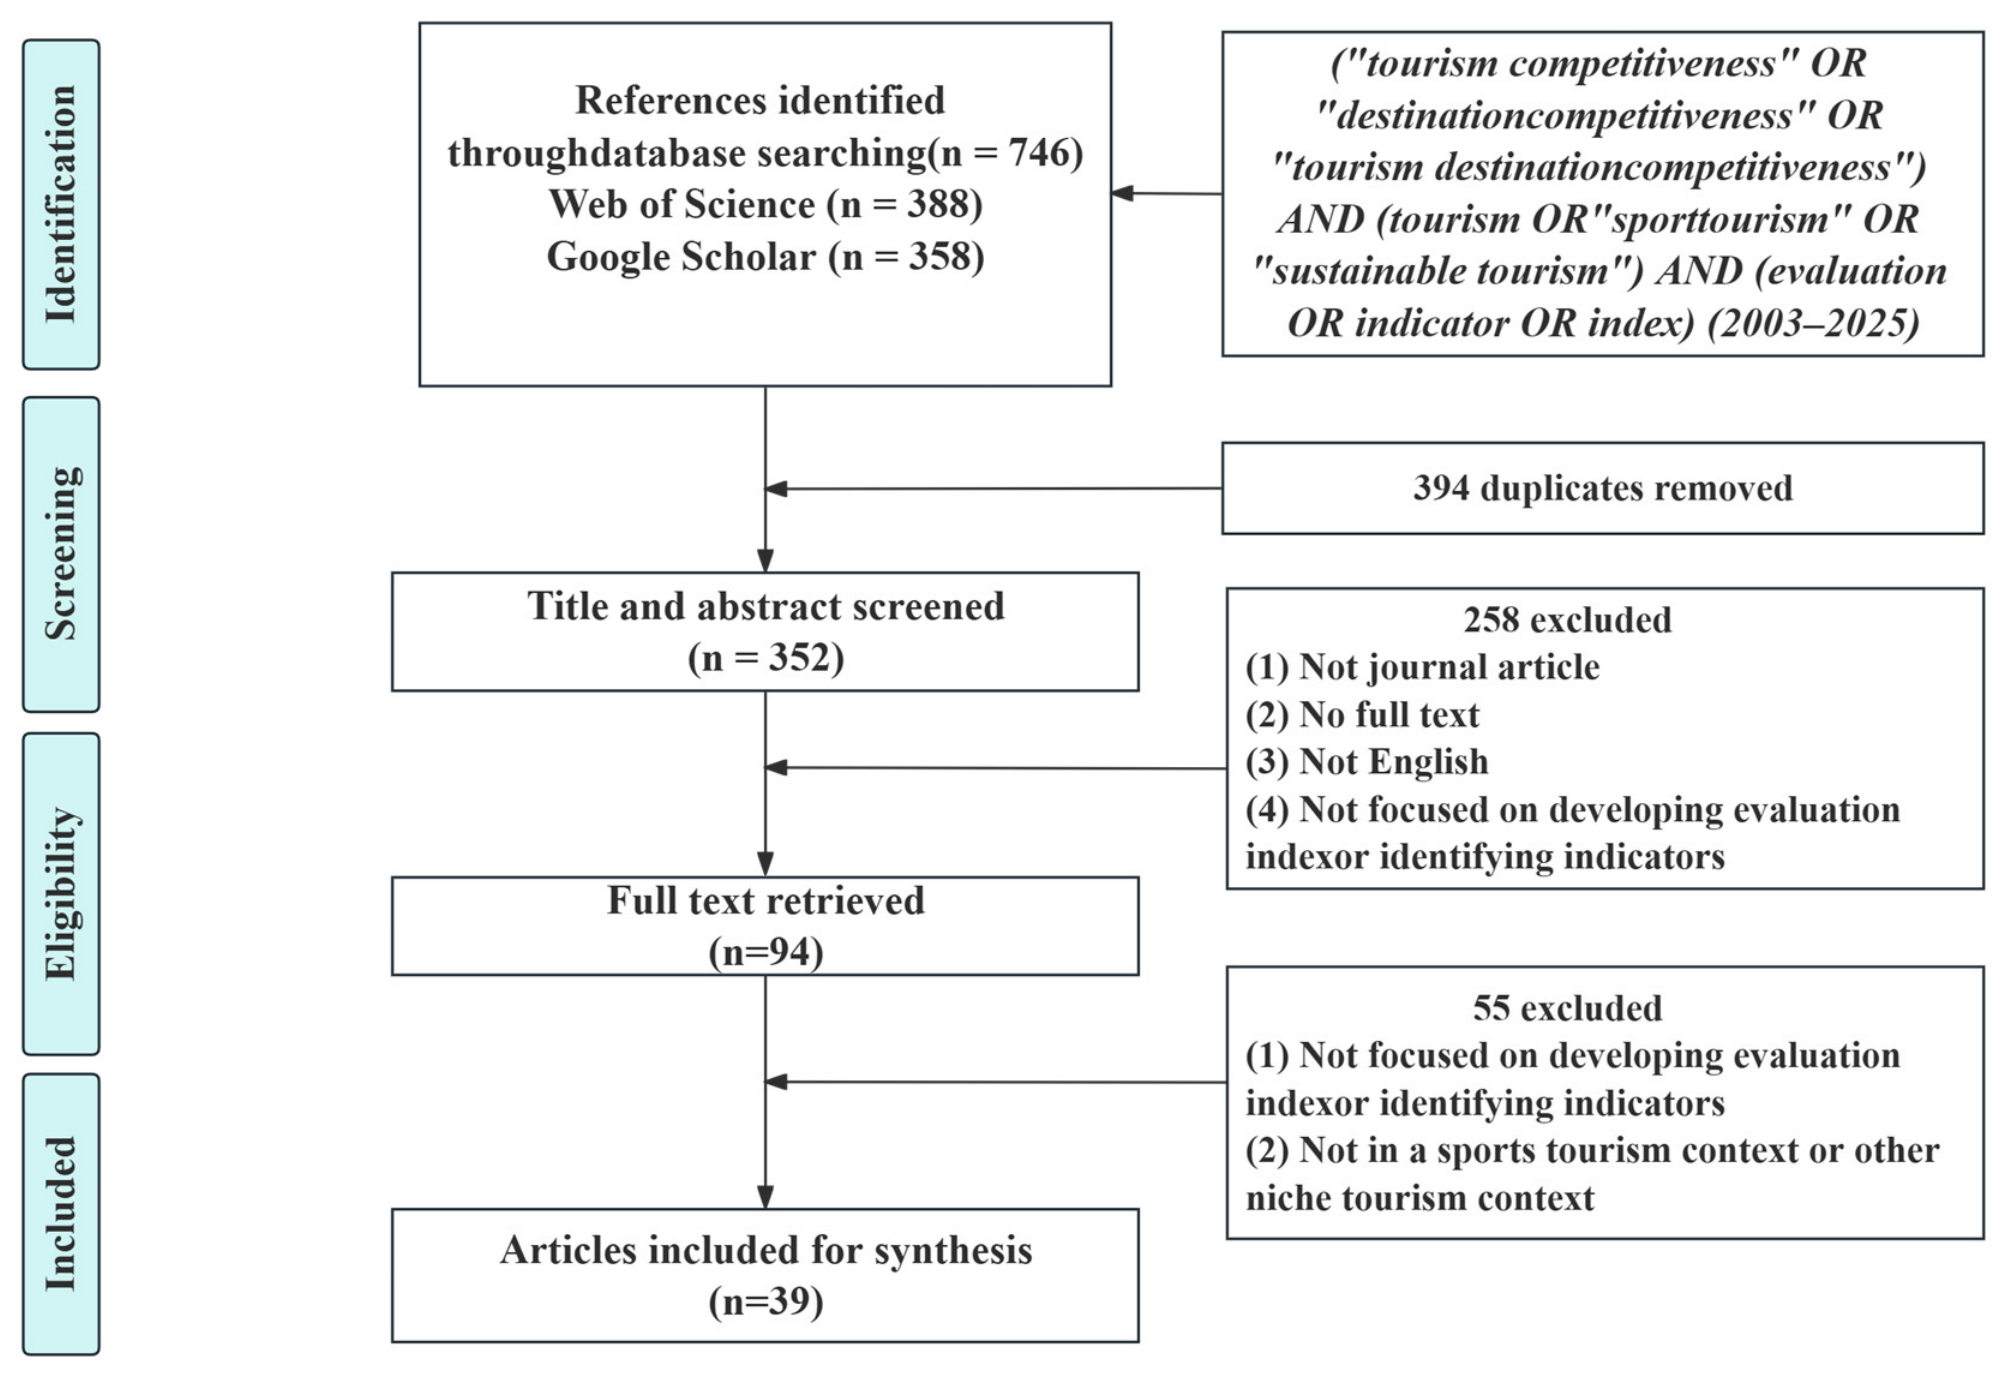
A total of 746 records were identified. After removing 394 duplicates, 352 records remained for title and abstract screening. Of these, 258 were excluded, leaving 94 for full-text review. Another 55 were excluded, leaving 39 articles in the final synthesis. The selection process is presented in Figure 3.
Figure 3.
Flowchart of systematic literature review and article selection.
From the 39 articles, 42 potential indicators were extracted with sources and original construct labels. Conceptually overlapping indicators were consolidated. Adapted indicators were checked for construct consistency by comparing definition, measurement unit, and theoretical linkage to the parent factor, and were renamed where necessary. The full list is provided in Appendix A.
It should be noted that some indicators are not directly comparable across the three jurisdictions due to differences in administrative classifications, tourism statistics, and definitions. For such indicators, we adopt functionally equivalent categories rather than identical ones. For example, the “natural scenic spots offering sports activities” indicator is operationalized through national forest parks, geological parks, and nature reserves in Guangdong; country parks managed by the AFCD in Hong Kong; and public parks and recreational areas managed by the IAM in Macao. Similarly, the “licensed hotels” indicator is operationalized through licensed hotel establishments in all three jurisdictions. These examples illustrate the general principle, which can be extended to other indicators in future application studies.
3.2. Fuzzy Delphi Method (FDM)
The process of the FDM in this study consists of three main stages: input arrangement, expert survey, and FDM analysis (Saffie et al., 2016).
- Stage 1: Input arrangement
The input arrangement consists of a literature review, questionnaire design, and pre-test. Two experts reviewed the questionnaire for content validity; one of them possesses extensive research experience in sports tourism and event management, while the other specializes in tourism destination competitiveness. The two experts pointed out deficiencies and ambiguities in the wording of indicators and related explanations, and the questionnaire was revised accordingly before it was ready for use.
- Stage 2: Expert survey
In this stage, there are two steps, namely, selection of experts and collecting the experts’ views.
The first step was selecting experts. Purposive sampling was utilized to choose the experts by identifying and selecting qualified experts in the relevant field (Mohamed Yusoff et al., 2021). To avoid bias, experts from diverse backgrounds (academia, industry, and government) were included. The following criteria were adopted for expert selection: (1) relevant professional background in sports tourism, TDC or related fields; (2) senior position or academic title: associate professor or higher in academia, manager or above in industry, section chief or higher in government; (3) minimum of 10 years of relevant experience; and (4) direct industry or policymaking involvement.
Regarding sample size, there is no strong relation between the number of experts and the quality of the decisions (Ocampo et al., 2018). Novakowski and Wellar (2008) suggested a sample size of 5–15 experts. A sample size of 10 to 20 specialists is generally adequate for obtaining valuable outcomes (Nguyen et al., 2023). Agrest et al. (2024) emphasized that a group of at least 10 experts boosts confidence more effectively. Hence, 12 experts were regarded as a suitable sample size for this study.
Based on the qualifications, 12 experts were invited and all accepted: 5 academics (1 from Hong Kong and 1 from Macao), 5 industry experts (1 from Hong Kong and 1 from Macao), and 2 government experts. All were informed of the study’s purpose and expressed willingness to participate (experts’ profiles provided in Appendix B).
The next step was collecting data from the experts through a two-round Delphi survey. In round 1, questionnaires were distributed on 20 February 2026, and final responses were collected on 15 March 2026 (24 days). In round 2, the survey was conducted from March 20 to 1 April 2026 (12 days). The experts responded independently and anonymously, without knowing other members’ identities or individual answers. During the Delphi survey, the researcher maintained communication with the experts to clarify ambiguities and follow up on questionnaire completion, without discussing the content or direction of their judgments, thereby preserving the independence of the Delphi process.
- Stage 3: FDM analysis
Microsoft Excel software was used to analyze and assess the experts’ perspectives, as Mohamed Yusoff et al. (2021) suggested. There are three requirements that must be fulfilled in FDM analysis, which are the fuzzy score (A) ≥ 0.5, the threshold value (d) ≤ 0.2 and expert consensus ≥ 75%. This stage consists of four processes: fuzzification process, defuzzification process, computing the threshold value (d), and obtaining a 75% consensus from the experts (Manakandan et al., 2017).
- (1)
- Fuzzification process
The experts scored each item on a Likert scale, and the scores were converted into Triangular Fuzzy Numbers (TFNs) through the fuzzification process, which accounts for the inherent ambiguity in expert opinions. Each potential value ranges between 0 and 1 (Anand & Bharatraj, 2017). Each TFN is characterized by three parameters: the minimum value (n1), the medium value (n2), and the maximum value (n3). Table 2 illustrates the conversion of the Likert scale into fuzzy numbers.
Table 2.
The conversion between the five-point Likert scale and the fuzzy scale.
- (2)
- Defuzzification process
The defuzzification process aims to determine the value of the fuzzy score (A), which indicates the importance level of each item. This process helps determine whether an item should be kept or discarded using the following formula in Equation (1):
where m1, m2, and m3 represent the average fuzzy number for each item. If the fuzzy score (A) is greater than or equal to 0.5, the item can be retained.
- (3)
- Compute the threshold value (d)
The threshold value (d) for all the experts regarding a specific item should be no greater than 0.2. The formula used to compute the threshold value (d) is shown in Equation (2) (Manakandan et al., 2017; Sulaiman et al., 2020):
- (4)
- Obtain a 75% consensus from the experts
Achieving consensus is widely acknowledged to be the primary goal in Delphi method, with a minimum 75% consensus required to declare acceptable agreement among the experts (Chu & Hwang, 2008). The percentage of expert consensus for each item was calculated as the number of experts whose threshold value (d) was no more than 0.2, divided by the total number of experts. When any item failed to achieve the 75% consensus threshold, then a new Delphi round was required. Between Round 1 and Round 2, the experts received a structured summary of the group results (each item’s fuzzy score and consensus percentage) and re-rated each item independently and anonymously.
Finally, the factors influencing STDC and the corresponding indicators to measure STDC were identified.
3.3. Analytic Hierarchy Process (AHP)
Based on the AHP, the relative weights of the factors and indicators were obtained. The process of using the AHP is detailed below:
- (1)
- Structure a hierarchy
The first step of the AHP is to structure a hierarchy based on the results of the previous FDM. The hierarchy is typically set by defining a specific goal at the highest level, with subsequent lower level(s) used to achieve that goal. In this study, the hierarchy directly corresponded to the levels of the evaluation framework of STDC, which consisted of the main goal, dimension level, factor level, and indicator level.
- (2)
- Construct a pairwise comparison matrix
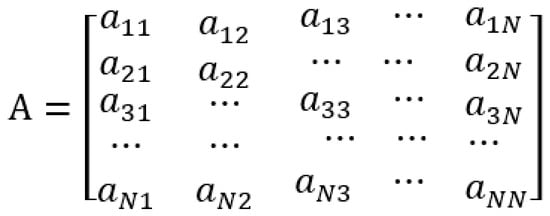
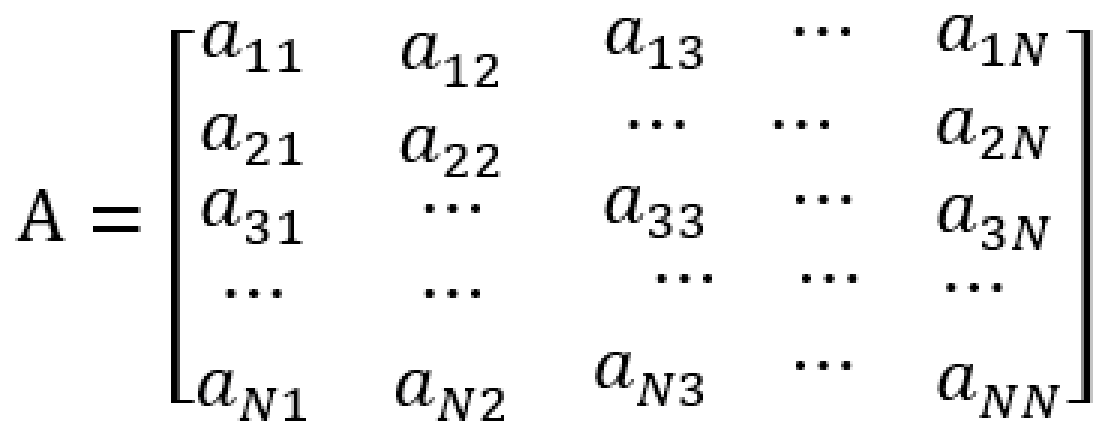
The next step is to construct the pairwise comparison matrix, which would be included in the questionnaires. The questionnaire employs Saaty’s 1–9 scale to determine the relative weights (aij) through pairwise comparisons between indicators i and j. The 1–9 scale used for pairwise comparisons is shown in Table 3. Based on this scale, expert judgments are recorded in an N × N pairwise comparison matrix A, where N denotes the number of compared indicators.
Table 3.
The 1–9 scale used for the pairwise comparisons.
As presented in Figure 4, respondents were only required to complete the upper triangular matrix, as the lower triangular matrix consists of the positive reciprocals of the corresponding upper elements (i.e., aij = 1/aji for all i, j from 1, 2 … N). The diagonal elements of the matrix (aNN) are all equal to 1. Thus, the lower triangular part of the matrices was automatically generated from the corresponding upper triangular responses (I.-T. Yang et al., 2012).
Figure 4.
The pairwise comparison matrix used in the AHP.
- (3)
- Calculating the weights
In general, the weights are elicited by employing matrix algebra to determine the principal eigenvector w = (w1, w2 … wN) from matrix A, where wi > 0. The principal eigenvector for each matrix, when normalized, becomes the vector of priorities (i.e., weights) for that matrix (Saaty, 1980). Mathematically, as proposed by Saaty (1980), the principal eigenvector of A as the desired priority vector w can be estimated by solving Equation (3) below.
where is the largest eigenvalue of matrix A and w is the corresponding normalized eigenvector.
- (4)
- Consistency evaluation
Consistency evaluation is a step to validate the logical coherence of the experts’ relative judgments. Saaty (1980) proved that the ≥ N for positive reciprocal matrices and is equal to N if and only if matrix A is perfectly consistent. Therefore, the closer is to N, the more consistent the judgement is. In this step, serves as an important validating parameter to measure the consistency of the experts’ judgement, as formalized in Equation (4):
Furthermore, Saaty (1980) suggested conducting a consistency check of the evaluation, in which the consistency ratio (CR) is determined as follows in Equation (5):
where CI is the consistency index and RI is the random index (calculated by the mean CI value). CI is computed as shown in Equation (6):
where N is the dimension of the matrix, and is the same as that in Equation (3).
If the value of CR is less than 0.10, the pairwise comparison matrix can be considered consistent; if not, it should be revised until consistency is reached (Saaty, 1980). In this study, all pairwise comparison matrices across the 12 experts eventually achieved CR < 0.10. A total of 192 matrices were evaluated. Initially, 5 matrices had CR > 0.10 and were returned to the experts for revision; after revision, all 192 matrices achieved CR < 0.10, with final CR values ranging from 0.00 to 0.085 (mean = 0.028).
- (5)
- Aggregating individual weight to group weights
In the AHP, individual weights must be aggregated to represent group judgement. The most commonly used aggregation methods are the geometric mean method and the weighted arithmetic mean method. This study adopts the geometric mean method for weight aggregation, as it dampens the effect of extreme values (Aull-Hyde et al., 2006), while the arithmetic method may create the problem known as “eclipsing,” wherein lower values are dominated by higher ones or vice versa.
Therefore, all the different weights obtained from the individual’s pairwise comparisons were aggregated using the geometric mean method, with the formula shown in Equation (7):
where is the group weight, is the individual weight of the kth expert, and is the total number of experts. The aggregated weights were then normalized as the sum of weights at each hierarchy, which should be 1.
Finally, the global weights in the lower levels were calculated by multiplying the local weight at the upper level by the local weight at the lower level. This global weight represents the weight relative to the overall goal layer, while the local weight represents the weight at each hierarchy.
4. Results
4.1. Validation of the Factors and Indicators Using FDM
4.1.1. The Results of First Round of Fuzzy Delphi Analysis
Of the initial 23 factors and 42 indicators, 2 factors and 4 indicators were rejected, namely, factor “F22 Hospitality” and its corresponding indicator, “I22 Friendliness of residents towards tourists”; “F42 Location” and its corresponding indicator, “I42 Travel time from major tourists’ markets”; “I21-3 Number of countries/regions covered by visa-free or visa-on-arrival policies” from the factor “F21 Accessibility”; and “I43-2 Number of tourism accidents” from the factor “F43 Security and safety.” This was because they obtained fuzzy scores lower than 0.5. Meanwhile, the experts’ consensus reached 75% or above, which indicates that these factors and indicators met the consensus criteria for being considered relatively unimportant.
Based on the corresponding quantitative values of opinions in the first round, five indicators received fuzzy scores below 0.5, while the experts’ consensus failed to reach 75%. This suggested significant divergence among the experts regarding the importance of these indicators, necessitating further refinement through an additional Delphi round.
Furthermore, the experts suggested two additional indicators, one of which is “number of man-made sports tourism attractions” to measure the factor “cultural sports resources.” Another indicator is “number of sports associations,” which can be used to measure “destination management organization,” and is classified under the “destination management” dimension. Moreover, both the items accepted in Round 1 and those marked as “pending” were carried forward to Round 2 and rated again. As a result, a total of 22 factors and 40 indicators were included for the subsequent Delphi round.
4.1.2. The Results of the Second Round of Fuzzy Delphi Analysis
In the second round, among the 22 factors and 40 indicators assessed, 2 factors and 4 indicators received fuzzy scores below 0.5; meanwhile, the experts’ consensus reached 75% or above, so those factors and indicators therefore were excluded. The remaining 36 indicators met the predefined consensus criteria without further controversy. A final list of essential items comprising 20 factors and 36 indicators was identified for the evaluation of STDC of the GBA.
Through two rounds of Delphi surveys, a total of four factors and eight indicators were eliminated. Specifically, four factors along with their five associated indicators were eliminated: (1) shopping, measured by the number of shopping facilities (e.g., malls, outlets, and duty-free shops); (2) entertainment, assessed via the number of amusement parks, theme parks, and night tourism activities (e.g., live performances and light shows); (3) hospitality, evaluated based on the friendliness of residents toward tourists; and (4) location, determined by travel time from major tourist markets.
Additionally, three indicators were removed while retaining their parent factors: (1) the number of countries/regions covered by visa-free or visa-on-arrival policies (accessibility); (2) the number of undergraduate students of sports and tourism management majors (human resource development); and (3) the number of tourism accidents (safety and security).
Table 4 presents a complete summary of the two-round Delphi screening results, including all eliminated and retained items. The final framework comprises 20 factors and 36 indicators for STDC evaluation in the GBA.
Table 4.
Summary of 2-round fuzzy Delphi analysis results.
4.2. Determining the Weight of Each Factor and Indicator Through AHP
Based on the results of the previous Delphi rounds, a hierarchical structure was developed for the final AHP round of the Delphi-AHP survey. This consisted of the main goal, dimension level, factor level, and indicator level. Table 5 presents the weights of dimensions and factors, for the dimension level, D1 Endowed and created resources ranked first of the four dimensions, with a weight of 0.281, followed by D2 Supporting factors (0.278), D3 Destination management (0.266), and finally, D4 Situational conditions (0.175). The importance (global weights) of factors is as follows. The most salient of the 20 factors was “F23 Tourism infrastructure,” with a global weight of 0.0739; “F12 Cultural sports resources” ranked second most important (0.0717), followed by “F26 Quality of sports tourism service” (0.0698), “F13 Sports events” (0.0663), “F11 Natural sports resources” (0.0621) “F35 Environmental sustainability” (0.0601), “F24 Sports infrastructure” (0.0598), “F33 Destination marketing” (0.0545), “F15 Sports tourism activities” (0.0525), “F43 Safety and security” (0.0509), “F44 Price competitiveness” (0.0480), “F45 Technology and innovation” (0.0434), “F31 Information” (0.0431), “F21 Accessibility” (0.0409), “F32 Human resource development” (0.0364), “F34 Policy and planning” (0.0362), “F36 Destination management organization” (0.0356), “F25 Sports enterprises” (0.0336), “F41 Destination image” (0.0327) and “F14 Climate” (0.0284).
Table 5.
Weight of dimensions and factors.
Table 6 displays the importance (global weight) of all indicators. “I13 Number of international and national sports events” (global weight of 0.0663) was considered the most important of the 36 indicators for evaluating the GBA as a sports tourism destination. “I11 Number of natural scenic spot offering sports activities” ranked second, with a global weight of 0.0621; “I15 Number of sports activities” obtained the third high global weight of 0.0525. The rest of the top 10 indicators with high importance (global weight) are as follows: “I22-2 Number of man-made sports tourism attractions” (0.0370); “I32 Number of employees in culture, tourism, sports industry” (0.0364); “I34 Related policy and planning for improving tourism competitiveness or encouraging sports tourism development” (0.0362); “I36 Number of sports associations” (0.0356); “I12-1 Number of tangible and intangible examples of sports heritage” (0.0346); “I25 Number of sports enterprises per million population” (0.0336); and “I24-1 Number of stadiums per million population” (0.0328).
Table 6.
Weight and rank of indicators.
5. Discussion
5.1. Rationale for Excluded Factors and Indicators
An interesting finding is that several generic TDC factors, including shopping, entertainment, hospitality, and location, were excluded during the Delphi process. Shopping and entertainment are typically regarded as important tourism attractors (Choi et al., 2018; Nikjoo & Ketabi, 2015), but the experts considered them baseline expectations rather than differentiators for sports tourists in the GBA. Hospitality, including resident friendliness, is often regarded as a source of competitive advantage, yet experts in this study viewed it as less important and difficult to quantify across the 11 GBA cities. This contrasts with Kamis et al. (2026), who emphasize the interplay between credibility and hospitality in sports tourism competitiveness and position hospitality as central. Location, particularly travel time from major markets, plays a key role in generic destination attractiveness (Dwyer & Kim, 2003), but the GBA’s compact and integrated spatial structure reduces its differentiating power. Together, these exclusions suggest that sports tourism competitiveness relies less on general tourism amenities and more on sport-specific resources, infrastructure, and events.
Three additional indicators were also removed. Visa policy was excluded because only Hong Kong and Macao maintain independent visa regimes, while Guangdong cities operate under a unified national policy, reducing cross-city comparability. The number of undergraduate students in sports and tourism management was dropped because it reflects potential future supply rather than current human resources. The number of tourism incidents was considered less valid as a safety indicator, as it can be heavily influenced by factors unrelated to destination governance. These indicators were therefore deemed unsuitable for inclusion in the evaluation index.
5.2. Weighting Results: Priority Dimensions, Factors, and Indicators
The AHP results indicate that at the dimension level, “endowed and created resources” (0.281) received the highest weight, followed by “supporting factors” (0.278), “destination management” (0.266), and “situational conditions” (0.175). The higher weights assigned to resources and supporting factors suggest that the experts view core supply-side conditions, such as sports resources, events, infrastructure, and services, as the primary determinants of STDC. In contrast, situational conditions such as security, price, and technology were given lower weights, indicating that the experts consider them contextual moderators rather than foundational drivers. Destination management received a moderate weight, suggesting that coordination and governance functions are recognized as important but may be less directly tied to competitiveness than tangible resources and infrastructure. This pattern may reflect the specific nature of sports tourism, where the availability of sport-specific resources and facilities is essential for attracting sports tourists.
At the factor level, “tourism infrastructure” (0.0739) received the highest global weight, followed by “cultural sports resources” (0.0717) and “sports events” (0.0663). The high weight of “tourism infrastructure” (0.0739) and sports infrastructure (weight: 0.0598) reflects the necessity of robust logistical and facility-based support for sports tourism. This aligns with Jovanovic’s (2016) assertion that tourism infrastructure serves as the foundation for tourism growth by enhancing service distribution. Furthermore, the findings support Xue and Mason’s (2019) argument that commercial sports facilities not only stimulate the sports industry but also enhance destination image and boost tourism. The relatively high weights assigned to cultural sports resources (0.0717) and sports events (0.0663) indicate that experts regard both inherited and developed assets as important for enhancing destination appeal. These results resonate with previous studies highlighting the role of major sports events in driving tourism demand (Bazzanella et al., 2023) and the value of unique cultural sports resources in attracting sports tourists (Li & Huang, 2021). Similarly, the high weight of “quality of sports tourism services” ( 0.0698) underscores the service-oriented nature of sports tourism, consistent with Rahmati et al. (2020), who identified service excellence as the most critical driver of sports tourism development. “Climate” (0.0284) received the lowest weight, which may be explained by the experts’ perception that the GBA’s favorable subtropical climate is generally suitable for outdoor sports year-round, and therefore they did not regard it as a differentiating factor. In climate-constrained destinations, climate might receive a higher weight.
At the indicator level, “number of international and national sports events” (0.0663) received the highest weight, followed by “number of natural scenic spots offering sports activities” (0.0621) and “number of sports activities” (0.0525). These results indicate that experts consider event-hosting capacity and the availability of natural and organized sports activities as the most important indicator for evaluating STDC. This is consistent with the factor-level findings, where sports events and natural sports resources were highly weighted. In contrast, indicators related to general tourism services received lower weights. For example, “number of restaurants per million tourists” (0.0189), “number of tour operators per million tourists” (0.0187), and “number of tourist information centers per million tourists” (0.0146) ranked in the lower half. This suggests that experts regard such facilities as baseline requirements rather than key differentiators of STDC. Similarly, indicators under “situational conditions,” such as “proportion of technology and innovation expenditure to GDP” (0.0203), received relatively low weights, suggesting that the experts regard it as less important relative to other indicators. “Price of golfing service” (0.0187) also received a low weight, possibly because it provides only a partial reflection of price competitiveness in the sports tourism market, rather than a comprehensive measure of overall price levels.
6. Implications, Limitations and Suggestions for Future Study
6.1. Theoretical Implications
The theoretical contribution of this study lies primarily in adapting a general TDC framework to the sports tourism context. By validating sport-specific factors such as sports infrastructure, events, and cultural resources, the research bridges the gap between generic TDC frameworks and the requirements of the sports tourism segment.
The Delphi process excluded several factors that are central to generic TDC models, including shopping, entertainment, hospitality, and location. This suggests that in the sports tourism context, general tourism factors may function as baseline expectations rather than differentiators, or it may reflect the GBA’s specific conditions, where shopping and entertainment are abundant and location is already advantaged by dense transport networks.
Compared with Tian et al. (2023), our framework is explicitly grounded in Dwyer and Kim’s integrated model, adopts a three-level hierarchy (dimension, factor, indicator), and provides broader indicator coverage. Compared with other STDC indexes, which often focus on a single sport niche such as skiing, surfing, or scuba diving, or on rural sports tourism competitiveness (Yin et al., 2025), this index is designed for a multi-city, multi-sport context and therefore adopts a more general set of factors and indicators.
6.2. Practical Implications
The proposed evaluation index provides a structured reference for strategic planning and policy coordination. Its main practical value lies in identifying which dimensions, factors, and indicators experts consider most important. High-weighted areas such as sports events, tourism infrastructure, sports infrastructure, and service quality can be treated as priority domains in monitoring systems and resource allocation. As a globally strategic region, the GBA can draw on this index as a basis for evaluating each city’s STDC level and identify their strengths and weaknesses to support intercity coordination.
6.3. Limitations and Suggestions for Future Study
While this study provides a foundational framework, several limitations warrant attention. Firstly, the proposed evaluation index has not yet been empirically validated using real data from the GBA, and a full operational protocol, including data sources and normalization procedures, remains to be developed. In addition, several indicators remain in absolute counts (e.g., number of sports events, scenic spots, aircraft movements, and sports associations) and may therefore favor larger metropolitan centers. Per-capita or per-area adjustments will be required in the application stage to mitigate city-size bias. Subsequent studies should focus on applying the index to all 11 GBA cities, defining appropriate normalization and aggregation procedures, assessing the robustness of the resulting scores and rankings, and examining their relationship with relevant external destination-performance indicators. Secondly, the construction of this evaluation index system prioritized objective indicators with measurable secondary data due to practical constraints in obtaining primary data from tourists. While this approach enhances operational feasibility, it may result in partial representation of certain indicators. Future research should combine subjective indicators (primary data) with objective indicators (secondary data) to further improve the comprehensiveness and validity of the evaluation index system. Lastly, although the academic and industrial experts include representatives from Hong Kong and Macao, the government experts are from Guangdong Province and do not directly represent the administrative systems of Hong Kong and Macao. It should therefore be acknowledged that the final indicators may reflect Guangdong administrative perspectives more heavily than others. Future research should engage a more geographically balanced panel, including government experts from Hong Kong and Macao.
Author Contributions
Conceptualization, M.J. and L.L.; methodology, L.L.; investigation, L.L.; data analysis, L.L.; writing—original draft preparation, L.L. and F.W.; writing—review and editing, visualization, L.L.; supervision, M.J. All authors have read and agreed to the published version of the manuscript.
Funding
This research received no external funding.
Institutional Review Board Statement
This expert consultation study followed all ethical standards and did not require institutional review board approval under the legal provisions of the country where the research was conducted.
Informed Consent Statement
Informed consent was obtained from all subjects involved in the study.
Data Availability Statement
The data presented in this study are available on request from the corresponding author.
Conflicts of Interest
The authors declare no conflicts of interest.
Abbreviations
The following abbreviations are used in this manuscript:
| STDC | Sports Tourism Destination Competitiveness |
| TDC | Tourism Destination Competitiveness |
| GBA | Guangdong–Hong Kong–Macao Greater Bay Area |
| FDM | Fuzzy Delphi method |
| AHP | Analytic Hierarchy Process |
Appendix A
Table A1.
List of potential indicators with their sources.
Appendix B
Table A2.
List of academic experts.
Table A3.
List of industrial experts.
Table A4.
List of government experts.
References
- Agrest, M., Tapia-Munoz, T., Encina-Zúñiga, E., Vidal-Zamora, I., Geffner, N., Ardila-Gómez, S., Alvarado, R., Leiderman, E. A., & Reavley, N. (2024). Development of mental health first-aid guidelines for psychosis: A Delphi expert consensus study in Argentina and Chile. BMC Psychiatry, 24(1), 113. [Google Scholar] [CrossRef] [Scilit] [PubMed]
- Amoushahi, S., Salmanmahiny, A., Moradi, H., Tabrizi, A. R. M., & Galán, C. (2022). Localizing sustainable urban development (SUD): Application of an FDM-AHP approach for prioritizing urban sustainability indicators in Iran provinces. Sustainable Cities and Society, 77, 103592. [Google Scholar] [CrossRef] [Scilit]
- Anand, M. C. J., & Bharatraj, J. (2017). Theory of triangular fuzzy number. Proceedings of NCATM, 80, 80–83. [Google Scholar]
- Arasli, H., Abdullahi, M., & Gunay, T. (2021). Social media as a destination marketing tool for a sustainable heritage festival in Nigeria: A moderated mediation study. Sustainability, 13(11), 6191. [Google Scholar] [CrossRef] [Scilit]
- Aull-Hyde, R., Erdogan, S., & Duke, J. M. (2006). An experiment on the consistency of aggregated comparison matrices in AHP. European Journal of Operational Research, 171(1), 290–295. [Google Scholar] [CrossRef] [Scilit]
- Bazzanella, F., Schnitzer, M., Peters, M., & Bichler, B. F. (2023). The role of sports events in developing tourism destinations: A systematized review and future research agenda. Journal of Sport & Tourism, 27(2), 77–109. [Google Scholar] [CrossRef] [Scilit]
- Bichler, B. F., & Pikkemaat, B. (2021). Winter sports tourism to urban destinations: Identifying potential and comparing motivational differences across skier groups. Journal of Outdoor Recreation and Tourism, 36, 100420. [Google Scholar] [CrossRef] [Scilit]
- Bortolotti, A., Jreij, A., Mazza, F., & Vecchi, V. (2024). Sports as well-being practice: The diversification of tourism through the Integration of Sport, Wellness, and Health. In Beyond the 2026 winter Olympic games: Sustainable scenarios for the Valtellina mountain region (pp. 63–81). Springer Nature Singapore. [Google Scholar]
- Chau, D. S., & Yan, D. L. (2021). Destination hospitality indicators. Journal of Destination Marketing & Management, 19, 100537. [Google Scholar] [CrossRef] [Scilit]
- Choi, M., Lee, J. S., & Seo, A. J. (2018). Shopping destination competitiveness: Scale development and validation. Journal of Travel & Tourism Marketing, 35(8), 1087–1103. [Google Scholar] [CrossRef] [Scilit]
- Chu, H.-C., & Hwang, G.-J. (2008). A Delphi-based approach to developing expert systems with the cooperation of multiple experts. Expert Systems with Applications, 34(4), 2826–2840. [Google Scholar] [CrossRef] [Scilit] [PubMed]
- Cibinskiene, A., & Snieskiene, G. (2015). Evaluation of city tourism competitiveness. Procedia-Social and Behavioral Sciences, 213, 105–110. [Google Scholar] [CrossRef] [Scilit]
- Crotts, J. C., Magnini, V. P., & Calvert, E. (2022). Key performance indicators for destination management in developed economies: A four pillar approach. Annals of Tourism Research Empirical Insights, 3(2), 100053. [Google Scholar] [CrossRef] [Scilit]
- Crouch, G. I., & Ritchie, J. R. B. (1999). Tourism, competitiveness, and societal prosperity. Journal of Business Research, 44(3), 137–152. [Google Scholar] [CrossRef] [Scilit]
- Cui, A. (2021). PEST Analysis of sports tourism in Guangdong, Hong Kong, and Macao bay area under the background of policy top–level design. Journal of Guangzhou Sport University, 41(2), 37–39+98. [Google Scholar] [CrossRef]
- Darko, A., Chan, A. P. C., Ameyaw, E. E., Owusu, E. K., Pärn, E., & Edwards, D. J. (2019). Review of application of analytic hierarchy process (AHP) in construction. International Journal of Construction Management, 19(5), 436–452. [Google Scholar] [CrossRef] [Scilit]
- Dolan, J. G. (2008). Shared decision-making–transferring research into practice: The Analytic Hierarchy Process (AHP). Patient Education and Counseling, 73(3), 418–425. [Google Scholar] [CrossRef] [Scilit] [PubMed]
- Dwyer, L., & Kim, C. (2003). Destination competitiveness: Determinants and indicators. Current Issues in Tourism, 6(5), 369–414. [Google Scholar] [CrossRef] [Scilit]
- Elkadry, H., Shamsuzzaman, M., Piya, S., Haridy, S., Bashir, H., & Khadem, M. (2025). A fuzzy Delphi-AHP framework for identifying and prioritizing factors affecting students’ satisfaction in public high schools: Insights from the United Arab Emirates. Journal of Engineering Research, 13(2), 596–610. [Google Scholar] [CrossRef] [Scilit]
- Font, X., Torres-Delgado, A., Crabolu, G., Palomo Martinez, J., Kantenbacher, J., & Miller, G. (2023). The impact of sustainable tourism indicators on destination competitiveness: The European tourism indicator system. Journal of Sustainable Tourism, 31(7), 1608–1630. [Google Scholar] [CrossRef] [Scilit]
- Forsyth, P., & Dwyer, L. (2009). Tourism price competitiveness. In The Travel & Tourism Competitiveness Report 2009: Managing in a Time of Turbulence (pp. 77–90). World Economic Forum. [Google Scholar]
- Georgios, A. (2022). Indicators for sustainable tourism management: A case study using AHP and Delphi to evaluate mountainous areas in Greece. International Journal of Agricultural Resources, Governance and Ecology, 18(1–2), 100–144. [Google Scholar] [CrossRef] [Scilit]
- Heath, E. (2002). Towards a model to enhance Africa’s sustainable tourism competitiveness. Journal of Public Administration, 37, 327–353. [Google Scholar]
- Ivars-Baidal, J. A., Celdrán-Bernabeu, M. A., Femenia-Serra, F., Perles-Ribes, J. F., & Giner-Sánchez, D. (2021). Measuring the progress of smart destinations: The use of indicators as a management tool. Journal of Destination Marketing & Management, 19, 100531. [Google Scholar] [CrossRef] [Scilit]
- Jia, Z., Jiao, Y., Zhang, W., & Chen, Z. (2022). Rural tourism competitiveness and development mode, a case study from chinese township scale using integrated multi-source data. Sustainability, 14(7), 4147. [Google Scholar] [CrossRef] [Scilit]
- Jovanovic, S. (2016). Infrastructure as important determinant of tourism development in the countries of southeast Europe. Ecoforum, 5(1), 1–34. Available online: https://www.academia.edu/105924563/ (accessed on 10 March 2026).
- Kamis, J., Supian, K., Daut, A. Z., Abu Ashari, S. N., Abdullah, N., & Alyaa, N. I. (2026). Reconceptualising competitive effectiveness in sport tourism: The interplay between credibility and hospitality. International Journal of Research and Innovation in Social Science, 10(3), 1814–1822. [Google Scholar] [CrossRef] [Scilit]
- Kim, J. H., King, B. E. M., & Kim, S. (2022). Developing a slow city tourism evaluation index: A Delphi-AHP review of Cittaslow requirements. Journal of Sustainable Tourism, 30(4), 846–874. [Google Scholar] [CrossRef] [Scilit]
- Kladou, S., & Mavragani, E. (2015). Assessing destination image: An online marketing approach and the case of TripAdvisor. Journal of Destination Marketing & Management, 4(3), 187–193. [Google Scholar] [CrossRef] [Scilit]
- Knoll, T., Omar, M. I., Maclennan, S., Hernández, V., Canfield, S., Yuan, Y., Bruins, M., Marconi, L., Van Poppel, H., N’Dow, J., & Sylvester, R. (2018). Key steps in conducting systematic reviews for underpinning clinical practice guidelines: Methodology of the European association of urology. European Urology, 73(2), 290–300. [Google Scholar] [CrossRef] [Scilit] [PubMed]
- Lee, T. H., Jan, F.-H., & Liu, J.-T. (2021). Developing an indicator framework for assessing sustainable tourism: Evidence from a Taiwan ecological resort. Ecological Indicators, 125, 107596. [Google Scholar] [CrossRef] [Scilit]
- Li, P., & Huang, J. (2021). Review of the research on ethnic sports tourism in china. E3S Web of Conferences, 251, 03015. [Google Scholar] [CrossRef] [Scilit]
- Lu, Y., He, M., & Liu, C. (2023). Tourism competitiveness evaluation model of urban historical and cultural districts based on multi-source data and the AHP method: A case study in Suzhou ancient city. Sustainability, 15(24), 16652. [Google Scholar] [CrossRef] [Scilit]
- Manakandan, S., Ismail, R., Mohd Jamil, M. R., & Ragunath, P. (2017). Pesticide applicators questionnaire content validation: A fuzzy Delphi method. The Medical Journal of Malaysia, 72, 228–235. [Google Scholar] [PubMed]
- Martín-González, R., Swart, K., & Luque-Gil, A.-M. (2021). Tourism competitiveness and sustainability indicators in the context of surf tourism: The case of cape town. Sustainability, 13(13), 7238. [Google Scholar] [CrossRef] [Scilit]
- Mlađenović, D., & Virijević Jovanović, S. (2019). The research of skier motivations and factors influencing the choice of a ski destination. Facta Universitatis, Series: Physical Education and Sport, 17(1), 43–56. [Google Scholar] [CrossRef] [Scilit]
- Mohamed Yusoff, A. F., Hashim, A., Muhamad, N., & Wan Hamat, W. N. (2021). Application of fuzzy Delphi technique to identify the elements for designing and developing the e-PBM PI-poli module/ahmad fkrudin mohamed yusoff … [et al.]. Asian Journal of University Education (AJUE), 7(1), 1. [Google Scholar]
- Moradi, E., Ehsani, M., Saffari, M., & Norouzi Seyed Hosseini, R. (2022). Developing an integrated model for the competitiveness of sports tourism destinations. Journal of Destination Marketing & Management, 26, 100743. [Google Scholar] [CrossRef] [Scilit]
- Morfoulaki, M., Myrovali, G., Kotoula, K. M., Karagiorgos, T., & Alexandris, K. (2023). Sport tourism as driving force for destinations’ sustainability. Sustainability, 15(3), 2445. [Google Scholar] [CrossRef] [Scilit]
- Morrison, A. M., Cheah, J.-H., & Kumar, R. (2024). A destination performance measurement framework: Exploring the relationships among performance criteria and revisit intentions. Current Issues in Tourism, 28(5), 773–791. [Google Scholar] [CrossRef] [Scilit]
- Nguyen, P.-H., Nguyen, T.-L., Le, H.-Q., Pham, T.-Q., Nguyen, H.-A., & Pham, C.-V. (2023). How does the competitiveness index promote foreign direct investment at the provincial level in Vietnam? An integrated grey Delphi–DEA model approach. Mathematics, 11(6), 1500. [Google Scholar] [CrossRef] [Scilit]
- Nikjoo, A. H., & Ketabi, M. (2015). The role of push and pull factors in the way tourists choose their destination. Anatolia, 26(4), 588–597. [Google Scholar] [CrossRef] [Scilit]
- Novakowski, N., & Wellar, B. (2008). Using the Delphi technique in normative planning research: Methodological design considerations. Environment and Planning A: Economy and Space, 40(6), 1485–1500. [Google Scholar] [CrossRef] [Scilit]
- Ocampo, L., Ebisa, J. A., Ombe, J., & Geen Escoto, M. (2018). Sustainable ecotourism indicators with fuzzy Delphi method–A Philippine perspective. Ecological Indicators, 93, 874–888. [Google Scholar] [CrossRef] [Scilit]
- Orunbayev, A. (2023). Globalization and sports industry. American Journal Of Social Sciences And Humanity Research, 3(11), 164–182. [Google Scholar]
- Queiroz Neto, A., Lohmann, G., Scott, N., & Dimmock, K. (2017). Rethinking competitiveness: Important attributes for a successful scuba diving destination. Tourism Recreation Research, 42(3), 356–366. [Google Scholar] [CrossRef] [Scilit]
- Rahmati, M., Sadr, A. H., & Toorani, A. (2020). Explaining factors influencing sport tourism development case study: Minudasht County, Iran Mansour. Revista Turismo Estudos e Práticas-RTEP/GEPLAT/UERN, (3), 1–14. [Google Scholar]
- Ritchie, J. R. B., & Crouch, G. I. (2003). The competitive destination: A sustainable tourism perspective. CABI Pub. [Google Scholar]
- Roldán López De Hierro, A. F., Sánchez, M., Puente-Fernández, D., Montoya-Juárez, R., & Roldán, C. (2021). A fuzzy Delphi consensus methodology based on a fuzzy ranking. Mathematics, 9(18), 2323. [Google Scholar] [CrossRef] [Scilit]
- Saaty, T. L. (1980). The analytic hierarchy process: Planning, priority setting, resource allocation. McGraw-Hill. [Google Scholar]
- Saffie, N. A. M., Shukor, N. M., & Rasmani, K. A. (2016, July 24–27). Fuzzy Delphi method: Issues and challenges. 2016 International Conference on Logistics, Informatics and Service Sciences (LISS) (pp. 1–7), Sydney, NSW, Australia. [Google Scholar] [CrossRef] [Scilit]
- Salinas Fernández, J. A., Serdeira Azevedo, P., Martín Martín, J. M., & Rodríguez Martín, J. A. (2020). Determinants of tourism destination competitiveness in the countries most visited by international tourists: Proposal of a synthetic index. Tourism Management Perspectives, 33, 100582. [Google Scholar] [CrossRef] [Scilit]
- Selim, M. A., Abdel-Fattah, N. A., & Hegazi, Y. S. (2021). A composite index to measure smartness and competitiveness of heritage tourism destination and historic building. Sustainability, 13(23), 13135. [Google Scholar] [CrossRef] [Scilit]
- Sulaiman, H. F., Ismail, R., Mohd Yusoff, H., Anuar, N., Mohd Jamil, M. R., & Daud, F. (2020). Validation of occupational zoonotic disease questionnaire using fuzzy Delphi method. Journal of Agromedicine, 25(2), 166–172. [Google Scholar] [CrossRef] [Scilit] [PubMed]
- Tang, C., Wu, X., Zheng, Q., & Lyu, N. (2018). Ecological security evaluations of the tourism industry in ecological conservation development areas: A case study of Beijing’s ECDA. Journal of Cleaner Production, 197, 999–1010. [Google Scholar] [CrossRef] [Scilit]
- Tian, J., Deng, W., & Yuan, J. (2023). Evaluation of sports tourism competitiveness of urban agglomerations in Guangdong-Hong Kong-Macao greater bay area. Heliyon, 9(12), e22780. [Google Scholar] [CrossRef] [Scilit] [PubMed]
- Wang, S., Li, Y., & Wong, J. W. C. (2021). Exploring experiential quality in sport tourism events: The case of Macau grand prix. Advances in Hospitality and Tourism Research (AHTR), 9(1), 78–105. [Google Scholar] [CrossRef] [Scilit]
- Xu, S. (2021). Research on the evaluation index system and improvement strategies of sports tourism destination competitiveness in Shanghai [Master’s Thesis, Shanghai University of Sport]. [Google Scholar] [CrossRef]
- Xue, H., & Mason, D. S. (2019). Stadium games in entrepreneurial cities in China: A state project. Journal of Global Sport Management, 4(2), 185–209. [Google Scholar] [CrossRef] [Scilit]
- Yang, C.-C., Shen, C.-C., Lin, Y.-S., Lo, H.-W., & Wu, J.-Z. (2021). Sustainable sports tourism performance assessment using grey-based hybrid model. Sustainability, 13(8), 4214. [Google Scholar] [CrossRef] [Scilit]
- Yang, I.-T., Wang, W.-C., & Yang, T.-I. (2012). Automatic repair of inconsistent pairwise weighting matrices in analytic hierarchy process. Automation in Construction, 22, 290–297. [Google Scholar] [CrossRef] [Scilit]
- Yin, L., Gu, Q., Gao, X., Tai, P., & Cao, L. (2025). Evaluating rural sports tourism competitiveness: A framework applied to Shandong province. PLoS ONE, 20(6), e0323868. [Google Scholar] [CrossRef] [Scilit] [PubMed]
- Yuan, J., Zhou, Y., & Liu, Y. (2022). Convergence evaluation of sports and tourism industries in urban agglomeration of Guangdong–Hong Kong–Macao greater bay area and its spatial-temporal evolution. Sustainability, 14(16), 10350. [Google Scholar] [CrossRef] [Scilit]
- Zehrer, A., Smeral, E., & Hallmann, K. (2017). Destination competitiveness—A comparison of subjective and objective indicators for winter sports areas. Journal of Travel Research, 56(1), 55–66. [Google Scholar] [CrossRef] [Scilit]
- Zhao, Q., Xu, P., Wang, B., Wu, S., Wu, M., & Jin, P. (2024). Does location affect the mechanism of tourism competitiveness? Evidence from machine learning analysis. Tourism Management Perspectives, 53, 101291. [Google Scholar] [CrossRef] [Scilit]
- Zhao, Y., Mei, X., & Guo, J. (2023). Influence of sustainable environment based on a SWOT-PEST model on sports tourism service integration development. Sustainability, 15(2), 1632. [Google Scholar] [CrossRef] [Scilit]
- Ziakas, V. (2023). Leveraging sport events for tourism development: The event portfolio perspective. Journal of Global Sport Management, 8(1), 43–72. [Google Scholar] [CrossRef] [Scilit]
- Zou, Y. (2016). The Assessment of tourism security and its temporal and spatial pattern in tourism destination based on statistical data of 31 cities. China Soft Science Magazine, 2, 56–66. [Google Scholar]

Disclaimer/Publisher’s Note: The statements, opinions and data contained in all publications are solely those of the individual author(s) and contributor(s) and not of MDPI and/or the editor(s). MDPI and/or the editor(s) disclaim responsibility for any injury to people or property resulting from any ideas, methods, instructions or products referred to in the content. |
© 2026 by the authors. Licensee MDPI, Basel, Switzerland. This article is an open access article distributed under the terms and conditions of the Creative Commons Attribution (CC BY) license.