


Abstract
Urban green spaces (UGSs) are vital components of urban tourism, providing multifunctional settings for recreation, cultural engagement, and ecological appreciation. Despite their importance, limited research has explored how visitors allocate time, activities, and spatial use within these landscapes. This study examined visitor spatial and temporal behaviour at a South African botanical garden through a quantitative survey of 301 respondents. Results showed that weekend visits and half-day stays were the most common temporal patterns, while significant site–activity associations linked relaxation with the picnic area, hiking with the hiking trail, concert attendance with the concert area, and birdwatching with the wetland. Multivariate analyses further revealed differentiated patterns of visitor site use, visitor composition, and visit characteristics through NMDS and identified four underlying spatial–activity dimensions through PCA: restorative and active recreation, event-oriented use, nature observation, and visual–aesthetic engagement. These findings highlight opportunities to manage visitor concentration, improve spatial connectivity, and encourage greater use of underutilised areas through diversified recreational opportunities. This study contributes to sustainable urban tourism planning by demonstrating how evidence on visitor spatial and temporal behaviour can inform targeted management and the planning of multifunctional botanical gardens.
1. Introduction
Urban green spaces (UGSs) support recreation, environmental education, biodiversity conservation, and human–nature interaction [1,2,3]. Botanical gardens (BGs) are multifunctional UGSs that integrate conservation, education, and recreation and can contribute to urban tourism and accessible nature-based experiences [1,4,5].
Understanding how visitors use these spaces is important for effective planning and management. Visitor use is often uneven across sites and may be influenced by site characteristics, accessibility, facilities, and visitor motivations [6,7]. Examining visitor numbers, activities, and spatial use can therefore identify areas of concentrated or limited use and inform the management of visitor impacts and resources [7,8]. Spatial approaches have also demonstrated that visitor groups may exhibit distinct movement patterns, with implications for managing recreational use and protecting sensitive areas [9].
Limited research has examined the spatial and temporal dimensions of visitor movement within BGs, particularly how visitors select sites, move between them, allocate time, and engage in different activities [8,9]. BG research has more commonly focused on visitor profiles, motivations, and attractions than on the integrated spatial and temporal dimensions of visitor behaviour [10]. These limit understanding of how visitor use is distributed across garden sites and when different patterns of use occur, creating challenges for site-responsive visitor management [7,8].
This study therefore examined visitor behaviour at Walter Sisulu National Botanical Garden (WSNBG) by characterising visitor profiles and temporal visitation patterns, examining spatial movement and activity patterns across garden sites, and identifying underlying spatial–activity dimensions of visitor behaviour. By integrating these dimensions, this study provides evidence to support targeted visitor management and the sustainable planning of multifunctional BGs.
1.1. Understanding Visitor Movement Behaviour Through Space and Time
Current data on visitor patterns is essential for effective planning and management of visitor services and movement [11,12]. Visitor movement reflects the interaction between space and time, with destination characteristics, visitor preferences, activities, and accessibility influencing where visitors move and how they allocate their available time [7,8,13]. Understanding these relationships can support visitor management, tourism planning, and urban development [13,14].
1.2. Space Factor
Visitor movement is influenced by physical characteristics such as terrain, pathways, accessibility, infrastructure, vegetation, visibility, and the location of attractions [15]. Visitors commonly concentrate around entrances, major attractions, and distinctive landscape features [16,17], while accessibility, visibility, and environmental quality can influence the attractiveness and use of different areas [18,19].
Evidence from different regions indicates that these influences are context-dependent. Visitor behaviour varied between green spaces with different landscape characteristics in Granada, Spain [20], while visitor movement in Finnish urban forests varied according to recreational activities and the use of trails and natural features [21]. These differences may reflect the contrasting purposes and physical characteristics of these spaces. General UGSs and forests provide opportunities for recreation and informal movement, whereas BGs typically combine designated pathways with specialised plant collections, landscaped areas, and managed attractions.
Attractions may similarly influence visitor distribution differently across destinations. Recreational attractions contributed to the appeal of a BG in Ghana [22], while water bodies and playgrounds were associated with greater park visitation in Texas [23]. Collectively, these studies suggest that visitor concentration is shaped not only by the presence of attractions but also by the activities they support and the characteristics of the settings in which they occur. In BGs, therefore, specialised plant collections, scenic landscapes, educational features, and recreational facilities may each contribute to patterns of visitor spatial use, depending on the characteristics and purposes of the destination.
Accessibility provides an additional explanation for differences in visitor use. Evidence from United States cities indicates that accessibility is associated with realised park visitation [24], while research in Tshwane highlights accessibility alongside safety and maintenance [25]. The broader range of factors identified in the South African context may reflect differences in the social and environmental conditions in which green spaces are used. Thus, areas with similar physical attractions may receive different levels of visitation because of differences in accessibility, perceived safety, maintenance, and visitor characteristics.
Overall, the evidence indicates that visitor distribution results from the combined influence of physical characteristics, accessibility, facilities, activities, and visitor characteristics. These relationships are likely to vary according to landscape type and destination context. Although previous research has established the importance of these factors [26,27], the distribution of visitor movement among individual areas within BGs remains comparatively underexplored, particularly in the South African context.
1.3. Time Factor
Visitor movement is also shaped by the limited time available to select destinations, participate in activities, and move between locations [15]. Areas with attractive landscapes, interactive features, shade, water features, and scenic viewpoints may encourage longer stays [17,28]. Consequently, physical characteristics can influence both visitor distribution and the amount of time allocated to particular locations.
Evidence from the United States demonstrates that visitor concentration can change during the course of a visit, indicating that areas of high use may be temporary rather than consistently concentrated [29]. This may differ between large natural recreation areas and BGs because differences in destination size, pathway structure, and the spatial distribution of attractions affect the time required to move between sites.
Visitor use also varies over longer periods. Spatial and temporal differences in park visitation have been identified in Texas [23] and across US cities [24]. Such variation may be associated with environmental conditions, accessibility, visitor characteristics, and daily or seasonal routines. This indicates that visitor concentrations observed at a particular time may not represent overall patterns of use.
Duration of stay provides another dimension of visitor time allocation. Visitors to a UGS in Addis Ababa spent an average of approximately 3.6 h at the destination, with satisfaction varying across environmental and recreational attributes [30]. Differences in visitor characteristics and available activities may partly explain variation in duration, indicating that time allocation is influenced by both the destination and the visitor.
Temporal patterns may also differ between weekdays and weekends and across periods of the day [31,32]. These variations can influence when particular areas experience greater visitor pressure. Combining movement patterns with duration of stay therefore provides a more comprehensive understanding of visitor time–space behaviour [33]. However, the relationship between choice of visit site, movement, and duration of stay remains insufficiently explored [7,8,18]. For BGs, examining arrival and departure times alongside planned destinations, actual areas visited, areas where visitors spend most of their time, and repeated visitation can help establish how visitor movement is distributed across space and time. Such evidence can inform staffing, maintenance, visitor facilities, wayfinding, and conservation measures [2,15,34].
Existing research shows that visitor movement is influenced by spatial characteristics, accessibility, attractions, visitor activities, and temporal factors [7,15,16,26,27]. Studies from different regions further demonstrate that visitor behaviour varies with landscape characteristics, recreational activities, destination features, and accessibility [21,22,23,24,25]. Temporal studies also demonstrate variation in visitor concentration and duration of stay [29,30]. However, limited research has examined spatial and temporal visitor behaviour together within BGs, particularly in South Africa. Existing BG studies have focused mainly on visitor perceptions and motivations [1,10,35]. Consequently, limited evidence exists on the relationship between visitors’ planned and actual destinations, areas of concentrated and repeated use, and the timing and duration of visits. This study examines visitor movement across space and time to provide evidence on spatial distribution, site choice, activity patterns, and visitation rhythms, offering a practical basis for targeted management and the planning of multifunctional BGs.
2. Materials and Methods
2.1. Study Area
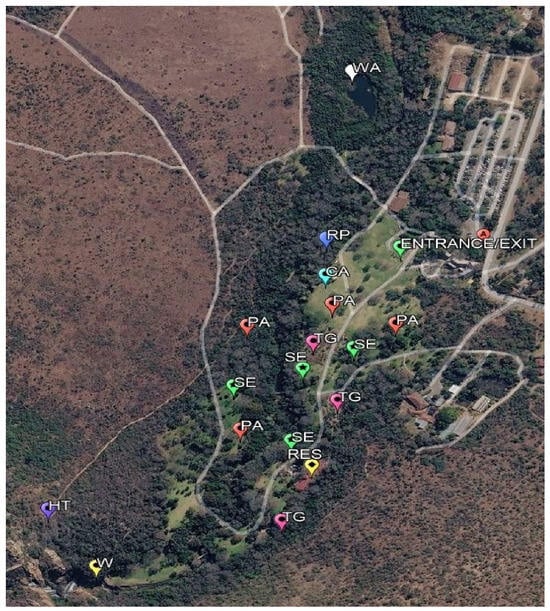
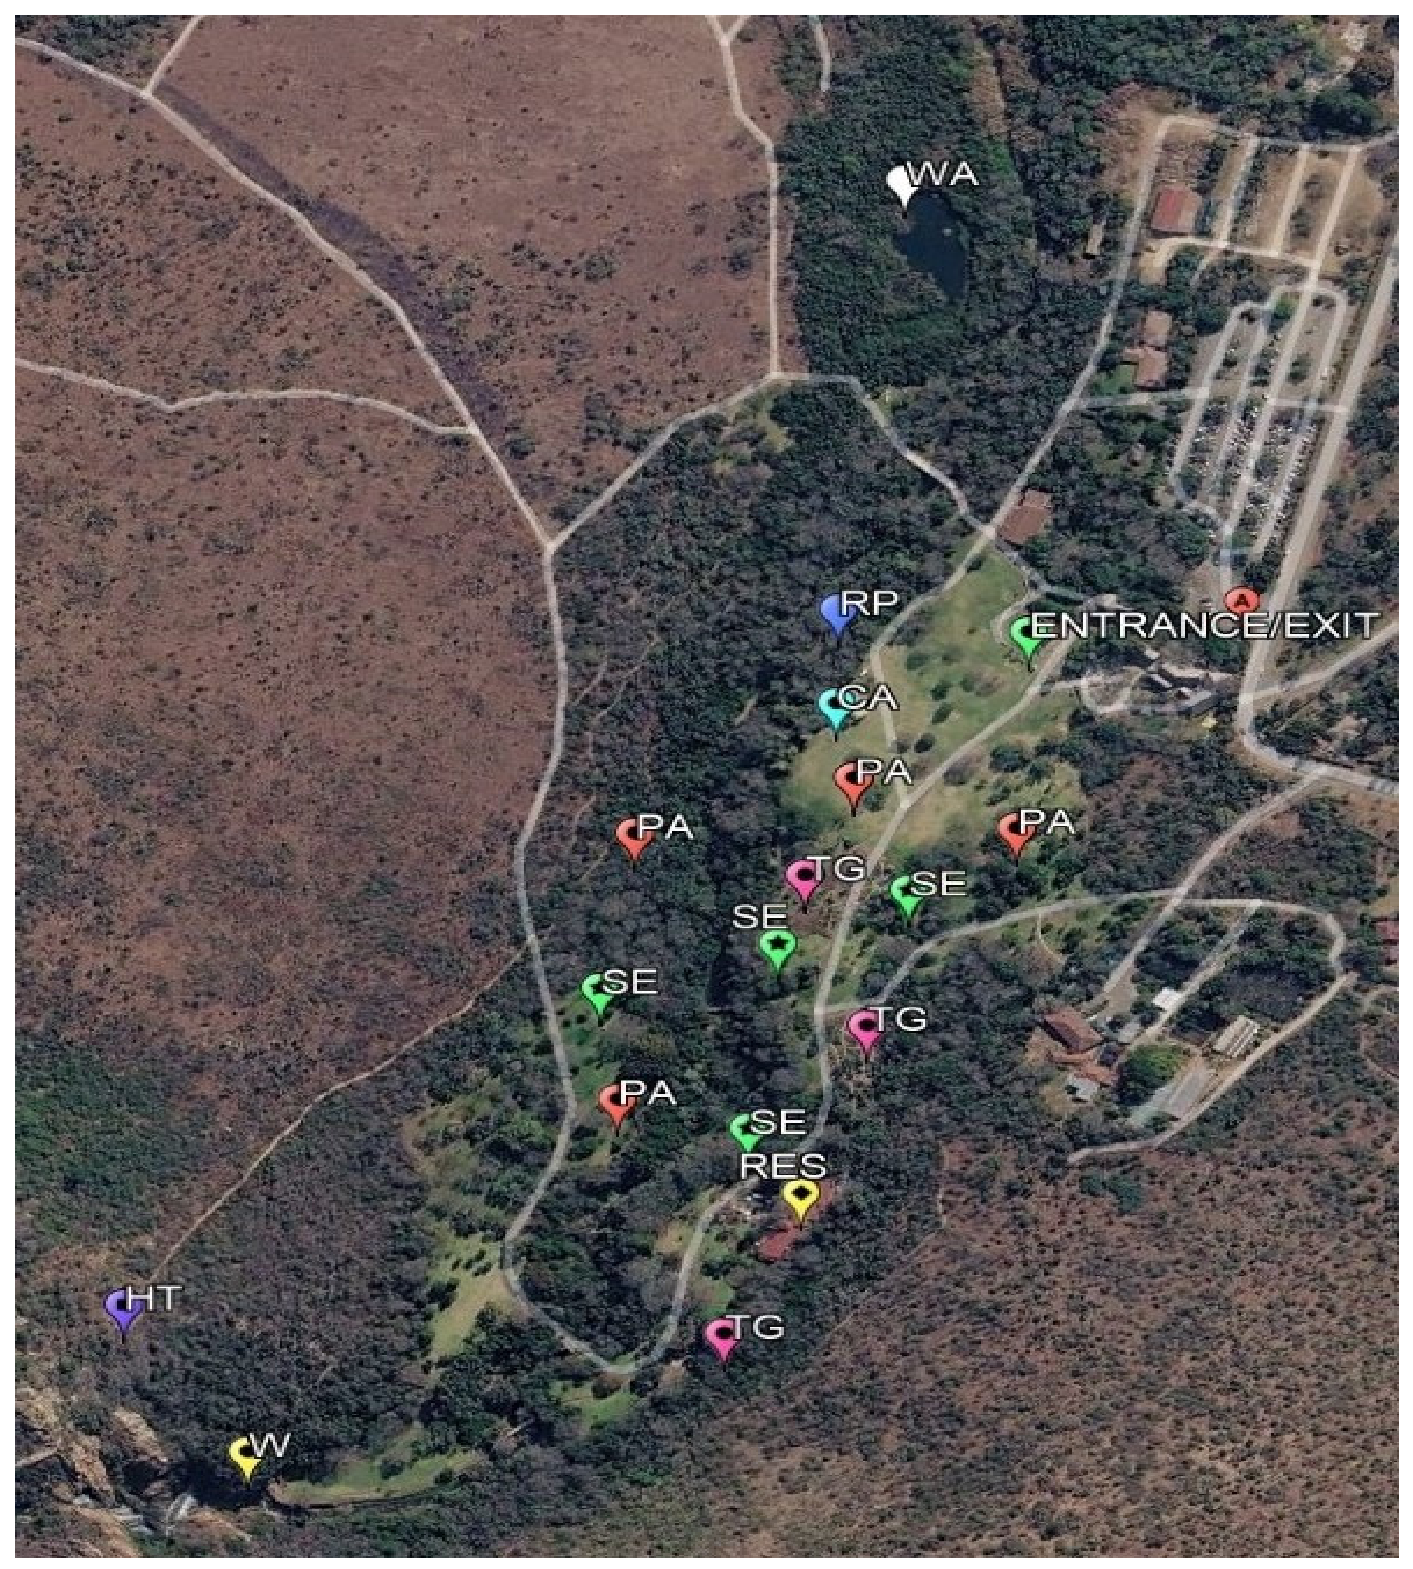
This study was conducted at Walter Sisulu National Botanical Garden (WSNBG), managed by the South African National Biodiversity Institute (SANBI) [36]. Established in 1982, the 296 ha garden in Krugersdorp, Gauteng, comprises three major vegetation types and supports over 600 plant and 240 bird species [36]. Key visitor features include the Witpoortjie Waterfall; trails; gardens; restaurant; sculpture exhibits; green spaces; and event facilities supporting recreational, cultural, and social activities [36]. The location of the study area and the spatial characteristics of WSNBG are presented in Figure 1.
Figure 1.
Location and spatial distribution of the principal visitor destinations at Walter Sisulu National Botanical Garden (WSNBG). CA = Concert Area; HT = Hiking Trail; PA = Picnic Area; RES = Restaurant; RP = Reflection Pond; SE = Sculpture Exhibits; TG = Theme Garden; W = Waterfall; WA = Wetland Area. Source: Adapted from Google Earth Pro (Figure 1 was developed using Google Earth Pro (Google LLC, Mountain View, CA, USA) [37] to map the physical and spatial characteristics of WSNBG, including the location of the principal visitor sites.).
2.2. Research Design, Data Collection, and Analysis
For this study, a descriptive quantitative methodology was employed using a structured questionnaire adapted from previous visitation studies [1,7,38]. Data were collected from 301 visitors using a 58-item questionnaire covering demographic and visitor-profile characteristics, visit motivations, spatial movement, and temporal behaviour. The questionnaire comprised closed-ended, multiple-choice, Likert-scale, yes/no, and open-ended questions. The analyses focused on visitor characteristics, spatial movement patterns, temporal behaviour, visit frequency, activities undertaken, and factors associated with site use.
Data were collected over five weeks in August 2025 through both physical and electronic administration. Trained fieldworkers distributed questionnaires within the garden, while the electronic version was hosted on Google Forms (Google LLC, Mountain View, CA, USA) [39] and accessed through QR codes. Of the 301 responses, 279 were collected physically and 22 electronically. Convenience sampling was used across weekdays and weekends and at different times of day to capture variation in visitor behaviour. Although this non-probability approach limits statistical generalisability, it provided practical access to visitors across different temporal periods during this study.
The data were tabulated and analysed using STATA Version 17 software (Stata Corp LLC, College Station, TX, USA) [40]. Descriptive statistics were used to summarise visitor characteristics, visitation timing, site visitation, and reported activities. These summaries provided an overall description of visitor profiles, visitation rhythms, and patterns of site use, addressing the study objective of characterising the temporal and spatial distribution of visitors across the garden.
The data were tabulated and analysed using STATA Version 17. Descriptive statistics were used to summarise visitor characteristics, visitation timing, site visitation, and reported activities. These summaries provided an overall description of visitor profiles, temporal visitation patterns, and spatial site-use patterns, addressing the objective of characterising the temporal and spatial distribution of visitors across the garden.
Non-metric multidimensional scaling (NMDS) was used to examine patterns of visitor site use and spatial similarity among garden sites. Visitation to each garden site was coded as binary presence/absence data for each respondent, forming a site-use matrix. Jaccard dissimilarity was calculated from this matrix to account for shared site-use patterns, and the resulting dissimilarity matrix was subjected to NMDS. The ordination was used to identify similarities and differences in visitor site-use profiles and to determine whether garden sites exhibited distinct or overlapping patterns of use. Ordination fit was assessed using the stress statistic, with values below 0.20 considered acceptable for interpretation. NMDS thus provided a spatial representation of similarities and differences in visitor site-use patterns across the multifunctional garden.
Associations between garden-site visitation and categorical visitor and temporal characteristics were assessed using Cramer’s V. The measure was used to quantify the strength of associations between individual garden sites and day type (weekday or weekend), age group, group composition, and visit frequency. Spearman’s rho was used to examine the relationship between the number of garden sites visited and visit duration. These analyses assessed the extent to which site-use patterns were associated with visitor characteristics, temporal behaviour, and duration of visits.
Principal component analysis (PCA) was conducted on the correlation matrix of coded visitor site-use and activity variables to identify underlying dimensions linking site visitation and visitor activities. The suitability of the data for PCA was assessed using the Kaiser–Meyer–Olkin (KMO) measure of sampling adequacy and Bartlett’s test of sphericity. The KMO value was 0.78, indicating adequate sampling adequacy, while Bartlett’s test was significant (χ2 = 412.56, p < 0.001), confirming that the correlation matrix was suitable for component analysis. Components were evaluated using eigenvalues and the scree plot, with the latter supporting the retention of four components. The retained components were subjected to Varimax rotation to facilitate interpretation. Component interpretation was based on the magnitude and direction of the rotated loadings, with stronger loadings used to characterise the principal spatial–activity dimensions. The four components accounted for 51.9% of the total variance. PCA complemented the NMDS by identifying broader behavioural dimensions underlying relationships between visitor site choice and reported activities. Together, these analyses provided an integrated basis for interpreting visitor site-use and activity patterns and informing site-responsive management of the garden.
3. Results
Results are organised into four dimensions: demographic profile, spatial movement patterns, temporal behaviour, and multivariate patterns of site use, with NMDS and PCA used further to examine relationships among garden sites and visitor activities.
3.1. Demographic Results
The empirical findings begin with an examination of the demographic profile of respondents at the WSNBG, aiming to identify key traits of the target population. The demographic profile of respondents, as outlined in Table 1, was compiled using variables including gender, age, marital status, level of education, occupation, respondent category, composition of the respondent group and purpose of the visit.
Table 1.
Socio-demographic and visit characteristics of respondents (N = 301).
Table 1 presents a comprehensive overview of the demographic characteristics of the research sample. The data indicate that the majority (44%) of respondents were in the predominant age group of 25–34 years. The least represented age category was individuals aged 55–64 of the sample, thus implying a younger sample. In terms of group composition, most respondents visited the garden with friends, followed by family groups with children. A significant number (59%) attended without children, while others (18%) were accompanied by two children. Regarding educational attainment, nearly half of the respondents held a national diploma or equivalent, with some possessing a higher certificate.
Transportation results reveal that a large majority travelled to the garden using personal vehicles, likely reflecting considerations of convenience and accessibility. The majority of respondents resided in Johannesburg and the surrounding areas. Notably, prior visits served as the most common source of information about the garden, followed by word-of-mouth from family and friends. These patterns suggest a high level of repeat visitation, with many respondents indicating they visit the garden at least annually. Some reported visiting several times per year.
3.2. Patterns of Spatial Movement
To examine visitors’ movement patterns within the WSNBG, respondents were asked to indicate the garden sites they had initially planned to visit and the sites they actually visited during their visit (Table 2).
Table 2.
Distribution of reported planned visits and actual visits across garden sites.
Table 2 illustrate a high degree of spatial consistency between visitors’ planned and actual garden-site movements, with only a small overall reduction in 13 site selections (−4.3%). In contrast, the hiking trail recorded the greatest spatial divergence, with nine fewer actual than planned visits. Smaller deviations were recorded at the wetland area, waterfall, and restaurant, while no deviation occurred at the remaining sites.
Overall, the limited deviations indicate that visitors largely maintained their planned spatial movement patterns.
To examine visitation beyond the planned movements, respondents were also asked to identify additional garden sites visited during their visit (Table 3).
Table 3.
Respondents’ reported additional visitation to garden sites.
Table 3 shows that the waterfall recorded the highest frequency of return visits, followed by the sculpture exhibits and the restaurant. Together, these three sites accounted for 83% of all additional site visits. By contrast, minimal return activity was recorded at the remaining sites. Taken together, additional visitation was concentrated in a limited number of sites, with most other sites receiving comparatively few visits.
Modes of garden use were assessed by analysing survey responses in which respondents identified the activities undertaken during their visit (Table 4).
Table 4.
Distribution of respondents’ activities.
Table 4 demonstrates that relaxation was the most frequently cited activity, followed by hiking, with both accounting for the majority (79%) of responses. All other activities were reported at substantially lower levels, with self-expression and photography representing the least frequently reported pursuits. In summary, recreational engagement was dominated by a narrow set of core activities, with limited diversification across activity types.
3.3. Temporal Movement Patterns
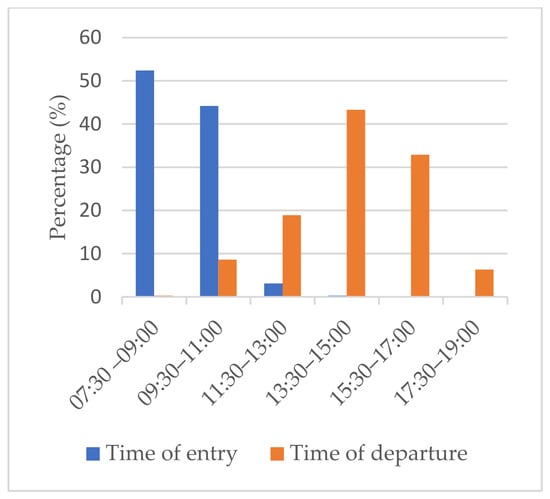
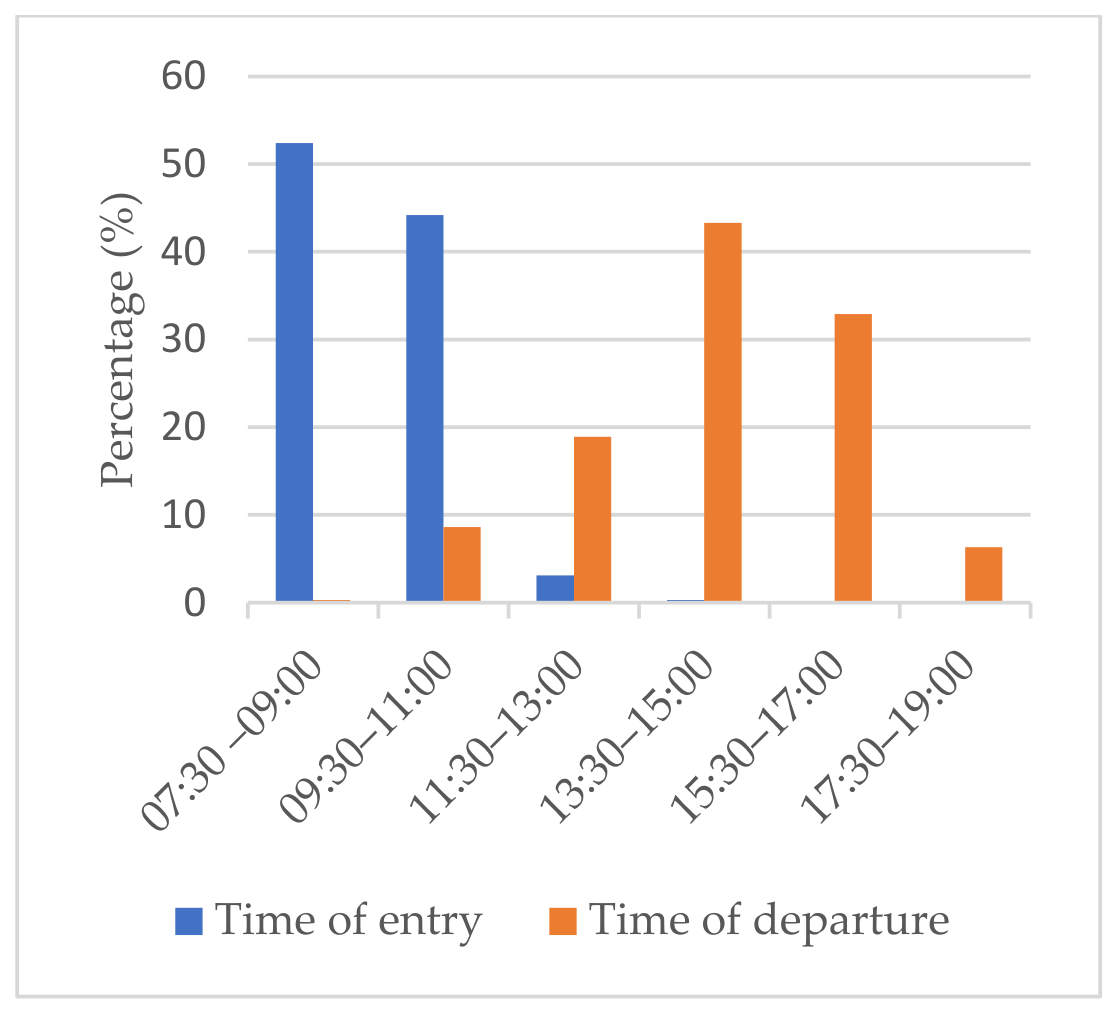
To examine temporal patterns of visitation, respondents were asked to indicate the day on which they visited the garden and the duration of their stay. These variables were included to characterise visitation behaviour and identify temporal trends in visitor use (Figure 2 and Figure 3).
Figure 2.
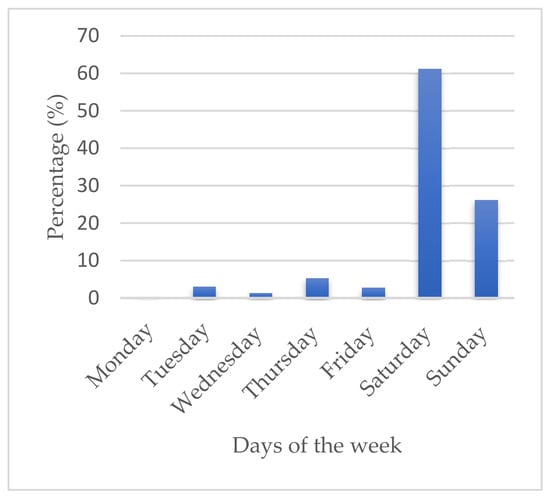
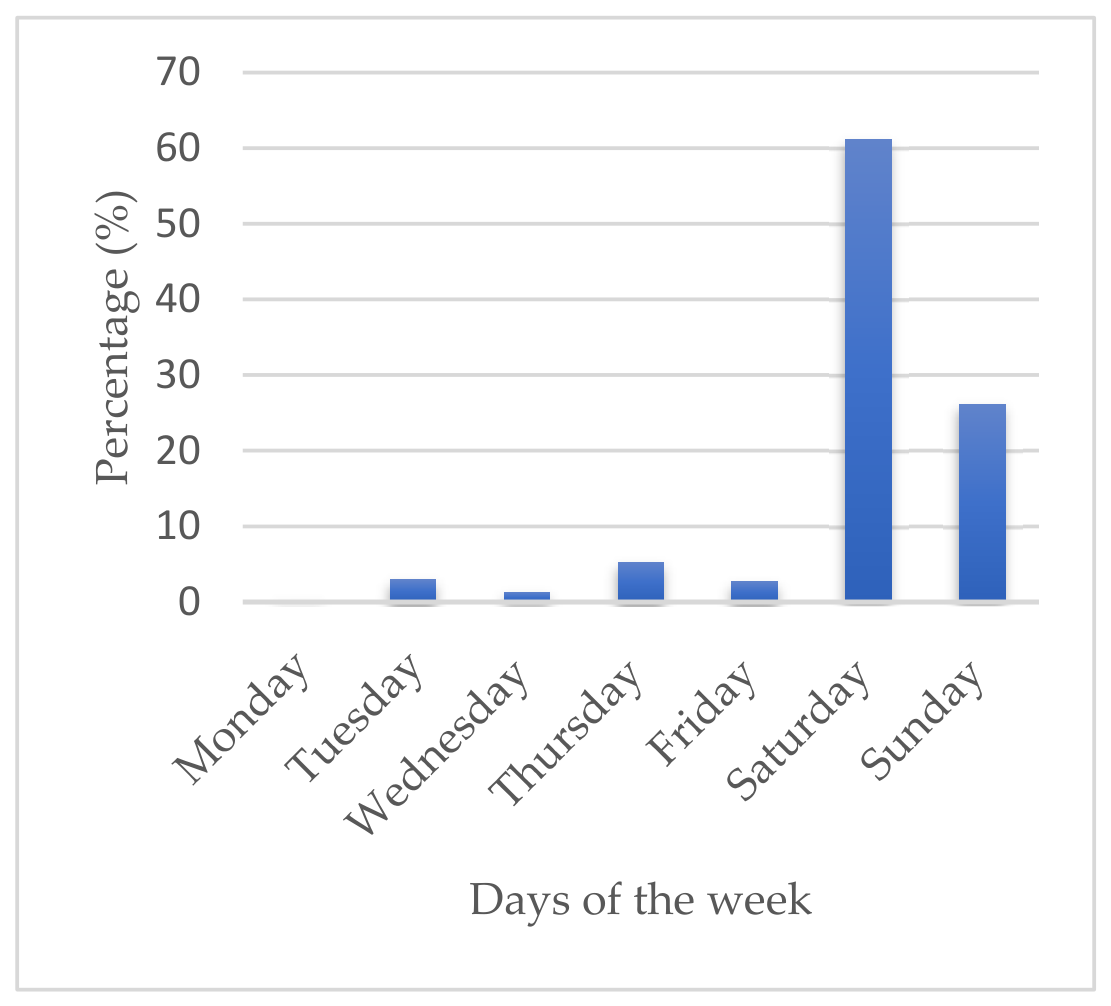
Distribution of visits by day.
Figure 3.
Time of entry vs. time of departure of the week.
Figure 2 and Figure 3 display the temporal patterns of visitor visitation, entry, and departure at the BG. As presented in Figure 2, most respondents visited on Saturdays, followed by Sundays, indicating higher weekend visitation. Weekday visitation was comparatively lower, with Thursday recording the highest weekday visitation, followed by Tuesday, Friday, and Wednesday. Figure 3 demonstrates that most respondents reported arriving between 08:00 and 11:00, representing the most common arrival period. Fewer respondents arrived between 11:30 and 13:00, while the lowest arrival frequency occurred between 13:30 and 15:00. Regarding departure, most respondents reported leaving between 13:30 and 15:00, followed by 15:30 and 17:00. Fewer respondents departed between 11:30 and 13:00, while early-morning and late-afternoon departures were least common.
3.4. Multidimensional Scaling of Spatial Visitation Patterns
Associations between individual garden sites and variables such as day type (weekday or weekend), age group, group composition, and visit frequency were assessed to determine whether spatial patterns of garden use varied according to temporal behaviour and visitor characteristics. Cramer’s V quantified the strength of categorical associations, and Spearman’s rho examined the relationship between the number of sites visited and visit duration (Table 5).
Table 5.
Visitor–site associations across temporal, visitor, and activity characteristics.
Table 5 shows that spatial visitation was significantly associated with multiple aspects of temporal behaviour and visitor composition; however, the strength of these associations differed by site. Temporal associations varied across garden sites, with the strongest patterns observed for the picnic area and wetland and a comparatively weaker pattern for the hiking trail. Age was significantly associated with visitation to the concert area, wetland, picnic area, and hiking trail. Waterfall visitation, however, was not significantly associated with age group.
Group composition was significantly associated with visitation to the picnic area, waterfall, and hiking trail, with the strongest association occurring at the picnic area.
Visit frequency was significantly associated with visitation to the waterfall, hiking trail, and picnic area. The number of sites visited was also significantly associated with visit duration.
Overall, spatial visitation varied across selected temporal and visitor characteristics, with significant associations concentrated across several recreational and activity-oriented sites.
3.5. Principal Component Analysis of Spatial–Activity Relationships
The PCA identified four broad dimensions of spatial site–activity behaviour, collectively accounting for 51.9% of the total variance (Table 6). PC1 represented a restorative/stay-oriented versus active recreation dimension, characterised by relaxation and picnic-area use in contrast to hiking and hiking-trail use. PC2 represented an event-oriented versus trail-based recreation dimension, distinguishing concert-related activities from hiking and trail use. PC3 reflected a nature-observation dimension, primarily associated with birdwatching and wetland use. PC4 represented visual and aesthetic engagement, characterised mainly by photography and sculpture exhibit-related use, with waterfall visitation also contributing to this dimension (Table 7).
Table 6.
PCA loadings of spatial site–activity relationships.
Table 7.
Variance explained by principal components.
Collectively, the four components represent distinct dimensions of spatial site–activity behaviour, encompassing restorative and active recreation, event-oriented use, nature observation, and visual and aesthetic engagement.
4. Discussion
This study shows that the garden functions primarily as a local urban leisure space, with visitation concentrated among younger and middle-aged adults and social or family groups. This pattern is broadly consistent with South African research showing that BGs serve nearby urban populations and provide recreational, social, and nature-based experiences [1,10,41], and parallels international findings from China, where urban gardens attract regional visitors for everyday leisure [42]. The reliance on private vehicles also highlights the importance of accessibility in visitor use. Evidence from São Paulo demonstrates substantial spatial inequalities in access to UGSs, showing that proximity and the distribution of green infrastructure can influence opportunities for the use of UGSs [43].
The concentration of visitation on Saturdays and Sundays indicates stronger visitor demand during non-working days, consistent with a study in China [31] that examined population movement patterns across 36 major cities and identified systematic differences between weekday and weekend mobility. The overlap between the predominant arrival period (08:00–11:00) and departure period (13:30–15:00) suggests that visits typically extended for approximately 2.5–4 h, reflecting sustained daytime use of the BG. These temporal patterns highlight the importance of aligning visitor services and management interventions with periods of increased weekend and daytime demand.
Visitor movement combined planned destinations with flexible route choices, particularly around the hiking trail. The concentration of repeat visitation at the waterfall, sculpture exhibits, and restaurant identifies these features as focal nodes requiring sustained maintenance and facilities, while less-visited areas such as the reflection pond and theme gardens present opportunities for visitor dispersal. However, the present study did not systematically assess distances between destinations or the surface and condition of paths and roads; therefore, these physical characteristics cannot be identified as causes of the observed visitation patterns. Rather, they represent factors that warrant further investigation when assessing differences in visitor movement and site use. Activity analysis further confirmed functional differentiation, with relaxation associated with the picnic area, hiking with the hiking trail, events with the concert area, and birdwatching with the wetland. PCA consolidated these relationships into four broader dimensions of restorative and active recreation, event-oriented use, nature observation, and visual and aesthetic engagement. These findings are consistent with the multifunctional character of UGSs, where recreational use, nature experience, and ecological functions can coexist within the same landscape [44]. Visitors therefore appear to select destinations according to their preferred activities and experiences.
The concentration of visitation at key nodes, particularly the waterfall, picnic area, and hiking trail, together with higher weekend and daytime use, suggests that management should prioritise low-cost orientation and visitor-dispersal measures during peak periods. Clear entry-point information, directional markers, strategically placed site maps, QR-based route information, and suggested walking loops could improve wayfinding and encourage movement towards less-visited destinations such as the reflection pond and theme gardens. Targeted interpretation and promotion of these sites, supported by staff or volunteer guidance, could increase their visibility without immediate physical redevelopment, while continued maintenance and appropriate facility provision at high-use nodes would help accommodate concentrated demand. Collectively, these measures provide a cost-sensitive approach to managing visitor movement through information, orientation, and targeted promotion before considering more substantial infrastructure interventions.
For new garden designs, observed visitor behaviour can provide a basis for considering attractions, pathways, facilities, and entrances as integrated systems. Active recreation may be connected to trail networks, event facilities to high-flow areas, and restorative or observational spaces to quieter zones. Applying visitor-flow evidence during pre-construction planning may help inform the placement of attractions, pathway networks, accessibility features, and facilities. Chinese research demonstrates the value of incorporating spatial layout, accessibility, and visitor-flow considerations into UGS planning and capacity management [45,46]. Overall, the findings demonstrate that visitor behaviour can provide an evidence base for both the management of existing BGs and the spatial planning of new BGs. Understanding how visitors move between destinations, engage in activities, and use spaces across different temporal periods can support more informed decisions about connectivity, circulation, activity zoning, accessibility, wayfinding, and visitor-support infrastructure. This provides a basis for designing multifunctional landscapes that respond to visitor needs while supporting sustainable and site-responsive management.
5. Conclusions
This study demonstrates that visitor behaviour in the BG is shaped by demographic profiles, temporal rhythms, spatial destinations, and activity-based preferences. By showing how visitor movement and site–activity relationships structure garden use, this study contributes to sustainable management and planning strategies that balance visitor experience with ecological sensitivity. Future research should extend this approach through multi-site comparisons, seasonal and longitudinal studies, and the use of GPS/GIS-based tracking and spatial analysis to deepen understanding of factors influencing visitor movement. In summary, this study highlights that BGs are best managed and designed as spatially and temporally differentiated systems of visitor activities, where evidence-based insights into behaviour can guide both immediate management decisions and long-term planning.
Author Contributions
Conceptualization, M.E.R.; methodology, M.E.R.; formal analysis, M.E.R.; investigation, M.E.R.; resources, U.P.H.; data curation, M.E.R.; writing—original draft preparation, M.E.R.; writing—review and editing, U.P.H., J.W.H., and P.T.; supervision, U.P.H., J.W.H., and P.T. All authors have read and agreed to the published version of the manuscript.
Funding
This research received no external funding.
Institutional Review Board Statement
This study was conducted in accordance with the Declaration of Helsinki and approved by the Human Research Ethics Committee of Tshwane University of Technology (HREC=05=007(MS), 10 July 2025).
Informed Consent Statement
Informed consent was obtained from all subjects involved in this study.
Data Availability Statement
The raw data supporting the findings and conclusions of this article are available from the corresponding author upon reasonable request.
Conflicts of Interest
The authors declare no conflicts of interest.
Abbreviations
The following abbreviations are used in this manuscript:
| UGS | Urban Green Space |
| BG | Botanical Garden |
| WSNBG | Walter Sisulu National Botanical Garden |
| PCA | Principal Component Analysis |
| NMDS | Non-Metric Multidimensional Scaling |
| SANBI | South African National Biodiversity Institute |
References
- Hermann, U.P.; Bouwer, S.C. Motives to Visit Urban Ecotourism Sites: A Study of a Botanical Garden in South Africa. J. Environ. Manag. Tour. 2023, 14, 563–574. [Google Scholar] [CrossRef] [Scilit] [PubMed]
- Heikinheimo, V.; Tenkanen, H.; Bergroth, C.; Järva, O.; Hiippala, T.; Toivonen, T. Understanding the Use of Urban Green Spaces from User-Generated Geographic Information. Landsc. Urban Plan. 2020, 201, 103845. [Google Scholar] [CrossRef] [Scilit]
- Dobbs, C.; Escobedo, F.J.; Clerici, N.; De la Barrera, F.; Eleuterio, A.A.; MacGregor-Fors, I.; Reyes-Paecke, S.; Vásquez, A.; Zea Camaño, J.D.; Hernández, H.J. Urban Ecosystem Services in Latin America: Mismatch between Global Concepts and Regional Realities? Urban Ecosyst. 2018, 22, 173–187. [Google Scholar] [CrossRef] [Scilit]
- Frediani, K. The Role of Curation in Botanic Gardens: Platforms for Environmental and Social Transition. Living Lab 2024, 1, 22–72. [Google Scholar] [CrossRef] [Scilit]
- Chen, G.; Sun, W. The Role of Botanical Gardens in Scientific Research, Conservation, and Citizen Science. Plant Divers. 2018, 40, 181–188. [Google Scholar] [CrossRef] [Scilit] [PubMed]
- Mkhize, B.N. Who Visits a Nature-Based Urban Attraction and Why? Afr. J. Hosp. Tour. Leis. 2020, 9, 1–14. [Google Scholar]
- Sisneros-Kidd, A.M. Why Do They Do That? Understanding Factors Influencing Visitor Spatial Behavior in Parks and Protected Areas. Ph.D. Dissertation, Utah State University, Logan, UT, USA, 2018. [Google Scholar]
- Bursa, B.; Mailer, M.; Axhausen, K.W. Intra-Destination Travel Behavior of Alpine Tourists: A Literature Review on Choice Determinants and the Survey Work. Transportation 2022, 49, 1465–1516. [Google Scholar] [CrossRef] [Scilit]
- Orellana, D.; Bregt, K.; Ligtenberg, A.; Wachowicz, M. Exploring Visitor Movement Patterns in Natural Recreational Areas. Tour. Manag. 2012, 33, 672–682. [Google Scholar] [CrossRef] [Scilit]
- Middel, I.J.; Bouwer, S.C.; Hermann, U.P. Nature-Based Urban Tourism Attractions: Resident Perceptions of the Benefits of Visitation to a Botanical Garden in South Africa. Int. J. Tour. Cities 2025, 11, 500–512. [Google Scholar] [CrossRef] [Scilit]
- Khairi, M.D.; Ismail, N.H.; Jaafar, S.M. Knowledge of Tourist Spatial Behaviour to Improve Melaka World Heritage Site Management. Int. J. Tour. Cities 2022, 8, 88–106. [Google Scholar] [CrossRef] [Scilit]
- Kovalcsik, T.; Elekes, Á.; Boros, L.; Könnyid, L.; Kovács, Z. Capturing Unobserved Tourists: Challenges and Opportunities of Processing Mobile Positioning Data in Tourism Research. Sustainability 2022, 14, 13826. [Google Scholar] [CrossRef] [Scilit]
- Huang, X. Study of Conceptual Framework of Tourism Temporal Planning. Tour. Trib. 2014, 29, 73–79. [Google Scholar]
- Chettiar, S.; Laryea, S.; Wall, K. A Model for Integrated Tourism Infrastructure Planning in the South African Public Sector. Afr. J. Hosp. Tour. Leis. 2022, 11, 1804–1823. [Google Scholar]
- Riungu, G.K.; Peterson, B.A.; Beeco, J.A.; Brown, G. Understanding Visitors’ Spatial Behavior: A Review of Spatial Applications in Parks. Tour. Geogr. 2019, 20, 833–857. [Google Scholar] [CrossRef] [Scilit]
- Liu, P.; Xiao, X.; Zhang, J.; Wu, R.; Zhang, H. Spatial Configuration and Online Attention: A Space Syntax Perspective. Sustainability 2018, 10, 221. [Google Scholar] [CrossRef] [Scilit]
- Hu, J.; Wu, J.; Sun, Y.; Zhao, X.; Hu, G. Spatiotemporal Influence of Urban Park Landscape Features on Visitor Behavior. Sustainability 2023, 15, 5248. [Google Scholar] [CrossRef] [Scilit]
- Yang, E. Spatiotemporal Role of Tourism in Mitigating Social Vulnerability. J. Hosp. Tour. Manag. 2024, 60, 291–302. [Google Scholar] [CrossRef] [Scilit]
- Li, W.; Liu, Y. The Influence of Visual and Auditory Environments in Parks on Visitors’ Landscape Preference, Emotional State, and Perceived Restorativeness. Humanit. Soc. Sci. Commun. 2024, 11, 1491. [Google Scholar] [CrossRef] [Scilit]
- Adinolfi, C.; Suárez-Cáceres, G.P.; Cariñanos, P. Relation between Visitors’ Behaviour and Characteristics of Green Spaces in the City of Granada, South-Eastern Spain. Urban For. Urban Green. 2014, 13, 534–542. [Google Scholar] [CrossRef] [Scilit]
- Korpilo, S.; Virtanen, T.; Saukkonen, T.; Lehvävirta, S. More Than A to B: Understanding and Managing Visitor Spatial Behaviour in Urban Forests Using Public Participation GIS. J. Environ. Manag. 2018, 207, 124–133. [Google Scholar] [CrossRef] [Scilit] [PubMed]
- Cudjoe, E.; Gbedemah, S.F. The New Roles of Legon Botanical Garden as Visitor Destination in Ghana. J. Sustain. Tour. Entrep. 2020, 1, 23–35. [Google Scholar] [CrossRef] [Scilit]
- Song, Y.; Newman, G.; Huang, X.; Ye, X. Factors Influencing Long-Term City Park Visitations for Mid-Sized US Cities: A Big Data Study Using Smartphone User Mobility. Sustain. Cities Soc. 2022, 80, 103815. [Google Scholar] [CrossRef] [Scilit]
- Young, M.T.; Vispute, S.; Serghiou, S.; Kumok, A.; Shah, Y.; Lane, K.J.; Black-Ingersoll, F.; Brochu, P.; Bharel, M.; Skenazy, S.; et al. Quantifying Urban Park Use in the USA at Scale: Empirical Estimates of Realised Park Usage Using Smartphone Location Data. Lancet Planet. Health 2024, 8, e564–e573. [Google Scholar] [CrossRef] [Scilit] [PubMed]
- Struwig, C.; Davis, N.; Breetzke, G.D. Factors Impacting Urban Greenspace Usage: New Evidence from South Africa. GeoJournal 2024, 89, 228. [Google Scholar] [CrossRef] [Scilit]
- Sugimoto, K.; Ota, K.; Suzuki, S. Visitor Mobility and Spatial Structure in a Local Urban Tourism Destination: GPS Tracking and Network Analysis. Sustainability 2019, 11, 919. [Google Scholar] [CrossRef] [Scilit]
- Shoval, N.; Isaacson, M. Tracking Tourists in the Digital Age. Ann. Tour. Res. 2007, 34, 141–159. [Google Scholar] [CrossRef] [Scilit]
- Ijatuyi, E.J.; Yessoufou, K.; Patrick, H.O. Sustainable Tourism and Green Space: Exploring How Green Spaces and Natural Attractions Contribute to Local Tourism Economies and Revenue Generation in Gauteng Province. Discov. Sustain. 2025, 6, 236. [Google Scholar] [CrossRef] [Scilit]
- Peterson, B.A.; Perry, E.E.; Brownlee, M.T.J.; Sharp, R. The Transient Nature of Concentrated Use at a National Park: A Spatiotemporal Investigation into Visitor Behavior. J. Outdoor Recreat. Tour. 2020, 31, 100310. [Google Scholar] [CrossRef] [Scilit]
- Chemeda, B.A.; Woldemedhin, D.G.; Mesfin, D.; Terefe, F. Visitors’ Fondness and Satisfaction to Urban Recreational Parks: The Case of Bihere-Tsige Park, Addis Ababa, Ethiopia. Discov. Glob. Soc. 2025, 3, 42. [Google Scholar] [CrossRef] [Scilit]
- Zhang, C.; Li, M.; Ma, D.; Guo, R. How Different Are Population Movements between Weekdays and Weekends: A Complex-Network-Based Analysis on 36 Major Chinese Cities. Land 2021, 10, 1160. [Google Scholar] [CrossRef] [Scilit]
- Abreu Novais, M.; Del Papa, B.; Han, Q.; Mohan, K.; Vásárhelyi, O.; Wang, Y.; Zejnilovic, L. Investigating Patterns of Tourist Movement Using Multiple Data Sources. J. Vacat. Mark. 2026, 32, 709–724. [Google Scholar] [CrossRef] [Scilit]
- Ballantyne, R.; Packer, J. International Handbook on Ecotourism; Edward Elgar: Cheltenham, UK, 2013. [Google Scholar] [CrossRef] [Scilit]
- Roberts, H.V. Using Twitter Data in Urban Green Space Research: A Case Study and Critical Evaluation. Appl. Geogr. 2017, 81, 13–20. [Google Scholar] [CrossRef] [Scilit]
- Mosia, M.; Dube, K.; Labuschagne, V. Tourist Perceptions of the Impacts of Climate Variability and Change on Botanical Gardens. Afr. J. Hosp. Tour. Leis. 2022, 11, 343–361. [Google Scholar] [CrossRef] [Scilit]
- South African National Biodiversity Institute (SANBI). Annual Performance Plan 2024/25; SANBI: Pretoria, South Africa, 2024; Available online: https://www.sanbi.org/wp-content/uploads/2025/10/Annual-Report-2024-25.pdf (accessed on 2 May 2026).
- Google LLC. Google Earth Pro [Software], version 7.3.7.1327; Google LLC: Mountain View, CA, USA, 2025. Available online: https://earth.google.com/desktop/ (accessed on 2 May 2026).
- Vassiliadis, C.A.; Priporas, C.V.; Andronikidis, A. An Analysis of Visitor Behaviour Using Time Blocks: A Study of Ski Destinations in Greece. Tour. Manag. 2013, 34, 61–70. [Google Scholar] [CrossRef] [Scilit]
- Google LLC. Google Forms [Software], Google LLC: Mountain View, CA, USA, 2025. Available online: https://forms.google.com/ (accessed on 2 May 2026).
- StataCorp. Stata Statistical Software [Software], Release 17; StataCorp LLC: College Station, TX, USA, 2021.
- Ward, C.D.; Parker, C.M.; Shackleton, C.M. The Use and Appreciation of Botanical Gardens as Urban Green Spaces in South Africa. Urban For. Urban Green. 2010, 9, 49–55. [Google Scholar] [CrossRef] [Scilit]
- Wu, K.; Feng, C.; Chen, Z.; Wang, H. How Greenspaces Fit into Daily Routines: Evidence from Mobile Signaling Data in Shenzhen, China. Urban For. Urban Green. 2026, 124, 129631. [Google Scholar] [CrossRef] [Scilit]
- Moreira, T.C.L.; Polizel, J.L.; Santos, I.S.; Silva Filho, D.F.; Bensenor, I.M.; Lotufo, P.A.; Mauad, T. Green Spaces, Land Cover, Street Trees and Hypertension in the Megacity of São Paulo. Int. J. Environ. Res. Public Health 2020, 17, 725. [Google Scholar] [CrossRef] [Scilit] [PubMed]
- Kowarik, I. Urban Wilderness: Supply, Demand, and Access. Urban For. Urban Green. 2018, 29, 336–347. [Google Scholar] [CrossRef] [Scilit]
- Zhang, Y.; Li, X.R.; Su, Q. Does Spatial Layout Matter to Theme Park Tourism Carrying Capacity? Tour. Manag. 2017, 61, 82–95. [Google Scholar] [CrossRef] [Scilit]
- Jiang, Y.; Li, T.; Xu, H.; Huang, X.; Li, H.; Wang, Z. Exploring the Factors Influencing Visits to Urban Parks: A Case Study of Beijing’s Central Urban Area. Appl. Geogr. 2025, 178, 103613. [Google Scholar] [CrossRef] [Scilit]

Disclaimer/Publisher’s Note: The statements, opinions and data contained in all publications are solely those of the individual author(s) and contributor(s) and not of MDPI and/or the editor(s). MDPI and/or the editor(s) disclaim responsibility for any injury to people or property resulting from any ideas, methods, instructions or products referred to in the content. |
© 2026 by the authors. Licensee MDPI, Basel, Switzerland. This article is an open access article distributed under the terms and conditions of the Creative Commons Attribution (CC BY) license.