


Abstract
Public aircraft engine certification data provide a reproducible basis for emissions modeling when the proprietary combustor geometry, engine cycle data, and detailed operating histories are unavailable. This study develops a physically constrained reduced-order framework based on the International Civil Aviation Organization (ICAO) Aircraft Engine Emissions Databank for modeling gaseous emissions from civil aircraft gas turbine engines over the landing and take-off (LTO) cycle. In this framework, physical constraints are introduced through combustor-aware grouping, physics-informed predictor selection, empirical domain restrictions, and physical admissibility checks on the fitted correlations. The analysis uses variables available directly from the ICAO Aircraft Engine Emissions Databank, together with derived LTO quantities, to construct combustor-aware reduced-order correlations for LTO-averaged emission indices, namely for nitrogen oxides (NOx), carbon monoxide (CO), and hydrocarbons (HC), denoted by , , and , respectively. High-bypass-ratio (HBPR) turbofan engines are grouped by representative combustor technology, including conventional/single-annular combustor (Conventional/SAC), double-annular combustor (DAC), twin-annular premixing swirler (TAPS), Pratt & Whitney TALON lean-burn combustor, low-emissions combustor (LEC), and an Unknown category. For each pollutant and combustor group, two-predictor quadratic response surfaces and power law correlations are fitted using public engine-level predictors such as the overall pressure ratio, bypass ratio, rated thrust, and total LTO fuel consumption. The results show that combustor-aware grouping improves interpretability and that no single global predictor pair represents all pollutants or combustor technologies. For , the overall pressure ratio appears in every selected predictor pair, consistent with the pressure- and temperature-sensitive nature of NOx formation. For , strong within-dataset group-specific correlations are obtained for several combustor classes, whereas is more sensitive to zero and near-zero values, making percentage-based errors and log-space power law fits less reliable. The quadratic models generally provide stronger within-dataset descriptive fits, while the power law models provide compact non-negative scaling relations for groups where their errors are acceptable. The proposed framework is suitable for emissions trend analysis, preliminary comparative assessment, and the interpretation of public certification data, but it should not be used as a substitute for certification testing, detailed combustor simulation, or off-design mission-level prediction without additional validation.
1. Introduction
Aircraft gas turbine engines remain central to commercial aviation because of their high power density, reliability, operational maturity, and suitability for medium- and long-range transport. Their development reflects a long sequence of advances in compressor and turbine aerodynamics, combustor design, cooling technology, materials, controls, and integrated engine cycle optimization [1,2,3]. These advances have produced propulsion systems that are progressively cleaner, leaner, and more fuel-efficient [4]. Nevertheless, aircraft engine emissions remain a major environmental, regulatory, and design concern because they affect the local air quality near airports and contribute to the atmospheric chemistry and climate forcing at altitude [5,6,7]. The reliable prediction of gaseous emissions is therefore required for certification support, emissions inventories, airport air quality studies, engine cycle analysis, and the preliminary assessment of future propulsion concepts.
Aero-engine exhaust contains major products of hydrocarbon combustion, mainly carbon dioxide and water vapor, together with regulated pollutants such as nitrogen oxides (NOx), carbon monoxide (CO), hydrocarbons (HC), smoke, and non-volatile particulate matter [3,8,9,10]. International certification practice is framed through International Civil Aviation Organization (ICAO) Annex 16, Volume II, which defines standards and recommended practices for aircraft engine emissions, including gaseous emissions from turbojet and turbofan engines [11]. Public emission measurements are reported in the ICAO Aircraft Engine Emissions Databank, which provides fuel flow rates and emission indices at the standard landing and take-off (LTO) operating modes [12]. The measurement and calculation context is also supported by technical procedures for continuous gaseous emissions sampling and aircraft emissions calculation [13,14]. These datasets and procedures have long been used in emissions inventories and flight emissions assessment methods [15,16,17]. However, certification data are obtained under standardized sea-level static conditions; therefore, their use outside the certification framework requires careful interpretation, especially for non-LTO operation, mission-level inventories, and engine cycle studies.
The present work focuses on gaseous pollutants, especially NOx, CO, and hydrocarbons (HC). In the combustion literature, HC emissions are also commonly referred to as unburned hydrocarbons (UHC); however, the notation HC is used consistently here to follow the ICAO Aircraft Engine Emissions Databank terminology. NOx is important in gas turbine combustors because its formation is strongly coupled to high-temperature reaction zones, the combustor pressure, the residence time, oxygen availability, and fuel–air mixing. Thermal NO formation is commonly associated with the high-temperature oxidation of atmospheric nitrogen [18]; prompt NO and other nitrogen chemistry routes may also contribute depending on the local equivalence ratio, fuel composition, pressure, and flame structure [19,20,21,22,23,24]. CO and HC, by contrast, are mainly associated with incomplete oxidation, local quenching, an insufficient residence time, poor mixing, and low-temperature operation [8,9]. These different formation mechanisms imply that a single unconstrained empirical relation is unlikely to represent all gaseous emissions across all engines, operating modes, and combustor technologies.
Although the present study uses certification data and engine-level variables, the interpretation of gaseous emission trends must recognize the liquid fuel processes occurring inside aero-engine combustors. Conventional kerosene-fueled combustors inject fuel as a spray; the subsequent sequence of atomization, droplet heating, evaporation, vapor–air mixing, ignition, and finite-rate oxidation controls the local equivalence ratio field, the flame temperature distribution, the residence time available for reaction, and the completeness of combustion [9,25,26]. Classical and subsequent droplet vaporization studies show that evaporation depends on heat and mass transfer, the ambient pressure, the gas temperature, fuel volatility, and the surrounding composition [27,28,29,30,31,32]. In gas turbine combustors, slow evaporation or poor atomization can produce locally rich pockets, delayed burning, or fuel vapor leakage into cooler downstream zones. These effects tend to increase CO and HC because oxidation may be incomplete when the residence time, temperature, or oxygen availability is insufficient. Conversely, improved atomization and rapid evaporation can promote more uniform mixture preparation but may also modify the high-temperature residence time, thereby affecting NOx formation. Low-emission combustor concepts such as lean direct injection (LDI), rich-burn quick-quench lean-burn (RQL), and other staged or partially premixed configurations therefore attempt to manage the coupled processes of evaporation, mixing, flame stabilization, quenching, and dilution so that high-temperature stoichiometric regions and incomplete-oxidation zones are minimized [33,34,35]. In the present ICAO-based work, detailed injector geometries, Sauter mean diameters, spray distributions, liner air admissions, and combustor residence time data are unavailable for most certified engines. Fuel droplet evaporation is consequently treated as a physical interpretation factor rather than an explicitly solved submodel.
Several categories of aircraft engine emission prediction methods have been developed, each with different input requirements, physical fidelity, and computational costs. Fuel flow methods and combustor inlet pressure–temperature (P3–T3) approaches use reference emissions data together with the fuel flow, combustor inlet pressure, combustor inlet temperature, or related engine performance quantities to estimate emissions away from reference conditions [16,17]. Semi-empirical combustor correlations relate emissions to quantities such as the combustor inlet pressure, combustor inlet temperature, fuel–air ratio, equivalence ratio, flame temperature, residence time, and combustor loading [9,25,36,37]. These methods are attractive for conceptual design and preliminary assessment because they are computationally inexpensive and can be implemented with limited information. Their main limitation is that their validity is tied to the data, combustor class, and operating range used for calibration.
More detailed reduced-order approaches include stirred reactor and chemical reactor network (CRN) models. These methods divide the combustor into idealized reacting zones and solve finite-rate chemistry while retaining a manageable computational cost [26,34]. They offer a useful compromise between simple correlations and full reacting-flow simulation because they can represent the residence time, equivalence ratio distribution, and staged combustion effects more explicitly. At higher fidelity, computational fluid dynamics (CFD)-based reacting flow calculations can resolve the influences of the geometry, turbulent mixing, heat transfer, and turbulence–chemistry interaction, but they require detailed boundary conditions and substantial computational resources [38,39,40]. Recent CFD and CRN studies indicate that chemical evolution may continue downstream of the combustor, particularly under high-pressure and high-temperature turbine conditions, challenging the common assumption that the pollutant composition is always frozen at the combustor exit [40].
Engine performance simulation tools provide another route for emissions assessment because the combustor inlet pressure, combustor inlet temperature, fuel flow, and turbine temperature are determined by the thermodynamic cycle. Generic gas turbine simulation methods, cycle deck frameworks, and integrated engine performance tools are therefore useful for connecting public emissions data to engine cycle variables and for assessing how the fuel type, operating conditions, and cycle parameters affect thrust, fuel flow, and the specific fuel consumption [41,42]. Recent computational studies have also used Python-based and other simulation environments for turbojet and turbofan performance and emissions analysis [43], while neural network and pattern recognition methods have been explored in related turbofan engine data applications [44]. However, purely data-driven models can produce discontinuous response surfaces, poor extrapolation, or non-physical predictions if the training data are sparse, heterogeneous, or insufficiently constrained. These risks are especially important for certification datasets, where publicly available variables are limited and different engine and combustor classes are not uniformly represented.
Multidisciplinary assessment frameworks have also been developed to evaluate aero-engine technologies beyond isolated performance or emissions metrics. The Techno-Economic Environmental Risk Analysis (TERA) framework provides an example of an integrated approach in which engine performance, environmental impact, economics, and risk can be assessed during preliminary technology evaluation [45,46]. Although the present work does not perform techno-economic or risk analysis, the proposed reduced-order emissions correlations are compatible with the transparent and computationally efficient models required in TERA-type preliminary assessment frameworks.
Recent regression work using public engine emissions datasets has shown that engine-level variables such as the overall pressure ratio, rated thrust, bypass ratio, and fuel flow can explain part of the variation in NOx emissions but that global regressions over mixed engine populations can be misleading when different combustor technologies and engine families are grouped together [47]. This observation is consistent with the emissions correlation literature: cycle parameters influence emissions, but the combustor architecture, injector design, mixture preparation, residence time distribution, and technology level also matter. It is also consistent with ongoing engine cycle and emissions studies in which cycle modifications, such as inter-turbine burning or other advanced configurations, require emissions models that remain physically interpretable and constrained [48].
The present work differs from previous ICAO-based emission studies in its scope and modeling intent. Existing approaches commonly use ICAO certification data either as direct reference values for LTO inventory calculations, as calibration points for fuel flow or P3–T3-based off-design corrections, or as the basis for pollutant-specific correlations focused mainly on NOx [16,17,47]. Other studies develop combustor-specific or fuel-specific correlations for particular technologies, such as LDI, RQL, flameless combustion, or hydrogen combustion, using experimental or computational datasets that are not equivalent to broad certification databank modeling [24,33,35,38]. In contrast, the present study uses the ICAO Aircraft Engine Emissions Databank as the backbone for a deterministic, physically interpretable, and physically admissible modeling framework for regulated gaseous emissions, including NOx, CO, and HC. The objective is not to replace detailed combustor simulation, reactor network modeling, established fuel flow correction methods, or proprietary engine cycle tools. Rather, the work provides an intermediate modeling level that links public certification data, engine-level variables, combustor-related grouping, and ICAO-derived LTO quantities while explicitly recognizing the limitations imposed by the absence of proprietary injector, liner, residence time, and combustor geometry data.
The main contribution of this paper is the formulation of a physically constrained ICAO Databank-based approach for modeling aircraft engine gaseous emissions. The proposed framework emphasizes three aspects. In the present context, “physically constrained” is used in a reduced-order modeling sense: the correlations are conditioned on the combustor technology where traceable, restricted to physically meaningful engine-level predictors, evaluated within their empirical calibration domains, and subjected to physical admissibility checks. The term does not imply a first-principles combustion model or the direct solution of combustor flow, thermodynamic state variables, residence time distributions, or chemical kinetics.
First, the framework uses a curated set of public certification variables to construct consistent emission models for LTO gaseous pollutants. Second, it compares quadratic response surface and power law correlation forms while enforcing physically admissible behavior, particularly non-negative emissions and empirical domain restrictions. Third, it evaluates the role of engine grouping and combustion-related classification in improving model reliability and interpretability. By combining public certification data with engineering constraints, the study provides an intermediate modeling level between simple empirical curve fitting and high-fidelity combustor simulation.
2. Materials and Methods
2.1. Methodological Framework
This study develops a deterministic, ICAO-consistent, and physically interpretable methodology for modeling gaseous emissions from civil aircraft gas turbine engines. The methodology uses the ICAO Aircraft Engine Emissions Databank as the primary public certification data source and follows the calculation structure of ICAO Annex 16, Volume II, for gaseous emissions from turbojet and turbofan engines intended for subsonic operation [11,12]. The gaseous pollutants considered are nitrogen oxides (NOx), carbon monoxide (CO), and hydrocarbons (HC).
Accordingly, the physical constraints in the present framework are imposed at the model development and application levels rather than through the direct solution of the governing combustion equations. Specifically, they comprise combustor-aware grouping, the selection of predictors having an engineering relationship with engine and combustion operation, the restriction of the fitted correlations to the empirical predictor ranges represented in the databank, and the rejection or qualification of model behavior that violates physical admissibility, such as negative emissions or unsupported extrapolation.
The methodology is organized into two linked levels. The first level reconstructs ICAO landing and take-off (LTO) cycle quantities from the databank using the reported emission indices, fuel flow rates, rated thrust, and standard ICAO time-in-mode values. The second level develops deterministic databank-level correlations using public engine variables and derived LTO quantities, including the rated thrust, reference pressure ratio or overall pressure ratio, bypass ratio, mode-resolved fuel flow rates, total LTO fuel consumption, LTO pollutant mass, thrust-normalized LTO pollutant mass, and LTO-averaged emission indices. The present analysis is therefore restricted to variables available directly from the ICAO Databank or reconstructed from the ICAO LTO-cycle calculation procedure. No proprietary combustor geometry, engine cycle deck, combustor inlet pressure, combustor inlet temperature, fuel–air ratio, or residence time data are used in the fitted correlations.
The workflow, summarized in Figure 1, reflects the wide range of fidelity levels used in aircraft engine emissions modeling. Semi-empirical and deterministic correlations are suitable when only limited public data are available and when physically interpretable engineering models are required [25,35,36]. Stirred reactor and chemical reactor network methods provide a greater physical resolution but require additional assumptions about combustor zoning, the residence time, mixing, and the finite-rate chemistry [26,34]. CFD-based reacting flow methods can resolve the detailed geometry, heat transfer, turbulent mixing, and turbulence–chemistry interaction, but they require proprietary combustor information and substantial computational resources [38,39,40]. The present work therefore targets an intermediate level: more physically constrained than unconstrained curve fitting but reproducible using public certification data and ICAO-derived LTO quantities.
Figure 1.
Methodological workflow used to construct physically constrained, ICAO Databank-based emissions correlations. The framework starts from ICAO certification data, reconstructs LTO-cycle fuel and pollutant quantities, screens engines and combustor groups, selects physically meaningful predictor pairs, and fits deterministic quadratic and power law correlations subject to empirical domain and physical admissibility checks. In the workflow, OPR denotes the overall pressure ratio, BPR the bypass ratio, the rated thrust, the total LTO fuel consumption, RMSE the root mean square error, and MAPE the mean absolute percentage error.
2.2. ICAO Databank and Engine Screening
The primary dataset is extracted from the ICAO Aircraft Engine Emissions Databank, version 32. The analysis is limited to turbojet and turbofan engines intended for subsonic operation and reported under the ICAO gaseous emissions certification framework. The ICAO framework controls for smoke and the gaseous emissions HC, CO, and NOx and reports the mass of each gaseous pollutant emitted during the reference LTO cycle in grams [11]. The certification and measurement context is further supported by gaseous emissions measurement and aircraft emissions calculation procedures used in aviation emissions assessment [13,14].
For each engine record, the following variables are extracted when available: engine manufacturer; engine identification; combustor description; engine type; bypass ratio (BPR); reference pressure ratio or overall pressure ratio (OPR); rated thrust ; fuel flow rates at the LTO modes; emission indices of NOx, CO, and HC at the LTO modes; LTO fuel consumption; total LTO pollutant mass; and normalized LTO pollutant mass . The ICAO Databank also provides fuel-related information such as the net heat of combustion, hydrogen content, aromatic content, naphthalene content, and sulfur content where available. These fuel variables are retained for descriptive assessment but are not used as primary regression variables unless data completeness is sufficient.
The raw dataset is screened before model fitting. Records are excluded from a given model only when one or more variables required by the model are missing, non-physical, or clearly inconsistent. Applying the initial engine and data-completeness screening yielded 608 records. Records flagged as superseded in the ICAO Databank were then removed, excluding 240 historical entries and leaving 368 current records for analysis. No record was removed at this stage on the basis of its emission magnitude, regression residual, or model performance. Derivative entries that share a certification test are retained because they correspond to separately certified engine designations. Separate working datasets are then generated for each pollutant and each selected response variable. Mode-resolved quantities are retained for reconstructing LTO totals and for physical interpretation, while the present results focus on LTO-averaged emission indices. For HC, zero and near-zero values are retained in the descriptive statistics and quadratic response surface analysis, but they are treated separately in log-space power law fitting because logarithmic transformation is undefined for zero or non-positive responses.
2.3. ICAO LTO-Cycle Reconstruction
The ICAO reference LTO cycle for subsonic turbojet and turbofan engines consists of four operating modes: take-off, climb, approach, and taxi/ground idle. The corresponding thrust settings are 100%, 85%, 30%, and 7% of the rated thrust , respectively. The corresponding time-in-mode values are 0.7, 2.2, 4.0, and 26.0 min, respectively [11]. These values are used as the fixed operating basis for all LTO-cycle calculations in the present study.
For each pollutant p and LTO operating mode j, the pollutant mass flow rate is calculated from the emission index and fuel flow rate as
where is the pollutant mass emission rate in g/s, is the emission index of pollutant p at mode j in g/kg fuel, and is the fuel mass flow rate at mode j in kg/s.
The total LTO mass of pollutant p is then reconstructed as
where is in grams and is the time in mode in minutes. This expression follows the ICAO calculation logic in which the pollutant mass over the LTO cycle is obtained from the product of the emission index, fuel flow, and time in mode. The same emission index, fuel flow, and time-in-mode structure has also been used in aircraft emissions inventories and fuel flow-based emissions estimation methods [15,17].
The total LTO fuel consumption is calculated as
where is in kilograms. An LTO-averaged emission index is then defined as
where is in g/kg fuel.
The regulatory-style thrust-normalized pollutant mass is calculated as
where is the rated thrust in kN. The resulting quantity has units of g/kN and is retained as a principal response variable because ICAO gaseous emissions standards and certification reporting use for gaseous pollutants.
The reconstructed values of , , and are compared against the corresponding databank-reported values where available. Records with significant discrepancies are flagged and checked for unit inconsistency, missing mode data, superseded status, or databank reporting differences. This reconstruction step provides internal verification of the data processing workflow before any regression or correlation fitting is performed.
2.4. Reference Conditions and Use of Corrected Certification Data
The ICAO certification framework reports gaseous emissions under reference atmospheric conditions. For subsonic turbojet and turbofan engines, the reference atmospheric condition is the International Standard Atmosphere (ISA) sea level, except that the reference humidity is specified as 0.00634 kg water/kg dry air [11]. The public databank values used in this study are therefore treated as certified or certification-derived reference condition values.
The present study does not attempt to reprocess raw analyzer measurements or repeat the full ICAO measurement correction procedure. ICAO Appendix 3 describes the correction of measured emission indices to reference atmospheric conditions and identifies the combustor inlet temperature, combustor inlet pressure, fuel–air ratio, and humidity as relevant correction variables [11]. However, the public databank does not provide the raw sampling system data, analyzer histories, or all correction inputs required to reconstruct the certification correction process. Accordingly, the certified databank values are used as the reference dataset. The ICAO correction framework is used to guide the interpretation of physically meaningful variables, but the present study does not attempt to reconstruct unreported combustor inlet quantities such as , , the fuel–air ratio, humidity correction histories, or residence time parameters.
2.5. Response Variables
Five classes of response variables are considered. The first class consists of mode-specific emission indices,
where p denotes NOx, CO, or HC, and j denotes take-off, climb, approach, or idle. These responses preserve the mode-resolved structure of the ICAO Databank.
The second class consists of mode-specific pollutant emission rates,
This response is useful because ICAO reporting includes the emission rate, defined as the emission index multiplied by the fuel flow.
The third class consists of the total LTO pollutant mass,
The fourth class consists of the thrust-normalized total LTO pollutant mass,
This response is especially important because it accounts for the engine size and is directly aligned with ICAO-style emissions reporting.
The fifth class consists of the LTO-averaged emission index defined in Equation (4),
which provides the fuel-normalized response used in the combustor group correlation analyses presented in Section 3.
For NOx, high-power modes are expected to be particularly important because thermal NO formation is strongly associated with high temperatures and combustor pressures, oxygen availability, and residence times [18,24]. For CO and HC, the idle and approach modes are treated with special care because incomplete combustion, quenching, poor atomization, slow evaporation, and insufficient residence times can dominate low-power emissions [8,9,25].
2.6. Databank-Level Reduced-Order Correlations
The databank-level reduced-order correlations use only variables available directly from the ICAO Databank or quantities derived from it. Candidate predictors include the rated thrust , reference pressure ratio or OPR, bypass ratio BPR, mode fuel flow , total LTO fuel consumption , and combustor or engine family classification where available. These variables are selected because previous ICAO Databank regression work has shown that the OPR, thrust, fuel flow, and combustor technology are important explanatory variables for NOx, while a single global regression over mixed combustor types can have weak predictive reliability [47].
Two parametric reduced-order correlation forms are considered. Both forms are fitted to the ICAO-derived data using regression, but they differ in their functional structure and physical admissibility characteristics. The first is a power law form,
where Z is the selected emissions response, denotes predictor variables, C is a fitted coefficient, and denotes fitted exponents. For positive values of Z and , Equation (11) can be fitted in logarithmic form:
This form is transparent, physically interpretable, and non-negative for positive inputs. It also allows each exponent to be interpreted as the normalized sensitivity of the response to the corresponding predictor.
The second form is a two-predictor quadratic response surface correlation,
where X is the first selected predictor, Y is the second selected predictor, and a–f are fitted coefficients. This form is used for the combustor group response surface models reported in Section 3. Both the power law and quadratic response surface correlations are fitted using regression; once their coefficients are estimated, each provides a deterministic mapping from the selected predictors to the emissions response. Their distinction therefore lies in their functional structure rather than in the coefficient estimation method. The quadratic model is useful because it can represent the curvature and interaction between two predictors while remaining explicit and easy to evaluate. Unlike the power law form, however, the quadratic response surface correlation does not automatically guarantee non-negative predictions. Therefore, the fitted surfaces are interpreted only within the empirical predictor ranges of the corresponding combustor group, and the predictions are checked for physical admissibility.
For mode-specific NOx emission indices, a representative databank-level power law model is
For the thrust-normalized total LTO NOx, a representative model is
For the LTO-averaged NOx emission index used in the present combustor group response surface analysis, the response is
where is the total LTO NOx mass and is the total LTO fuel consumption. This quantity is equivalent to a fuel-normalized total LTO NOx emission and has units of g/kg fuel.
The selected two-predictor quadratic model in Equation (13) is then fitted separately for each combustor group using the best-performing predictor pair.
For CO and HC, the same reduced-order structure is applied to the LTO-averaged emission indices, and . These responses are treated separately from because CO and HC are more strongly associated with incomplete combustion, low-temperature oxidation, quenching, evaporation, and mixture preparation effects. For each pollutant and combustor group, the final predictor pair is selected based on physical relevance, data availability, residual behavior, model performance metrics, and consistency with the empirical predictor range. The selected predictors are not forced to be the same for NOx, CO, and HC because their formation and destruction mechanisms differ. Although the framework allows several response variables to be analyzed separately, the results presented in Section 3 focus on LTO-averaged emission indices because they provide a fuel-normalized basis for comparing combustor groups.
2.7. Combustion Physics Interpretation of Model Scatter
The present paper does not explicitly solve a droplet evaporation or spray combustion submodel because the ICAO Databank does not provide the injector geometry, Sauter mean diameter, spray cone angle, droplet size distribution, liner air admission, or combustor residence time distribution. However, these processes are important for interpreting model scatter and pollutant trends.
In liquid fuel gas turbine combustors, atomization, droplet heating, evaporation, vapor–air mixing, ignition, and finite-rate oxidation determine the local equivalence ratio field and the completeness of combustion [9,25,26]. Droplet vaporization studies further show that evaporation depends on heat and mass transfer, the ambient pressure, the gas temperature, fuel volatility, and the surrounding composition [27,28,29,30,31,32]. Slow evaporation or poor atomization can increase CO and HC by allowing liquid fuel or fuel vapor to escape the hot core, enter cooler zones, or experience insufficient oxidation time. Conversely, rapid evaporation and improved mixing can reduce incomplete combustion products but may alter the local flame temperature and high-temperature residence time, thereby influencing NOx.
For this reason, the present correlations are interpreted as engine- and combustor-level reduced-order models, not as substitutes for detailed spray combustion calculations. Fuel droplet evaporation and mixing are included in the physical interpretation of residuals and subgroup behavior, especially when comparing combustor technologies or engine families.
2.8. Combustor-Aware and Engine Family Subgroup Modeling
A single global correlation over all engines may mix different combustor architectures, injector systems, technology generations, engine families, and manufacturer design choices. Previous ICAO Databank regression work has shown that global NOx regressions over mixed engine populations may have limited predictive accuracy, whereas combustor-specific models can improve the fit substantially [47]. Therefore, subgroup modeling is included as a core part of the methodology.
The grouping variables include the manufacturer, engine family, combustor description, combustor technology, bypass ratio class, and pressure ratio class. Separate subgroup correlations are fitted only when the number of records is sufficient and the classification is traceable. Records with missing or untraceable combustor technology information are retained as a separate Unknown group rather than being assigned to one of the identified combustor technology classes. This preserves certified engine records for which the public databank does not provide sufficient information for a defensible technology classification, while avoiding unsupported reassignment to the SAC, DAC, TAPS, TALON, or LEC categories.
The subgroup analysis is not treated as a purely statistical device. It is used to determine whether model scatter is associated with physically meaningful differences in combustor technology, mixture preparation, staging, quenching strategy, or engine family. This is particularly important for NOx, because combustor concepts such as RQL, LDI, TAPS, DAC, and other staged or lean-burn architectures can modify the relationship between the OPR, fuel flow, flame temperature, and emission index [33,34,35].
To enable meaningful technology-based comparisons while maintaining adequate sample sizes, the combustor descriptions reported in the ICAO Aircraft Engine Emissions Databank were consolidated into a limited number of representative combustor technology classes. The original databank contains a mixture of generic combustor architectures, manufacturer-specific designations, hardware modifications, emissions reduction upgrades, and internal configuration codes. Since many descriptions represent variants or evolutionary improvements of the same underlying combustor concept rather than fundamentally different combustion technologies, they were grouped according to their primary combustion architecture and emissions control strategy. Conventional annular combustors were classified as Conventional/SAC, dual-annular staged combustors as DAC, twin-annular premixing swirler combustors as TAPS, and Pratt & Whitney lean-burn combustors as TALON.
The LEC category was treated as a broad low-emissions combustor class rather than as a tightly defined single architecture. It includes records identified in the databank as low-emissions combustors or advanced low-emissions annular combustor derivatives when a more specific public technology designation could not be assigned. This grouping increases the sample size but also introduces internal architectural heterogeneity because proprietary low-emissions combustor designs may differ in injector arrangement, staging strategy, liner air distribution, atomization system, and emissions control philosophy. Therefore, LEC correlations are interpreted as correlations for a broad low-emissions class rather than for a single combustor architecture. Entries with no reported or traceable combustor description were assigned to an Unknown category.
2.9. Coefficient Estimation
The coefficients of the power law models are obtained by least-squares regression of the logarithmically transformed equations. For Equation (11), the fitted intercept gives
while the remaining regression coefficients are the exponents . Only positive, physically meaningful values are used in logarithmic regression. Zero, missing, or non-physical emission indices are not replaced by arbitrary small values. Instead, such records are excluded from the corresponding log-space fit and documented. This avoids the artificial distortion of the fitted coefficients.
For the quadratic response surface model in Equation (13), the coefficients are estimated by ordinary least squares in the original variable space. For each record i, the fitted value is written as
The coefficient vector is
The least-squares estimate is obtained by minimizing the sum of squared prediction errors,
In the response surface analysis, the pressure ratio and bypass ratio are dimensionless, is in kN, is in kg, and the LTO-averaged emission indices , , and are in g/kg fuel.
2.10. Treatment of Zero and Near-Zero HC Responses
The HC response requires special treatment because several records, especially in the LEC group, contain zero or near-zero values of . These values may represent very low certified HC emissions, rounding effects, reporting limits, or near-complete oxidation under the reference LTO calculation procedure. They are not replaced by arbitrary small constants before regression. Such replacement would change the fitted intercept and slope of log-space correlations and could exaggerate the apparent dependence of HC emissions on the selected predictors.
For the primary analysis, quadratic response surface models are fitted in the original response space. Therefore, valid records with zero-valued are retained in the original-scale quadratic fits. In contrast, the power law model is fitted only to positive HC responses because the logarithmic transformation requires , where denotes for record i. The number of excluded zero or non-positive records is reported for the affected combustor groups. Consequently, HC power law coefficients are interpreted as positive-subset scaling relations rather than complete models for all HC records.
To examine whether the zero and near-zero HC values exhibit a systematic structure within the predictor space, a two-part hurdle-style diagnostic is introduced. Hurdle models separate the occurrence of a non-zero or measurable response from the magnitude of the response once it crosses the hurdle. This structure is widely used for zero-heavy data and has been adapted for environmental pollutant measurements near detection limits [49,50]. In the present study, the hurdle is defined by a practical near-zero threshold . Two thresholds, and , are used as diagnostic values.
A binary indicator is defined as
The first part of the hurdle diagnostic models the probability that the HC response exceeds the near-zero threshold:
where and are standardized forms of the two selected predictors for the combustor group. Standardization is used only for the diagnostic logistic fit to avoid numerical scaling effects. The inverse-logit function is
The logistic coefficients are estimated by minimizing the Bernoulli negative log-likelihood of the binary occurrence indicator. Defining
the Bernoulli negative log-likelihood objective, denoted by , is
This diagnostic fit therefore estimates whether the probability of exceeding the near-zero HC threshold varies systematically with the standardized predictor pair.
The second part of the hurdle interpretation concerns the magnitude of HC once it is positive. In this work, this magnitude is not modeled with a new distributional model. Instead, it is represented by the same positive-subset power law correlation already used in the main analysis:
This positive-response relation is not refitted separately for each ; it is the same positive-subset power law correlation reported in the main HC analysis. Thus, the hurdle diagnostic is used to support interpretation rather than to replace the reported deterministic correlations. It indicates whether the occurrence of measurable HC responses is systematically associated with the selected predictors, while the original-scale quadratic model and the positive-subset power law model remain the primary reported correlations. A Tobit sensitivity check was also performed by treating zero and near-zero HC values as left-censored observations. However, for the LEC subset, the Tobit optimization was sensitive to scaling and initialization and did not produce a stable predictor-dependent fit beyond an intercept-dominated solution. Therefore, the Tobit model was not retained as a reported correlation.
2.11. Model Selection and Performance Assessment
Model selection and performance assessment are carried out at four levels. First, the reconstructed LTO fuel mass, pollutant mass, and normalized pollutant mass are compared with the corresponding databank-reported values where available. Second, fitted correlations are evaluated using the coefficient of determination , root mean square error (RMSE), and mean absolute percentage error (MAPE). For power law correlations, both original-scale and log-space coefficients of determination are examined where applicable. Third, residual behavior is examined against the OPR, rated thrust, BPR, fuel flow, engine family, and combustor class to detect systematic bias. Fourth, physical admissibility is checked by confirming non-negative predictions, plausible trends, and the avoidance of extrapolation beyond the calibration range.
The residual for record i is defined as
where is the databank-derived response and is the model prediction.
To assess internal heterogeneity within the broad LEC category, the residuals of the LEC quadratic response surface correlations were further stratified according to the combustor descriptions reported in the ICAO Databank. Combustor description subgroups containing at least five records were summarized individually to avoid over-interpreting categories represented by only one or two records. For each retained subgroup, the mean residual and RMSE were calculated separately for NOx, CO, and HC. In addition, the ratio of the between-subgroup residual sum of squares to the total residual sum of squares was calculated as a descriptive measure of the fraction of residual variation associated with internal combustor description grouping. This analysis is used to characterize heterogeneity within the LEC class and is not interpreted as a causal decomposition of the residual variance.
The reported metrics are therefore interpreted as within-dataset correlation performance indicators rather than as independent out-of-sample validation statistics. Accordingly, they should not be interpreted as measures of generalization to unseen engine families or combustor configurations, particularly for the heterogeneous LEC and Unknown groups. A rigorous assessment of generalization would require an out-of-sample validation strategy, such as engine family holdout testing, and is identified as a direction for future work.
Because several combustor groups have limited or unevenly distributed records, a model is retained only when it improves the statistical fit without contradicting the expected physical behavior of the pollutant or producing non-physical predictions within the empirical predictor range. For HC groups with substantial zero or near-zero responses, the , RMSE, MAPE, and log-space power law metrics are interpreted together with the zero-count and near-zero-count checks. In such cases, the power law fit is treated as a positive-subset scaling relation, while the original-scale quadratic fit and zero-aware diagnostics provide the main basis for interpretation.
2.12. Response Surface and Parametric Interpretation
The fitted correlations were not used to perform a formal derivative-based sensitivity analysis. Instead, they were interpreted parametrically by examining the selected predictor pairs, model performance metrics, fitted response surfaces, empirical predictor ranges, and fitted coefficients. This interpretation was used to assess whether the selected variables produced physically meaningful trends within each combustor group.
For the power law correlations, the fitted exponents can indicate the direction and relative strength of the association between a predictor and the selected response. However, these exponents were not treated as independent physical sensitivities because the databank variables may be mutually correlated and may also reflect engine family, combustor technology, and certification condition effects.
For the quadratic response surface correlations, interpretation was based on the shape of the fitted surface, the presence of curvature, and the interaction term in Equation (13). The response surfaces were used to visualize how the predicted response varied over the two-predictor space and to identify regions where the model may be extrapolating beyond physically represented engine combinations. Therefore, the response surface plots are interpreted as diagnostic and explanatory tools rather than as formal sensitivity maps.
The parametric interpretation was carried out separately for NOx, CO, and HC where applicable, because these pollutants are governed by different formation and oxidation mechanisms. For the combustor group analyses reported in Section 3, the interpretation focuses on the selected predictor pairs, the fitted quadratic and power law coefficients, the model performance metrics, and the empirical predictor ranges for each pollutant group.
As a complementary quantitative measure of predictor–response association, Spearman rank correlation coefficients, , were calculated separately for each combustor group between each predictor retained in the selected two-predictor model and the corresponding LTO-averaged emission index. Spearman correlation was used because the relationships were not assumed to be linear and several pollutant responses exhibit skewness, curvature, or near-zero behavior. These bivariate coefficients are used only as descriptive measures of monotonic association; they are not interpreted as causal sensitivities and were not used as substitutes for the multivariable quadratic or power law correlations. Because the predictors may themselves be correlated, the sign or magnitude of a bivariate need not correspond directly to an individual coefficient in a multivariable fitted model.
2.13. Scope and Limitations
The proposed methodology is intended for public data-based engineering analysis. It is not a substitute for ICAO certification testing, proprietary combustor analysis, detailed engine cycle simulation, or high-fidelity reacting flow simulation. The ICAO Databank provides certified or certification-derived emission indices and fuel flow data at reference LTO modes, but it does not provide the full combustor geometry, injector details, liner air distribution, combustor inlet pressure, combustor inlet temperature, fuel–air ratio, residence time distribution, local equivalence ratio fields, raw analyzer data, or complete correction histories.
Accordingly, the proposed framework is most appropriate for identifying emissions trends, deriving physically admissible reduced-order correlations, comparing engine families and combustor groups, and assessing the extent to which public ICAO certification variables can explain LTO gaseous emission behavior. It is not intended for certification compliance demonstration, detailed combustor design, cruise emissions prediction, or extrapolation to radically different combustor concepts, alternative fuels, hydrogen combustion, or future engine cycles without additional validation. These limitations are consistent with the broader distinction between public data-based correlations, generic emission prediction methods, reactor network models, and high-fidelity reacting flow simulations [26,34,40].
3. Results
3.1. Combustor Technology Classification and Working Engine Groups
The first stage of the analysis examined whether the ICAO combustor description field could be used to construct physically meaningful engine subgroups. The raw combustor descriptions in the databank are not standardized: some entries refer directly to the combustor architecture, some refer to manufacturer-specific technology names, some describe emissions certification characteristics, and some records contain blank or incomplete entries. Therefore, the combustor description field was not used directly as a categorical predictor. Instead, the descriptions were collapsed into representative combustor technology groups.
Conventional annular combustors and single-annular descriptions were grouped as Conventional/SAC. Dual-annular staged combustors were grouped as DAC. Advanced low-emissions combustors and related annular low-emission derivatives were grouped as LEC where a more specific manufacturer technology could not be identified. Twin-annular premixing swirler combustors were grouped as TAPS, and Pratt & Whitney lean-burn combustors were grouped as TALON. Records with missing or untraceable combustor descriptions were assigned to an Unknown group. These records correspond to certified engines for which the publicly available databank information was insufficient to assign a defensible combustor technology class. They were retained rather than discarded in order to preserve the available certification information and to quantify the effect of incomplete technology classification on model performance. The Unknown group was therefore treated as a separate working class in the regression analysis and was not combined with any of the identified combustor technologies. Its fitted correlations are interpreted cautiously because the underlying combustor architectures are not traceable from the public databank fields. Because the correlations for the identified combustor groups are fitted independently, excluding the Unknown records would not alter the fitted coefficients or performance metrics of the Conventional/SAC, DAC, TAPS, TALON, or LEC models.
The resulting classification confirmed that combustor-aware grouping is essential for the present dataset. Engines with a similar overall pressure ratio, rated thrust, or bypass ratio may still exhibit different gaseous emission behavior because the combustor architecture affects fuel–air preparation, the local equivalence ratio distribution, the quench strategy, the residence time, and high-temperature reaction zones. Consequently, only screened high-bypass-ratio turbofan engines were retained for the subsequent regression and response surface analyses, and these records were analyzed separately according to their combustor-specific subgroups. The resulting record distribution among the combustor groups is shown in Figure 2.
Figure 2.
Distribution of screened engine records among the combustor groups used in the combustor-aware correlation analysis. The screened dataset contains 368 records after the removal of entries flagged as superseded in the ICAO Databank.
3.2. NOx Correlation Analysis and Dataset Definition
In the present application, the response variable is the LTO-averaged NOx emission index, , defined in Equation (16). The predictor pair selection was performed separately for each combustor group rather than globally over the full dataset. This was done because the preliminary classification showed that engines with a similar rated thrust, bypass ratio, or pressure ratio may still exhibit different NOx behavior when the combustor architecture changes. The candidate predictors were limited to variables available from, or directly reconstructed from, the ICAO Databank: OPR, BPR, rated thrust , and total LTO fuel consumption . These variables were selected because they provide engine-level proxies for combustor pressure–temperature severity, the propulsive cycle architecture, the engine scale, and the integrated fuel burning level over the LTO cycle.
All two-predictor combinations among these variables were screened for each combustor group. The screened pairs were OPR + BPR, OPR + , OPR + , BPR + , BPR + , and + . The preferred pair for each group was selected using the combined evidence from the , RMSE, and MAPE, while also requiring that the resulting trend be physically interpretable and supported by the empirical data range. This avoided the selection of a predictor pair solely because it produced a marginal improvement in one statistical metric.
The selected pairs were then retained for both the quadratic response surface and power law fits. This ensured that the two correlation forms were compared using the same physical predictor space for each combustor group. The selected pairs therefore represent the best compromise between statistical performance, physical interpretability, and data availability for the corresponding combustor class.
The resulting selections are physically meaningful. OPR appears in the selected pairs for the Conventional/SAC, DAC, TALON, TAPS, LEC, and Unknown groups, that is, for every combustor group, which is consistent with the expected importance of combustor pressure and temperature effects on NOx formation. BPR is selected for DAC and TALON, indicating that the cycle architecture remains important for these combustor groups. The rated thrust is selected for TAPS, suggesting that the engine scale or combustor flow capacity retains explanatory value. The total LTO fuel consumption is selected for the Conventional/SAC, LEC, and Unknown groups, showing that the integrated fuel burning level remains relevant even when the response is expressed as an LTO-averaged emission index.
Table 1 summarizes the combustor group datasets, selected predictor pairs, empirical predictor ranges, and observed ranges used in the subsequent model fitting.
Table 1.
Dataset information and empirical ranges for the selected two-predictor LTO-averaged EINOx models.
Table 1 defines the empirical domain for each combustor group model. The predictor ranges are used to interpret the fitted correlations and to avoid treating predictions outside the observed combustor group domain as physically validated results.
3.3. Quadratic Response Surface Correlations
For each combustor group, the selected two-predictor quadratic response surface model defined in Equation (13) was fitted using the predictor pair listed in Table 1. The fitted coefficients and model performance metrics are summarized in Table 2.
Table 2.
Quadratic response surface results for LTO-averaged EINOx.
The quadratic response surface form provides higher statistical flexibility and gives stronger fits than the corresponding power law form for most combustor groups. The highest coefficients of determination are obtained for DAC, Conventional/SAC, and LEC, with values of 0.987, 0.961, and 0.947, respectively. The TALON group gives the lowest RMSE, indicating a compact response range and a relatively accurate fit within this combustor class. The Unknown group has the weakest quadratic fit, which is consistent with the heterogeneous nature of records lacking a traceable combustor technology classification.
Because the quadratic model includes squared and interaction terms, the coefficients in Table 2 should be interpreted as response surface parameters rather than independent physical sensitivities. The fitted surfaces were used to examine the curvature, interactions between predictors, and the behavior of the model within the empirical ranges listed in Table 1.
3.4. Power Law Correlations
The same two predictors selected for each combustor group were also used to fit the power law correlation defined in Equation (11). For the present application, , so the model becomes
where ; X and Y correspond to the first and second selected predictors listed in Table 1, respectively; C is the multiplicative coefficient; and a and b are the fitted exponents. This ensures that the quadratic response surface and power law models are compared using the same two-dimensional predictor space for each combustor group. The power law form is less flexible than the quadratic response surface model because it does not contain squared or interaction terms. However, it has the important advantage of remaining non-negative for positive predictor values. The fitted power law coefficients and corresponding model performance metrics are summarized in Table 3. Because the power law model was fitted in logarithmic form, only records with positive response and predictor values were retained. For the Unknown group, this condition was satisfied by the 79 records retained after the LTO data quality screening.
Table 3.
Power law correlation results for LTO-averaged EINOx.
The power law correlations provide strong fits for DAC and LEC, with values of 0.964 and 0.929, respectively. The TALON power law model has the lowest RMSE among the power law fits, although its is lower than those of DAC and LEC. The TAPS and Unknown groups show weaker power law performance, indicating that their behavior is less completely represented by simple multiplicative scaling with the selected two predictors.
The fitted exponents provide useful scaling information, but they should not be interpreted as isolated causal effects. For example, the pressure ratio appears with a strong positive exponent in the DAC, TAPS, and TALON power law models, indicating that generally increases with the OPR within these grouped datasets. The LEC model likewise gives a positive OPR exponent together with a positive exponent for the total LTO fuel consumption, indicating that the fitted scaling reflects the combined influence of the combustor pressure level, the engine size, and the fuel-normalized definition of the response.
3.5. Combustor-Dependent Interpretation and Empirical Domain Effects
The comparison between the quadratic and power law models shows that the preferred reduced-order representation depends on the combustor group. The quadratic response surface form generally provides higher statistical flexibility because it can represent the curvature and interaction between predictors. The power law form is more constrained because it preserves non-negative predictions for positive inputs, but it cannot represent curvature as flexibly as the quadratic model. The two forms are therefore complementary: the quadratic correlations provide flexible combustor-specific response surfaces, whereas the power law correlations provide compact, physically admissible scaling relations.
The selected predictor pairs also show that the LTO-averaged EINOx behavior is not governed by a single universal pair of engine variables. For DAC and TALON, the selected predictor pair is OPR + BPR, suggesting that the cycle architecture is important for these combustor groups. For TAPS, the selected pair is OPR + , indicating that the rated thrust carries useful information about the engine scale or combustor flow capacity even after fuel normalization. For the Conventional/SAC, LEC, and Unknown groups, the selected pair combines the OPR and the total LTO fuel consumption, showing that the combustor pressure level and the integrated fuel use scaling remain important within these categories.
The response surfaces were evaluated over rectangular grids spanning the individual ranges of the two selected predictors. Such grids can include artificial predictor combinations that do not correspond to actual certified engines. For example, the maximum OPR and maximum total LTO fuel consumption may not occur in the same engine record. Consequently, predictions outside the empirical ranges in Table 1, or over combinations not represented by the actual databank records, were treated as extrapolative model behavior rather than physically validated predictions.
Overall, the results support the use of combustor-aware reduced-order correlations for ICAO Databank-based emissions modeling. A pooled or global model can be useful for broad trends, but combustor-specific correlations provide more physically interpretable behavior when sufficient records are available. This supports the central premise of the study: public certification data can be used to construct transparent reduced-order emissions models, but combustor technology and empirical domain limits must be considered explicitly.
3.6. CO and HC Emissions Correlation Analysis
The predictor screening and correlation fitting procedure applied to was repeated for the LTO-averaged CO and HC emission indices, denoted here as and , respectively. The objective was to identify the best-performing two-variable representation for each combustor group rather than imposing a common predictor pair across all pollutants and combustor technologies. This distinction is important because CO and HC emissions are governed mainly by incomplete combustion, low-temperature oxidation, quenching, fuel evaporation, and mixture preparation effects, whereas NOx is more strongly associated with high-temperature and high-pressure operation.
The range and data quality checks for and are summarized in Table 4 and Table 5, respectively. The selected predictors listed in these two tables are used consistently in the subsequent quadratic and power law coefficient tables. Therefore, the predictor pair columns are not repeated in Table 6, Table 7, Table 8 and Table 9.
Table 4.
Range and data quality checks for .
Table 5.
Range and data quality checks for .
Table 6.
Quadratic response surface coefficients and performance metrics for .
Table 7.
Power law coefficients and performance metrics for .
Table 8.
Quadratic response surface coefficients and performance metrics for .
Table 9.
Power law coefficients and performance metrics for .
The checks indicate that is generally well behaved, with no zero or near-zero values in the screened combustor groups. Therefore, the CO regression metrics are relatively stable. In contrast, is more sensitive to small values. This is particularly evident for the LEC group, where 32 records have zero , 36 records fall below 0.01 g/kg, and 44 records fall below 0.05 g/kg. Consequently, percentage-based metrics, especially the MAPE, are interpreted cautiously for HC.
For , the selected predictor pairs and fitted quadratic coefficients are summarized in Table 6. The Conventional/SAC group showed the strongest quadratic response surface fit, with and selected as the best predictor pair, giving , RMSE , and MAPE . The TAPS group was also well represented by OPR and , with , and the TALON group by BPR and , with . The LEC group showed a reasonably high using OPR and , but with a higher MAPE of , indicating greater scatter in the normalized CO response. The DAC and Unknown groups showed weaker fits, particularly the Unknown group, for which .
The corresponding power law fits for are given in Table 7. The power law form provided positive predictions for positive inputs, but it did not uniformly outperform the quadratic response surfaces. The strongest power law fits were obtained for Conventional/SAC and TAPS, with original-scale values of 0.905 and 0.814, respectively. For the DAC, TALON, LEC, and Unknown combustor groups, the power law models showed weaker correlation performance than the quadratic models. Therefore, for CO, the power law models are most useful as compact positive correlations for groups with strong log-space behavior, while the quadratic surfaces provide a better descriptive fit for most combustor groups.
For , the selected predictor pairs and quadratic response surface results are summarized in Table 8. The TAPS group produced the strongest fit, with OPR and selected as the best predictor pair and , followed by Conventional/SAC with OPR and and . The TALON group showed a moderate quadratic fit, with . In contrast, the DAC, LEC, and Unknown groups showed weaker fits. The LEC group requires special caution: although the RMSE is moderate, the MAPE is not reported because many values are zero or near zero, making percentage-based errors numerically unstable and unsuitable for model comparison.
The power law fits for are listed in Table 9. Compared with CO, the HC power law models were generally weaker. The TAPS group gave the best original-scale power law fit among the HC cases, with . The TALON group showed a log-space but a much lower original-scale value, indicating poor reconstruction of the dimensional response. The LEC group is again affected by the high number of zero or near-zero HC values. Of the 99 LEC records, 32 zero-valued responses were excluded from the logarithmic power law fit, leaving 67 positive-response records. The resulting original-scale indicates that this power law fit is unsuitable for prediction of LEC HC emissions. The coefficients are retained only for reproducibility as a limited positive-response-subset scaling relation. The MAPE for this case is not reported because it is dominated by near-zero denominators and is not a meaningful comparative performance metric.
The parity behavior of the group-specific quadratic response surface correlations is summarized in Figure 3. When the predictions from all combustor groups are combined, the all-group coefficients of determination are , , and for , , and , respectively. These values are calculated across all 368 records after applying the corresponding combustor group-specific quadratic model to each record; the individual combustor group values are reported in Table 2, Table 6, and Table 8. The NOx and CO parity plots show comparatively tighter clustering around the one-to-one line for several combustor groups, whereas the HC parity plot shows larger scatter and the weaker reconstruction of the original-scale response. This behavior is consistent with the tabulated metrics and with the greater sensitivity of HC to zero and near-zero values.
Figure 3.
Parity plots comparing databank-derived and model-predicted LTO-averaged emission indices for (a) NOx, (b) CO, and (c) HC. Different marker symbols identify the combustor groups, and the dashed line denotes perfect agreement. The all-group coefficients of determination are , , and for NOx, CO, and HC, respectively. The corresponding combustor group-specific values are reported in Table 2, Table 6, and Table 8.
For the LEC group, a hurdle-style diagnostic was applied to provide additional context for the weak HC power law behavior reported in Table 9 and Figure 3c. The diagnostic examines whether the occurrence of measurable values exhibits a systematic association with the selected OPR–rated thrust predictor space. The logistic occurrence model was fitted using the standardized OPR, standardized rated thrust, and their interaction. The diagnostic was repeated for and , as summarized in Table 10. These thresholds are not introduced as universal detection limits; they are used only as practical near-zero cutoffs to characterize the LEC subset.
Table 10.
Hurdle-style occurrence diagnostic for LEC . The coefficients correspond to the logistic model in Equation (22) using the standardized OPR and standardized rated thrust.
Figure 4 visualizes the LEC HC hurdle diagnostic for . The figure shows that near-zero and measurable HC responses are not uniformly distributed over the OPR–rated thrust predictor space.
Figure 4.
Hurdle-style occurrence diagnostic for LEC using . The plot illustrates the predictor-space structure of near-zero and measurable HC responses in the selected OPR–rated thrust space.
The hurdle diagnostic indicates that measurable LEC HC responses are structured within the OPR–rated thrust space rather than being uniformly scattered across the selected predictor domain, as shown in Figure 4. For both thresholds, the fitted main-effect coefficient associated with the standardized OPR is negative, while the fitted main-effect coefficient associated with the standardized rated thrust is positive. Because the logistic model also includes an interaction term, these coefficients are interpreted as diagnostic indicators of the predictor-space structure rather than independent causal sensitivities. The diagnostic therefore supports the treatment of the LEC HC power law fit as a positive-subset scaling relation rather than as a complete predictive model for all LEC HC records.
Overall, the CO results are more robust than the HC results. For , meaningful combustor group-specific correlations were obtained for Conventional/SAC, TAPS, TALON, and LEC, although the power law representation was the strongest mainly for Conventional/SAC and TAPS. For , the quadratic response surfaces provided useful descriptive models for Conventional/SAC, TAPS, and TALON, but the power law correlations were generally weaker and should be interpreted cautiously. The LEC group is the most important HC exception because it contains many zero and near-zero values. The hurdle diagnostic indicates that measurable LEC HC responses exhibit a systematic association with the OPR–rated thrust predictor space, while the positive-subset power law fit gives only a limited scaling relation for records with positive HC. These findings are consistent with the physical nature of CO and HC emissions, which are strongly affected by low-power combustion stability, local quenching, evaporation, mixing, and combustor-specific design features that are not fully represented by the public ICAO Databank variables.
3.7. Residual Variation Within the LEC Group
Because the LEC category represents a broad collection of low-emissions combustor designs rather than a single architecture, the residuals of the LEC quadratic correlations were examined according to the combustor descriptions retained within this group. Table 11 summarizes the descriptions represented by at least five records. These seven subgroups contain 93 of the 99 LEC records (93.9%); the remaining six records were retained in the overall LEC correlations but were not interpreted separately because their individual combustor description categories contained only one or two records.
Table 11.
Residual statistics for sufficiently populated combustor description subgroups within the LEC category. Residuals are defined as databank-derived minus predicted LTO-averaged emission index.
The residuals show a clear internal structure, particularly for CO and HC. For example, the 2253M21 and 2253M21-PFN subgroups exhibit positive mean residuals for both CO and HC, indicating systematic underprediction by the pooled LEC correlation, whereas the subgroup identified simply as LEC exhibits negative mean residuals for both pollutants. In contrast, the much larger Phase5 Tiled subgroup has mean residuals close to zero for all three pollutants, although residual scatter remains present.
A descriptive decomposition of the residual sum of squares shows that differences between the retained combustor description subgroups account for approximately 25.9%, 59.2%, and 61.5% of the residual variation for NOx, CO, and HC, respectively. Thus, internal LEC technology differences are much more strongly reflected in the remaining CO and HC scatter than in the NOx scatter. These results confirm that the pooled LEC correlations represent class-level trends across several low-emissions technologies rather than a universal correlation for a single combustor architecture.
3.8. Predictor–Response Associations and Empirical Domains
Table 12 summarizes the empirical ranges of the selected predictors together with their Spearman rank correlations with the corresponding LTO-averaged emission response. The results quantify the group- and pollutant-dependent associations that underlie the reduced-order correlations. For NOx, the selected predictors generally exhibit positive monotonic associations with the response, although the strength and, in the case of TALON BPR, the direction depend on the combustor group. CO shows predominantly negative associations with the selected predictors, particularly for Conventional/SAC, TAPS, and LEC. HC exhibits weaker and more group-dependent associations, consistent with the greater influence of combustor-specific mixture preparation, quenching, evaporation, and low-temperature oxidation processes.
Table 12.
Empirical domains and Spearman rank correlations for the selected predictor pairs.
The rank correlations are descriptive bivariate measures and should not be interpreted as independent physical sensitivities. In particular, predictor correlation and interaction can cause the bivariate association to differ from the corresponding coefficient or exponent in a multivariable fitted correlation. The empirical ranges in Table 12 also define the intended application domains of the reported correlations. Neither the quadratic nor the power law models should be treated as validated outside these predictor ranges. Although the power law form remains non-negative for positive inputs, this mathematical property does not imply validity under extrapolation.
4. Discussion
This study does not attempt to reproduce the internal combustor physics directly. Rather, physical knowledge is used to constrain how the data-driven correlations are constructed and interpreted through combustor-aware grouping, physically motivated predictor selection, empirical domain restrictions, and physical admissibility checks. The resulting correlations for , , and should therefore be regarded as physics-informed reduced-order representations of the public certification data, rather than as first-principles combustor models. This places the work between direct LTO inventory calculation and high-fidelity combustor simulation. In this sense, the proposed approach complements fuel flow-based and P3–T3-type methods, which use certification data as reference information for off-design emission estimation but require additional correction assumptions or engine performance quantities that are not always publicly available [16,17,26].
One central finding is that a single global relationship between engine-level variables and gaseous emissions is not sufficient to represent the behavior of the high-bypass-ratio turbofan dataset. The selected predictor pairs differ between combustor groups, indicating that emissions are affected not only by engine scale and cycle variables but also by the combustor architecture and technology generation. For , OPR appears in every selected predictor pair, which is consistent with the expected dependence of NOx formation on the pressure, temperature, and high-power combustion severity. However, the second selected predictor differs among groups. DAC and TALON select BPR together with OPR, TAPS selects together with OPR, and Conventional/SAC, LEC, and Unknown select together with OPR. This confirms that, even for the same pollutant, the best reduced-order representation depends on how the combustor technology interacts with the engine size, pressure ratio, bypass ratio, and fuel flow characteristics.
The LEC group requires particular caution because it is a broad low-emissions category rather than a single public combustor architecture. Its large sample size improves the statistical coverage, but the wide emission ranges indicate that it combines several proprietary low-emissions technologies and engine family generations. The residual analysis provides quantitative evidence of this internal heterogeneity. For the sufficiently populated internal combustor description subgroups, between-subgroup differences account for approximately 25.9%, 59.2%, and 61.5% of the residual variation for NOx, CO, and HC, respectively. The effect is therefore relatively modest for NOx but substantial for CO and especially HC. This behavior is consistent with the greater sensitivity of incomplete combustion pollutants to the injector arrangement, staging, mixture preparation, liner air distribution, quenching, and other combustor-specific features that are not represented explicitly by the public engine-level predictors. Consequently, even a strong pooled LEC fit should be interpreted as a class-level within-dataset correlation rather than as a universal correlation for low-emissions combustor technology.
The NOx results are consistent with the previous emission correlation literature, in which the combustor pressure, temperature, residence time, and mixture preparation are central factors in NOx formation [18,24,25,35]. The present correlations do not include the combustor inlet temperature, fuel–air ratio, primary-zone temperature, or residence time explicitly, because these variables are not available in the public ICAO Databank. Nevertheless, the OPR, rated thrust, BPR, and LTO fuel consumption provide publicly available surrogate descriptors of the engine pressure ratio level, cycle architecture, engine scale, and integrated fuel use. They do not directly measure the combustor inlet pressure , combustor inlet temperature , local fuel–air ratio, equivalence ratio, or residence time. Their associations with emissions should therefore be interpreted as an engine-level representation of the underlying combustion conditions rather than as a direct measurement of these conditions. The strong NOx fits obtained for several groups, particularly DAC, Conventional/SAC, and LEC, are consistent with these engine-level variables retaining useful information about the severity and scale of the LTO combustion process.
The weaker within-dataset fit of the Unknown group is attributed primarily to its heterogeneous composition. Because the public databank does not provide sufficient combustor information for these engines, the group may contain different combustor architectures, staging strategies, injector designs, and technology generations. These unresolved differences introduce additional scatter that cannot be captured adequately by the selected engine-level predictors. The weaker fit of the Unknown group therefore supports the use of combustor-aware classification: when the combustor technology is known and engines can be grouped more consistently, the resulting correlations are generally more interpretable and exhibit lower unexplained scatter within the calibration data.
The comparison between quadratic response surface and power law correlations highlights a useful trade-off. The quadratic model generally provides stronger within-dataset fits because it can represent the curvature and interaction between the two selected predictors. This is evident in the high values obtained for several NOx groups and in the improved descriptive performance for CO and HC in comparison with the corresponding power law fits. However, the quadratic form is not intrinsically constrained to remain non-negative and should therefore be interpreted only within the empirical predictor ranges reported for each combustor group. By contrast, the power law form is less flexible, but it remains positive for positive input variables and gives compact scaling relations. This makes the power law form attractive for physically admissible reduced-order modeling when the fitted response is sufficiently accurate. The results therefore support the use of the two forms in complementary roles: the quadratic surfaces as flexible descriptive models and predictor screening tools and the power laws as compact positive correlations when their errors are acceptable.
The CO results show that is more robustly correlated than for most combustor groups. This is consistent with the data quality checks, which showed that CO had no zero or near-zero values in the screened combustor groups. The Conventional/SAC group gives the strongest CO quadratic fit, while TAPS is also represented well using OPR and , and TALON using BPR and . The CO power law correlations are strongest for Conventional/SAC and TAPS but weaker for DAC, TALON, LEC, and Unknown. These trends suggest that CO behavior can be represented by public engine-level variables for some combustor families, but that the relationship is not universal. Physically, CO formation and oxidation are controlled by incomplete combustion, the local temperature, oxygen availability, the residence time, liner cooling, dilution, and low-power combustion stability [8,9,25]. Many of these quantities are not present in the ICAO Databank, which explains the remaining scatter. The DAC results also illustrate that model performance is pollutant-dependent rather than uniformly weak or strong for a given combustor class. For NOx, the DAC correlations provide strong within-dataset fits, whereas the corresponding CO and HC correlations are substantially weaker. This contrast may be associated with the staged nature of double-annular combustion, for which changes in fuel and air distribution between combustion zones can produce operating condition-dependent variations in the local equivalence ratio, flame stabilization, and oxidation completeness. Such effects are not resolved by the available engine-level predictors. Consequently, OPR and BPR may capture much of the DAC NOx trend while remaining insufficient to describe the lower-temperature and incomplete-oxidation processes governing CO and HC.
The HC results require greater caution. The range checks show that contains many small, zero, or near-zero values, especially for the LEC group. This makes percentage-based error metrics unstable and also affects logarithmic power law fitting, because zero or non-positive responses cannot be used directly in log-space regression. The weak or negative values of in several HC power law cases indicate that, after back-transformation to the original response scale, the power law predictions may perform worse than using the group mean as a predictor. These cases should therefore not be interpreted as reliable predictive correlations. The quadratic surfaces provide useful descriptive fits for TAPS, Conventional/SAC, and TALON, but the HC power law models are generally less robust than the NOx and CO models.
The LEC hurdle diagnostic provides additional context for interpreting the HC results. It indicates that the occurrence of measurable values is associated with the OPR–rated thrust predictor space, rather than being uniformly scattered across the selected predictor domain. This does not prove a causal relationship between the OPR, rated thrust, and HC formation, nor does it establish a universal HC detection limit for the ICAO Databank. Instead, it shows that the zero and near-zero LEC HC records form a structured data quality and response regime issue. Therefore, the LEC HC power law model should be interpreted only as a scaling relation for the positive-response subset, while the original-scale quadratic model and the zero-aware diagnostic provide the main basis for interpreting the full LEC HC group.
The weaker HC behavior is physically plausible. HC emissions are especially sensitive to local quenching, incomplete vaporization, wall cooling, poor atomization, fuel vapor escape from the hot reaction zone, and insufficient oxidation time. These effects are strongly combustor-specific and depend on the injector design, droplet size distribution, liner air admission, recirculation structure, and residence time distribution [9,25,27]. Since these quantities are unavailable in the public databank, HC correlations based only on the OPR, BPR, rated thrust, and fuel flow cannot fully resolve the underlying physics. The HC results therefore illustrate an important limitation of public data-based modeling: a pollutant may be regulated and reported in certification data, but its variability may still depend on hidden combustor details that are not represented by public engine-level variables.
The fuel droplet evaporation discussion helps to interpret this limitation. The ICAO Databank reports fuel flow and emission index quantities, but it does not provide the spray characteristics, Sauter mean diameter, injector pressure drop, local mixture fraction distribution, or liner cooling pattern. Droplet evaporation and vapor–air mixing are therefore not modeled explicitly in the present correlations. Nevertheless, they remain important physical mechanisms behind the observed scatter, especially for CO and HC. Experimental and theoretical droplet vaporization studies show that evaporation depends on the ambient temperature, pressure, composition, fuel volatility, and heat and mass transfer conditions [28,29,30,32]. These processes are embedded indirectly in the certified emission measurements, but they cannot be separated using the public databank alone.
The present results also clarify the role of empirical domain limits. The response surfaces are fitted over actual engine records but plotted or evaluated over rectangular predictor grids. Such grids can include combinations of OPR, BPR, , and that do not correspond to any certified engine in the dataset. Therefore, high values should not be interpreted as evidence that the model can be extrapolated freely. The correlations are valid only within the observed predictor ranges and for combustor groups represented by sufficient data. This is particularly important for broad categories such as LEC and Unknown, where the category may contain several technology generations or mixed design philosophies.
The study therefore supports three broader implications. First, ICAO Databank variables are sufficient to construct transparent LTO-scale emission correlations for selected pollutants and combustor groups. Second, combustor-aware grouping improves interpretability and reduces the risk of misleading global regression behavior, consistent with previous ICAO Databank regression work on NOx [47]. Third, the correlation performance depends strongly on the pollutant. NOx and CO show useful reduced-order correlation structure in several combustor groups, whereas HC is more sensitive to near-zero values and hidden combustor-specific physics.
Several limitations should be emphasized. The reported performance metrics are within-dataset correlation indicators, not independent certification-grade validation results. The study uses public ICAO certification data at reference LTO conditions and does not reconstruct raw measurement corrections, combustor inlet quantities, cruise operation, or mission-level off-design behavior. The combustor classifications are derived from public combustor description fields and therefore may not capture all internal design differences. Finally, the fitted coefficients are specific to the units, response definitions, and empirical ranges used in this study. Future work should extend the analysis to mode-resolved emissions, evaluate out-of-sample prediction using engine family holdout tests where sample sizes permit, compare the correlations with fuel flow and P3–T3 methods, and integrate public data correlations with independently validated engine cycle models only when the additional thermodynamic variables can be justified.
5. Conclusions
This study developed a physically constrained, ICAO Databank-based framework for modeling regulated gaseous emissions from aircraft gas turbine engines. The main conclusions are summarized as follows:
- The proposed framework uses public certification variables and ICAO-derived LTO quantities to construct reduced-order correlations for , , and . The analysis is deliberately restricted to variables available directly from the ICAO Aircraft Engine Emissions Databank or reconstructed from the ICAO LTO-cycle calculation procedure; no proprietary combustor geometry, engine cycle data, combustor inlet pressure or temperature, fuel–air ratio, or residence time information is required.
- Combustor-aware grouping is important for meaningful reduced-order emission modeling. The preferred predictor pairs differ among combustor groups and pollutants, confirming that a single global relationship between engine-level variables and emissions is insufficient for the high-bypass-ratio turbofan dataset. For , OPR appears in every selected predictor pair, while the second predictor varies among the BPR, rated thrust, and total LTO fuel consumption.
- Quadratic response surface and power law correlations serve complementary purposes. The quadratic models generally provide stronger within-dataset fits because they capture curvature and predictor interaction, but they do not automatically preserve non-negative predictions and should be interpreted only within the empirical predictor ranges. Power law correlations provide compact positive scaling relations for positive inputs but are less flexible and should be used only when their performance and fitted trends remain acceptable and physically plausible.
- The correlation performance is pollutant-dependent. is generally represented more robustly than , whereas HC is strongly affected by zero and near-zero values, particularly in the LEC group. The hurdle-style diagnostic indicates that measurable LEC HC responses are associated with the OPR–rated thrust predictor space, but it does not establish a universal detection limit or causal HC model. Accordingly, the LEC HC power law fit is unsuitable for prediction and is retained only as a positive-response-subset scaling relation.
- Overall, the proposed correlations are most appropriate for emissions trend analysis, preliminary comparative assessment, and the interpretation of public ICAO certification data. They should not be used as substitutes for certification testing, detailed combustor simulation, or off-design mission-level prediction without additional validation. Future work should focus on mode-resolved emission modeling, rigorous out-of-sample validation, uncertainty quantification, and integration with independently validated cycle analysis tools when the required thermodynamic variables are available.
Supplementary Materials
The following supporting information can be downloaded at: https://www.mdpi.com/article/10.3390/gases6040056/s1, Supplementary File S1, data-audit and reproducibility workbook containing the retained-record identifiers, exclusion log for superseded records, combustor-group assignments, screening and calculation documentation, fitted model coefficients, and numerical data supporting the revised analysis.
Author Contributions
Conceptualization, R.K.; methodology, R.K. and M.H.A.; software, R.K.; validation, R.K. and M.H.A.; formal analysis, R.K.; investigation, R.K. and M.H.A.; resources, R.K. and M.H.A.; data curation, R.K.; writing—original draft preparation, R.K.; writing—review and editing, R.K. and M.H.A.; visualization, R.K.; project administration, R.K. All authors have read and agreed to the published version of the manuscript.
Funding
This research received no external funding.
Informed Consent Statement
Not applicable.
Data Availability Statement
The source data analyzed in this study are publicly available from the ICAO Aircraft Engine Emissions Databank, hosted by the European Union Aviation Safety Agency (EASA) on behalf of ICAO: https://www.easa.europa.eu/en/domains/environment/icao-aircraft-engine-emissions-databank (accessed on 3 May 2026). The processed dataset, record-level screening audit, combustor-group assignments, exclusion log, and reproducibility calculations supporting the revised analysis are provided in Supplementary File S1.
Acknowledgments
The authors acknowledge the International Civil Aviation Organization for maintaining the Aircraft Engine Emissions Databank, which provided the public certification data used in this study. During manuscript preparation, the authors used OpenAI ChatGPT-5.6 for language refinement, LaTeX formatting support, editorial organization, and assistance with spreadsheet macro development. The authors have reviewed and verified the outputs and take full responsibility for the content of this publication.
Conflicts of Interest
The authors declare no conflicts of interest.
Abbreviations
The following abbreviations are used in this manuscript:
| BPR | Bypass ratio |
| CFD | Computational fluid dynamics |
| CO | Carbon monoxide |
| CRN | Chemical reactor network |
| DAC | Double-annular combustor |
| EI | Emission index |
| EICO | Emission index of carbon monoxide |
| EIHC | Emission index of hydrocarbons |
| EINOx | Emission index of nitrogen oxides |
| FAR | Fuel–air ratio |
| HBPR | High bypass ratio |
| HC | Hydrocarbons |
| ICAO | International Civil Aviation Organization |
| ISA | International Standard Atmosphere |
| LDI | Lean direct injection |
| LEC | Low-emissions combustor |
| LTO | Landing and take-off |
| MAPE | Mean absolute percentage error |
| NOx | Nitrogen oxides |
| OPR | Overall pressure ratio |
| P3 | Combustor inlet pressure |
| P3–T3 | Combustor inlet pressure–temperature method |
| RMSE | Root mean square error |
| RQL | Rich-burn quick-quench lean-burn |
| SAC | Single-annular combustor |
| T3 | Combustor inlet temperature |
| TAPS | Twin annular premixing swirler |
| TERA | Techno-Economic Environmental Risk Analysis |
| UHC | Unburned hydrocarbons |
References
- Koff, B.L. Gas Turbine Technology Evolution: A Designer’s Perspective. J. Propuls. Power 2004, 20, 577–595. [Google Scholar] [CrossRef] [Scilit]
- Parker, R.; Fedder, G. Aircraft engines: A proud heritage and an exciting future. Aeronaut. J. 2016, 120, 131–169. [Google Scholar] [CrossRef] [Scilit]
- Rolls-Royce plc. The Jet Engine, 5th ed.; Rolls-Royce PLC: Derby, UK, 2015. [Google Scholar]
- Farokhi, S. Aircraft Propulsion: Cleaner, Leaner, and Greener, 3rd ed.; Wiley: Hoboken, NJ, USA, 2022. [Google Scholar]
- Intergovernmental Panel on Climate Change (IPCC). Aviation and the Global Atmosphere; Technical Report; Cambridge University Press: Cambridge, UK, 1999. [Google Scholar]
- European Union Aviation Safety Agency (Ed.) European Aviation Environmental Report 2025; Publications Office: Luxembourg, 2025. [Google Scholar] [CrossRef]
- International Civil Aviation Organization (ICAO). Skyward Action: Realizing Aviation’s Sustainable Future; Technical Report; International Civil Aviation Organization (ICAO): Montréal, QC, Canada, 2025. [Google Scholar]
- Mellor, A. Gas turbine engine pollution. Prog. Energy Combust. Sci. 1976, 1, 111–133. [Google Scholar] [CrossRef] [Scilit]
- Lefebvre, A.H.; Ballal, D.R. Gas Turbine Combustion, 3rd ed.; CRC Press: Boca Raton, FL, USA, 2010. [Google Scholar] [CrossRef] [Scilit]
- Owen, B.; Anet, J.G.; Bertier, N.; Christie, S.; Cremaschi, M.; Dellaert, S.; Edebeli, J.; Janicke, U.; Kuenen, J.; Lim, L.; et al. Review: Particulate Matter Emissions from Aircraft. Atmosphere 2022, 13, 1230. [Google Scholar] [CrossRef] [Scilit]
- International Civil Aviation Organization (ICAO). Annex 16 to the Convention on International Civil Aviation: Environmental Protection, Volume II—Aircraft Engine Emissions, 5th ed.; International Civil Aviation Organization: Montréal, QC, Canada, 2023; ISSN OCLC: 1548601691. [Google Scholar]
- International Civil Aviation Organization (ICAO). ICAO Aircraft Engine Emissions Databank, 2026. Available online: https://www.easa.europa.eu/domains/environment/icao-aircraft-engine-emissions-databank (accessed on 3 May 2026).
- SAE Standard ARP1256E; Procedure for the Continuous Sampling and Measurement of Gaseous Emissions from Aircraft Turbine Engines. SAE International: Warrendale, PA, USA, 2023. [Google Scholar] [CrossRef] [Scilit]
- SAE Standard AIR5715; Procedure for the Calculation of Aircraft Emissions. SAE International: Warrendale, PA, USA, 2009. [Google Scholar] [CrossRef] [Scilit]
- Baughcum, S.L.; Tritz, T.G.; Henderson, S.C.; Pickett, D.C. Scheduled Civil Aircraft Emission Inventories for 1992: Database Development and Analysis; NASA Contractor Report CR-4700; National Aeronautics and Space Administration, Langley Research Center: Hampton, VA, USA, 1996. [Google Scholar]
- Deidewig, F.; Döpelheuer, A.; Lecht, M. Methods to Assess Aircraft Engine Emissions in Flight. In Proceedings of the 20th Congress of the International Council of the Aeronautical Sciences, Napoli, Italy, 8–13 September 1996. [Google Scholar]
- DuBois, D.; Paynter, G.C. “Fuel Flow Method2” for Estimating Aircraft Emissions. SAE Trans. 2006, 115, 1–14. [Google Scholar] [CrossRef] [Scilit]
- Zeldovich, Y.B. The Oxidation of Nitrogen in Combustion and Explosions. In Selected Works of Yakov Borisovich Zeldovich, Volume I; Sunyaev, R.A., Ed.; Princeton University Press: Princeton, NJ, USA, 1992. [Google Scholar] [CrossRef] [Scilit]
- Fenimore, C. Formation of nitric oxide in premixed hydrocarbon flames. Symp. (Int.) Combust. 1971, 13, 373–380. [Google Scholar] [CrossRef] [Scilit]
- Bowman, C.T. Kinetics of pollutant formation and destruction in combustion. Prog. Energy Combust. Sci. 1975, 1, 33–45. [Google Scholar] [CrossRef] [Scilit]
- De Soete, G. Overall reaction rates of NO and N2 formation from fuel nitrogen. Symp. (Int.) Combust. 1975, 15, 1093–1102. [Google Scholar] [CrossRef] [Scilit]
- Miller, J.A.; Bowman, C.T. Mechanism and modeling of nitrogen chemistry in combustion. Prog. Energy Combust. Sci. 1989, 15, 287–338. [Google Scholar] [CrossRef] [Scilit]
- Bozzelli, J.W.; Dean, A.M. O + NNH: A possible new route for NOX formation in flames. Int. J. Chem. Kinet. 1995, 27, 1097–1109. [Google Scholar] [CrossRef] [Scilit]
- Glarborg, P.; Miller, J.A.; Ruscic, B.; Klippenstein, S.J. Modeling nitrogen chemistry in combustion. Prog. Energy Combust. Sci. 2018, 67, 31–68. [Google Scholar] [CrossRef] [Scilit]
- Rizk, N.K.; Mongia, H.C. Semianalytical Correlations for NOx, CO, and UHC Emissions. In Proceedings of the ASME International Gas Turbine and Aeroengine Congress and Exposition, Cologne, Germany, 1–4 June 1992. [Google Scholar]
- Shakariyants, S.A. Generic Methods for Aero-Engine Exhaust Emission Prediction. Ph.D. Thesis, Delft University of Technology, Delft, The Netherlands, 2008. OCLC: 840404471. [Google Scholar]
- Abramzon, B.; Sirignano, W. Droplet vaporization model for spray combustion calculations. Int. J. Heat Mass Transf. 1989, 32, 1605–1618. [Google Scholar] [CrossRef] [Scilit]
- Ghassemi, H.; Baek, S.W.; Khan, Q.S. Experimental Study on Binary Droplet Evaporation at Elevated Pressures and Temperatures. Combust. Sci. Technol. 2006, 178, 1031–1053. [Google Scholar] [CrossRef] [Scilit]
- Saharin, S.; Lefort, B.; Morin, C.; Chauveau, C.; Le Moyne, L.; Kafafy, R. Vaporization Characteristics of Ethanol Droplets: Influence of the Environment Humidity. In Proceedings of the ASME 2011 Turbo Expo: Turbine Technical Conference and Exposition, Vancouver, BC, Canada, 6–10 June 2011; pp. 669–676. [Google Scholar] [CrossRef] [Scilit]
- Saharin, S.; Lefort, B.; Morin, C.; Chauveau, C.; Le Moyne, L.; Kafafy, R. Vaporization Characteristics of Ethanol and 1-Propanol Droplets at High Temperatures. At. Sprays 2012, 22, 207–226. [Google Scholar] [CrossRef] [Scilit]
- Azami, M.H.; Savill, M. Modelling of Spray Evaporation and Penetration for Alternative Fuels. Fuel 2016, 180, 514–520. [Google Scholar] [CrossRef] [Scilit]
- Eyice, D.K.; Renoux, G.; Halter, F.; Yozgatlıgil, A.; Gökalp, I.; Chauveau, C. Vaporization Characteristics of an Isolated Ethanol Droplet at Flame Conditions. At. Sprays 2022, 32, 79–94. [Google Scholar] [CrossRef] [Scilit]
- He, Z.J.; Chang, C.T.; Follen, C.E. NOx Emissions Performance and Correlation Equations for a Multipoint LDI Injector. In Proceedings of the 53rd AIAA Aerospace Sciences Meeting (AIAA SciTech 2015), Kissimmee, FL, USA, 5–9 January 2015. AIAA Paper 2015-0098. [Google Scholar] [CrossRef] [Scilit]
- Prakash, A. Prediction of NOx Emissions for an RQL Combustor Using a Stirred Reactor Modelling Approach. Ph.D. Thesis, Cranfield University, Cranfield, UK, 2015. [Google Scholar]
- Kyprianidis, K.G.; Nalianda, D.; Dahlquist, E. A NOx Emissions Correlation for Modern RQL Combustors. Energy Procedia 2015, 75, 2323–2330. [Google Scholar] [CrossRef] [Scilit]
- Odgers, J.; Kretschmer, D. The Prediction of Thermal NOx in Gas Turbines. In Proceedings of the 1985 International Gas Turbine Symposium and Exposition, Volume 2: Coal, Biomass and Alternative Fuels; Combustion and Fuels; Oil and Gas Applications; Cogeneration, Beijing, China, 17 September 1985; ASME: New York, NY, USA, 1985; p. V002T04A022, ASME Paper 85-IGT-126. [Google Scholar] [CrossRef] [Scilit]
- Plee, S.; Mellor, A. Characteristic time correlation for lean blowoff of bluff-body-stabilized flames. Combust. Flame 1979, 35, 61–80. [Google Scholar] [CrossRef] [Scilit]
- Perpignan, A.A.V.; Talboom, M.G.; Levy, Y.; Rao, A.G. Emission Modeling of an Interturbine Burner Based on Flameless Combustion. Energy Fuels 2018, 32, 822–838. [Google Scholar] [CrossRef] [Scilit] [PubMed]
- Perpignan, A.A.V.; Gangoli Rao, A. Effects of chemical reaction mechanism and NOx formation pathways on an inter-turbine burner. Aeronaut. J. 2019, 123, 1898–1918. [Google Scholar] [CrossRef] [Scilit]
- Perpignan, A.A.V.; Tomasello, S.G.; Rao, A.G. Evolution of Emission Species in an Aero-Engine Turbine Stator. Aerospace 2021, 8, 11. [Google Scholar] [CrossRef] [Scilit]
- Visser, W.P.J. Generic Analysis Methods for Gas Turbine Engine Performance: The Development of the Gas Turbine Simulation Program GSP. Doctoral Dissertation, TU Delft, Delft, The Netherlands, 2015. OCLC: 911671027. [Google Scholar] [CrossRef] [Scilit]
- Azami, M.H.; Savill, M. Comparative Study of Alternative Biofuels on Aircraft Engine Performance. Proc. Inst. Mech. Eng. Part G J. Aerosp. Eng. 2017, 231, 1509–1521. [Google Scholar] [CrossRef] [Scilit]
- Aksoy, S. Python-Based Performance and Emissions Analysis of Turbojet and Turbofan Engines. Int. J. Multidiscip. Res. 2025, 7, 1–11. [Google Scholar] [CrossRef]
- Szrama, S. Turbofan engine health status prediction with neural network pattern recognition and automated feature engineering. Aircr. Eng. Aerosp. Technol. 2024, 96, 19–26. [Google Scholar] [CrossRef] [Scilit]
- Ogaji, S.O.T.; Pilidis, P.; Hales, R. TERA: A Tool for Aero-Engine Modelling and Management. In Proceedings of the 2nd World Congress on Engineering Asset Management and the 4th International Conference on Condition Monitoring, Harrogate, UK, 14 June 2007. [Google Scholar]
- Nalianda, D.K.; Kyprianidis, K.G.; Sethi, V.; Singh, R. Techno-economic viability assessments of greener propulsion technology under potential environmental regulatory policy scenarios. Appl. Energy 2015, 157, 35–50. [Google Scholar] [CrossRef] [Scilit]
- Hasanovic, A.; Sarikaya, M.A. NOx Emissions of the 50 Most Used Engines for Passenger Aircraft; Project; Hamburg University of Applied Sciences (HAW Hamburg): Hamburg, Germany, 2025. [Google Scholar]
- Kafafy, R. Thermodynamic Performance Enhancement and NOx Emission Assessment in a Triple-Spool Turbofan Engine with an Interstage Turbine Burner. Thermo 2026, 6, 47. [Google Scholar] [CrossRef] [Scilit]
- Hofstetter, H.; Dusseldorp, E.; Zeileis, A.; Schuller, A.A. Modeling Caries Experience: Advantages of the Use of the Hurdle Model. Caries Res. 2016, 50, 517–526. [Google Scholar] [CrossRef] [Scilit] [PubMed]
- Huang, L.; Bradshaw, K.; Grosskleg, J.; Siciliano, S.D. Assessing Space, Time, and Remediation Contribution to Soil Pollutant Variation near the Detection Limit Using Hurdle Models to Account for a Large Proportion of Nondetectable Results. Environ. Sci. Technol. 2019, 53, 6824–6833. [Google Scholar] [CrossRef] [Scilit] [PubMed]
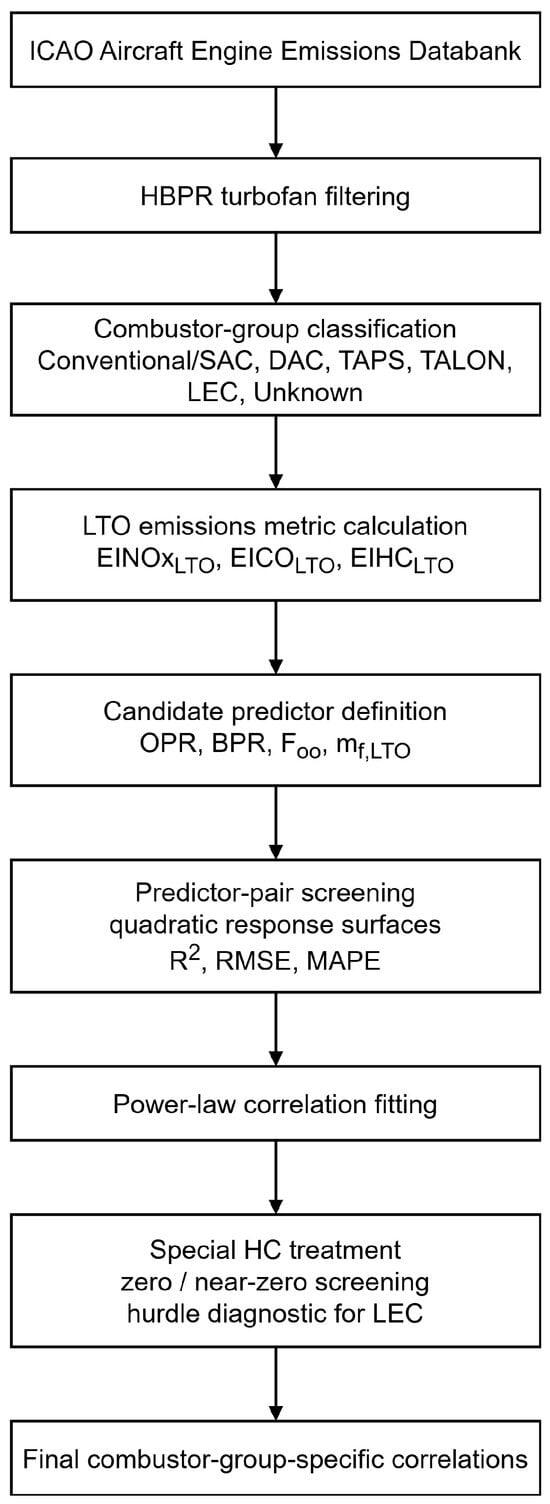
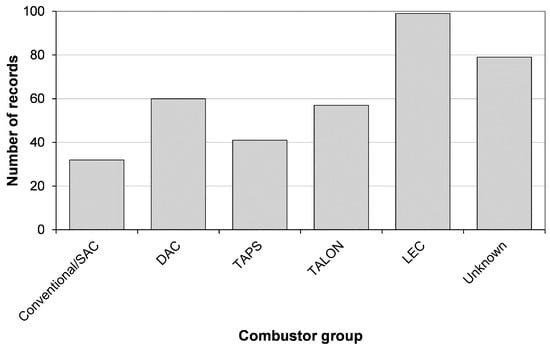
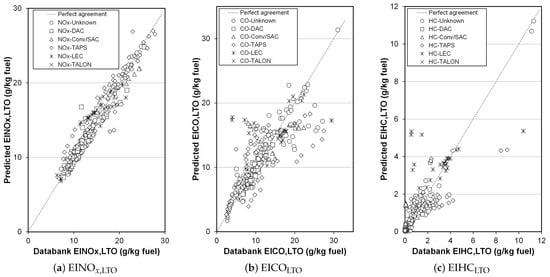
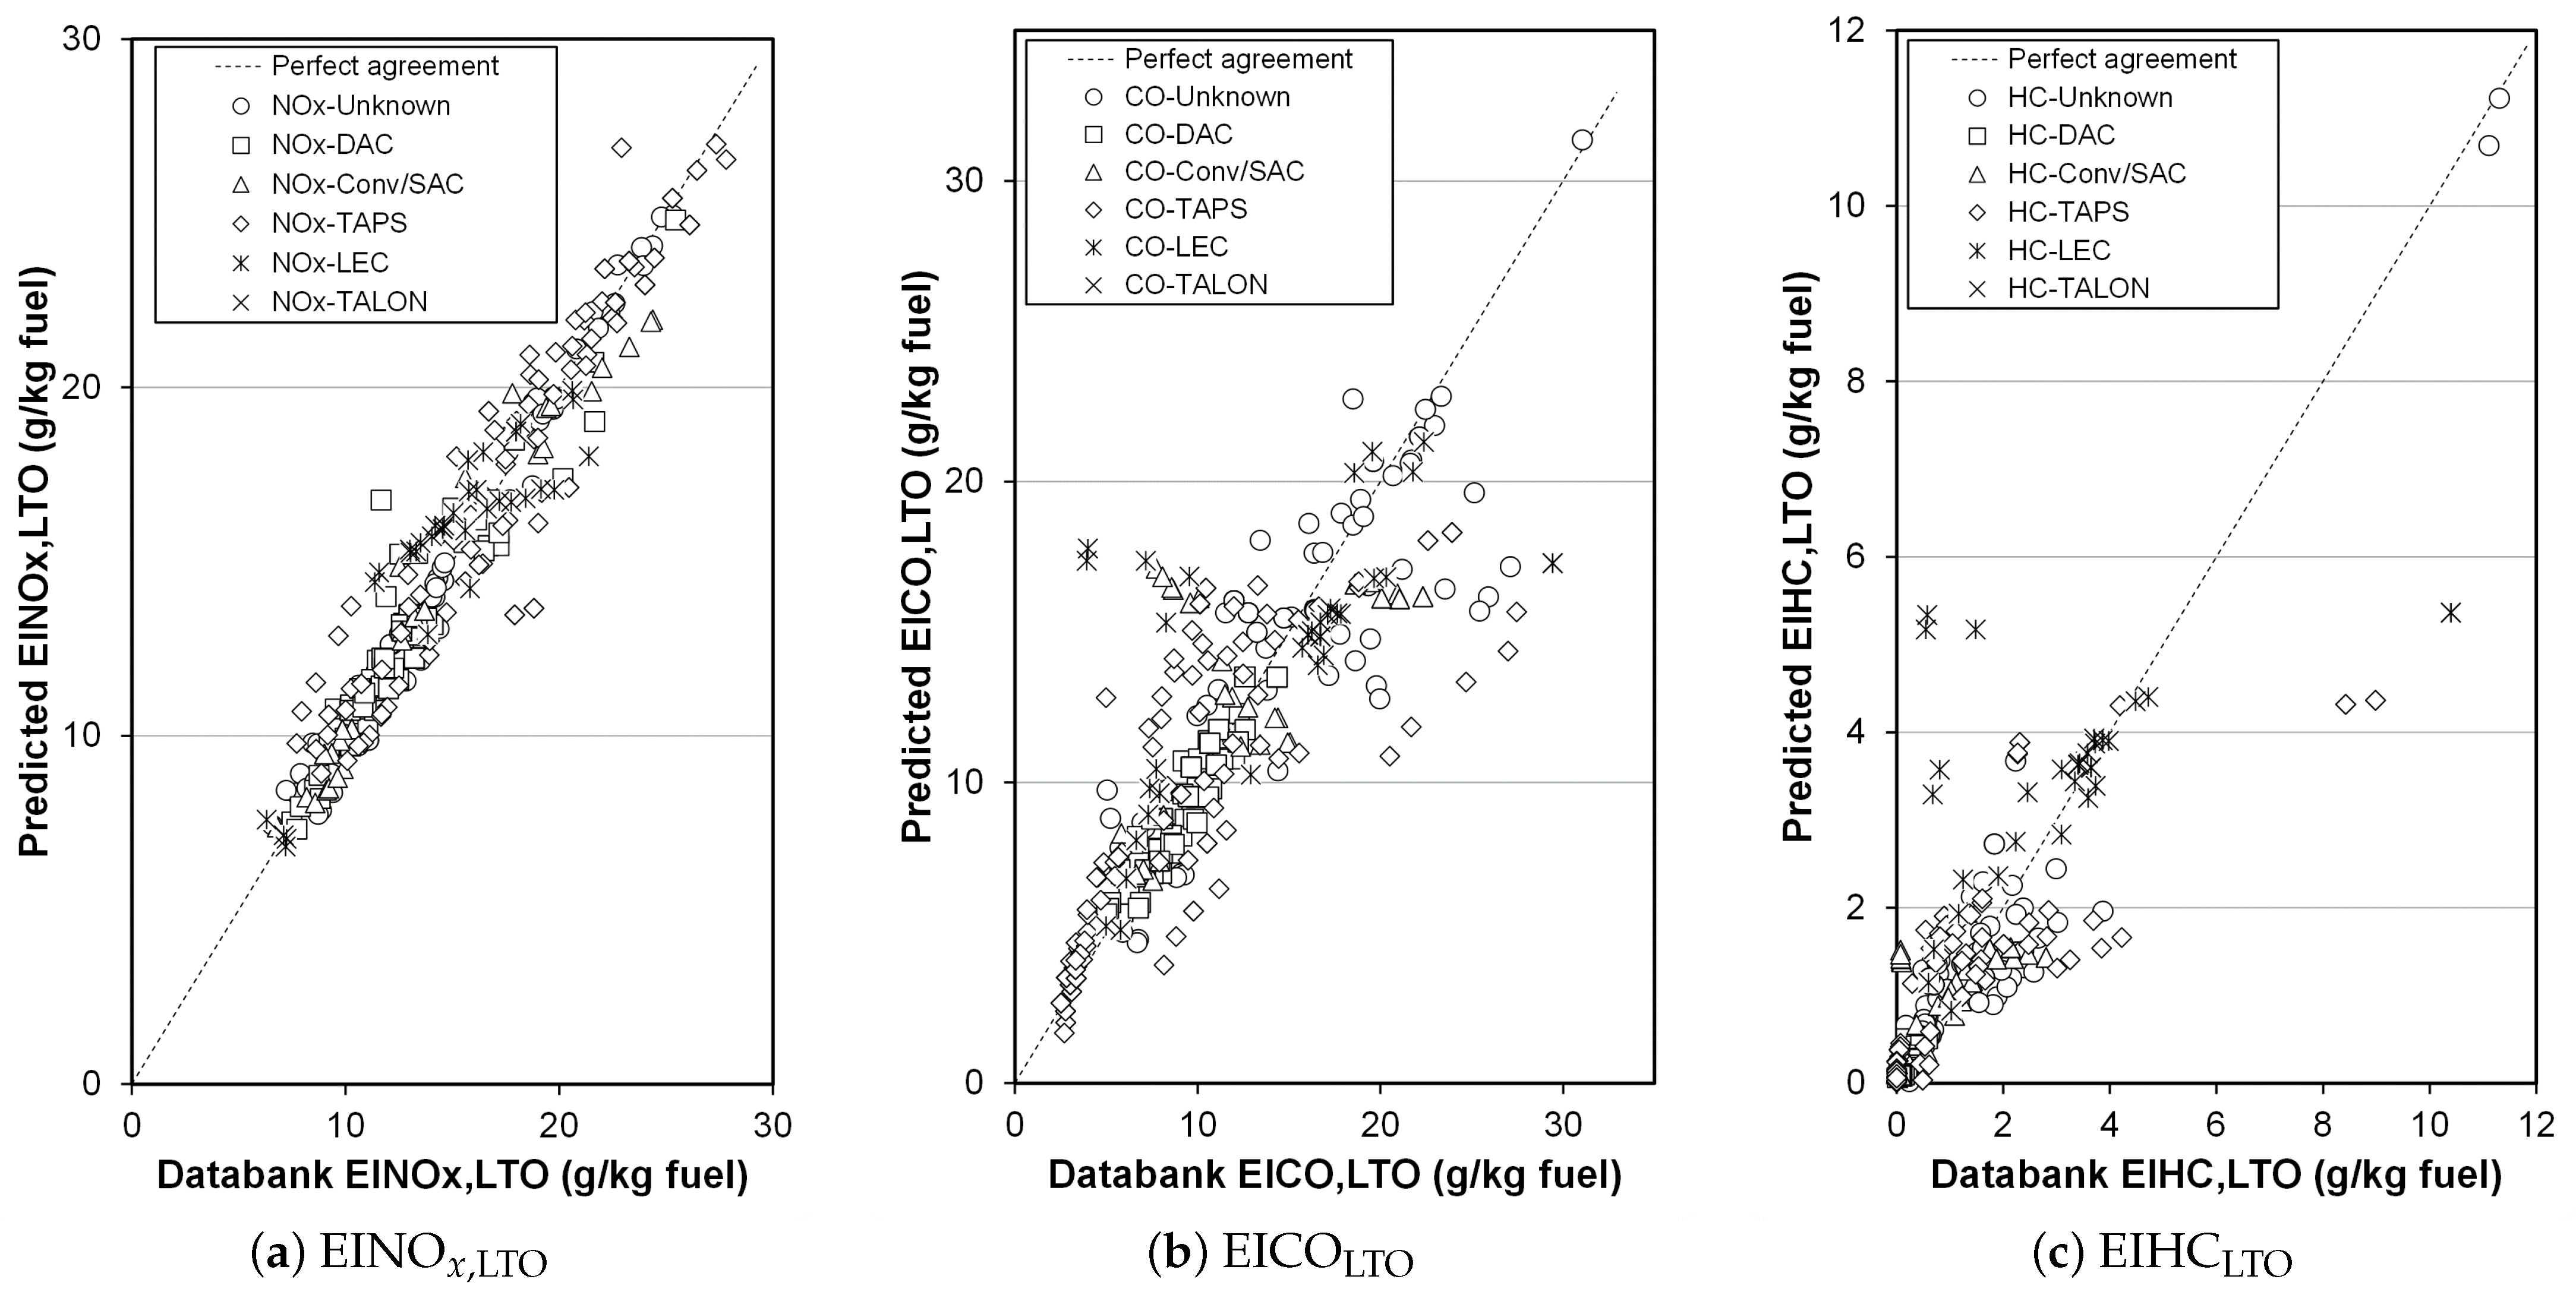
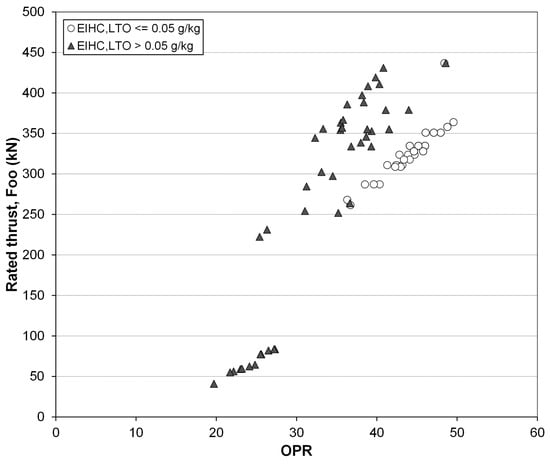
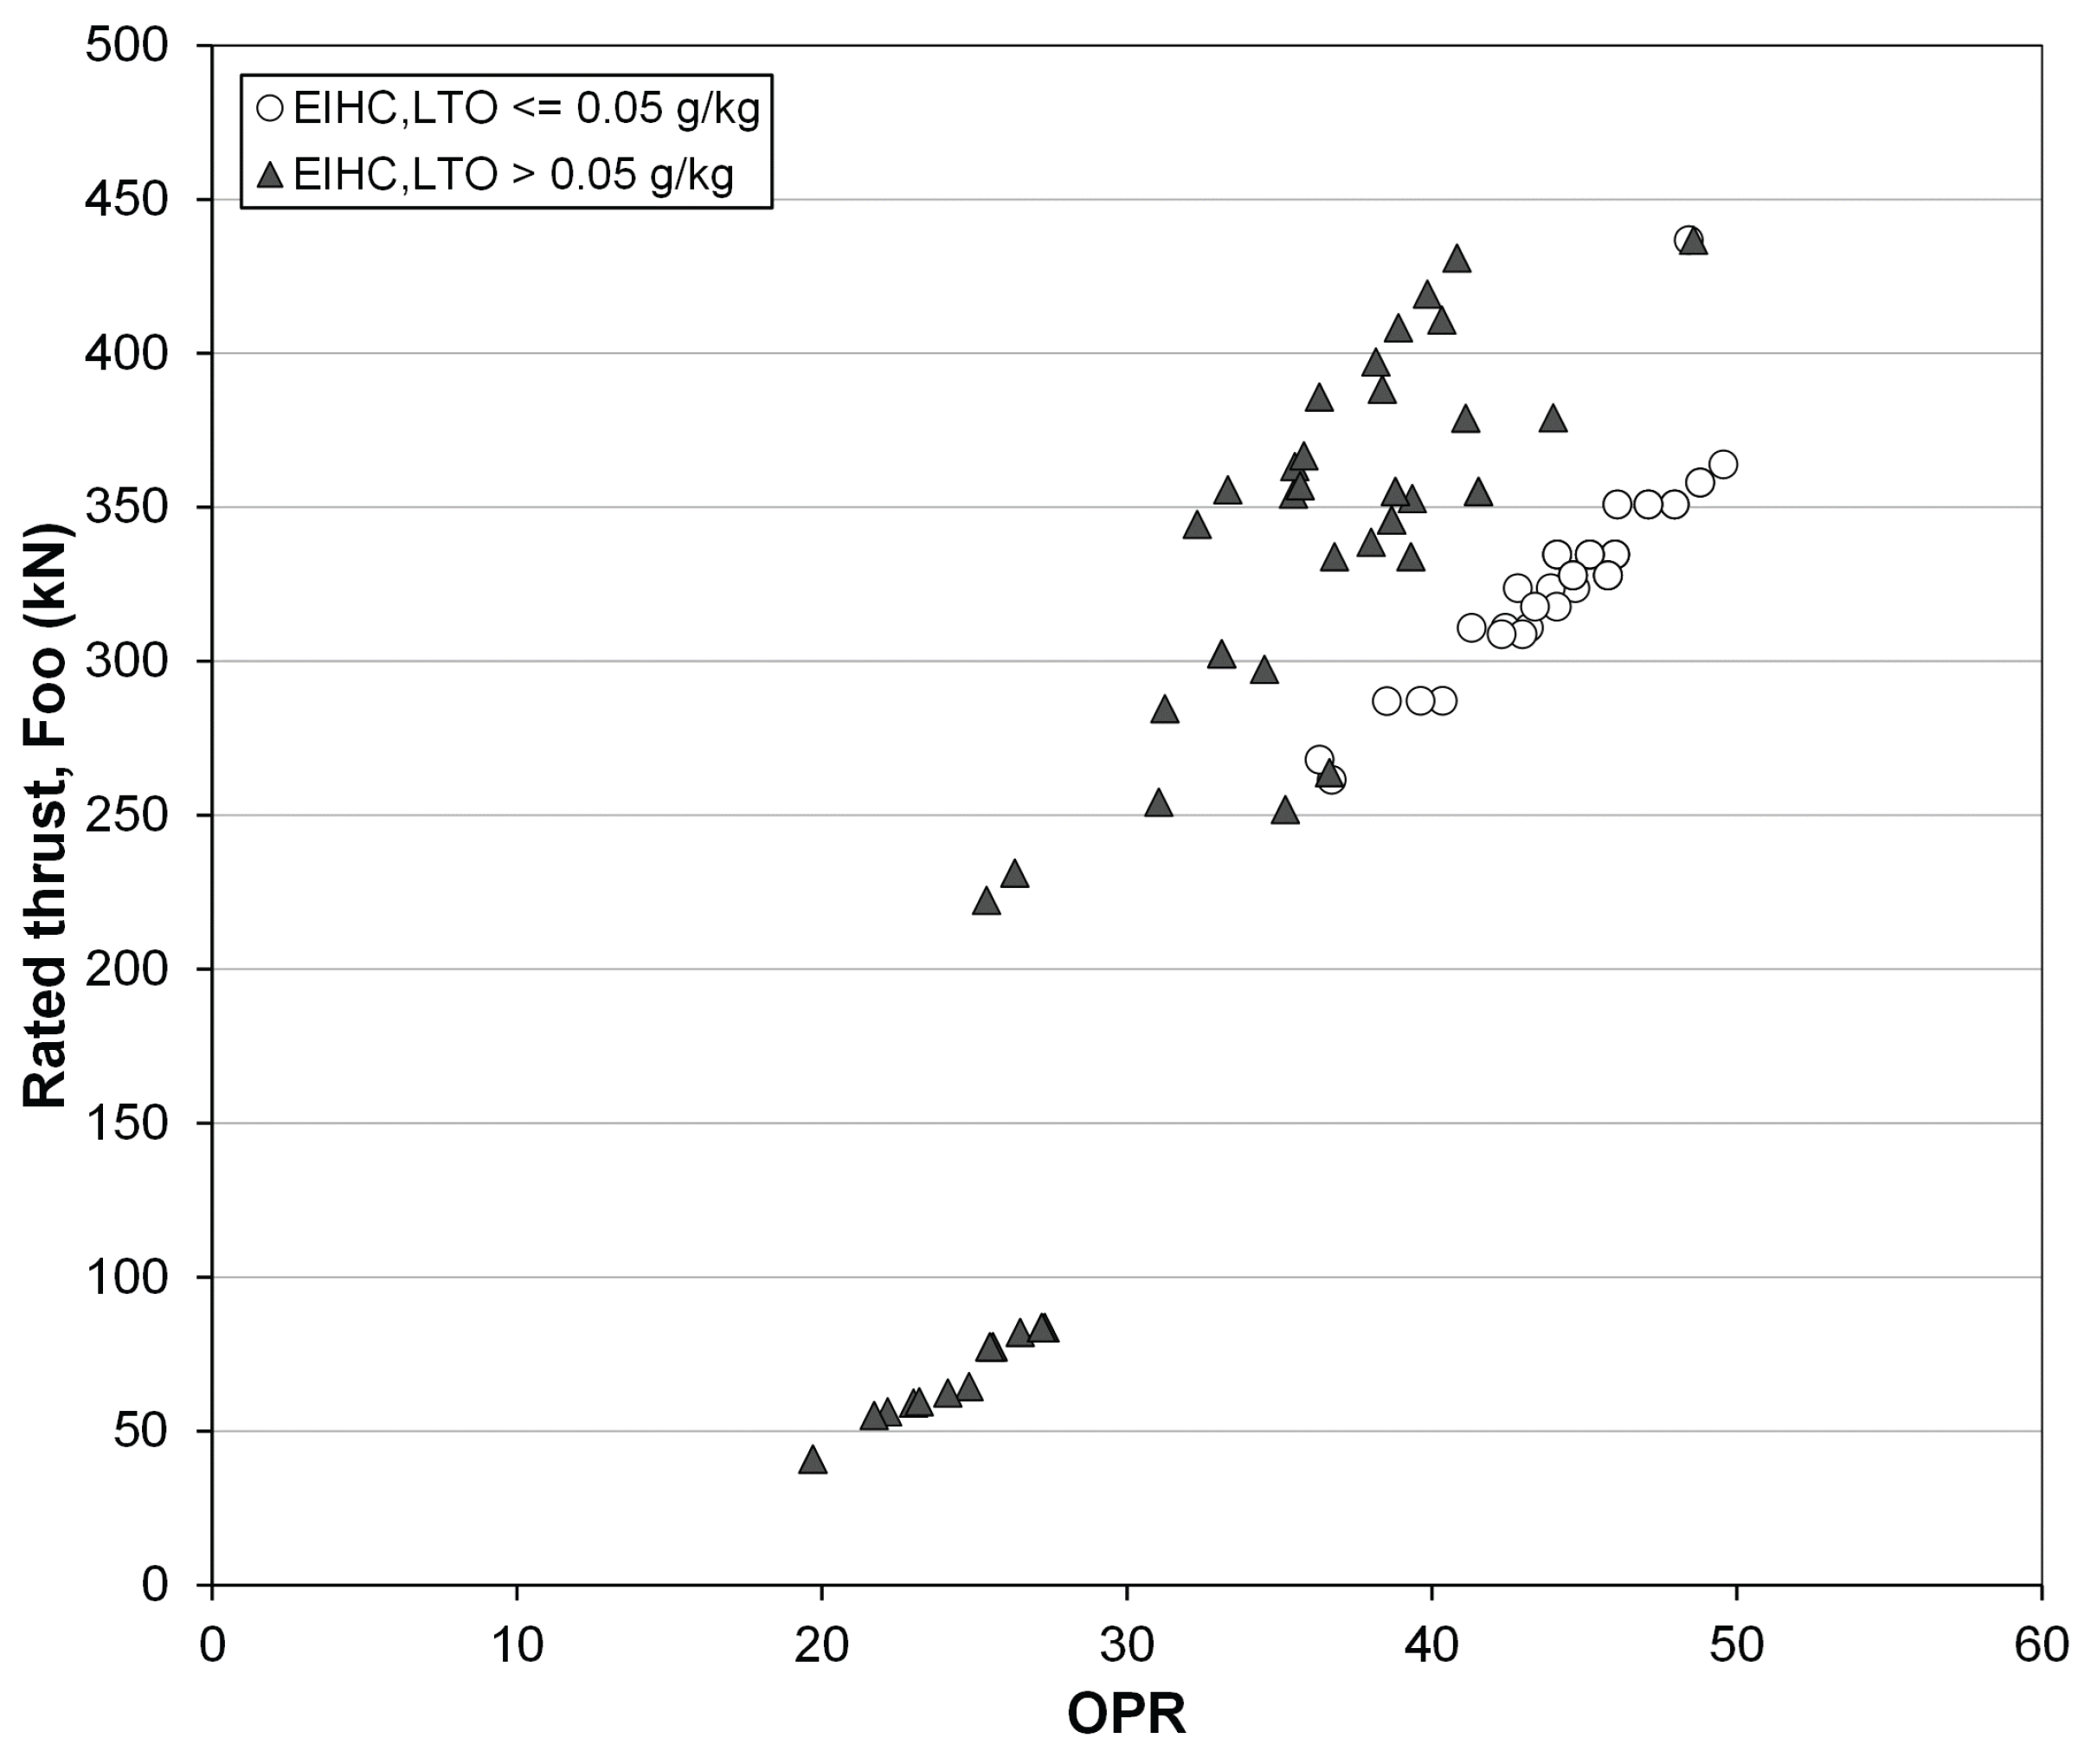

Disclaimer/Publisher’s Note: The statements, opinions and data contained in all publications are solely those of the individual author(s) and contributor(s) and not of MDPI and/or the editor(s). MDPI and/or the editor(s) disclaim responsibility for any injury to people or property resulting from any ideas, methods, instructions or products referred to in the content. |
© 2026 by the authors. Licensee MDPI, Basel, Switzerland. This article is an open access article distributed under the terms and conditions of the Creative Commons Attribution (CC BY) license.