


Abstract
Agriculture is both a source of greenhouse gases (GHGs) and a potential carbon sink, so mitigation must distinguish direct emission reduction from carbon removal. This study quantifies Portuguese agricultural emissions and assesses how carbon farming and biochar can complement source-specific mitigation. FAOSTAT data for 11 farm-gate sources (1990–2023) are analysed alongside, but not merged with, harmonised EEA/Eurostat CRF 3 data for Portugal and the EU-26 (2005–2023). Long-run patterns are assessed using the Hamed–Rao modified Mann–Kendall test, Sen slopes and exploratory Pettitt diagnostics. Farm-gate emissions declined by 14.36%, and the adjusted test supported a decreasing aggregate trend (τ = −0.426, p = 0.0227, q = 0.0458; Sen slope = −37.19 kt CO2e yr−1). Manure management and synthetic fertilisers also declined significantly; enteric fermentation was not significant after serial-correlation correction, and on-farm energy showed no monotonic trend. Under CRF 3, Portuguese emissions increased by 0.81% from 2005 to 2023, whereas the EU-26 declined by 6.97%. Direct CH4, N2O and energy-related mitigation should be prioritised, with carbon farming and biochar carbon removal used as complementary options subject to additionality, permanence, life-cycle accounting and robust MRV.
1. Introduction
Achieving climate neutrality requires sustained reductions in gross GHG emissions, complemented by carbon removals for residual emissions that are difficult to eliminate [1,2]. Agriculture occupies a distinctive position in this transition because it emits methane (CH4), nitrous oxide (N2O) and carbon dioxide (CO2), while also managing soils, perennial vegetation and biomass that can store carbon. The sector therefore lies at the intersection of source-specific emissions abatement and land-based carbon removal [3,4].
This mitigation challenge is particularly relevant in the European Union (EU), where agricultural GHG emissions remain dominated by non-CO2 sources. According to the European Environment Agency, enteric fermentation accounts for about 49% of EU agricultural GHG emissions, agricultural soils for about 30%, and manure management for about 17% [5]. This source structure implies that agricultural climate policy cannot rely on a single instrument: livestock methane, nutrient-related N2O, energy use and carbon storage require different technical responses.
Carbon-farming practices can increase carbon storage in soils and biomass and can reduce selected soil emissions, but outcomes depend on management, environmental conditions and the persistence of stored carbon. Biochar is a distinct pathway because pyrolysis converts part of biogenic carbon into a more persistent carbon-rich material. Its net climate benefit nevertheless depends on sustainable feedstock sourcing, the counterfactual fate of biomass, conversion efficiency and emissions from transport, production and final use [6,7]. Carbon farming and biochar should therefore complement, not substitute for, feasible direct emissions reductions.
The policy context has also changed rapidly. Portugal established a national Voluntary Carbon Market through Decree-Law No. 4/2024, while Regulation (EU) 2024/3012 created the EU Carbon Removals and Carbon Farming Certification Framework (CRCF). Commission Delegated Regulation (EU) 2026/285, published in the Official Journal and in force, establishes certification methodologies for permanent removals, including Biochar Carbon Removal (BCR). Separately, the Commission adopted a delegated act on carbon-farming certification methodologies on 9 July 2026 (C(2026) 4666 final), with a corrigendum issued on 3 September 2026 (C(2026) 6304 final) [8,9,10,11]. This distinction avoids treating a Commission-adopted delegated act and an already published delegated regulation as having identical procedural status. Together, these instruments formalise the distinction between a biophysical environmental improvement and a verified, creditable climate outcome.
Despite this policy momentum, the evidence relevant to Portugal remains fragmented. Inventory data describe emission levels and source composition; farm studies identify livestock and energy-related pressures; soil-carbon, agroforestry and biochar studies evaluate management responses under specific biophysical conditions; and carbon-market research focuses on baselines, additionality, MRV and permanence. These strands do not, by themselves, show how Portugal’s long-run emissions profile should be translated into an integrated mitigation-and-removal strategy. The principal gap addressed here is therefore the connection between observed source-level emissions, context-dependent removal options and the integrity requirements for creditable outcomes [12,13]. The unresolved empirical-policy question is not simply which sources dominate, but how their measured levels and historical changes can be translated into a source-ranked intervention matrix while preserving the distinction between inventory evidence and context-specific literature estimates.
Against this background, the central research question is as follows: how can the structure and long-run evolution of Portuguese agricultural GHG emissions inform a coherent mitigation-and-removal portfolio that prioritises direct source reduction while identifying credible roles for carbon farming and BCR? The study addresses this question by (i) quantifying the evolution and 2023 composition of 11 FAOSTAT farm-gate emission sources over 1990–2023; (ii) testing long-run trends and candidate level shifts in the aggregate series and the four largest individual 2023 sources; (iii) benchmarking Portugal against the EU-26 under the harmonised CRF 3 inventory boundary; and (iv) interpreting the empirical results using Portugal-specific and Mediterranean evidence on soil carbon, biochar, MRV and the current Portuguese and EU certification architecture. The analysis therefore also decomposes the FAOSTAT change over the common 2005–2023 period and links source magnitudes to interventions, published effect evidence, feasibility constraints and the limits of quantitative extrapolation as summarised in Section 3.
The contribution is fourfold. First, the study moves beyond endpoint comparisons by combining a long national emissions series with autocorrelation-adjusted non-parametric trend inference, thereby distinguishing persistent temporal patterns from simple differences between initial and final observations. Second, it makes accounting boundaries explicit by comparing FAOSTAT farm-gate and CRF 3 evidence without treating the two systems as interchangeable, reducing the risk of drawing misleading conclusions from differently defined emission inventories. Third, it links the observed source profile to a mitigation hierarchy in which feasible CH4, N2O and energy-related emission reductions precede and are complemented by carbon farming and BCR. Fourth, it identifies the MRV, additionality, permanence, aggregation, sustainability and life-cycle conditions that must be satisfied before environmental improvements can support high-integrity carbon claims. The operational contribution is a reproducible 2005–2023 source decomposition and an evidence-graded source-to-intervention matrix; neither national mitigation cost curves nor project-level certified removals are estimated.
The remainder of the article is organised as follows: Section 2 presents the data and methods. Section 3 reports the empirical results. Section 4 discusses the main findings, policy implications, limitations and future research directions. Section 5 concludes.
1.1. Agricultural GHG Control: Separating Source Reduction from Carbon Removal
Agricultural mitigation comprises mechanisms that should not be treated as interchangeable. Reducing enteric methane targets livestock CH4; improving fertiliser and nutrient management affects N2O; replacing fossil energy reduces energy-related CO2; increasing soil organic carbon (SOC) stores additional carbon in soils; and BCR changes the form and expected storage duration of biogenic carbon. CO2-equivalent provides a common aggregation metric, but it does not remove the differences in physical processes, atmospheric behaviour, storage duration, permanence or MRV requirements [1,2,14].
This distinction is central to policy design. A farm may reduce emissions and increase carbon stocks simultaneously, but removals should complement rather than replace feasible source reductions. Paustian et al. [3] show that improved soil management can both reduce GHG emissions and increase soil carbon, while also stressing the need for measurement and monitoring with quantified uncertainty. Smith et al. [4] similarly emphasise credible MRV as a condition for scaling soil-carbon removal. An effective portfolio should therefore combine source-specific reductions with conservatively quantified removals [2,3,4].
Portugal-specific evidence reinforces the case for source-specific mitigation. Castanheira et al. [15] found that dairy-farm activities, including manure management, enteric fermentation and diesel consumption, contributed more than 70% of the global-warming potential of milk production in a Portuguese case study. Pereira and Trindade [16], using a survey of 1471 Portuguese commercial dairy cattle farms, estimated GHG emissions from enteric fermentation and manure management and reported a combined mean of 1.2 ± 0.22 kg CO2e per litre of milk; higher milk productivity was associated with a lower emissions intensity. For the intervention evidence, Almeida et al. [17] synthesised in vivo studies of ruminant feed additives, including a reported 23.3% average reduction in methane yield with 3-nitrooxypropanol relative to control diets; this is a treatment-specific trial estimate, not a nationwide Portuguese inventory reduction.
Morais et al. [18], analysing 25 pasture-based dairy farms on São Miguel Island in the Azores, identified enteric fermentation as the largest average component of the carbon footprint, accounting for 46% of total impact. At the aggregate level, Mourão and Martinho [19] found higher animal production to be associated with higher Portuguese agricultural GHG emissions. Energy use is a separate mitigation domain in which efficiency and low-carbon energy can reduce emissions across agri-food systems [20]. Together, these studies support direct attention to livestock, manure, nutrient and energy sources before removals are considered as a complement. A comparable national-level analysis in Greece likewise found that livestock GHG mitigation potential varied substantially across management scenarios, with diet and manure management among the more influential levers, reinforcing the value of source-specific interventions [21]. A recent cross-bloc analysis using FAOSTAT data [22] demonstrates that emission trends and source composition may differ depending on the countries included and the aggregation methods applied. These findings reinforce the importance of examining absolute emissions and their composition separately, as a larger sectoral share does not necessarily indicate a higher emissions intensity.
1.2. Soil Organic Carbon, Carbon Farming, and Mediterranean Constraints
SOC storage reflects the balance between carbon inputs and losses through decomposition, mineralisation, erosion and biomass removal. Inputs and stabilisation are influenced by vegetation, roots, organic amendments and management, while the magnitude and persistence of the SOC change also depend on climate, water availability, soil texture and mineralogy, land use and initial conditions. SOC should therefore be treated as a context-dependent soil function rather than as a fixed response to a named practice [23].
The ‘4 per 1000’ initiative placed agricultural soil carbon prominently within climate mitigation, but the literature does not support a uniform annual sequestration rate across soils, regions or time. Minasny et al. [24] show that the estimated rates depend on the soil depth, initial SOC and time since management change. Accumulation generally slows as soils approach a new equilibrium; consequently, SOC sequestration is finite and should not be treated as a constant or indefinitely repeatable annual removal [3].
Cover crops illustrate this context dependence. Poeplau and Don [25] estimated a mean SOC accumulation of 0.32 ± 0.08 Mg C ha−1 yr−1 across observations spanning 1–54 years after cover-crop introduction. Although saturation was not detectable in the empirical dataset because long-term observations were limited, RothC simulations indicated progressively slower accumulation as soils approached a new steady state. Mediterranean evidence further shows that climate, slope and management duration can modify these responses.
In Mediterranean vineyards, Estrela-Muriel et al. [26] found higher SOC stocks under green covers and organic amendments than under conventional management, with responses varying by climate, slope and duration of application. The authors also identified missing information on bulk density, stone content, initial SOC and other environmental variables as important limitations for interpreting effect sizes.
Mediterranean olive studies show a similar need for context-specific interpretation. Márquez-García et al. [27] reported lower erosion-related SOC losses under cover crops, while Pareja-Sánchez et al. [28] found SOC stocks in the upper 30 cm to be, on average, 2.03 Mg C ha−1 higher in commercial olive orchards managed with temporary spontaneous cover for at least eight years than in comparable bare-soil orchards.
Portugal-specific grassland and montado evidence is particularly informative. Teixeira et al. [29], using five years of observations from eight Portuguese sites to calibrate a soil organic-matter model, estimated stronger SOM increases under sown biodiverse permanent pastures rich in legumes than under natural or fertilised natural grasslands. Gómez-Rey et al. [30] found higher organic C and total N under improved pastures established for 26–32 years in Mediterranean cork-oak woodland, with the strongest organic-C response in the surface soil beneath oak canopies.
By contrast, Rodrigues et al. [31] found no significant SOC-stock advantage for improved-pasture management over natural-understorey management in another Portuguese cork-oak woodland. Taken together, the studies show that improved pasture should not be assigned a universal sequestration factor: outcomes depend on management history, the reference system and tree-understorey interactions. A spatial typology of farming systems on Madeira [32] further highlights the within-Portugal structural heterogeneity, cautioning against transferring a uniform land-management intervention between island and mainland production systems.
These constraints are directly relevant to Portuguese carbon farming. Water availability affects biomass production and carbon inputs, irrigation can add energy demand, and N management can alter N2O emissions. Erosion can also export soil carbon from sloping vineyard and olive systems. Credible methodologies should therefore quantify net outcomes under local climatic and agronomic conditions rather than credit practice adoption alone [26,27].
1.3. Biochar Carbon Removal as a Complementary Durable-Removal Pathway
Biochar is produced by thermochemical conversion of biomass under oxygen-limited conditions. Pyrolysis converts part of biogenic carbon into structures that are substantially more persistent than the original biomass, thereby delaying its return to the atmosphere [7].
Sustainable biochar systems can contribute to climate mitigation through persistent carbon storage and, depending on the system, through avoided emissions or useful energy coproducts. Their net effect depends on feedstock source, conversion conditions, the counterfactual use of biomass and the energy source displaced by coproducts [6,7].
BCR must therefore be assessed as a full system rather than as soil amendment alone. Collection, preparation, drying, transport, pyrolysis, fugitive emissions, energy use and final application can all create emissions that reduce net removal. Counterfactual biomass use is equally important: residues that already protect soil, recycle nutrients or supply another useful service cannot be treated as costless feedstock [6,7].
The agronomic evidence is heterogeneous but relevant to Portuguese conditions. In a global meta-analysis of 75 studies and 250 observations, Bekchanova et al. [33] estimated a 61% increase in soil C sequestration after biochar application (95% CI: 36–90%), whereas pooled effects on total CO2 flux and microbial respiration were statistically inconclusive. Responses varied with experimental design, application rate, feedstock and pyrolysis temperature.
In Portugal, Gholamahmadi et al. [34] used soil from a commercial Bairrada vineyard in a controlled sloping-lysimeter experiment. Woody biochar reduced runoff by 50% and soil erosion by 58%, increased water infiltration by 50% and daily soil moisture by 59%, and increased vegetation cover substantially. These results support soil-conservation and adaptation co-benefits, but they are not an estimate of the national BCR potential.
Jongen et al. [35], in a newly established legume-rich Portuguese pasture, found higher above-ground productivity in biochar-amended plots, although the magnitude and statistical significance varied by year and sampling date. Lustosa Filho et al. [36] produced nutrient-enriched biochar-based materials from Portuguese olive pomace, demonstrating a technically feasible residue-valorisation pathway. These studies justify targeted pilots, not the national extrapolation of a single biochar response factor.
The regulatory treatment of BCR reflects this accounting distinction. Commission Delegated Regulation (EU) 2026/285 establishes a dedicated BCR certification methodology covering eligibility, baseline calculation, the quantification of removals and associated GHG emissions, monitoring, sustainability and long-term storage. Net certified removal therefore depends on measured biochar characteristics and eligible storage after relevant associated emissions are deducted. The methodology provides a more explicit accounting chain than simply demonstrating that biochar has been applied to soil [10].
1.4. Carbon Credits, Additionality, and Farm Economics
A biophysical climate benefit does not automatically generate a credible tradable carbon unit. Paul et al. [12] identify recurring challenges for soil-carbon certificates, including quantification, baseline and counterfactual definition, additionality, permanence, reversal risk, leakage and long-term monitoring. These issues are particularly important when a practice is already common, legally required or supported by other public payments, because the incremental effect attributable to carbon finance may then be smaller than the observed biophysical change. A recent review in Gases similarly identifies baseline definition, additionality, validation and independent verification as central conditions for converting mitigation or removal activities into credible carbon units [37].
Contract design also affects farmer participation and the credibility of outcomes. Raina et al. [13] distinguish between result-based, action-based and hybrid carbon-farming payments. Result-based approaches link compensation more directly to measured mitigation but require more demanding MRV and can expose farmers to environmental performance risk. Action-based payments are simpler but have a weaker link to realised mitigation. Hybrid contracts combine a guaranteed or action-based component with additional compensation linked to measured outcomes.
Transaction costs are therefore material to project viability. Soil sampling, MRV, certification and other administrative, legal and technical requirements can reduce the net carbon revenue reaching farmers, especially where the project scale is small [12,13].
Aggregation can spread fixed certification and verification costs across multiple participants. Decree-Law No. 4/2024 allows eligible individual carbon projects to be grouped into programmes under common project-type and methodological conditions, providing a legal route for joint verification and potential economies of scale [8].
Figure 1 summarises the conceptual framework linking source-specific agricultural mitigation and carbon-removal pathways with environmental, economic and resilience outcomes.
Figure 1.
Conceptual framework linking agricultural greenhouse gas mitigation and carbon removal pathways with environmental, economic, and resilience outcomes. The schematic distinguishes direct emissions control from carbon-removal pathways and presents environmental and socioeconomic outcomes as potential benefits. The figure was created by the authors using Python (version 3.13.5), the Matplotlib library (version 3.10.8) and ChaptGPT (version GPT-6 Astra).
2. Materials and Methods
This study combines national agricultural GHG-emission analysis, EU benchmarking, non-parametric trend assessment, and an integrative synthesis of mitigation and carbon-removal evidence. The empirical approach uses FAOSTAT farm-gate data and 7 CRF 3 inventory data, complemented by statistical trend and change-point diagnostics. Supplementary trajectory and composition figures are reported in Appendix A.
2.1. FAOSTAT Farm-Gate GHG Emissions
The primary empirical analysis uses the FAOSTAT Emissions Totals (GT) domain for Portugal over 1990–2023. The selected element is ‘Emissions (CO2eq) (AR5)’, expressed in thousand tonnes of CO2 equivalent (kt CO2e). The series therefore aggregates GHGs using AR5 global-warming potentials and should not be interpreted as CO2 emissions alone [38].
Eleven categories are included in the analytical farm-gate total: enteric fermentation; manure management; rice cultivation; synthetic fertilisers; manure applied to soils; manure left on pasture; crop residues; burning of crop residues; on-farm energy use; drained organic soils; and savanna fires. Pre- and post-production emissions such as fertiliser manufacturing, processing, packaging, transport, retail and household consumption are excluded, as are land-use-change and forest categories. The resulting total is used as a defined analytical boundary, not as a complete food-system footprint.
For each emission source i, the cumulative percentage change between 1990 and 2023 is calculated as shown in Equation (1):
where Ei,1990 and Ei,2023 denote emissions from source i in 1990 and 2023, respectively. The share of source i in total farm-gate emissions in 2023 is calculated as shown in Equation (2):
where Si represents the percentage contribution of source i to total farm-gate emissions in 2023, and j = 1, …, 11 indexes the eleven emission-source series. The absolute contribution of each source to the historical change in emissions is calculated as shown in Equation (3):
where Di measures the absolute change in emissions from source i over the 1990–2023 period. For each year t, total farm-gate emissions are obtained as the sum of the eleven component emission series, as shown in Equation (4):
where denotes total farm-gate emissions in year t and Ei,t denotes emissions from source i in that year. Calculations use unrounded source values; rounding is applied only for presentation. Annual totals were cross-checked against the sum in Equation (4). The descriptive decomposition in Equations (1)–(4) is complemented by the non-parametric trend and change-point analysis in Section 2.4. For comparability with the CRF 3 benchmark, the absolute and percentage changes in each FAOSTAT farm-gate emission source were also calculated for 2005–2023, following Equations (1) and (3) and using unrounded emission values [38].
Di = Ei,2023 − Ei,1990,
2.2. CRF 3 European Benchmark
A complementary benchmark uses harmonised EEA/Eurostat data for the Agriculture sector (CRF 3) over 2005–2023. The 2005 start year follows the baseline used in current EEA agricultural-emissions monitoring, while 2023 is retained as the common terminal year with the FAOSTAT analysis; this prevents the comparison from mixing different end years [5,39]. The comparator EU-26 is calculated as EU-27 less Portugal so that Portugal is not included in its own benchmark. The comparison covers both the cumulative change in total CRF 3 emissions and the 2023 composition across enteric fermentation, managed agricultural soils, manure management and a residual category comprising all remaining harmonised CRF 3 sources. Given the differences in inventory boundaries and the absence of harmonised agricultural production denominators, the analysis focuses on emission levels, source composition, and percentage changes rather than emissions intensity. As contextual evidence on production structure, 2023 livestock density is compared using the harmonised Eurostat farm-structure measure (livestock units per hectare of utilised agricultural area). This ancillary structural benchmark compares Portugal with the EU-27 as a whole; it is not substituted for the EU-26 inventory benchmark and is not an emissions-intensity estimate [40].
The CRF 3 series is analytically distinct from the FAOSTAT farm-gate total. In national GHG inventories, agricultural fuel combustion is reported under the energy-sector reporting structure rather than being part of CRF 3 Agriculture; consequently, farm energy follows a different accounting logic from the FAOSTAT farm-gate series. The two totals are therefore neither summed nor treated as direct substitutes, and their different Portuguese trajectories should not be interpreted as a data inconsistency. They are compared only to show how the diagnosis changes with accounting boundary [5,41,42]. In Section 3 below, summarises the correspondence between FAOSTAT farm-gate and CRF 3 emission categories, highlighting common emission sources and differences in the treatment of on-farm energy use. Although several categories represent similar emission processes, differences in accounting boundaries, greenhouse gas coverage, and estimation methodologies limit their direct comparability. Accordingly, the analysis focuses on differences in aggregate emission trajectories and source composition rather than attributing these differences to individual accounting factors. To make the common-period comparison more informative, the observed difference between the Portuguese FAOSTAT and CRF 3 totals is partitioned arithmetically into the FAOSTAT on-farm energy series and the remaining difference after that series is excluded. This is a descriptive identity, not a harmonised source-by-source reconciliation or an estimate of the causal effect of an accounting rule.
2.3. Integrative Evidence Synthesis and Regulatory Analysis
The empirical diagnosis is interpreted through an integrative, purposive evidence synthesis rather than a formal systematic review. Priority is given to peer-reviewed meta-analyses and reviews, Portugal-specific field or modelling studies, and recent Mediterranean evidence directly relevant to vineyards, olive systems, grasslands, agroforestry, biochar, MRV and contract design. Regulatory sources include Portugal’s Decree-Law No. 4/2024, Regulation (EU) 2024/3012, Delegated Regulation (EU) 2026/285 and the Commission’s carbon-farming delegated act adopted on 9 July 2026, as corrected on 3 September 2026 (C(2026) 4666 final; C(2026) 6304 final).
For transparency, literature identification followed a targeted search protocol rather than a PRISMA-style systematic review. Searches used bibliographic search engines and publisher databases with combinations of Portugal/Portuguese, Mediterranean, agricultural greenhouse gas, soil organic carbon/carbon farming, biochar/BCR, MRV, and carbon-contract terms, supplemented by backward citation checking from major reviews. Priority was given to peer-reviewed meta-analyses and reviews, Portugal-specific empirical studies, and recent Mediterranean evidence; official inventory, legal and regulatory material was retrieved from FAOSTAT, EEA/Eurostat, EUR-Lex and Diário da República. The literature search and regulatory review were updated through 26 October 2026. Sources were selected based on their scientific relevance to agricultural greenhouse gas emissions, mitigation mechanisms, carbon removal, quantitative evidence, agricultural production structures, methodological approaches, implementation constraints, and regulatory developments.
For a transparent source-to-intervention comparison, an arithmetic scaling indicator is defined as 0.01 × Ei,2023 the amount corresponding to a 1% change in each source’s observed 2023 emissions. This indicator describes the size of the emission source, not the expected effectiveness, eligible adoption rate or achievable mitigation of any specific intervention. For prospective appraisal, a source-specific gross reduction would depend on the eligible share of baseline emissions and the intervention effect within that eligible share; assessment of net benefit additionally requires associated life-cycle emissions and leakage to be accounted for on consistent boundaries. Costs are assessed in terms of necessary capital, and operating and verification inputs rather than assigning a national marginal abatement cost without comparable activity and cost data.
The synthesis is used to assess plausibility, constraints and implementation pathways; it is not used to estimate a pooled effect or a national sequestration factor. Because source selection is purposive rather than systematic, the literature component should be interpreted as contextual evidence supporting the empirical discussion, not as an exhaustive review. This limitation is important given the heterogeneity of SOC responses and the absence of a harmonised national inventory of sustainably mobilisable biochar feedstocks in the present study.
2.4. Statistical Trend and Change-Point Analysis
To test whether endpoint differences correspond to persistent temporal patterns while limiting multiplicity, inferential analysis was restricted to five series: total farm-gate emissions plus the four largest individual 2023 sources enteric fermentation, on-farm energy use, manure management and synthetic fertilisers. These four sources jointly accounted for 81.55% of the 2023 farm-gate total, so the selection rule is based on source importance rather than on the sign or significance of the trend estimates. Lag-1 autocorrelation was calculated as a diagnostic and indicated substantial persistence across all five series (0.674–0.809). Monotonic trends were therefore tested using the Hamed–Rao modified Mann–Kendall procedure, which adjusts the variance of the Mann–Kendall statistic for significant autocorrelation in the detrended ranked series [43]. Positive serial autocorrelation can lead to underestimated variance and overstated statistical significance in the conventional Mann–Kendall test. Accordingly, the Hamed–Rao modification was adopted for the primary trend analysis to account for serial dependence, while Sen’s slope was estimated separately from the original annual series [43,44].
Trend magnitude was summarised with Sen’s slope and 95% confidence intervals [44]. Because the confidence intervals returned by the applied sens.slope implementation use the conventional Mann–Kendall variance and do not incorporate the Hamed–Rao correction, statistical inference on the existence of a monotonic trend is based on the modified Mann–Kendall p-value; the Sen estimate is used primarily for direction and magnitude. Accordingly, a conventional Sen-slope interval is not treated as an independent significance criterion when it conflicts with the autocorrelation-adjusted Mann–Kendall inference. Potential single shifts in central tendency were assessed with Pettitt’s non-parametric test [45]. Since the standard Pettitt test does not explicitly adjust for serial dependence, its p-values and candidate years are treated as exploratory rather than as confirmatory evidence of structural or causal breaks.
Benjamini–Hochberg adjusted p-values were calculated separately for the five modified Mann–Kendall tests and the five Pettitt diagnostics [46]. The two analyses are treated as separate hypothesis families, and the adjustment controls the expected false-discovery rate within each defined family rather than converting the tests into independent confirmatory endpoints. Because the emissions series are correlated, adjusted values are interpreted cautiously. A 5% significance level was used, with q = 0.05 as the false-discovery-rate target. Analyses were implemented in R using the modifiedmk and trend packages.
As a sensitivity analysis, the Hamed–Rao procedure was extended to all 11 individual farm-gate source series, complementing the primary analysis focused on the four largest sources and the aggregate total. Benjamini–Hochberg adjustment was applied across the 11-source family. The aggregate total was not included in this sensitivity family because it is the deterministic sum of the component series. Results are reported in Table A1.
Sensitivity to the treatment of serial dependence was also examined using trend-free pre-whitening (TFPW) following Yue et al. [47]. For each source, the Sen slope was removed, lag-1 correlation was estimated from the detrended series, the detrended series was pre-whitened, the trend was reintroduced, and an ordinary Mann–Kendall test was then applied to the transformed series. Benjamini–Hochberg adjustment was applied across the 11 individual sources. The Hamed–Rao variance correction was retained for primary inference, whereas TFPW was applied as a sensitivity analysis to the treatment of serial dependence. Previous methodological studies show that pre-whitening can affect trend-test power and that its performance depends on the strength of serial correlation, trend magnitude and sample characteristics [43,47,48,49]. Differences between the two sets of results are therefore interpreted as method sensitivity rather than independent confirmation of a trend (see Table A2). The influence of persistence on change-point detection further supports the exploratory interpretation of Pettitt diagnostics [50].
3. Results
This section presents the main findings on the composition, evolution, and long-term trends of Portuguese agricultural GHG emissions, including a comparison with the EU-26.
3.1. Structure of Portuguese Farm-Gate Emissions in 2023
In 2023, the eleven selected farm-gate sources emitted 8779.55 kt CO2e. Enteric fermentation was the largest source at 3441.02 kt CO2e (39.19%), followed by on-farm energy use at 1789.51 kt CO2e (20.38%) and manure management at 1437.51 kt CO2e (16.37%). Together, these three sources accounted for 75.95% of the farm-gate total. Enteric fermentation, manure management, manure left on pasture and manure applied to soils jointly represented 65.48%, while on-farm energy represented a further 20.38%.
Table 1 reports the 1990 and 2023 source levels, cumulative change and 2023 share for each farm-gate category.
Table 1.
Structure and change of farm-gate GHG emissions in Portugal, 1990–2023.
The distribution in Table 1 establishes the source ranking underlying the later trend analysis: enteric fermentation, on-farm energy and manure management account for most 2023 farm-gate emissions. These shares refer to the selected FAOSTAT boundary and should not be interpreted as CRF 3 sector shares.
Figure 2 shows the 2023 farm-gate source distribution and the concentration of emissions in enteric fermentation, on-farm energy use and manure management.
Figure 2.
Farm-gate greenhouse gas emissions in Portugal, 2023. Source: FAOSTAT Emissions Totals (GT), element “Emissions (CO2eq) (AR5)”; values are reported in kt CO2e and as shares of the eleven-source farm-gate total. The authors created this figure using R 4.6.1 in RStudio 2026.07.0.
3.2. Long-Run Change and Decomposition, 1990–2023
Total farm-gate emissions declined from 10,252.19 kt CO2e in 1990 to 8779.55 kt CO2e in 2023, an absolute reduction of 1472.64 kt CO2e (14.36%). The path was non-monotonic: emissions peaked at 10,722.26 kt CO2e in 2000, and 2023 was the lowest value in the analysed period. Figure A1 shows the complete annual trajectory.
Source-level changes were heterogeneous. Enteric fermentation decreased by 11.18%, manure management by 18.47%, synthetic fertilisers by 40.62%, manure left on pasture by 23.22% and manure applied to soils by 27.07%. Crop-residue emissions, savanna fires and burning of crop residues fell more sharply from smaller bases. On-farm energy moved in the opposite direction, increasing by 8.61% from 1647.70 to 1789.51 kt CO2e.
In absolute terms, enteric fermentation contributed the largest reduction (−433.02 kt CO2e), followed by synthetic fertilisers (−336.63 kt CO2e) and manure management (−325.71 kt CO2e). On-farm energy increased by 141.81 kt CO2e and offset part of these reductions. Figure A2 and Figure A3 show the indexed trajectories of the five largest 2023 sources and the 2023 broad-group composition, respectively.
Figure 3 summarises the cumulative source-level changes between 1990 and 2023, showing reductions in ten categories and an increase in on-farm energy use.
Figure 3.
Cumulative change in Portuguese farm-gate emissions by source, 1990–2023. Absolute changes are calculated as emissions in 2023 minus emissions in 1990 (kt CO2e); negative values indicate reductions. Source: FAOSTAT Emissions Totals (GT). The authors created this figure using R 4.6.1 in RStudio 2026.07.0.
3.3. Portugal Versus the EU-26 Under the CRF 3 Inventory Boundary
Under the harmonised CRF 3 inventory boundary, Portuguese agricultural emissions increased from 6947.39 to 7003.36 kt CO2e between 2005 and 2023 (+0.81%). Over the same period, the EU-26 aggregate declined from 384,762.61 to 357,926.64 kt CO2e (−6.97%). Portugal therefore did not reproduce the aggregate decline observed across the rest of the EU under this boundary.
The 2023 composition also differed. Enteric fermentation represented 55.91% of Portuguese CRF 3 emissions compared with 49.05% in the EU-26, a difference of 6.86 percentage points. Managed agricultural soils accounted for 26.56% in Portugal and 29.91% in the EU-26; manure management accounted for 14.54% and 17.20%, respectively; and other harmonised sources accounted for 2.99% and 3.84%. These are compositional differences and should not be interpreted as differences in emissions efficiency or emissions per unit of agricultural output.
The source-composition contrast can be contextualised with an independent structural indicator. Eurostat reports 2023 total livestock densities of 0.6 livestock units per hectare of utilised agricultural area in Portugal and 0.7 for the EU-27 aggregate [40]. Thus, Portugal’s higher enteric-fermentation share within CRF 3 does not imply a higher overall livestock density. These livestock-density figures are descriptive farm-structure measures based on a different population denominator and an EU-27 (not EU-26) comparator; they do not establish animal-level emissions efficiency or permit a causal interpretation of the inventory differences.
Over the common 2005–2023 interval, Portuguese FAOSTAT farm-gate emissions fell from 9693.66 to 8779.55 kt CO2e (−914.11 kt CO2e; −9.43%), whereas CRF 3 agricultural emissions increased from 6947.39 to 7003.36 kt CO2e (+55.97 kt CO2e; +0.81%). The 10.24-percentage-point difference in their rates of change is descriptive rather than an estimate of accounting-boundary effects. Within FAOSTAT, the largest decreases occurred in on-farm energy (−443.62 kt CO2e), enteric fermentation (−179.34 kt CO2e) and savanna fires (−112.01 kt CO2e), while rice cultivation (+71.39 kt CO2e) and synthetic fertilisers (+28.65 kt CO2e) increased. On-farm energy represented approximately 48.53% of the net farm-gate reduction during this period. Table 3 and Table 4 present the common-period comparison and clarify the inventory categories, respectively. Table A3 gives the complete source decomposition. A complete numerical reconciliation would require matched CRF 3 source-level data and harmonised accounting conventions.
Table 2 places the Portuguese emissions trajectory alongside the EU-26 benchmark using a consistent CRF 3 sector definition, while also comparing the composition of major agricultural emission categories in 2023.
Table 2.
Portuguese agricultural emissions compared with the EU-26 under the CRF 3 inventory boundary.
The CRF 3 comparison shows that Portugal did not follow the EU-26 aggregate reduction over 2005–2023. Because the FAOSTAT farm-gate inventory includes sources outside CRF 3 agriculture, the next table examines Portugal over the same observation period before comparing the two accounting boundaries.
Building on the CRF 3 benchmark in Table 2, Table 3 compares Portuguese FAOSTAT farm-gate and CRF 3 agricultural emissions over the common 2005–2023 period, distinguishing on-farm energy from the remaining farm-gate sources.
Table 3.
Common-period 2005–2023 emissions comparison under distinct accounting boundaries.
As shown in Table 3 above, the decline in Portuguese farm-gate emissions is partly driven by on-farm energy, which alone accounts for nearly half of the 2005–2023 reduction. Because agricultural fuel use is reported outside CRF 3 agriculture, the divergent trajectories cannot be interpreted as conflicting measurements of an identical sector total.
Table 3 also provides an exact arithmetic bridge between the two observed Portuguese totals. Their difference narrowed from 2746.27 kt CO2e in 2005 to 1776.19 kt CO2e in 2023, a change of −970.08 kt CO2e. The 443.62 kt CO2e fall in FAOSTAT on-farm energy accounts for 45.73% of this narrowing; the remaining 526.46 kt CO2e is the change in the difference between non-energy FAOSTAT sources and the CRF 3 total. This residual aggregates differences in category coverage, activity information and estimation conventions and cannot be interpreted as a separately measured physical-emissions change or attributed to any one accounting factor.
To interpret the inventory contrasts identified in Table 3, Table 4 maps the relevant FAOSTAT categories to the corresponding CRF reporting categories, distinguishing comparable source processes from categories assigned to different sectors.
Table 4.
Correspondence between FAOSTAT farm-gate emission sources and CRF 3 inventory categories.
As Table 4 illustrates, on-farm energy belongs to the energy-sector reporting structure rather than CRF 3 agriculture, whereas several FAOSTAT soil categories map collectively to the managed agricultural soils. Consequently, this crosswalk supports the interpretation of inventory boundaries but does not imply that category totals can be directly reconciled without harmonised source-level inputs.
Figure 4 compares the 2023 CRF 3 composition in Portugal and the EU-26, highlighting Portugal’s larger enteric-fermentation share.
Figure 4.
Composition of CRF 3 agricultural greenhouse gas emissions in Portugal and the EU-26, 2023. Categories are shown as shares of each inventory total. EU-26 denotes the EU-27 excluding Portugal. Source: Harmonised EEA/Eurostat CRF 3 Agriculture; the four categories comprise enteric fermentation, manure management, managed agricultural soils and other harmonised sources. The authors generated this figure using Python (version 3.13.5) and Matplotlib (version 3.10.8).
3.4. Non-Parametric Trend and Change-Point Results
Table 5 summarises the primary trend tests for total farm-gate emissions and the four largest 2023 source categories. It reports lag-1 persistence alongside Hamed–Rao significance tests, Sen slope estimates and exploratory Pettitt change points.
Table 5.
Non-parametric trend and change-point results for total Portuguese farm-gate emissions and the four largest individual 2023 sources, 1990–2023.
The primary results distinguish source categories exhibiting persistent monotonic changes from those whose endpoint changes do not correspond to a statistically supported trend after adjustment for serial dependence. The corresponding all-source sensitivity checks are presented in Table A1 and Table A2.
Total farm-gate emissions showed a significant decreasing trend under the Hamed–Rao modified Mann–Kendall test (τ = −0.426, corrected p = 0.0227; Benjamini–Hochberg q = 0.0458), with a Sen slope of −37.19 kt CO2e yr−1 (95% CI: −53.11 to −20.39). Manure management also showed a significant decreasing trend (τ = −0.476, corrected p = 0.0275; q = 0.0458; Sen slope = −7.73 kt CO2e yr−1), while synthetic fertilisers showed the strongest trend evidence among the source series (τ = −0.462, corrected p = 0.0037; q = 0.0187; Sen slope = −6.70 kt CO2e yr−1). Exploratory Pettitt diagnostics identified candidate shifts after 2001 for the total and after 2000 for manure management and synthetic fertilisers (all p < 0.001).
Enteric fermentation had a negative Sen slope (−8.26 kt CO2e yr−1; conventional 95% CI: −15.56 to −3.39), but the autocorrelation-adjusted monotonic trend was not significant (τ = −0.348, corrected p = 0.0909; q = 0.1136). The apparent difference between the conventional Sen confidence interval and the modified Mann–Kendall inference reflects the variance treatment described in Section 2.4; trend significance is based on the Hamed–Rao test. On-farm energy showed no monotonic trend (τ = −0.045, corrected p = 0.8087; q = 0.8087; Sen slope = −1.78 kt CO2e yr−1, 95% CI: −7.87 to 4.50), despite ending 8.61% above its 1990 level. Exploratory Pettitt diagnostics indicated candidate shifts after 2000 for enteric fermentation (p < 0.001) and after 2005 for on-farm energy (p = 0.0371; q = 0.0371).
The all-source sensitivity analysis in Table A1 retained significant decreasing trends after 11-source BH correction for manure management, synthetic fertilisers, manure applied to soils, manure left on pasture, crop residues, burning of crop residues, drained organic soils and savanna fires. Enteric fermentation (q = 0.1000), rice cultivation (q = 0.0721) and on-farm energy use (q = 0.8087) did not meet the 5% false-discovery-rate threshold under Hamed–Rao.
The TFPW robustness analysis in Table A2 preserved the trend direction for all 11 sources and again found no monotonic trend for on-farm energy use (q = 0.5457), but it classified enteric fermentation as significantly decreasing (q < 0.0001) and rice cultivation as significantly increasing (q = 0.0097). Accordingly, statistical significance for enteric fermentation and rice cultivation is method-sensitive, whereas the broader evidence of declining trends across manure-, fertiliser-, residue- and drained-organic-soil sources is robust to the alternative serial-correlation treatment. The sensitivity contrast therefore informs uncertainty in trend classification; it does not reverse the observed 2005–2023 source levels or justify attributing a specific annual shift to a climate-policy intervention.
4. Discussion
4.1. The Emission Profile Prioritises Direct GHG Control Before Removals
The source composition indicates that direct control of dominant emissions should remain the first mitigation priority. In the farm-gate dataset, enteric fermentation accounted for 39.19% of 2023 emissions, on-farm energy for 20.38% and manure management for 16.37%. Portuguese farm studies independently identify enteric fermentation and manure management as major dairy GHG sources, while energy use constitutes a separate mitigation domain [15,16,18,20]. These processes require source-specific interventions and cannot be physically eliminated by increasing SOC elsewhere. Table 6 turns the 2023 source ranking and original trend estimates into a source-to-intervention matrix, explicitly separating observed inventory magnitudes from measures whose efficacy has been estimated in different populations or experimental settings.
Table 6.
Linking the Portuguese 2023 source profile to source-specific mitigation and complementary removal pathways.
Carbon farming is therefore complementary rather than marginal. Soil and biomass management can increase carbon storage and, in some cases, reduce soil emissions while delivering agronomic co-benefits. The appropriate hierarchy is to reduce feasible gross emissions first and then add removals where they are agronomically justified and can be conservatively quantified against a credible baseline [2,3,4].
The CRF 3 comparison reinforces this conclusion. Enteric fermentation represented a larger share of Portuguese CRF 3 emissions than of the EU-26 aggregate in 2023. This does not establish a lower emissions efficiency, but it does show that enteric methane remains structurally important within Portugal’s agricultural inventory. Removals can complement this challenge; they should not be used to obscure the trajectory of gross emissions. A recent EU-27–Mercosur-4 comparison [22] similarly illustrates that country-group source compositions and absolute GHG trajectories describe distinct quantities; production denominators would be needed to interpret emission intensity. Without harmonised production, livestock, land-use or value-added denominators, the source shares cannot establish relative agricultural emissions intensities. The 2023 Eurostat livestock-density comparison (Portugal: 0.6 LSU/ha; EU-27: 0.7 LSU/ha) illustrates why a relatively high inventory share of enteric methane is not sufficient to rank production intensity or infer technological inefficiency [40].
The trend analysis adds a further qualification. The aggregate decline, and the decreases in manure management and synthetic fertilisers, remain statistically supported after serial-correlation correction and multiplicity adjustment. By contrast, the 11.18% endpoint decline in enteric fermentation does not correspond to a significant monotonic trend under the Hamed–Rao test. Likewise, the 8.61% endpoint increase in on-farm energy coexists with an insignificant monotonic slope. Pettitt candidate shifts cluster around 2000–2001 for several series and after 2005 for energy, but these dates are exploratory because the test does not correct for serial dependence; they should not be interpreted as policy-induced structural breaks without a separate attribution design.
Moreover, the all-source Hamed–Rao sensitivity family does not support a monotonic enteric-fermentation trend after 11-source multiplicity control, whereas TFPW does; rice cultivation is similarly non-significant under Hamed–Rao but significantly increasing under TFPW. These disagreements indicate a sensitivity to serial-correlation treatment and argue against basing policy attribution on the significance classification of either series alone. In contrast, the direction and significance of the main declines in manure management, synthetic fertilisers and several smaller source categories are stable across the two approaches. The aligned 2005–2023 evidence also changes the historical emphasis: on-farm energy is higher in 2023 than in 1990, but declined substantially from its 2005 level. Policy priorities should therefore refer to both the current source size and the baseline period, not to one endpoint difference as proof of consistent annual progress.
The empirical source ranking in Table 1 and the trend evidence in Table 5 provide the basis for the integrated source-to-intervention assessment in Table 6. The table differentiates measured Portuguese emission magnitudes from context-specific intervention evidence and the feasibility conditions of carbon-removal pathways.
The intervention matrix identifies livestock methane, manure, soil nitrogen and farm energy as distinct targets for gross-emission reductions. Carbon farming and biochar are considered separately because their potential net climate contributions depend on local conditions and verified storage rather than on the size of the current emissions inventory.
For interpretation of Table 6, a 1% change in enteric fermentation, on-farm energy, manure management and synthetic-fertiliser emissions corresponds, respectively, to 34.41, 17.90, 14.38 and 4.92 kt CO2e at the observed 2023 source levels. These figures indicate relative source scale only: a feasible intervention must first establish the fraction of emissions eligible for treatment, its empirically supported effect under Portuguese conditions and a net balance after associated emissions. For economic appraisal, incremental capital and operating costs, monitoring expenditure, avoided input costs and any revenues need to be compared with the resulting net tonnes of CO2e; no numerical cost-effectiveness ranking can be inferred solely from the emissions inventory. Methane reduction, nutrient efficiency and on-farm energy measures therefore remain distinct implementation decisions, while soil carbon and biochar are evaluated as additional removal pathways.
4.2. Where Carbon Farming Is Most Plausible in Portugal
The reviewed evidence is strongest for three Portuguese or Mediterranean contexts: permanent crops, grasslands and agroforestry. In vineyards and olive groves, inter-row management can alter biomass inputs, erosion and water dynamics. Mediterranean meta-analytic and field evidence shows that green covers, organic amendments and spontaneous cover can increase SOC or reduce erosion-related SOC losses under suitable conditions [26,27,28]. These effects are context-dependent rather than universal. For implementation, prioritise monitoring in water-limited vineyards and olive groves, carefully stratified pasture and montado projects, and sites where initial SOC and soil texture can be measured. Madeira’s farm-system typology [32] is an additional reminder that small-island land fragmentation and management heterogeneity complicate the transfer of a single national intervention factor.
Mediterranean water constraints must therefore be included in the climate assessment. A practice that increases SOC but materially reduces crop water availability or requires additional irrigation can have a smaller net climate and farm benefit than the SOC response alone suggests. Accounting should consider water, energy, N2O and productivity alongside carbon storage rather than crediting soil cover as an isolated action [26].
Montado and other agroforestry systems require separate calibration because trees, understorey, livestock and soil processes interact. Gómez-Rey et al. [30] found higher organic C under long-established improved pastures, particularly beneath oak canopies, whereas Rodrigues et al. [31] found no significant SOC-stock advantage for improved pasture over natural understorey in a different Alentejo setting. The contrast is informative: a practice label alone is insufficient for a national carbon factor.
For Portuguese carbon farming, this evidence supports stratified, measurement-anchored accounting in which climate, soil type, initial SOC, crop system, tree cover and management history are explicit. Models can reduce monitoring costs, but they should be calibrated and validated against appropriate measurements. This direction is consistent with the Commission-adopted July 2026 carbon-farming delegated act, as corrected in September 2026, which sets out activity-specific certification methodologies for agriculture and agroforestry on mineral soils [11].
4.3. Why Biochar May Offer an Accounting Advantage in the Portuguese Portfolio
Biochar has a different accounting profile from conventional SOC management. Its mass, carbon content and stability characteristics can be measured more directly than small changes in a large and spatially variable SOC stock. BCR is nevertheless not simple: full life-cycle accounting, sustainable sourcing, eligible storage and chain-of-custody requirements remain necessary [7,10].
Portugal-specific evidence directly demonstrates at least one agricultural residue pathway: Lustosa Filho et al. [36] produced biochar-based fertiliser materials from olive pomace. Wider BCR feedstock potential should not be inferred from gross residue production. A national assessment would need to determine which residues are sustainably mobilisable after accounting for existing roles in soil protection, nutrient recycling, feed, energy or other uses [6,7].
Recent Portuguese experiments support targeted agronomic pilots. Gholamahmadi et al. [34] reported lower runoff and erosion and higher infiltration and soil moisture in a Bairrada vineyard soil amended with woody biochar. Jongen et al. [35] reported higher pasture productivity at several sampling points after biochar application, with effects varying over time. These findings indicate potential adaptation and productivity co-benefits, but neither study estimates national durable CO2 removal. Climate accounting should therefore remain separate from agronomic performance.
A credible Portuguese BCR programme would require a territorial feedstock inventory, pyrolysis and energy balances, product-quality and carbon-stability controls, transport accounting and georeferenced eligible storage. Delegated Regulation (EU) 2026/285 provides the certification architecture; Portuguese pilots could supply local cost, logistics and performance data that are currently missing. A policy-screening sequence should therefore prioritise eligible local residues with documented competing uses, quantify stable stored carbon per production batch, subtract associated life-cycle emissions, and separately document any energy coproduct. A gross soil-improvement effect is neither a removal quantity nor a creditable revenue estimate.
4.4. MRV, Additionality, and Transaction Costs Are Likely to Determine Market Scale
An important constraint on agricultural carbon-market scale is the cost of moving from national or regional evidence to project-level crediting. Crediting requires activity data, baselines, monitoring and independent verification. Soil projects need statistically defensible measurement or validated models, while BCR additionally requires the traceability of feedstock, product and storage. These requirements create fixed costs that become more material at the small project scale [12,13].
Aggregation can reduce some of these fixed costs by standardising contracts, coordinating data collection and verification, and spreading MRV expenditure across participants. It also creates governance requirements concerning data ownership, revenue sharing, credit ownership, long-term obligations and interaction with public support. These issues should be explicit in programme design [8,13].
Economic claims should therefore focus on net rather than gross carbon revenue. As an illustrative project-level bookkeeping identity—not an equation estimated in this study—net carbon margin can be written as ΠC = PCQC − Cimpl − CMRV − Cver − Creg − Ctrans − Crisk, where PCQC is the gross carbon revenue and the remaining terms represent implementation, MRV, verification, registration, transaction and risk-reserve costs. The identity is included only to make the relevant cost categories explicit; empirical profitability requires project-specific prices, credited quantities and cost data. In practice, carbon revenue may form only one component of the farm business case alongside input efficiency, water and soil benefits, resilience and product value [13,51]. Complementary food-system research in Portugal [52] demonstrates why a weighted food-related carbon-pressure proxy must not be interpreted as a measured greenhouse-gas inventory or a causal emissions effect. Consumer-side proxies and farm-gate territorial inventories answer different questions and cannot serve as interchangeable production-denominators.
4.5. An Integrated Agricultural GHG Mitigation-And-Removal Framework
Figure 5 illustrates the decision-making framework linking agricultural emission sources to the mitigation and carbon-removal strategies presented in Table 6. The framework integrates emission magnitude, historical trends, technical feasibility, expected net climate benefits, and monitoring and verification requirements to guide the prioritisation and implementation of appropriate interventions.
Figure 5.
Integrated framework linking the Portuguese agricultural GHG profile to direct emissions control, carbon farming, Biochar Carbon Removal (BCR) and the assessment of potential climate outcomes. The conceptual framework links the source profile to intervention selection and the assessment of carbon integrity; it does not estimate project-level effects. The source shares in the first panel refer to the eleven-source FAOSTAT farm-gate total; the seven remaining categories are grouped as “other sources”. The figure was created by the authors using Python (version 3.13.5), the Matplotlib library (version 3.10.8) and ChaptGPT (version GPT-6 Astra).
4.6. Implementation and Policy Implications
Portugal now has overlapping national and EU frameworks relevant to agricultural carbon projects. Decree-Law No. 4/2024 establishes the national Voluntary Carbon Market, while Regulation (EU) 2024/3012 establishes the CRCF quality and certification framework. Delegated Regulation (EU) 2026/285 is in force for permanent-removal methodologies including BCR. The Commission also adopted carbon-farming methodologies for agriculture and agroforestry on mineral soils, peatland and other organic-soil restoration, and afforestation on 9 July 2026; that delegated act was corrected on 3 September 2026 [10,11]. These instruments should therefore be cited and interpreted according to their specific procedural status rather than treated as a single undifferentiated rule set. The policy task is to connect certification tools to source-specific mitigation without treating removals as substitutes for feasible gross-emission reductions.
The first implementation priority is accounting discipline. National inventory emissions, farm or product footprints, and creditable project outcomes are different quantities. A decline in a national category is not itself a project credit, and adoption of a cover crop or biochar application is not itself a credit. Crediting requires a verified, additional and conservatively quantified net difference relative to the applicable baseline after relevant emissions and uncertainty are accounted for.
A second priority is interoperable agricultural MRV. Project implementation would benefit from systems that can link parcel information, farm activity records, livestock and fertiliser data, energy use, soil measurements and remote-sensing products where methodologically appropriate. Shared reference data and long-term monitoring networks could reduce duplication while improving calibration and comparability across projects. Recent field evidence further shows that measurement frequency and spatial replication can affect season-long CO2, CH4, N2O and global-warming-potential estimates across agroecosystems, underscoring that MRV quality depends on sampling design as well as measurement technology [53].
A third priority is demonstration across contrasting Portuguese production systems rather than adoption of a single national practice factor. Vineyard, olive, grassland and montado projects should be evaluated under locally relevant soil, climate, water and management conditions. BCR pilots should also test biomass sourcing, conversion, transport, useful energy recovery where applicable, and final eligible storage as one integrated life-cycle system.
A fourth priority is aggregation with transparent value sharing. Aggregated programmes can reduce fixed certification and verification costs, but contracts should disclose project-management fees, verification costs, risk buffers and the net share of revenues or benefits allocated to participating farmers. Clear governance is necessary for durable participation.
Finally, non-carbon co-benefits should be measured separately rather than converted indiscriminately into CO2-equivalents. Water retention, erosion control, soil fertility, biodiversity and resilience can strengthen the value of a project, but they require their own indicators and should not be used to inflate the quantified carbon outcome.
Figure 6 presents an integrated framework for implementing agricultural mitigation and carbon-removal strategies in Portugal, linking regulatory requirements, carbon accounting and monitoring, reporting and verification (MRV), locally adapted agricultural practices, and the assessment of project-level climate outcomes. The framework highlights the institutional, methodological, and operational conditions necessary to translate mitigation and carbon-removal opportunities into credible and verifiable climate benefits.
Figure 6.
Implementation pathway from Portuguese and EU carbon-policy frameworks to implementation requirements, agricultural actions and credible project outcomes. The framework synthesises Portugal’s Voluntary Carbon Market and the EU carbon-removal certification architecture, including implementation and verification requirements [8,9,10,11]. The figure was created by the authors using Python (version 3.13.5), the Matplotlib library (version 3.10.8) and ChaptGPT (version GPT-6 Astra).
4.7. Limitations and Research Agenda
The study has four main limitations. First, FAOSTAT farm-gate and CRF 3 data use different accounting boundaries and are employed for complementary purposes; differences between them should not be interpreted as measurement error or combined into a single total. Both source databases can be revised retrospectively, so exact replication should record the extraction date and dataset version used. Second, national series identify where emissions occur but do not establish the causal drivers of annual changes and are not normalised by the agricultural output, livestock numbers, land area or value added; the results therefore describe absolute inventory trajectories rather than the emissions intensity or technical efficiency. The modified Mann–Kendall and Sen analyses describe temporal patterns rather than causation, and Pettitt change points remain exploratory because the standard test does not explicitly adjust for serial dependence. For 2005–2023, changes in FAOSTAT farm-gate emissions are decomposed by emission source, while the CRF 3 series provides a complementary aggregate benchmark. Differences between the two emission trajectories are interpreted considering their distinct accounting boundaries, sectoral coverage, and estimation methodologies, without attributing the observed divergence to specific accounting factors.
Third, the literature synthesis is integrative and purposive rather than systematic. The reviewed studies identify the mechanisms, effect heterogeneity and implementation constraints, but they do not provide a basis for assigning a single Portuguese national SOC factor. The contrasting pasture and montado results illustrate this limitation directly.
Fourth, the study does not estimate a national BCR supply curve or tradable-credit volume. Such an estimate would require spatially explicit information on sustainably mobilisable residues, competing uses, moisture and transport, pyrolysis yields, biochar carbon content and stability, plant efficiency, energy coproducts, counterfactual biomass fate and final-use constraints. Treating gross residue production as available BCR feedstock would overstate the opportunity.
A priority extension is therefore a spatially explicit Portuguese BCR scenario model. For feedstock i, sustainably mobilisable biomass can be represented as Bmob,i = Btotal,i × fmob,i; biochar output as BCi = Bmob,i × YBC,i; and net carbon removal as CO2rem,i = BCi × Ci × Fstable,i × 44/12 − ELC,i. Low, central and high scenarios should vary mobilisation, pyrolysis yield, carbon fraction, stability and life-cycle emissions. Initial applications should focus on residue streams for which current uses and sustainable mobilisation can be documented, including olive-pomace pathways already examined in Portugal.
A second extension is project-level economic modelling. Net farm value should combine carbon revenue with changes in fertiliser, energy and water use, soil losses, yields, capital and financing costs, and MRV expenditure. This would distinguish projects for which carbon revenue is material from those in which agronomic co-benefits dominate the investment case.
5. Conclusions
Portugal’s agricultural GHG profile remains concentrated in sources requiring direct emissions control. Enteric fermentation, on-farm energy use and manure management jointly accounted for 75.95% of the analysed farm-gate emissions in 2023. Total farm-gate emissions were 14.36% lower than in 1990, and the Hamed–Rao test identified a significant decreasing aggregate trend (τ = −0.426, corrected p = 0.0227; q = 0.0458; Sen slope = −37.19 kt CO2e yr−1). Significant declines were also observed for manure management and synthetic fertilisers. By contrast, enteric fermentation did not show a significant monotonic decline after correction for serial dependence, while on-farm energy showed no monotonic trend and remained 8.61% above its 1990 level. Under the distinct CRF 3 boundary, Portuguese agricultural emissions increased by 0.81% between 2005 and 2023, whereas the EU-26 declined by 6.97%. These findings indicate that progress has been uneven across emission sources. Over the aligned 2005–2023 period, FAOSTAT farm-gate emissions fell by 914.11 kt CO2e (9.43%) while the distinct CRF 3 total rose by 55.97 kt CO2e (0.81%); on-farm energy accounted for 443.62 kt CO2e of the FAOSTAT reduction in this interval. Different inventory scopes preclude the interpretation of the 10.24 percentage-point difference as a harmonised accounting effect. In the common-period descriptive reconciliation, the FAOSTAT–CRF 3 total difference narrowed by 970.08 kt CO2e; the change in FAOSTAT on-farm energy accounts arithmetically for 443.62 kt CO2e of that amount, with the remaining 526.46 kt CO2e reflecting the non-energy FAOSTAT–CRF 3 residual. This partition does not establish a complete category-matched inventory reconciliation.
The main policy implication is that direct GHG reduction should remain the priority, with carbon removal used as a complement. In Portugal, this means continued attention to enteric CH4, manure-related emissions, nutrient management and fossil-energy use. Carbon-farming strategies should be locally calibrated rather than based on uniform national sequestration factors, particularly across vineyards, olive systems, grasslands and montado, where SOC responses depend on soil, climate, water availability and management history. The integrated intervention matrix prioritises enteric fermentation by present magnitude, while retaining manure, nutrient and energy interventions according to their source-specific mechanisms, maturity of evidence and local feasibility; published percentage effects are not assumed to apply uniformly to Portuguese farms.
BCR provides a complementary durable-removal pathway and may also be integrated with useful energy production. Pyrolysis can produce biochar together with heat, electricity or other energy co-products, potentially improving the economic performance of projects where sustainably mobilisable residues are available. However, energy generation and carbon removal should be accounted for separately. Removal claims should reflect only the biogenic carbon durably stored after accounting for feedstock sourcing, competing uses, transport, processing, pyrolysis emissions and eligible final storage. Portuguese demonstration projects should therefore evaluate integrated biochar–energy systems using full life-cycle accounting and the transparent treatment of energy co-products.
These findings are also relevant to Portugal’s Voluntary Carbon Market and the EU CRCF. National inventory reductions, farm-level mitigation and project-level carbon credits are different accounting outcomes. Carbon credits should therefore be based on additional and verified net effects relative to credible baselines, supported by a robust MRV, the appropriate treatment of uncertainty and permanence, and life-cycle accounting where relevant. Aggregated programmes may reduce MRV and verification costs for smaller farms, but transparent governance and revenue-sharing arrangements remain necessary.
The study has several limitations. FAOSTAT farm-gate and CRF 3 data use different accounting boundaries and should not be combined into a single emissions total. The time-series analysis identifies temporal patterns but does not establish their causal drivers, and Pettitt change points remain exploratory. The analysis considers absolute national emissions rather than emissions intensity, while the literature synthesis is integrative rather than systematic. The study also does not estimate a national BCR supply curve, economically viable removal potential or project-level abatement costs.
Future research should therefore examine the drivers of source-specific emission trends, including livestock numbers, agricultural output, fertiliser use, energy consumption, technology and policy changes. Spatially explicit studies are also needed to establish locally calibrated carbon-farming baselines and SOC responses across Portuguese production systems. For BCR, future work should combine sustainable residue availability, competing uses, pyrolysis performance, transport, biochar stability and life-cycle emissions to estimate credible removal scenarios. Integrated biochar–energy systems should also be evaluated to determine where energy recovery can improve project viability without reducing durable carbon storage or creating double-counting. Finally, the project-level economic analysis should incorporate implementation, MRV, verification, financing and transaction costs alongside carbon revenue and agronomic co-benefits.
Funding
This research was funded by national funds through FCT—Fundação para a Ciência e a Tecnologia, I.P., under the strategic funding of the University of Coimbra Institute for Legal Research (UCILeR), project UIDB/04643/2025 with DOI: (https://doi.org/10.54499/UID/04643/2025).
Institutional Review Board Statement
Not applicable. This study used aggregate secondary data and did not involve human participants or animals.
Informed Consent Statement
Not applicable. This study did not involve human participants.
Data Availability Statement
Publicly available datasets were analysed in this study. Portuguese farm-gate greenhouse gas emissions were obtained from the FAOSTAT Emissions Totals (GT) database using the element “Emissions (CO2eq) (AR5)” for 1990–2023 (https://www.fao.org/faostat/en/#data/GT) (accessed on 9 October 2026). Harmonised agricultural greenhouse gas emissions under the CRF 3 inventory boundary were obtained from Eurostat/European Environment Agency sources, including “Greenhouse gas emissions by source sector” (env_air_gge; https://doi.org/10.2908/ENV_AIR_GGE).
Acknowledgments
During the preparation of this manuscript, the author used Grammarly (version 1.2.96.1473) solely for language and grammatical editing and ChatGPT (GPT-6 Astra) was used to develop conceptual of Figure 1, Figure 5 and Figure 6. All quantitative analyses and data-derived visualizations were produced and verified by the author using the analytical procedures and software reported in the manuscript. The author takes full responsibility for the content of this publication.
Conflicts of Interest
The authors declare no conflict of interest.
Abbreviations
The following abbreviations are used in this manuscript:
| BCR | Biochar Carbon Removal |
| CH4 | Methane |
| CO2 | Carbon dioxide |
| CO2e | Carbon dioxide equivalent |
| CRCF | Carbon Removals and Carbon Farming Certification Framework |
| CRF | Common Reporting Format |
| EEA | European Environment Agency |
| EU | European Union |
| FAO | Food and Agriculture Organization of the United Nations |
| GHG | Greenhouse gas |
| MRV | Monitoring, reporting and verification |
| N2O | Nitrous oxide |
| SOC | Soil organic carbon |
Appendix A
Figure A1.
Annual farm-gate greenhouse gas emissions in Portugal, 1990–2023. The series peaks in 2000 and ends 14.36% below its 1990 level. Source: FAOSTAT Emissions Totals (GT); annual totals comprise eleven selected farm-gate emission sources and are expressed in kt CO2e. The authors created this figure using R 4.6.1 in RStudio 2026.07.0.
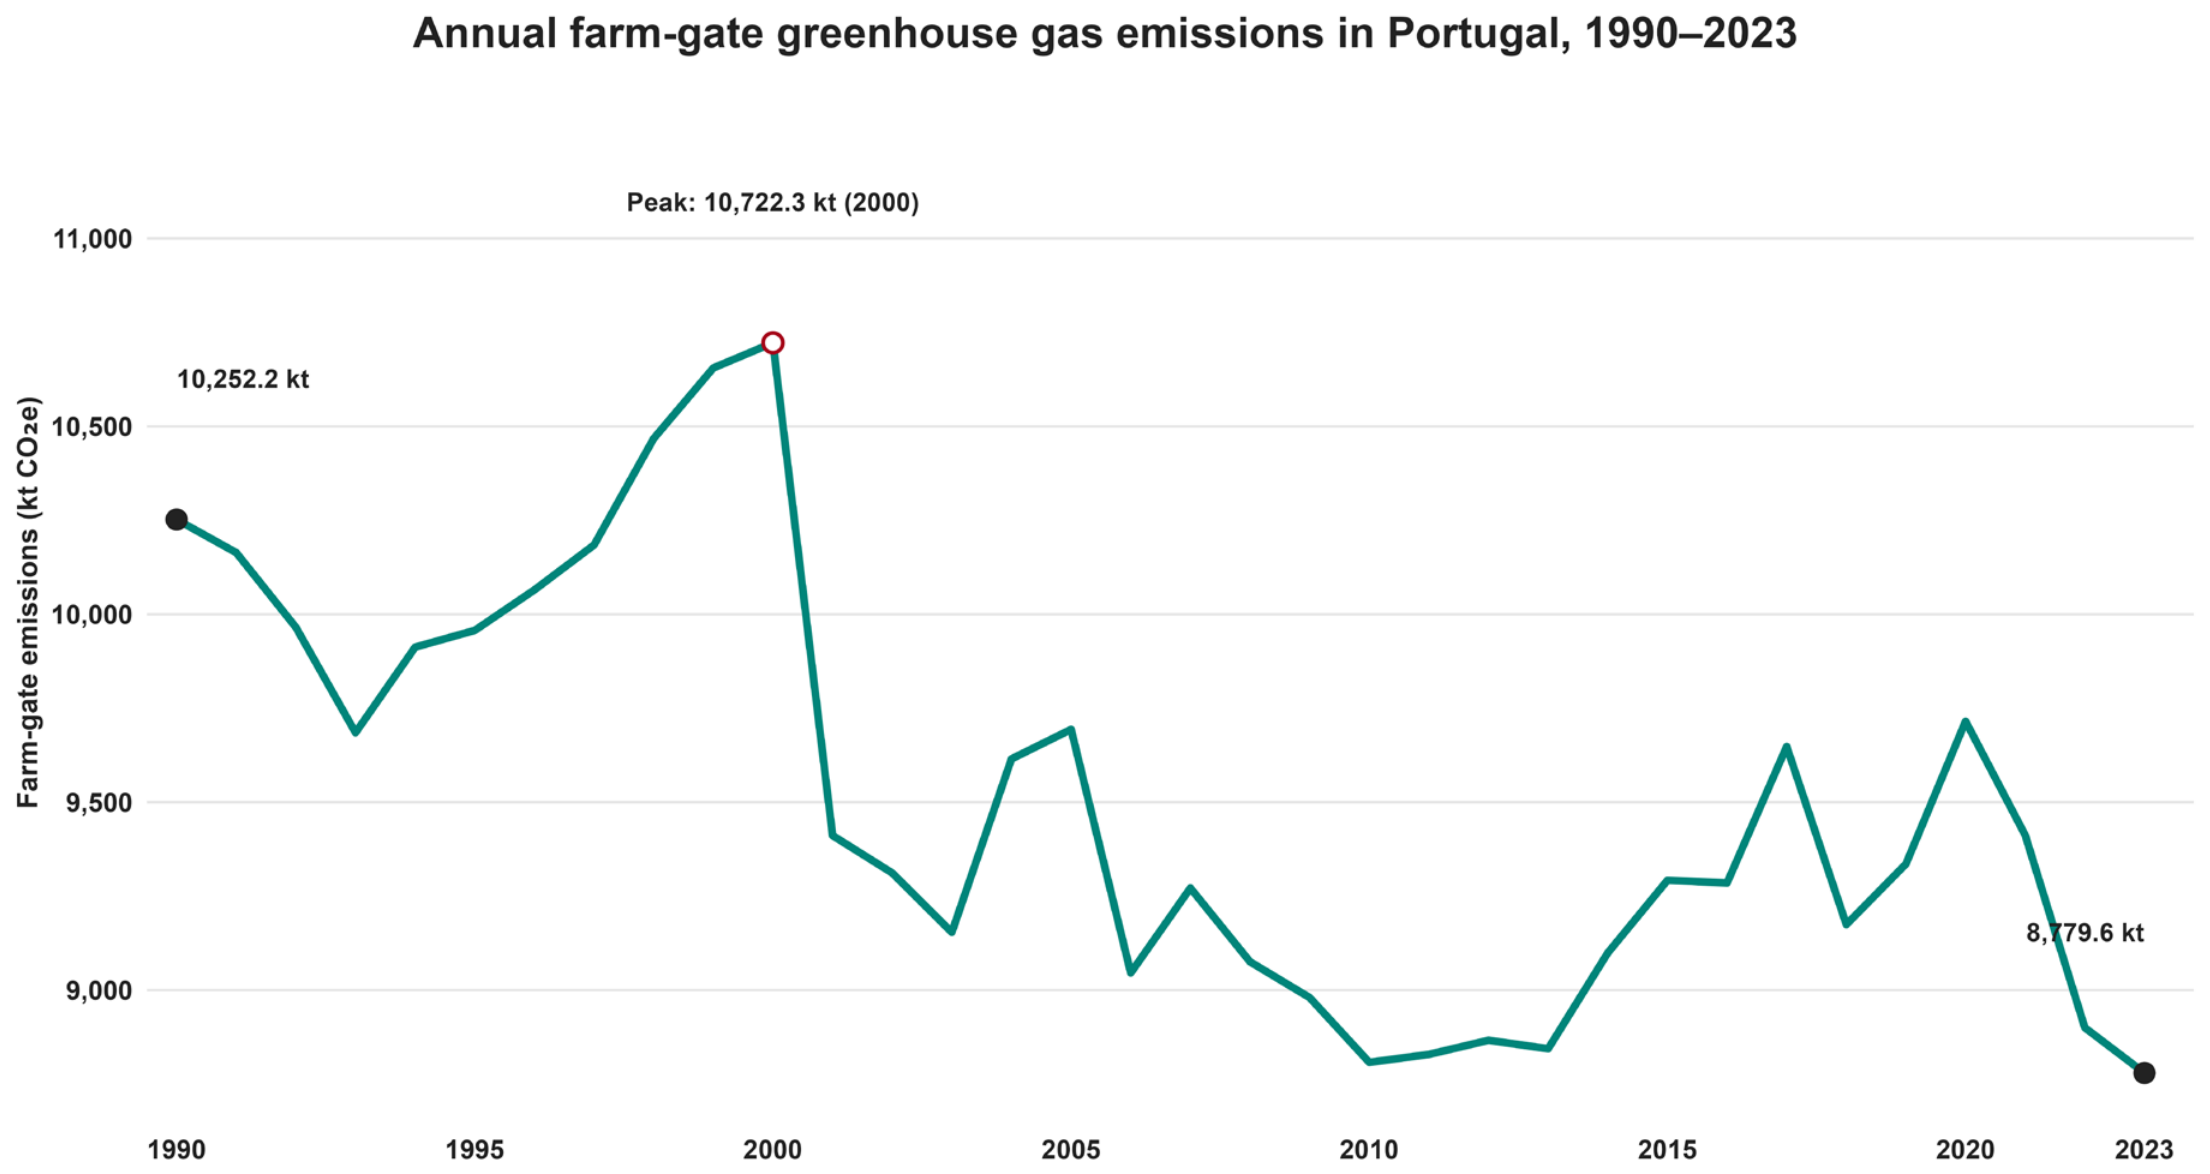
Figure A2.
Indexed trajectories of the five largest Portuguese farm-gate emission sources in 2023, 1990–2023 (1990 = 100). Each source is independently indexed to its 1990 level; vertical scales differ between panels. Source: FAOSTAT Emissions Totals (GT). The authors created this figure using R 4.6.1 in RStudio 2026.07.0.
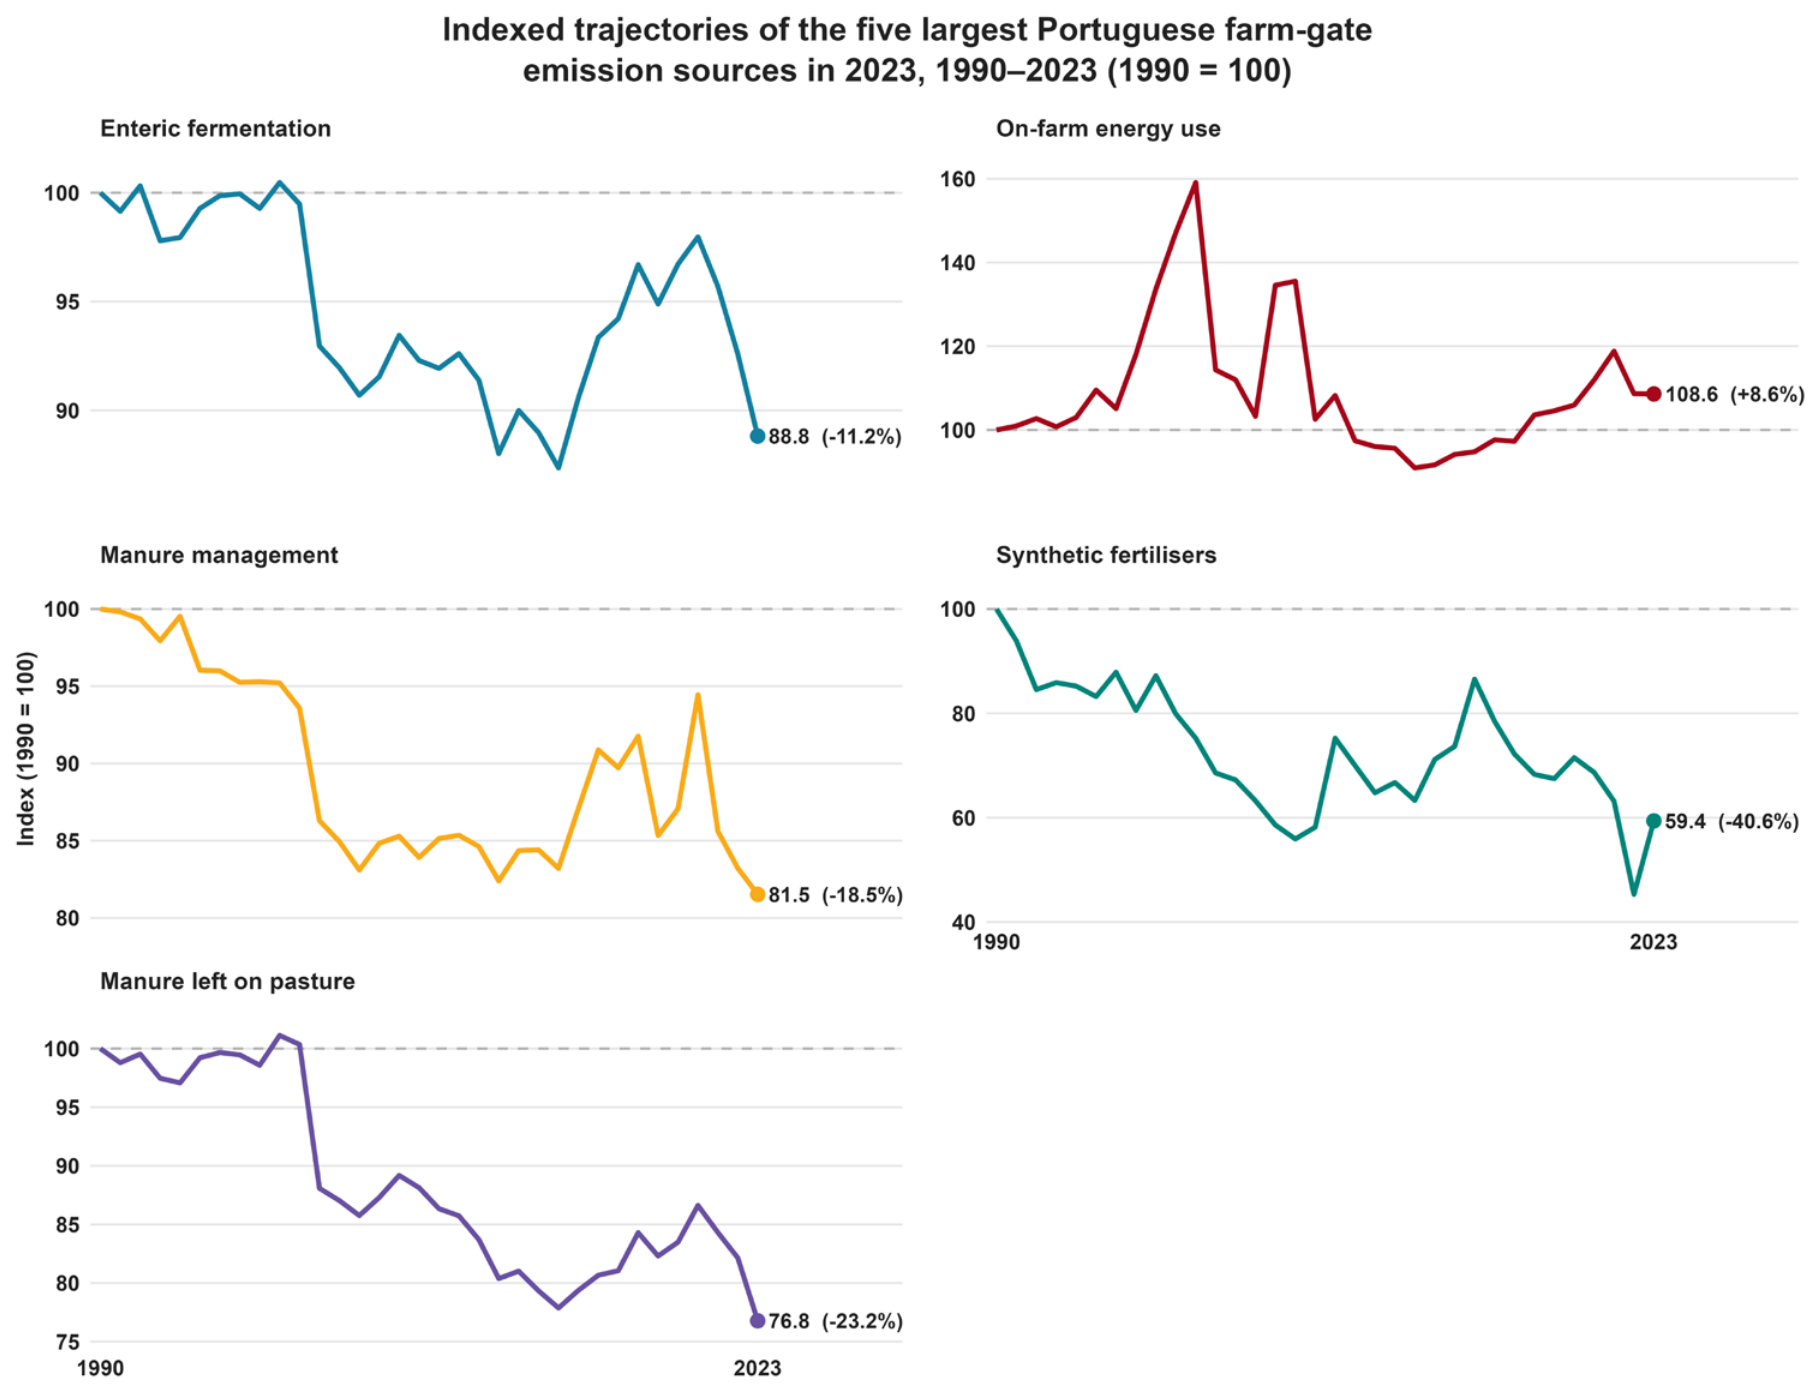
Figure A3.
Composition of Portuguese farm-gate emissions by broad source group, 2023. Livestock and manure account for 65.48% and on-farm energy for 20.38% of the total. Source: FAOSTAT Emissions Totals (GT); group contributions are calculated relative to the eleven-source farm-gate total. The authors created this figure using R 4.6.1 in RStudio 2026.07.0.
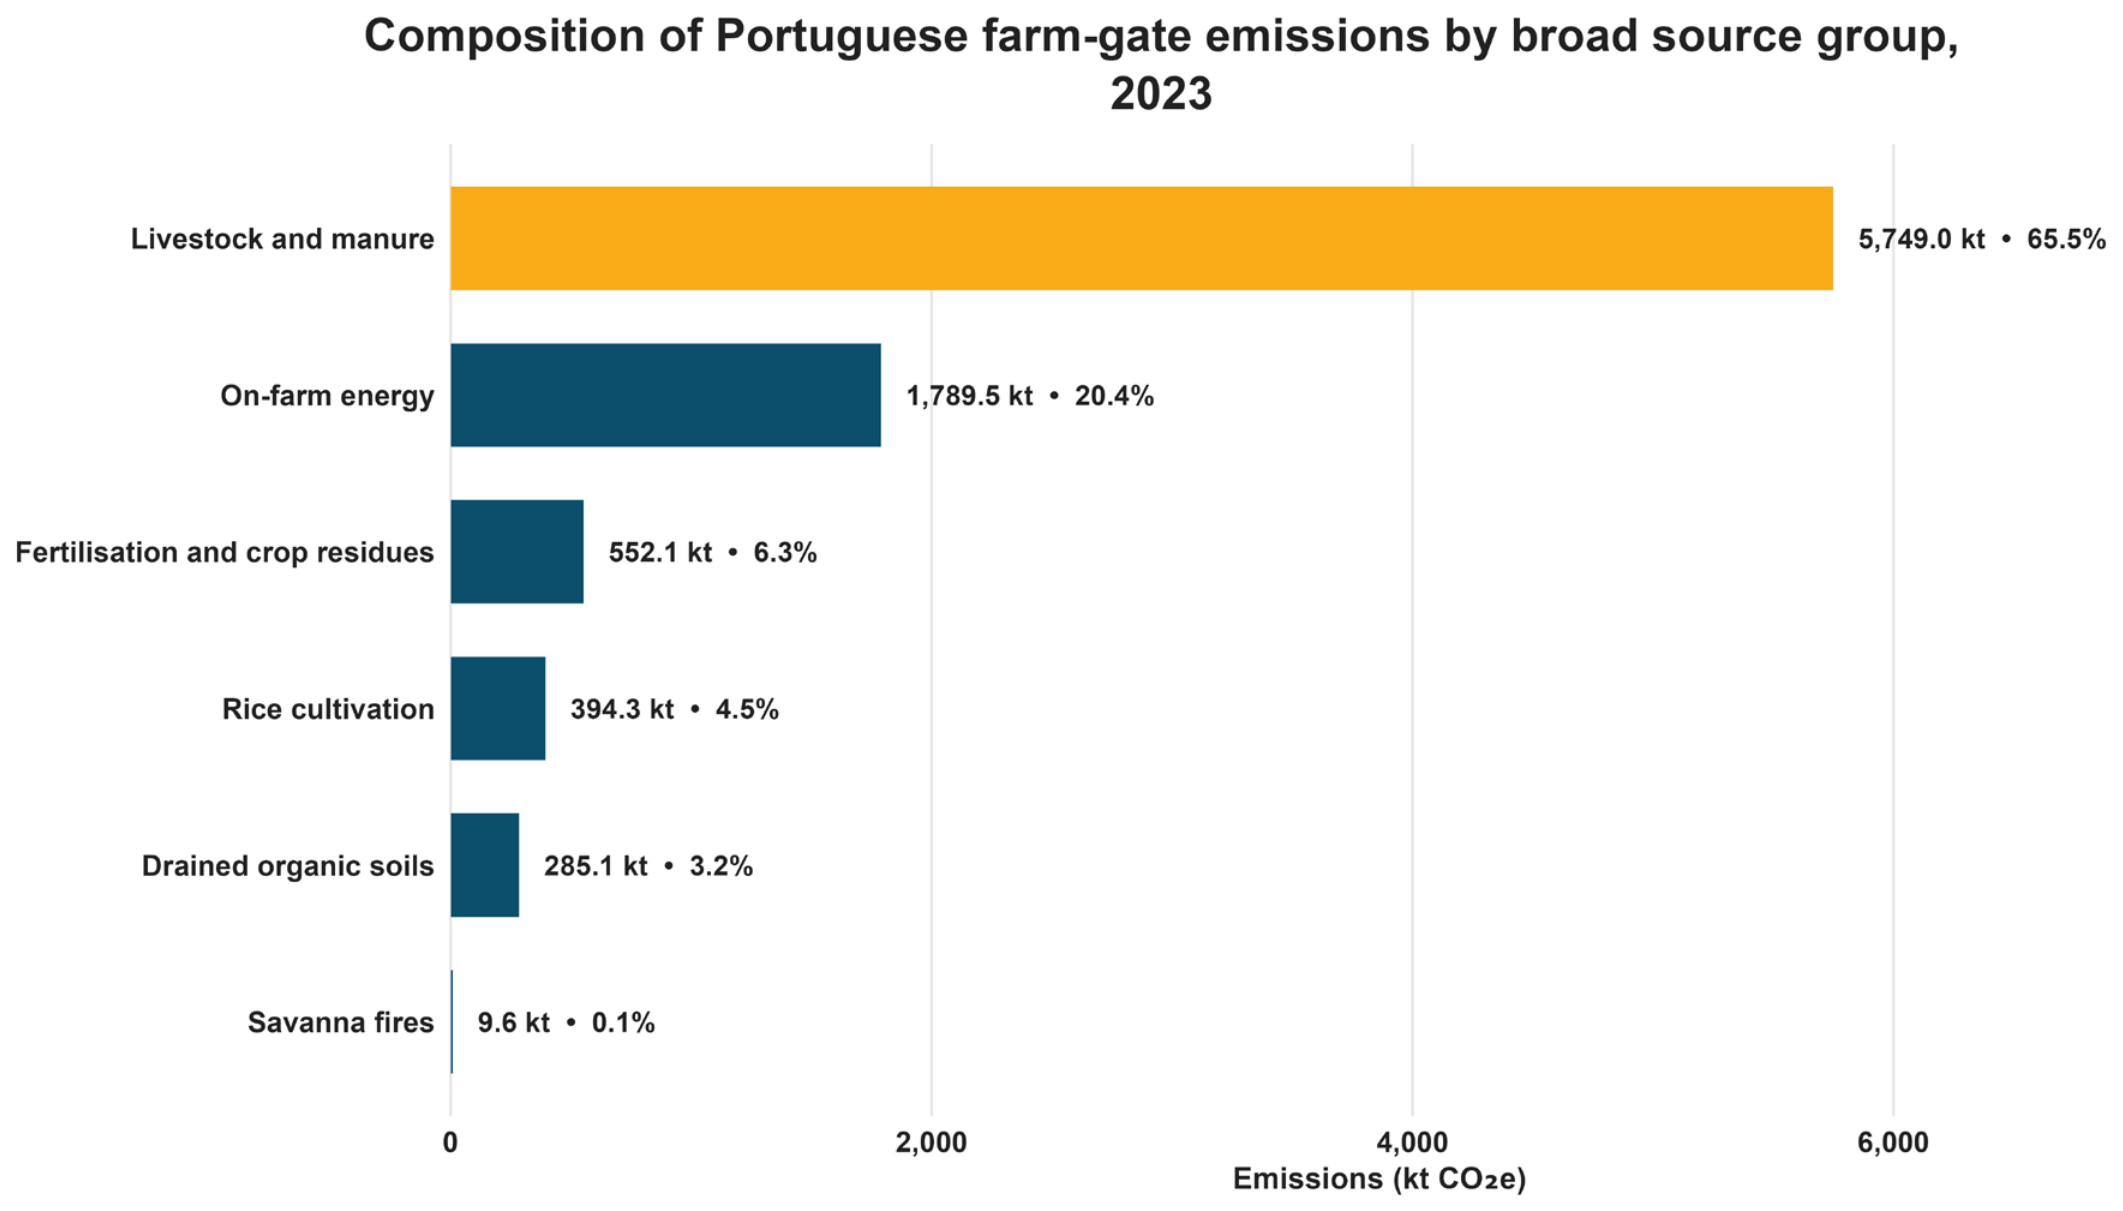
Figure A4.
Indexed CRF 3 agricultural greenhouse gas emissions for Portugal and the EU-26, 2005–2023 (2005 = 100). Portugal ends 0.81% above its 2005 level, while the EU-26 ends 6.97% below. Each trajectory is indexed separately to 2005 = 100. EU-26 denotes EU-27 excluding Portugal. Source: harmonised EEA/Eurostat CRF 3 Agriculture. The authors created this figure using R 4.6.1 in RStudio 2026.07.0.
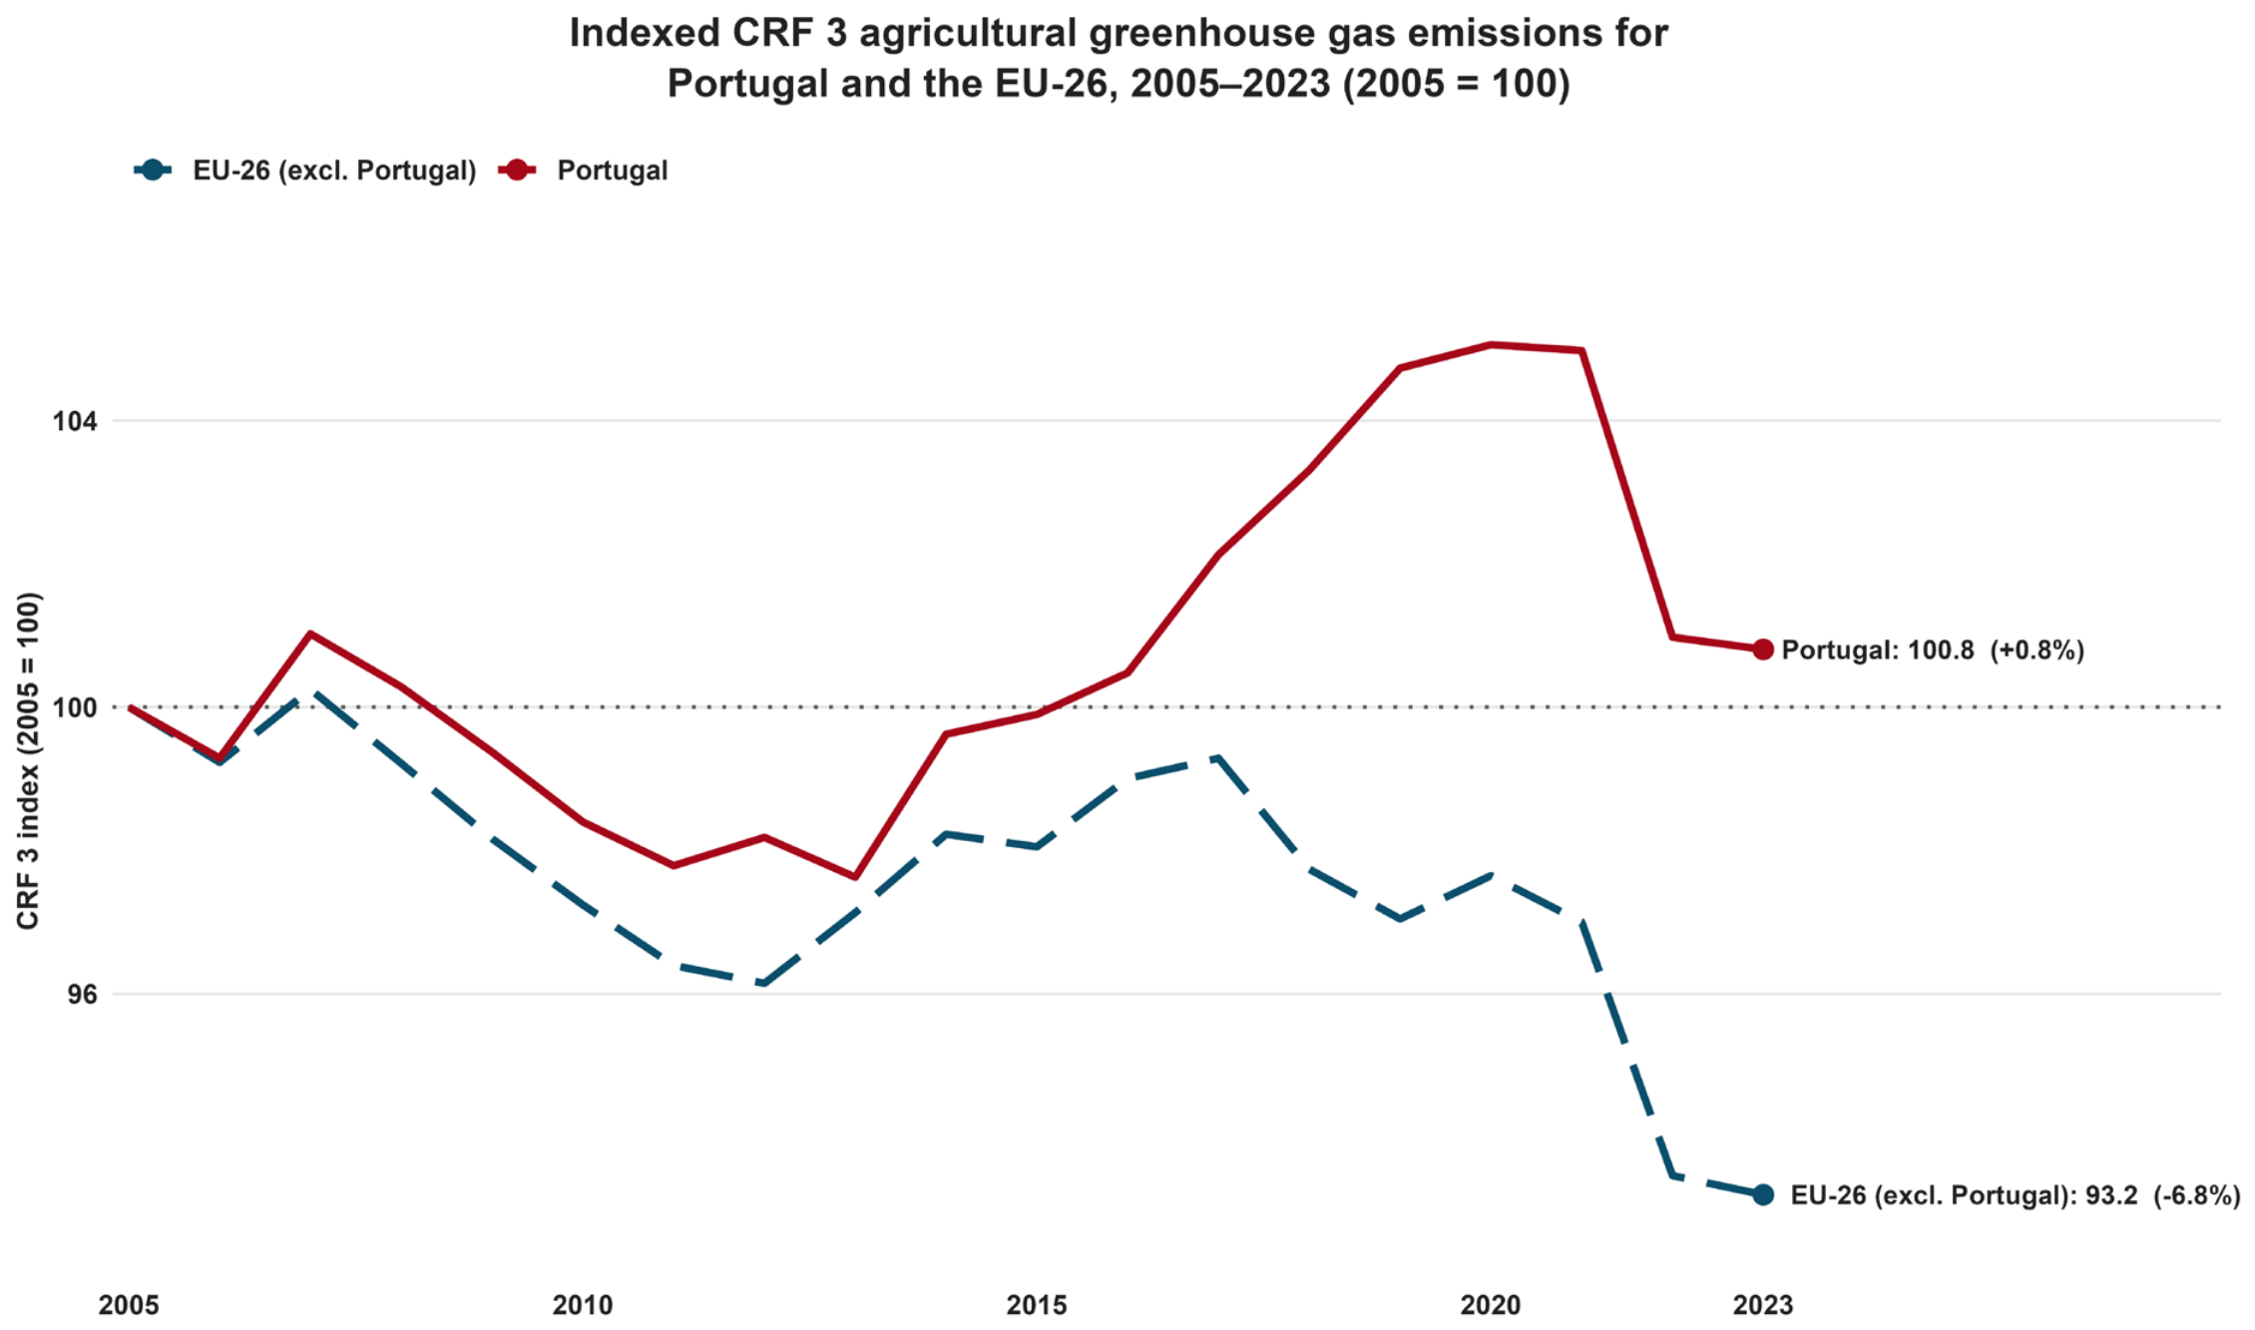
Table A1.
Sensitivity analysis applying Hamed–Rao modified Mann–Kendall inference to all 11 individual Portuguese farm-gate emission sources, 1990–2023.
Table A2.
Trend-free pre-whitening robustness analysis for all 11 individual Portuguese farm-gate emission sources, 1990–2023.
Table A3.
Source-level absolute and percentage changes in Portuguese FAOSTAT farm-gate emissions, 2005–2023.
References
- Nabuurs, G.-J.; Mrabet, R.; Abu Hatab, A.; Bustamante, M.; Clark, H.; Havlík, P.; House, J.I.; Mbow, C.; Ninan, K.N.; Popp, A.; et al. Agriculture, Forestry and Other Land Uses (AFOLU). In Climate Change 2022: Mitigation of Climate Change. Contribution of Working Group III to the Sixth Assessment Report of the Intergovernmental Panel on Climate Change; Shukla, P.R., Skea, J., Slade, R., Al Khourdajie, A., van Diemen, R., McCollum, D., Pathak, M., Some, S., Vyas, P., Fradera, R., et al., Eds.; Cambridge University Press: Cambridge, UK, 2022. [Google Scholar] [CrossRef] [Scilit]
- Babiker, M.; Berndes, G.; Blok, K.; Cohen, B.; Cowie, A.; Geden, O.; Ginzburg, V.; Leip, A.; Smith, P.; Sugiyama, M.; et al. Cross-sectoral perspectives. In Climate Change 2022: Mitigation of Climate Change. Contribution of Working Group III to the Sixth Assessment Report of the Intergovernmental Panel on Climate Change; Shukla, P.R., Skea, J., Slade, R., Al Khourdajie, A., van Diemen, R., McCollum, D., Pathak, M., Some, S., Vyas, P., Fradera, R., et al., Eds.; Cambridge University Press: Cambridge, UK, 2022. [Google Scholar] [CrossRef] [Scilit]
- Paustian, K.; Lehmann, J.; Ogle, S.; Reay, D.; Robertson, G.P.; Smith, P. Climate-smart soils. Nature 2016, 532, 49–57. [Google Scholar] [CrossRef] [Scilit] [PubMed]
- Smith, P.; Soussana, J.-F.; Angers, D.; Schipper, L.; Chenu, C.; Rasse, D.P.; Batjes, N.H.; van Egmond, F.; McNeill, S.; Kuhnert, M.; et al. How to measure, report and verify soil carbon change to realize the potential of soil carbon sequestration for atmospheric greenhouse gas removal. Glob. Change Biol. 2020, 26, 219–241. [Google Scholar] [CrossRef] [Scilit] [PubMed]
- EEA—European Environment Agency. Greenhouse Gas Emissions from Agriculture in Europe; European Environment Agency: Copenhagen, Denmark, 2026; Available online: https://www.eea.europa.eu/en/analysis/indicators/greenhouse-gas-emissions-from-agriculture (accessed on 9 October 2026).
- Woolf, D.; Amonette, J.E.; Street-Perrott, F.A.; Lehmann, J.; Joseph, S. Sustainable biochar to mitigate global climate change. Nat. Commun. 2010, 1, 56. [Google Scholar] [CrossRef] [Scilit] [PubMed]
- Lehmann, J.; Cowie, A.; Masiello, C.A.; Kammann, C.; Woolf, D.; Amonette, J.E.; Cayuela, M.L.; Camps-Arbestain, M.; Whitman, T. Biochar in climate change mitigation. Nat. Geosci. 2021, 14, 883–892. [Google Scholar] [CrossRef] [Scilit]
- Portugal. Decreto-Lei n.º 4/2024, de 5 de Janeiro: Institui o Mercado Voluntário de Carbono e Estabelece as Regras para o seu Funcionamento, 1.ª série, n.º 4; Diário da República: Lisboa, Portugal, 2024. [Google Scholar]
- European Parliament and Council. Regulation (EU) 2024/3012 of 27 November 2024 establishing a Union certification framework for permanent carbon removals, carbon farming and carbon storage in products. Off. J. Eur. Union 2024, L 3012. [Google Scholar]
- European Commission. Commission Delegated Regulation (EU) 2026/285 of 3 February 2026 supplementing Regulation (EU) 2024/3012 by establishing the certification methodologies for permanent carbon removals activities. Off. J. Eur. Union 2026, L 285. [Google Scholar]
- European Commission. Commission Delegated Regulation of 9 July 2026 Supplementing Regulation (EU) 2024/3012 by Establishing Certification Methodologies for Carbon Farming Activities, C(2026) 4666 Final, Corrected by C(2026) 6304 Final of 3 September 2026. EUR-Lex. Available online: https://eur-lex.europa.eu/legal-content/EN/TXT/?uri=intcom:C%282026%294666 (accessed on 9 October 2026).
- Paul, C.; Bartkowski, B.; Dönmez, C.; Don, A.; Mayer, S.; Steffens, M.; Weigl, S.; Wiesmeier, M.; Wolf, A.; Helming, K. Carbon farming: Are soil carbon certificates a suitable tool for climate change mitigation? J. Environ. Manag. 2023, 330, 117142. [Google Scholar] [CrossRef] [Scilit] [PubMed]
- Raina, N.; Zavalloni, M.; Viaggi, D. Incentive mechanisms of carbon farming contracts: A systematic mapping study. J. Environ. Manag. 2024, 352, 120126. [Google Scholar] [CrossRef] [Scilit] [PubMed]
- Forster, P.; Storelvmo, T.; Armour, K.; Collins, W.; Dufresne, J.-L.; Frame, D.; Lunt, D.J.; Mauritsen, T.; Palmer, M.D.; Watanabe, M.; et al. The Earth’s energy budget, climate feedbacks, and climate sensitivity. In Climate Change 2021: The Physical Science Basis. Contribution of Working Group I to the Sixth Assessment Report of the Intergovernmental Panel on Climate Change; Masson-Delmotte, V., Zhai, P., Pirani, A., Connors, S.L., Péan, C., Berger, S., Caud, N., Chen, Y., Goldfarb, L., Gomis, M.I., et al., Eds.; Cambridge University Press: Cambridge, UK, 2021; pp. 923–1054. [Google Scholar] [CrossRef] [Scilit]
- Castanheira, É.G.; Dias, A.C.; Arroja, L.; Amaro, R. The environmental performance of milk production on a typical Portuguese dairy farm. Agric. Syst. 2010, 103, 498–507. [Google Scholar] [CrossRef] [Scilit]
- Pereira, J.; Trindade, H. Short communication: Impact of the intensity of milk production on ammonia and greenhouse gas emissions in Portuguese cattle farms. Span. J. Agric. Res. 2015, 13, e06SC05. [Google Scholar] [CrossRef] [Scilit]
- Almeida, A.K.; Hegarty, R.S.; Cowie, A. Meta-analysis quantifying the potential of dietary additives and rumen modifiers for methane mitigation in ruminant production systems. Anim. Nutr. 2021, 7, 1219–1230. [Google Scholar] [CrossRef] [Scilit] [PubMed]
- Morais, T.G.; Teixeira, R.F.M.; Rodrigues, N.R.; Domingos, T. Carbon footprint of milk from pasture-based dairy farms in Azores, Portugal. Sustainability 2018, 10, 3658. [Google Scholar] [CrossRef] [Scilit]
- Mourão, P.R.; Martinho, V.D. Portuguese agriculture and the evolution of greenhouse gas emissions—Can vegetables control livestock emissions? Environ. Sci. Pollut. Res. 2017, 24, 16107–16119. [Google Scholar] [CrossRef] [Scilit] [PubMed]
- IRENA FAO. Renewable Energy for Agri-Food Systems: Towards the Sustainable Development Goals and the Paris Agreement; International Renewable Energy Agency and Food and Agriculture Organization of the United Nations: Rome, Italy, 2021. [Google Scholar] [CrossRef] [Scilit]
- Akamati, K.; Laliotis, G.P.; Bizelis, I. Greenhouse Gas Emissions of the Poultry Sector in Greece and Mitigation Potential Strategies. Gases 2023, 3, 47–56. [Google Scholar] [CrossRef] [Scilit]
- Koengkan, M. Diverging Agricultural Greenhouse Gas Emissions and Partial Convergence of Source Structures Across the EU-27 and Mercosur-4. Gases 2026, 6, 51. [Google Scholar] [CrossRef] [Scilit]
- Wiesmeier, M.; Urbanski, L.; Hobley, E.; Lang, B.; von Lützow, M.; Marin-Spiotta, E.; van Wesemael, B.; Rabot, E.; Ließ, M.; Garcia-Franco, N.; et al. Soil organic carbon storage as a key function of soils—A review of drivers and indicators at various scales. Geoderma 2019, 333, 149–162. [Google Scholar] [CrossRef] [Scilit]
- Minasny, B.; Malone, B.P.; McBratney, A.B.; Angers, D.A.; Arrouays, D.; Chambers, A.; Chaplot, V.; Chen, Z.-S.; Cheng, K.; Das, B.S.; et al. Soil carbon 4 per mille. Geoderma 2017, 292, 59–86. [Google Scholar] [CrossRef] [Scilit]
- Poeplau, C.; Don, A. Carbon sequestration in agricultural soils via cultivation of cover crops—A meta-analysis. Agric. Ecosyst. Environ. 2015, 200, 33–41. [Google Scholar] [CrossRef] [Scilit]
- Estrela-Muriel, L.; Funes, I.; Sánchez-Costa, E.; Domene, X.; de Herralde, F. Effect of green covers and organic amendments on soil organic carbon stock in Mediterranean vineyards—A meta-analysis. OENO One 2026, 60, 9778. [Google Scholar] [CrossRef] [Scilit]
- Márquez-García, F.; Hayas, A.; Peña, A.; Ordóñez-Fernández, R.; González-Sánchez, E.J. Influence of cover crops and tillage on organic carbon loss in Mediterranean olive orchards. Soil Tillage Res. 2024, 235, 105905. [Google Scholar] [CrossRef] [Scilit]
- Pareja-Sánchez, E.; Calero, J.; García-Ruiz, R. Does spontaneous cover crop increase the stocks of soil organic carbon and nitrogen in commercial olive orchard? Soil Tillage Res. 2024, 244, 106237. [Google Scholar] [CrossRef] [Scilit]
- Teixeira, R.F.M.; Domingos, T.; Costa, A.P.S.V.; Oliveira, R.; Farropas, L.; Calouro, F.; Barradas, A.M.; Carneiro, J.P.B.G. Soil organic matter dynamics in Portuguese natural and sown rainfed grasslands. Ecol. Model. 2011, 222, 993–1001. [Google Scholar] [CrossRef] [Scilit]
- Gómez-Rey, M.X.; Garcês, A.; Madeira, M. Soil organic-C accumulation and N availability under improved pastures established in Mediterranean oak woodlands. Soil Use Manag. 2012, 28, 497–507. [Google Scholar] [CrossRef] [Scilit]
- Rodrigues, A.R.; Costa e Silva, F.; Correia, A.C.; Bicho, M.C.; Madeira, M.; Coutinho, J. Do improved pastures enhance soil quality of cork oak woodlands in the Alentejo region (Portugal)? Agrofor. Syst. 2020, 94, 125–136. [Google Scholar] [CrossRef] [Scilit]
- Koengkan, M.; Fuinhas, J.A.; Olanrele, I. Agrarian Structure in a Small Island Region: A Typological and Spatial Analysis of Agricultural Systems in Madeira Island. Sustainability 2026, 18, 3545. [Google Scholar] [CrossRef] [Scilit]
- Bekchanova, M.; Kuppens, T.; Cuypers, A.; Jozefczak, M.; Malina, R. Biochar’s effect on the soil carbon cycle: A rapid review and meta-analysis. Biochar 2024, 6, 88. [Google Scholar] [CrossRef] [Scilit]
- Gholamahmadi, B.; Gonzalez Pelayo, O.; Isaka, S.; Campos, I.; Martins, M.; Bastos, A.C.; Jongen, M.; Verheijen, F.G.A. The impact of biochar application on sponge function, water erosion, and vegetation cover in a Mediterranean vineyard soil. J. Environ. Manag. 2025, 388, 125916. [Google Scholar] [CrossRef] [Scilit] [PubMed]
- Jongen, M.; Bastos, A.C.; Jelinčić, A.; Simões, L.; Gonzalez-Pelayo, O.; Niemeyer, J.; Unger, S.; Domingos, T.; Verheijen, F.G.A. Biochar, plant productivity and community structure: A two-year study in a newly sown legume-rich pasture in Portugal under ambient and reduced precipitation. Agric. Ecosyst. Environ. 2026, 405, 110403. [Google Scholar] [CrossRef] [Scilit]
- Lustosa Filho, J.F.; Hernandez, Z.; de Figueiredo, T. Potential for elaboration of biochar-based fertilizers produced from olive pomace in Portugal. Rev. Ciênc. Agrár. 2023, 46, 121–130. [Google Scholar] [CrossRef]
- Nevzorova, T. Carbon Market for Climate Projects in Russia: An Overview of Nature-Based and Technological Carbon Offsets. Gases 2024, 4, 153–173. [Google Scholar] [CrossRef] [Scilit]
- FAO. FAOSTAT Domain Emissions Totals: Methodological Note, Release October 2023; Food and Agriculture Organization of the United Nations: Rome, Italy, 2023. [Google Scholar]
- Eurostat. Greenhouse Gas Emissions by Source Sector; European Commission: Luxembourg, 2026. [Google Scholar] [CrossRef]
- Eurostat. Agri-Environmental Indicator—Livestock Patterns. Statistics Explained (Data from August 2026; 2023 Livestock-Density Indicator, Dataset ef_fsi_lskds). European Commission. 2026. Available online: https://ec.europa.eu/eurostat/statistics-explained/SEPDF/cache/14882.pdf (accessed on 9 October 2026).
- IPCC. 2019 Refinement to the 2006 IPCC Guidelines for National Greenhouse Gas Inventories, Volume 4: Agriculture, Forestry and Other Land Use; Intergovernmental Panel on Climate Change: Geneva, Switzerland, 2019. [Google Scholar]
- Portugal. Portugal: 2026 National Inventory Document (NID); United Nations Framework Convention on Climate Change: Bonn, Germany, 2026. [Google Scholar]
- Hamed, K.H.; Rao, A.R. A modified Mann–Kendall trend test for autocorrelated data. J. Hydrol. 1998, 204, 182–196. [Google Scholar] [CrossRef] [Scilit]
- Sen, P.K. Estimates of the regression coefficient based on Kendall’s tau. J. Am. Stat. Assoc. 1968, 63, 1379–1389. [Google Scholar] [CrossRef]
- Pettitt, A.N. A non-parametric approach to the change-point problem. J. R. Stat. Soc. Ser. C (Appl. Stat.) 1979, 28, 126–135. [Google Scholar] [CrossRef] [Scilit] [PubMed]
- Benjamini, Y.; Hochberg, Y. Controlling the false discovery rate: A practical and powerful approach to multiple testing. J. R. Stat. Soc. Ser. B (Methodol.) 1995, 57, 289–300. [Google Scholar] [CrossRef] [Scilit]
- Yue, S.; Pilon, P.; Phinney, B.; Cavadias, G. The influence of autocorrelation on the ability to detect trend in hydrological series. Hydrol. Processes 2002, 16, 1807–1829. [Google Scholar] [CrossRef] [Scilit]
- Bayazit, M.; Önöz, B. To prewhiten or not to prewhiten in trend analysis? Hydrol. Sci. J. 2007, 52, 611–624. [Google Scholar] [CrossRef] [Scilit]
- Hamed, K.H. Enhancing the effectiveness of prewhitening in trend analysis of hydrologic data. J. Hydrol. 2009, 368, 143–155. [Google Scholar] [CrossRef] [Scilit]
- Serinaldi, F.; Kilsby, C.G. The importance of prewhitening in change point analysis under persistence. Stoch. Environ. Res. Risk Assess. 2016, 30, 763–777. [Google Scholar] [CrossRef] [Scilit]
- Strauss, V.; Paul, C.; Dönmez, C.; Burkhard, B. Carbon farming for climate change mitigation and ecosystem services—Potentials and influencing factors. J. Environ. Manag. 2024, 372, 123253. [Google Scholar] [CrossRef] [Scilit] [PubMed]
- Koengkan, M.; Fuinhas, J.A.; Georgescu, I.; Domingos, H.; Khan, F. Mediterranean Dietary Transition and a Weighted Food-Related Carbon-Pressure Proxy in Portugal: Evidence from Dynamic Time-Series Analysis. Sustainability 2026, 18, 8711. [Google Scholar] [CrossRef] [Scilit]
- Brye, K.R.; Della Lunga, D.; Brye, J.B.; Seuferling, C.; Buchanan, T.; Dockery, W.; Gwaltney, L. Preliminary Assessment of Measurement Frequency and Replication Effects on Season-Long Greenhouse Gas Emissions and Global Warming Potential Estimation Consistency Among Various Ecosystems. Gases 2026, 6, 32. [Google Scholar] [CrossRef] [Scilit]
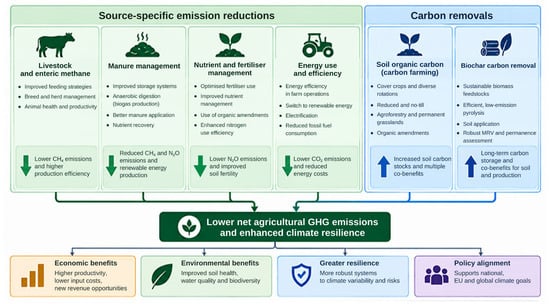
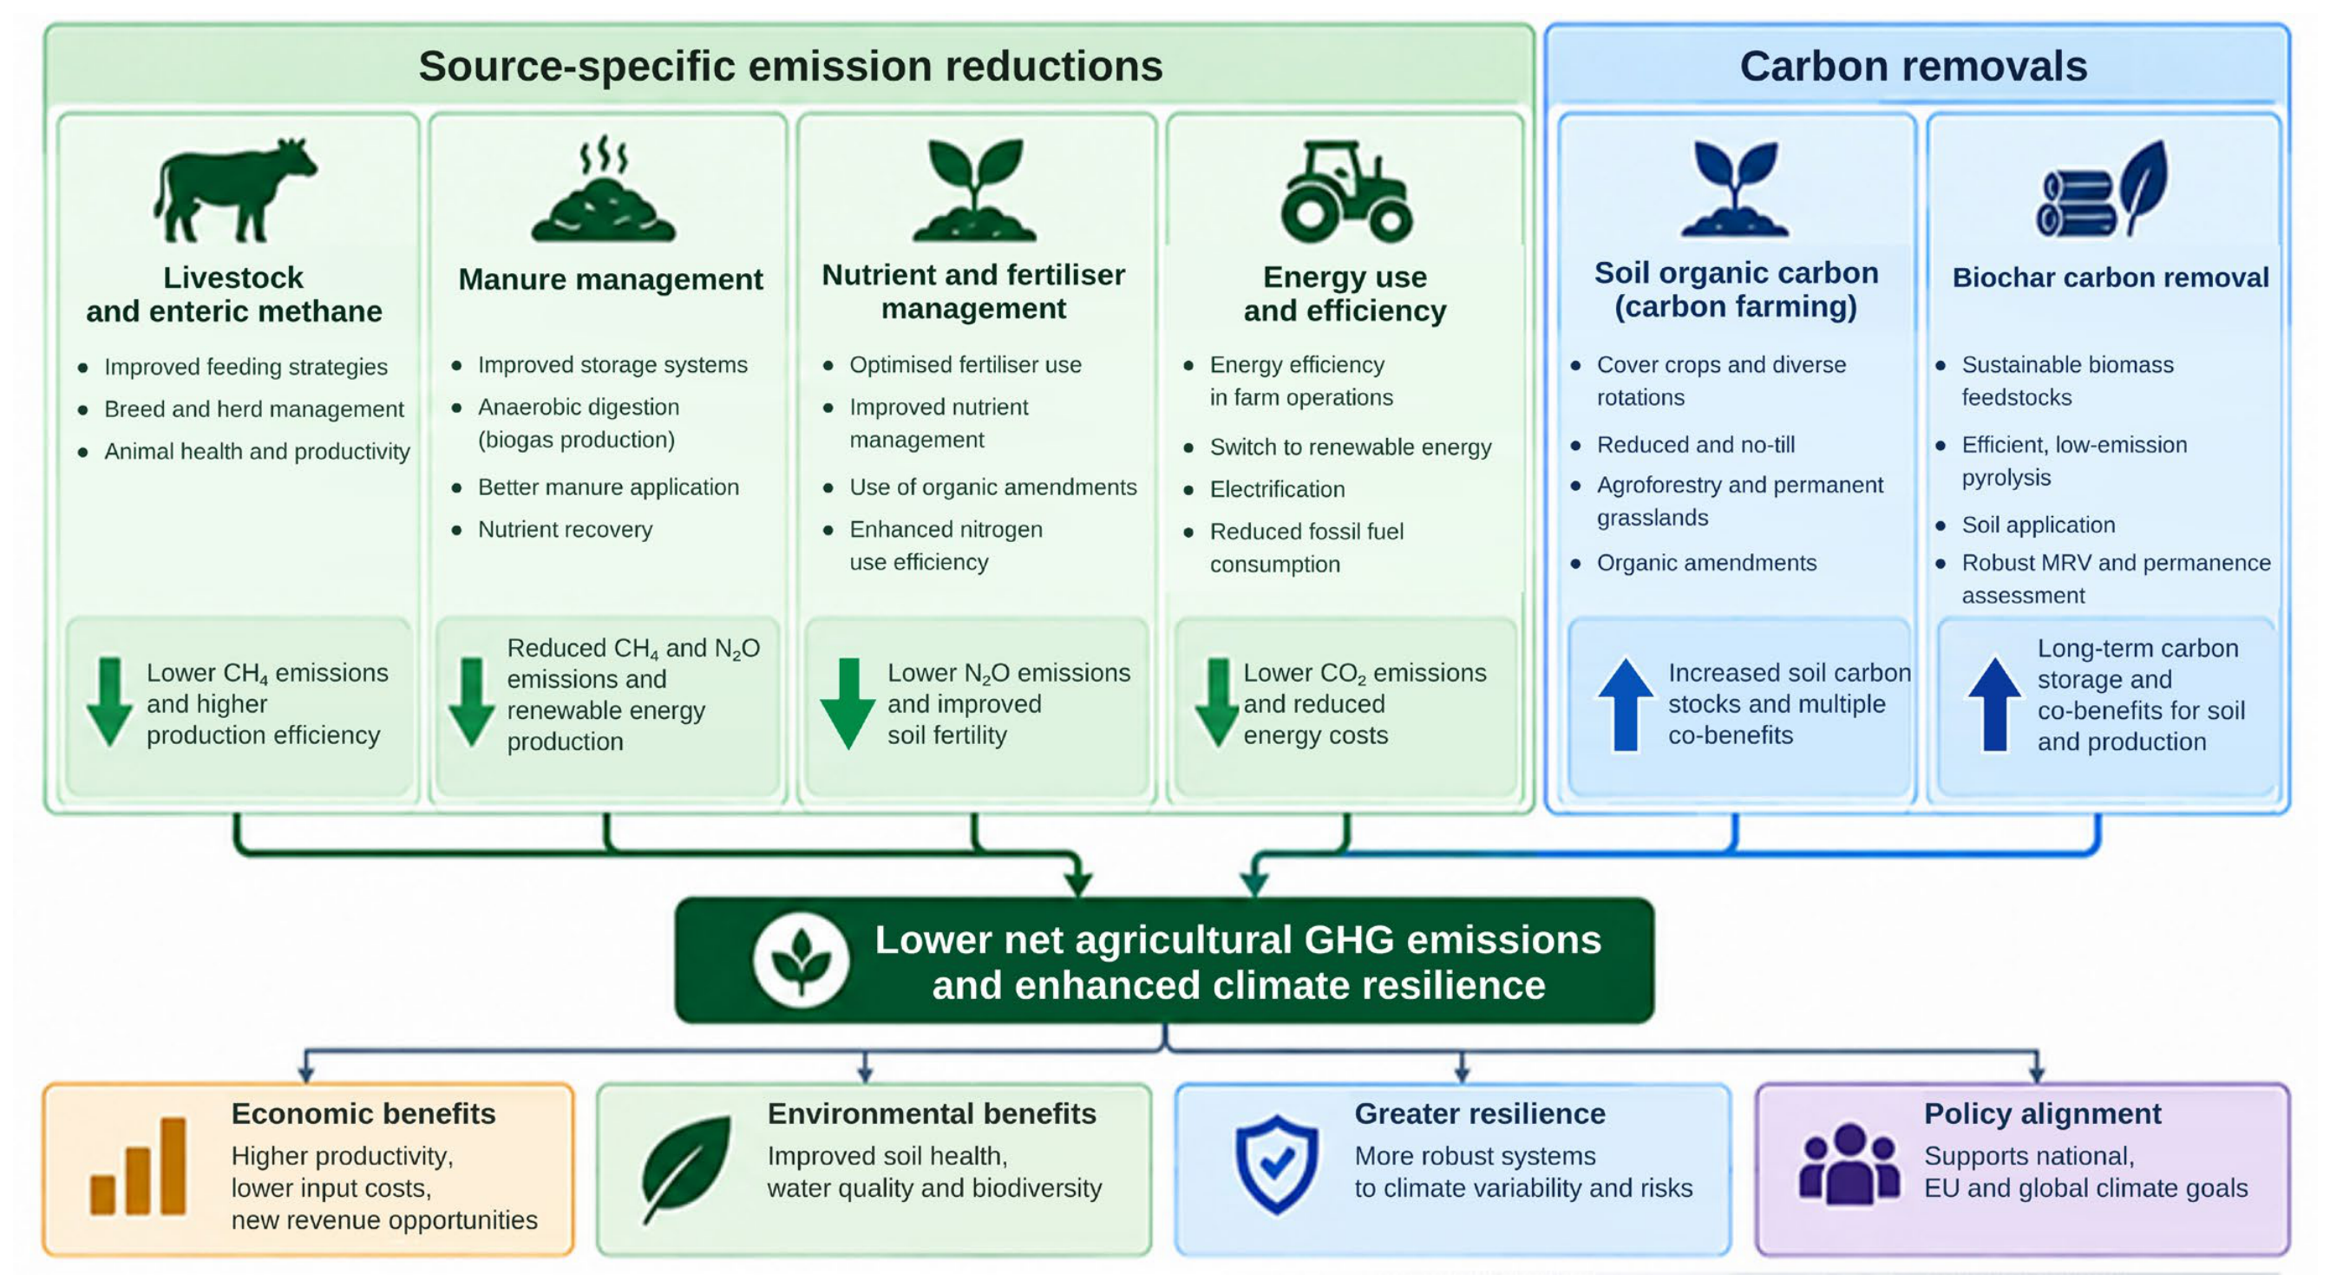
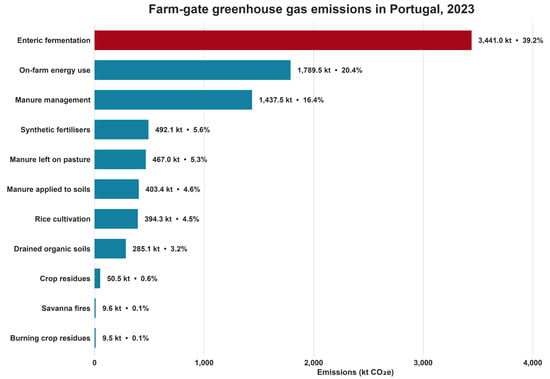
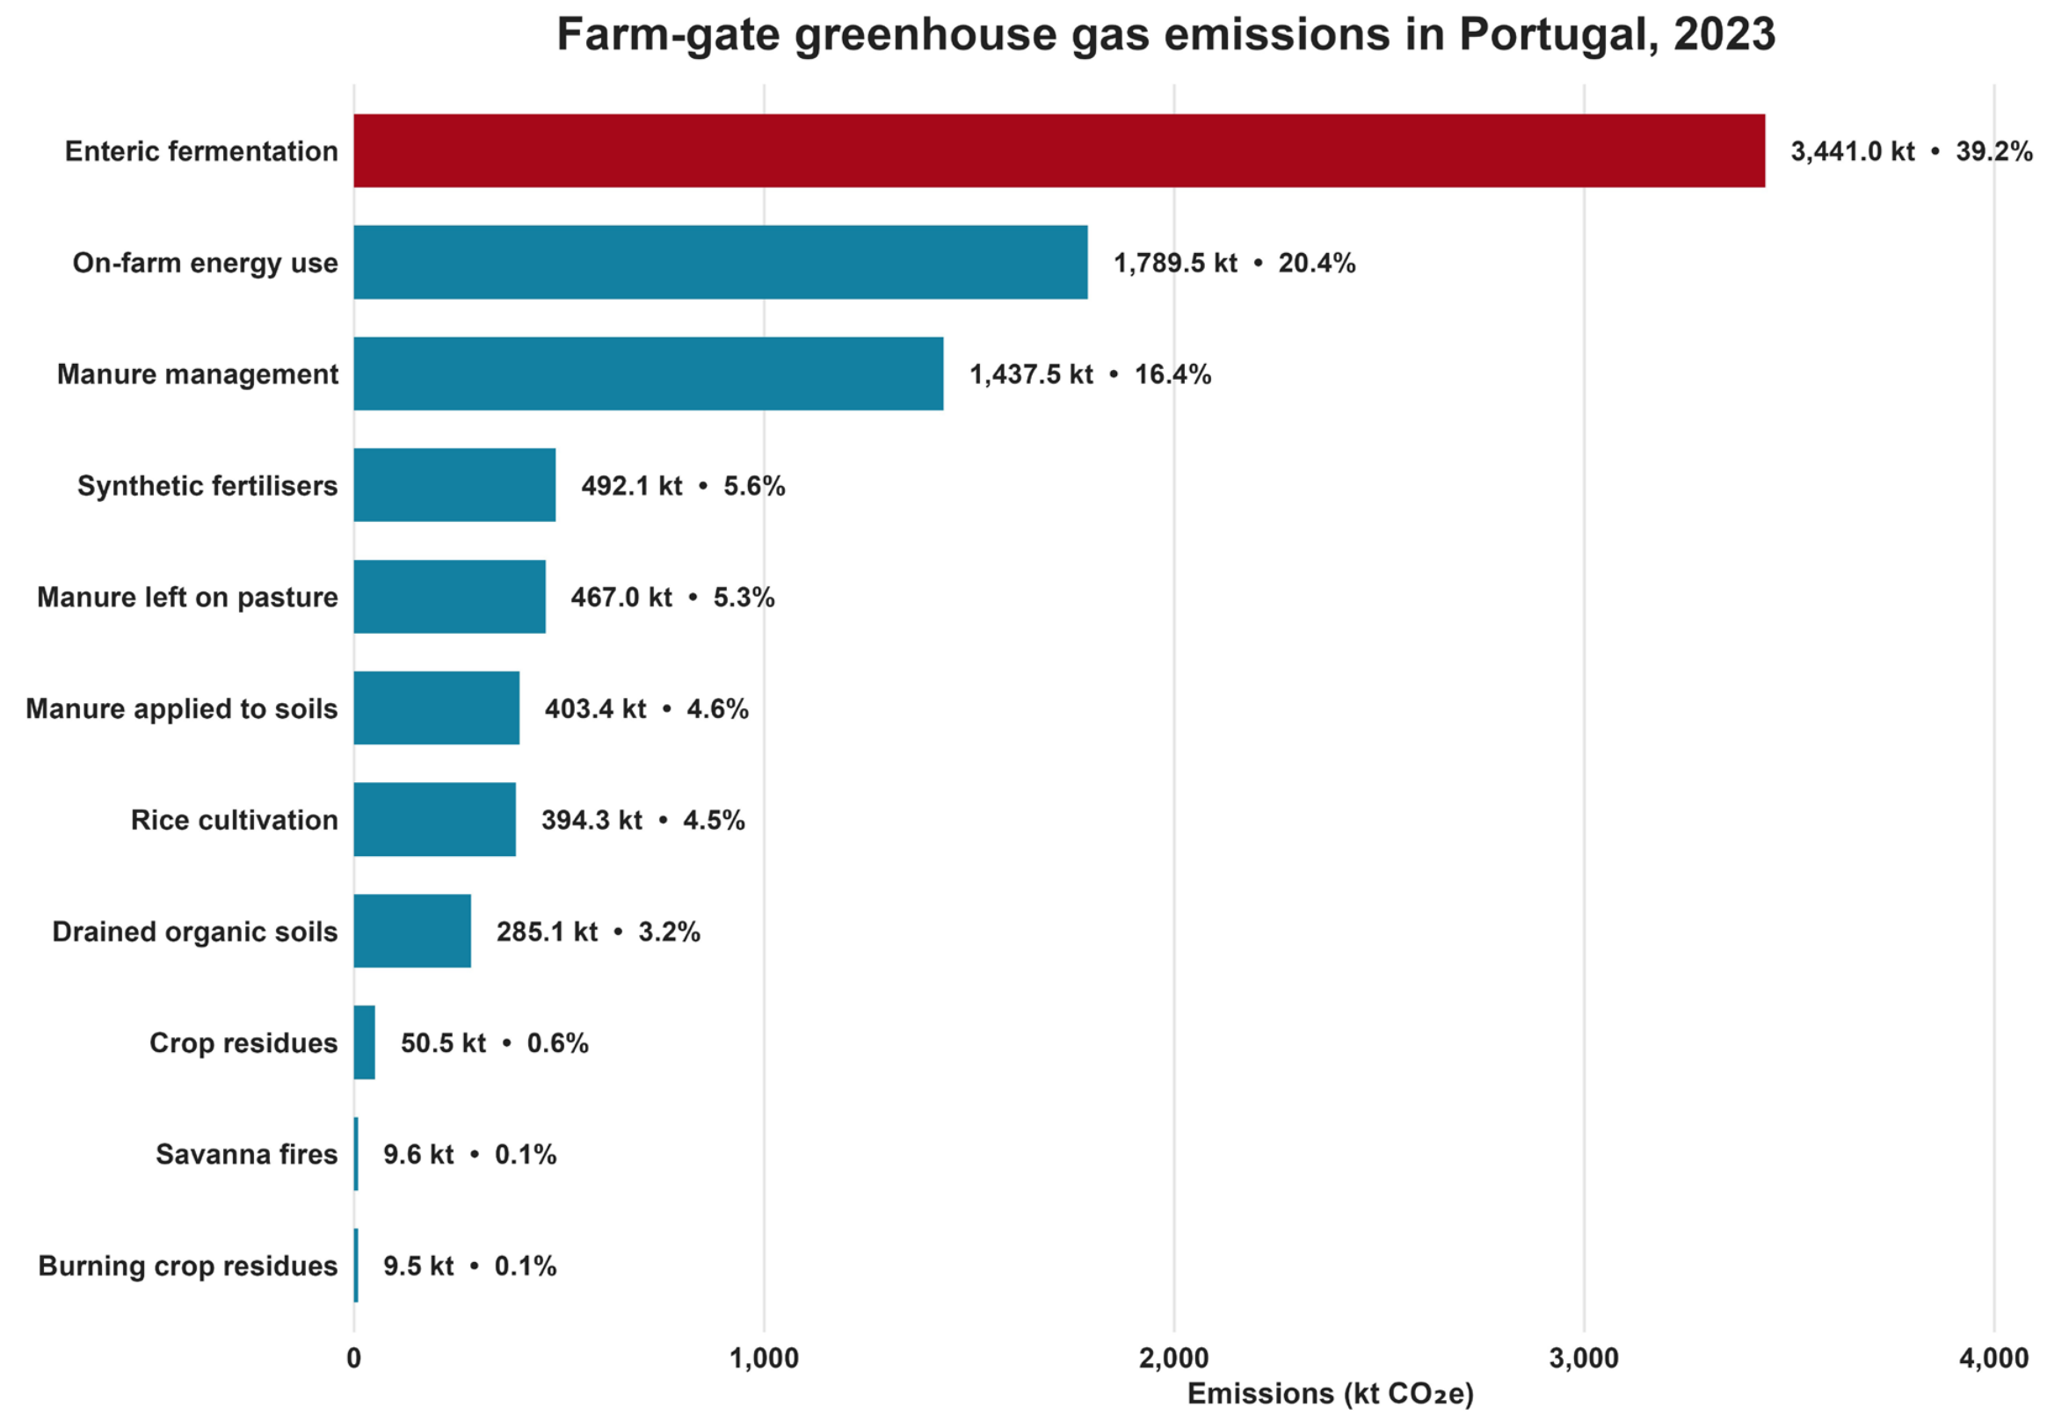
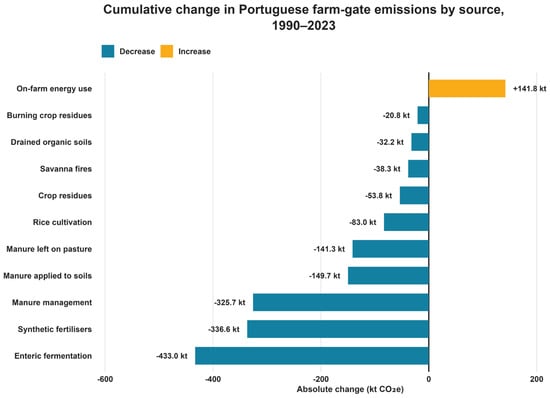
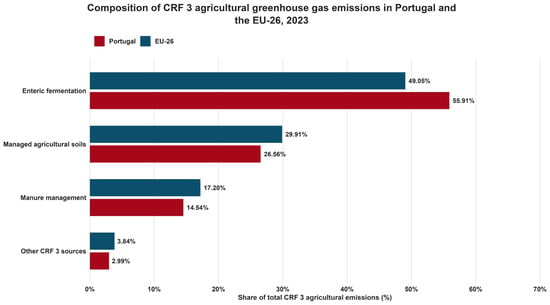
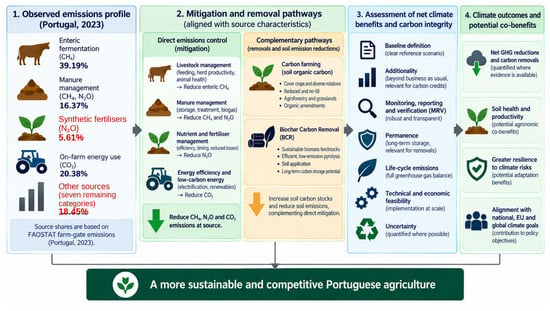
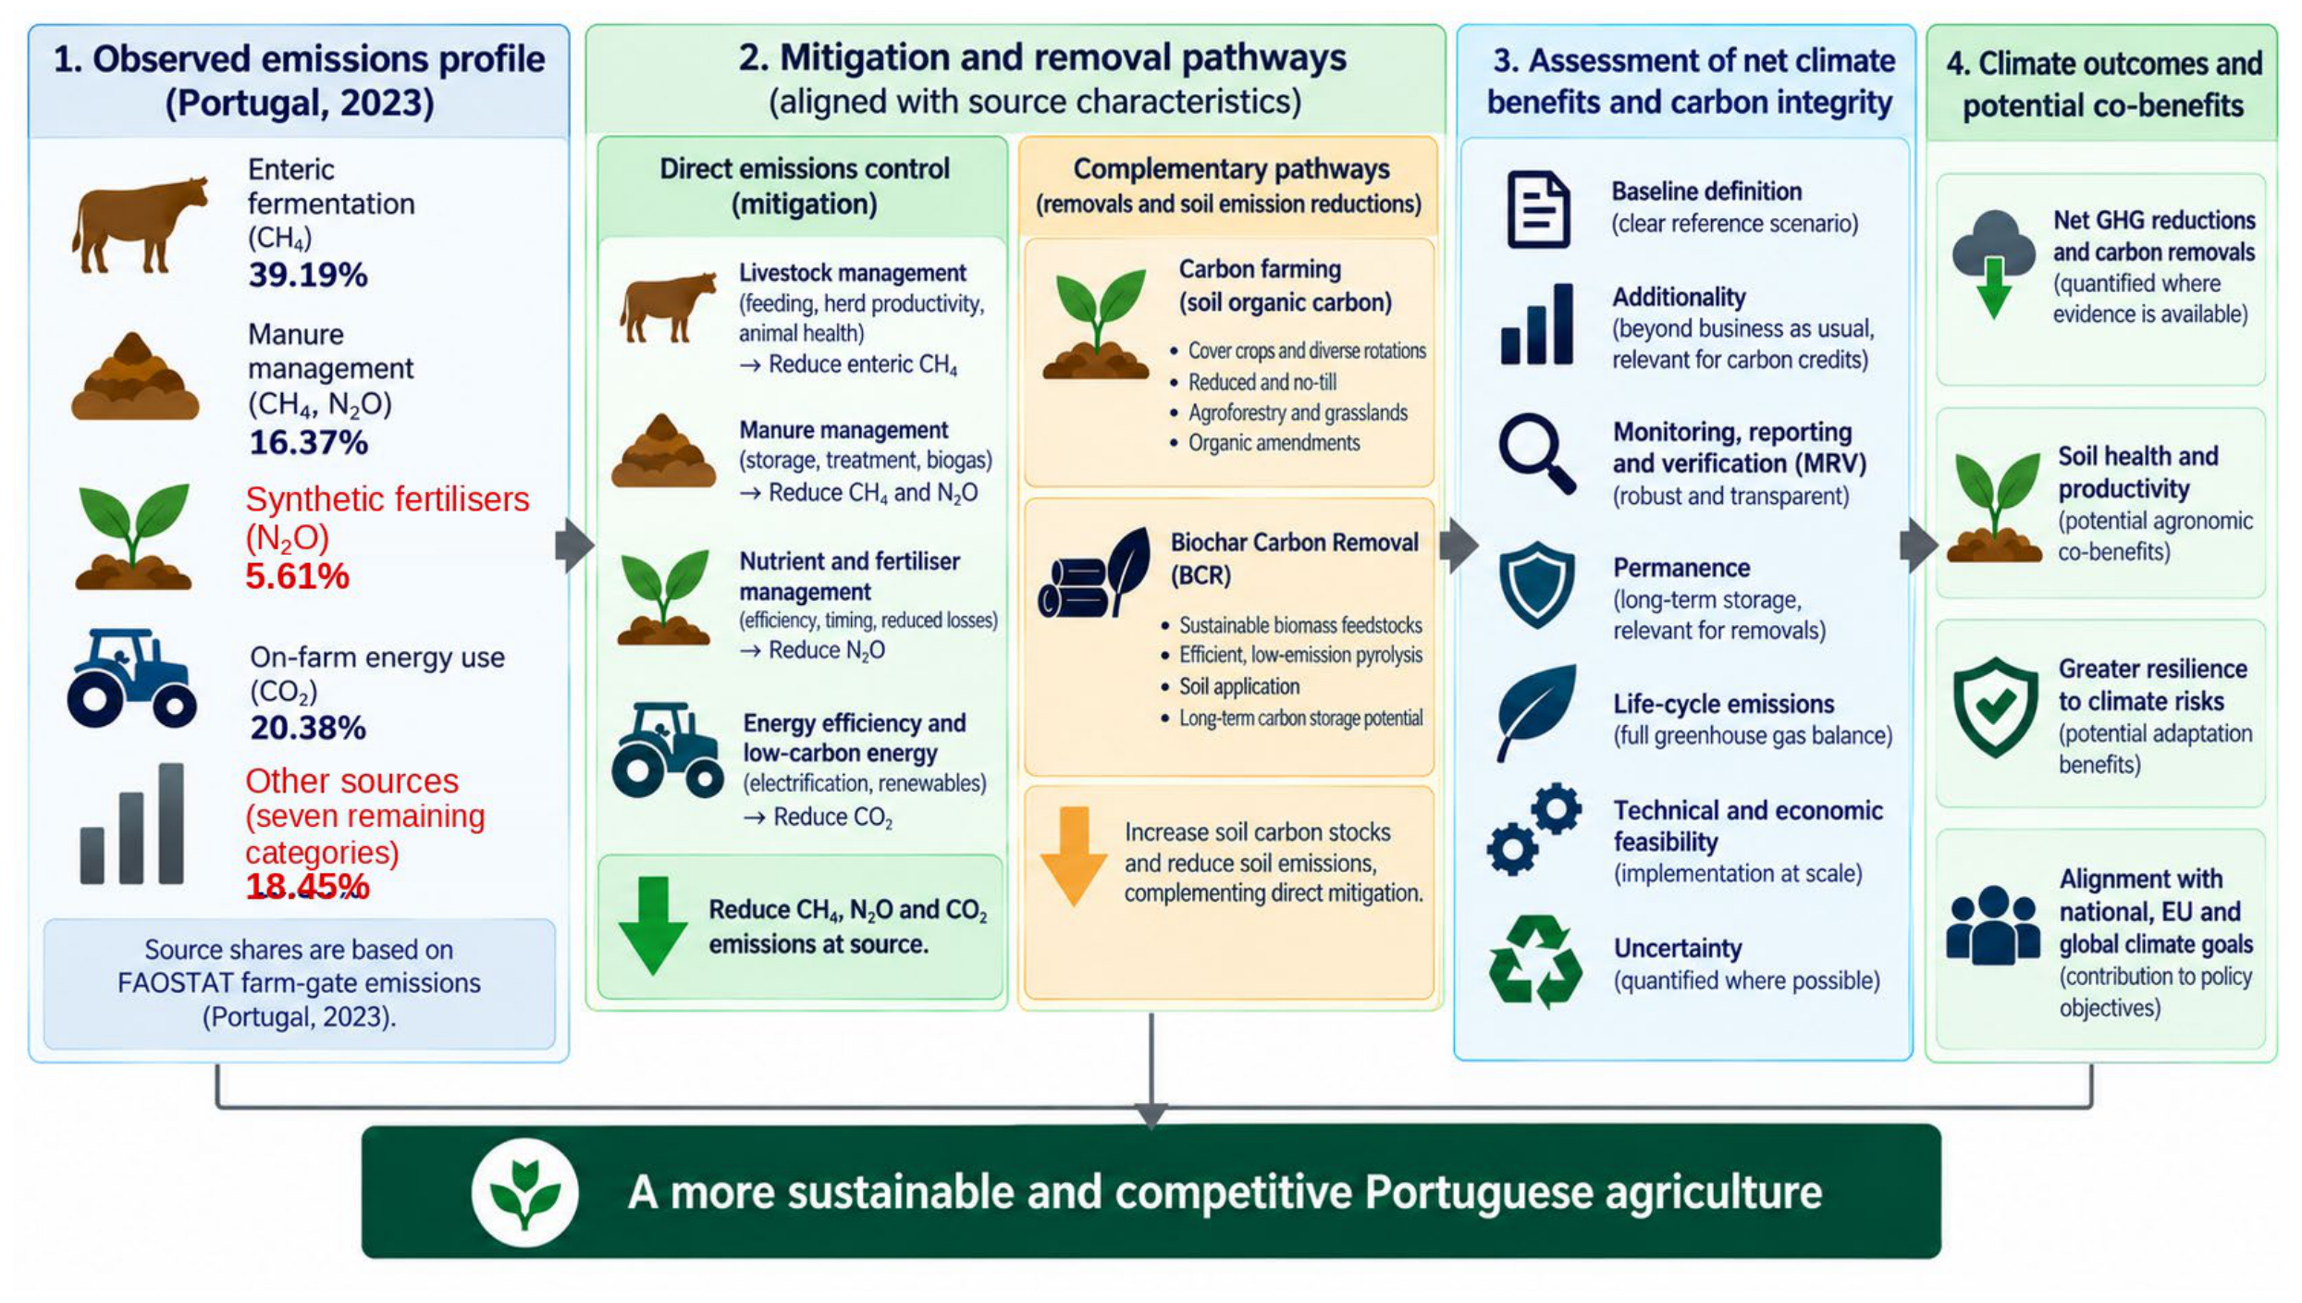
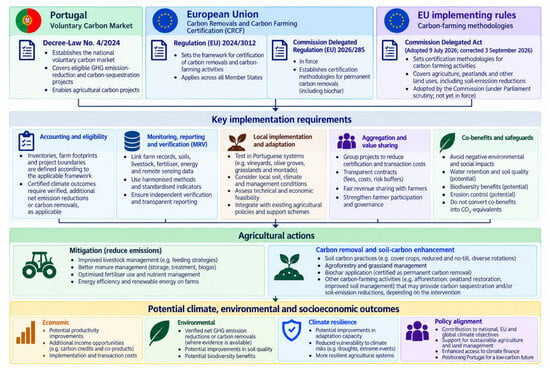
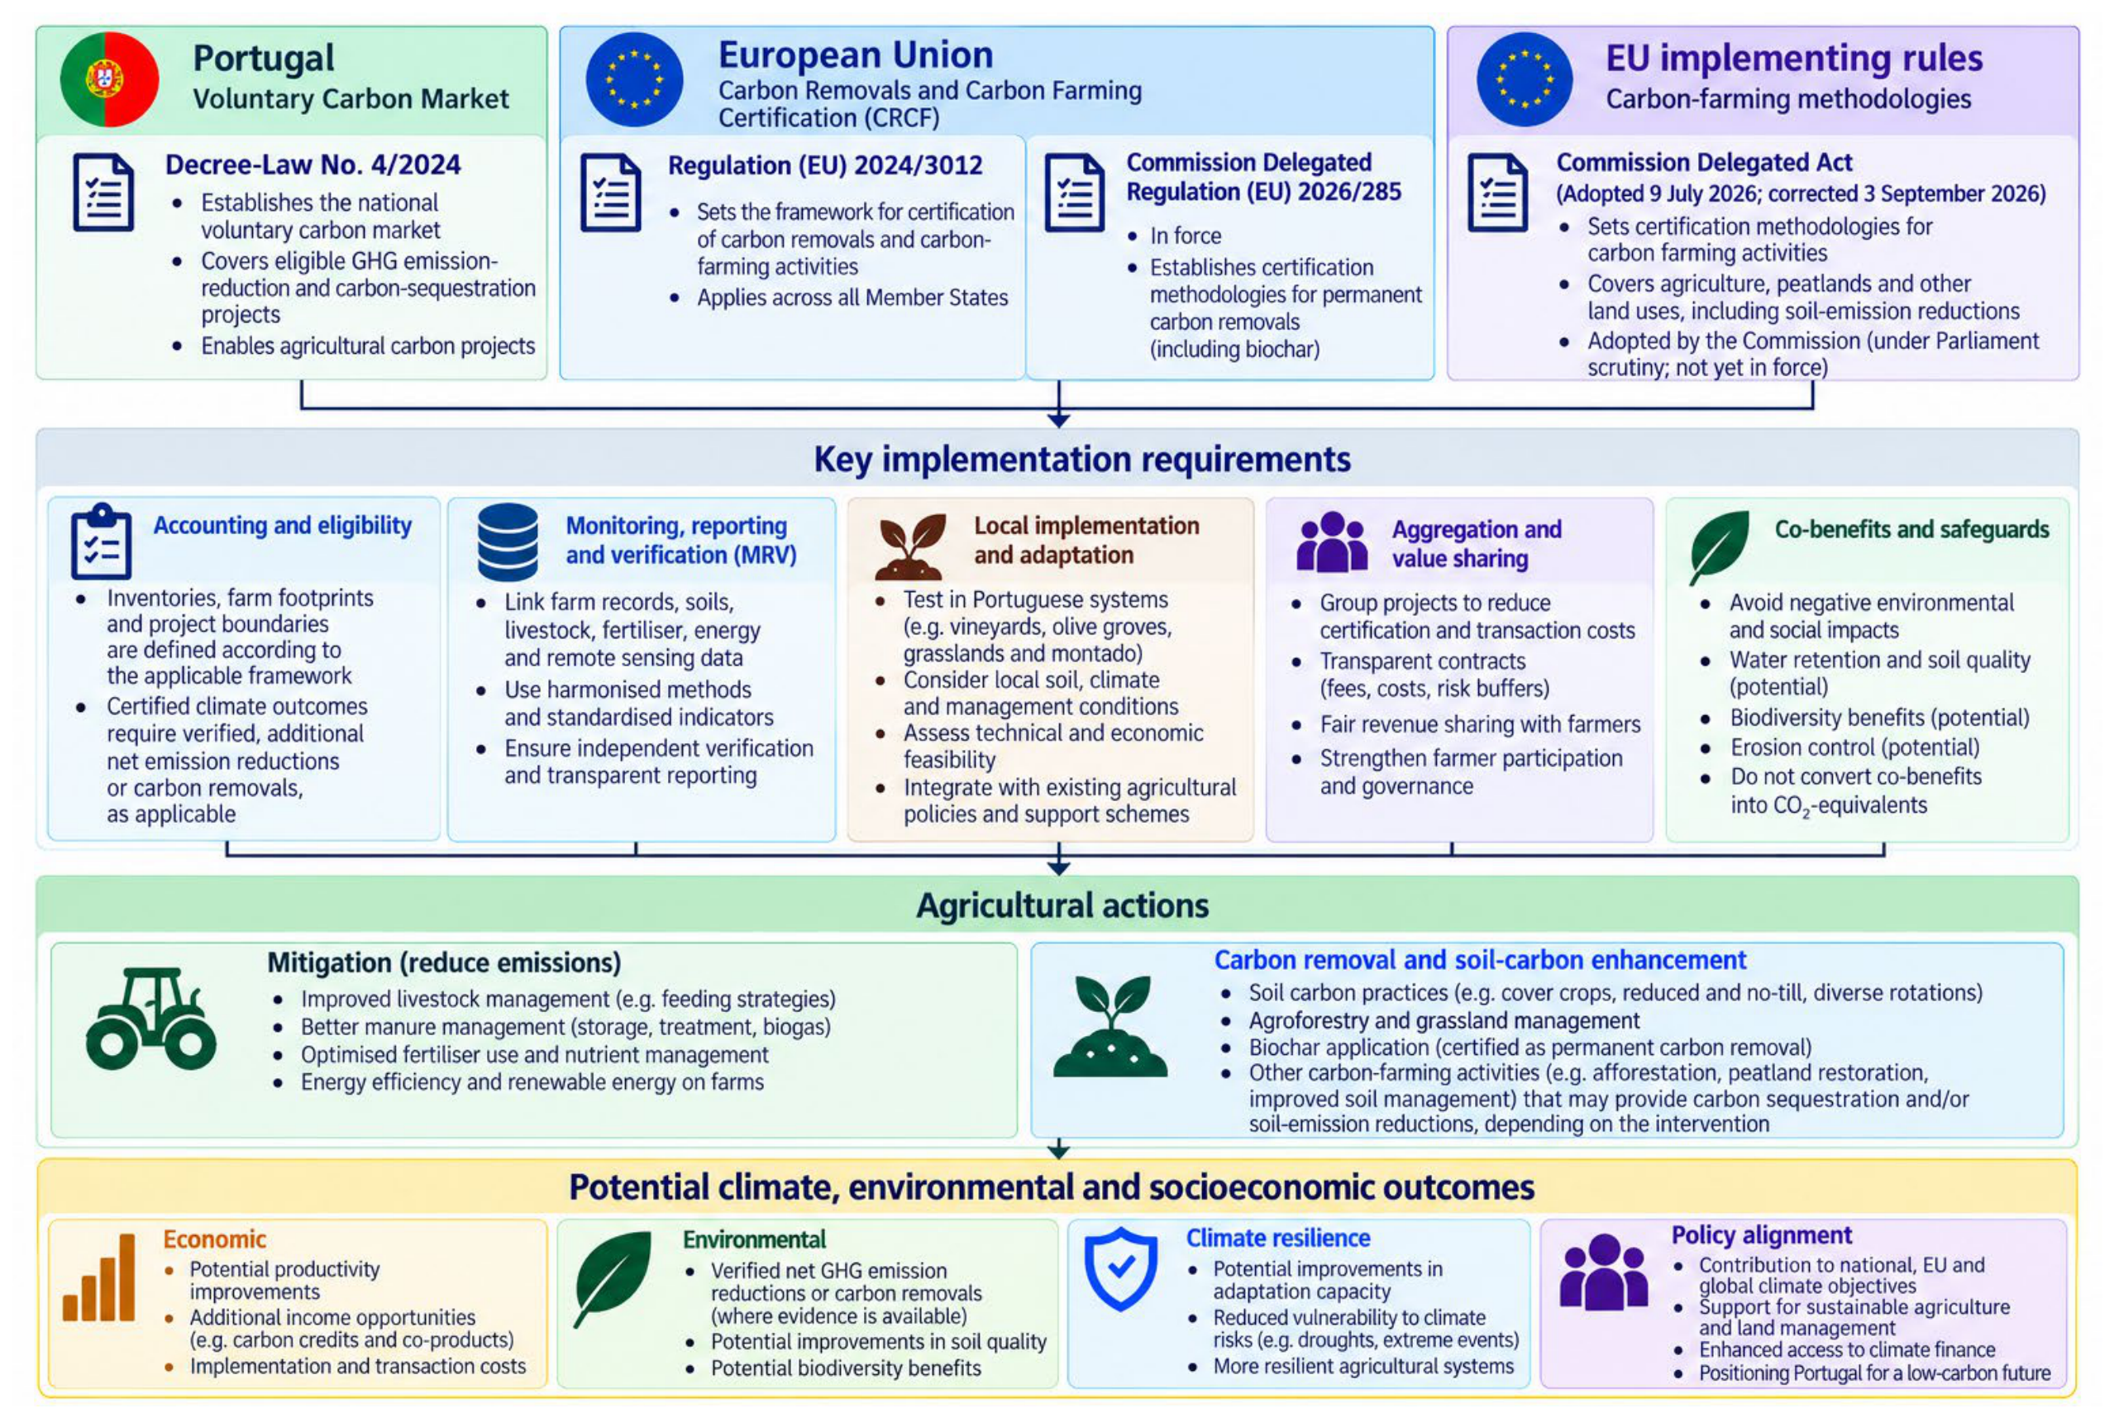

Disclaimer/Publisher’s Note: The statements, opinions and data contained in all publications are solely those of the individual author(s) and contributor(s) and not of MDPI and/or the editor(s). MDPI and/or the editor(s) disclaim responsibility for any injury to people or property resulting from any ideas, methods, instructions or products referred to in the content. |
© 2026 by the author. Licensee MDPI, Basel, Switzerland. This article is an open access article distributed under the terms and conditions of the Creative Commons Attribution (CC BY) license.