


Abstract
Background: Cyclophosphamide (CTX)-induced immunosuppression involves systemic toxicity, splenic atrophy, and broad transcriptomic disruption. Icariin (ICA) has immunomodulatory activity, but the systems-level features associated with splenic recovery remain incompletely defined. Methods and Results: Male mice were assigned to control, CTX, and CTX plus ICA (20, 40, or 80 mg/kg) groups. Phenotypic measurements were integrated with splenic RNA sequencing, differential expression analysis, targeted gene-set analysis, and weighted gene co-expression network analysis (WGCNA). ICA produced dose-associated improvement in spleen index and body weight trajectory, with the most consistent phenotypic response at 80 mg/kg. Overall transcriptomic separation was supported by permutational multivariate analysis of variance (PERMANOVA) (F = 17.18, R2 = 0.873, p < 0.001). WGCNA identified a recovery-associated turquoise module; Myb was assigned to this module, whereas Gata1 belonged to a distinct royalblue module. Complement and chemokine gene sets provided the strongest targeted enrichment evidence, and reverse transcription quantitative polymerase chain reaction (RT-qPCR) confirmed dose-associated changes in selected innate immune transcripts. Marker-based lineage signatures indicated non-uniform recovery, including persistent depression of the B-cell signature. Conclusion: ICA-associated phenotypic recovery coincided with partial, non-uniform remodeling of splenic transcriptional programs. The Myb- and Gata1-associated findings are hypothesis-generating co-expression signals and do not establish transcription-factor binding or causality.
Keywords:
icariin; cyclophosphamide; immunosuppression; WGCNA; spleen; IL-17 pathway; transcriptional hubs 1. Introduction
Cyclophosphamide (CTX) remains a foundational alkylating agent in diverse antineoplastic and immunosuppressive regimens [1,2]. Its clinical utility is limited by systemic toxicity, including myelosuppression and injury to secondary lymphoid organs, particularly the spleen [3,4]. CTX is a prodrug that undergoes hepatic bioactivation to phosphoramide mustard and acrolein; the latter metabolite depletes cellular glutathione and promotes oxidative stress, thereby contributing to splenic atrophy through apoptotic and necrotic mechanisms. CTX-induced splenic atrophy involves both cellular depletion and broad transcriptional suppression across hematopoietic and innate immune programs, increasing susceptibility to secondary infections [3,5]. At the molecular-level, CTX has been linked to Toll-like receptor 4 (TLR4)-mediated NF-κB signaling and NLRP3 inflammasome activation in tissue injury models [6]. Current supportive interventions, predominantly recombinant granulocyte colony-stimulating factor (G-CSF), promote myeloid recovery but do not fully reconstitute the broader innate and adaptive immune architecture [7,8]. G-CSF therapy also carries dose-limiting adverse effects, including bone pain and, in rare cases, splenic rupture [9]. These constraints motivate the search for adjunctive agents capable of supporting immune recovery after chemotherapy without compounding toxicity [5,10,11].
Natural flavonoids have drawn attention as multi-target immunomodulators that may buffer chemotherapy-induced physiological stress [12,13]. Icariin (ICA), the principal prenylated flavonol glycoside from Epimedium species, has a pharmacological profile that extends beyond generic antioxidant activity [14,15,16,17]. ICA modulates macrophage polarization, suppresses NF-κB activation, and inhibits the NLRP3 inflammasome in a range of experimental systems [18,19,20,21,22,23,24,25,26,27]. Reviews of flavonoid-mediated immunomodulation have also highlighted the capacity of icariin to inhibit NF-κB and inflammasome activation across multiple experimental contexts [28]. ICA attenuates TLR4/MyD88/NF-κB signaling in LPS-stimulated inflammatory models [23] and tumor cell systems [29], positioning it at the intersection of two innate immune pathways: TLR signaling and NLRP3-associated inflammation, both of which are frequently disrupted after CTX exposure. These cellular-level findings suggest that ICA may influence broader transcriptomic disruption after chemotherapy rather than acting on a single pathway alone.
Despite this mechanistic rationale, how ICA supports recovery of whole-organ immune function after chemotherapy, specifically splenic recovery, has not been examined at a systems-level. The spleen was specifically prioritized as the focal organ of this investigation. As the body’s largest peripheral secondary lymphoid organ, the spleen not only possesses a rich repertoire of innate immune cell populations—such as macrophages, which are central to the TLR and NLRP3 inflammatory pathways—but also exhibits extraordinary sensitivity to blood-borne microenvironmental shifts and systemic stress. Chemotherapy triggers multidimensional transcriptomic perturbations that single-gene approaches cannot adequately capture [30,31]. Weighted gene co-expression network analysis (WGCNA) offers a framework for identifying co-regulated gene modules and candidate regulatory nodes from global transcriptomic data [32,33,34]. This approach has been applied to characterize splenic transcriptomic responses to hematopoietic stressors [35]. However, it has not been used to map the transcriptomic architecture of ICA-mediated recovery after CTX-induced immunosuppression.
In the present study, we used a CTX-induced murine model of immunosuppression to characterize the restorative effects of ICA through integrated phenotypic and transcriptomic analyses. By correlating spleen index and body weight recovery with WGCNA-derived co-expression networks, we identified core transcriptional modules responsive to ICA. Network topology analysis further highlighted putative hematopoietic transcription factor-associated co-expression signals involving Myb and Gata1, which we now interpret as candidate network associations rather than direct regulatory evidence. RT-qPCR validated the recovery of selected innate immune genes. This systems-level approach provides an mRNA-level framework for understanding ICA-associated splenic immune recovery after chemotherapy.
2. Materials and Methods
2.1. Animals and Ethical Statement
Specific pathogen-free (SPF) male C57BL/6 mice (aged 6–8 weeks, weighing 20–25 g) were obtained from Beijing Vital River Laboratory Animal Technology Co., Ltd. (Beijing, China). Animals were housed under standard laboratory conditions (12 h light/dark cycle, 22 ± 2 °C, 50–60% humidity) with ad libitum access to standard chow and water. All experimental protocols were reviewed and approved by the Institutional Animal Care and Use Committee of Medical College of Liaodong University, Dandong, China (approval no. LDUMC20250118), in accordance with institutional guidelines for the ethical care and use of laboratory animals. Cages contained standard bedding and nesting material as environmental enrichment. Animals were observed at least once daily for body weight, activity, posture, food and water intake, respiration, and general clinical condition. Prespecified humane endpoints were a loss of 20% or more of pre-treatment body weight, inability to eat or drink, persistent recumbency or severe lethargy, labored breathing, or signs of unrelieved pain or distress. Any mouse meeting an endpoint was to be euthanized immediately. Handling and procedures were performed by trained personnel using gentle handling to minimize distress. The protocol was approved on 18 January 2025.
All animal experiments were conducted in accordance with institutional guidelines for the ethical care and use of laboratory animals.
2.2. Reagents and Pharmacological Model
Cyclophosphamide (CTX; purity ≥ 98%) and Icariin (ICA; purity ≥ 98%) were purchased from Shanghai Yuanye Bio-Technology Co., Ltd. (Shanghai, China). ICA was dissolved in a 0.5% carboxymethyl cellulose sodium (CMC-Na) solution to prepare suspensions of the required concentrations. CTX was dissolved in sterile saline immediately prior to use.
2.3. Experimental Design and Administration
Following a one-week acclimation period, the mice were randomized into five cohorts (n = 6 per group): control (CK), CTX model (CTX), and three ICA treatment groups designated as low (CTX_L_ICA, 20 mg/kg), medium (CTX_M_ICA, 40 mg/kg), and high dose (CTX_H_ICA, 80 mg/kg). To induce immunosuppression, mice in all groups except the CK cohort received daily intraperitoneal (i.p.) injections of CTX (80 mg/kg) for three consecutive days (Days 1–3). Following the completion of CTX modeling, ICA was administered via daily oral gavage for seven consecutive days (Days 4–10). The CK and CTX groups received an equivalent volume of the corresponding vehicle in parallel throughout the intervention period. The sample size was determined a priori in G*Power 3.1 for a one-way fixed-effects analysis of variance (ANOVA) with five groups. With spleen index designated as the primary outcome, a conservative anticipated effect size of Cohen’s f = 0.70 based on the magnitude and variability reported in a published five-group CTX-induced immunosuppression study [36], α = 0.05, and 80% power indicated a minimum total sample size of 30 mice; therefore, six mice were included per group. Group allocation was generated using Excel random numbers. Potential confounding was minimized by balancing cage positions and randomizing the order of treatment administration, tissue collection, and outcome measurement across groups. After allocation, cage and sample identifiers were coded; investigators performing spleen weighing, molecular assays, and statistical analysis were blinded to group identity until the primary analyses were completed. Personnel administering CTX, vehicle, and the different ICA doses were not blinded because they prepared and delivered the group-specific treatments.
2.4. Phenotypic and Macroscopic Evaluation
Murine body weights were recorded daily throughout the intervention period. At the terminal time point, anesthesia was induced with 4% isoflurane in oxygen and maintained at 2%. A deep plane of anesthesia was confirmed by loss of the righting and pedal-withdrawal reflexes. Mice were then euthanized by cervical dislocation as a secondary physical method, and cessation of respiration and heartbeat was confirmed before tissue collection. No surgical procedures were performed, and analgesics were not required. Spleens were immediately excised, cleared of adhering connective tissues, and weighed. The spleen index was calculated as spleen weight (mg) divided by final body weight (g), and is therefore reported in mg/g. The isolated splenic tissues were rapidly snap-frozen in liquid nitrogen and stored at −80 °C for downstream molecular profiling.
2.5. RNA Extraction and Transcriptomic Sequencing
Total RNA was extracted from frozen splenic tissues using TRIzol reagent (Invitrogen, Carlsbad, CA, USA) according to the manufacturer’s instructions. RNA integrity and concentration were assessed using the Agilent 2100 Bioanalyzer (Agilent Technologies, Santa Clara, CA, USA); only samples with an RNA Integrity Number (RIN) ≥ 7.0 were used for library construction. Sequencing libraries were prepared using the TruSeq RNA Sample Prep Kit and sequenced on a NovaSeq 6000 platform (both from Illumina, San Diego, CA, USA) to generate 150 bp paired-end reads. For RNA sequencing (RNA-seq) analysis, three biologically independent spleen samples were randomly selected from each group after excluding samples with insufficient RNA quality, resulting in 15 libraries in total.
2.6. Bioinformatics and WGCNA Pipeline
Raw sequencing reads were filtered using Trimmomatic to remove adapters and low-quality sequences. Clean reads were aligned to the mouse reference genome (GRCm38) using HISAT2. For principal component analysis (PCA), fragments per kilobase of transcript per million mapped reads (FPKM) values from all genes were transformed as log2(FPKM + 1). Differential expression was analyzed with DESeq2; differentially expressed genes (DEGs) were defined by |log2(fold change)| > 1 and adjusted p < 0.05. DEG functional profiles were evaluated by Kyoto Encyclopedia of Genes and Genomes (KEGG) enrichment. WGCNA was applied to the filtered expression matrix using the WGCNA R package. Module eigengenes were related to the available phenotypic traits, and candidate network-associated genes were prioritized by intramodular connectivity and module membership. Protein–protein interaction (PPI) networks were visualized using STRING and Cytoscape (https://cytoscape.org/).
To provide statistical support for PCA-based group separation, one-way permutational multivariate analysis of variance (PERMANOVA) was performed on the same all-gene log2(FPKM + 1) matrix used for PCA. Euclidean distances were used. The overall five-group test used 9999 random label permutations; exploratory pairwise 3 vs. 3 tests used all 20 possible label allocations. Pairwise p values were interpreted cautiously because the small number of exact permutations limits resolution.
As an internal sensitivity check, the turquoise-module eigengene was recalculated after random subsampling of 50%, 70%, 80%, or 90% of its genes (200 iterations per fraction), and each subsampled eigengene was correlated with the full-module eigengene. We also reviewed module solutions across soft-thresholding powers of 5–10, minimum module sizes of 20–50 genes, and merge cut heights of 0.20–0.30 (Supplementary Table S1). These analyses assess parameter and gene-set sensitivity within the current dataset; they are not formal sample-level module-preservation analyses.
The WGCNA input matrix retained genes with FPKM ≥ 0.01 in at least one library, reducing the matrix from 22,597 to 19,619 genes. An unsigned network was constructed with soft-thresholding power β = 6, selected from the scale-free topology diagnostic using a reference fit-index threshold of approximately 0.85. Modules were detected with a minimum size of 30 genes and merged at an eigengene dissimilarity cut height of 0.25. Intramodular connectivity (kWithin) and module membership (kME) were calculated, and the top 50 genes from the target module were used for downstream enrichment and network summaries.
For the marker-based lineage analysis, curated B-cell, T-cell, myeloid/inflammatory, and erythroid marker genes were mapped to the FPKM matrix. For each gene, log2(FPKM + 1) values were z-standardized across the 15 libraries; each sample’s lineage score was the mean z score of the available markers in that family. Marker lists and group summaries are provided in Supplementary Table S2.
In a secondary hypothesis-driven enrichment analysis, genes were ranked by differential expression effect size for CTX versus CK and CTX_H_ICA versus CTX. Predefined immune gene sets representing complement, chemokine, inflammatory response, TLR signaling, and B-cell activation were evaluated by a preranked gene set enrichment analysis (GSEA) procedure. Normalized enrichment scores (NES) and nominal permutation p values are reported; gene sets with fewer than three matched genes were not interpreted. Full summary results are provided in Supplementary Table S6.
2.7. Quantitative Real-Time PCR (RT-qPCR)
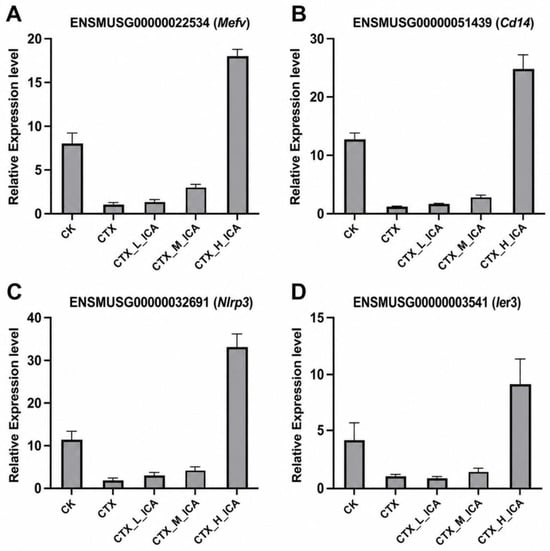
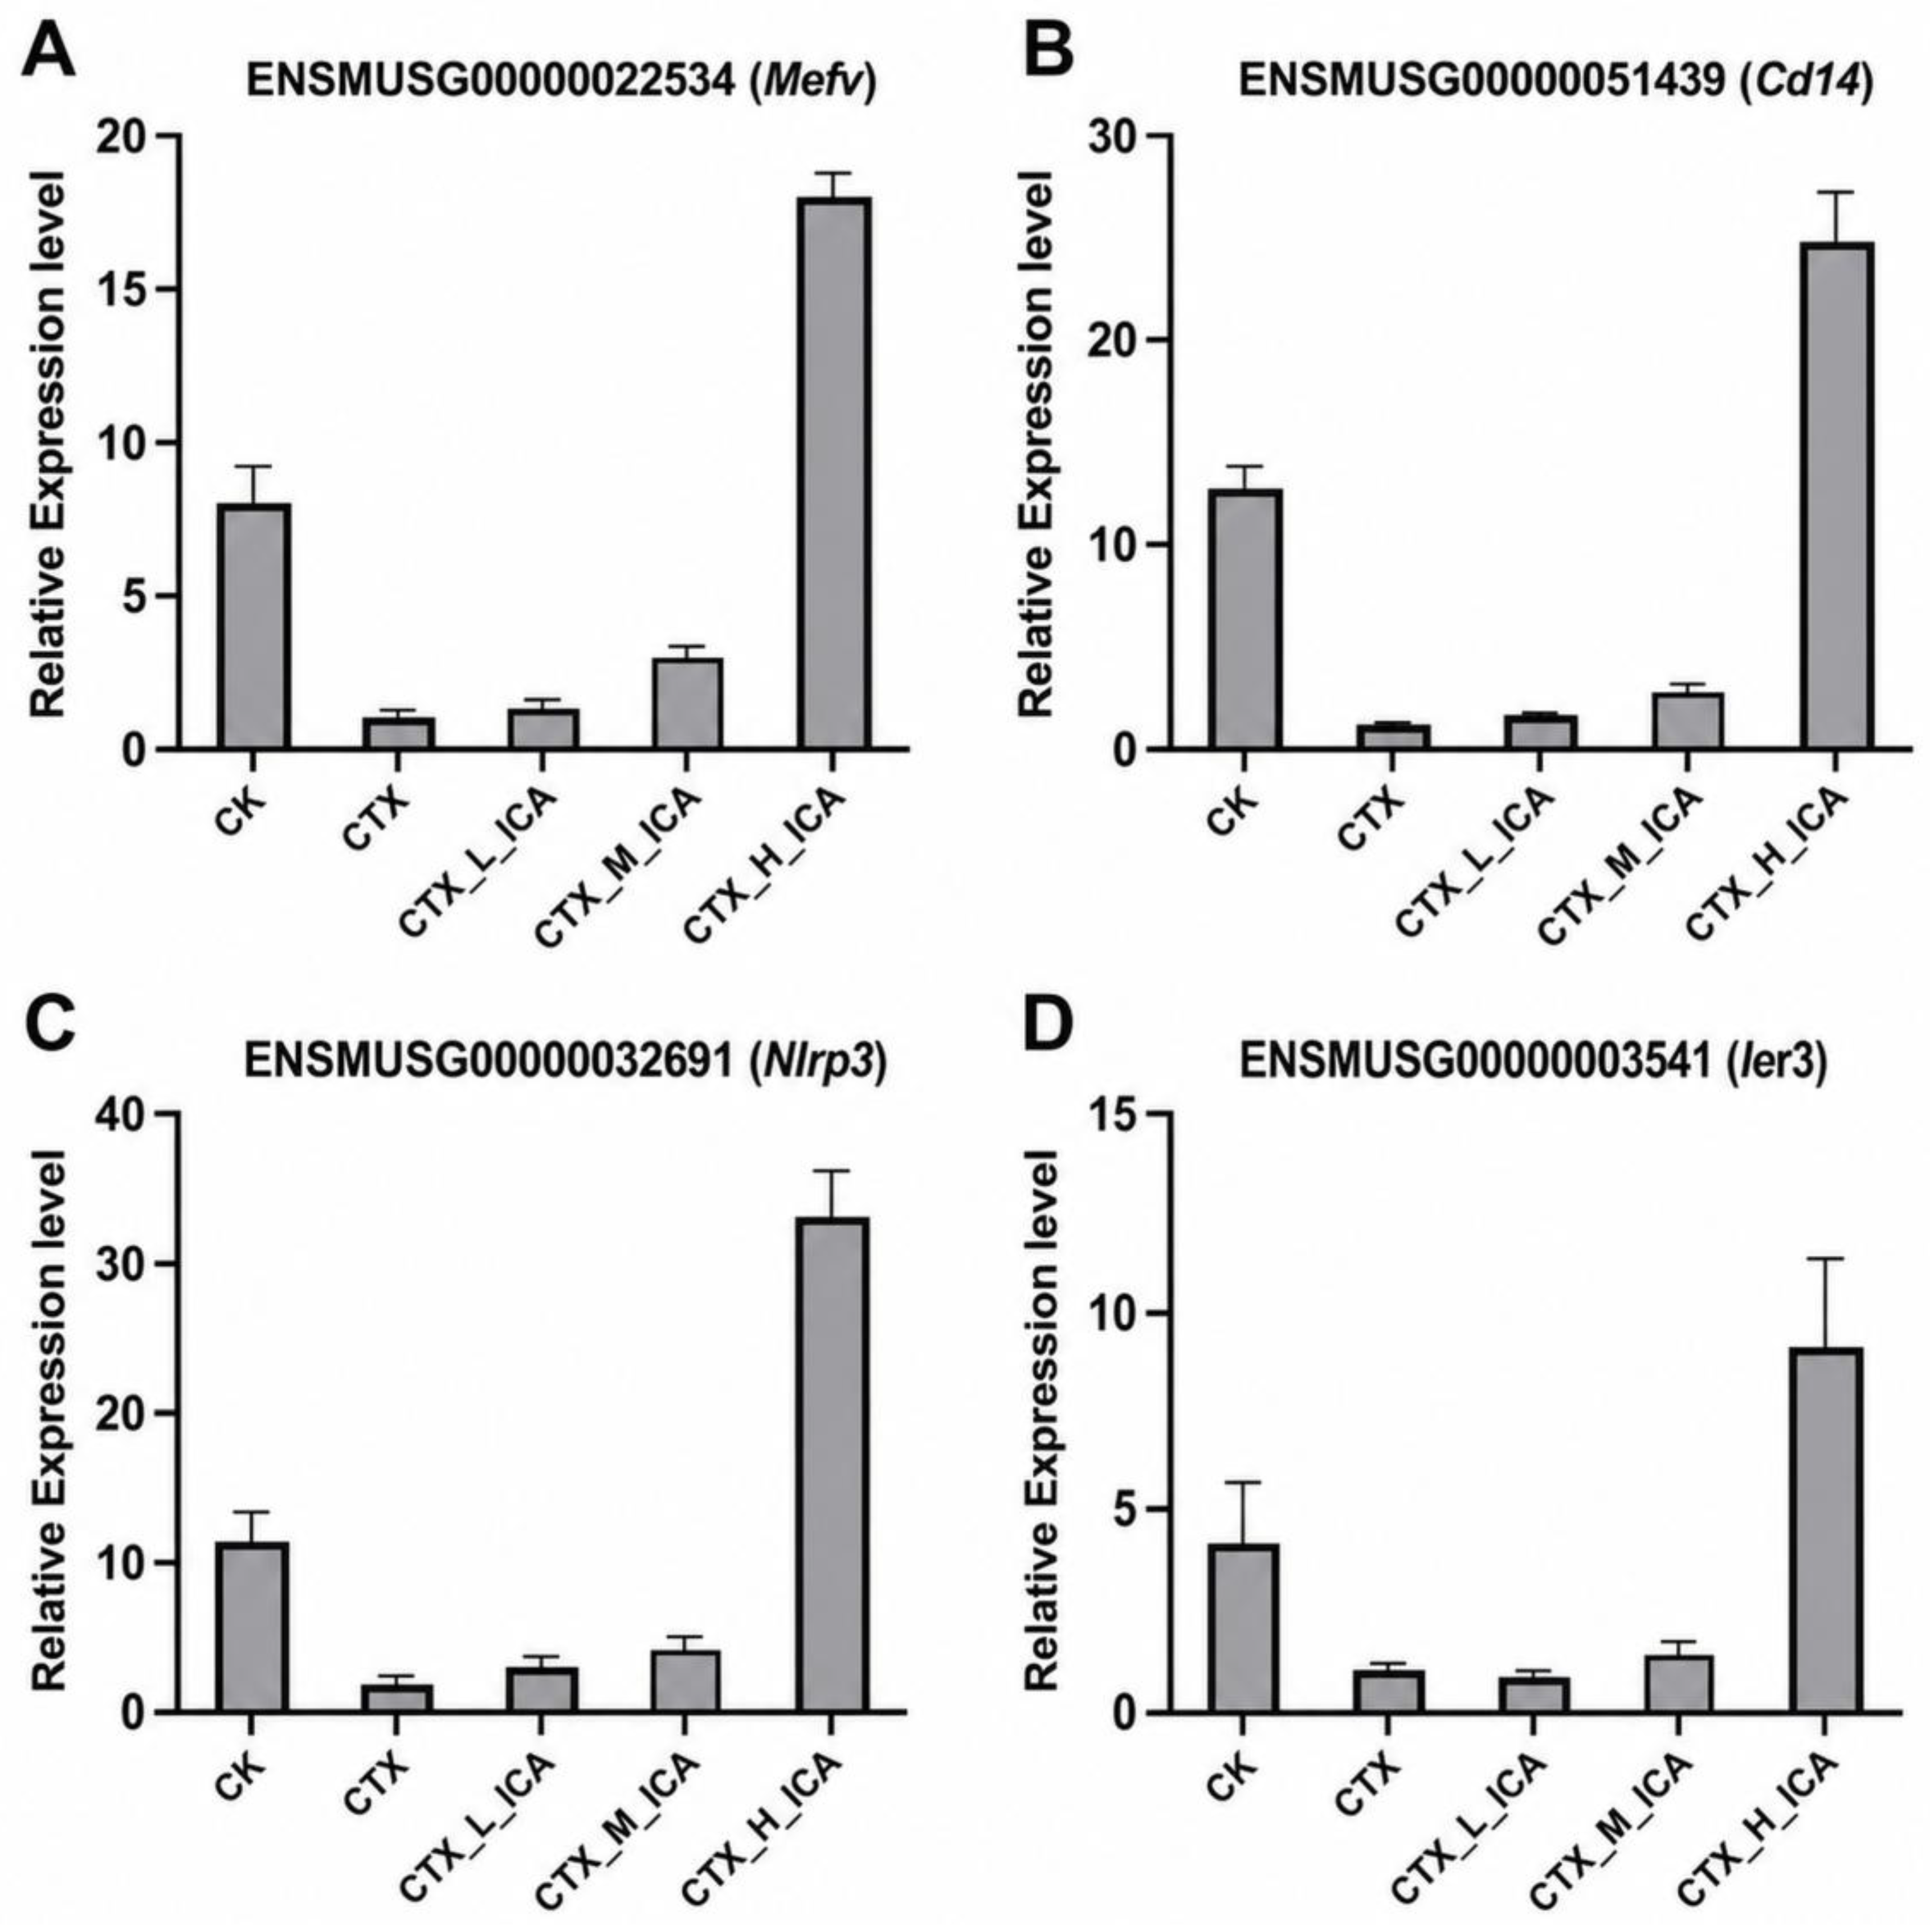
To validate selected RNA-seq-derived innate immune expression patterns, RT-qPCR was performed for Mefv, Cd14, Nlrp3, and Ier3. These genes were selected because they showed strong RNA-seq differential expression and represented complementary innate immune axes detected in the transcriptomic analysis: inflammasome-related innate sensing (Mefv and Nlrp3), TLR/LPS-associated monocyte-macrophage signaling (Cd14), and immediate-early inflammatory stress response (Ier3). This panel was intended to validate selected ICA-responsive innate immune transcripts rather than to validate WGCNA-derived Myb/Gata1 network regulation. Total RNA (1 µg) was reverse-transcribed into cDNA using the PrimeScript RT Reagent Kit (Takara Bio Inc., Kusatsu, Shiga, Japan). Quantitative PCR was performed on a QuantStudio 5 system (Applied Biosystems, Thermo Fisher Scientific, Waltham, MA, USA) using SYBR Green Master Mix (Thermo Fisher Scientific, Waltham, MA, USA). The amplification parameters were 95 °C for 5 min, followed by 40 cycles of 95 °C for 15 s and 60 °C for 30 s. Relative mRNA expression levels were calculated using the 2−ΔΔCt method, with beta-actin serving as the endogenous normalization control. Primer sequences are listed in Table 1.
Table 1.
Primer sequences used for quantitative real-time PCR (RT-qPCR) validation.
2.8. Statistical Analysis
Phenotypic data are presented as mean ± standard deviation (SD). End-point group comparisons were evaluated by one-way ANOVA followed by Tukey’s test after assessment of normality (Shapiro–Wilk test) and homogeneity of variances (Levene’s test); non-parametric alternatives were considered when assumptions were not met. Grubbs’ test was used only as a sensitivity screen, and all six spleen index observations per group were retained in the primary analysis. Body weight trajectories were summarized across the seven recorded days; statements about the timing of divergence are descriptive unless otherwise specified. For marker-lineage signatures, group differences were assessed by Kruskal–Wallis tests and ordinal CTX-to-high-dose trends by Spearman correlation. A two-sided p < 0.05 was considered statistically significant. Phenotypic statistical analyses were performed using GraphPad Prism 9.0 (GraphPad Software, Boston, MA, USA).
3. Results
3.1. ICA Attenuates CTX-Induced Physical Deterioration and Splenic Atrophy
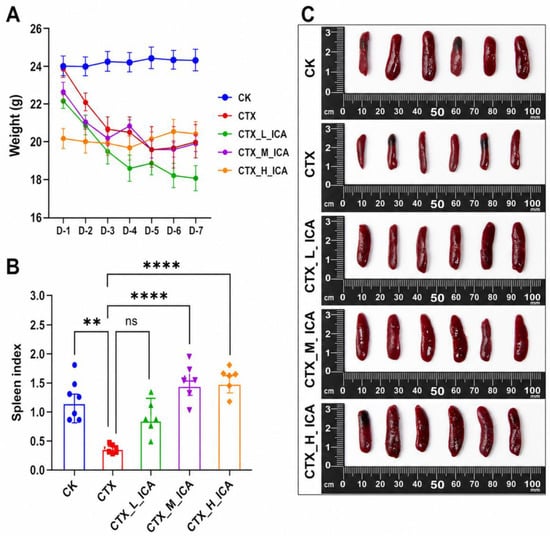
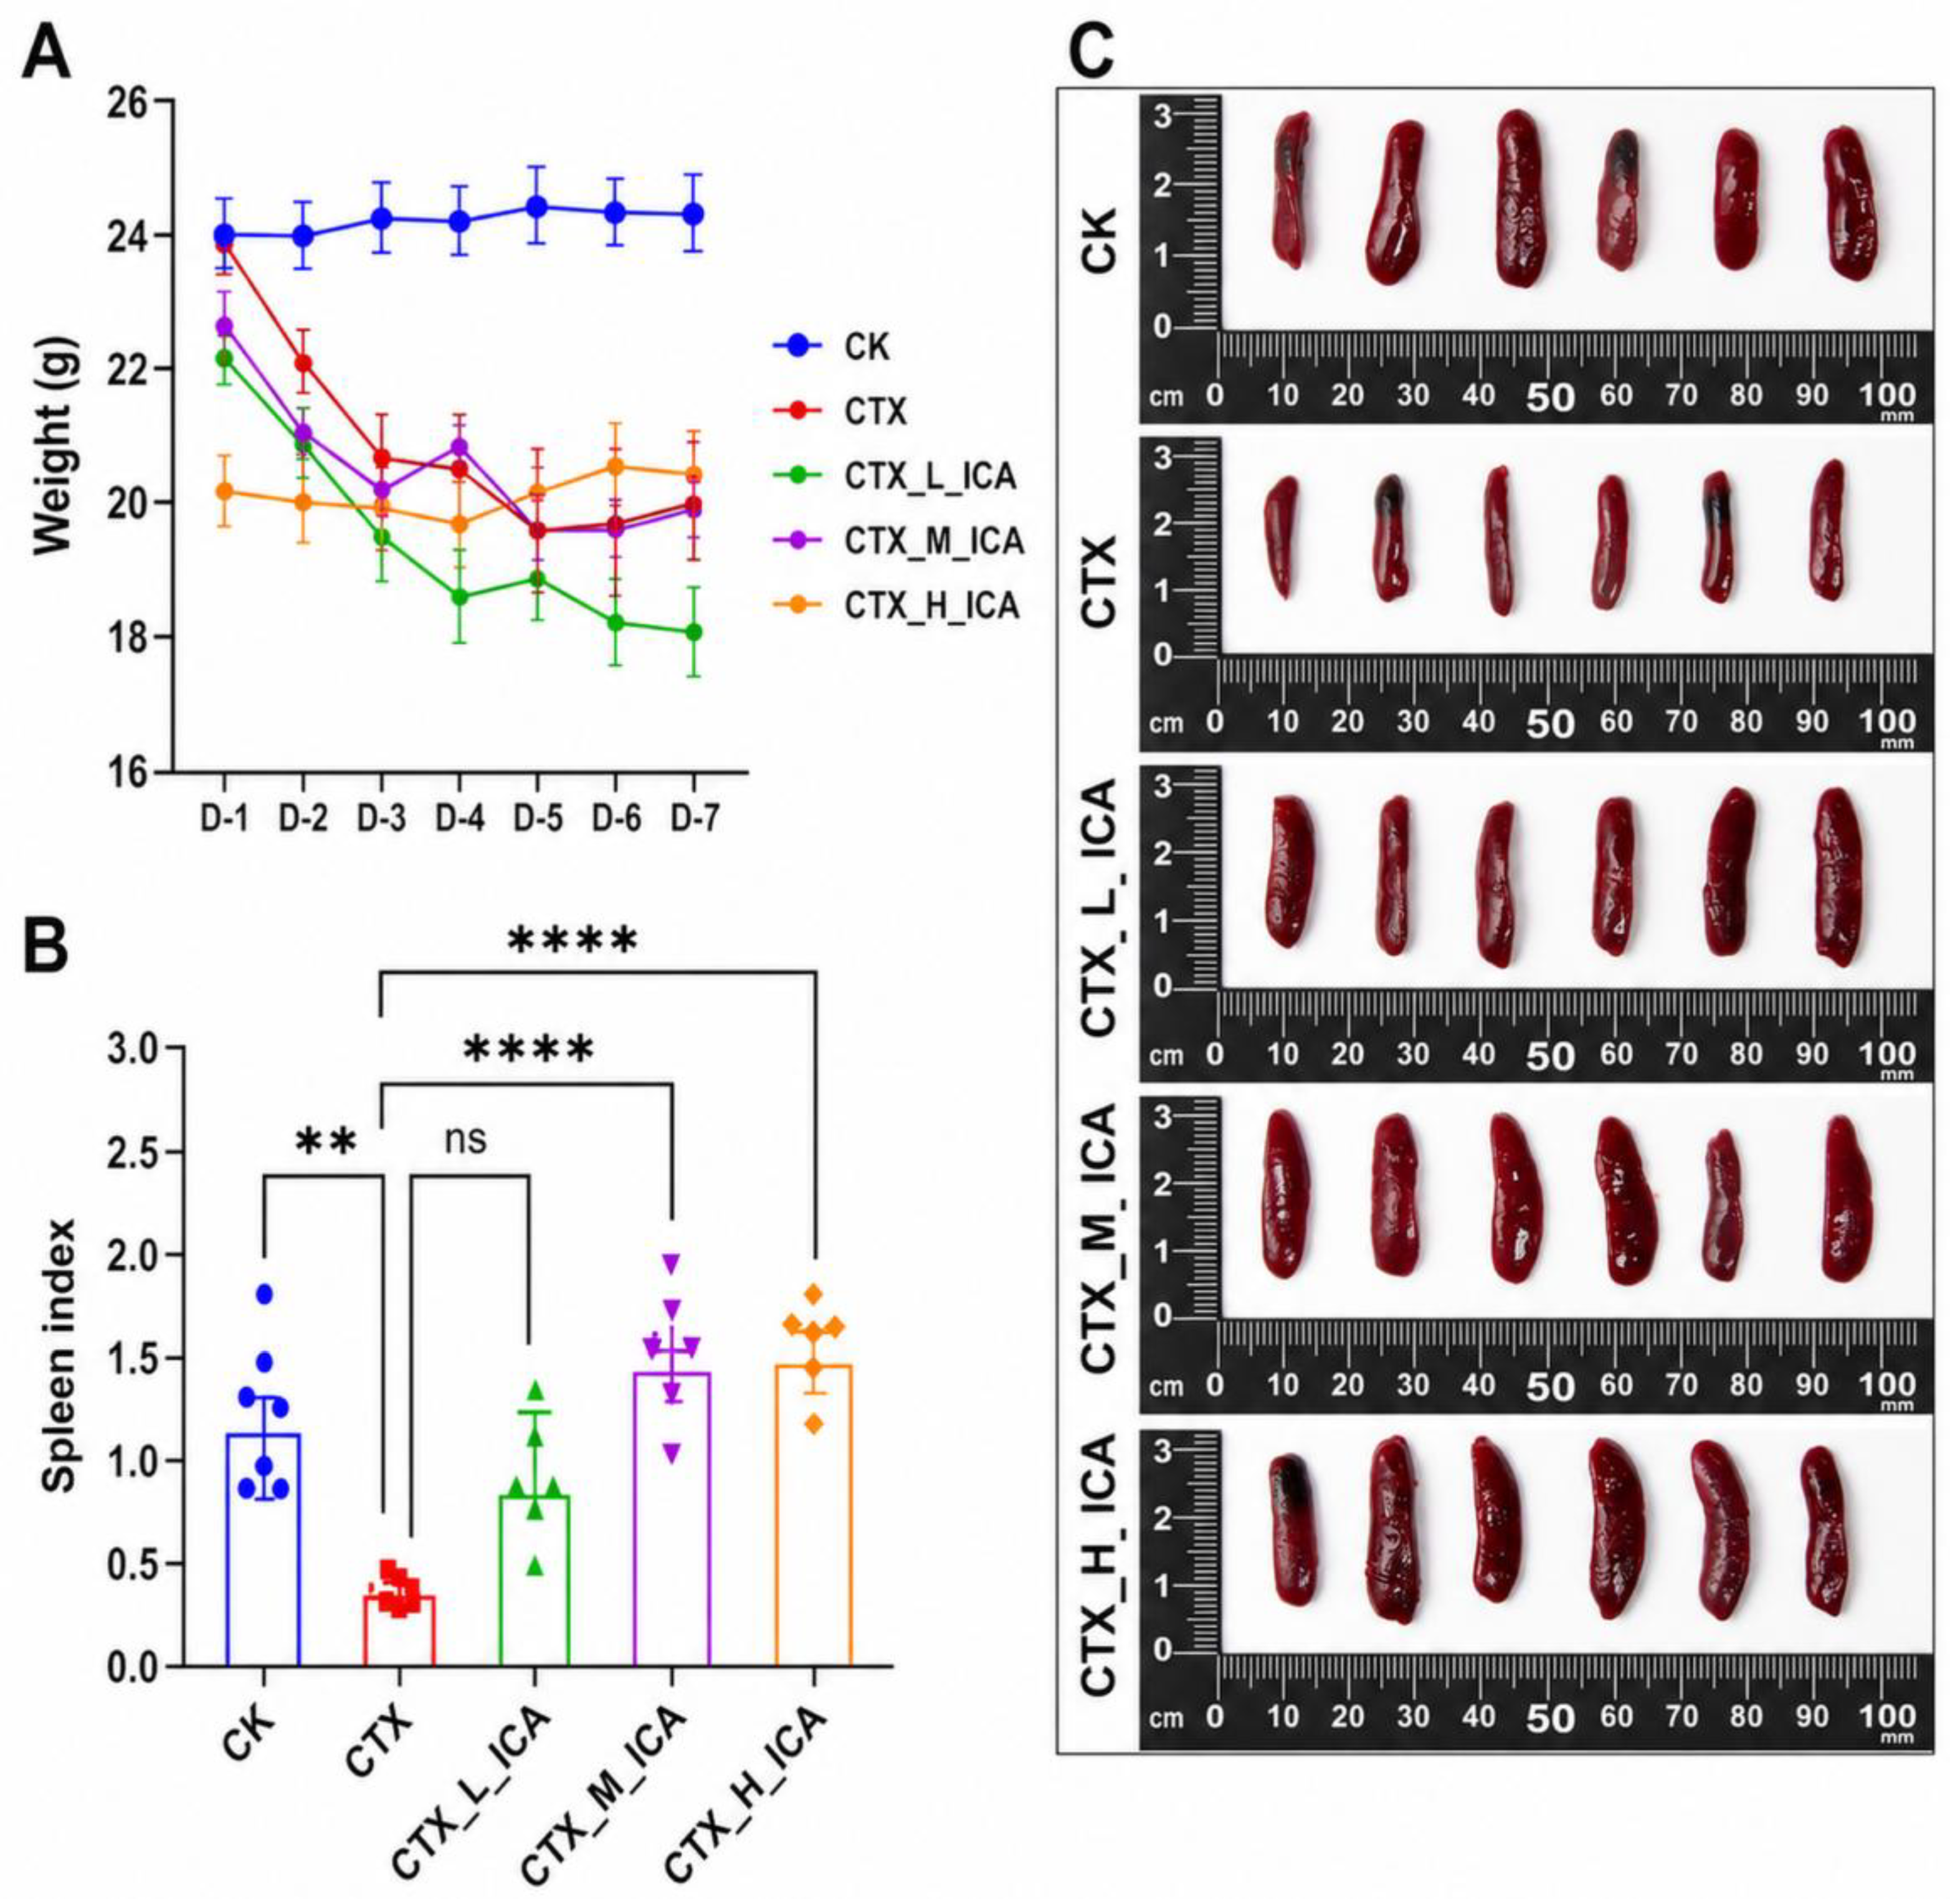
CTX treatment reduced body weight and spleen index, consistent with systemic toxicity and splenic atrophy. Low-dose ICA produced little improvement in body weight trajectory; medium-dose ICA showed partial improvement, and high-dose ICA showed the most consistent phenotypic recovery (Figure 1A). Daily body weights are summarized in Table 2. Spleen index values increased across the ICA dose groups, with the medium- and high-dose groups showing the clearest recovery relative to CTX (Figure 1B,C; Table 3). One CTX_L_ICA animal had a spleen index of 0.0577 mg/g. This verified source value was retained in the primary analysis; excluding it in a sensitivity analysis did not change the conclusion that low-dose ICA was not significantly different from CTX. The animal was the fourth phenotype entry and was not among the three CTX_L_ICA libraries used for RNA-seq, so it did not directly influence PCA, DEG, WGCNA, KEGG, targeted GSEA, or marker-signature analyses. No animal met the prespecified humane endpoints, and no unexpected adverse events or deaths occurred during the experiment.
Figure 1.
Icariin (ICA) attenuates cyclophosphamide (CTX)-induced systemic toxicity and splenic atrophy. (A) Daily body weight trajectories. (B) Spleen index, calculated as spleen weight (mg) divided by final body weight (g). (C) Representative macroscopic spleen images. Data are mean ± standard deviation (SD; n = 6 per group). Statistical brackets are shown in panel B; ns, not significant; **, p < 0.01; ****, p < 0.0001.
Table 2.
Daily body weight measurements (g) of mice across experimental groups.
Table 3.
Spleen index values (mg/g) calculated as spleen weight (mg) divided by final body weight (g). The table reports calculated spleen index values only; no separate absolute spleen weight column is shown.
3.2. Transcriptomic Landscape of ICA-Mediated Recovery
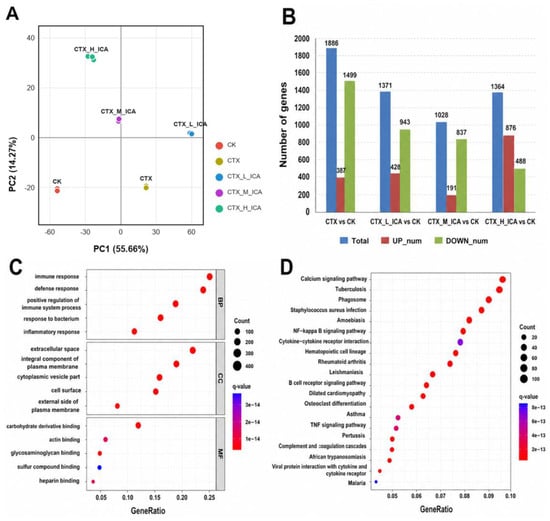
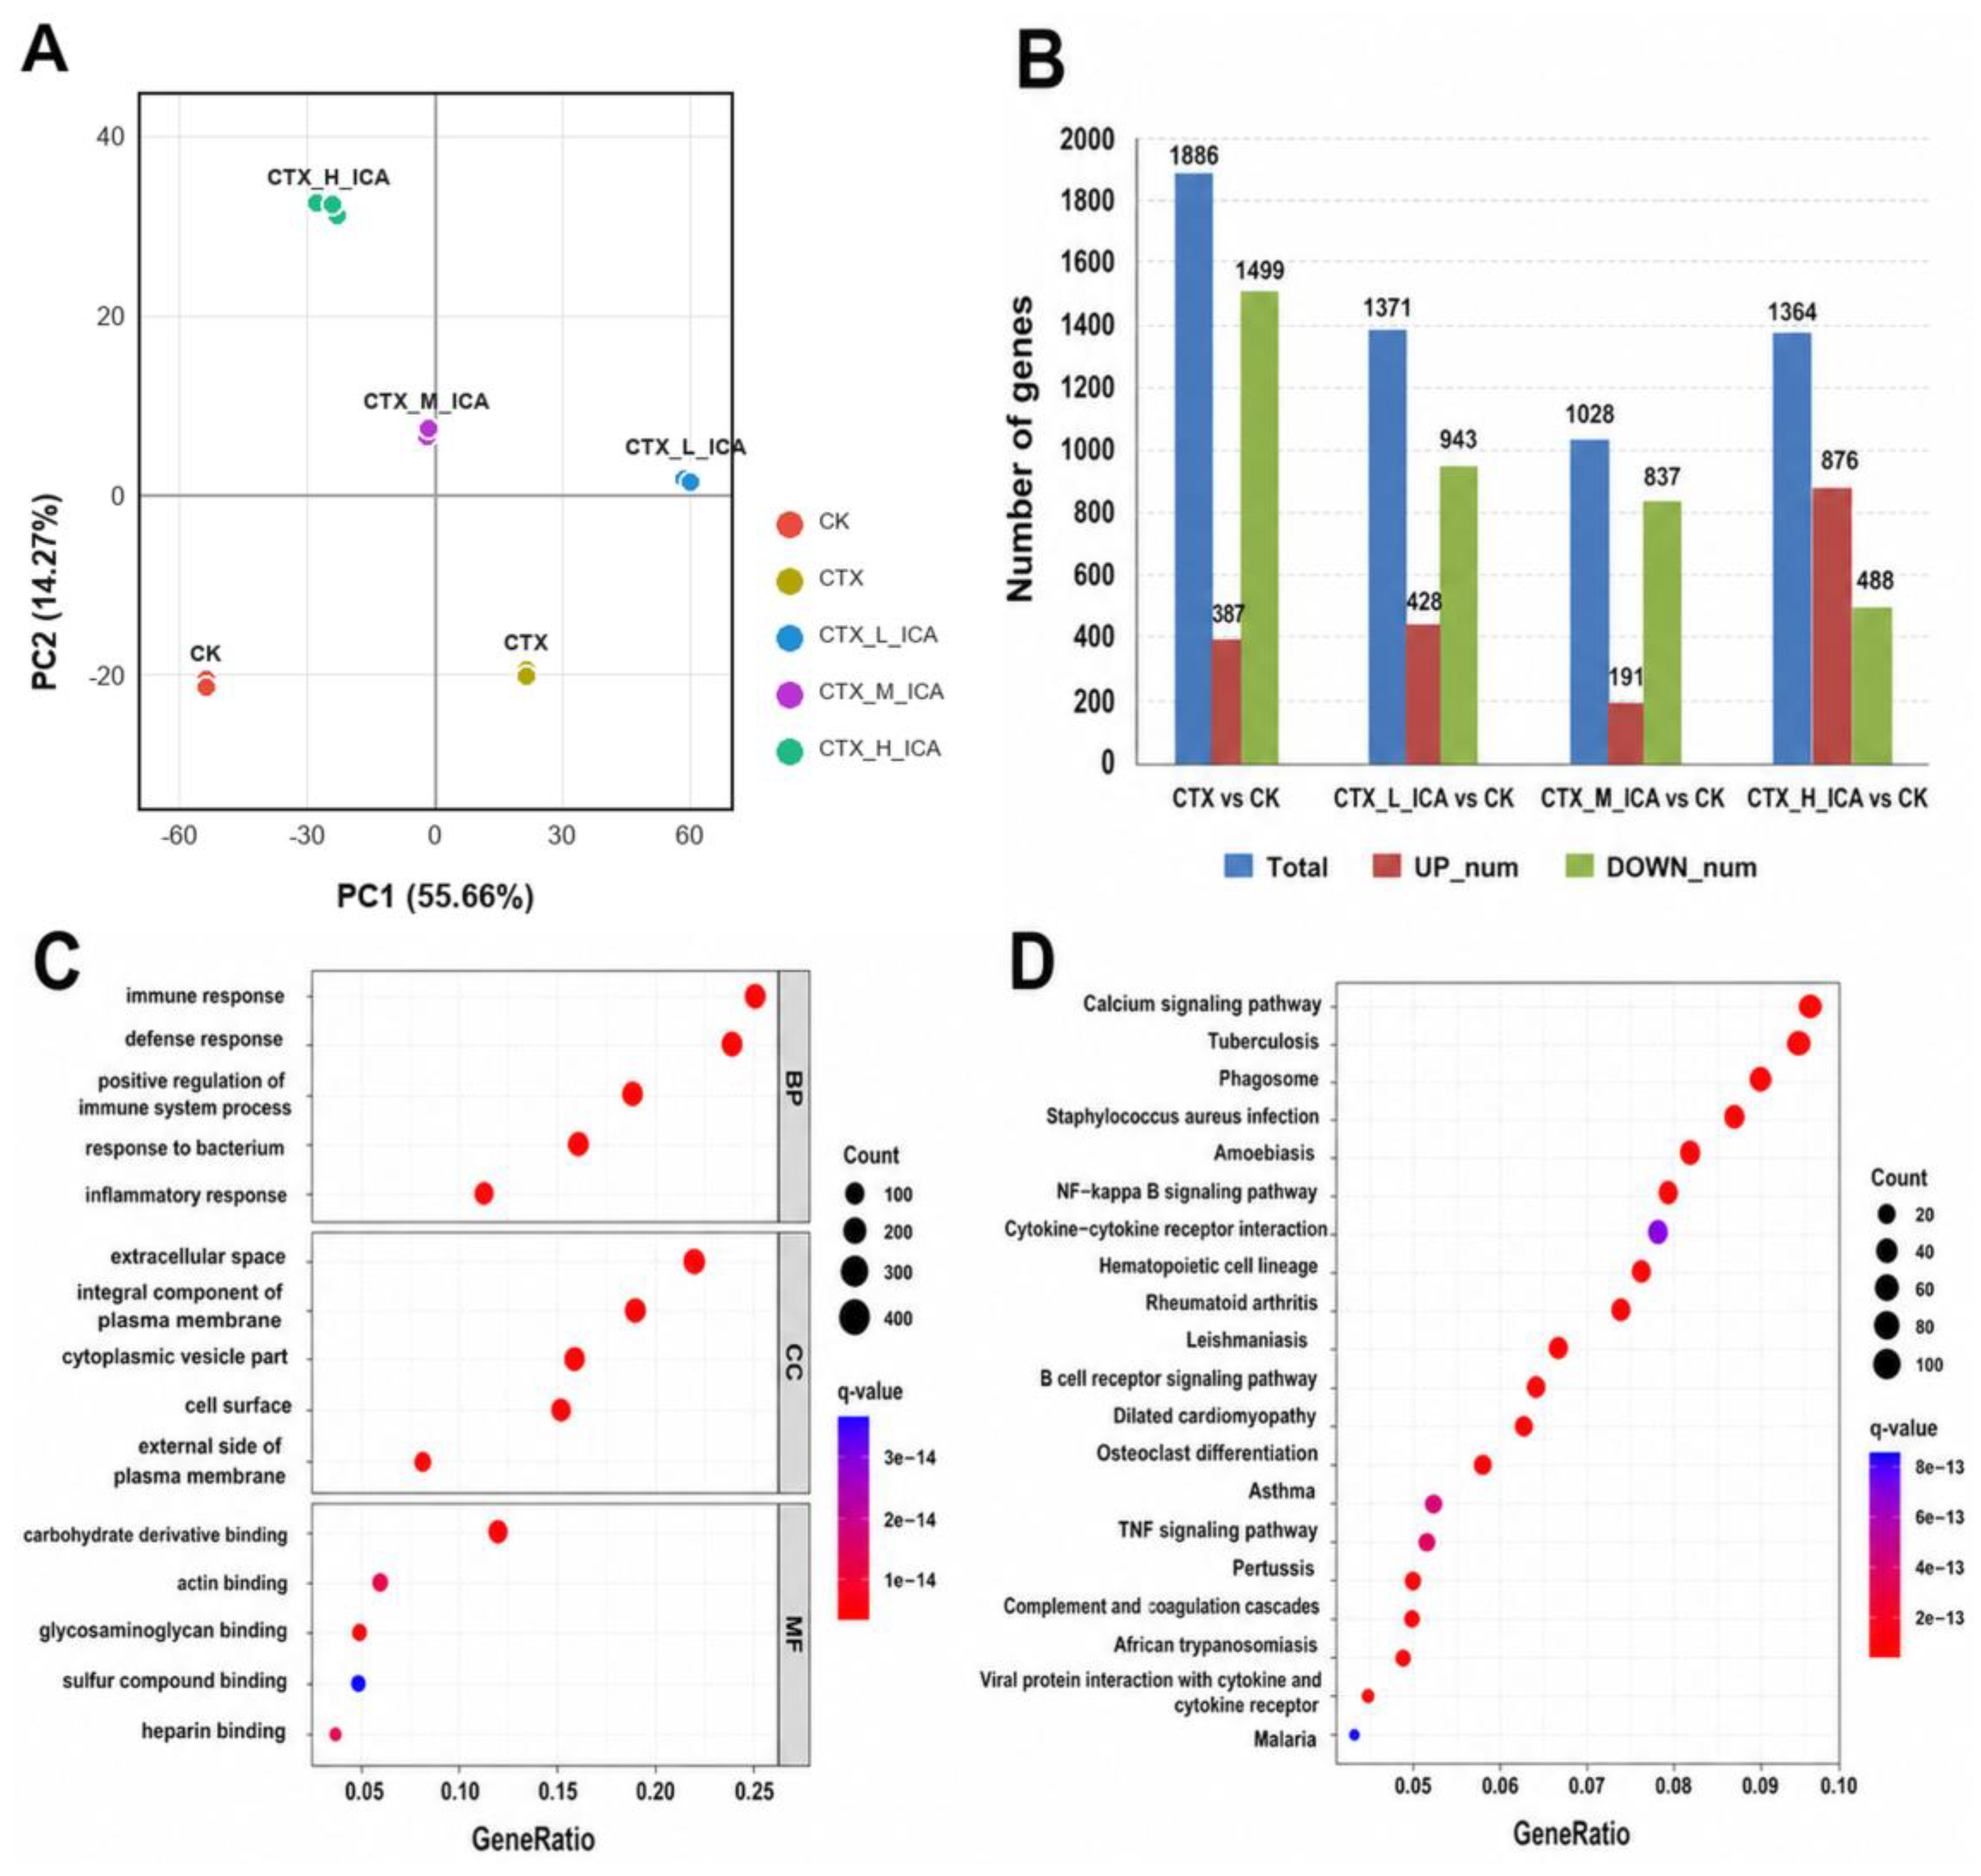
RNA-seq was performed on 15 spleen samples (three per group). Sequencing quality and mapping metrics were consistently high (Table 4). In the all-gene log2(FPKM + 1) PCA used for Figure 2A, PC1 and PC2 explained 55.66% and 14.27% of the variance. Overall transcriptomic separation was supported by permutational multivariate analysis of variance (PERMANOVA) (F = 17.18, R2 = 0.873, p < 0.001; 9999 permutations). Centroid distances were consistent with partial, rather than complete, high-dose convergence toward CK: CTX was 86.50 units from CK, whereas CTX_H_ICA was 65.25 units from CK and 72.52 units from CTX. CTX produced 1886 DEGs, including 1499 downregulated genes. ICA shifted the DEG balance toward upregulation, most prominently at the high dose (Figure 2B). KEGG annotations included immune processes as well as myocardial disease labels (Figure 2C,D); the latter were non-significant after multiple-testing correction and are interpreted as shared stress/immune annotations rather than evidence of cardiac pathology.
Table 4.
Summary of RNA-sequencing data quality and genome mapping statistics.
Figure 2.
Global transcriptomic landscape associated with ICA treatment. (A) PCA of the all-gene log2(FPKM + 1) matrix (PC1, 55.66%; PC2, 14.27%). (B) Numbers of differentially expressed genes (DEGs) in the indicated comparisons. (C,D) Functional enrichment displays. Myocardial disease-related database labels in panel D reflect shared genes and were not significant after multiple-testing correction; they should not be interpreted as evidence of heart-specific pathology.
3.3. Convergence of Core Genes on IL-17 and TLR Signaling
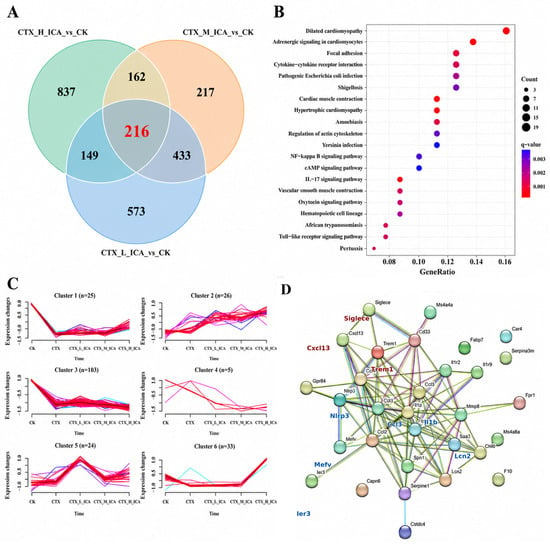
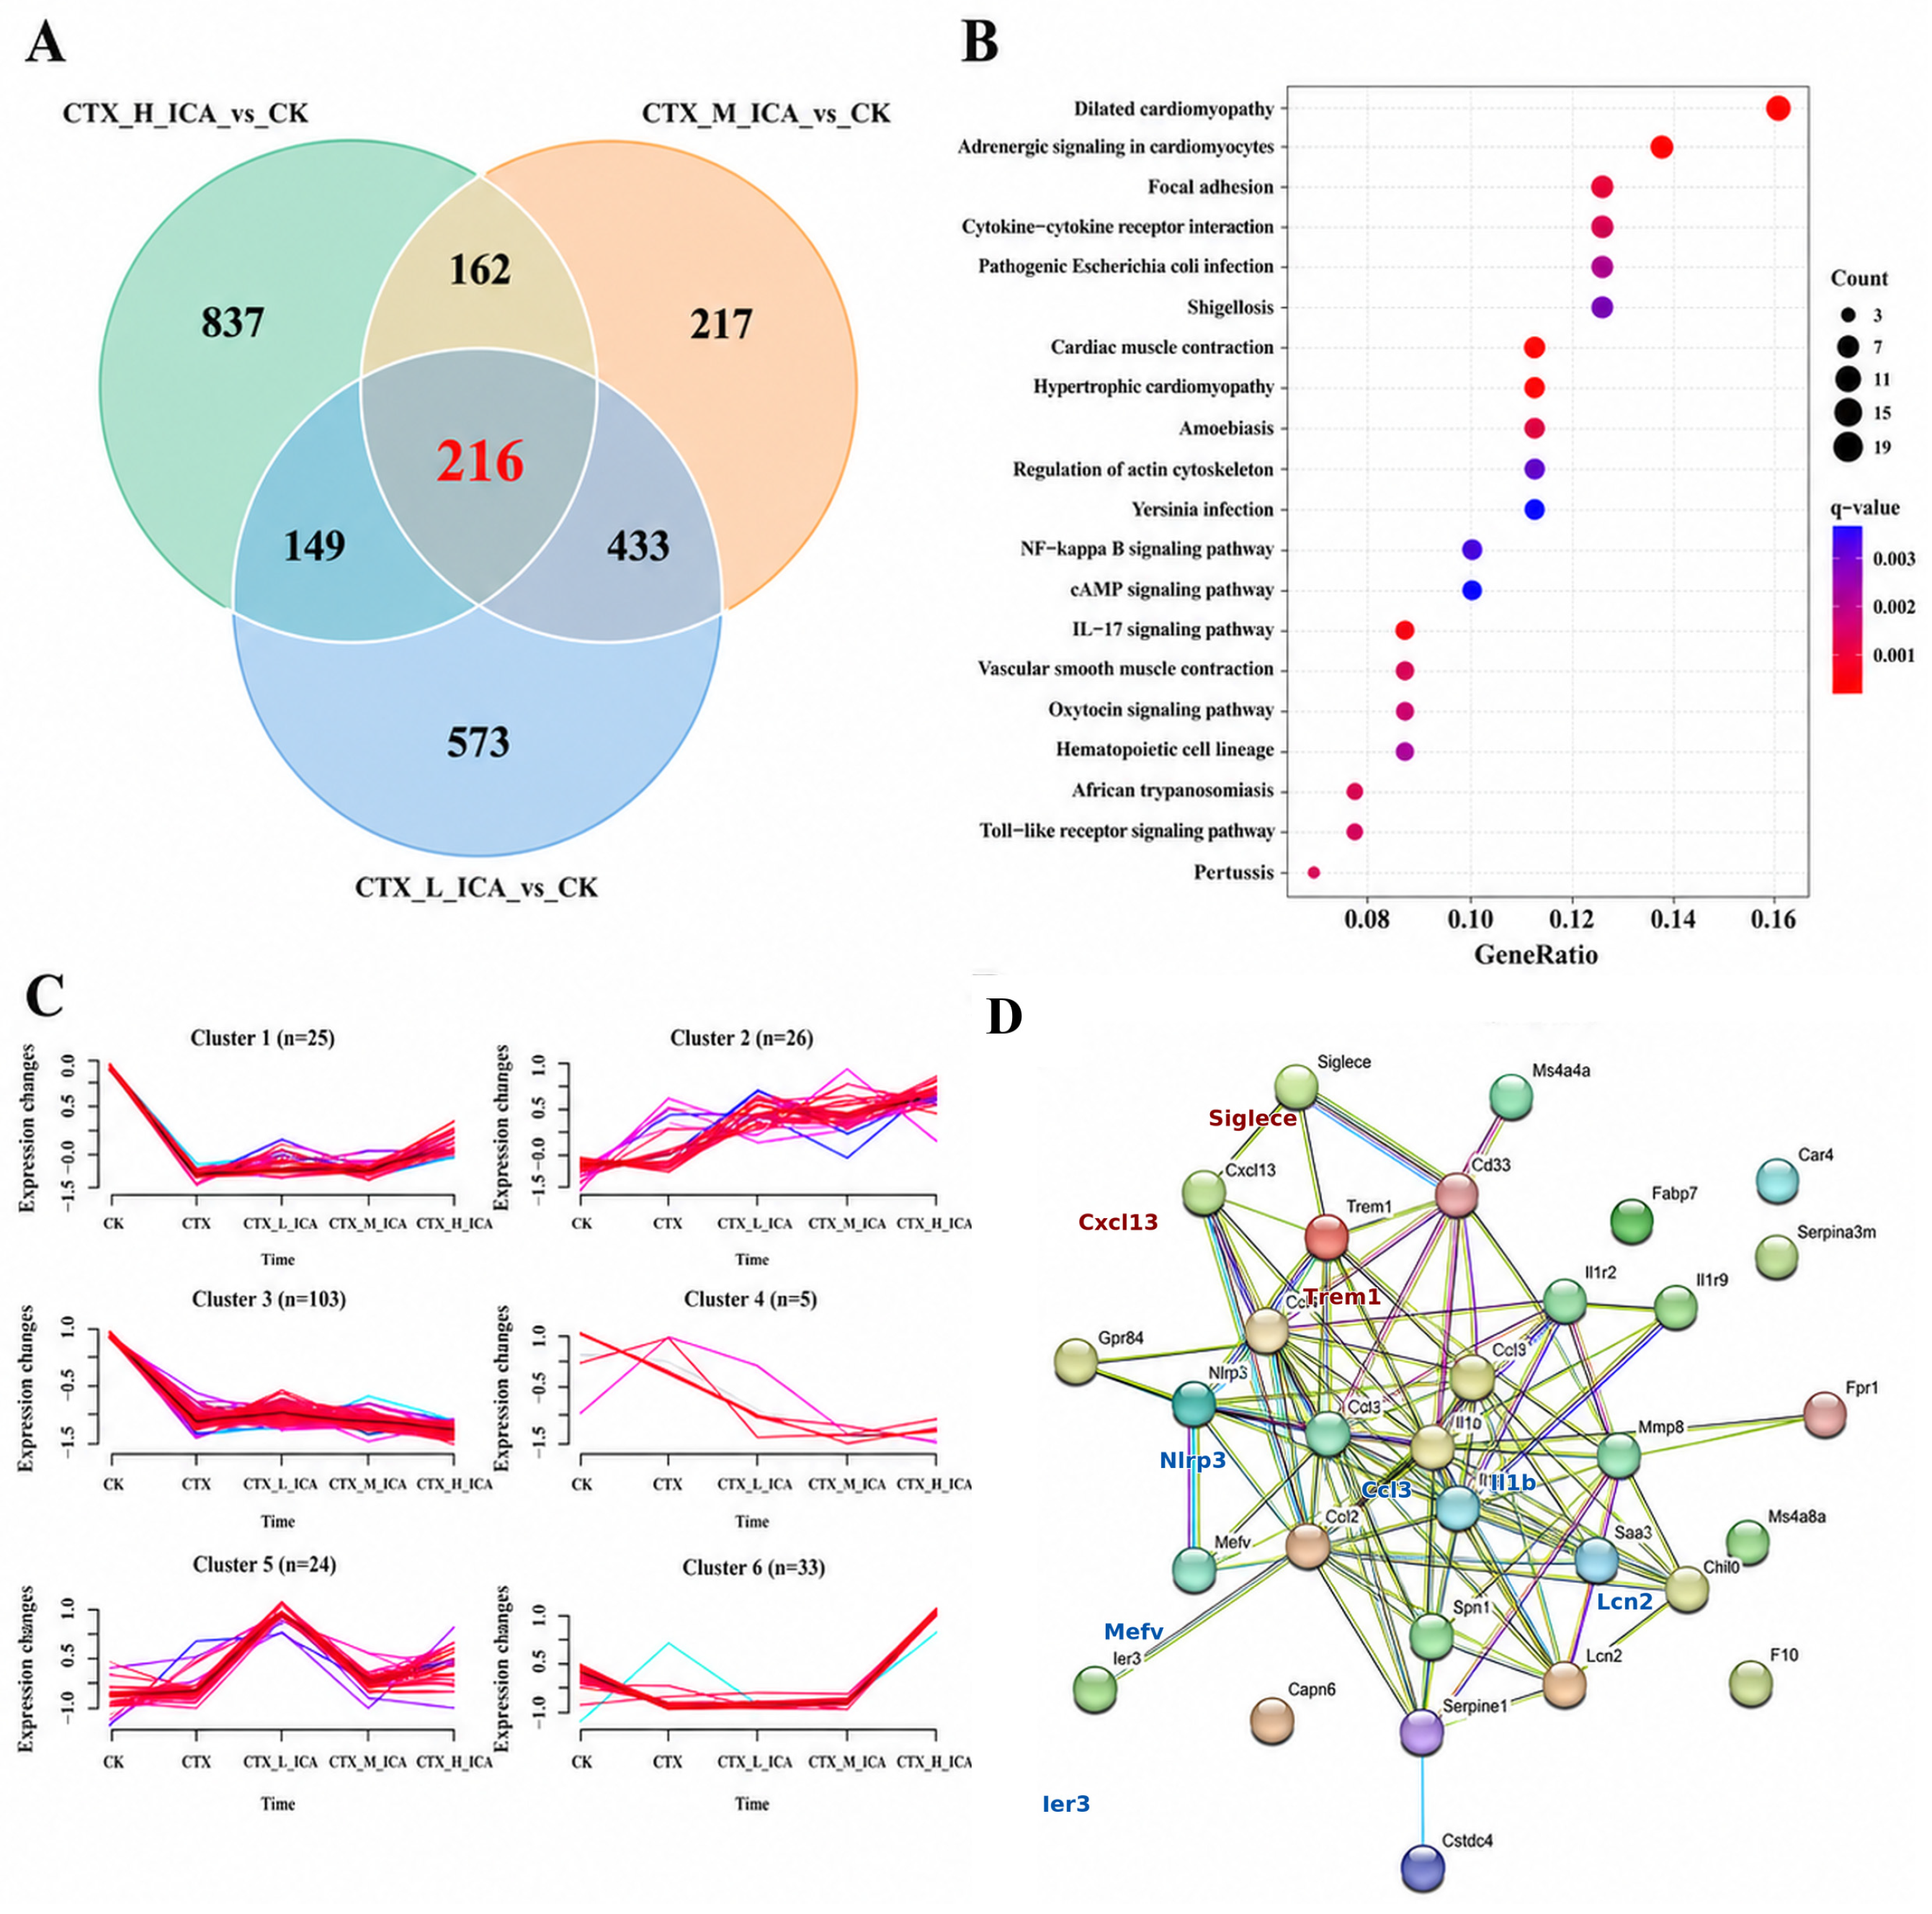
To identify core molecular targets of ICA, DEGs across all treatment doses were intersected, yielding 216 consistently regulated genes (Figure 3A). These core genes were significantly enriched in IL-17 and Toll-like receptor (TLR) signaling pathways (Figure 3B). Trend analysis further highlighted Cluster 6, consisting of 33 genes whose expression was suppressed by CTX and progressively restored by ICA, closely paralleling spleen index recovery (Figure 3C). PPI network analysis of this cluster revealed key immune sensors and effectors, including Il1b, Ccl3, and Cxcl2 (Figure 3D).
Figure 3.
Identification of core ICA-responsive gene clusters and signaling hubs. (A) Intersection analysis of DEGs identifying 216 consistently regulated core genes. (B) Functional enrichment analysis of the identified core genes. (C) Trend analysis showing Cluster 6 genes associated with dose-dependent splenic recovery. (D) Protein–protein interaction (PPI) network of the identified recovery-associated cluster. In panel C, thin colored lines represent individual genes, and the thick red line represents the cluster-level trend.
3.4. WGCNA Identifies Putative Hematopoietic Co-Expression Signals Linked to Splenic Recovery
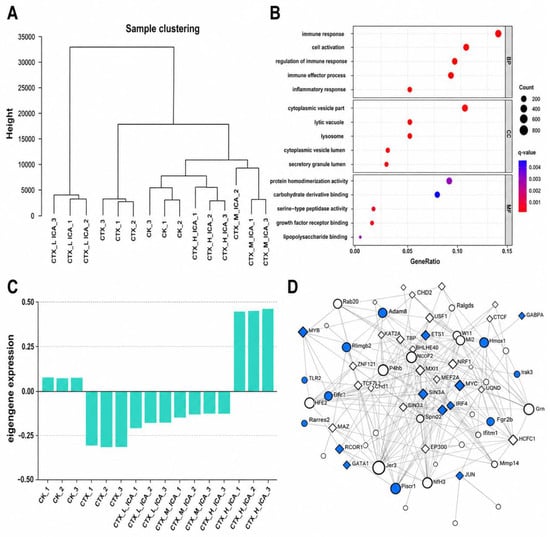
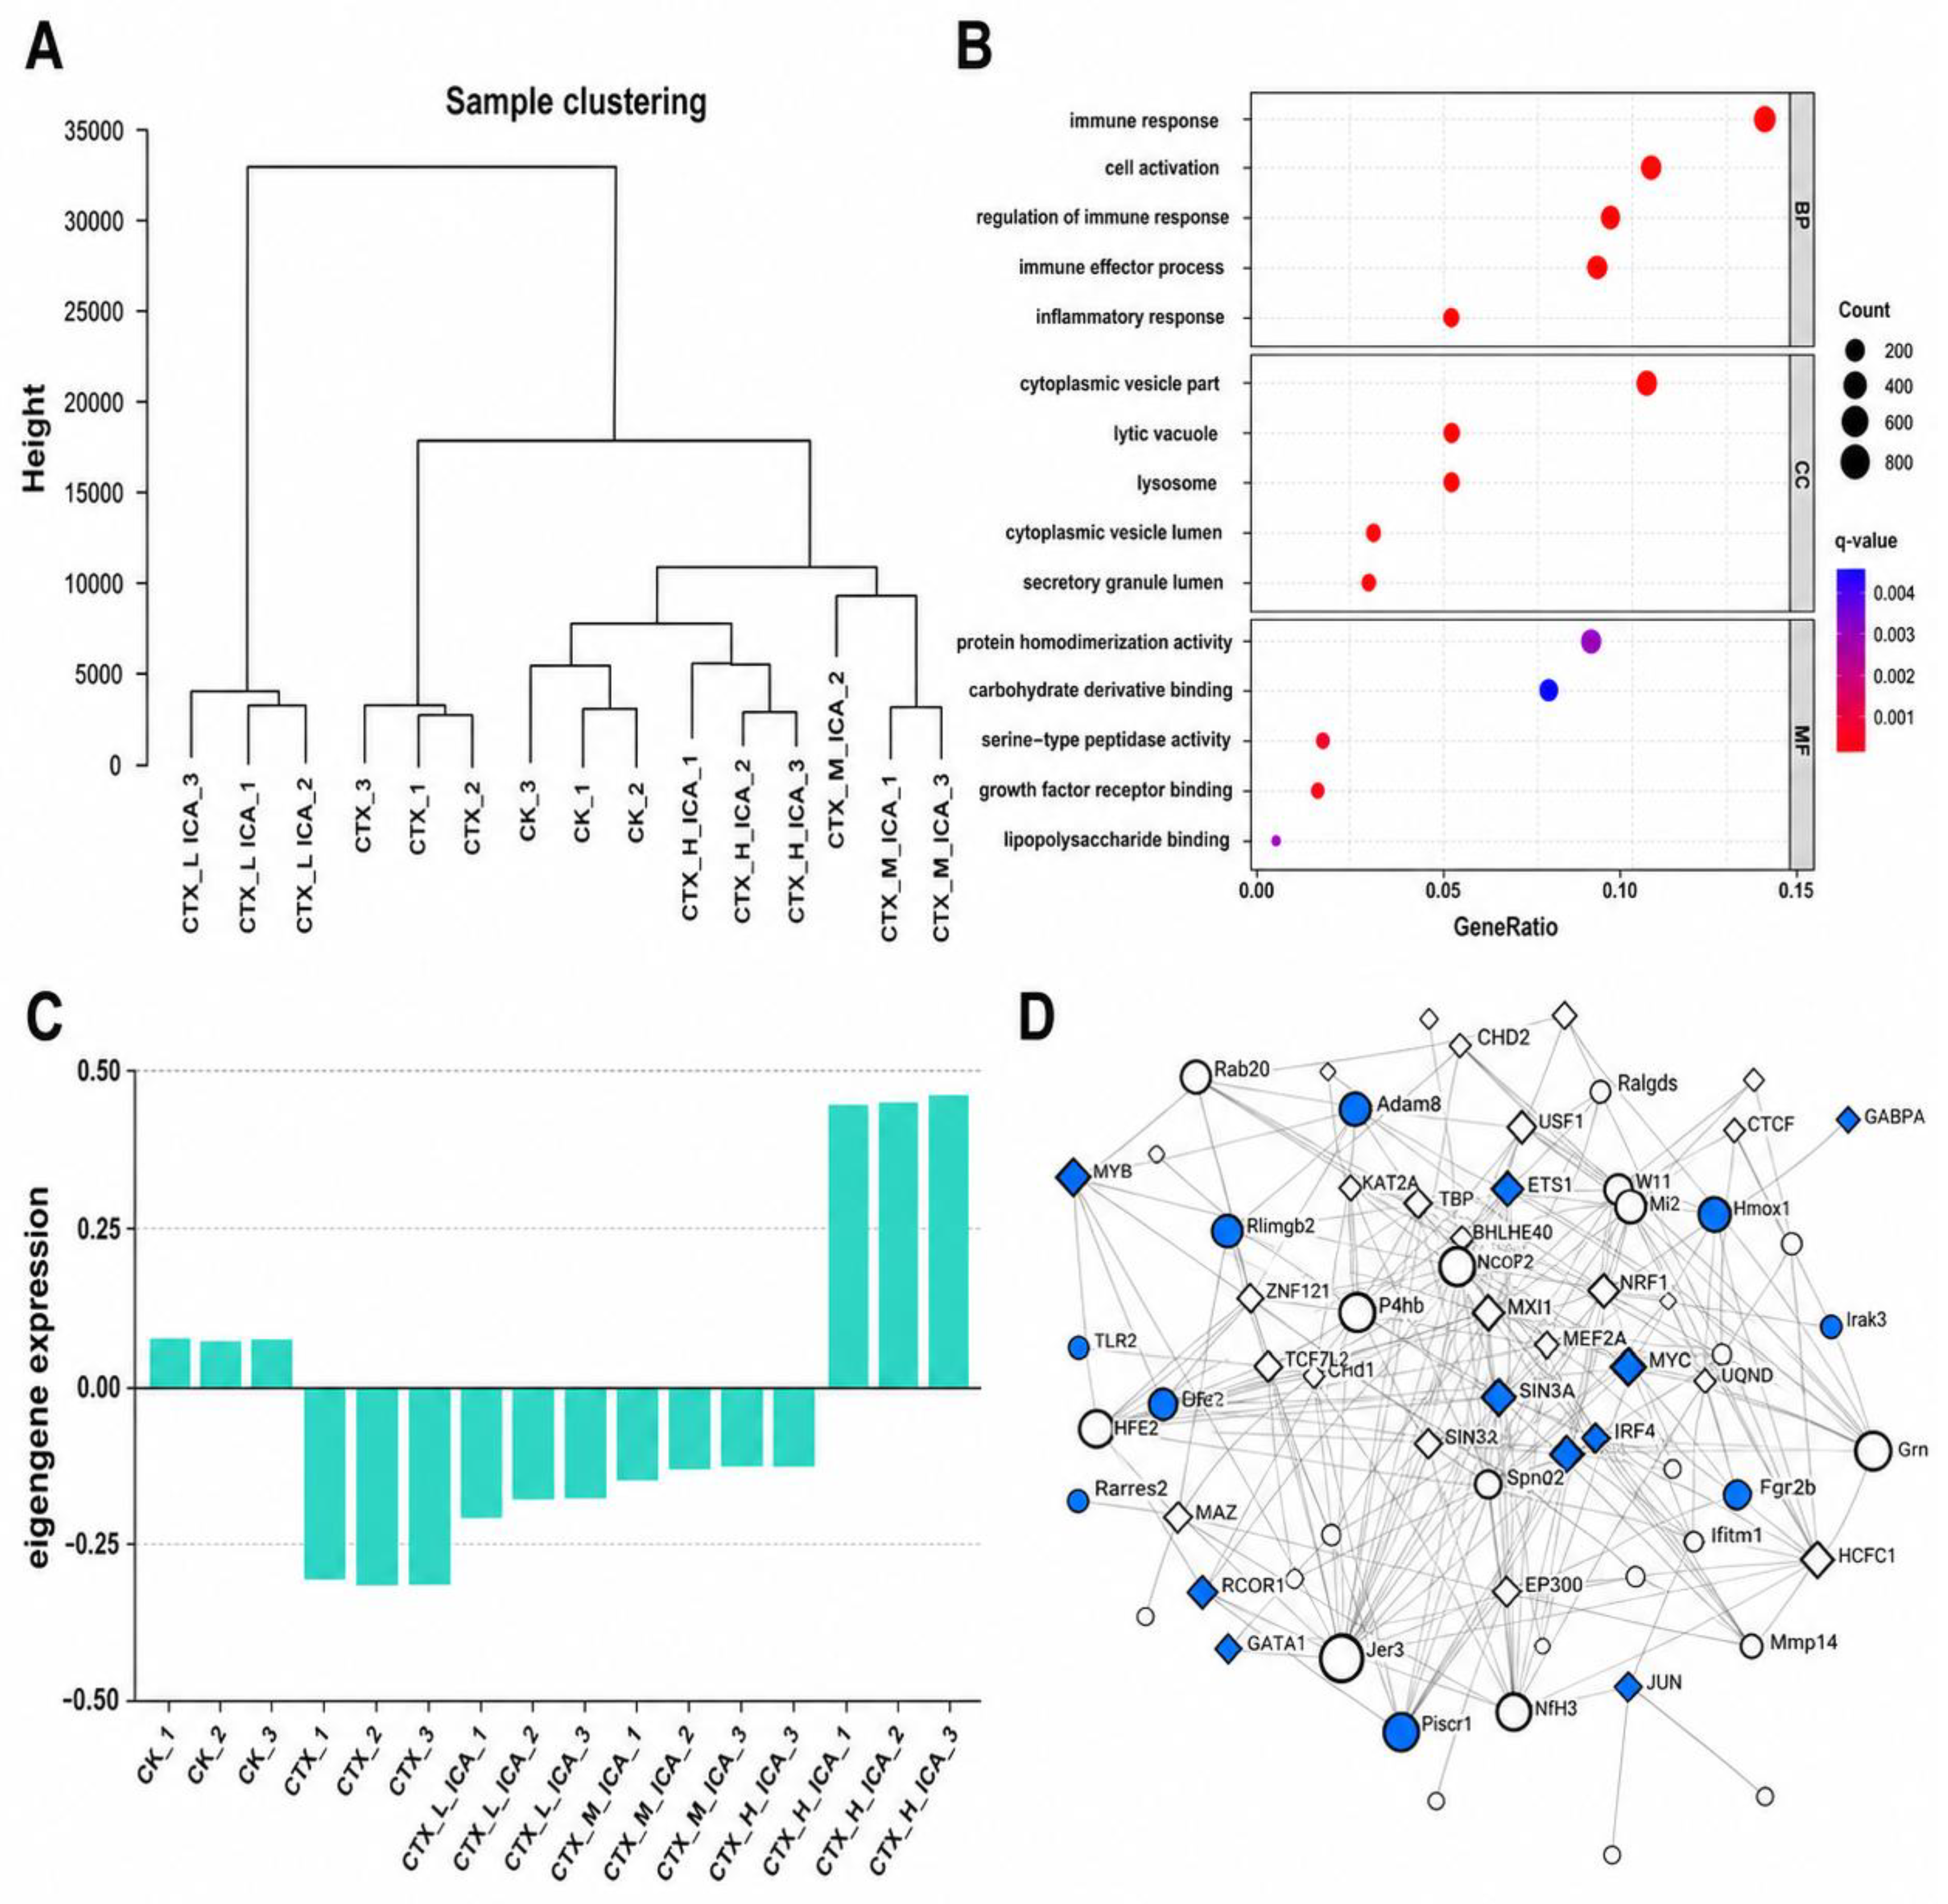
To identify co-expression modules associated with splenic recovery, WGCNA was applied. Sample clustering of the WGCNA input samples is shown in Figure 4A. Functional enrichment of MEturquoise genes indicated immune effector processes and growth factor receptor binding (Figure 4B). The MEturquoise eigengene pattern across individual RNA-seq libraries showed CTX-associated suppression and high-dose ICA-associated recovery (Figure 4C). In the verified WGCNA output, Myb was assigned to the turquoise module and showed module membership with MEturquoise (kME = −0.821642), whereas Gata1 was assigned to the royalblue module and showed stronger membership with MEroyalblue (kME = −0.807335) than with MEturquoise (kME = 0.226820). These findings suggest that ICA-mediated recovery is associated with putative hematopoietic transcription factor-related co-expression signals, but they do not demonstrate direct activation, binding, or causal regulation by Myb or Gata1 (Figure 4D).
Figure 4.
Weighted gene co-expression network analysis (WGCNA)-based identification of recovery-associated co-expression patterns and putative hematopoietic transcription factor-related network signals. (A) Hierarchical sample clustering of the WGCNA expression matrix. (B) Functional enrichment of genes in the MEturquoise module. (C) MEturquoise eigengene expression pattern across individual RNA-seq libraries. (D) Predicted co-expression/regulatory network visualization highlighting selected transcription factor-associated nodes, including Myb and Gata1; these nodes are putative and not experimentally validated regulators.
Re-analysis of the WGCNA output confirmed 19,619 genes from 15 libraries assigned to 31 modules, including 6882 genes in turquoise. The maximum absolute value in the MEturquoise module-trait row was 0.703. Under random gene subsampling, correlations between subsampled and full turquoise eigengenes remained ≥0.9999. Parameter sensitivity was greatest around β = 5–6 and lower at several higher-power settings (Supplementary Figure S2 and Table S1). These findings support internal robustness of the eigengene pattern but do not establish sample-level module preservation.
A marker-based lineage signature analysis was used to assess whether bulk expression shifts might reflect splenic cell composition changes (Supplementary Figure S1 and Table S2). The B-cell signature was high in CK (mean z = 1.897), decreased after CTX (−0.701), and remained below CK in all ICA groups (−0.397 to −0.409). The myeloid/inflammatory signature increased after CTX (0.853), peaked in CTX_L_ICA (1.205), and decreased in CTX_M_ICA (−0.019) and CTX_H_ICA (−0.674). T-cell scores were lowest in CTX_L_ICA (−1.368) and higher in the medium- and high-dose groups (0.606 and 0.742). The erythroid signature was highest in CTX_H_ICA (1.568). Thus, the bulk RNA-seq pattern is compatible with non-uniform lineage shifts and cannot be attributed solely to cell-intrinsic regulation.
3.5. RT-qPCR Validation of ICA-Responsive Innate Immune Genes
RT-qPCR was used as a targeted validation of selected innate immune transcripts rather than as validation of the WGCNA Myb/Gata1 network. The four-gene panel represented inflammasome-related innate sensing (Mefv and Nlrp3), TLR/LPS-associated monocyte-macrophage signaling (Cd14), and immediate-early inflammatory stress response (Ier3). The RT-qPCR data showed strong high-dose ICA-associated rebound of these transcripts (Figure 5A–D; Table 5), supporting modulation of selected innate immune signatures. However, these assays do not establish Myb/Gata1 regulatory activity or validate WGCNA hub gene function.
Figure 5.
Reverse transcription quantitative polymerase chain reaction (RT-qPCR) validation of key immune transcriptomic signatures. Relative mRNA expression levels of (A) Mefv, (B) Cd14, (C) Nlrp3, and (D) Ier3 in splenic tissues. Actin served as the endogenous control. Data represent mean ± SD.
Table 5.
Expression Levels of Immune-Related Genes (Normalized to Actin).
4. Discussion
Chemotherapy-induced immunosuppression remains a dose-limiting complication in oncology. In this study, CTX produced splenic atrophy and systemic toxicity in male mice, and ICA produced a dose-associated phenotype: the medium dose improved spleen index, whereas 80 mg/kg produced the most consistent improvement across spleen index and body weight trajectory [36,37,38]. These findings support phenotypic recovery but do not, by themselves, demonstrate restoration of splenic immune cell composition or microarchitecture.
The transcriptomic evidence supports coordinated innate inflammatory modulation rather than a single linear mechanism. In targeted GSEA, CTX versus CK showed positive enrichment of complement (NES = 1.40, nominal p = 0.010) and chemokine (NES = 1.40, p = 0.014) gene sets. Chemokine signaling was negatively enriched in CTX_H_ICA versus CTX (NES = −1.38, p = 0.037), whereas inflammatory response and TLR gene sets changed in the same direction but were not significant (p = 0.146 and 0.439). Complement and chemokine signaling therefore provide the strongest targeted enrichment evidence. IL-17/TLR, TLR4/MyD88/NF-κB, NLRP3, and Nrf2/HO-1 are discussed as DEG-supported or literature-supported context, not as fully validated pathways in this experiment [6,28,39,40,41].
Direct biochemical or neuroendocrine stress endpoints (including ROS, MDA, antioxidant enzyme activity, glutathione, or corticosterone) were not measured. RNA-seq nevertheless showed transcript-level stress-response patterns: Hmox1, Sod2, Atf3, and Lcn2 increased after CTX, were often highest in CTX_L_ICA, and approached CK levels in CTX_H_ICA. These observations are indirect transcriptional signatures and should not be interpreted as direct measurements of oxidative or systemic stress.
The combined phenotype-transcriptome panel may support preclinical comparison of ICA, its metabolites or analogs, and combination strategies. Mefv, Cd14, Nlrp3, Ier3, selected inflammatory transcripts, and complement/chemokine enrichment may serve as candidate pharmacodynamic readouts. They are not validated clinical biomarkers and require independent cohorts, protein-level assays, cell population measurements, and additional chemotherapy-associated immunosuppression models [42,43].
Network analysis organized individual DEG and enrichment results into phenotype-linked co-expression structures. Myb was assigned to turquoise (kME = −0.822), whereas Gata1 was assigned to royalblue (kME = −0.807; kME with turquoise = 0.227), indicating distinct hematopoietic co-expression contexts. Integration with the enrichment results links complement/chemokine signals to candidate hematopoietic modules [44,45,46,47,48,49], but this is prioritization at the mRNA co-expression level and does not establish direct pathway regulation, transcription-factor binding, or causality.
Nlrp3 transcript abundance should not be equated with NLRP3 inflammasome activation. RNA-seq showed CTX-associated induction of Nlrp3, a further increase in low-dose ICA, and lower expression at medium and high doses relative to CTX, although the high-dose group remained above CK. This non-monotonic pattern is compatible with transcriptional priming and lineage composition changes, but inflammasome activation cannot be inferred because NLRP3 protein, ASC specks, cleaved caspase-1, mature IL-1β/IL-18, and GSDMD cleavage were not measured.
RT-qPCR likewise showed a high-dose Nlrp3 transcript rebound relative to CTX. This result validates an assay-level mRNA pattern, not inflammasome activation, and may reflect recovery of innate transcriptional capacity or regulation at a different level from protein-complex activation.
MYB plausibly links the turquoise co-expression pattern to hematopoietic progenitor and lymphoid programs, whereas GATA1 represents a separate royalblue module signal compatible with erythroid, megakaryocytic, or selected myeloid programs. Because bulk spleen expression is sensitive to lineage composition and no protein, motif, occupancy, or perturbation assays were performed, these associations remain hypothesis-generating.
The phenotype showed a dose-associated pattern: low-dose ICA produced limited recovery; medium-dose ICA produced partial improvement, and 80 mg/kg produced the most consistent recovery in body weight trajectory and spleen index. The transcriptomic response was not uniformly restorative; however, the low-dose group showed pronounced myeloid/inflammatory signatures, and the high-dose group retained a depressed B-cell signature while showing a strong erythroid signature.
At the transcriptomic scale, the depth of CTX-induced suppression warrants comment. Of the 1886 DEGs identified, 1499 (79%) were downregulated, reflecting the predominantly suppressive effect of CTX on the splenic transcriptome. ICA treatment shifted this distribution toward upregulation in a dose-dependent manner, with the high-dose group showing the largest increase in the number of upregulated genes. The 216 genes consistently regulated across all three ICA doses may represent a core transcriptional response to ICA that is detectable even at doses that produce limited phenotypic recovery. The observation that low-dose ICA mobilized a transcriptional response without corresponding organ-level improvement suggests that transcriptional engagement alone is insufficient for splenic recovery; a threshold level of pathway reactivation, achieved more robustly at higher doses, may be required to translate molecular changes into restored spleen mass and function.
Several limitations should be emphasized. Only three RNA-seq libraries per group were analyzed, limiting pairwise multivariate tests and WGCNA generalizability. The study used male mice only. Bulk RNA-seq cannot distinguish cell composition changes from cell-intrinsic regulation. Spleen mass and index do not establish restoration of white pulp, red pulp, marginal zones, or lymphoid follicles because histology and flow cytometry were unavailable. The RT-qPCR panel did not include Myb, Gata1, or WGCNA hub genes, and no protein-level or functional assays were performed. The 0.0577 mg/g CTX_L_ICA value was retained as an authentic phenotype record and was not among the sequenced samples. Larger, sex-balanced cohorts with histology, flow cytometry, protein assays, and independent network preservation are needed.
Myocarditis-related KEGG annotations were non-significant after multiple-testing correction (adjusted p values 0.574–1.000). In the CTX_H_ICA versus CK all-DEG analysis, the viral myocarditis row was driven by Bach2 and Pcdhga4 (adjusted p = 0.972). An immune-focused review identified 334 annotation rows, none with adjusted p < 0.05 (Supplementary Table S3). These labels therefore do not support myocardial pathology [50]. If cardiac effects are examined in future studies, dedicated histological assessment would be required [51].
PERMANOVA supports overall five-group transcriptomic separation, but exact pairwise tests were not significant (all p = 0.143) because each group contained only three libraries. Figure 2A is therefore interpreted as overall structure and partial high-dose convergence, not definitive separation of every pair.
The WGCNA findings are exploratory module-level associations. The internal gene-subsampling and parameter checks do not substitute for formal module preservation in an independent, larger cohort.
Because the present dataset is bulk splenic RNA-seq, marker-based lineage signatures cannot distinguish changes in cell abundance from transcriptional changes within a given cell type. The B-cell depletion, myeloid/inflammatory expansion, T-cell recovery pattern, and high-dose erythroid signature therefore indicate a cell composition confound that should be validated by flow cytometry, histology, or single-cell/spatial transcriptomics in future studies.
Histological validation was not available for the present revision, and this limits the interpretation of spleen weight and spleen index recovery. Although the phenotypic and transcriptomic data suggest ICA-associated splenic recovery, these endpoints cannot determine whether white pulp organization, red pulp architecture, marginal zones, or lymphoid follicles were restored. Future studies should include H&E staining, immunohistochemistry, and/or flow cytometry to directly evaluate splenic tissue architecture and immune cell reconstitution after CTX and ICA treatment.
The RT-qPCR panel did not include Myb, Gata1, or representative WGCNA hub genes. Therefore, the RT-qPCR results validate selected innate immune transcript signatures but do not provide independent experimental validation of the putative Myb/Gata1-associated co-expression network. Future studies should include RT-qPCR and protein-level validation of Myb, Gata1, and prioritized WGCNA hub genes, together with perturbation or occupancy assays where feasible.
In summary, ICA produced dose-associated attenuation of CTX-induced body weight loss and splenic atrophy, with the most consistent phenotype at 80 mg/kg. This recovery coincided with partial and non-uniform transcriptomic remodeling, including complement/chemokine modulation, persistent B-cell signature depression, and candidate Myb- and Gata1-associated co-expression signals. The study provides a hypothesis-generating framework for ICA-associated splenic recovery but does not establish tissue-architecture restoration, transcription-factor binding, or causal pathway regulation.
Supplementary Materials
The following supporting information can be downloaded at https://www.mdpi.com/article/10.3390/immuno6030053/s1: Figure S1. Marker-based B-cell, T-cell, myeloid/inflammatory, and erythroid lineage-signature scores calculated from z-standardized log2(FPKM + 1) values across the 15 RNA-seq libraries; points show individual samples and bars show group mean ± SD. Figure S2. Internal turquoise-module eigengene sensitivity under random subsampling of 50%, 70%, 80%, or 90% of module genes (200 iterations per fraction); this analysis does not represent sample-level module preservation. Table S1. WGCNA parameters, module counts, and parameter/gene-subsampling sensitivity results. Table S2. Marker-gene mapping, per-sample lineage scores, group summaries, and statistics. Table S3. Myocarditis-related and immune-focused KEGG annotation audit, including contributing genes and adjusted p values. Table S4. PCA coordinates, overall and pairwise PERMANOVA results, and centroid distances. Table S5. Authoritative raw spleen-index values, group summaries, and provenance note. Table S6. Targeted GSEA summary, including matched-gene counts and nominal p values.
Author Contributions
Conceptualization, N.L., S.Y. and L.L.; methodology, N.L., Z.D., W.J. and F.Z.; software, N.L., S.J. and Z.D.; validation, N.L., Z.D. and W.J.; formal analysis, W.J.; investigation, N.L., S.J., Z.D., F.Z. and D.M.; resources, N.L., S.J., W.J., F.Z. and D.M.; data curation, N.L., S.J., Z.D. and D.M.; writing—original draft preparation, N.L.; writing—review and editing, S.Y. and L.L.; visualization, N.L.; supervision, S.Y. and L.L.; project administration, L.L.; funding acquisition, L.L. All authors have read and agreed to the published version of the manuscript.
Funding
This work was supported by the Natural Science Foundation of Liaoning Province of China (no. 2022-NLTS-15-02 and 2023-MSLH-063) and the Science Foundation of Educational Commission of Liaoning Province of China (no. LJKMZ20221763 and LJKMZ20221762). The funders had no role in the study design; collection, analysis, or interpretation of data; writing of the manuscript; or the decision to submit the work for publication.
Institutional Review Board Statement
The animal study protocol was approved by the Institutional Animal Care and Use Committee of Medical College of Liaodong University (approval no. LDUMC20250118; 18 January 2025).
Informed Consent Statement
Not applicable.
Data Availability Statement
The processed results supporting the additional analyses are provided in the Supplementary Materials. Raw sequencing files and complete expression matrices are available from the corresponding authors upon reasonable request.
Conflicts of Interest
The authors declare no conflicts of interest.
Abbreviations
| ICA | Icariin |
| CTX | Cyclophosphamide |
| HSPC | Hematopoietic stem and progenitor cell |
| DEGs | Differentially expressed genes |
| KEGG | Kyoto Encyclopedia of Genes and Genomes |
| WGCNA | Weighted gene co-expression network analysis |
| PPI | Protein–protein interaction |
| TF | Transcription factor |
References
- Emadi, A.; Jones, R.J.; Brodsky, R.A. Cyclophosphamide and cancer: Golden anniversary. Nat. Rev. Clin. Oncol. 2009, 6, 638–647. [Google Scholar] [CrossRef] [Scilit] [PubMed]
- Brodsky, R.A. High-dose cyclophosphamide for autoimmunity and alloimmunity. Immunol. Res. 2010, 47, 179–184. [Google Scholar] [CrossRef] [Scilit] [PubMed]
- Ahlmann, M.; Hempel, G. The effect of cyclophosphamide on the immune system: Implications for clinical cancer therapy. Cancer Chemother. Pharmacol. 2016, 78, 661–671. [Google Scholar] [CrossRef] [Scilit] [PubMed]
- Petroni, G.; Formenti, S.C.; Chen-Kiang, S.; Galluzzi, L. Immunomodulation by anticancer cell cycle inhibitors. Nat. Rev. Immunol. 2020, 20, 669–679. [Google Scholar] [CrossRef] [Scilit] [PubMed]
- Zhao, Q.; Wang, J.; Liang, H.; Guo, W.; Chu, Y.; Liu, L.; Kang, W. Prevention of cyclophosphamide-induced immune suppression by polysaccharides from Apocynum venetum flowers via enhancing immune response, reducing oxidative stress, and regulating gut microbiota in mice. Front. Pharmacol. 2024, 15, 1354794. [Google Scholar] [CrossRef] [Scilit] [PubMed]
- Salah, R.; El-Sayed, G.; El-Sherbini, E.S.; El-Adl, M. Vinpocetine alleviated lung injury induced by cyclophosphamide in rats via modulation of NLRP3 inflammasome, NF-κB, and apoptotic pathways. Biochem. Biophys. Res. Commun. 2025, 778, 152345. [Google Scholar] [CrossRef] [Scilit] [PubMed]
- Dale, D.C.; Crawford, J.; Klippel, Z.; Reiner, M.; Osslund, T.; Fan, E.; Morrow, P.K.; Allcott, K.; Lyman, G.H. A systematic literature review of the efficacy, effectiveness, and safety of filgrastim. Support. Care Cancer 2018, 26, 7–20. [Google Scholar] [PubMed]
- Lyman, G.H.; Yau, L.; Nakov, R.; Krendyukov, A. Overall survival and risk of second malignancies with cancer chemotherapy and G-CSF support. Ann. Oncol. 2018, 29, 1903–1910. [Google Scholar] [CrossRef] [Scilit] [PubMed]
- Lyman, G.H.; Reiner, M.; Morrow, P.K.; Crawford, J. The effect of filgrastim or pegfilgrastim on survival outcomes of patients with cancer receiving myelosuppressive chemotherapy. Ann. Oncol. 2015, 26, 1452–1458. [Google Scholar] [CrossRef] [Scilit] [PubMed]
- Minculescu, L.; Sengelov, H.; Marquart, H.V.; Ryder, L.P.; Fischer-Nielsen, A.; Haastrup, E. Granulocyte Colony-Stimulating Factor Effectively Mobilizes TCR γδ and NK Cells Providing an Allograft Potentially Enhanced for the Graft-Versus-Leukemia Effect for Allogeneic Stem Cell Transplantation. Front. Immunol. 2021, 12, 625165. [Google Scholar] [CrossRef] [Scilit] [PubMed]
- Yu, X.; Zhu, L.; Wang, T.; Chen, J. Immune microenvironment of cholangiocarcinoma: Biological concepts and treatment strategies. Front. Immunol. 2023, 14, 1037945. [Google Scholar] [CrossRef] [Scilit] [PubMed]
- Middleton, E., Jr.; Kandaswami, C.; Theoharides, T.C. The effects of plant flavonoids on mammalian cells: Implications for inflammation, heart disease, and cancer. Pharmacol. Rev. 2000, 52, 673–751. [Google Scholar] [CrossRef] [Scilit]
- Hostetler, G.L.; Ralston, R.A.; Schwartz, S.J. Flavones: Food Sources, Bioavailability, Metabolism, and Bioactivity. Adv. Nutr. 2017, 8, 423–435. [Google Scholar] [CrossRef] [Scilit] [PubMed]
- Fang, J.; Zhang, Y. Icariin, an Anti-atherosclerotic Drug from Chinese Medicinal Herb Horny Goat Weed. Front. Pharmacol. 2017, 8, 734. [Google Scholar] [CrossRef] [Scilit] [PubMed]
- Wang, S.; Ma, J.; Zeng, Y.; Zhou, G.; Wang, Y.; Zhou, W.; Sun, X.; Wu, M. Icariin, an Up-and-Coming Bioactive Compound Against Neurological Diseases: Network Pharmacology-Based Study and Literature Review. Drug Des. Dev. Ther. 2021, 15, 3619–3641. [Google Scholar] [CrossRef] [Scilit] [PubMed]
- Zhuang, W.; Sun, N.; Gu, C.; Liu, S.; Zheng, Y.; Wang, H.; Tong, X.; Song, J. A literature review on Epimedium, a medicinal plant with promising slow aging properties. Heliyon 2023, 9, e21226. [Google Scholar] [CrossRef] [Scilit] [PubMed]
- Bi, Z.; Zhang, W.; Yan, X. Anti-inflammatory and immunoregulatory effects of icariin and icaritin. Biomed. Pharmacother. 2022, 151, 113180. [Google Scholar] [CrossRef] [Scilit] [PubMed]
- Liu, Z.-Q.; Luo, X.-Y.; Sun, Y.-X.; Wu, W.; Liu, C.-M.; Liu, Z.-Q.; Liu, S.-Y. The antioxidative effect of icariin in human erythrocytes against free-radical-induced haemolysis. J. Pharm. Pharmacol. 2004, 56, 1557–1562. [Google Scholar] [CrossRef] [Scilit] [PubMed]
- Hostetler, G.; Riedl, K.; Cardenas, H.; Diosa-Toro, M.; Arango, D.; Schwartz, S.; Doseff, A.I. Flavone deglycosylation increases their anti-inflammatory activity and absorption. Mol. Nutr. Food Res. 2012, 56, 558–569. [Google Scholar] [CrossRef] [Scilit] [PubMed]
- El-Shitany, N.A.; Eid, B.G. Icariin modulates carrageenan-induced acute inflammation through HO-1/Nrf2 and NF-κB signaling pathways. Biomed. Pharmacother. 2019, 120, 109567. [Google Scholar] [CrossRef] [Scilit] [PubMed]
- Xiang, S.; Zhao, L.; Tang, C.; Ling, L.; Xie, C.; Shi, Y.; Liu, W.; Li, X.; Cao, Y. Icariin inhibits osteoblast ferroptosis via Nrf2/HO-1 signaling and enhances healing of osteoporotic fractures. Eur. J. Pharmacol. 2024, 965, 176244. [Google Scholar] [CrossRef] [Scilit] [PubMed]
- Liu, Y.; Zhong, H.; Liu, W.; He, X.; Zhan, X.; Sun, C. Icariin alleviates the apoptosis of chondrocytes in osteoarthritis through regulating SIRT-1-Nrf2-HO-1 signaling. Chem. Biol. Drug Des. 2024, 103, e14518. [Google Scholar] [CrossRef] [Scilit] [PubMed]
- Xu, C.-Q.; Liu, B.-J.; Wu, J.-F.; Xu, Y.-C.; Duan, X.-H.; Cao, Y.-X.; Dong, J.-C. Icariin attenuates LPS-induced acute inflammatory responses: Involvement of PI3K/Akt and NF-κB signaling pathway. Eur. J. Pharmacol. 2010, 642, 146–153. [Google Scholar] [CrossRef] [Scilit] [PubMed]
- Duan, S.; Ding, Z.; Liu, C.; Wang, X.; Dai, E. Icariin suppresses nephrotic syndrome by inhibiting pyroptosis and epithelial-to-mesenchymal transition. PLoS ONE 2024, 19, e0298353. [Google Scholar] [CrossRef] [Scilit] [PubMed]
- Lu, F.; Li, L.; Zheng, B.; Wang, C.; Liu, Z.; Huang, X.; Song, L.; Ding, C.; Li, Y. Icariin alleviates cognitive dysfunction by reducing neuroinflammation via the cGAS-STING pathway. J. Ethnopharmacol. 2025, 350, 120010. [Google Scholar] [CrossRef] [Scilit] [PubMed]
- Gao, J.; Gao, J.H.; Zhang, Y.F.; Gao, D.; Zhang, Y.P. The multifaceted regulatory effect of icariin on macrophages: A mini-review. Front. Immunol. 2026, 17, 1765533. [Google Scholar] [CrossRef] [Scilit] [PubMed]
- Shen, R.; Wang, J.H. The effect of icariin on immunity and its potential application. Am. J. Clin. Exp. Immunol. 2018, 7, 50–56. [Google Scholar] [PubMed]
- Yi, Y.S. Flavonoids: Nutraceuticals for Rheumatic Diseases via Targeting of Inflammasome Activation. Int. J. Mol. Sci. 2021, 22, 488. [Google Scholar] [CrossRef] [Scilit] [PubMed]
- Li, C.; Yang, S.; Ma, H.; Ruan, M.; Fang, L.; Cheng, J. Influence of icariin on inflammation, apoptosis, invasion, and tumor immunity in cervical cancer by reducing the TLR4/MyD88/NF-κB and Wnt/β-catenin pathways. Cancer Cell Int. 2021, 21, 206. [Google Scholar] [CrossRef] [Scilit] [PubMed]
- Baghban, R.; Roshangar, L.; Jahanban-Esfahlan, R.; Seidi, K.; Ebrahimi-Kalan, A.; Jaymand, M.; Kolahian, S.; Javaheri, T.; Zare, P. Tumor microenvironment complexity and therapeutic implications at a glance. Cell Commun. Signal. 2020, 18, 59. [Google Scholar] [CrossRef] [Scilit] [PubMed]
- Tan, P.; Wei, X.; Huang, H.; Wang, F.; Wang, Z.; Xie, J.; Wang, L.; Liu, D.; Hu, Z. Application of omics technologies in studies on antitumor effects of Traditional Chinese Medicine. Chin. Med. 2024, 19, 123. [Google Scholar] [CrossRef] [Scilit] [PubMed]
- Zhang, B.; Horvath, S. A general framework for weighted gene co-expression network analysis. Stat. Appl. Genet. Mol. Biol. 2005, 4, 1128. [Google Scholar] [CrossRef] [Scilit] [PubMed]
- Langfelder, P.; Horvath, S. WGCNA: An R package for weighted correlation network analysis. BMC Bioinform. 2008, 9, 559. [Google Scholar] [CrossRef] [Scilit] [PubMed]
- Pei, G.; Chen, L.; Zhang, W. WGCNA Application to Proteomic and Metabolomic Data Analysis. In Methods in Enzymology; Academic Press: Cambridge, MA, USA, 2017; Volume 585, pp. 135–158. [Google Scholar]
- Lyu, X.; Shi, J.; Liu, Q.; Jiang, M.; Liu, X.; Li, Y.; Ding, S.; Dai, X. Immunosuppression of spleen in mice treated with erythropoietin: Transcriptomic and immunological analysis. Front. Immunol. 2025, 16, 1560589. [Google Scholar] [CrossRef] [Scilit] [PubMed]
- Lee, S.Y.; Park, S.Y.; Park, H.J. Immuno-Enhancing Effects of Galium aparine L. in Cyclophosphamide-Induced Immunosuppressed Animal Models. Nutrients 2024, 16, 597. [Google Scholar] [CrossRef] [Scilit] [PubMed]
- Shi, M.; Kan, H.; Tang, Y.; Tian, L.; Guo, X.; Chen, W.; Geng, J.; Zong, Y.; Bi, Y.; He, Z. Icariin ameliorates cyclophosphamide-induced renal encephalopathy by modulating the NF-κB and Keap1-Nrf2 signaling pathways. Int. J. Mol. Sci. 2025, 26, 4838. [Google Scholar] [CrossRef] [Scilit] [PubMed]
- Yang, C.; Xu, Y.; Gong, F.; Li, S.; Zhan, H.; Huang, Z.; Wang, M.; Li, H.; Huang, H. Shengxian decoction alleviates cyclophosphamide-induced immunosuppression via improving B cell-mediated immune responses. Front. Pharmacol. 2025, 16, 1565451. [Google Scholar] [CrossRef] [Scilit] [PubMed]
- Mills, K.H.G. IL-17 and IL-17-producing cells in protection versus pathology. Nat. Rev. Immunol. 2023, 23, 38–54. [Google Scholar] [CrossRef] [Scilit] [PubMed]
- Koerber, R.-M.; Krollmann, C.; Cieslak, K.; Tregel, E.; Saenz, M.L.; Brümmendorf, T.H.; Koschmieder, S.; Griesshammer, M.; Gütgemann, I.; Baldauf, C.K.; et al. NLRP3-induced systemic inflammation controls the development of JAK2V617F mutant myeloproliferative neoplasms. Nat. Commun. 2025, 16, 10591. [Google Scholar] [CrossRef] [Scilit] [PubMed]
- Alruhaimi, R.S.; Hassanein, E.H.M.; Alnasser, S.M.; Ahmeda, A.F.; Althagafy, H.S.; Allam, A.M.T.; Qebesy, H.S.; Mahmoud, A.M. Modulation of NF-κB/NLRP3 inflammasome axis, Nrf2/HO-1 signaling and attenuation of oxidative stress mediate the protective effect of ambroxol against cyclophosphamide cardiotoxicity. Biochem. Biophys. Res. Commun. 2025, 776, 152242. [Google Scholar] [CrossRef] [Scilit] [PubMed]
- Wu, D.-H.; Zhao, Z.-L.; Yin, W.-T.; Liu, H.; Xiang, X.-Y.; Zhu, L.-J.; Li, J.-Q.; Yan, Z.-H.; Li, Y.-J.; Jian, Y.-P.; et al. STING exerts antiviral innate immune response by activating pentose phosphate pathway. Cell Commun. Signal. 2024, 22, 599. [Google Scholar] [CrossRef] [Scilit] [PubMed]
- Huang, Y.; Wu, F.; Zhan, T.; Cao, X.; Bao, W.; Feng, G.; Ni, J.; Wang, Y.; Li, H.; Chen, T.; et al. Icariin rescues immune dysfunction in sepsis through RSK2-driven YAP-cGAS-IFN-β signaling activation. Phytomedicine 2025, 149, 157524. [Google Scholar] [CrossRef] [Scilit] [PubMed]
- Gautam, S.; Fioravanti, J.; Zhu, W.; Le Gall, J.B.; Brohawn, P.; Lacey, N.E.; Hu, J.; Hocker, J.D.; Hawk, N.V.; Kapoor, V.; et al. The transcription factor c-Myb regulates CD8+ T cell stemness and antitumor immunity. Nat. Immunol. 2019, 20, 337–349. [Google Scholar] [CrossRef] [Scilit] [PubMed]
- Wang, H.-Y.; Chen, J.-Y.; Li, Y.; Zhang, X.; Liu, X.; Lu, Y.; He, H.; Li, Y.; Chen, H.; Liu, Q.; et al. Single-cell RNA sequencing illuminates the ontogeny, conservation and diversification of cartilaginous and bony fish lymphocytes. Nat. Commun. 2024, 15, 7627. [Google Scholar] [CrossRef] [Scilit] [PubMed]
- Nei, Y.; Obata-Ninomiya, K.; Tsutsui, H.; Ishiwata, K.; Miyasaka, M.; Matsumoto, K.; Nakae, S.; Kanuka, H.; Inase, N.; Karasuyama, H. GATA-1 regulates the generation and function of basophils. Proc. Natl. Acad. Sci. USA 2013, 110, 18620–18625. [Google Scholar] [CrossRef] [Scilit] [PubMed]
- Takasaki, K.; Wafula, E.K.; Fan, J.M.; Sit, Y.T.; Kumar, S.S.; Smith, D.; Gagne, A.; Gearhart, P.A.; French, D.L.; Thom, C.S.; et al. Single-cell transcriptomics reveal individual and cooperative effects of trisomy 21 and GATA1s on hematopoiesis. Stem Cell Rep. 2025, 20, 102577. [Google Scholar] [CrossRef] [Scilit] [PubMed]
- Chen, K.; Bao, Z.; Tang, P.; Gong, W.; Yoshimura, T.; Wang, J.M. Chemokines in homeostasis and diseases. Cell. Mol. Immunol. 2018, 15, 324–334. [Google Scholar] [CrossRef] [Scilit] [PubMed]
- Xu, M.; Wang, Y.; Xia, R.; Wei, Y.; Wei, X. Role of the CCL2-CCR2 signalling axis in cancer: Mechanisms and therapeutic targeting. Cell Prolif. 2021, 54, e13115. [Google Scholar] [CrossRef] [Scilit] [PubMed]
- Kanehisa, M.; Furumichi, M.; Sato, Y.; Kawashima, M.; Ishiguro-Watanabe, M. KEGG for taxonomy-based analysis of pathways and genomes. Nucleic Acids Res. 2023, 51, D587–D592. [Google Scholar] [CrossRef] [Scilit] [PubMed]
- Wu, X.; Meier, L.; Liu, T.X.; Toldo, S.; Poelzing, S.; Gourdie, R.G. Detection, Isolation and Quantification of Myocardial Infarct with Four Different Histological Staining Techniques. Diagnostics 2024, 14, 2325. [Google Scholar] [CrossRef] [Scilit] [PubMed]

Disclaimer/Publisher’s Note: The statements, opinions and data contained in all publications are solely those of the individual author(s) and contributor(s) and not of MDPI and/or the editor(s). MDPI and/or the editor(s) disclaim responsibility for any injury to people or property resulting from any ideas, methods, instructions or products referred to in the content. |
© 2026 by the authors. Licensee MDPI, Basel, Switzerland. This article is an open access article distributed under the terms and conditions of the Creative Commons Attribution (CC BY) license.