Article

Viewers’ Affect and Ideological Sorting in Spain’s Late-Night Television: Evidence from El Hormiguero and La Revuelta


by
Sergio A. Berumen
1 and
Karen Arriaza Ibarra
2,*
1
Faculty of Economics and Business Sciences, Rey Juan Carlos University, 28032 Madrid, Spain
2
Faculty of Information Sciences, Complutense University of Madrid, 28040 Madrid, Spain
*
Author to whom correspondence should be addressed.
Journal. Media 2026, 7(3), 144; https://doi.org/10.3390/journalmedia7030144
Submission received: 1 May 2026 / Revised: 25 June 2026 / Accepted: 8 July 2026 / Published: 15 July 2026

Abstract

This study examines whether viewers’ relative affinity toward Spain’s two leading late-night hosts—Pablo Motos (El Hormiguero) and David Broncano (La Revuelta)—varies systematically by ideology. Using an anonymous non-probability online survey fielded in Segiuptember 2024 among adults in the primary analytic frame (N = 806), we construct two parallel six-item affinity indices: IM for Motos and IB for Broncano. Our primary outcome is the respondent-level Affective Gap (BA = IB − IM), where positive values indicate greater relative affinity toward Broncano. In the adult analytic frame, IM averages 2.517 and IB 2.710 on a 1–5 scale, yielding a mean BA of 0.192 (95% CI [0.094, 0.289]). BA is clearly positive among left-leaning respondents and lower, often negative, among right-leaning respondents. In OLS models with HC3 standard errors, ideology remains a strong negative predictor of BA after adjustment for age, gender, education, and socioeconomic status, and the association is robust to bootstrap intervals and sensitivity checks. Open-ended responses are used descriptively to contextualize the quantitative gradient. The study contributes to research on selective exposure, affective sorting, and media-personality evaluation by showing that, within this non-probability analytic sample, relative evaluations of two prominent Spanish late-night hosts are strongly associated with respondents’ ideological self-placement.

1. Introduction

Politics increasingly moves through popular culture and entertainment in contemporary media environments, blurring the boundary between institutional politics and media culture (Street, 1997; Schemer et al., 2024; Kim & Patterson, 2025). Entertainment formats do more than mirror political contexts; they make ideological cues visible and shape how audiences interpret public issues. Late-night television offers a particularly useful setting for observing this process, since host-centered performance can turn humor and topical conversation into vehicles of political meaning. In these formats, each one of the presenters becomes part of what viewers evaluate.
Research on political entertainment provides the basis for this approach. Street (1997) established a key point of departure for the study of the relationship between politics, popular culture, and entertainment. Later work has extended this discussion to contemporary communication environments, where entertainment media shape audience positioning and political participation while carrying broader political consequences (Nærland, 2019; Matthes et al., 2023; Cervi et al., 2023; Schemer et al., 2024; Kim & Patterson, 2025; Klüser, 2025). Work on political humor adds a more specific mechanism: satirical and comic formats can make public issues accessible while giving them affective force (Brassett, 2022; Burgers & Brugman, 2022; Mendiburo-Seguel et al., 2022; Pehe, 2022).
High-choice media environments make the distinction between exposure and evaluation especially important. Audiences may form impressions of media figures through platform fragments, even when regular viewing is limited. Ratings can therefore diverge from viewer evaluations of on-air personalities (Stroud, 2018; Jürgens & Stark, 2022). Selective exposure and hostile media research further suggest that audience affect toward each one of the presenters can align with political identity even when the format remains humorous and conversational (Feldman, 2018).
Platformed circulation sharpens this dynamic. Comparative research shows that fragmented and polarized information environments can intensify congruent media use, although patterns vary by platform and national context (Steppat et al., 2022). Recent platform studies suggest that recommender systems and engagement-based ranking can shape exposure diversity and the visibility of divisive content (Yu et al., 2024; Milli et al., 2025). Work on narrative entertainment and parasocial relationships helps explain why media figures can sustain attachment, irritation, and persuasive force beyond linear viewing (Oschatz & Marker, 2020; Tukachinsky et al., 2020; Rahmani et al., 2025).
This framework examines viewers’ affect toward Spain’s two late-night presenters: Pablo Motos, host of El Hormiguero on commercial channel Antena 3, and David Broncano, host of La Revuelta on public broadcaster RTVE. The case is useful because linear reach and digital clip circulation coexist, and the two presenters have become public reference points in the same competitive late-night slot. The article measures how audiences evaluate each host and how those evaluations vary by ideology. Because the two of them are publicly compared, the article treats affinity as both host-specific and relative. It constructs two parallel six-item affinity indices, IM for Motos and IB for Broncano. Reliability and item-level diagnostics are reported in Appendix A, Table A2. The respondent-level Affective Gap is defined as BA = IB − IM. Positive values indicate greater relative affinity for Broncano; negative values indicate greater relative affinity for Motos.

2. Theoretical Framework

2.1. Political Entertainment, Selective Exposure, and Ideological Sorting

Politics nowadays moves through entertainment as part of everyday media experience (Schemer et al., 2024). Entertainment now shares in the production of political meaning, once centered on news and campaign communication. Public issues also become legible when performance and platform circulation turn humor into a vehicle of political meaning. Late-night television is especially suited to this process. Its informal style allows entertainment to carry political cues without picturing itself as formal political communication.
Political entertainment research has traced this capacity of leisure-oriented media to shape how audiences interpret politics and assign affective weight to public life (Street, 1997; Nærland, 2019; Kim & Patterson, 2025). Research on satire and political humor reaches a related conclusion: audiences can process political cues while approaching humorous formats as leisure (Burgers & Brugman, 2022; Brassett, 2022; Matthes et al., 2023).
In high-choice media environments, these cues rarely stay confined to the broadcast itself. A viewer may encounter a host through a viral clip and the commentary that follows. Thus, impressions of television personalities extend beyond ratings and linear viewership.
Selective exposure research helps explain why those impressions may become ideologically patterned. Audiences tend to gravitate toward media environments that align with prior attitudes or identities (Stroud, 2018). The same logic can operate through evaluation. The same presenter’s style may be perceived differently when the presenter appears culturally closer, even in a different type of media. Comparative work suggests that fragmented and polarized media environments can strengthen congruent media use, with patterns that vary by platform and national setting (Steppat et al., 2022; Jürgens & Stark, 2022). This perspective frames the Spanish late-night case analyzed here. The article refers to entertainment audiences as ideologically mixed and assumes that politically patterned affinity can emerge even on mixed media exposure. It asks whether respondents’ ideological self-placement shapes evaluations of two prominent Spanish late-night hosts. The focus is on ideological sorting in audience affect: the process by which media personalities acquire political meaning and become objects of differentiated affinity.

2.2. Affective Polarization and Presenter-Level Evaluation

Affective polarization describes how political identities shape emotional orientations toward public objects. Although the concept is usually studied in the context of parties and partisan actors, its logic can extend to media figures when their public image carries ideological or cultural meaning (Iyengar et al., 2019). Late-night hosts are useful for tracing that extension. They anchor entertainment formats as recognizable person-brands. Their humor, interview style, tone, guest selection, and public persona can make authenticity, bias, or cultural proximity visible to viewers. A program may remain entertaining while its host becomes politically legible.
Ratings capture exposure, while the presenter’s affinity captures judgment. This distinction matters for the present study because the figure who anchors a format can develop a public image that circulates beyond regular viewing.
In a platformed media environment, that image often travels in fragments. A viewer may encounter a presenter through a clip and the surrounding commentary, then form a durable impression from fragmentary exposure alone. Consequently, presenter-level afffect offers a way to observe how entertainment formats acquire political meaning outside conventional measures of audience size.
When evaluations of hosts vary systematically with ideological self-placement, political identity shapes more than preferences for explicit political information. It also organizes affective judgments about entertainment personalities. This article uses affinity for Pablo Motos and David Broncano to examine that process in host-centered late-night television.

2.3. Hostile-Media Perceptions, Perceived Politicization, and Interpretive Ambiguity

Hostile-media perception offers another route from ideology to the presenter’s evaluation. Viewers often perceive media actors as biased against their own views, especially when the figure, outlet, or issue at stake is politically salient (Feldman, 2018). In late-night entertainment, that perception often operates indirectly. Bias is inferred from tone, guest treatment, interview posture, or the sense that a conversation has been politicized.
Late-night television gives those inferences room to take shape. Humor and informality allow hosts to address public issues while maintaining an entertainment frame. The same gesture may seem spontaneous to one viewer and intrusive to another. Irreverence may be read as authenticity; it may also be read as disrespect. Critical questioning is equally unstable: some viewers see independence, while others see hostility.
The affinity items used in this study map these judgments at the presenter level. Respondents were asked whether each presenter represents ideas they believe in, addresses topics of interest, appears accessible and friendly, engages in independent journalism, conducts interviews fairly and respectfully, and tends to politicize conversations. Taken together, the items capture how viewers position a host’s public persona in relation to their own worldview.
The open-ended responses add interpretive depth. Respondents did more than express general liking or dislike. They grounded their evaluations in frames such as humor, approachability, interview style, sexism, politicization, and persona. The article uses these responses descriptively to show how presenter style, perceived fairness, and political meaning become linked in audience judgment.

2.4. Parasocial Relationships and Presenter Affinity

Late-night television is built around the host. The presenter’s persona often anchors the audience’s relationship to the program: viewers may return for the guests or segments, but also for the host’s humor, rhythm, authenticity, interview style, and perceived familiarity. This makes parasocial relationships central to presenter affinity. Parasocial research shows that audiences can develop one-sided but meaningful forms of attachment to media figures, ranging from familiarity and trust to irritation and involvement, and that these relationships can shape persuasion, engagement, and media response (Tukachinsky et al., 2020; Rahmani et al., 2025).
In contemporary media systems, parasocial dynamics extend beyond full-program viewing. Host personas circulate through clips, memes, social media posts, interviews, controversies, and algorithmically distributed fragments. This circulation can intensify affective responses because viewers repeatedly encounter host-specific cues outside the original broadcast context. Platformed distribution makes the host more visible as an object of affection, including among audiences with partial or irregular exposure (Yu et al., 2024; Milli et al., 2025).
Evaluations of Pablo Motos and David Broncano should therefore be understood as judgments of two programs and two public-facing media personalities. Viewers may respond to each presenter’s humor, authenticity, fairness, arrogance, proximity, or ideological resonance. These judgments address program quality, but they also reflect identity-based and parasocial responses to the host as a recognizable public figure.
This theoretical logic supports the use of presenter-level affinity indices. Measuring affinity for each host allows the analysis to move beyond exposure and ratings to the affective and interpretive dimensions of audience response. Host affinity captures how respondents evaluate the presenter as a media personality, rather than simply indicating whether they watch the program.

2.5. Relative Affinity in a Paired Late-Night Context

The empirical case examined in this article features two prominent hosts competing in the same late-night environment. Pablo Motos and David Broncano are publicly visible figures associated with distinct program styles, institutional settings, interview conventions, and audience expectations. For international readers, the paired context matters because the study examines hosts who have become alternative reference points in Spanish entertainment television.
This setting makes relative affinity analytically useful. Viewers can evaluate each host separately, whereas public debate often places them in relation to one another. That relation may involve humor, interview dynamics, perceived freshness, conventionality, or politicization. The article examines whether respondents’ ideological self-placement is associated with the direction of their evaluations of presenters in this paired context.
Relative affinity captures directional preference without treating the two evaluations as psychological opposites. Some viewers may like both presenters, dislike both, or evaluate each presenter for different reasons. The relative measure helps identify preference in a competitive media environment, while the host-specific affinity indices preserve absolute evaluations. This distinction matters because similar relative scores can stem from different absolute profiles.
The Affective Gap is used as the main outcome because the central research question concerns ideological sorting in relative presenter evaluation. Affinity for one host does not necessarily entail rejection of the other. The measure captures whether respondents evaluate one presenter more favorably than the other in a competitive, publicly salient late-night context. This approach allows the article to examine ideological structuring in audience affect while acknowledging that presenter evaluations may also operate independently.

3. Rationale, Objectives, and Hypotheses

3.1. Rationale

Viewer’s affect—that is, the individual evaluative response—is an indicator of how audiences are organized by ideology, even in audiovisual content geared toward entertainment. This study addresses this issue in the context of two leading and publicly salient late-night shows in Spain: El Hormiguero (7 y Acción/Banijay, 2007–) and La Revuelta (Encofrados Encofrasa/El Terrat/RTVE, 2024–).
The evidence derives from a Spanish-language, anonymous online questionnaire that was answered anonymously by 877 respondents and a primary adult analytic sample of N = 806 respondents aged 18–100. The questionnaire combined: (i) sociodemographic variables and ideological self-placement; (ii) an affinity battery on a 1–5 Likert-type scale (Likert, 1932); and (iii) four open-ended questions about likes and dislikes specific to each host. This design enables analysis of: (a) relative affective evaluation between Pablo Motos and David Broncano; (b) variation in that gap by ideology and sociodemographic profiles; and (c) descriptive thematic patterns that emerge in open-ended responses.

3.2. Contribution of the Study

Theoretical: it shifts the focus from “ratings” (exposure) to viewer evaluation, which is more informative in platformed environments.
Methodological: it proposes and operationalizes an individual BA that is comparable across respondents.
Applied: it offers tentative editorial considerations on segment framing and clip circulation, to be tested in future research.

3.3. General Objective

To analyze how viewers’ affect toward Motos and Broncano is structured and which ideological, sociodemographic, and discursive factors are associated with its variation within the analytic sample.

3.4. Specific Objectives

O1.
To build indicators of affinity toward each host and derive an individual BA for each respondent.
O2.
To estimate how BA varies as a function of ideological self-placement and sociodemographic profiles (age, gender, education, and socioeconomic status).
O3.
To map the frames/themes that emerge from the open-ended responses (e.g., “humor,” “approachability,” “tough questions,” “sexism,” “politicization,” “format”), systematically distinguishing between Motos and Broncano.
O4.
To ensure robustness, transparency, and reproducibility through predefined quality-control rules, effect sizes, 95% confidence intervals, robustness checks, and anonymized reporting of quantitative and qualitative evidence.

3.5. Hypotheses

H1 (ideological gradient).
BA is expected to be negatively associated with ideological self-placement, such that more left-leaning respondents tend to show higher BA values, whereas more right-leaning respondents tend to show lower BA values, indicating relatively greater affinity for Broncano on the left and relatively greater affinity for Motos on the right.
H2 (aggregate asymmetry).
The sample meaning of BA differs significantly from zero.
H3 (sociodemographic covariates).
Beyond ideology, BA is expected to vary across sociodemographic profiles, with age likely to show the most consistent association, while associations for gender, education, and socioeconomic status are treated as exploratory.
RQ1 (exploratory qualitative context).
What recurrent evaluative themes appear in open-ended responses about each host, and how do these themes help interpret the ideological gradient observed in BA?

3.6. Operational Definitions

Affinity per host (A_Motos, A_Broncano).
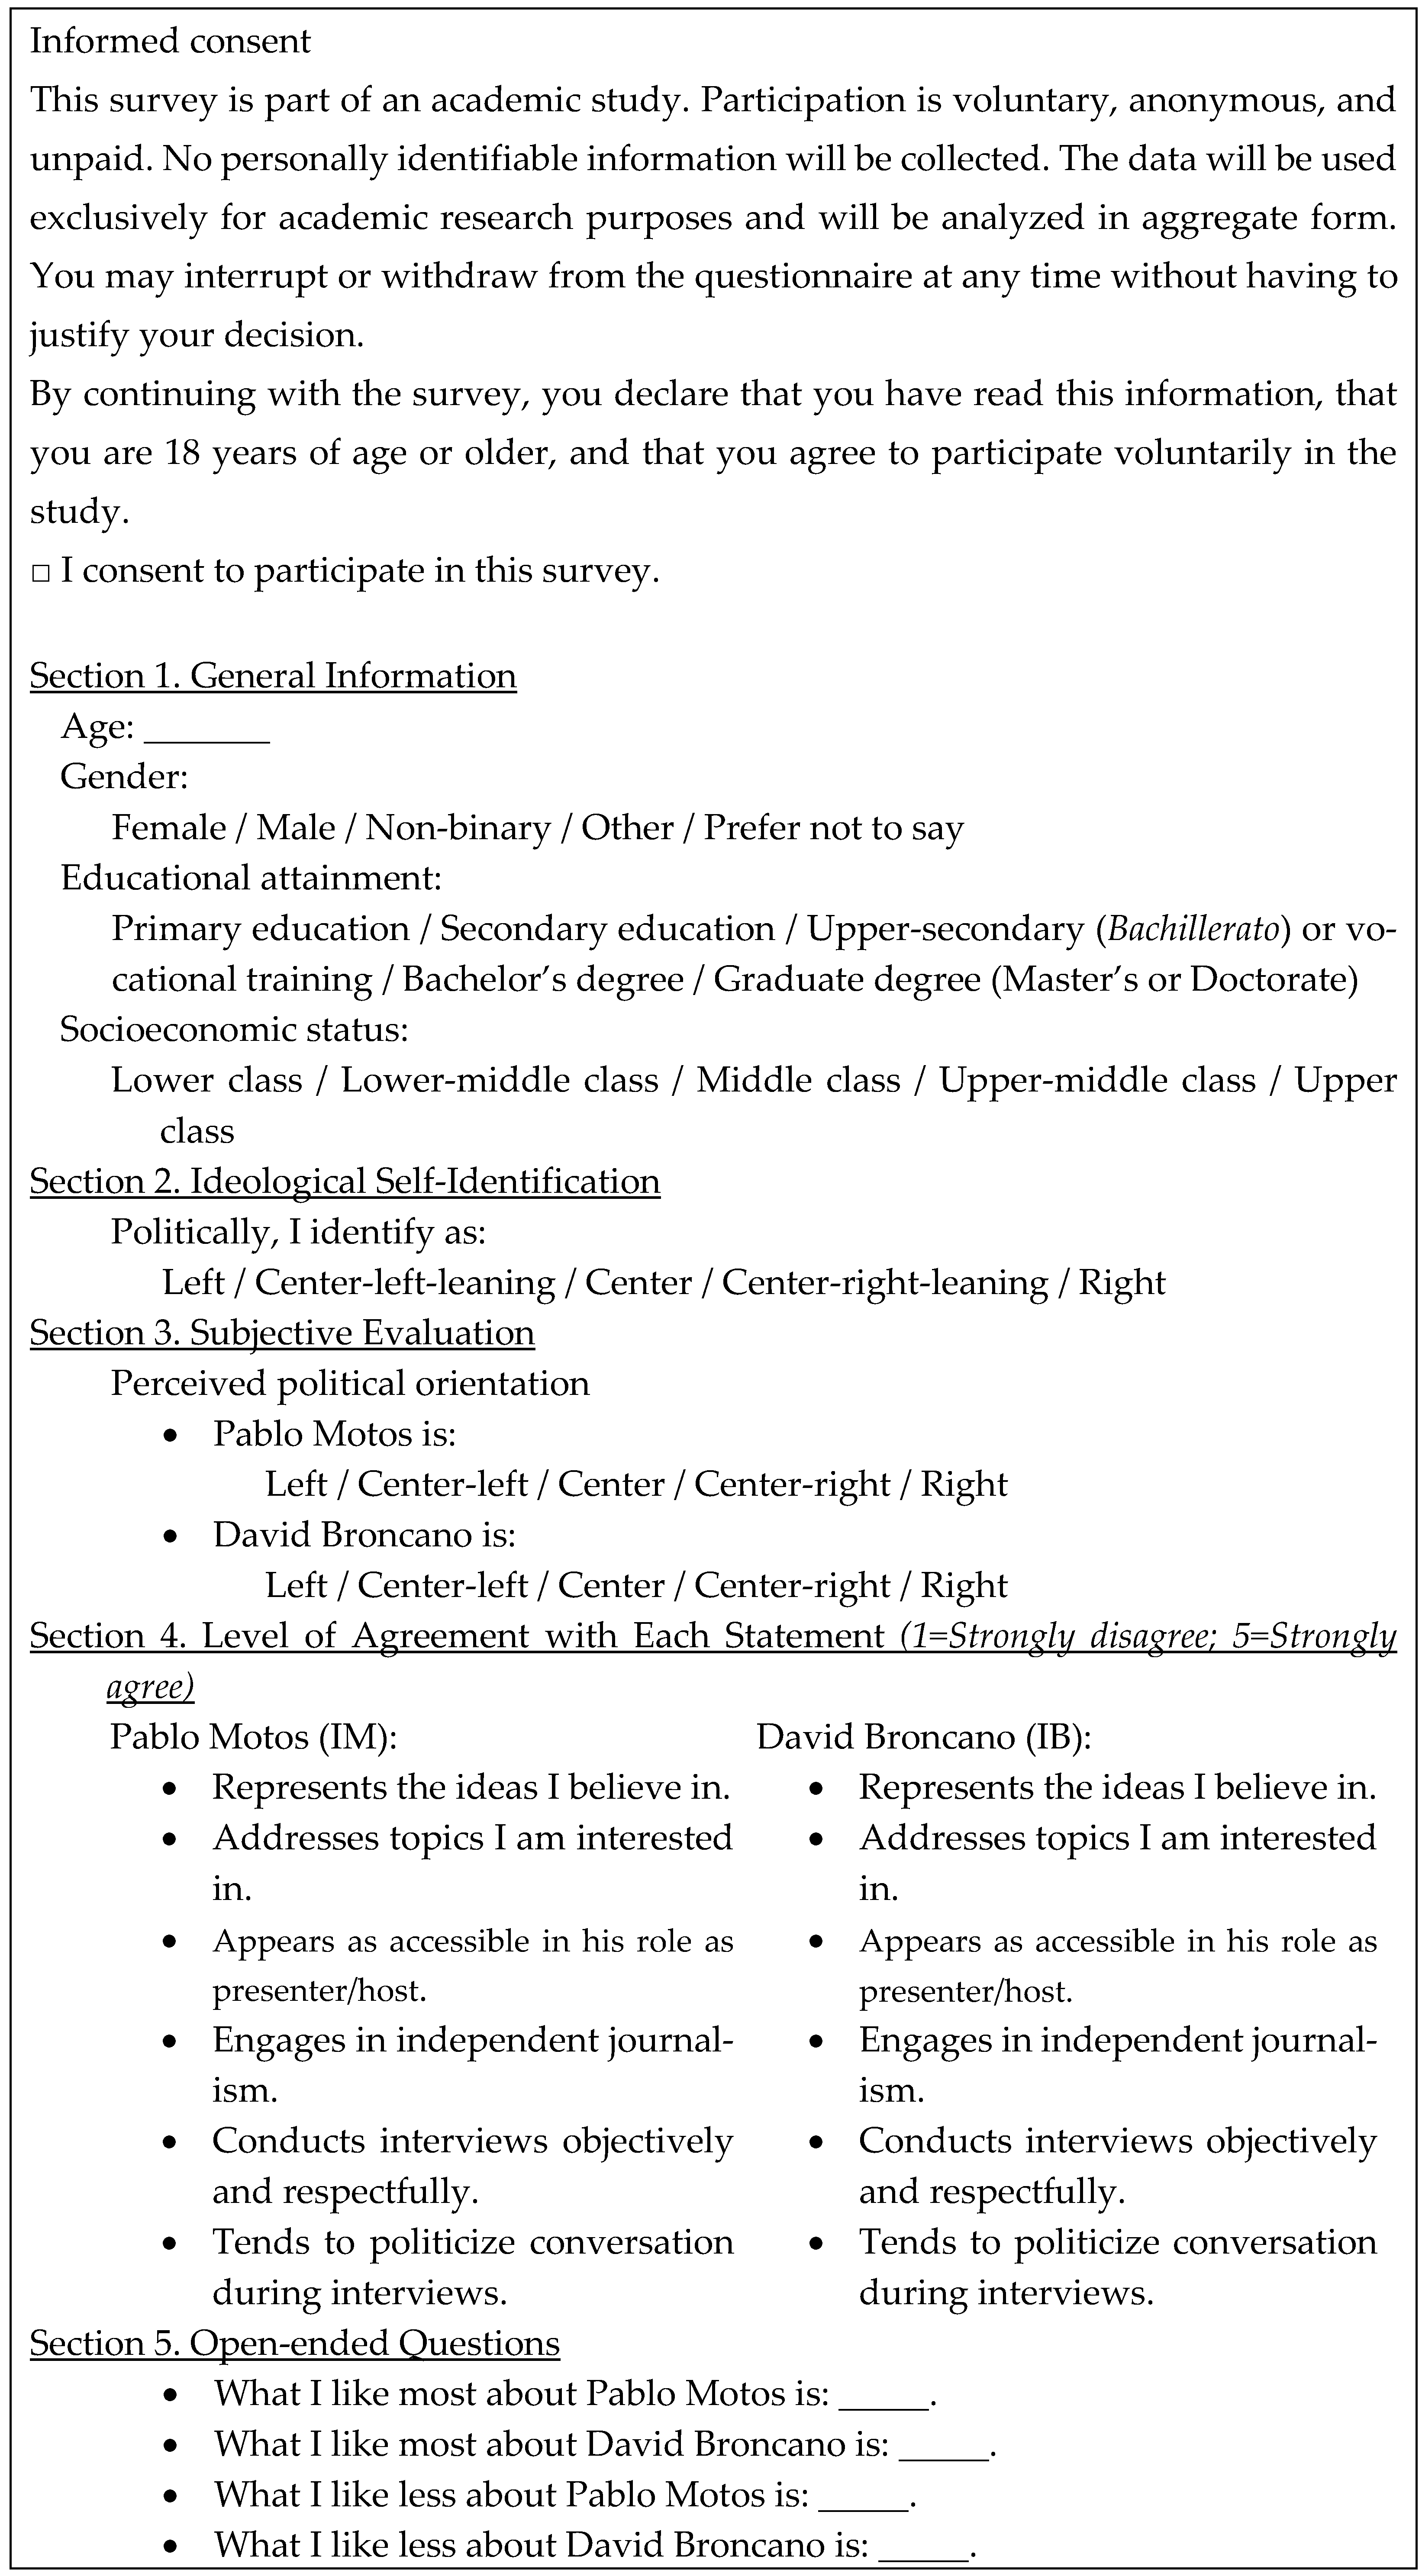
For each presenter, an individual-level affinity score was calculated as the mean of the corresponding Likert items on a 1–5 scale, with reverse-worded items re-coded before aggregation. Specifically, the items were used to construct two identical indices (6 + 6) (Figure 1, Section 4): IM for Pablo Motos and IB for David Broncano (see Appendix A, Table A2 for full item wording, keying, item-to-scale allocation, loadings, and item–total correlations).
Affective Gap (BA).
Our primary outcome is the BA, defined as IB − IM. Positive values indicate greater relative affinity for Broncano, and negative values indicate greater relative affinity for Motos. Detailed construction and sign convention appear in Section 4.3.
Reliability.
Before averaging items into IM/IB, internal consistency was assessed using Cronbach’s α (criterion ≥ 0.70) (Cronbach 1951). When items are treated as strictly ordinal, ordinal α and McDonald’s ω are reported as sensitivity checks (McDonald, 1970). Any negatively keyed item was re-coded before aggregation according to the definitive item map reported in Appendix A, Table A2.

4. Method

4.1. Study Design and Data

This study uses a cross-sectional online survey that combines closed-ended Likert items with open-ended prompts about two television hosts: Pablo Motos and David Broncano. Fieldwork took place from 21 to 26 September 2024. Participation was voluntary, anonymous, and unpaid. No personally identifiable information was collected.
The original dataset includes 877 submitted responses. Although the consent screen stated that participation was intended for adults aged 18 or older, the submitted dataset included responses with missing, implausible, or out-of-range age information. The primary analytic frame was therefore restricted ex post to respondents with valid ages between 18 and 100, yielding N = 806 adults. Unless otherwise noted, the main analyses use this adult analytic frame without excluding respondents flagged by quality-control indicators. A stricter QC frame is reserved for robustness checks.
Recruitment used a non-probability online dissemination strategy. The survey link was shared through the authors’ personal and professional online networks, including messaging platforms and social media, as well as an Instagram account related to the audiovisual industry. Respondents could forward the link to other adults, but no referral chains were tracked, and no respondent-driven sampling procedure was implemented. Accordingly, we describe the procedure as convenience-based online recruitment with snowball-like secondary diffusion, rather than as classical snowball sampling or panel-based recruitment. The study is therefore intended to identify associations and patterns within the analytic sample, not to estimate population-level parameters for Spain.

4.2. Survey Instrument

The questionnaire included five components: (a) sociodemographic variables (age, gender, education, and socioeconomic status); (b) an ideological self-placement; (c) a perceived political orientation of each host; (d) a battery of affinity items for each host rated on a 1–5 Likert-type scale; and (e) four open-ended prompts asking respondents what they liked most and least about each presenter. The full questionnaire structure and item wording are shown in Figure 1 of the manuscript and match the archived survey file.
Ideological self-placement was recorded in five ordered categories and coded from −2 to +2 for the main quantitative models, with lower values indicating more left-leaning self-placement and higher values indicating more right-leaning self-placement. Because the group means are not perfectly monotonic across categories, this coding is interpreted as a summary linear trend; categorical specifications are treated as a useful robustness or descriptive check.
Figure 1. The questionnaire shows audience perceptions of El Hormiguero and La Revuelta. The instrument comprises five sections: (i) General Information; (ii) Ideological Self-Identification; (iii) Perceived Political Orientation; (iv) Level of Agreement items (six per presenter; 1–5, 1 = Strongly disagree, 5 = Strongly agree); and (v) Open-ended prompts. Item labels and IDs: IM (Pablo Motos) = {PM_A1 (ID 4), PM_A2 (ID 6), PM_A3 (ID 8), PM_A4 (ID 9), PM_A5 (ID 10), PM_A6 (ID 12)}; IB (David Broncano) = {DB_A1 (ID 5), DB_A2 (ID 7), DB_A3 (ID 11), DB_A4 (ID 13), DB_A5 (ID 14), DB_A6 (ID 15)}. Composite indices: IM and IB are respondent-level means computed when at least 4 of 6 items are observed; any negatively keyed item was re-coded before aggregation according to the definitive item map reported in Appendix A, Table A2. Higher scores indicate greater affinity. Affective Gap: BA = IB − IM (BA > 0 = relatively greater affinity for Broncano; BA < 0 = relatively greater affinity for Motos; BA = 0 = no relative differentiation). Full item wording, keying, and reliability diagnostics appear in Appendix A, Table A2.
Journalmedia 07 00144 g001

4.3. Scale Construction and Primary Outcome

The main outcome of the study is the BA, defined as the difference between the Broncano and Motos affinity indices: BA = IB − IM. Positive values indicate greater relative affinity for Broncano; negative values indicate greater relative affinity for Motos; and a value of zero indicates no relative differentiation between the two hosts.
BA was selected as the primary outcome because the substantive question concerns relative presenter affinity in a paired competitive setting. IM and IB capture absolute affinity toward each host, whereas BA captures whether a given respondent evaluates Broncano more favorably than Motos, Motos more favorably than Broncano, or both similarly. This relative measure is especially useful in a media environment where the two programs are publicly compared and compete for attention in the same late-night slot. Nevertheless, BA does not imply that evaluations of the two hosts are perfect opposites or that IM and IB lack independent meaning.
IM and IB are computed as the arithmetic mean of six presenter-specific items each, all measured on a 1–5 scale. Scale construction follows the final item allocation reported in Figure 1 and in Appendix A, Table A2. Item-level keying follows the definitive item map used in the manuscript, and any negatively keyed item is re-coded before aggregation, as indicated in that final map. Composite scores were computed only when at least 4 of 6 items were observed for the corresponding presenter-specific scale. Outcomes (IM, IB, BA) are never imputed. In the adult analytic frame, non-missing observations are n = 806 for IM, n = 806 for IB, and n = 806 for BA. Descriptive statistics reported in the manuscript are based on that frame.

4.4. Reliability and Item Diagnostics

Internal consistency of the two presenter-specific indices was assessed with Cronbach’s alpha, and McDonald’s omega and ordinal alpha served as sensitivity checks. Item-level diagnostics—including corrected item–total correlations, alpha-if-dropped, and component loadings—are summarized in Appendix A, Table A2.
Beyond internal consistency, the item battery was designed to provide content coverage of several theoretically relevant dimensions of presenter affinity in a host-centered entertainment context. The six parallel items assess whether respondents perceive each presenter as ideologically representative, topically relevant, approachable and accessible as an interviewer/host, independent, fair and respectful in interviews, and prone to politicizing the conversation. These dimensions were selected because they align with the theoretical mechanisms emphasized in the article: selective affinity, perceived proximity, hostile-media perceptions, interview fairness, and politicization. Accordingly, IM and IB should be interpreted as adapted presenter-affinity indices for this specific empirical setting, rather than as fully validated general-purpose media-affinity scales.
One measurement caveat concerns Item 14 in the Broncano scale, which showed weak corrected item–total correlations and would increase internal consistency if dropped. The item was retained to preserve the definitive parallel six-item structure across presenters and to maintain comparability between IM and IB. Nevertheless, this decision may introduce some noise measurements into IB and, by extension, BA. The results should therefore be interpreted as based on a symmetric adapted index, with the weaker performance of this item acknowledged as a limitation. A further coding caveat concerns the item flagged as a reverse-key candidate in the Motos scale. The final aggregation follows the definitive keying reported in Appendix A.
Because the article’s substantive inferences rely primarily on the difference between two parallel indexes administered within the same questionnaire, the focus is on internal consistency and transparent item mapping rather than on strong claims of external scale validation. The study treats IM and IB as adapted parallel affinity indices for this specific media setting.

4.5. Data Quality Procedures

A set of predefined quality-control procedures was implemented to document response quality and support sensitivity analyses. These procedures included age-range filtering to define the adult analytic frame (18–100), identification of speeders based on very short completion times, and identification of straight-lining patterns within the Likert battery. Appendix A (Table A1) documents 43 speeders and 73 straight-liners. Because these flags overlap, the number of unique QC exclusions is 81, yielding a QC-strict frame of N = 725 adults, with 723 non-missing BA values.
The main descriptive and multivariable analyses are conducted on the adult analytic frame without excluding respondents flagged as speeders or straight-liners. The QC-strict frame is used only for robustness checks. This preserves comparability across the main descriptive tables and anchors the primary analysis in the adult analytic frame.

4.6. Quantitative Analysis

Quantitative analysis was carried out in three steps. First, descriptive statistics for IM, IB, and BA are reported, including means, medians, standard deviations, quartiles, and 95% confidence intervals. Second, bivariate differences in BA across ideological groups are assessed using one-way ANOVA and Kruskal–Wallis tests (Kruskal & Wallis, 1952). Third, multivariable ordinary least squares (OLS) models with HC3 heteroskedasticity-consistent standard errors are estimated to assess the association between ideology and BA while adjusting for age, gender, education, and socioeconomic status (Long & Ervin, 2000; MacKinnon, 2012).
The main linear specification treats ideology as an ordered predictor ranging from −2 to +2. Because descriptive group means show a strong overall left-to-right pattern but are not perfectly monotonic across all ideological categories, the linear model is interpreted as summarizing the trend rather than as evidence of strict category-by-category monotonicity.
Model uncertainty is assessed using percentile bootstrap confidence intervals with 1000 resamples. Additional sensitivity analyses include re-estimation on the QC-strict frame and re-estimation using a standardized version of BA. Across the reported robustness checks, the sign and substantive magnitude of the ideology coefficient remain stable (Efron & Tibshirani, 1994). Appendix A also reports measurement checks related to the weak Broncano item and the reverse-keying decision for the Motos item. These checks support the stability of the substantive ideological gradient.
To address multiple testing among non-intercept terms in the fully adjusted models, Holm–Bonferroni (Holm, 1979) corrections are applied. In the reported results, ideology remains strongly significant after correction, and age retains statistical significance, whereas associations that refer to gender, education, and socioeconomic status do not remain robust.

4.7. Open-Ended Responses

The open-ended questions are used in this article as a descriptive qualitative complement to the quantitative analyses. Their function is to provide thematic context for the observed ideological gradient in BA, not to serve as an independent inferential outcome in the main text. Responses were grouped into recurrent themes such as humor, approachability, interview style, politicization, tone, sexism, format, and persona/brand. Aggregated frequencies by presenter are reported in Appendix A, Table A5. In this article, the qualitative component is interpreted cautiously and descriptively. The main claims, therefore, do not depend on formal predictive models based on thematic codes.
The thematic categories were developed through a hybrid procedure. First, categories were informed by the study’s theoretical focus and by concepts expected to be relevant to presenter evaluation, including humor, approachability, interview style, politicization, tone, and perceived fairness. Second, the category list was refined after an initial reading of the open-ended responses to capture recurring expressions not fully anticipated in advance, such as persona/brand and directiveness/intrusiveness. The resulting coding should be interpreted as a descriptive thematic grouping rather than as a fully independent qualitative inference. It contextualizes the quantitative gradient by showing which evaluative frames were most associated with each presenter.

4.8. Missing Data

Outcomes (IM, IB, BA) were not imputed. In the adult analytic frame, BA is non-missing for N = 806 respondents. Scale means are computed only when the respondent provides at least 4 of the 6 items for the corresponding presenter-specific scale. For multivariable models, observations are included on an available case basis, and model-specific sample sizes are reported in the corresponding tables.

4.9. Ethics and Data Availability

The study relied on an anonymous online survey of adults, and all participants provided informed consent before participating. The study received Institutional Review Board approval. Additional files and replication-support materials are deposited in the Universidad Rey Juan Carlos Dataverse, e-cienciaDatos, at https://doi.org/10.21950/YT407P. These materials include fieldwork documentation, case-flow information, quality-control summaries, measurement diagnostics, descriptive summaries, model summaries, and coded open-ended response frequencies.

5. Results

5.1. Sample and Quality Controls

Analyses focus on the adult analytic frame of N = 806 respondents aged 18–100, drawn from 877 submitted responses. For robustness, the QC-strict frame excludes respondents flagged as speeders (n = 43; threshold = 1.283 min) and/or straight-liners (n = 73; ≥80% identical responses). Because these flags overlap, the number of unique QC exclusions is 81, yielding N = 725 in the QC-strict frame, with BA non-missing for 723 cases. These counts are documented in Appendix A, Table A1, which reports fieldwork metadata, case-flow, and quality-control counts.

5.2. Scale Construction and Reliability (IM/IB)

Two parallel six-item presenter-specific indices were constructed from the affinity battery shown in Figure 1: IM for Pablo Motos and IB for David Broncano. Internal consistency was acceptable in the adult analytic frame, and item-level diagnostics—including corrected item–total correlations, alpha-if-dropped, and component loadings—are summarized in Appendix A, Table A2. The final item mapping and keying follow the definitive item map used in the manuscript.

5.3. Descriptive Statistics (IM, IB, BA)

On the 1–5 scale, the sample mean IM was 2.517 (95% CI [2.451, 2.583]) and the sample mean IB was 2.710 (95% CI [2.654, 2.765]). The BA = IB − IM averaged 0.192 (95% CI [0.094, 0.289]). Unless otherwise indicated, descriptive results are computed on the adult analytic frame (age ≥18 and ≤100; N = 806) without excluding respondents flagged as speeders or straight-liners; BA is computed whenever at least 4 of 6 items are observed for each presenter-specific scale. Appendix A, Table A3, reports the corresponding descriptive distributions, percentiles, and extreme-share summaries.

5.4. BA by Ideology (H1)

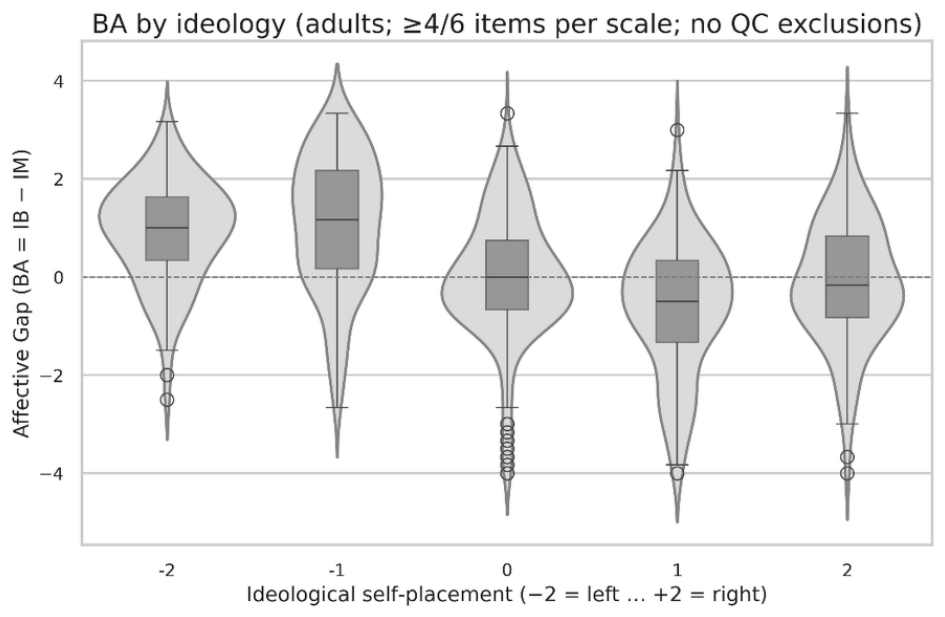
BA shows a strong left-to-right ideological gradient: it is clearly positive among left-leaning respondents and lower, often negative, among right-leaning respondents. The pattern is not perfectly monotonic across all ideological categories, and the rightmost category has a negative meaning in a confidence interval that includes zero. Therefore, the linear specification is interpreted as a summary trend rather than as evidence of strict category-by-category monotonicity. Group differences are large and highly significant: ANOVA F = 45.298, p < 10−35; Kruskal–Wallis H = 152.808, p < 10−35. A box/violin plot of BA by ideology (−2 = left to +2 = right) illustrates this left-to-right differentiation, with the horizontal dashed line marking BA = 0. Means, medians, and 95% confidence intervals by ideological category are reported in Appendix A, Table A4 (Figure 2).

5.5. Multivariable Models (OLS-HC3)

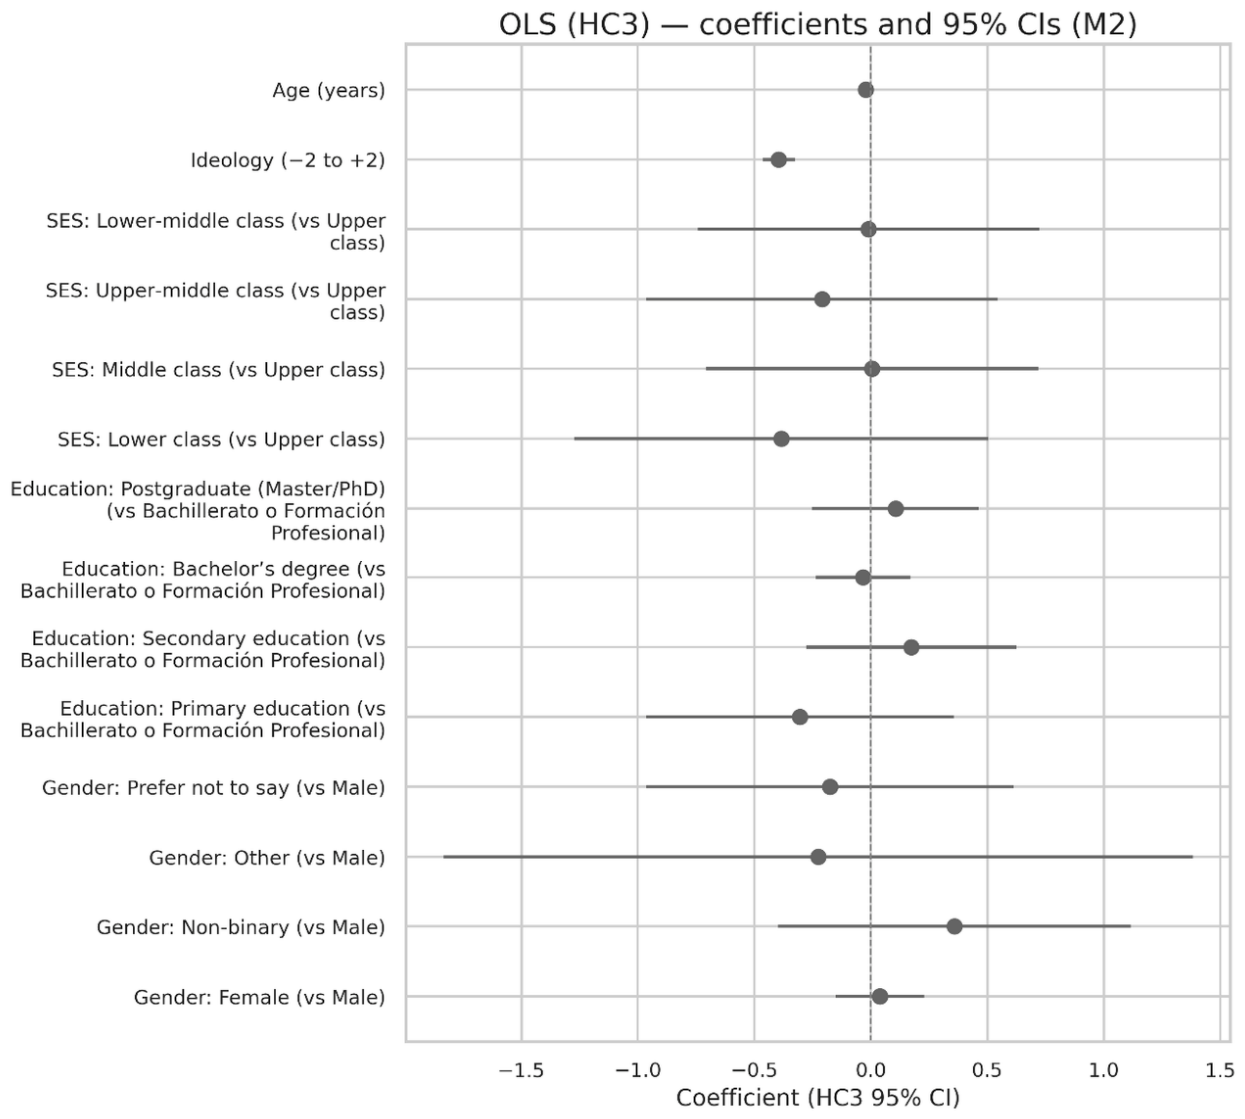
OLS models with heteroskedasticity-robust (HC3) standard errors confirmed that ideology is a strong predictor of BA. In the baseline specification (M1: BA~Ideology), the ideology coefficient was −0.340 (95% CI [−0.396, −0.285]) and the model explained approximately 12% of the variance in BA. Adding age, gender, education, and socioeconomic status in the adjusted specification (M2) increased explained variance to approximately 17.6%, with the ideology coefficient remaining negative (−0.348; 95% CI [−0.404, −0.292]). Substantively, this estimate implies that a four-category movement from the leftmost to the rightmost ideological self-placement is associated with an expected decrease of approximately 1.39 points in BA, although this interpretation should be read as a summary linear trend rather than as evidence of perfect monotonicity across all ideological categories (Figure 3).
These estimates indicate that rightward ideological self-placement is associated with lower BA values, shifting relative evaluations away from Broncano and, in many cases, toward greater relative affinity for Motos. Regarding H3, evidence is limited but informative: age shows a statistically significant association with BA net of ideology and covariates, whereas gender, education, and socioeconomic status do not show robust associations after multiple-comparison adjustments.

5.6. Robustness and Multiple Comparisons

Robustness is evaluated along three dimensions: (i) nonparametric uncertainty in the ideology slope via bootstrapping; (ii) targeted sensitivity analyses; and (iii) multiple-comparison adjustments for non-intercept terms. Unless otherwise noted, models use HC3 robust standard errors.
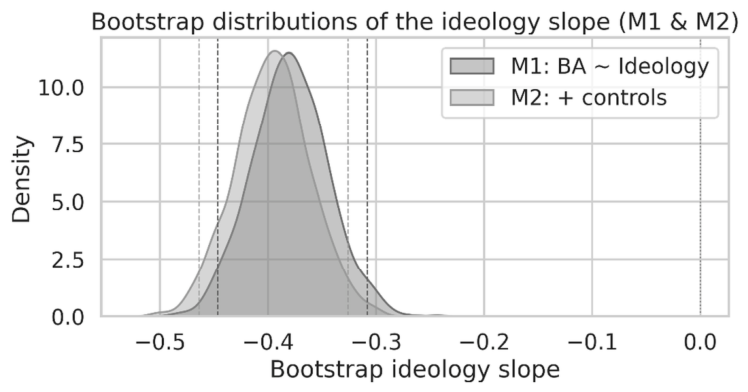
Bootstrap uncertainty corroborates the main OLS-HC3 results (Figure 4). With 1000 resamples, percentile confidence intervals for the ideology coefficient remained clearly below zero in both the baseline and adjusted models, confirming the stability of the main association. Targeted sensitivity checks preserve both the sign and the substantive magnitude. Re-estimating the models after excluding respondents flagged as speeders and/or straight-liners, that is, using the QC-strict frame, yields a similarly negative ideology slope, and re-estimating the baseline model using a standardized version of BA produces the same substantive conclusion. Holm–Bonferroni corrections applied to non-intercept terms in the adjusted models leave ideology highly significant; age remains statistically significant, while gender, education, and socioeconomic status are not robust.
Estimation uses HC3 robust standard errors in the main models.

5.7. Qualitative Integration—Thematic Links

Open-ended responses provide descriptive thematic context for the quantitative gradient in BA. Using a hybrid thematic grouping, responses were organized into recurring frames, including humor, approachability, interview style, directiveness/intrusiveness, tone, sexism, politicization, format, and persona/brand. Appendix A, Table A5, reports aggregated frequencies by presenter.
Read descriptively, these themes provide illustrative context that aligns with the ideological gradient observed in the quantitative analyses. Mentions of humor and approachability are more common in responses about Broncano, whereas criticisms of Motos more often focus on tone, sexism, and persona-related traits. References to politicization and interview directiveness/intrusiveness appear in evaluations of both presenters, but are especially salient in criticisms of Broncano. These thematic contrasts help contextualize the observed pattern—higher BA among left-leaning respondents and lower BA among right-leaning respondents—but do not independently test it.
The qualitative material is interpreted cautiously and descriptively. In this version of the article, it is used to contextualize the quantitative findings rather than as a fully independent inferential component.

5.8. Substantive Interpretation

The results indicate an ideologically supported viewer’s affect in Spain’s late-night television context. At the aggregate level, BA differs from zero and favors Broncano on average, while within-audience differentiation is pronounced: left-leaning respondents evaluate Broncano more favorably than Motos, whereas right-leaning respondents show lower BA values, often indicating relatively greater affinity for Motos than for Broncano. This association remains stable after adjusting for sociodemographic covariates and across bootstraps and targeted sensitivity checks.

6. Discussion

6.1. Main Findings

This study documents a clear ideological gradient in relative presenter-level evaluations within a non-probability adult sample in Spain’s late-night television context. On the 1–5 scale, the adult sample average for the Motos index (IM) is 2.517 (95% CI [2.451, 2.583]) and for the Broncano index (IB) is 2.710 (95% CI [2.654, 2.765]), yielding an aggregate Affective Gap of BA = 0.192 (95% CI [0.094, 0.289]), which differs from zero and supports H2. Descriptively, the distribution of BA is skewed toward Broncano, with BA ≥ +1 (pro–Broncano) observed in 30.4% of the adult analytic frame versus BA ≤ −1 (pro–Motos) in 17.9%. Group contrasts by ideology confirm pronounced differences (ANOVA F = 45.298, p < 10−35; Kruskal–Wallis H = 152.808, p < 10−35), and Figure 2 visualizes a strong left-to-right gradient: BA is clearly positive among left-leaning respondents and lower, often negative, among right-leaning respondents, while category means are not strictly monotonic across all ideological bins.
One plausible mechanism underlying the observed ideological gradient is perceived ideological positioning, though the present design does not directly test mediation. Viewers may evaluate hosts based on humor, interview quality, or entertainment value, while also inferring political cues from tone, guest selection, institutional location, recurring controversies, or broader public narratives surrounding each program. Presenter affinity may partly operate through hostile-media and identity-protective mechanisms: viewers reward a host perceived as culturally or politically closer to their own group and penalize one associated with an opposing camp. The present design cannot establish whether perceived host ideology mediates the association between respondent ideology and BA. Even so, the pattern is consistent with theories of selective exposure, affective polarization, and parasocial evaluation in politicized entertainment environments.
Multivariable models corroborate these patterns. In OLS models with HC3 standard errors, a baseline specification (M1: BA~Ideology) explains R2 ≈ 0.120, with a negative slope on ideology. Adding age, gender, education, and socioeconomic status (M2) increases the explanatory power to R2 ≈ 0.176, and the ideology coefficient remains negative and stable in magnitude (see Figure 3). Percentile bootstrap uncertainty (B = 1000) confirms the precision of the ideological slope (M1: 95% CI [−0.399, −0.285]; M2: 95% CI [−0.402, −0.295]). Sensitivity checks—including excluding speeders/straight-liners and standardizing BA—reproduce the sign and similar effect sizes (see Figure 4 and Appendix ATable A3, Table A4 and Table A5). Regarding covariates, age is negatively associated with BA net of ideology and other controls. Other covariates, such as gender, education, and socioeconomic status, do not show robust associations after multiple-comparison adjustments, indicating partial support for H3.
The evidence shows that evaluations of the two hosts are strongly ordered by ideology, a pattern that persists within sociodemographic characteristics, with a tight uncertainty around the ideological slope and consistent results across robustness checks. The aggregate asymmetry (BA > 0 on average) establishes H2, while the observed negative association between ideology and BA is fully consistent with the hypothesized ideological gradient in viewers’ affect (reframed H1). These findings underscore the relevance of presenter-level affect, distinct from exposure metrics, in platformed media environments where identity-linked cues structure evaluations of humorous and conversational formats.

6.2. Theoretical Implications

By focusing on evaluation (the presenter’s affect) rather than exposure, this work documents how identity-based political segmentation shapes perceptions even when the content is primarily humorous and conversational. This supports the idea that, in clip-driven ecosystems, affect toward media figures can diverge from reach metrics, with evaluation biases aligned with ideological identity. The theoretical contribution thus shifts the emphasis from “viewer watches program” to “how the viewer evaluates the program’s personal brand,” showing that the viewer-level affinity is a more sensitive indicator of audience organization than gross exposure.
Beyond the Spanish late-night context, the findings speak to core concerns in political communication and audience research—how identity cues shape evaluation in platformed, attention-driven distribution. By centering viewers’ affect rather than merely their exposure to the show, the study contributes to research on audiences, political communication, and media’s evolving infrastructures.

6.3. Descriptive Qualitative Context

A thematic reading of the open-ended responses provides illustrative context that is compatible with the ideological gradient in BA, but this should not be interpreted as an independent inferential test of that gradient. Mentions of tone, perceived sexism, and persona tend to accompany unfavorable evaluations of Motos among left-leaning profiles, whereas references to interview directiveness/intrusiveness and politicization arise among right-leaning profiles critical of Broncano. These patterns are interpreted descriptively and are used to contextualize, rather than formally model, the quantitative findings in this version of the article.

6.4. Alignment with Psychometric Validity

The internal consistency of IM/IB (α ≥ 0.70; ω coefficients consistent with α) supports the reliability of the indices, and the parallel 6 + 6 item allocation provides a transparent basis for the adapted presenter-affinity measures. Even so, minor changes in item keying or item-to-scale allocation could slightly shift scale means without altering the substantive direction of the BA gradient reported here. Methodologically, the respondent-level BA offers a compact, reproducible outcome that can be ported to other formats, thereby supporting comparative and cumulative research across media systems.
At the same time, the item diagnostics indicate that the results should be read alongside the measurement caveats reported in Appendix A, especially the weak item–total performance of one Broncano item and the reverse-keying check for the Motos scale.

6.5. Limitations

Several limitations should be considered when interpreting the findings. First, the study is cross-sectional and observational. The analyses identify associations between ideological self-placement and presenter-level affinity, but they do not establish causal effects or causal mechanisms. Although the observed gradient is theoretically consistent with selective exposure, hostile-media perceptions, affective polarization, and parasocial evaluation, the design of this study cannot determine whether ideology causes differences in affinity or if prior affinity shapes ideological interpretation; it cannot determine whether both of them are influenced by unobserved factors.
Second, the study relies on a non-probability online recruitment strategy. As clarified in the Method section, the survey was distributed via convenience-based online dissemination with snowball-like secondary diffusion; referral chains were not tracked, and no respondent-driven sampling procedure was implemented. The findings should therefore be read as associations observed within this non-probability analytic sample, rather than as population-representative estimates for Spain, Spanish adults, or Spanish late-night viewers in total. The recruitment strategy may also have produced self-selection, with respondents holding stronger prior opinions about either presenter or the public debate surrounding the two programs more likely to participate. Such self-selection could amplify observed affective differences and should be considered when interpreting the magnitude of the BA gradient.
Third, although ex ante quality-control rules and response-quality flags were applied, online survey data may still contain unobserved heterogeneity. The present article does not fully account for several potentially relevant factors, including prior viewing frequency, exposure to social media clips, parasocial attachment, political interest, media trust, and prior familiarity with each program. Incorporating these variables would help future studies to more clearly distinguish among habitual viewers, occasional viewers, clip-based audiences, and respondents whose evaluations are based primarily on second-order public discussion.
Fourth, the presenter-affinity indices should be interpreted as adapted measures for this specific empirical setting rather than as fully validated general-purpose scales of media affinity. Internal consistency was acceptable for both IM and IB, but reliability alone does not establish construct validity. The six parallel items were designed to cover theoretically relevant dimensions of presenter affinity: ideological representation, topic relevance, approachability, perceived independence, interview fairness, and politicization. Additional validation would be needed before applying the scale to other hosts, programs, or media systems. One measurement caveat concerns Item 14 of the Broncano scale, which showed a weak corrected item–total correlation compared with the other items. Item 14 was retained to preserve the parallel six-item structure across presenters and because the overall reliability of the IB scale remained acceptable. This decision may introduce some noise measurement into IB and, by extension, BA. A separate coding caveat concerns the reverse-keying check for one Motos item. The final aggregation follows the definitive keying reported in Appendix A, and sensitivity checks indicated that the substantive ideological gradient was not driven by this item-coding decision.
Fifth, the use of BA as a difference score has interpretive limits. Although BA is well aligned with the study’s focus on relative affinity in a paired competitive setting, it can obscure absolute levels of affinity toward each host. Similar BA values may correspond to different evaluative profiles, such as liking both presenters, disliking both, or evaluating both moderately. Difference scores have also been criticized in psychometric literature when they are treated as complete substitutes for the underlying constructs. The present findings should therefore be read as evidence of ideological structuring in relative affinity. Future research should also model IM and IB separately and consider audience-profile typologies based on both absolute and relative evaluations.
Finally, the qualitative component serves as a descriptive complement rather than a fully independent qualitative or mixed-methods test. The thematic grouping of open-ended responses helps contextualize the quantitative gradient, but it does not include formal intercoder reliability statistics or respondent-level models linking thematic codes to BA or ideology. The qualitative findings should therefore be read as illustrative contextual evidence. Future mixed-methods work could use independent coders, intercoder agreement, and individual-level models to more systematically assess how specific evaluative frames relate to ideology, IM, IB, and BA.
Future analyses should routinely report IM and IB alongside BA, because similar BA values may reflect substantively different evaluative profiles, including dual affinity, dual rejection, neutrality, or asymmetric preference.

6.6. Future Directions

Three extensions appear especially promising. First, stimulus-based experiments could test whether varying tone, interview style, or fairness cues produce measurable changes in BA under more controlled conditions. Second, panel designs would enable assessment of how presenter-level factors affect evolving in response to political events, editorial shifts, or changes in guest selection. Third, future mixed-method and experimental work could connect clip-level features—such as topic, tone, framing, perceived civility, and platform context—to audience profiles including ideology, age, prior exposure, media trust, and parasocial attachment. In this way, subsequent research could move beyond descriptive alignment between thematic responses and BA and toward a more fully specified account of how media cues and audience predispositions interact in platformed late-night environments.
Future research should model IM and IB separately in addition to BA. This would preserve information about absolute evaluations and allow researchers to distinguish audience tendencies that BA alone cannot separate: dual affinity, dual rejection, neutrality, and asymmetric preference. Such models could also test whether ideology predicts affinity for each host through symmetric or asymmetric mechanisms.

7. Conclusions

Within this non-probability adult analytic sample, relative presenter-level evaluations of two prominent Spanish late-night hosts are strongly associated with respondents’ ideological self-placement. The sample means Affective Gap (BA = 0.192; 95% CI [0.094, 0.289]) differs from zero, and the ideological slope is clear and persists net of covariates, with stable estimates across bootstraps and targeted sensitivity analyses. Consistent with H3, BA varies modestly across sociodemographic profiles beyond ideology, although only age shows a robust association in the adjusted models.
This study decouples reach and affect, showing that political identity structures perceptions even in humorous and conversational formats. This shift in emphasis—from “who watches” to “how viewers evaluate”—reinforces frameworks on evaluation bias and ideological sorting as applied to media personalities, not only to informational content. Psychometrically, IM/IB achieve adequate reliability (α ≥ 0.70; ω coefficients consistent with α), with an empirical 6 + 6 item allocation via PCA, which provides a reproducible measure of individual affinity that is comparable across presenters.
Finally, the findings raise questions for future applied testing rather than offering directly tested editorial interventions. In a media environment where presenter evaluations may be ideologically sorted, future research could examine whether interview-fairness cues, contextual framing around politically sensitive segments, and short-clip packaging across platforms shape viewer evaluations or reduce hostile reactions. These implications remain tentative because the present study does not experimentally test segment design, clip packaging, or civility markers. Controlled studies could assess whether such editorial choices affect viewer evaluations.

Author Contributions

The authors participated in all phases of the research. All authors have read and agreed to the published version of the manuscript.

Funding

This research received no external funding.

Institutional Review Board Statement

The study was conducted in accordance with the Declaration of Helsinki and was initially approved on 10 September 2024. The protocol was renewed by the Ethics Committee of Rey Juan Carlos University on 30 April 2026 (protocol code: 250320263192026), for the ongoing analysis, dissemination, and publication of anonymized data. No additional recruitment or data collection was conducted after the original fieldwork period. The study complied with applicable data protection regulations and COPE/MDPI publishing ethics.

Informed Consent Statement

This study relied on an anonymous online survey of adults. All participants provided informed consent before survey initiation. No personally identifiable information was collected.

Data Availability Statement

The original data presented in the study are openly available in in the Universidad Rey Juan Carlos Dataverse, e-cienciaDatos, at https://doi.org/10.21950/YT407P. The deposit includes fieldwork, case-flow, quality-control, measurement, descriptive, model-summary, and coded open-ended response materials.

Acknowledgments

During the preparation of this manuscript, the authors used Microsoft 265 Copilot, powered by the GPT-5 reasoning model for the purposes of English language editing and grammatical correction.

Conflicts of Interest

The authors declare no conflicts of interest.

Abbreviations

The following abbreviations are used in this manuscript:
BAAffective Gap (IB − IM)
CIConfidence Interval
dfDegrees of freedom
HC3Heteroskedasticity-consistent SEs (type 3)
IBAffinity Index toward David Broncano
IMAffinity Index toward Pablo Motos
OLSOrdinary Least Squares
PCAPrincipal Components Analysis
QCQuality Control
Q1/Q3First/third quartile
R2Coefficient of Determination
SEStandard Error
SESSocioeconomic Status
αCronbach’s alpha
ωMcDonald’s omega

Appendix A

Table A1. Sample and quality controls.
MetricCountShareNotes
Total responses8771.000
Adults (≥18)8060.919
Speeders430.053Share among adults in the analytic frame; threshold = 1.283 min
Straight-liners (≥80%)730.091Share among adults in the analytic frame
Table A2. Item Mapping, Loadings, and Item–Total Statistics.
ItemIDScalePC1PC2CITC PearsonCITC SpearmanAlpha If DroppedReverse-Key Candidate
5IB (Broncano)−0.2790.3330.6300.6280.666No
7 −0.2940.3370.6750.6720.652No
11 −0.2930.2970.5190.5070.697No
13 −0.2270.3250.5200.5040.699No
14 0.1590.2880.0850.1000.804No
15 −0.1150.2940.4900.5110.709No
4IM (Motos)0.3370.2370.6970.6900.691No
6 0.3340.2690.7450.7390.675No
8 0.3430.2670.7450.7390.675No
9 −0.2980.298−0.261−0.2600.903Yes
10 0.3550.2460.7080.6960.689No
12 0.3210.2510.6890.6860.692No
Note: This table lists the 12 items of the affinity battery (Figure 1, Section 4), their two-component PCA loadings, corrected item–total correlations (Spearman, 1927) computed on the adult sample, Cronbach’s alpha if dropped, and a reverse-keying flag (negative CITC). Any negatively keyed item was re-coded before aggregation according to the definitive item map reported in Table A2. Within the IB scale, Item 14 showed the weakest corrected item–total association and the highest alpha-if-dropped value; however, it was retained in the final index to preserve symmetry with the parallel six-item structure, while overall reliability for IB remained acceptable.
Table A3. BA Percentiles, Extreme Shares, and Reliability (Adults, No QC Exclusions).
MetricValueNotes
N (adults, BA non-missing)806Adults (≥18), no speeder/straight-liner exclusions; scales require ≥4/6 items
BA percentiles (min, p5, p10, p25, p50, p75, p90, p95, max)
 min−4.0
 p5−2.333
 p10−1.5
 p25−0.667
 p500.167
 p751.167
 p902.0
 p952.5
 max3.333
Extreme shares (symmetric thresholds) Over N
 BA ≥ +1 (pro–Broncano)0.304share of N
 BA ≤ −1 (pro–Motos)0.179share of N
Sensitivity thresholds
 p25/p75 of BA−0.667/1.167from percentiles above
Reliability (from manuscript; adults sample)
IM (α/ω/ordinal α)0.773/0.868/0.769Reported in the manuscript
IB (α/ω/ordinal α)0.750/0.824/0.744Reported in the manuscript
Notes: This table is computed on the adult-only frame (≥18, ≤100) without removing speeders or straight-liners, in line with Section 5.3 of the manuscript. Composite scales (IM/IB) are averaged when at least 4 out of 6 items are observed; BA is defined as IB − IM. Reported statistics include percentiles, symmetric extreme shares (BA ≥ +1; BA ≤ −1), and the empirical p25/p75 cutoffs used in sensitivity checks. Reliability indices are reported in the manuscript and included here for reference and consistency with the main text.
Table A4. BA by Ideology (Means/CIs)—Adults; No QC Exclusions.
Ideology (−2 to +2)NMean BAMedian BA95% CI Lower95% CI Upper
−21150.9071.00.7121.101
−11501.0651.1670.8461.285
0251−0.0180.0−0.1760.141
1145−0.619−0.5−0.839−0.398
2145−0.125−0.167−0.3350.085
Notes: Following Section 5.3, Section 5.4 and Section 5.5 of the manuscript, all estimates in this table are computed on the adult-only frame (≥18, ≤100) without removing speeders or straight-liners. BA = IB − IM; scales require ≥4/6 observed items. The table reports mean and median BA by ideological self-placement (−2 to +2) with t-based 95% confidence intervals. Sign convention: BA > 0 indicates higher relative affinity for Broncano; BA < 0 indicates higher relative affinity for Motos.
Sample size (adults, BA & ideology non-missing): N = 806. Model-fit summaries for the OLS specifications discussed in the main text are R2 = 0.12 for M1 and R2 = 0.176 for M2.
Table A5. Code–Frequency Matrix for Open-ended Responses.
CategoryMotos (n)Broncano (n)Total (n)
humor85230315
approachability37112149
interviews/tough questions81110191
directivity/intrusiveness51116
tone301141
sexism29130
politicization342155
format27835
persona/brand7241113
fairness cues257
others6855721257
not codable242214456
Notes: Frequencies are reported for the adult analytic frame (ages 18–100), with no additional exclusion based on QC flags. Rule-based thematic grouping was used for descriptive contextualization. Counts are aggregate theme mentions by presenter; no verbatim responses are reported.

References

  1. Brassett, J. (2022). The ironic state. Bristol University Press. [Google Scholar] [CrossRef] [Scilit]
  2. Burgers, C., & Brugman, B. C. (2022). How satirical news impacts affective responses, learning, and persuasion: A three-level random-effects meta-analysis. Communication Research, 49(7), 966–993. [Google Scholar] [CrossRef] [Scilit]
  3. Cervi, L., Tejedor, S., & García Blesa, F. (2023). TikTok and political communication: The latest frontier of politainment? A case study. Media and Communication, 11(2), 15–28. [Google Scholar] [CrossRef] [Scilit]
  4. Cronbach, L. J. (1951). Coefficient alpha and the internal structure of tests. Psychometrika, 16(3), 297–334. [Google Scholar] [CrossRef] [Scilit]
  5. Efron, B., & Tibshirani, R. J. (1994). An introduction to the bootstrap. Chapman & Hall/CRC. [Google Scholar]
  6. Feldman, L. (2018). The hostile media effect. In K. Kenski, & K. H. Jamieson (Eds.), The Oxford handbook of political communication. Oxford University Press. [Google Scholar] [CrossRef] [Scilit]
  7. Holm, S. (1979). A simple sequentially rejective multiple test procedure. Scandinavian Journal of Statistics, 6(2), 65–70. Available online: https://www.jstor.org/stable/4615733 (accessed on 12 February 2026).
  8. Iyengar, S., Lelkes, Y., Levendusky, M., Malhotra, N., & Westwood, S. J. (2019). The origins and consequences of affective polarization in the United States. Annual Review of Political Science, 22, 129–146. [Google Scholar] [CrossRef] [Scilit]
  9. Jürgens, P., & Stark, B. (2022). Mapping exposure diversity: The divergent effects of algorithmic curation on news consumption. Journal of Communication, 72(3), 322–344. [Google Scholar] [CrossRef] [Scilit]
  10. Kim, E., & Patterson, S., Jr. (2025). The American viewer: Political consequences of entertainment media. American Political Science Review, 119(2), 917–931. [Google Scholar] [CrossRef] [Scilit]
  11. Klüser, K. J. (2025). From entertainment to engagement? Entertainment figures’ political messaging and audience responses in the digital age. Political Communication, 42(6), 968–991. [Google Scholar] [CrossRef] [Scilit]
  12. Kruskal, W. H., & Wallis, W. A. (1952). Use of Ranks in One-Criterion Variance Analysis. Journal of the American Statistical Association, 47(260), 583–621. [Google Scholar] [CrossRef]
  13. Likert, R. (1932). A technique for the measurement of attitudes. Archives of Psychology, 22(140), 1–55. [Google Scholar]
  14. Long, J. S., & Ervin, L. H. (2000). Using heteroskedasticity-consistent standard errors in the linear regression model. The American Statistician, 54(3), 217–224. [Google Scholar] [CrossRef] [Scilit]
  15. MacKinnon, J. G. (2012). Thirty years of heteroskedasticity-robust inference (Working Paper No. 1268). Queen’s University. Available online: https://www.econ.queensu.ca/working_papers/papers/qed_wp_1268.pdf (accessed on 8 January 2026).
  16. Matthes, J., Heiss, R., & van Scharrel, H. (2023). The distraction effect: Political and entertainment-oriented content on social media, political participation, interest, and knowledge. Computers in Human Behavior, 142, 107644. [Google Scholar] [CrossRef] [Scilit]
  17. McDonald, R. P. (1970). The theoretical foundations of principal factor analysis, canonical factor analysis, and alpha factor analysis. British Journal of Mathematical and Statistical Psychology, 23(1), 1–21. [Google Scholar] [CrossRef] [Scilit]
  18. Mendiburo-Seguel, A., Alenda, S., Ford, T. E., Olah, A. R., Navia, P. D., & Argüello-Gutiérrez, C. (2022). #funnypoliticians: How do political figures use humor on Twitter? Frontiers in Sociology, 7, 788742. [Google Scholar] [CrossRef] [Scilit] [PubMed]
  19. Milli, S., Carroll, M., Wang, Y., Pandey, S., Zhao, S., & Dragan, A. D. (2025). Engagement, user satisfaction, and the amplification of divisive content on social media. PNAS Nexus, 4(3), pgaf062. [Google Scholar] [CrossRef] [Scilit] [PubMed]
  20. Nærland, T. U. (2019). From pleasure to politics: Five functions of watching TV-series for public connection. European Journal of Communication, 35(2), 93–107. [Google Scholar] [CrossRef] [Scilit]
  21. Oschatz, C., & Marker, C. (2020). Long-term persuasive effects in narrative communication research: A meta-analysis. Journal of Communication, 70(4), 473–496. [Google Scholar] [CrossRef] [Scilit]
  22. Pehe, V. (2022). Poking fun at the transformation: Postsocialist TV satire in the 1990s. VIEW Journal of European Television History and Culture, 11(22), 7–22. [Google Scholar] [CrossRef] [Scilit]
  23. Rahmani, B., Montano, B., Groves, D. W., & Green, D. P. (2025). The persuasive effects of narrative entertainment: A meta-analysis of recent experiments. Behavioural Public Policy, 1–23. [Google Scholar] [CrossRef] [Scilit]
  24. Schemer, C., Stanyer, J., Meltzer, C. E., Gehle, L., Van Aelst, P., Theocharis, Y., Strömbäck, J., Štětka, V., Stępińska, A., Splendore, S., Zoizner, A., Matthes, J., Koc-Michalska, K., Hopmann, D. N., Esser, F., de Vreese, C., David, Y., Corbu, N., & Castro, L. (2024). The relationship of political entertainment media use and political efficacy: A comparative study in 18 countries. International Journal of Public Opinion Research, 36(4), edae046. [Google Scholar] [CrossRef] [Scilit]
  25. Spearman, C. (1927). The abilities of man: Their nature and measurement. Nature, 120(3014), 181–183. [Google Scholar] [CrossRef] [Scilit]
  26. Steppat, D., Castro Herrero, L., & Esser, F. (2022). Selective exposure in different political information environments—How media fragmentation and polarization shape congruent news use. European Journal of Communication, 37(1), 82–102. [Google Scholar] [CrossRef] [Scilit] [PubMed]
  27. Street, J. (1997). Politics and popular culture. Temple University Press. [Google Scholar]
  28. Stroud, N. J. (2018). Selective exposure theories. In K. Kenski, & K. H. Jamieson (Eds.), The Oxford handbook of political communication. Oxford University Press. [Google Scholar] [CrossRef] [Scilit]
  29. Tukachinsky, R., Walter, N., & Saucier, C. J. (2020). Antecedents and effects of parasocial relationships: A meta-analysis. Journal of Communication, 70(6), 868–894. [Google Scholar] [CrossRef] [Scilit]
  30. Yu, X., Haroon, M., Menchen-Trevino, E., & Wojcieszak, M. (2024). Nudging recommendation algorithms increases news consumption and diversity on YouTube. PNAS Nexus, 3(12), pgae518. [Google Scholar] [CrossRef] [Scilit] [PubMed]
Figure 2. BA by ideological self-placement (−2 = left, …, +2 = right) among adults in the adult analytic frame (N = 806). Outcome: BA = IB − IM (BA > 0 indicates higher relative affinity for Broncano; BA < 0 for Motos). The horizontal dashed line marks BA = 0. Boxes/violins display the distribution within each ideological category.
Journalmedia 07 00144 g002
Figure 3. OLS (HC3) coefficient plot for M2 (BA~Ideology + Age + Gender + Education + SES). Dots = estimates; bars = 95% CIs. Adult analytic frame; model-specific N reported in the regression table; ≥4/6 items per presenter-specific scale; BA = IB − IM.
Journalmedia 07 00144 g003
Figure 4. Bootstrap distributions of the ideological slope. Vertical lines mark a percentile-based 95% CI range for M1 and M2. Percentile bootstrap uncertainty (B = 1000) confirms the precision of the ideological slope (M1: 95% CIs [−0.399, −0.285]; M2: 95% CIs [−0.402, −0.295]).
Journalmedia 07 00144 g004
Disclaimer/Publisher’s Note: The statements, opinions and data contained in all publications are solely those of the individual author(s) and contributor(s) and not of MDPI and/or the editor(s). MDPI and/or the editor(s) disclaim responsibility for any injury to people or property resulting from any ideas, methods, instructions or products referred to in the content.