


Abstract
Groundwater quality in semi-arid regions is influenced by interacting geological, climatic, and human factors. This study integrated hydrochemical analysis, ionic relationships, multivariate statistics, Water Quality Index (WQI), and GIS-based spatial analysis to evaluate groundwater quality in Fars Province, southern Iran. A total of 171 groundwater wells were sampled during each of the 2020 and 2021 monitoring campaigns. Hydrochemical diagrams and ionic relationships indicated the predominance of Na–Cl facies and showed that groundwater chemistry is mainly controlled by carbonate and silicate weathering, evaporite dissolution, cation exchange, water–rock interaction, and evaporation–crystallization. Chloro-alkaline indices indicated a mixed cation-exchange system, with positive CAI values predominating regionally and negative values occurring locally. Principal Component Analysis (PCA) and Hierarchical Cluster Analysis (HCA) consistently identified groundwater mineralization as the dominant source of hydrochemical variability, characterized by EC, TDS, major ions, and hardness, while bicarbonate and nitrate represented a secondary source of variability reflecting both carbonate-related processes and localized nutrient inputs. Based on WQI, about 48% and 42.7% of the sampled wells were classified as excellent or good in 2020 and 2021, respectively, whereas 26% and about 30% were unsuitable for drinking. Spatial analysis revealed widespread mineralization and enrichment of Na+, Cl−, and SO42−, although interpolation results for EC and TDS should be interpreted cautiously and primarily for exploratory visualization of spatial patterns because of their lower predictive performance. In general, regional groundwater quality is governed primarily by natural hydrogeochemical evolution, while localized anthropogenic influences may contribute to nutrient variability. The results provide a basis for targeted monitoring and sustainable groundwater management in semi-arid aquifers.
1. Introduction
Groundwater is one of the most important freshwater resources supporting domestic water supply, agricultural production, industrial development, and ecosystem sustainability worldwide [1,2,3,4]. Its importance is particularly pronounced in arid and semi-arid regions, where limited and highly variable surface water resources make groundwater the primary source of freshwater for human consumption and socioeconomic development. However, rapid population growth, urbanization, industrialization, agricultural expansion, and climate change have substantially increased groundwater abstraction during recent decades, resulting in declining groundwater levels and progressive deterioration of groundwater quality [5,6,7,8,9,10]. Intensive groundwater exploitation has become particularly critical in semi-arid regions, where reduced recharge and prolonged drought accelerate salinization and hydrochemical evolution, thereby threatening the long-term sustainability of groundwater resources [11,12,13,14].
Groundwater chemistry is controlled by complex interactions among lithology, mineral weathering, groundwater residence time, evaporation, ion exchange, and anthropogenic activities. Consequently, identifying the dominant hydrogeochemical processes is essential for evaluating groundwater suitability and developing effective management strategies [15,16,17,18,19]. Comprehensive groundwater quality assessment therefore requires not only the determination of physicochemical parameters but also integrated hydrochemical interpretation using graphical techniques, multivariate statistical analyses, and spatial analysis to distinguish natural geochemical controls from human-induced impacts.
Among the available assessment approaches, the Water Quality Index has become one of the most widely applied tools for evaluating groundwater suitability for drinking purposes because it integrates multiple water quality variables into a single quantitative indicator that is readily interpreted by water managers and decision-makers [20,21,22,23,24]. Combined with hydrochemical facies classification, ionic relationships, and spatial mapping techniques, WQI provides a practical framework for identifying groundwater quality deterioration and delineating areas requiring management intervention. Previous studies have successfully integrated WQI with hydrochemical analyses to evaluate surface and groundwater quality in different hydrogeological settings, including Lake Dokan in Iraq [25], the Shatt Al-Kufa River [26], groundwater resources in Ghana [27], and the Dayrout aquifer in Upper Egypt [28]. Similar investigations have also been conducted in Iran, including groundwater quality assessment in Birjand [29], Sistan and Baluchistan Province [30], Beheshtabad Basin [31], and nitrate pollution monitoring in the Fasarud Plain using GIS techniques [32].
Although hydrochemical diagrams, ionic relationships, multivariate statistical techniques, water quality indices, and geospatial analysis are well-established approaches, their integration can provide a more comprehensive interpretation of complex groundwater systems. In hydrogeologically heterogeneous regions, groundwater chemistry commonly reflects interacting effects of geological conditions, mineral weathering, evaporite dissolution, cation exchange, evaporation–crystallization, and localized anthropogenic inputs. Hydrochemical diagrams identify major facies and evolutionary trends, ionic cross-plots and chloro-alkaline indices provide evidence of mineral dissolution and cation-exchange processes, while multivariate and spatial analyses help identify common controls and their regional variability. Integrating these complementary approaches can therefore provide greater process-based insight than applying individual methods independently.
Accordingly, this study evaluates groundwater chemistry and drinking-water quality across a large regional groundwater system covering approximately 27,500 km2 in southern Iran using observations from 2020 and 2021. The study’s contribution lies in integrating hydrochemical, ionic, multivariate, and geospatial evidence to identify the dominant hydrogeochemical facies and processes, including geological control, silicate and carbonate weathering, evaporite dissolution, cation exchange resulting in Na+/K+ or Ca2+/Mg2+ release, and evaporation–crystallization. It further links these processes with spatial variability and drinking-water suitability, providing a regional-scale understanding of groundwater evolution and the factors controlling its quality.
2. Materials and Methods
2.1. Study Area
The study area encompasses the eastern part of Fars Province, southwestern Iran, covering approximately 27,500 km2 between latitudes 28°30′–30°35′ N and longitudes 52°05′–55°10′ E (Figure 1). The area is situated within the Simply Folded Zagros Belt, a tectonic zone formed by the collision of the Arabian and Eurasian plates, which has produced a series of NW–SE trending anticlines and synclines that fundamentally control groundwater occurrence and flow [33].
Figure 1.
Position of the study area within Fars Province and Iran, showing the locations of groundwater observation wells.
The study area encompasses several interconnected alluvial aquifer systems within the Kor River Basin and adjacent intermontane plains. The principal aquifer systems include the Marvdasht–Kharameh alluvial plain, the Fasa alluvial plain, and several smaller intermontane basins. The Marvdasht Plain, the largest and most extensively studied, forms a major intermontane basin within the Zagros Mountain chain extending in a NW–SE direction, with an alluvial aquifer area of approximately 1986 km2 [34]. The Fasa Plain, located to the southeast, constitutes a smaller but hydrogeologically distinct alluvial aquifer system [35]. Together, these plains represent the principal groundwater resource systems of the study region, supplying domestic, agricultural, and industrial water demands for a population exceeding 2.5 million.
The geological succession is dominated by sedimentary formations ranging from the Cretaceous to the Quaternary (Figure 2). The primary bedrock aquifers are composed of thick-bedded, fractured, and locally dolomitized limestones of the Sarvak, Asmari, Jahrom, and Daryan formations, which have developed significant secondary porosity and permeability through extensive fracturing and karstification [36]. These carbonate formations constitute the principal regional recharge areas and play a fundamental role in controlling groundwater chemistry through carbonate weathering. Overlying the bedrock, the Gachsaran Formation (consisting of marl, gypsum, and evaporite deposits) acts as a regional aquitard, impeding vertical water movement between the deeper karstic aquifers and the shallow alluvial systems [37].
Figure 2.
The aquifer characteristics maps: geology (a), land use (b), soil type (c), and groundwater flow direction (d).
Quaternary alluvial deposits, derived from erosion of surrounding sedimentary formations, cover most of the lowland plains. These deposits consist of heterogeneous mixtures of gravel, sand, silt, and clay deposited by fluvial and lacustrine systems, creating the principal shallow aquifer units. The alluvial aquifer system is generally unconfined to semi-confined, with saturated thicknesses ranging from approximately 50 m in marginal zones to more than 200 m in the central parts of the Marvdasht Plain [34]. In the Fasa Plain, the alluvial aquifer thickness is typically 60–120 m, decreasing toward the margins where bedrock approaches the surface [35]. The aquifer is layered, with clay and silt interbeds occurring between more permeable sandy and gravelly horizons, creating locally semi-confined conditions.
Regional groundwater flow is controlled by the topographic gradient, which decreases from the Zagros Mountain front (elevations > 3000 m) in the northwest and north toward the lower-elevation plains (approximately 1000 m) in the south and southeast. In the Marvdasht Plain, potentiometric surface mapping indicates that groundwater flow is generally directed from the mountain front toward the central and southern parts of the plain, converging toward the Kor River corridor and ultimately toward Bakhtegan Lake in the southeast [34]. Local flow directions are influenced by the NW–SE trending geological structures, pumping centers, and the position of the Kor River and its tributaries, which may function as either gaining or losing reaches depending on the relative positions of the water table and stream stage. In the Fasa Plain, groundwater flows predominantly from the northern and northeastern margins toward the southern and southwestern parts of the plain, with the general flow direction following the topographic gradient [35]. The hydraulic gradient across the alluvial plains is typically gentle (on the order of 10−3 to 10−2), consistent with the flat topography of the interior plains.
Groundwater recharge occurs primarily through (1) direct infiltration of precipitation through the alluvial cover and karst outcrops, (2) mountain-front recharge from the Zagros foothills, (3) seepage from ephemeral and perennial streams (particularly the Kor River and its tributaries), and (4) subsurface inflow from adjacent aquifer systems. The mean long-term annual precipitation across the study area is approximately 250–270 mm [38,39], concentrated mainly during the autumn and winter wet season (November–March). However, the prolonged dry season (April–October), combined with high potential evapotranspiration (approximately 1800–2200 mm yr−1), results in limited net recharge. Groundwater discharge occurs through (1) pumping from approximately 40,000 wells across Fars Province [40], (2) natural discharge to springs and qanats, (3) evapotranspiration in shallow water-table areas, and (4) lateral outflow to downstream aquifer systems. The annual groundwater extraction in the study area substantially exceeds natural recharge, resulting in a persistent negative water balance and progressive groundwater-level decline [40,41].
The study area is characterized by a hot semi-arid climate according to the Köppen–Geiger classification [42]. The mean annual air temperature is approximately 18 °C, with seasonal extremes ranging from −5 °C in winter to 39 °C in summer [43]. The prolonged dry season and intense evapotranspiration substantially exceed annual precipitation, limiting natural recharge and promoting progressive groundwater salinization through enhanced water–rock interaction and evaporative concentration of dissolved constituents along regional flow paths.
2.2. Groundwater Network and Samplingmethodolgy
The groundwater monitoring network comprises 171 observation and production wells distributed across the study area (Figure 1). The wells are part of the long-term groundwater quality monitoring network maintained by the Fars Regional Water Authority under the supervision of the Iran Water Resources Management Company (IWRMC). The monitoring wells were selected to represent the spatial variability of groundwater quality across different hydrogeological settings, including recharge zones near the mountain front, intermediate flow paths, and discharge areas in the central and downgradient parts of the plains. The well network includes both dedicated monitoring wells and production wells that have been incorporated into the monitoring program. Well depths range from approximately 20 to 200 m below ground level, with the majority of wells screened within the principal alluvial aquifer units.
Two annual groundwater sampling campaigns were conducted during 2020 and 2021. In both campaigns, the same 171 wells were sampled to ensure direct comparability of the results. Sampling was performed during the dry season (late spring to early autumn) to characterize baseline groundwater chemistry under conditions of minimal short-term recharge influence. The timing of sampling was consistent between the two years, with samples collected during comparable hydrological conditions to minimize the influence of seasonal variability on the observed differences. All field sampling was conducted by trained personnel from the Fars Regional Water Authority following standardized operating procedures.
Prior to sample collection, each well was purged by pumping at least three well volumes of water to ensure that the sampled water represented formation water rather than stagnant water from the well casing. Field parameters including pH, electrical conductivity (EC), and temperature were measured in situ using calibrated multiparameter instruments (Hach HQ40d, Hach Company, Loveland, CO, USA). Water samples were collected in pre-cleaned high-density polyethylene (HDPE) bottles. Samples for cation analysis were acidified to pH < 2 with concentrated HNO3, while samples for anion analysis were stored unacidified. All samples were stored in insulated coolers at approximately 4 °C during transport and maintained at this temperature until analysis, in accordance with standard preservation protocols [44].
Chemical analyses were performed in accredited laboratories licensed by the Iran Department of Environment, following the analytical methods prescribed by the American Public Health Association (APHA) Standard Methods for the Examination of Water and Wastewater [45]. The analytical methods, detection limits, and instrumentation used for each parameter are summarized in Table S1. Major cations (Na+, Ca2+, Mg2+) were determined by flame atomic absorption spectrophotometry (AAS; AA-7000, Shimadzu Corporation, Kyoto, Japan) or inductively coupled plasma optical emission spectrometry (ICP-OES; 5110 ICP-OES, Agilent Technologies, Santa Clara, CA, USA). Major anions (Cl−, SO42−, HCO3−, NO3−, NO2−) were analyzed by ion chromatography (930 Compact IC Flex, Metrohm AG, Herisau, Switzerland) and titrimetric methods. Total dissolved solids (TDS) were determined gravimetrically after evaporation at 105 °C, while total hardness (TH) was calculated from Ca2+ and Mg2+ concentrations.
The IWRMC implements a comprehensive QA/QC framework to ensure the reliability of groundwater quality data. This framework includes the following procedures: laboratory accreditation, calibration and verification, duplicate analyses, blank analyses, and charge balance error (CBE). The CBE distribution across the dataset is summarized in Table S2. About 47.7% of samples exhibited CBE values within ±5%, which is considered excellent for hydrogeochemical analyses [46,47]. Approximately 46% of samples showed CBE values between 5% and 10%, which is within the generally accepted range for groundwater studies [48,49,50]. Approximately 6.5% of samples exhibited CBE values between 10% and 15%. These samples were retained in the dataset because: (a) the CBE values remained within the ±15% threshold recommended by [49] for hydrogeochemical investigations; (b) the deviations are attributable to the inherent uncertainty in the analysis of minor constituents (particularly NO2− and HCO3−) and to the analytical detection limits for trace concentrations; and (c) exclusion of these samples would disproportionately remove data from specific spatial zones, potentially biasing the spatial analysis.
2.3. Data Preprocessing
Prior to statistical and hydrogeochemical analyses, the groundwater dataset was preprocessed to establish a consistent and reliable database. The data were screened for duplicate records, formatting inconsistencies, and anomalous observations using descriptive statistics and graphical inspection. Potential outliers were evaluated considering their hydrochemical plausibility and spatial consistency rather than statistical deviation alone, ensuring that naturally occurring extreme values were retained while analytically inconsistent measurements were corrected [51,52].
The dataset was subsequently standardized by harmonizing parameter names, measurement units, and data formats. As the monitoring records were essentially complete, no missing-value imputation was required. Following preprocessing, descriptive statistical parameters, including the minimum, maximum, mean, median, standard deviation, coefficient of variation, skewness, and kurtosis, were calculated for each water-quality parameter to characterize groundwater variability and provide the basis for subsequent hydrochemical, multivariate statistical, and spatial analyses.
2.4. Hydrochemical Analysis
Hydrochemical analyses were performed to identify the dominant geochemical processes controlling groundwater composition and to characterize the evolution of groundwater chemistry within the study area [48,50]. Descriptive evaluation of ionic abundance was subsequently used to identify the dominant hydrochemical constituents and their spatial and temporal variations.
Hydrochemical facies were identified using the Piper trilinear diagram, which classifies groundwater according to the relative proportions of major cations and anions and provides insight into groundwater evolution, mixing processes, and water–rock interactions [53]. To further investigate the mechanisms governing groundwater chemistry, the Gibbs diagram was employed to distinguish the relative influences of precipitation, rock weathering, and evaporation-crystallization processes on groundwater composition [54]. In addition, the Chadha diagram was used as a modified hydrochemical classification approach to identify dominant hydrogeochemical facies and ion-exchange processes [55], whereas the Durov diagram was applied to evaluate hydrochemical evolution, mixing patterns, and geochemical reactions occurring within the aquifer system [56]. The combined interpretation of these graphical methods provided a comprehensive assessment of groundwater hydrochemistry and formed the basis for subsequent interpretation of the governing geochemical processes in the study area.
2.5. Ionic Relationships and Cation-Exchange Indicators
To further identify the hydrogeochemical processes controlling groundwater chemistry, selected ionic relationships were evaluated using equivalent concentrations (meq L−1). The Na+–Cl− relationship was examined to distinguish the contribution of halite dissolution from additional sources or sinks of Na+. Groundwater derived predominantly from simple halite dissolution is expected to exhibit an approximately 1:1 relationship between Na+ and Cl−, whereas systematic deviations may indicate silicate weathering, ion exchange, additional chloride sources, or anthropogenic influences.
The relationship between (Ca2+ + Mg2+) and (HCO3− + SO42−) was also evaluated using a 1:1 reference line. Samples located close to the equiline indicate that carbonate and sulfate mineral dissolution can broadly account for the observed alkaline-earth cations and major anions. Systematic deviations from this relationship indicate additional geochemical processes, including cation exchange and/or additional mineral sources [48,50,57].
The direction of cation exchange was independently evaluated using the chloro-alkaline indices proposed by Schoeller [58], expressed as:
where all ionic concentrations are expressed in meq L−1. Negative CAI-I and CAI-II values indicate a cation-exchange process in which aqueous Ca2+ and Mg2+ are exchanged with Na+ and K+ retained on exchange sites of clay minerals and other aquifer materials. This process removes Ca2+ and/or Mg2+ from groundwater and releases Na+ and/or K+ into solution, thereby contributing to Na+ and K+ enrichment:
Ca2+(aq) + 2Na − X ⇌ Ca − X2 + 2Na+(aq)
Positive CAI-I and CAI-II values indicate the opposite exchange direction, in which aqueous Na+ and K+ are exchanged with Ca2+ and Mg2+ retained on exchange sites. This process removes Na+ and/or K+ from groundwater and releases Ca2+ and/or Mg2+ into solution [59]:
2Na+(aq) + Ca − X2 ⇌ 2Na − X + Ca2+(aq)
2.6. Drinking Water Quality Index (WQI)
The suitability of groundwater for drinking purposes was evaluated using the Weighted WQI, which integrates multiple physicochemical parameters into a single dimensionless indicator describing the overall drinking water quality [60]. Twelve water-quality parameters, including pH, EC, TDS, TH, Ca2+, Mg2+, Na+, HCO3−, Cl−, NO3−, NO2−, and SO42−, were selected based on their hydrochemical significance and drinking-water standards. The corresponding standard values used in the WQI calculation were adopted from established drinking-water WQI methodologies and relevant drinking-water standards. Because WHO does not provide health-based guideline values for several major ions, they were treated as conventional WQI reference concentrations rather than WHO health-based guideline values [61,62,63].
The parameter weights were assigned according to their relative importance to human health and drinking water quality (Table 1).
Table 1.
Drinking-water reference values and parameter weights used for WQI computation.
Each parameter was assigned a weight (wi) ranging from 2 to 5, where higher weights were allocated to constituents with greater health significance, such as nitrate and sulfate, whereas lower weights were assigned to parameters of comparatively lower health concern. The relative weight (Wi) of each parameter was calculated as:
where wi is the assigned weight of the ith parameter and n is the total number of parameters.
The quality rating (qi) for each parameter was determined using:
where Ci is the measured concentration of the parameter and Si is its corresponding drinking-water standard. As pH is a bounded parameter with both lower and upper acceptable limits, it was treated separately rather than using a single upper-limit equation. An ideal pH of 7.0 was adopted, with the acceptable range defined as 6.5–8.5. To avoid a discontinuity at the boundaries of the acceptable interval, a continuous two-sided quality-rating function was applied [64]:
The sub-index (SIi) of each parameter was subsequently calculated as:
The overall Water Quality Index was then obtained by summing the sub-indices of all parameters:
The computed WQI values were classified into five categories following the widely adopted classification proposed by [60]: excellent water (WQI < 50), good water (50–100), poor water (100–200), very poor water (200–300), and water unsuitable for drinking (WQI > 300). The resulting WQI values were subsequently used to evaluate the spatial distribution of groundwater quality and to identify areas requiring priority management and protection. The sample calculation for different conditions is presented in Supplementary Materials (Table S3).
2.7. Multivariate Statistical Analysis
Multivariate statistical techniques were employed to investigate the relationships among groundwater quality parameters, identify the dominant factors controlling groundwater chemistry, and classify groundwater samples with similar hydrochemical characteristics. Prior to analysis, all variables were standardized to eliminate the influence of differences in measurement units and magnitudes. Statistical analyses were performed using IBM SPSS Statistics (Version 25) and MATLAB R2024b (MathWorks Inc., Natick, MA, USA).
Pearson correlation analysis was first applied to quantify the strength and direction of linear relationships among the measured physicochemical parameters. The correlation coefficients were used to identify significant associations among major ions and physicochemical properties and to provide preliminary insight into the hydrogeochemical processes governing groundwater composition.
Principal Component Analysis (PCA) was subsequently performed to reduce the dimensionality of the hydrochemical dataset and to identify the principal factors controlling groundwater chemistry. Components with eigenvalues greater than one were retained according to the Kaiser criterion [65], and Varimax orthogonal rotation was applied to improve the interpretability of the component loadings [66]. Variables with high positive or negative loadings within each principal component were interpreted as representing common hydrogeochemical processes, including mineral weathering, ion exchange, evaporation, and anthropogenic influences.
HCA was performed to evaluate similarities among the measured physicochemical variables and identify groups of parameters exhibiting comparable hydrochemical behavior. Prior to clustering, all variables were standardized using z-score transformation. Agglomerative clustering was performed using Euclidean distance and Ward’s minimum-variance linkage method [67]. The variable dendrograms were examined using the linkage-distance scale, and a common cut level was applied to identify the principal variable clusters. HCA was used as complementary evidence to the Pearson correlation analysis and PCA rather than as an independent validation method.
To evaluate whether the observed differences between the 2020 and 2021 monitoring campaigns represent statistically significant changes rather than sampling or seasonal variability, the Wilcoxon signed-rank test was used as the primary paired test because several variables exhibited substantial skewness. The paired t-test was additionally applied as a sensitivity analysis to examine whether conclusions were robust to the parametric assumption. Because the same 171 wells were sampled in both campaigns under comparable hydrological conditions (dry season), the paired-sample design enables direct comparison of groundwater quality at each monitoring location.
2.8. Spatial Analysis
Spatial analysis was conducted to characterize the geographical distribution and spatial variability of groundwater-quality parameters and the WQI across the study area. All spatial analyses and map production were performed using ArcGIS 10.8 (ESRI Inc., Redlands, CA, USA).
The distributional characteristics of each variable were first examined using descriptive statistics and the Shapiro–Wilk normality test. Normality assessment was used as preliminary information rather than as the sole criterion for selecting an interpolation method. Candidate interpolation models were evaluated according to the characteristics of each dataset and their predictive performance. For variables exhibiting a suitable spatial structure, Ordinary Kriging was considered, including evaluation of the semivariogram and appropriate variogram model. Inverse Distance Weighting (IDW) was optimized by testing alternative power parameters for the remaining variables. The selection of interpolation models therefore considered both the statistical and spatial characteristics of the data, consistent with the principle that interpolation performance is variable-specific and should be evaluated rather than assumed from data distribution alone [68].
The predictive performance of the selected interpolation models was evaluated using Leave-One-Out Cross-Validation (LOOCV). For each observation, the measured value was temporarily excluded, predicted from the remaining observations, and then compared with the observed value. Model performance was assessed using normalized root mean square error (NRMSE), Kling–Gupta efficiency (KGE), and the Willmott index of agreement (Wi-I). Cross-validation is particularly important because it provides an empirical assessment of the ability of an interpolation model to predict values at unsampled locations [69].
The resulting interpolated surfaces were classified using scientifically relevant concentration thresholds and drinking-water reference values consistent with the criteria adopted for the groundwater-quality and WQI assessments. The proportional area occupied by each class was calculated from the classified raster layers. Because interpolation uncertainty may increase in relatively sparsely sampled parts of the monitoring domain, particularly near peripheral areas, the resulting maps were interpreted as regional spatial estimates rather than direct observations at unsampled locations.
3. Results and Discussion
3.1. Descriptive Statistics
Table 2 and Table 3 and Figure 3 summarize the descriptive statistics and distribution characteristics of the groundwater quality parameters for 2020 and 2021. Considerable spatial variability was observed in groundwater chemistry during both monitoring years. Most physicochemical parameters exhibited relatively high coefficients of variation (CV > 50%), particularly EC, TDS, TH, Na+, Cl−, SO42−, Ca2+, and Mg2+, indicating substantial heterogeneity in groundwater composition that can be attributed to differences in lithology, groundwater flow conditions, water–rock interaction, and local anthropogenic influences. In contrast, pH and HCO3− showed comparatively low variability (CV < 20%), suggesting relatively stable acid–base conditions throughout the aquifer system.
Table 2.
Descriptive statistics of groundwater quality parameters in 2020.
Table 3.
Descriptive statistics of groundwater quality parameters in 2021.
Figure 3.
Comparative boxplots of the physicochemical parameters measured in groundwater during the 2020 and 2021 monitoring campaigns. The boxplots illustrate the median, interquartile range, whiskers, and outliers for each parameter, highlighting the spatial variability and distribution characteristics of groundwater quality across the study area.
The boxplots (Figure 3) further illustrate the distribution of the measured parameters by showing wide interquartile ranges and numerous upper-end outliers for EC, TDS, TH, Na+, Cl−, and SO42−, whereas pH and HCO3− display comparatively narrow distributions. These observations are consistent with the positive skewness and high kurtosis values reported in Table 2 and Table 3, indicating that elevated concentrations occur only in a limited number of groundwater samples while most wells contain comparatively lower concentrations. The overall distribution patterns remained generally similar between 2020 and 2021, although a slight increase in the mean values of EC, TDS, SO42−, Na+, NO3−, and WQI during 2021 suggests a modest deterioration in groundwater quality. Collectively, the descriptive statistics and boxplot distributions provide the statistical foundation for the subsequent hydrochemical, multivariate statistical, and spatial analyses.
The Wilcoxon signed-rank test was applied to each physicochemical parameter to test the null hypothesis that the median difference between the 2020 and 2021 measurements is zero (Table S4). The Wilcoxon test was selected because it does not require the assumption of normality, which is appropriate given the positively skewed distributions observed for several parameters (Table 2 and Table 3). Additionally, the paired t-test was applied as a parametric complement. Effect sizes were assessed using the rank-biserial correlation coefficient to evaluate the practical significance of any statistically significant differences. The Wilcoxon signed-rank test indicates that five parameters (pH, HCO3−, NO3−, NO2−, and Mg2+) show statistically significant differences between the two campaigns at α = 0.05. However, it is important to note that the principal salinity parameters (EC, TDS, Na+, Cl−, SO42−, TH, Ca2+) show no statistically significant differences between the two campaigns, confirming that the dominant hydrogeochemical characteristics remained stable.
3.2. Hydrochemical Characteristics and Dominant Hydrogeochemical Processes
The groundwater chemistry exhibited a consistent ionic composition during both monitoring campaigns, with Na+ as the dominant cation and Cl− as the dominant anion (Table 2 and Table 3; Figure 4). The overall ionic abundance followed the sequence Na+ > Ca2+ > Mg2+ for cations and Cl− > SO42− > HCO3− for anions, while the relative abundance of these ions remained largely unchanged between 2020 and 2021 (Figure 4). This persistent ionic pattern indicates that the hydrochemical characteristics of the aquifer were relatively stable throughout the study period despite minor temporal variations in dissolved ion concentrations.
Figure 4.
Mean concentrations and relative abundance of the major cations (Na+, Ca2+, and Mg2+) and anions (Cl−, SO42−, and HCO3−) in groundwater during the 2020 and 2021 monitoring campaigns. The figure illustrates the dominant ionic composition and its temporal consistency across the study area.
The predominance of sodium, chloride, and sulfate, together with their relatively high mean concentrations and coefficients of variation (Table 2 and Table 3), suggests that groundwater chemistry is primarily governed by natural hydrogeochemical processes, although localized anthropogenic influences cannot be excluded. Elevated concentrations of these ions are consistent with groundwater evolution through prolonged water–rock interaction and the dissolution of soluble minerals, whereas the comparatively low variability of HCO3− reflects a more uniform contribution from carbonate buffering reactions across the aquifer. The slight increase in the mean concentrations of Na+ and SO42− during 2021 may indicate localized changes in groundwater evolution or recharge conditions rather than a basin-wide shift in hydrochemical composition.
The dominance of Na+–Cl− type waters further suggests the contribution of evaporite mineral dissolution and cation-exchange reactions to groundwater evolution, particularly within the downgradient parts of the aquifer. Nevertheless, the relative importance of geological formations, mineral weathering, evaporation, ion exchange, groundwater flow, and anthropogenic activities cannot be inferred solely from major-ion abundance. These controlling mechanisms are therefore examined in detail in the following sections using hydrochemical facies diagrams, ionic ratio analyses, and multivariate statistical techniques.
3.3. Hydrochemical Facies and Hydrogeochemical Evolution
3.3.1. Hydrochemical Facies
The Piper, Chadha, and Durov diagrams consistently indicate that groundwater chemistry remained relatively stable during the two monitoring campaigns despite minor temporal variations in ion concentrations (Figure 5, Figure 6, Figure 7 and Figure 8). The Piper diagrams (Figure 5) show that most groundwater samples are concentrated within the Na–Cl hydrochemical facies, whereas a smaller proportion of samples occupy mixed Ca–Mg–Cl and Ca–HCO3 fields. The predominance of sodium and chloride is consistent with the major-ion abundance discussed previously and suggests that groundwater has undergone considerable hydrochemical evolution before reaching the sampling locations. The persistence of similar facies during both years indicates that the dominant geochemical mechanisms controlling groundwater chemistry remained essentially unchanged.
Figure 5.
Piper trilinear diagrams illustrating the hydrochemical facies of groundwater samples collected during (a) 2020 and (b) 2021. The distribution of samples within the diamond field was used to identify the dominant groundwater facies and evaluate the temporal consistency of hydrochemical evolution.
Figure 6.
Chadha diagrams of groundwater samples collected during (a) 2020 and (b) 2021, showing the dominant hydrochemical facies and geochemical evolution of groundwater based on the relative abundance of major cations and anions.
Figure 7.
Durov diagrams for groundwater samples collected during (a) 2020 and (b) 2021, illustrating the hydrochemical evolution of groundwater and the influence of geochemical processes such as mineral dissolution, mixing, and ion exchange.
Figure 8.
Relationship between Na+ and Cl− concentrations for groundwater samples collected during (a) 2020 and (b) 2021.
The Chadha diagrams (Figure 6) further confirm this interpretation by showing that most groundwater samples plot within the field representing alkaline earths exceeding alkali metals with strong acidic anions, together with samples evolving toward alkali metal dominance. This distribution reflects progressive groundwater evolution from relatively fresh recharge waters toward chemically mature groundwater enriched in sodium and chloride through prolonged water–rock interaction and geochemical reactions. Likewise, the Durov diagrams (Figure 7) indicate that the groundwater is characterized mainly by simple dissolution processes accompanied by mixing and localized ion-exchange reactions, suggesting that groundwater chemistry results from the combined influence of several hydrogeochemical mechanisms rather than a single dominant process.
3.3.2. Geological Control and Mineral Weathering
The observed hydrochemical facies are closely associated with the geological framework of the aquifer. The predominance of dissolved sodium, chloride, calcium, magnesium, sulfate, and bicarbonate indicates that groundwater chemistry is primarily controlled by interaction between groundwater and the surrounding geological formations during regional flow. Carbonate minerals contribute calcium, magnesium, and bicarbonate through dissolution reactions, whereas silicate weathering provides an additional source of alkali metals, particularly sodium. The relatively low spatial variability of bicarbonate compared with the major salinity-related ions (Table 2 and Table 3) suggests that carbonate weathering is a widespread background process operating throughout the aquifer, whereas the greater variability of sodium, chloride, and sulfate reflects local geological heterogeneity and differences in groundwater residence time.
The Durov diagrams support this interpretation by indicating that mineral dissolution constitutes one of the principal mechanisms governing groundwater chemistry. The coexistence of carbonate-derived ions with high concentrations of sodium and chloride demonstrates that groundwater evolution cannot be explained solely by carbonate weathering but instead reflects the combined effects of carbonate dissolution, silicate weathering, and subsequent hydrochemical modification during groundwater circulation.
3.3.3. Ionic Relationships and Cation-Exchange Processes
The ionic cross-plots provide additional evidence regarding the processes responsible for the evolution of groundwater chemistry and complement the interpretations obtained from the Piper, Durov, Chadha, and Gibbs diagrams. In particular, the Na+–Cl− relationship and chloro-alkaline indices allow the direction of cation exchange to be evaluated more explicitly than hydrochemical facies diagrams alone. The Na+–Cl− relationships for both 2020 and 2021 show that most groundwater samples deviate below the 1:1 reference line (Figure 8), indicating that Na+ concentrations are generally lower than those expected from a simple stoichiometric relationship with Cl−. Thus, halite dissolution alone cannot explain the observed Na+ and Cl− composition. The relative Na+ deficit may reflect the removal of Na+ from groundwater through exchange with Ca2+ and Mg2+ associated with aquifer materials, while additional sources of Cl−, including evaporite dissolution and localized anthropogenic inputs, may also contribute to the observed deviation. The broadly similar distribution of samples during both monitoring years indicates that the processes controlling the Na+–Cl− relationship remained relatively stable over time. The Na+–Cl− plots therefore do not provide evidence for widespread sodium enrichment caused by cation exchange resulting in Na+/K+ release; instead, they are more consistent with a substantial role of Na+ removal and cation exchange resulting in Ca2+/Mg2+ release.
The relationship between (Ca2+ + Mg2+) and (HCO3− + SO42−) provides further insight into the sources of alkaline-earth cations and the role of ion exchange (Figure 9). A number of samples occur close to the 1:1 reference line, indicating that carbonate and sulfate mineral dissolution contributes to groundwater mineralization. However, a substantial proportion of the samples, particularly those with higher ionic concentrations, are located above the equiline, showing an excess of Ca2+ and Mg2+ relative to HCO3− and SO42−. This deviation indicates that simple carbonate and sulfate mineral dissolution is insufficient to explain the complete hydrochemical composition. The excess of Ca2+ and Mg2+ is consistent with the release of divalent cations from exchange sites during cation exchange, in which Na+ in groundwater is preferentially incorporated into the exchanger while Ca2+ and Mg2+ are released into solution. Nevertheless, the dispersion of samples around and above the equiline also indicates that cation exchange occurs together with carbonate weathering and evaporite dissolution rather than acting as an isolated process.
Figure 9.
Relationship between (Ca2+ + Mg2+) and (HCO3− + SO42−) concentrations for groundwater samples collected during (a) 2020 and (b) 2021.
The direction of cation exchange was evaluated more directly using the CAI-I and CAI-II indices (Figure 10). The distributions in both years are characterized predominantly by positive CAI-I values, with CAI-II values generally concentrated near zero and showing a mixture of positive and negative values. The occurrence of predominantly positive exchange indices indicates that cation exchange resulting in Ca2+/Mg2+ release was an important process affecting groundwater chemistry, whereas the negative values observed for a subset of samples demonstrate localized or mixed cation-exchange resulting in Na+/K+ release conditions. Consequently, the groundwater system should not be interpreted as being controlled by a single, uniform exchange mechanism. Instead, the CAI results indicate spatially variable exchange reactions associated with heterogeneous aquifer materials and differences in groundwater evolution. The predominance of positive CAI values is consistent with the Na+–Cl− plots, which show a relative deficit of Na+, and with the Ca2+ + Mg2+ excess indicated by the corresponding ionic cross-plots. At the same time, samples with negative CAI values provide evidence that cation exchange resulting in Na+/K+ release also occurs locally and may contribute to sodium enrichment in specific hydrochemical environments. Thus, the combined evidence indicates a mixed exchange system, with cation exchange resulting in Ca2+/Mg2+ release representing the dominant tendency at the regional scale during both monitoring years.
Figure 10.
Relationship between chloro-alkaline indices CAI-I and CAI-II for groundwater samples collected during (a) 2020 and (b) 2021.
3.3.4. Evaporation–Crystallization and Groundwater Evolution Along Flow Paths
The Gibbs diagrams (Figure 11) indicate that most groundwater samples fall within the rock-weathering dominance and evaporation–crystallization fields, whereas only a few samples approach the precipitation dominance field. This distribution demonstrates that precipitation contributes primarily to groundwater recharge, while subsequent hydrochemical evolution is governed mainly by mineral dissolution and evaporation under semi-arid climatic conditions. The absence of a dominant precipitation signature further indicates that rainfall chemistry exerts only a limited influence on the final groundwater composition.
Figure 11.
Gibbs diagrams showing the relationships between (a) Na+/(Na+ + Ca2+) and total dissolved solids (TDS) and (b) Cl−/(Cl− + HCO3−) and TDS for groundwater samples collected during 2020, together with (c) Na+/(Na+ + Ca2+) and TDS and (d) Cl−/(Cl− + HCO3−) and TDS for samples collected during 2021. The Gibbs fields distinguish the relative influence of precipitation, rock weathering, and evaporation–crystallization on groundwater chemistry.
The transition from carbonate-rich groundwater toward sodium–chloride facies observed in the Piper and Chadha diagrams, together with increasing total dissolved solids in the Gibbs plots, suggests progressive chemical evolution along regional groundwater flow paths. Recharge waters entering the aquifer initially acquire calcium, magnesium, and bicarbonate through carbonate weathering. As groundwater residence time increases, continued interaction with geological formations, dissolution of evaporitic minerals, ion exchange, and evaporative concentration progressively enrich groundwater in sodium, chloride, sulfate, and total dissolved solids. This evolutionary trend is particularly evident in downgradient parts of the aquifer, where groundwater flow converges toward discharge areas characterized by higher salinity.
Overall, the integrated interpretation of the Piper, Chadha, Durov, Gibbs, and Na+–Cl− diagrams demonstrates that groundwater chemistry is controlled principally by geological conditions and water–rock interaction, with carbonate and silicate weathering providing the initial dissolved constituents, followed by evaporite dissolution, cation exchange, and evaporation–crystallization during regional groundwater flow. The consistency of these hydrochemical signatures between 2020 and 2021 indicates that the governing processes remained stable throughout the study period, although localized increases in salinity suggest spatial differences in groundwater evolution and residence time.
3.4. Multivariate Statistical Analysis
3.4.1. Pearson Correlation Analysis
The Pearson correlation analysis provides an initial statistical overview of the relationships among the measured physicochemical parameters (Figure 12). In both monitoring years, EC and TDS showed strong positive relationships with the principal dissolved ions, particularly Na+, Cl−, and SO42−. This pattern indicates that variations in groundwater electrical conductivity and dissolved-solids content are primarily associated with changes in the overall ionic concentration of groundwater rather than with isolated variations in individual constituents. The persistence of these relationships during both 2020 and 2021 is consistent with the relatively stable Na–Cl hydrochemical facies and the absence of statistically significant interannual changes in the principal salinity-related parameters reported in the preceding sections. Ca2+, Mg2+, and TH also exhibited close positive associations, reflecting their common contribution to groundwater hardness. Their relationships with the major salinity variables indicate that hardness development occurs as part of the broader hydrochemical evolution of groundwater, while the previous ionic-ratio analyses suggest that mineral dissolution and cation exchange resulting in Ca2+/Mg2+ release may jointly influence the distribution of divalent cations. In contrast, HCO3− showed a comparatively distinct relationship with the major salinity parameters, which is consistent with its lower spatial variability and its role as a relatively stable component associated with carbonate weathering and groundwater buffering. The relationships involving NO3− and NO2− differ from those of the major salinity-related ions. Their relatively independent behavior suggests that nutrient concentrations are not governed by the same regional processes responsible for groundwater mineralization. Instead, this pattern supports the interpretation that localized sources, including agricultural activities, may influence these constituents. Therefore, Figure 12 indicates the coexistence of a dominant natural mineralization gradient and more localized anthropogenic influences, providing a statistical basis for the factor identification presented by PCA in the following section.
Figure 12.
Pearson correlation heatmap illustrating the relationships among the measured physicochemical parameters of groundwater samples collected during (a) 2020 and (b) 2021. Blue and red colors represent negative and positive correlations, respectively, while color intensity indicates the strength of the correlation coefficient.
3.4.2. Principal Component Analysis (PCA)
The suitability tests confirm that the hydrochemical datasets are appropriate for PCA in both monitoring years (Table 4). The KMO values of 0.764 for 2020 and 0.746 for 2021 indicate an adequate level of common variance among the variables, while the highly significant Bartlett’s test results demonstrate that the correlation matrices differ significantly from identity matrices. Based on the Kaiser criterion and the scree plots (Figure 13), three components were retained for 2020 and two components for 2021. The slightly simpler component structure in 2021 indicates that the major sources of variation were represented by fewer independent factors, rather than implying a fundamental change in the governing hydrogeochemical regime.
Table 4.
Results of the Kaiser–Meyer–Olkin (KMO) measure of sampling adequacy and Bartlett’s test of sphericity for assessing the suitability of the groundwater datasets for PCA, together with the number of components retained according to the Kaiser criterion, for the 2020 and 2021 monitoring campaigns.
Figure 13.
Scree plot showing the eigenvalues and cumulative percentage of explained variance for the extracted principal components. Components with eigenvalues greater than 1 were retained for subsequent interpretation according to the Kaiser criterion.
The rotated component matrix (Table 5) shows that RC1 was dominated in both years by high positive loadings of EC, TDS, SO42−, Cl−, Na+, Ca2+, Mg2+, and TH. This component therefore represents the principal groundwater mineralization factor. Its composition is consistent with the hydrochemical evidence indicating progressive enrichment of dissolved ions through water–rock interaction, dissolution of soluble and evaporitic minerals, cation-exchange reactions, and evaporative concentration along regional groundwater flow paths. The strong and persistent loadings of EC, TDS, Na+, Cl−, and SO42− particularly demonstrate that salinity evolution remained the dominant source of hydrochemical variability during both monitoring campaigns.
Table 5.
Rotated component matrix (Varimax rotation) showing the loading coefficients of the measured physicochemical parameters on the extracted rotated components (RCs) for groundwater samples collected during 2020 and 2021.
RC2 was characterized mainly by strong positive loadings of HCO3− and NO3− in both years. Because these parameters represent different hydrochemical origins, this component should be interpreted cautiously as a secondary axis of variation rather than as evidence of a single geochemical process. The HCO3− loading reflects the contribution of carbonate weathering and groundwater buffering, whereas the association of NO3− indicates that localized nutrient inputs also contribute to variability beyond the dominant mineralization gradient. The absence of a distinct NO2− component in 2021, compared with its strong loading on RC3 in 2020, may reflect temporal changes in the relative variability of nitrite rather than a change in the overall hydrogeochemical framework. In 2020, RC3 was primarily defined by NO2− and a negative pH loading, further emphasizing the localized and independent character of processes affecting nitrite.
The biplots of RC1 and RC2 (Figure 14) visually support these relationships by separating the dominant salinity-related variables from the secondary variation associated mainly with bicarbonate and nitrate. Overall, PCA corroborates the interpretation derived from the hydrochemical diagrams and ionic relationships: groundwater chemistry is primarily controlled by regional mineralization and hydrochemical evolution, while carbonate buffering and localized nutrient inputs account for additional, but comparatively secondary, sources of variability.
Figure 14.
Biplots of the first two rotated principal components (RC1 and RC2) for groundwater samples collected during (a) 2020 and (b) 2021. Orange symbols represent groundwater samples, and blue arrows denote the loading vectors of the physicochemical parameters. The relative orientation and magnitude of the vectors illustrate the relationships among variables and the dominant hydrogeochemical processes.
3.4.3. Hierarchical Cluster Analysis (HCA)
HCA dendrograms provide a complementary classification of the physicochemical parameters according to their similarity and confirm the multivariate structure identified by PCA (Figure 15). The relationship between the HCA clusters and the corresponding PCA components for the 2020 and 2021 monitoring campaigns is summarized in Table 6. Overall, the clustering patterns indicate that groundwater chemistry is primarily controlled by a dominant mineralization process, with additional influences related to carbonate weathering, nutrient inputs, and localized acid–base or contamination signals.
Figure 15.
Hierarchical cluster dendrograms of the measured physicochemical parameters for groundwater samples collected during (a) 2020 and (b) 2021, generated using Ward’s linkage method and Euclidean distance after z-score standardization.
Table 6.
Integration of HCA clusters, PCA components, and dominant hydrogeochemical process during 2020–2021.
Cluster I includes EC, TDS, Na+, Cl−, SO42−, TH, Ca2+, and Mg2+ and represents the principal groundwater mineralization and salinity-evolution group. The correspondence of this cluster with RC1 in both 2020 and 2021, which explained 63.1% and 63.8% of the total variance, respectively, suggests that variations in the major dissolved constituents and groundwater hardness are governed predominantly by a common regional hydrogeochemical gradient. This grouping is consistent with the strong relationships among these variables observed in the correlation analysis and supports the previous hydrochemical interpretation that progressive water–rock interaction, mineral dissolution, ion-exchange processes, and evaporative concentration contribute collectively to groundwater mineralization. The persistence of this dominant cluster during both years further indicates that the principal processes controlling salinity evolution remained stable during the study period.
Cluster II comprises HCO3− and NO3− and corresponds to RC2 in both monitoring years, accounting for 13.7% and 13.6% of the variance in 2020 and 2021, respectively. The association of these variables represents a secondary source of hydrochemical variability involving both natural and anthropogenic influences. HCO3− reflects the role of carbonate weathering and groundwater buffering, whereas NO3− may indicate localized nutrient inputs. Therefore, this cluster should not be interpreted as representing a single common geochemical process; rather, it highlights the simultaneous contribution of background carbonate-related processes and localized anthropogenic influences to groundwater-quality variability.
The remaining clusters represent comparatively localized or residual sources of variation. In 2020, NO2− formed Cluster III and was associated with RC3, which explained 9.6% of the total variance, indicating a localized anthropogenic contamination signal distinct from the dominant groundwater mineralization pattern. In contrast, pH constituted Cluster III in 2021, emphasizing the role of localized acid–base conditions. The complementary Cluster IV contained pH in 2020 and NO2− in 2021, reflecting the exchange in the relative contribution of acid–base equilibrium and residual anthropogenic signals between the two monitoring campaigns. These clusters account for only a limited portion of the overall hydrochemical variability and should therefore be considered secondary to the dominant mineralization process represented by Cluster I.
Overall, the HCA results (Figure 15), together with the integration presented in Table 6, support the PCA and correlation analyses by distinguishing a dominant regional mineralization and salinity-evolution process from secondary carbonate-related, nutrient-related, and localized residual influences. Although the relative grouping of pH and NO2− differs between 2020 and 2021, the persistence of Clusters I and II and their close correspondence with RC1 and RC2 demonstrate that the principal hydrogeochemical structure of the groundwater system remained broadly consistent between the two monitoring campaigns.
3.5. Drinking Water Quality Assessment
The WQI results indicate considerable spatial variability in groundwater quality in both years (Table 7). In 2020, about 48% of the samples were classified as excellent or good, whereas 35.7% fell within the very poor or unsuitable categories. A broadly similar pattern was observed in 2021, although the proportion of excellent and good water decreased to 42.7%, while the proportion of poor and unsuitable water decreased slightly.
Table 7.
Classification of groundwater samples based on WQI during 2020 and 2021.
The distribution of WQI values shown in Figure 16 illustrates substantial variability among groundwater samples in both monitoring years, with a pronounced right-skewed distribution and a persistent upper tail representing locations with markedly elevated WQI values. The overall distributions remained broadly comparable between 2020 and 2021, indicating that the spatial heterogeneity and the principal controls on groundwater quality were largely maintained over the study period. Nevertheless, the classification results in Table 7 indicate a modest shift toward poorer drinking-water quality in 2021. This shift suggests a modest deterioration in overall groundwater quality at the sampled wells, although the change was not uniform across the study area. The persistence of high WQI values in both years is consistent with localized groundwater mineralization associated primarily with elevated salinity-related constituents, while locally elevated nutrient concentrations may have contributed to poorer WQI values at some sites.
Figure 16.
Violin plots showing the distribution of WQI values for groundwater samples collected during the 2020 and 2021 monitoring campaigns. The violin width represents the probability density of WQI values, while the central markers indicate the mean and median values, illustrating the temporal variation in groundwater quality.
3.6. Spatial Distribution and Spatial Variability of Groundwater Quality
The spatial distribution of the investigated groundwater-quality parameters for 2020 and 2021 is presented in Figure S1. Prior to interpreting the mapped patterns, the distributional characteristics and interpolation performance of the datasets were evaluated. The Shapiro–Wilk results (Table S5) show that most variables deviated from normality, whereas HCO3− exhibited an approximately normal distribution in both years. Accordingly, optimized IDW was selected for most parameters, while Ordinary Kriging with an optimized exponential model was applied to HCO3− (Table S6). This variable-specific approach avoided the use of a single interpolation model for all hydrochemical variables. The LOOCV results (Table S7) indicate good to excellent predictive performance for pH and generally good performance for TH, HCO3−, SO42−, Cl−, NO3−, NO2−, Na+, Ca2+, Mg2+, and WQI. However, the interpolation performance of EC and TDS was classified as poor in both years. Therefore, the broad regional patterns of EC and TDS should be interpreted cautiously, and their maps should not be used to infer detailed local-scale variations. This uncertainty is particularly important given the close hydrochemical relationship between EC and TDS and the substantial spatial heterogeneity of groundwater mineralization across the study area. Nevertheless, the consistent agreement of the EC and TDS patterns with the distributions of major dissolved ions provides useful evidence for regional-scale salinity conditions.
The pH maps indicate highly stable groundwater conditions, with the entire mapped area remaining within the adopted acceptable range of 6.5–8.5 during both years. This spatial uniformity is consistent with the relatively limited variation in pH observed in the hydrochemical dataset and suggests effective buffering of groundwater by carbonate-bearing geological formations. In contrast, total hardness showed widespread elevated conditions, with the entire study area exceeding 180 mg L−1 as CaCO3 in both years. The spatial persistence of high hardness reflects the dominant influence of groundwater–rock interaction and the dissolution of carbonate- and sulfate-bearing minerals. Similarly, Ca2+ and Mg2+ concentrations were predominantly elevated, with the areas exceeding 80 and 30 mg L−1, respectively, expanding to virtually the entire mapped area in 2021. These patterns are consistent with the hydrochemical evidence for carbonate weathering and mineral dissolution and support the interpretation that hardness is primarily controlled by the geological composition of the aquifer system.
The distributions of EC and TDS indicate a highly mineralized groundwater system, with the measured values showing an overall increase in groundwater mineralization between 2020 and 2021 and a strong positive relationship between the two parameters. However, the interpolated surfaces exhibited different changes in classified areas: the proportion of the study area with EC below 1500 μS cm−1 increased from <1% in 2020 to 28% in 2021, whereas the area with TDS above 1200 mg L−1 increased from 65% to 99%. These apparently different spatial responses do not necessarily indicate a contradiction, because EC and TDS, although strongly related, are not interchangeable measures and were classified using different reference thresholds; moreover, their interpolated surfaces are affected by spatial variability and prediction uncertainty. Given the relatively poor LOOCV performance of EC and TDS, the raster-derived area percentages should therefore be regarded as exploratory spatial estimates rather than precise regional proportions or standalone evidence of temporal change. Temporal variation is consequently interpreted primarily from the paired observations at the same 171 monitoring wells, while the maps are used to illustrate broad spatial patterns of groundwater mineralization. The widespread mineralization indicated by these results is consistent with the predominance of Na–Cl facies, ionic relationships, and multivariate analyses. Sodium and chloride exhibited extensive spatial enrichment in both monitoring years. Approximately 100% and 99% of the study area exceeded 200 mg L−1 Na+ in 2020 and 2021, respectively, while chloride concentrations exceeded 250 mg L−1 over 89% of the area in 2020 and the entire mapped area in 2021. Sulfate also showed a pronounced increase, with the proportion of the area exceeding 250 mg L−1 increasing from 40% in 2020 to 94% in 2021. The spatial association of elevated Na+, Cl−, SO42−, EC, and TDS provides strong evidence for progressive groundwater mineralization through the combined influence of evaporite dissolution, water–rock interaction, cation-exchange processes, and evaporative concentration. This interpretation is consistent with the dominance of Na–Cl hydrochemical facies and the results of the Piper, Durov, Gibbs, ionic-ratio, PCA, and HCA analyses.
Bicarbonate showed a markedly more uniform spatial distribution, with the entire study area remaining within the 200–500 mg L−1 class during both years. This indicates that alkalinity was relatively stable compared with the pronounced spatial variability of the salinity-related parameters. The stable HCO3− distribution supports the PCA results, in which bicarbonate represented a hydrochemical pattern distinct from the broad major-ion mineralization gradient. Nutrient-related parameters displayed substantially more localized variability. Most of the study area was characterized by NO3− concentrations between 10 and 25 mg L−1, accounting for 96% and 90% of the area in 2020 and 2021, respectively, while no mapped area exceeded 50 mg L−1 in either year. Similarly, NO2− concentrations remained below the adopted drinking-water reference value over nearly the entire study area. These results suggest that nutrient contamination is not the dominant regional control on groundwater quality, although localized anthropogenic inputs may contribute to spatial variations in nitrogen species. This interpretation agrees with the multivariate results showing that nutrient variability is secondary to the dominant mineralization processes.
The spatial distribution of WQI demonstrates that groundwater suitability for drinking is strongly influenced by regional differences in mineralization. In 2020, only about 15.5% of the study area was classified as excellent or good, whereas about 59% was categorized as very poor or unsuitable for drinking. In 2021, the mapped WQI distribution shifted predominantly toward the poor and very poor classes, which together occupied approximately 95.5% of the study area, while about 4% was classified as unsuitable. These area-based estimates should be clearly distinguished from the WQI classification of the 171 sampled wells, which showed a more balanced distribution among quality classes (Table 7). The difference between point-based well percentages and interpolated area percentages reflects the fact that spatial interpolation weights the geographical extent of predicted water-quality conditions rather than simply counting individual monitoring wells.
Overall, the spatial patterns indicate that groundwater mineralization and hardness are the principal regional factors limiting drinking-water quality, particularly through elevated Na+, Cl−, SO42−, and dissolved solids. These processes are largely associated with the geological setting and groundwater evolution along regional flow paths, whereas nutrient-related contamination appears comparatively localized. The similarity of the dominant spatial patterns during 2020 and 2021 further supports the conclusion that the principal hydrogeochemical controls remained stable over the study period. However, because the EC and TDS interpolation models showed comparatively poor predictive performance and because observation density varies spatially, the maps should be interpreted primarily at the regional scale and with caution in sparsely sampled or peripheral areas.
3.7. Comparison with Previous Studies, Study Limitations, and Management Implications
The hydrochemical characteristics identified in the present study are generally consistent with those reported for semi-arid aquifers in Iran and other arid regions worldwide. The predominance of the Na–Cl hydrochemical facies and the integrated evidence from the Piper, Chadha, Durov, Gibbs, ionic-ratio, PCA, and HCA analyses indicate that groundwater chemistry is strongly influenced by water–rock interaction, carbonate and silicate weathering, evaporite dissolution, cation-exchange reactions, increasing residence time, and evaporation–crystallization. Similar hydrochemical controls have been reported in southern and central Iran [29,30,32], as well as in semi-arid groundwater systems in Egypt, Algeria, and Nepal [5,10,28]. More broadly, recent national-scale assessments have identified salinity and major-ion enrichment as major challenges for groundwater quality in Iran, particularly in arid and semi-arid regions where geological conditions, high evaporation, groundwater depletion, and human pressures interact [70,71].
The combined results nevertheless indicate that groundwater quality cannot be attributed exclusively to natural processes. The regional mineralization pattern is predominantly consistent with natural hydrogeochemical evolution, but localized anthropogenic influences may contribute to groundwater-quality variability. In particular, the distinct spatial and multivariate behavior of nitrate and nitrite suggests that nutrient-related variations are partly decoupled from the dominant major-ion mineralization process. Potential anthropogenic sources include agricultural fertilizer application, animal waste, leakage from septic systems or sewage networks, and, where applicable, the infiltration or use of wastewater for irrigation. Such sources have been widely identified as potential causes of localized nitrate contamination in groundwater systems in Iran and other semi-arid regions [70,72]. However, because source-specific tracers or isotopic data were not available in the present study, these potential anthropogenic contributions should be regarded as plausible influences rather than conclusively identified sources.
The comparison between the 2020 and 2021 datasets further suggests that the principal hydrogeochemical controls remained broadly stable during the study period. Although changes occurred in the spatial extent of individual concentration and WQI classes, the two monitoring campaigns alone do not provide sufficient evidence to establish a long-term trend of groundwater deterioration or improvement. Instead, these differences should be interpreted primarily as short-term spatial and temporal variability within a hydrogeochemical system characterized by persistent regional mineralization. Continued monitoring is therefore necessary to determine whether observed changes represent transient fluctuations or the beginning of longer-term changes associated with drought, climate variability, or increasing groundwater abstraction.
From a management perspective, the results indicate that groundwater protection should address both geogenic mineralization and potentially controllable anthropogenic pressures. Because elevated mineralization and hardness are widespread, particularly in relation to Na+, Cl−, SO42−, EC, and TDS, the protection of relatively low-mineralization and higher-quality groundwater zones should be prioritized for drinking-water supply. Groundwater abstraction should also be managed in accordance with aquifer recharge conditions, since excessive pumping may alter flow patterns, increase groundwater residence time, and intensify salinization through the concentration of dissolved constituents. This is particularly important in Iran, where widespread groundwater depletion and salinization have been associated with intensive exploitation of aquifer resources [70].
In parallel, localized anthropogenic risks require preventive management. Improved fertilizer management, the protection of wellhead areas, monitoring of agricultural return flows, and effective collection and treatment of domestic wastewater can reduce the risk of nitrate and other contaminants entering the aquifer. Where groundwater is affected by both agricultural and urban pressures, integrated land-use and groundwater management is preferable to evaluating hydrochemistry independently of human activities. Previous studies have similarly demonstrated that reductions in excessive fertilizer use, improvements in wastewater management, and modifications of agricultural practices can contribute to groundwater-quality protection [72].
Despite the comprehensive analytical framework adopted in this study, several limitations should be acknowledged. First, the hydrochemical assessment was based on two annual monitoring campaigns. Although the large number of wells provides a robust regional dataset and allows comparison between the two sampling periods, longer and preferably seasonal monitoring would improve the evaluation of interannual and seasonal hydrochemical variability under changing climatic and abstraction conditions. Second, the interpretation was based primarily on major physicochemical parameters. The inclusion of environmental isotopes, trace elements, dissolved organic constituents, and source-specific indicators would provide further insight into recharge mechanisms, groundwater residence time, mixing processes, and the relative contributions of natural and anthropogenic sources. In particular, nitrate isotopes could help distinguish fertilizer-, wastewater-, and soil-derived nitrogen sources where localized nitrate enrichment is suspected.
Finally, the spatial results are based on interpolation of discrete monitoring data and should therefore be interpreted as regional estimates rather than direct measurements of conditions at unsampled locations. Although the interpolation methods were evaluated through cross-validation, uncertainty remains greater in relatively sparsely sampled and peripheral areas. Future research should combine a denser monitoring network with hydrogeological information, groundwater-level observations, numerical flow and reactive-transport modeling, and appropriately validated geostatistical or machine-learning approaches. Such an integrated framework would provide a stronger basis for identifying groundwater-quality hotspots, distinguishing geogenic and anthropogenic influences, and developing targeted management strategies.
In general, the evidence from this study indicates that the regional groundwater-quality problem is primarily one of hydrogeochemical mineralization driven by geological and climatic conditions and groundwater evolution, while anthropogenic activities may impose additional localized pressures. Therefore, effective groundwater management should not rely on a single pollution-control strategy; it requires simultaneous management of groundwater abstraction, protection of recharge and high-quality groundwater zones, control of agricultural and wastewater-related contaminant inputs, and long-term hydrochemical monitoring.
4. Conclusions
This study provided an integrated assessment of groundwater hydrochemistry and drinking-water quality in a large semi-arid region of Fars Province, southern Iran, based on 171 monitoring wells sampled during the 2020 and 2021 campaigns. The combined application of hydrochemical diagrams, ionic relationships, Pearson correlation analysis, PCA, HCA, WQI, and GIS-based spatial analysis enabled the identification of the principal processes controlling groundwater chemistry and drinking-water suitability.
The hydrochemical results demonstrated the predominance of Na–Cl facies and a groundwater system characterized by substantial mineralization. The integrated interpretation of the Piper, Chadha, Durov, and Gibbs diagrams, together with ionic cross-plots, indicated that groundwater chemistry is mainly governed by carbonate and silicate weathering, evaporite dissolution, water–rock interaction, cation-exchange reactions, and evaporation–crystallization during regional groundwater circulation. The ionic-ratio and chloro-alkaline index analyses further demonstrated that cation exchange is spatially variable: cation exchange resulting in Ca2+/Mg2+ release represents the dominant regional tendency, whereas cation exchange resulting in Na+/K+ release also occurs locally and may contribute to sodium enrichment in specific hydrochemical environments.
The multivariate analyses independently supported these interpretations. PCA retained three components in 2020 and two components in 2021, with the dominant component explaining approximately 63% of the total variance in both years. This component was strongly associated with EC, TDS, SO42−, Cl−, Na+, Ca2+, Mg2+, and total hardness and represents the principal groundwater mineralization process. HCA showed a closely corresponding cluster structure, confirming that the dominant regional hydrochemical gradient is associated with salinity and major-ion enrichment. A secondary component and cluster involving HCO3− and NO3− reflected the coexistence of carbonate-related processes and localized nutrient inputs, while NO2− and pH represented more localized or residual sources of variability. Consequently, the results indicate that natural hydrogeochemical processes dominate at the regional scale, but localized anthropogenic influences cannot be excluded.
The WQI assessment revealed considerable variability in groundwater suitability for drinking. In 2020, about 48% of the sampled wells were classified as excellent or good, compared with 42.7% in 2021. Conversely, groundwater classified as unsuitable for drinking accounted for 26% and about 30% of the samples, respectively. These results demonstrate that groundwater-quality limitations are widespread and are principally associated with mineralization and major-ion enrichment rather than with widespread nutrient contamination. However, the differences between the two monitoring campaigns should be interpreted as short-term variability rather than evidence of a definitive long-term deterioration trend.
The spatial analysis further demonstrated pronounced regional heterogeneity in groundwater quality. Stable pH conditions and relatively uniform bicarbonate concentrations contrasted with widespread hardness and major-ion enrichment. In particular, the proportion of the mapped area with Na+ concentrations above 200 mg L−1 remained extremely high in both years (about 100% in 2020 and 99% in 2021), while the area with Cl− concentrations above 250 mg L−1 increased from 89% to 100%. Sulfate enrichment also became more widespread, with the area exceeding 250 mg L−1 increasing from 40% to 94%. These patterns are consistent with the dominant mineralization process identified by the hydrochemical and multivariate analyses. Nevertheless, the spatial interpretation of EC and TDS should be treated with caution because their relatively poor LOOCV performance limits the quantitative reliability of raster-derived area percentages; therefore, the maps are considered exploratory, while temporal changes are interpreted primarily from the repeated observations at the same monitoring wells.
Overall, the study shows that the principal limitation to groundwater use for drinking in the study area is regional hydrogeochemical mineralization associated with the geological and hydroclimatic setting, while agricultural activities, wastewater-related inputs, and other human pressures may contribute locally to nutrient-related variability. Effective groundwater management should therefore combine sustainable abstraction, protection of recharge and relatively high-quality groundwater zones, regular monitoring of salinity-related parameters, and control of potential agricultural and wastewater contaminant inputs. Future studies should extend monitoring over multiple seasons and years and incorporate environmental tracers, isotopic techniques, trace constituents, and groundwater-flow and reactive-transport modeling to better distinguish natural and anthropogenic controls and evaluate long-term changes in groundwater quality.
Supplementary Materials
The following supporting information can be downloaded at: https://www.mdpi.com/article/10.3390/earth7050152/s1.
Author Contributions
Conceptualization, M.B., A.B., N.R. and M.S.; methodology, M.B., A.B., N.R. and M.S.; software, M.B., A.B., N.R. and M.S.; validation, M.B., A.B., N.R. and M.S.; formal analysis, M.B., A.B., N.R., M.S. and K.K.-W.; investigation, M.B., A.B., N.R., M.S. and K.K.-W.; resources, M.B., A.B., N.R. and M.S.; data curation, M.B., A.B., N.R. and M.S.; writing—original draft preparation, M.B., A.B., N.R., M.S. and K.K.-W.; writing—review and editing, M.B. and K.K.-W.; visualization, M.B., A.B., N.R., M.S. and K.K.-W.; supervision, M.B., A.B., N.R., M.S. and K.K.-W.; project administration, K.K.-W.; funding acquisition, K.K.-W. All authors have read and agreed to the published version of the manuscript.
Funding
This research received no external funding.
Data Availability Statement
The data was included in the Supplementary Materials.
Conflicts of Interest
The authors declare no conflicts of interest.
References
- Abdelhafiz, M.A.; Seleem, E.-M.M.; El Nazer, H.A.; Zeid, S.A.; Salman, S.A.; Meng, B. Shallow groundwater environmental investigation at northeastern Cairo, Egypt: Quality and photo-treatment evaluation. Environ. Geochem. Health 2021, 43, 4533–4551. [Google Scholar] [CrossRef] [Scilit] [PubMed]
- Goswami, R.; Neog, N.; Thakur, R. Hydrogeochemical assessment of groundwater quality for drinking and irrigation in Biswanath and Sonitpur district of the Central Brahmaputra Plain, India. Front. Water 2022, 4, 889128. [Google Scholar] [CrossRef] [Scilit]
- Giao, N.T.; Nhien, H.T.H.; Anh, P.K.; Thuptimdang, P. Groundwater quality assessment for drinking purposes: A case study in the Mekong Delta, Vietnam. Sci. Rep. 2023, 13, 4380. [Google Scholar] [CrossRef] [Scilit] [PubMed]
- Faraji, H.; Shahryari, A. Assessment of groundwater quality for drinking, irrigation, and industrial purposes using water quality indices and GIS technique in Gorgan aquifer. Desalin. Water Treat. 2024, 320, 100821. [Google Scholar] [CrossRef] [Scilit]
- Derdour, A.; Guerine, L.; Allali, M. Assessment of drinking and irrigation water quality using WQI and SAR method in Maâder sub-basin, Ksour Mountains, Algeria. Sustain. Water Resour. Manag. 2021, 7, 8. [Google Scholar] [CrossRef] [Scilit]
- Kubiak-Wójcicka, K.; Jamorska, I.; Górski, Ł. The Identification of Risks for Drinking Water Intakes in Urbanized Area: The Case Study of Toruń (Central Poland). Water 2021, 13, 3378. [Google Scholar] [CrossRef] [Scilit]
- Bahrami, M.; Zarei, A.R. Assessment and modeling of groundwater quality for drinking, irrigation, and industrial purposes using water quality indices and GIS technique in fasarud aquifer (Iran). Model. Earth Syst. Environ. 2023, 9, 3907–3921. [Google Scholar] [CrossRef] [Scilit]
- Mebarki, S.; Kendouci, M.A.; Bendida, A. Monitoring the spatial evolution of groundwater quality during its diversion in the drinking water supply network in arid areas, case of Bechar city (Algeria Sahara). Appl. Water Sci. 2024, 14, 118. [Google Scholar] [CrossRef] [Scilit]
- Abadi, H.T.; Alemayehu, T.; Berhe, B.A. Hydrogeochemical characterization of groundwater in mountainous catchment and its suitability for drinking purposes in Irob, Tigray, Northern Ethiopia. Water Pract. Technol. 2024, 19, 1495–1512. [Google Scholar] [CrossRef] [Scilit]
- Ghimire, M.; Byanjankar, N.; Regmi, T.; Jha, R.; Joshi, D.R.; Joshi, T.P. Hydrogeochemical characterization of shallow and deep groundwater for drinking and irrigation water quality index of Kathmandu Valley, Nepal. Environ. Geochem. Health 2025, 47, 61. [Google Scholar] [CrossRef] [Scilit] [PubMed]
- Bahrami, M.; Khaksar, E.; Khaksar, E. Spatial variation assessment of groundwater quality using multivariate statistical analysis (Case Study: Fasa Plain, Iran). J. Groundw. Sci. Eng. 2020, 8, 230–243. [Google Scholar]
- Bahrami, M.; Esslamzadeh, M.J.; Zarei, A.R. Assessment of groundwater vulnerability using GIS-based modified DRASTIC models, case study: Fasarood plain, South Iran. J. Environ. Assess. Policy Manag. 2022, 24, 2250029. [Google Scholar] [CrossRef] [Scilit]
- Noori, R.; Maghrebi, M.; Jessen, S.; Bateni, S.; Heggy, S.M.; Javadi, E.; Noury, S.; Pistre, M.; Abolfathi, S.; AghaKouchak, S. Decline in Iran’s groundwater recharge. Nat. Commun. 2023, 14, 6674. [Google Scholar] [CrossRef] [Scilit] [PubMed]
- Eid, M.H.; Elbagory, M.; Tamma, A.A.; Gad, M.; Elsayed, S.; Hussein, H.; Moghanm, F.S.; Omara, A.E.D.; Kovács, A.; Péter, S. Evaluation of groundwater quality for irrigation in deep aquifers using multiple graphical and indexing approaches supported with machine learning models and GIS techniques, Souf Valley, Algeria. Water 2023, 15, 182. [Google Scholar] [CrossRef] [Scilit]
- Esmaeili, A.; Moore, F.; Keshavarzi, B. Nitrate contamination in irrigation groundwater, Isfahan, Iran. Environ. Earth Sci. 2014, 72, 2511–2522. [Google Scholar] [CrossRef] [Scilit]
- Nabavi, E. Failed policies, falling aquifers: Unpacking groundwater overabstraction in Iran. Water Altern. 2018, 11, 699. [Google Scholar]
- Subba Rao, N. Groundwater quality from a part of Prakasam District, Andhra Pradesh, India. Appl. Water Sci. 2018, 8, 30. [Google Scholar] [CrossRef] [Scilit]
- Sreedevi, P.; Sreekanth, P.; Ahmed, S.; Reddy, D. Evaluation of groundwater quality for irrigation in a semi-arid region of South India. Sustain. Water Resour. Manag. 2019, 5, 1043–1056. [Google Scholar] [CrossRef] [Scilit]
- Ehteram, M.; Soltani-Gerdefaramarzi, S. Advanced hybrid frameworks for water quality index prediction. Ain Shams Eng. J. 2025, 16, 103478. [Google Scholar] [CrossRef] [Scilit]
- Ramakrishnaiah, C.; Sadashivaiah, C.; Ranganna, G. Assessment of water quality index for the groundwater in Tumkur Taluk, Karnataka State, India. J. Chem. 2009, 6, 523–530. [Google Scholar] [CrossRef] [Scilit]
- Kachroud, M.; Trolard, F.; Kefi, M.; Jebari, S.; Bourrié, G. Water quality indices: Challenges and application limits in the literature. Water 2019, 11, 361. [Google Scholar] [CrossRef] [Scilit]
- Qasemi, M.; Darvishian, M.; Nadimi, H.; Gholamzadeh, M.; Afsharnia, M.; Farhang, M.; Allahdadi, M.; Darvishian, M.; Zarei, A. Characteristics, water quality index and human health risk from nitrate and fluoride in Kakhk city and its rural areas, Iran. J. Food Compos. Anal. 2023, 115, 104870. [Google Scholar] [CrossRef] [Scilit]
- Agidi, B.M.; Akakuru, O.C.; Aigbadon, G.O.; Schoeneich, K.; Isreal, H.; Ofoh, I.; Njoku, J.; Esomonu, I. Water quality index, hydrogeochemical facies and pollution index of groundwater around Middle Benue Trough, Nigeria. Int. J. Energy Water Resour. 2024, 8, 35–54, Correction in Int. J. Energy Water Resour. 2024, 8, 449. https://doi.org/10.1007/s42108-022-00190-4. [Google Scholar] [CrossRef] [Scilit]
- Nadjai, S.; Khammar, H.; Nabed, A.N.; Benaabidate, L. Assessment of aquifers contamination risk by TCR method: Case of the Middle Cheliff Alluvial Plain, Algeria. Desalin. Water Treat. 2024, 320, 100794. [Google Scholar] [CrossRef] [Scilit]
- Alobaidy, A.H.M.J.; Abid, H.S.; Maulood, B.K. Application of water quality index for assessment of Dokan lake ecosystem, Kurdistan region, Iraq. J. Water Resour. Prot. 2010, 2, 792–798. [Google Scholar]
- Kareem, S.A.; Jaber, W.S.; Al-Maliki, L.A.; Rasha, A.; Al-husseiny, R.A.; Al-Mamoori, S.K.; Alansari, N. Water quality assessment and phosphorus effect using water quality indices: Euphrates River- Iraq as a case study. Groundw. Sustain. Dev. 2021, 14, 100630. [Google Scholar] [CrossRef] [Scilit]
- Abanyie, S.K.; Sunkari, E.D.; Apea, O.B.; Abagale, S.; Korboe, H.M. Assessment of the quality of water resources in the Upper East Region, Ghana: A review. Sustain. Water Resour. Manag. 2020, 6, 52. [Google Scholar] [CrossRef] [Scilit]
- Gabr, M.E.; Soussa, H.; Fattouh, E. Groundwater quality evaluation for drinking and irrigation uses in Dayrout city Upper Egypt. Ain Shams Eng. J. 2021, 12, 327–340. [Google Scholar] [CrossRef] [Scilit]
- Khosravi, R.; Eslami, H.; Almodaresi, S.A.; Heidari, M.; Fallahzadeh, R.A.; Taghavi, M.; Khodadadi, M.; Peirovi, R. Use of geographic information system and water quality index to assess groundwater quality for drinking purpose in Birjand City, Iran. Desalin. Water Treat. 2017, 67, 74–83. [Google Scholar] [CrossRef] [Scilit]
- Abbasnia, A.; Yousefi, N.; Mahvi, A.H.; Nabizadeh, R.; Radfard, M.; Yousefi, M.; Alimohammadi, M. Evaluation of groundwater quality using water quality index and its suitability for assessing water for drinking and irrigation purposes: Case study of Sistan and Baluchistan province (Iran). Hum. Ecol. Risk Assess. Int. J. 2019, 25, 988–1005. [Google Scholar] [CrossRef] [Scilit]
- Gharahi, N.; Zamani-Ahmadmahmoodi, R. Evaluation of groundwater quality for drinking purposes: A case study from the Beheshtabad Basin, Chaharmahal and Bakhtiari Province, Iran. Environ. Earth Sci. 2020, 79, 82. [Google Scholar] [CrossRef] [Scilit]
- Bahrami, M.; Zarei, A.R.; Rostami, F. Temporal and spatial assessment of groundwater contamination with nitrate by nitrate pollution index (NPI) and GIS (case study: Fasarud Plain, southern Iran). Environ. Geochem. Health 2020, 42, 3119–3130. [Google Scholar] [CrossRef] [Scilit] [PubMed]
- Blanc, E.; Allen, M.B.; Inger, S.; Hassani, H. Structural styles in the Zagros Simple Folded Zone, Iran. J. Geol. Soc. 2003, 160, 401–412. [Google Scholar] [CrossRef] [Scilit]
- Honarbakhsh, A.; Tahmoures, M.; Tashayo, B.; Mousazadeh, M.; Ingram, B.; Ostovari, Y. GIS-based assessment of groundwater quality for drinking purpose in northern part of Fars province. Marvdasht. J. Water Supply Res. Technol. Aqua 2019, 68, 187–196. [Google Scholar] [CrossRef] [Scilit]
- Bagheri, R.; Bagheri, F.; Eggenkamp, H. Origin of groundwater salinity in the Fasa Plain, southern Iran, hydrogeochemical and isotopic approaches. Environ. Earth Sci. 2017, 76, 662. [Google Scholar] [CrossRef] [Scilit]
- Ostad, H.; Mohammadi, Z.; Raeisi, E.; Azimi, M.H.; Liso, I.S.; Parise, M. An integrated approach for characterization of a fractured-rock carbonate aquifer in the Zagros Region of Iran. J. Hydrol. 2024, 640, 131681. [Google Scholar] [CrossRef] [Scilit]
- Aghdam, J.A.; Raeisi, E.; Zare, M.; Forti, P.; Capaccioni, B. Hydrogeology of non-salt Gachsaran formation in iran: An example from the Zagros range–tang Sorkh valley. Carbonates Evaporites 2013, 28, 309–319. [Google Scholar] [CrossRef] [Scilit]
- Ansarifar, M.M.; Salarijazi, M.; Ghorbani, K.; Kaboli, A.R. Simulation of groundwater level in a coastal aquifer. Mar. Georesources Geotechnol. 2020, 38, 257–265. [Google Scholar] [CrossRef] [Scilit]
- Sadeghinia, A.; Nazaripour, H.; Rafati, S. Changes in precipitation characteristics in Iran. Bull. Geogr. Phys. Geogr. Ser. 2023, 25, 23–38. [Google Scholar] [CrossRef] [Scilit]
- Hojjati, M.H.; Boustani, F. An assessment of groundwater crisis in Iran, case study: Fars province. World Acad. Sci. Eng. Technol. 2010, 70, 476–480. [Google Scholar]
- Golian, M.; Saffarzadeh, A.; Katibeh, H.; Mahdad, M.; Saadat, H.; Khazaei, M.; Sametzadeh, E.; Ahmadi, A.; Sharifi Teshnizi, E.; Samadi Darafshani, M.; et al. Consequences of groundwater overexploitation on land subsidence in Fars Province of Iran and its mitigation management programme. Water Environ. J. 2021, 35, 975–985. [Google Scholar] [CrossRef] [Scilit]
- Raziei, T. Climate of Iran according to Koppen-Geiger, Feddema, and UNEP climate classifications. Theor. Appl. Climatol. 2022, 148, 1395–1416. [Google Scholar] [CrossRef] [Scilit]
- Raziei, T. Koppen-Geiger climate classification of Iran and investigation of its changes during 20th century. J. Earth Space Phys. 2017, 43, 13. [Google Scholar]
- Sarkar, L. Groundwater Contamination in Perspective of Different Elements, Water Quality Index and Health Implications. Curr. World Environ. 2024, 19, 93. [Google Scholar] [CrossRef] [Scilit]
- APHA. Standard Methods of Water and Wastewater, 23rd ed.; American Public Health Association: Washington, DC, USA, 2017; p. 1545. ISBN 0875530478. [Google Scholar]
- Mohammed, A.M.; Refaee, A.; El-Din, G.K.; Harb, S. Hydrochemical characteristics and quality assessment of shallow groundwater under intensive agriculture practices in arid region, Qena, Egypt. Appl. Water Sci. 2022, 12, 92. [Google Scholar] [CrossRef] [Scilit]
- Reza, S.K.; Haldar, A.; Khan, S.K.; Rahman, F.H. Validation of water quality parameters using ion balancing and electrochemical approaches: A case study. Int. J. Environ. Anal. Chem. 2024, 105, 6681–6700. [Google Scholar] [CrossRef] [Scilit]
- Appelo, C.A.J.; Postma, D. Geochemistry, Groundwater and Pollution; CRC Press: Boca Raton, FL, USA, 2004. [Google Scholar]
- Cherry, J.A.; Freeze, R.A. Groundwater; Prentice-Hall: Englewood Cliffs, NJ, USA, 1979; Volume 370. [Google Scholar]
- Hem, J.D. Study and Interpretation of the Chemical Characteristics of Natural Water; Department of the Interior, U.S. Geological Survey: Reston, VA, USA, 1985; Volume 2254.
- Helsel, D.R.; Hirsch, R.M.; Ryberg, K.R.; Archfield, S.A.; Gilroy, E.J. Techniques and Methods, Book 4, Chapter A3. In Statistical Methods in Water Resources; U.S. Geological Survey: Reston, VA, USA, 2020. [Google Scholar] [CrossRef] [Scilit]
- Reimann, C.; Filzmoser, P.; Garrett, R.; Dutter, R. Statistical Data Analysis Explained: Applied Environmental Statistics with R.; John Wiley & Sons: Hoboken, NJ, USA, 2011. [Google Scholar]
- Piper, A.M. A graphic procedure in the geochemical interpretation of water-analyses. Eos Trans. Am. Geophys. Union 1944, 25, 914–928. [Google Scholar] [CrossRef] [Scilit]
- Gibbs, R.J. Mechanisms controlling world water chemistry. Science 1970, 170, 1088–1090. [Google Scholar] [CrossRef] [Scilit] [PubMed]
- Chadha, D.K. A proposed new diagram for geochemical classification of natural waters and interpretation of chemical data. Hydrogeol. J. 1999, 7, 431–439. [Google Scholar] [CrossRef] [Scilit]
- Durov, S.A. Natural waters and graphic representation of their composition. Dokl. Akad. Nauk SSSR 1948, 59, 87–90. [Google Scholar]
- Hounslow, A.W. Water Quality Data: Analysis and Interpretation; CRC Press: Boca Raton, FL, USA, 1995; pp. 47–126. [Google Scholar]
- Schoeller, M. The chlorine content of the water in the sandy aquifer of the Landes of the Eyre Basin. Hydrol. Sci. J. 1965, 10, 5–10. [Google Scholar]
- Mussa, K.R.; Mjemah, I.C. Using hydrogeochemical facies and signatures for groundwater characterization and evolution assessment in aquifers with contrasting climate and geology in Tanzania. Appl. Water Sci. 2023, 13, 201. [Google Scholar] [CrossRef] [Scilit]
- Brown, R.M.; McClelland, N.I.; Deininger, R.A.; Tozer, R.G. A water quality index-do we dare. Water Sew. Work. 1970, 117, 339–343. [Google Scholar]
- Mammeri, A.; Tiri, A.; Belkhiri, L.; Salhi, H.; Brella, D.; Lakouas, E.; Tahraoui, H.; Amrane, A.; Mouni, L. Assessment of surface water quality using water quality index and discriminant analysis method. Water 2023, 15, 680. [Google Scholar] [CrossRef] [Scilit]
- Saikrishna, K.; Purushotham, D.; Sunitha, V.; Reddy, Y.S.; Linga, D.; Kumar, B.K. Data for the evaluation of groundwater quality using water quality index and regression analysis in parts of Nalgonda district, Telangana, Southern India. Data Brief. 2020, 32, 106235. [Google Scholar] [CrossRef] [Scilit] [PubMed]
- Sahab, M.F.; Mohammed, A.K.; Fayyadh, A.H.; Makhlif, K.A.; Abdulazez, A.A. Adoption of water quality index and multivariate statistical analyses to appraise the groundwater for drinkable purposes. Int. J. Environ. Impacts 2025, 8, 543–552. [Google Scholar] [CrossRef] [Scilit]
- Nabizadeh, R.; Valadi Amin, M.; Alimohammadi, M.; Naddafi, K.; Mahvi, A.H.; Yousefzadeh, S. Development of innovative computer software to facilitate the setup and computation of water quality index. J. Environ. Health Sci. Eng. 2013, 11, 1. [Google Scholar] [CrossRef] [Scilit] [PubMed]
- Nadjet, Z.; Abdelmonem, M.; Badra, A.; Lakhder, S.; Issam, Z.; Abderrahmane, K.; Nabil, M.; Salim, K.; Boualem, R. Multivariate Analysis of Groundwater Quality Using PCA and HAC: Geochemical Controls on Mineralization, Nitrification, and Pollutant Dynamics in Southeastern Arid Region of Algeria. Desalin. Water Treat. 2025, 324, 101463. [Google Scholar] [CrossRef] [Scilit]
- Ahmed, A.; Maruod, W. Comparative analysis of varimax and Promax rotation methods in exploratory factor analysis. Edelweiss Appl. Sci. Technol. 2025, 9, 501–513. [Google Scholar] [CrossRef] [Scilit]
- Ward, J.H., Jr. Hierarchical grouping to optimize an objective function. J. Am. Stat. Assoc. 1963, 58, 236–244. [Google Scholar] [CrossRef] [Scilit]
- Li, J.; Heap, A.D. A review of comparative studies of spatial interpolation methods in environmental sciences: Performance and impact factors. Ecol. Inform. 2011, 6, 228–241. [Google Scholar] [CrossRef] [Scilit]
- Bahrami, M.; Zarei, A.R.; Ahmadi, A.R. Linking groundwater quality and soil salinity for irrigation suitability evaluation in a semi-arid basin of Iran. Environ. Geochem. Health 2026, 48, 553. [Google Scholar] [CrossRef] [Scilit] [PubMed]
- Maghrebi, M.; Noori, R.; Partani, S.; Araghi, A.; Barati, R.; Farnoush, H.; Torabi Haghighi, A. Iran’s groundwater hydrochemistry. Earth Space Sci. 2021, 8, e2021EA001793. [Google Scholar] [CrossRef] [Scilit]
- Jalali, M.; Jalali, M. A meta-analysis of geochemical characteristics of groundwater quality in Iran. Phys. Chem. Earth Parts A/B/C 2024, 135, 103674. [Google Scholar] [CrossRef] [Scilit]
- Mora, A.; Torres-Martínez, J.A.; Capparelli, M.V.; Zabala, A.; Mahlknecht, J. Effects of wastewater irrigation on groundwater quality: An overview. Curr. Opin. Environ. Sci. Health 2022, 25, 100322. [Google Scholar] [CrossRef] [Scilit]
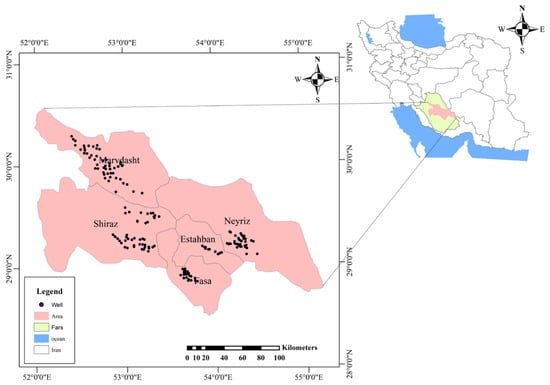
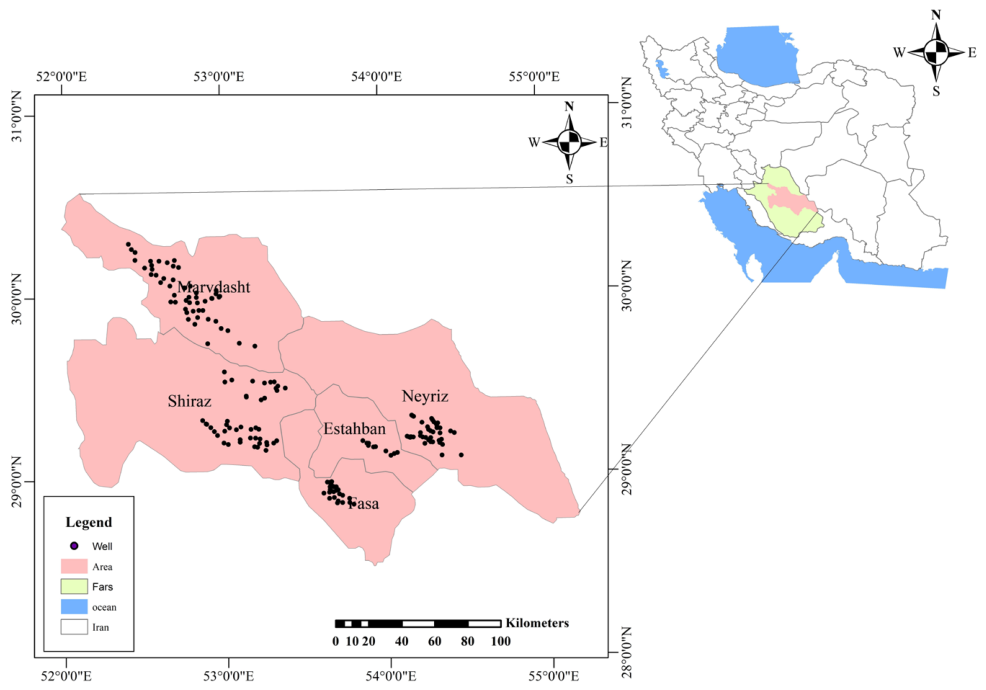
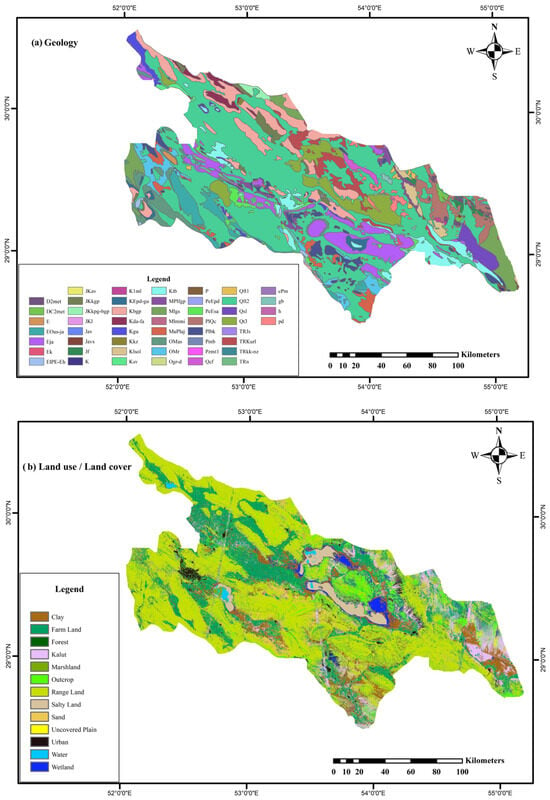
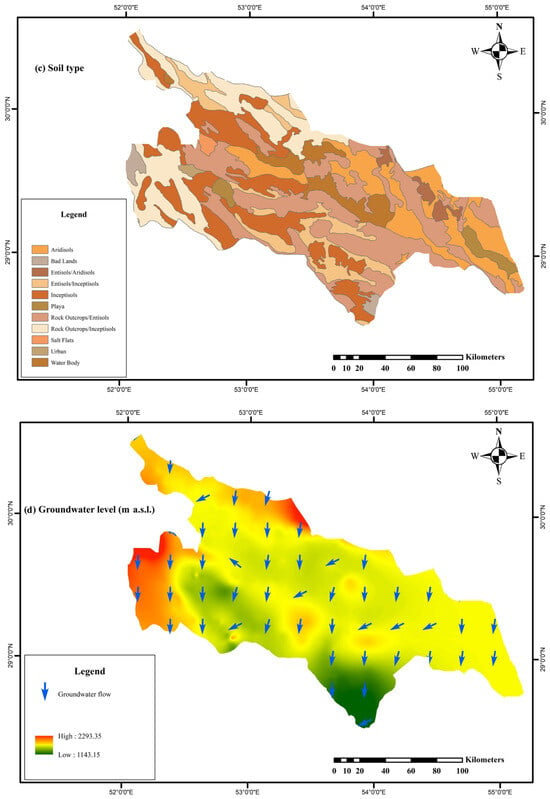
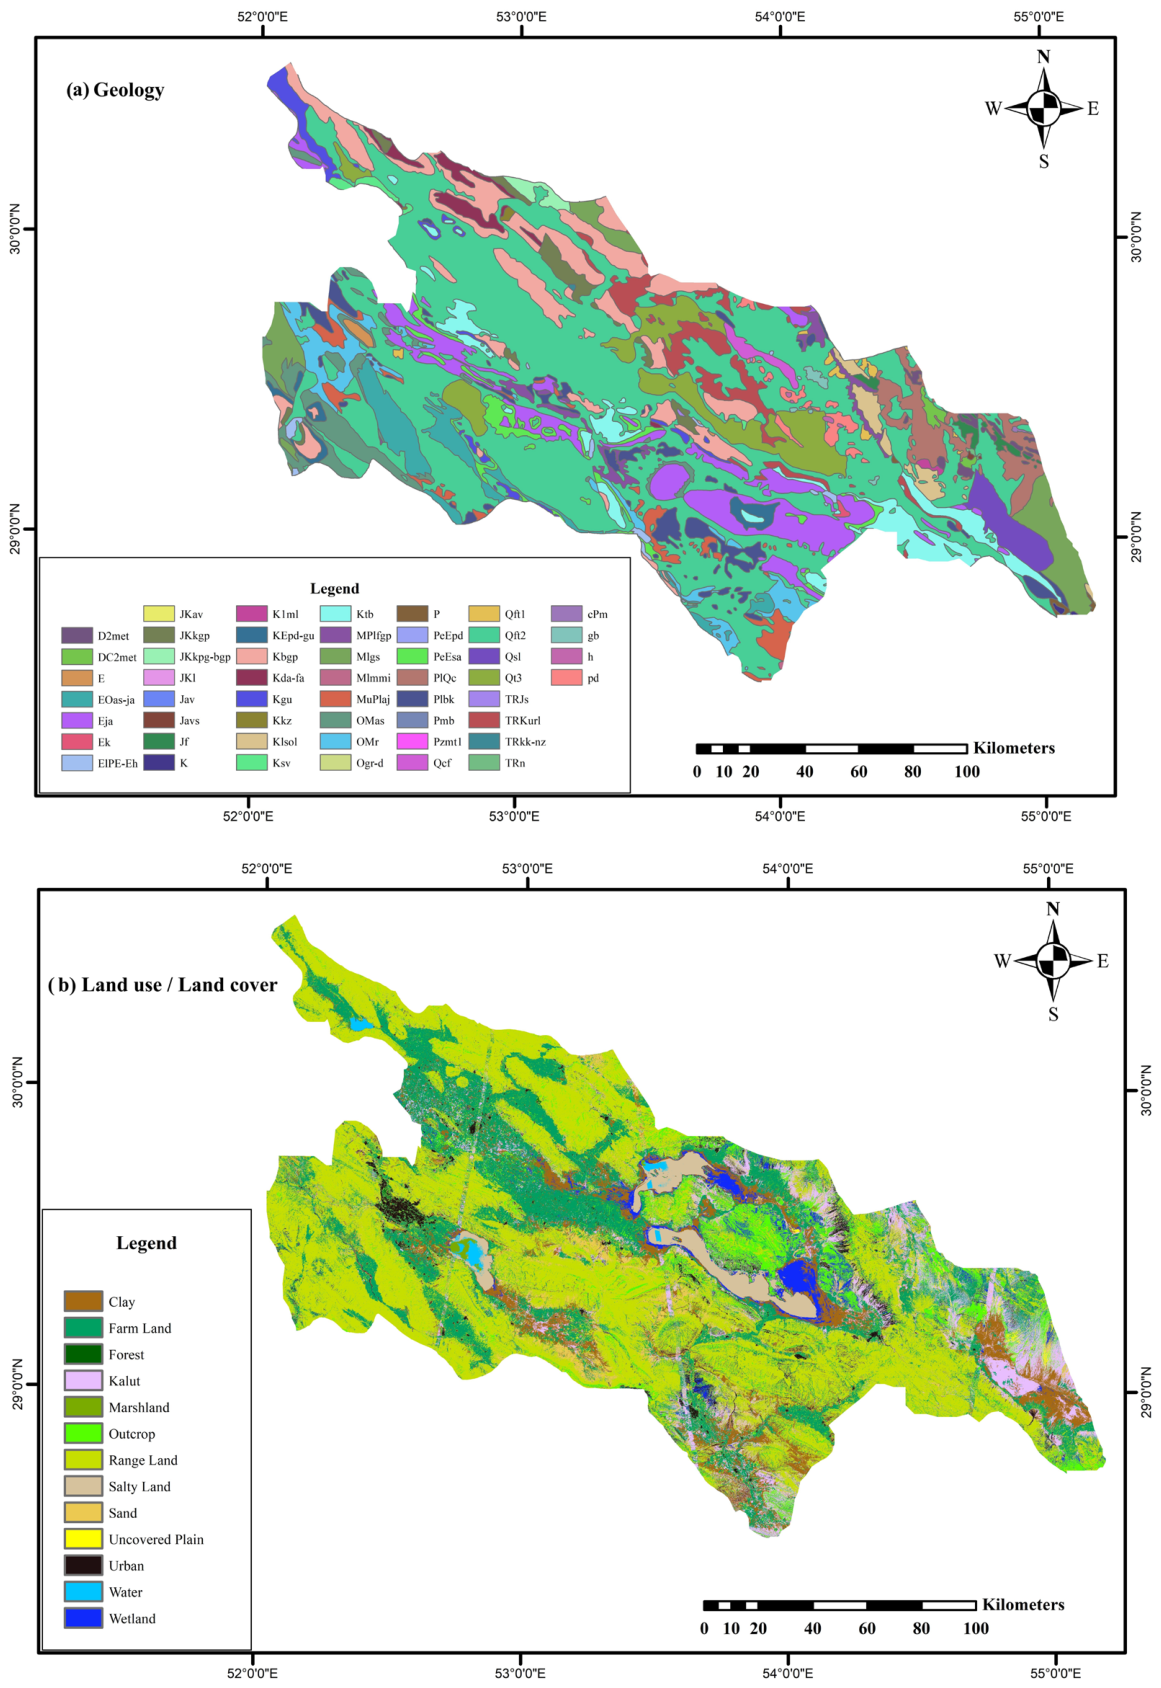
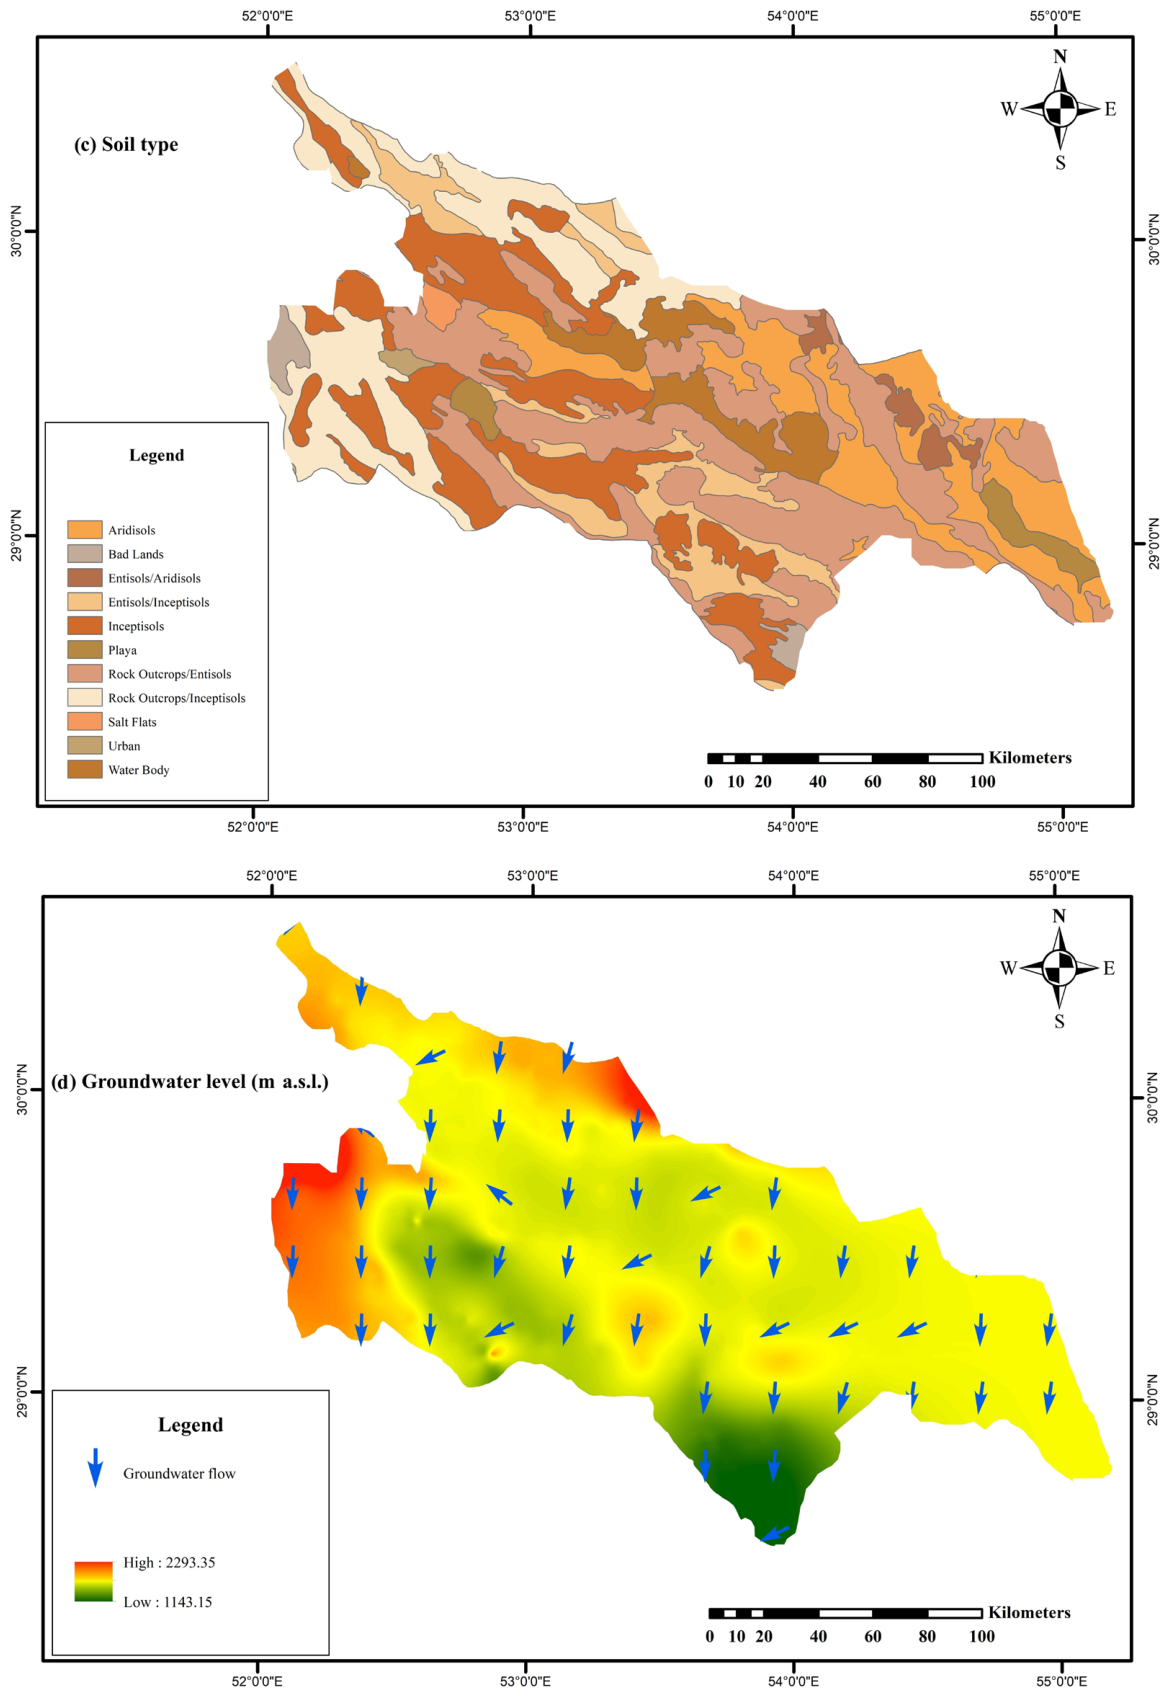
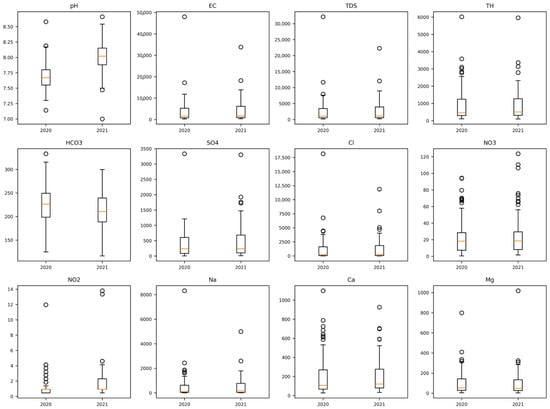
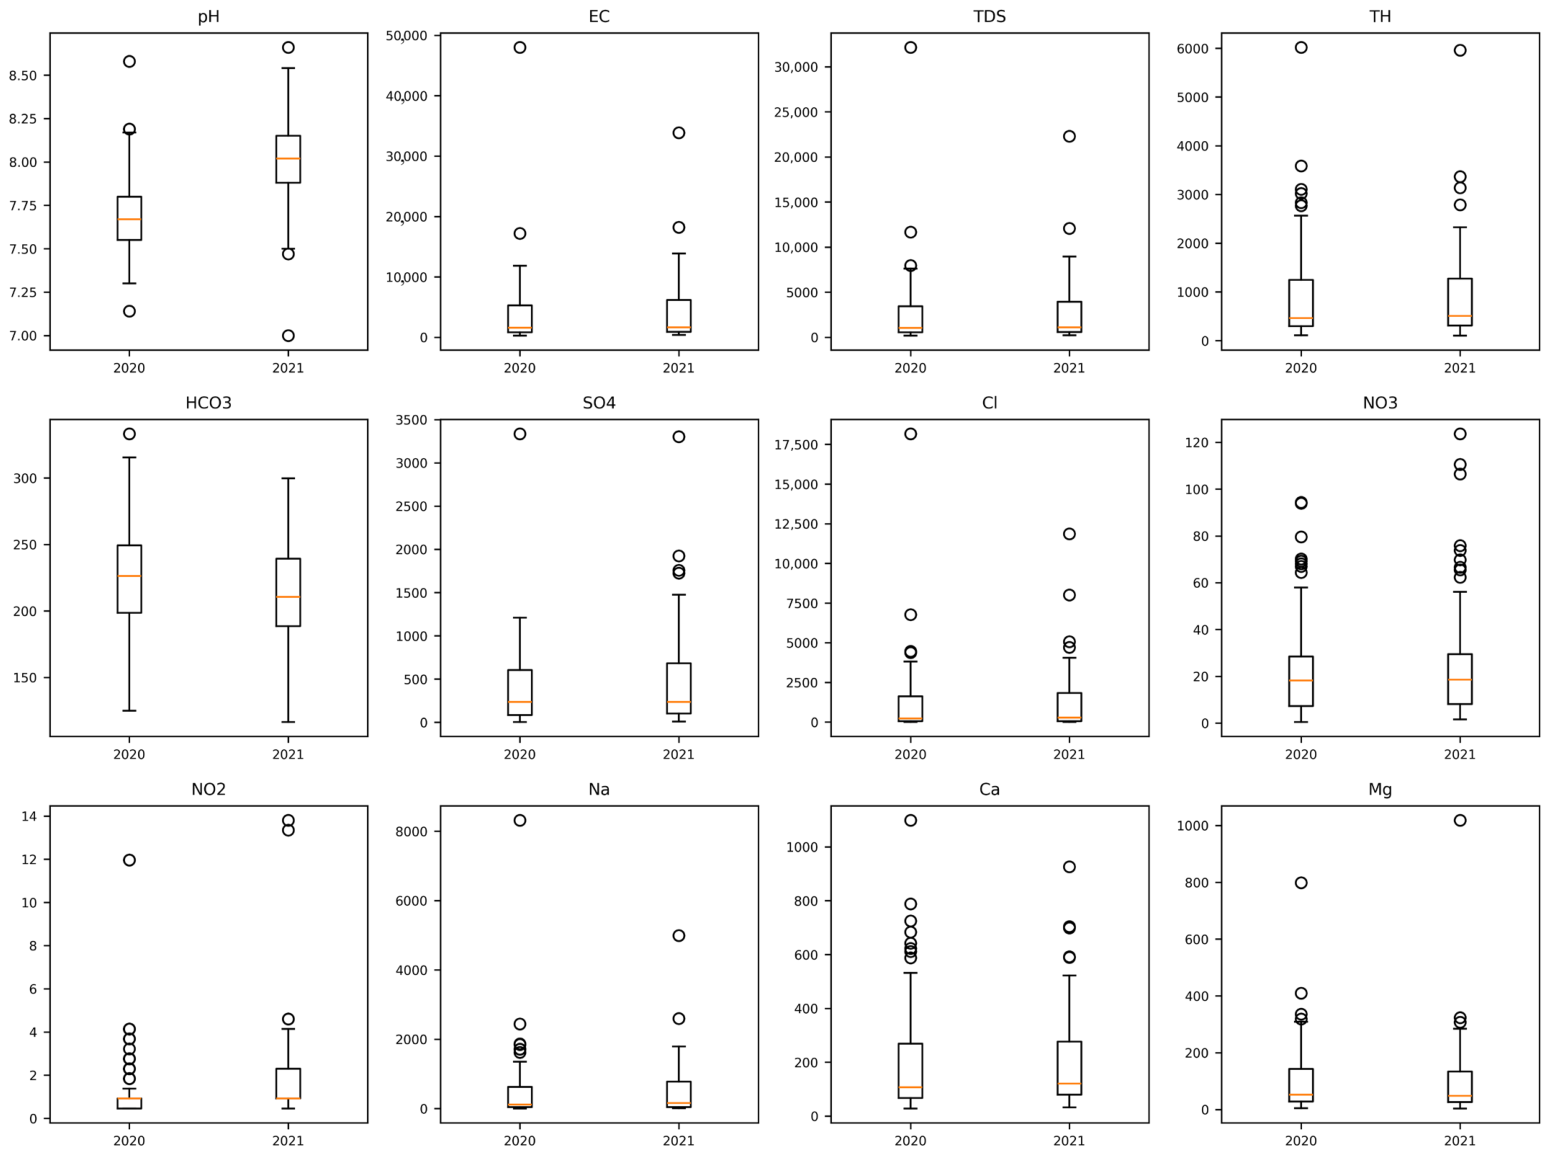
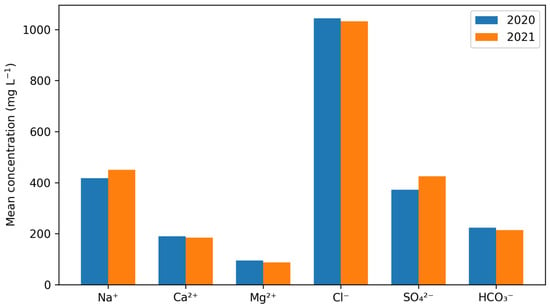
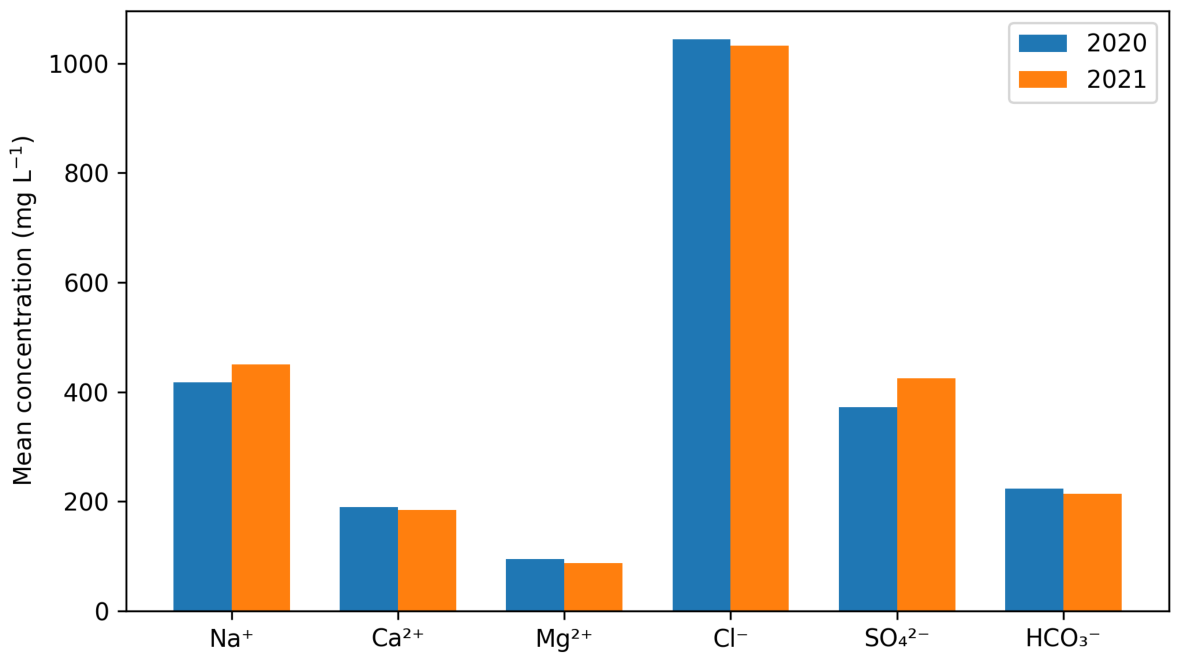
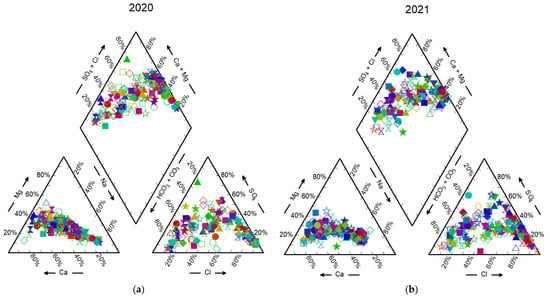
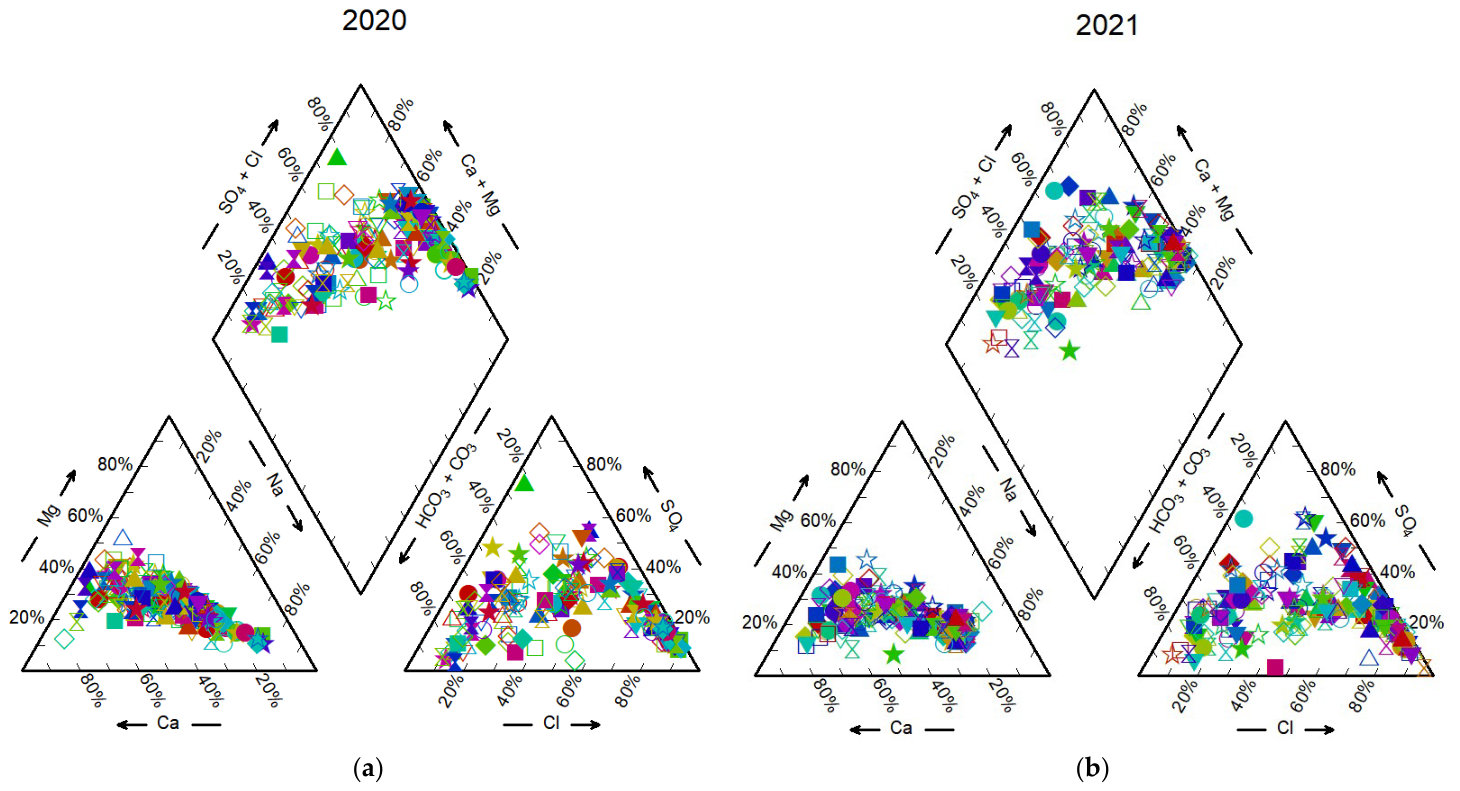
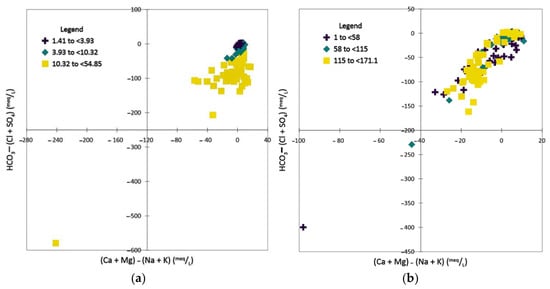
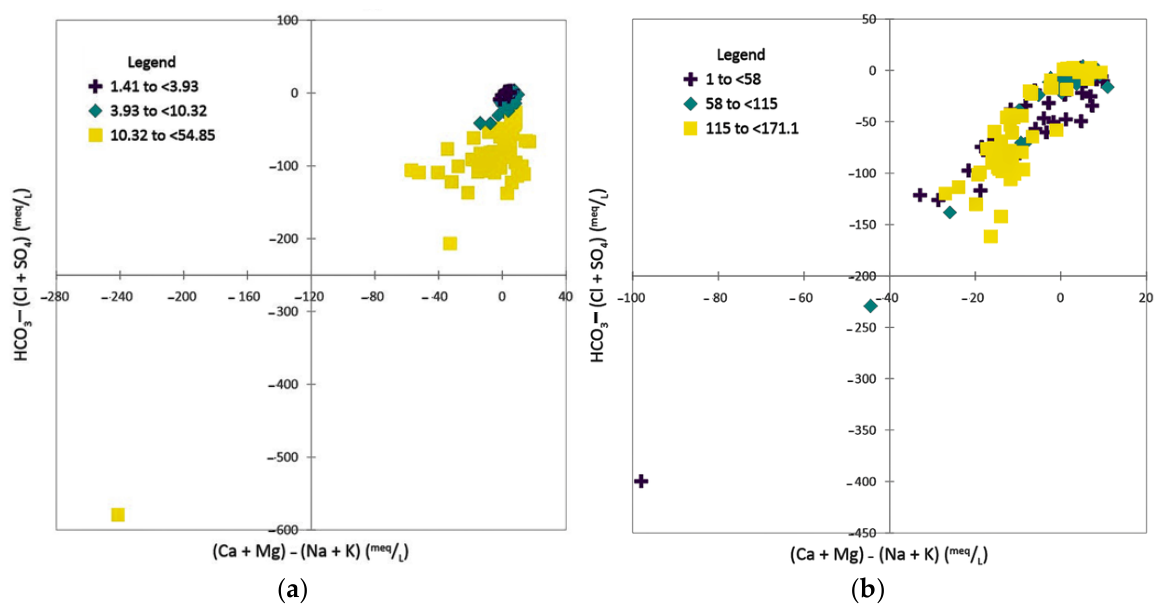
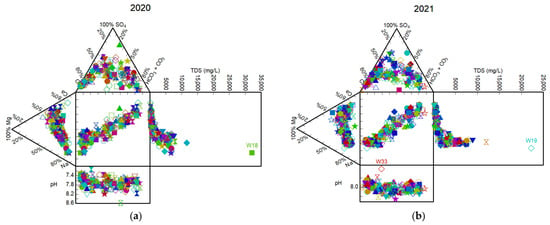
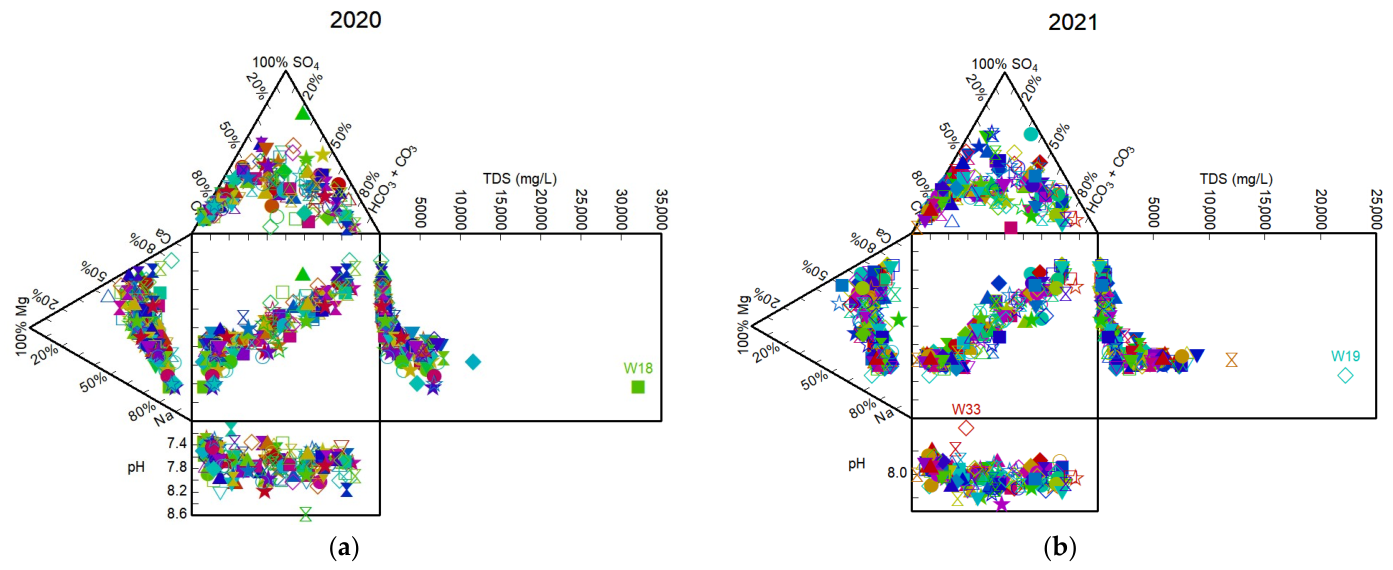
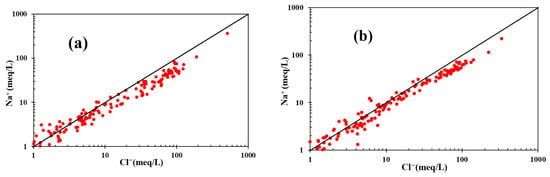
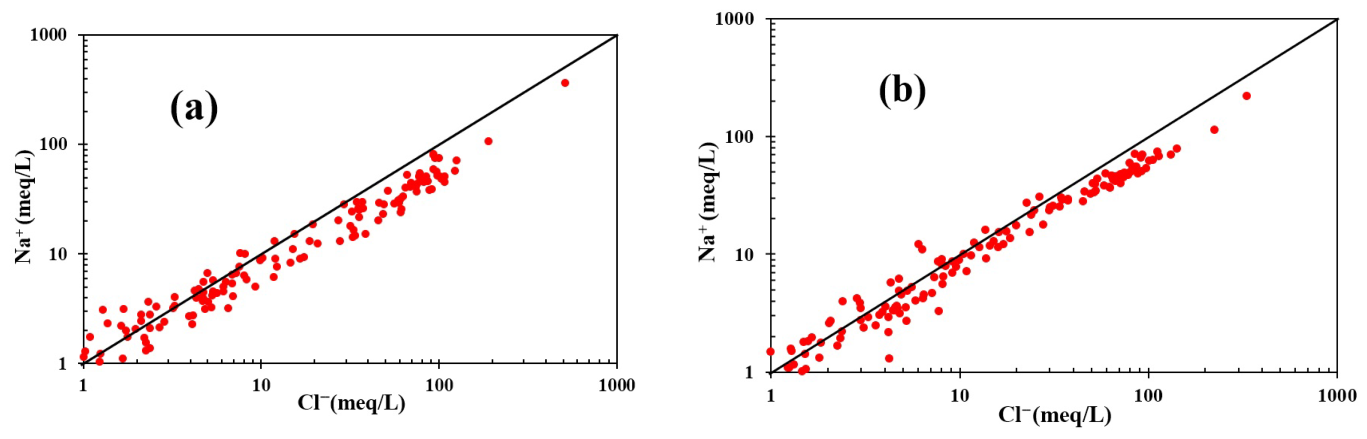
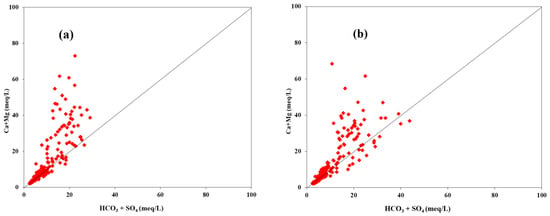
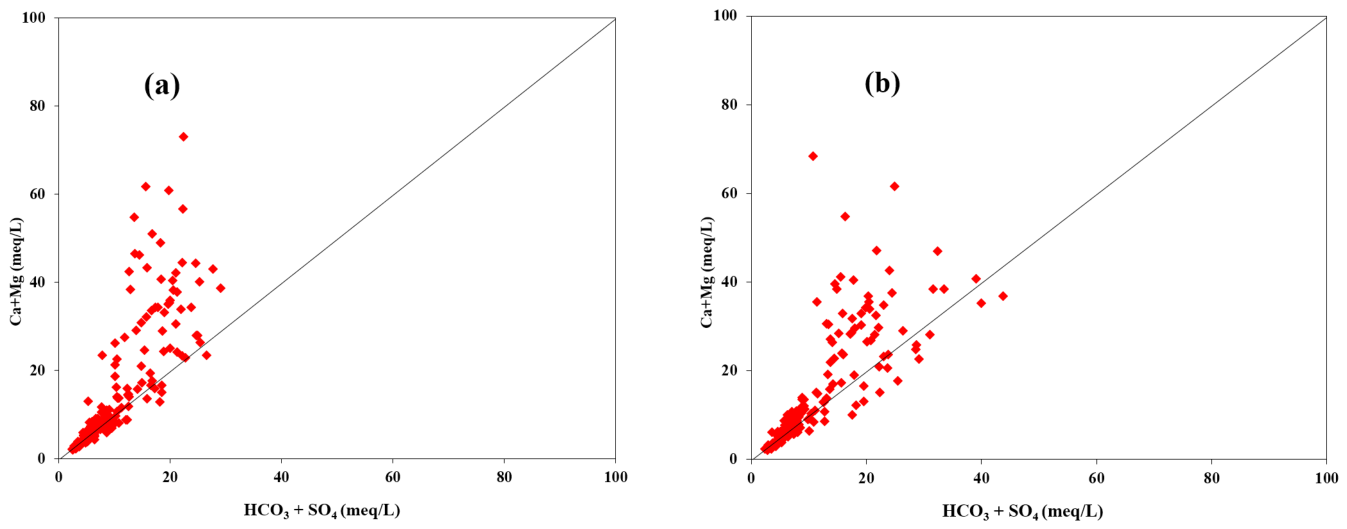
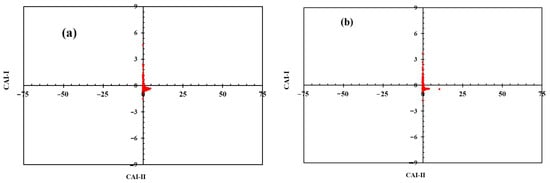
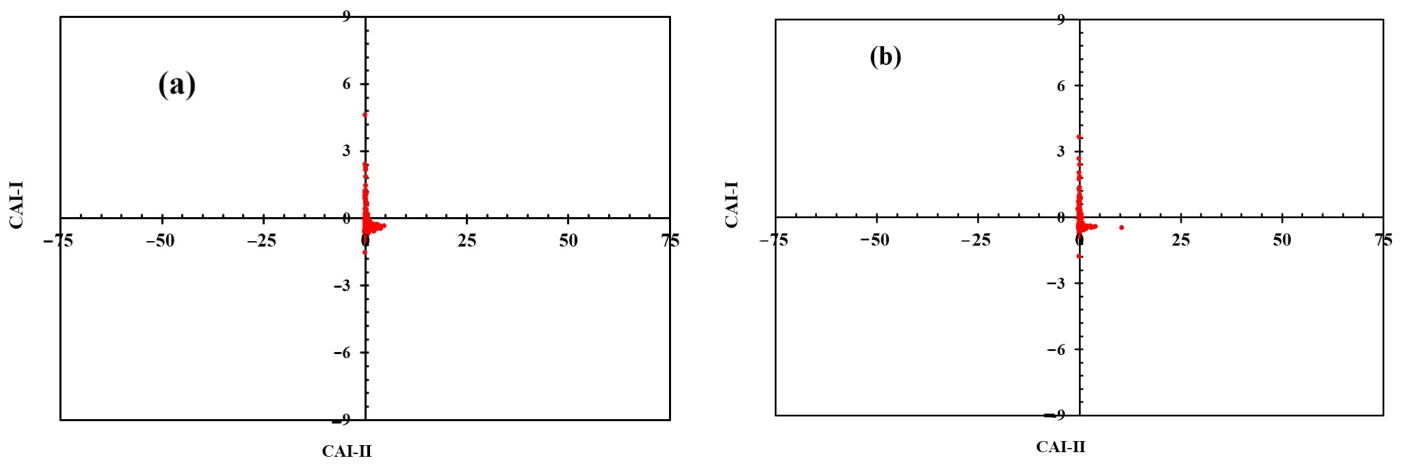
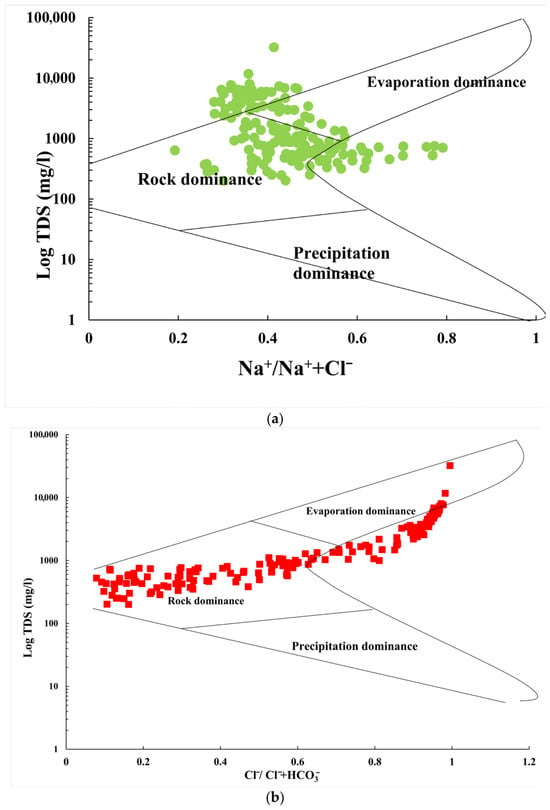
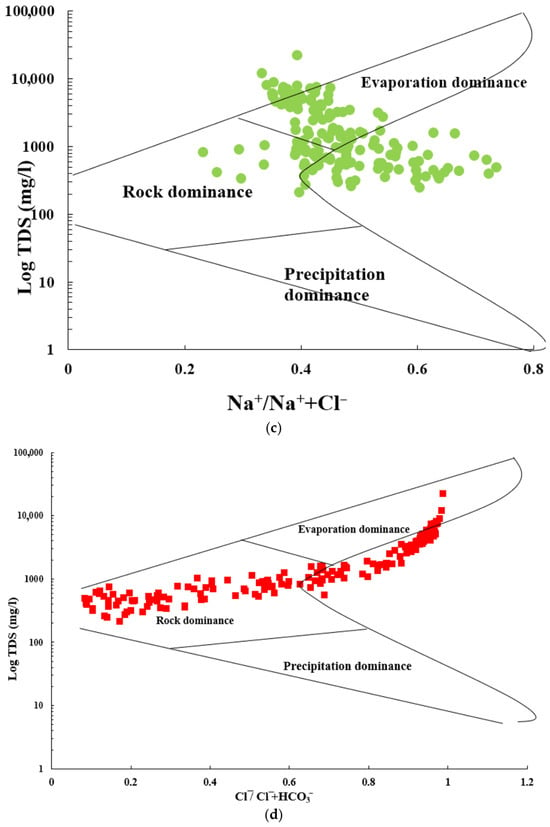
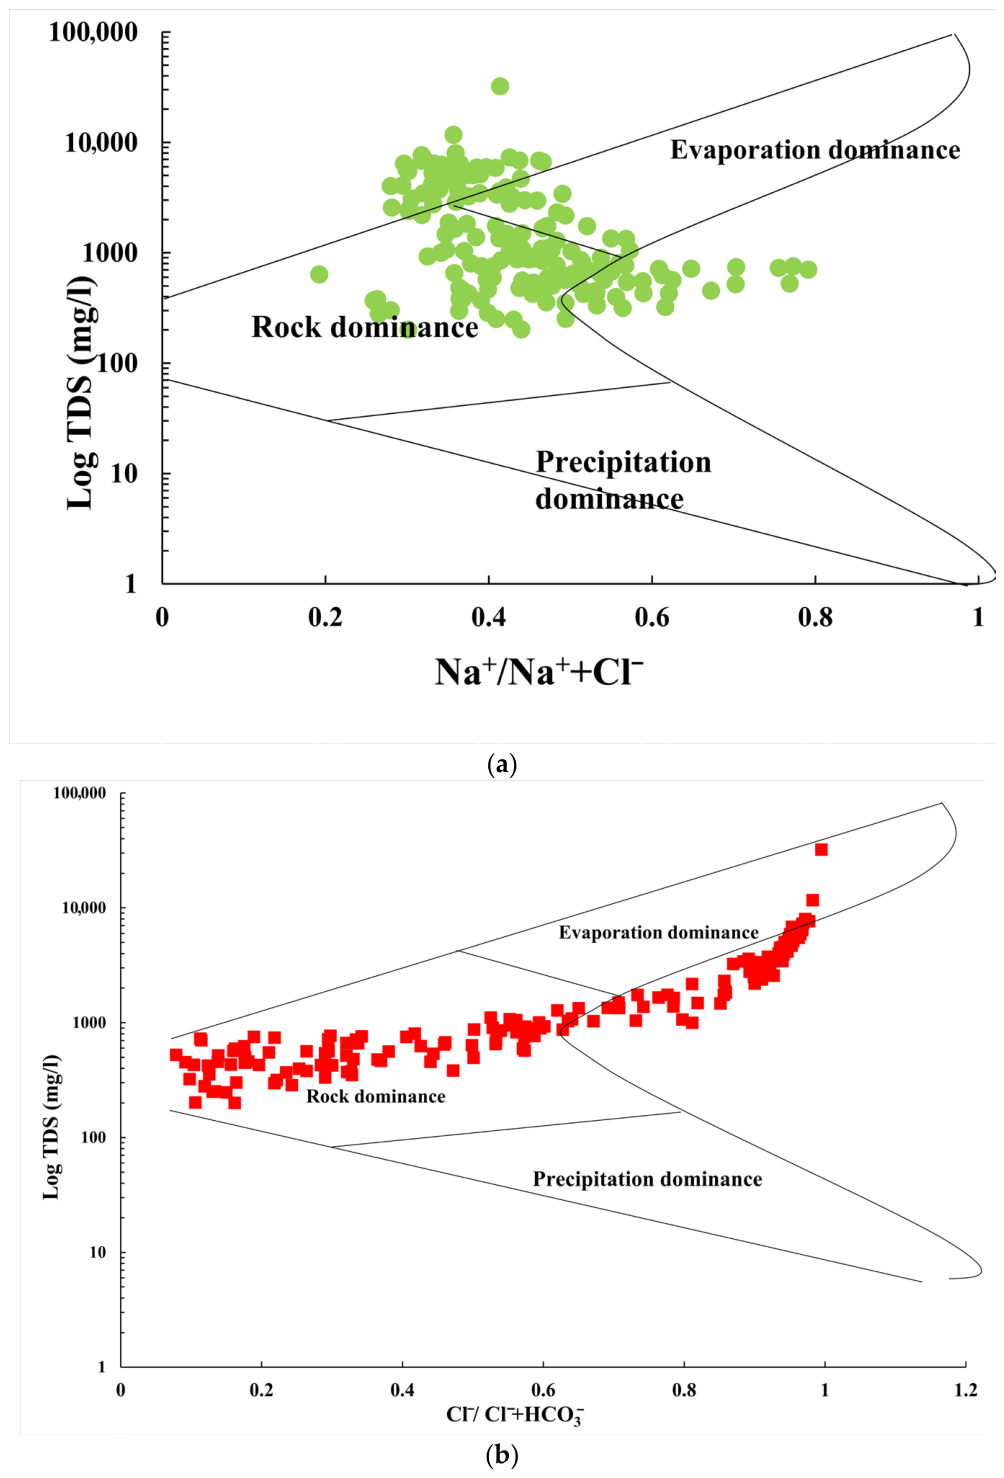
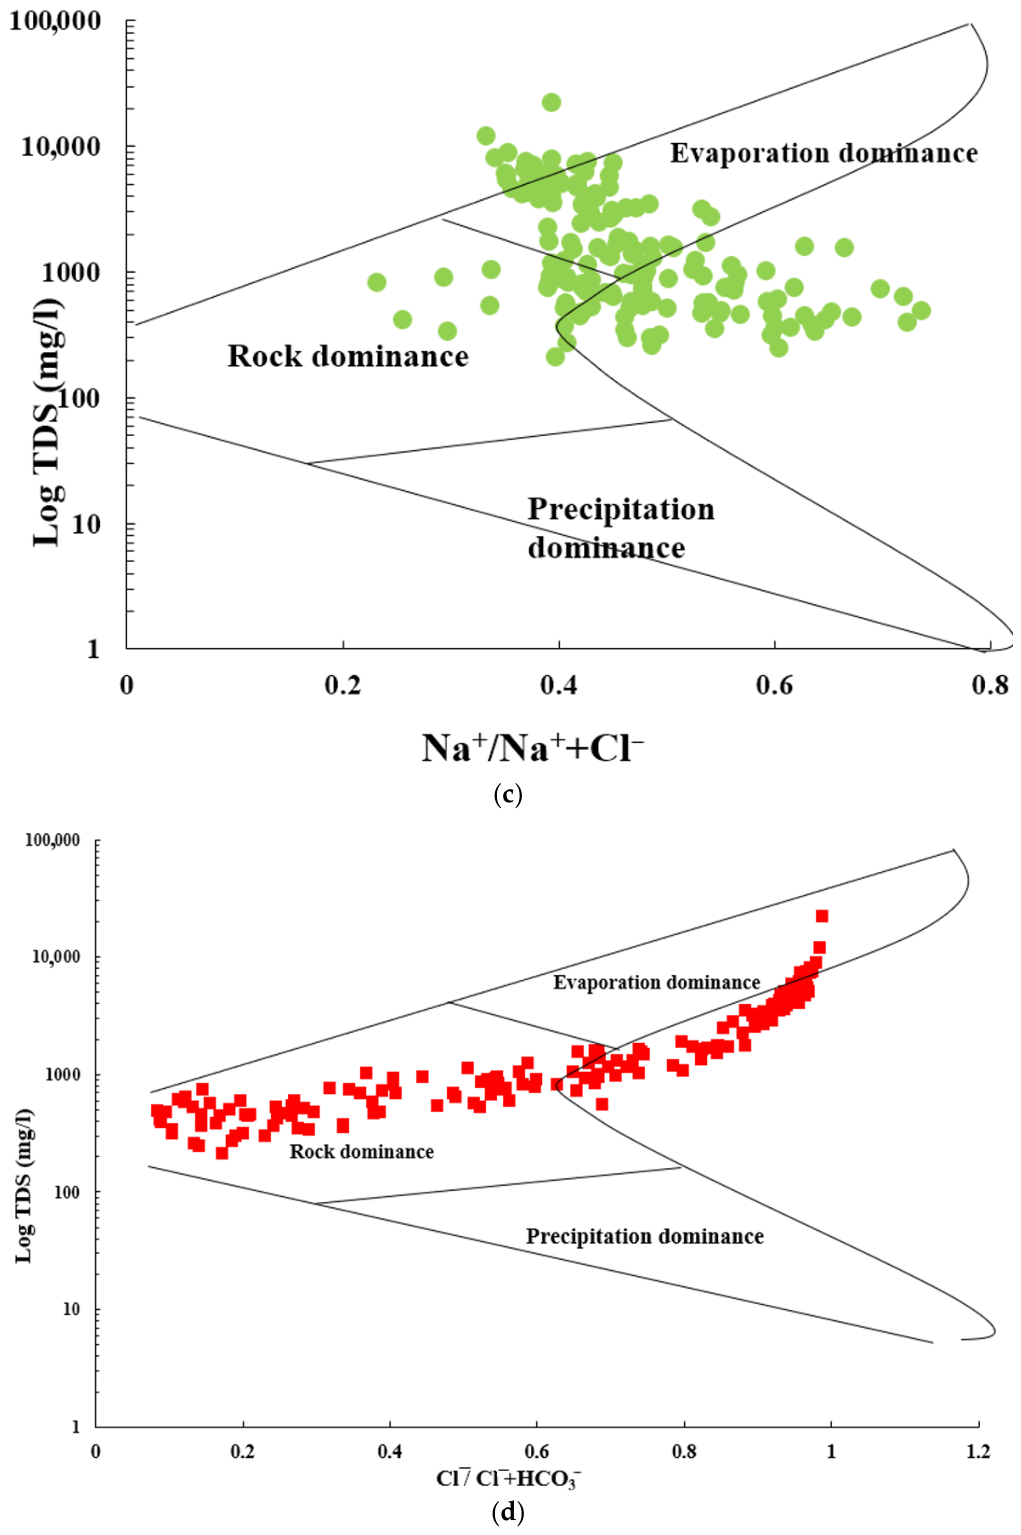
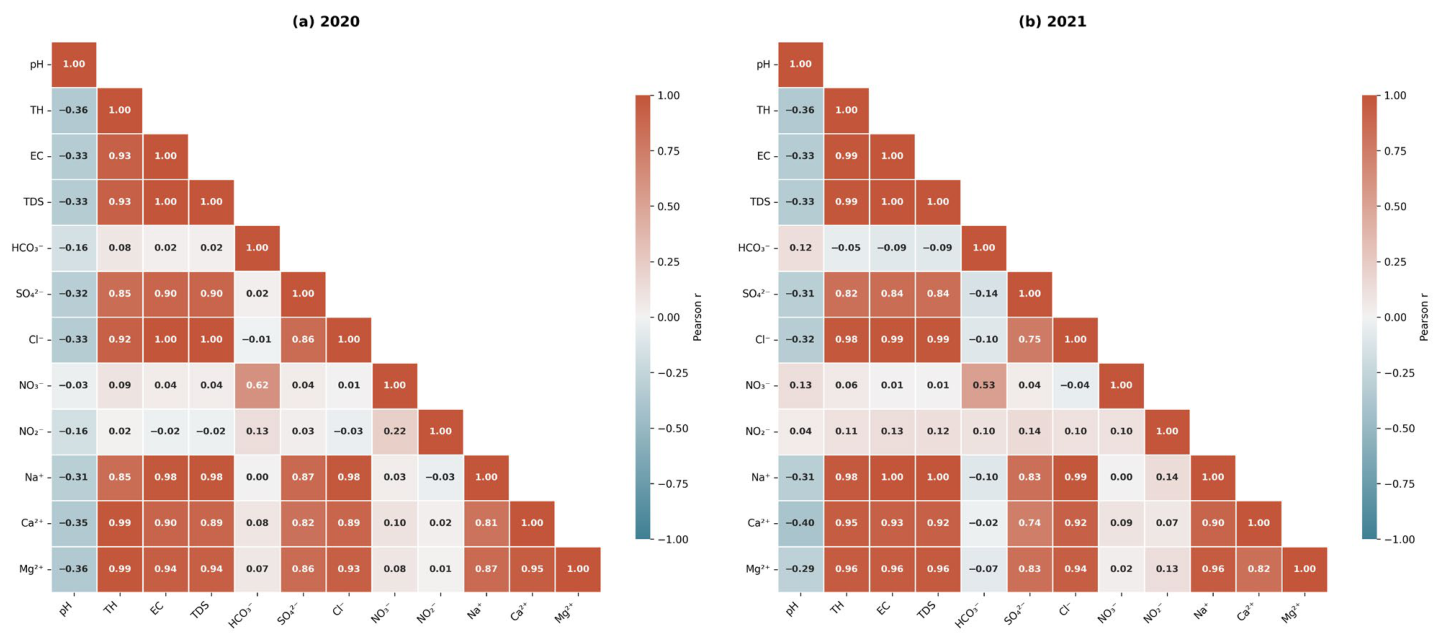
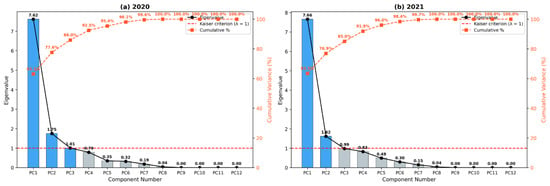
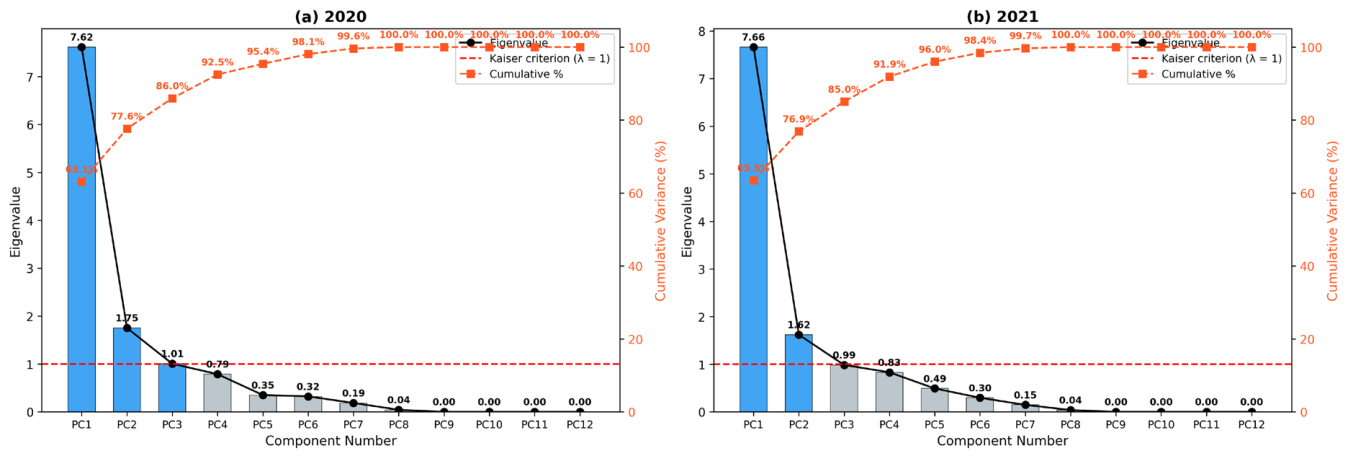
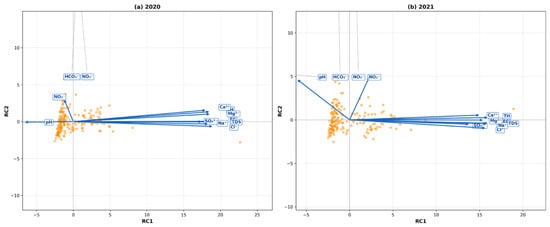
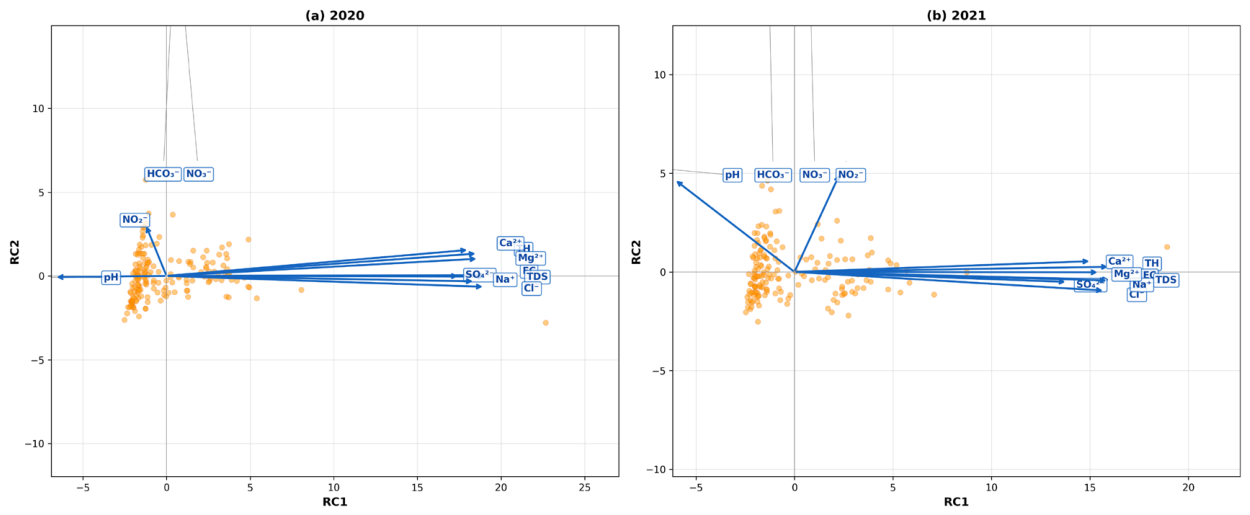
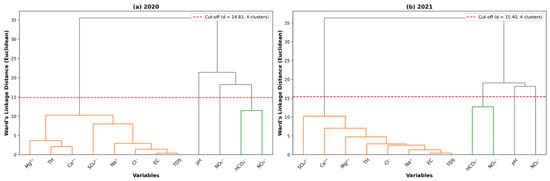
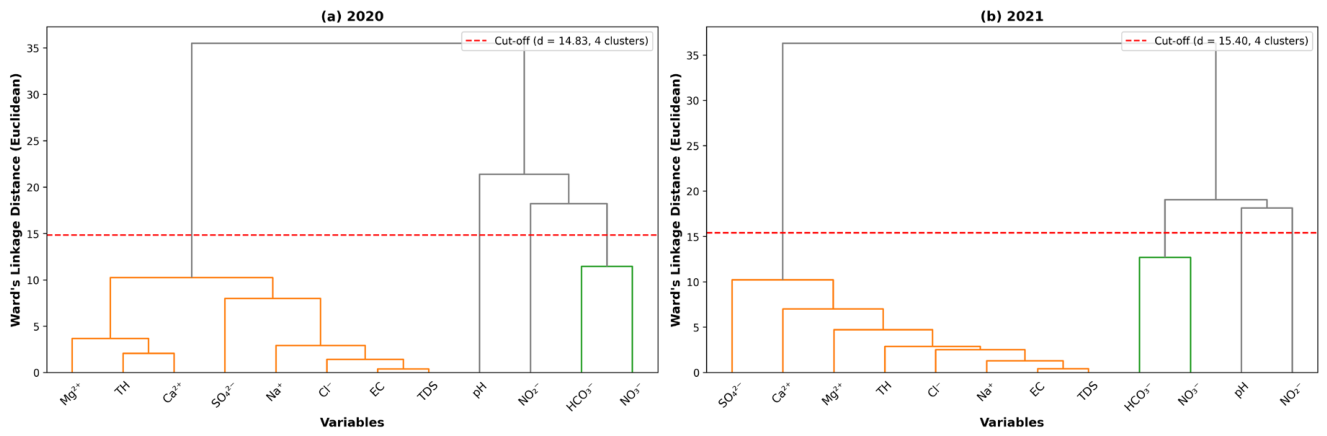
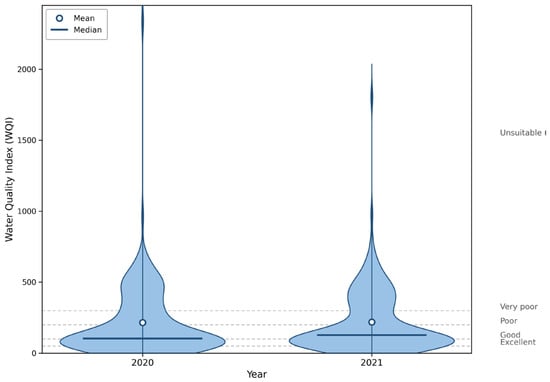
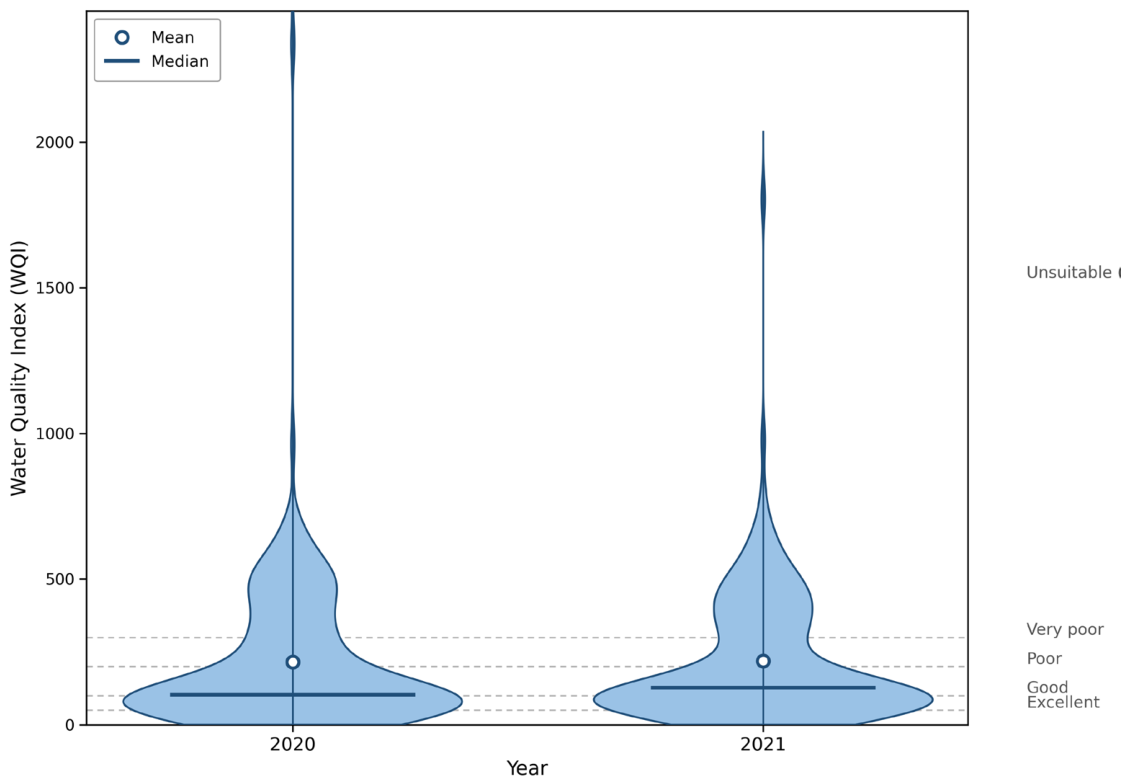

Disclaimer/Publisher’s Note: The statements, opinions and data contained in all publications are solely those of the individual author(s) and contributor(s) and not of MDPI and/or the editor(s). MDPI and/or the editor(s) disclaim responsibility for any injury to people or property resulting from any ideas, methods, instructions or products referred to in the content. |
© 2026 by the authors. Licensee MDPI, Basel, Switzerland. This article is an open access article distributed under the terms and conditions of the Creative Commons Attribution (CC BY) license.