1. Introduction
A recent multi-sensor analysis in northeast Thailand demonstrates that agricultural drought is best represented through the combined behavior of precipitation, vegetation, temperature, and soil moisture rather than a single variable [
1]. Meteorological drought is commonly characterized by precipitation deficits accumulated over defined timescales [
2], whereas SPEI additionally incorporates atmospheric evaporative demand [
3]. Agricultural drought develops when these anomalies propagate into soil-water limitation, vegetation stress, and reduced crop performance [
4]. Rainfed paddy systems in northeast Thailand exhibit marked spatiotemporal variability in drought occurrence [
5], and IPCC assessments project increasing drought risk in many regions under continued warming [
6]. Across the Lower Mekong and mainland Southeast Asia, multi-source observations and regional modeling show that rainfall, land cover, vegetation response, soil-water processes, and irrigation jointly shape agricultural drought [
7,
8,
9,
10].
Thailand has experienced substantial long-term losses from weather-related extremes [
11], and satellite monitoring identifies recurrent drought across northeast Thailand [
12]. National indicator-to-impact analysis shows that agricultural consequences vary among crops, regions, seasons, and drought durations [
13]. Multi-criteria and machine-learning mapping further demonstrates marked spatial variation in drought vulnerability across the northeast [
14]. In the Chi River Basin, climatic-index studies show that SPI and SPEI can portray drought differently because they respond to different atmospheric controls [
15].
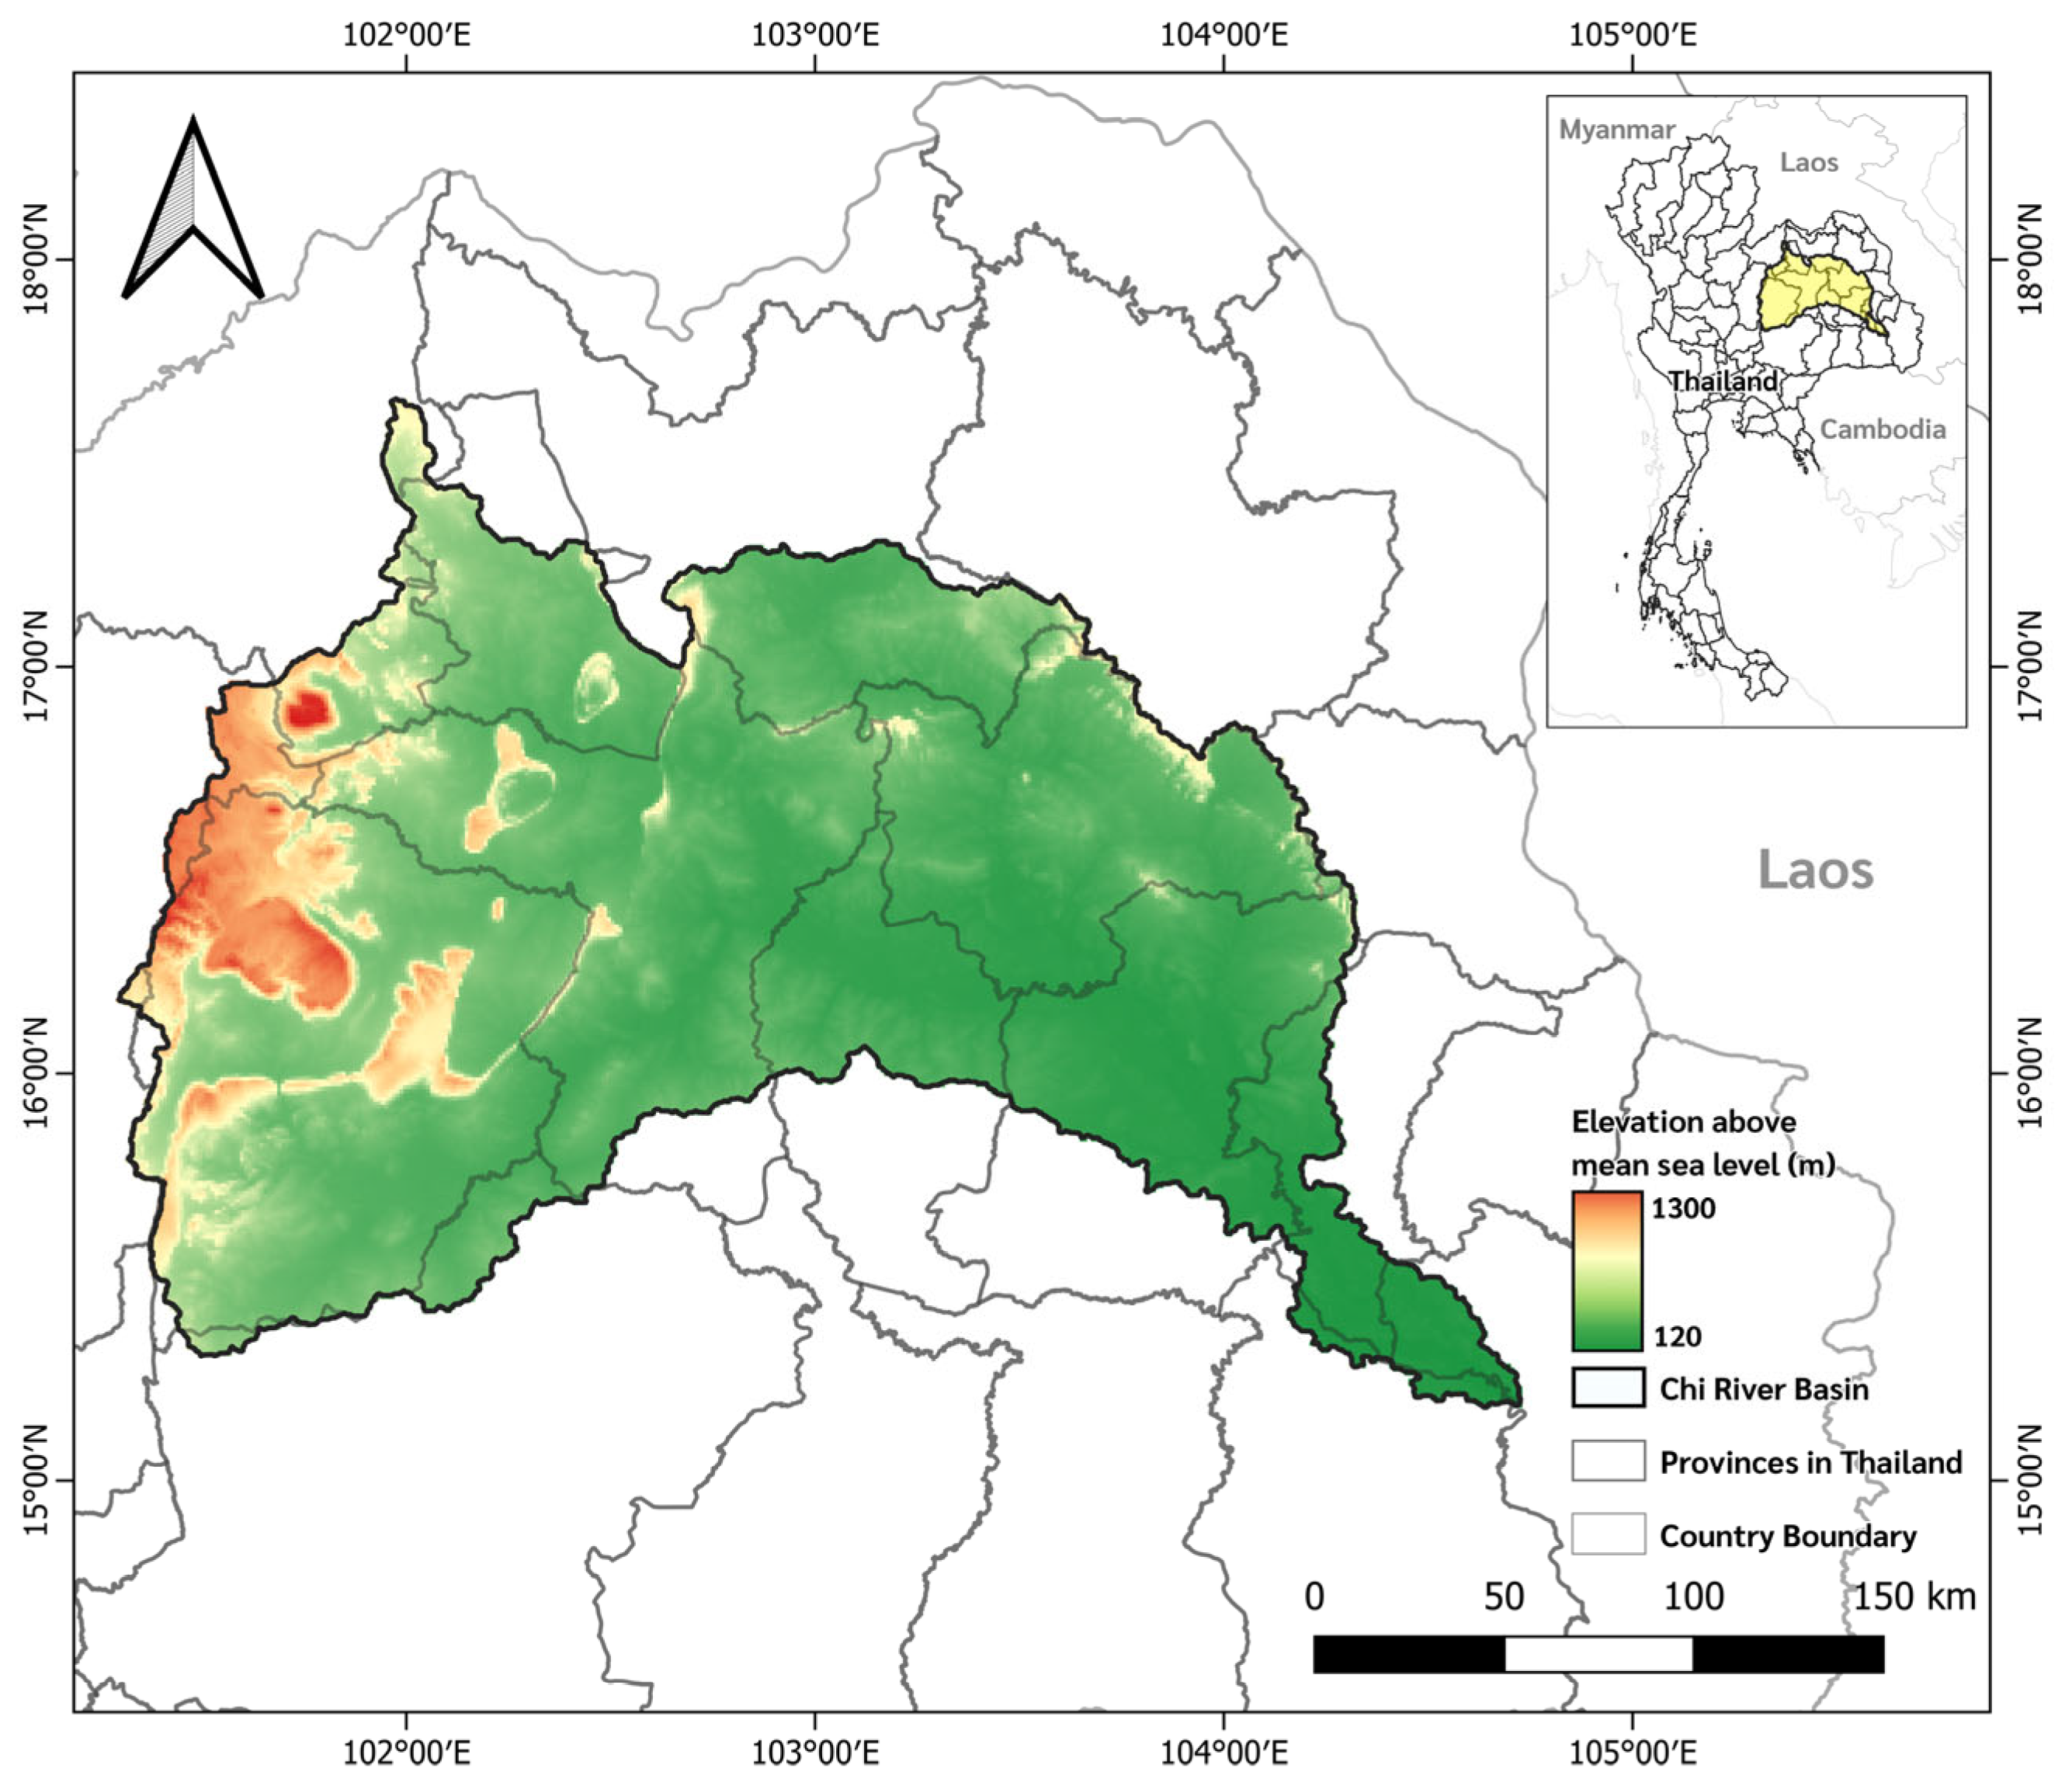
The Chi River Basin (CRB) covers approximately 49,500 km
2 across 14 northeastern provinces [
16,
17] and is one of Thailand’s major agricultural watersheds. A Thai sectoral risk assessment demonstrates that drought consequences extend beyond physical water deficits to economic and social sectors [
18]. Farmer adaptation in northern Thailand depends on risk appraisal, perceived response effectiveness, socioeconomic resources, and access to drought information [
19], while climate- and land-use-change projections indicate increasing future drought pressure in northeast Thailand [
20]. Existing CRB studies have mainly emphasized standardized climatic or remote-sensing indices [
15,
16,
17], leaving limited representation of within-basin agricultural exposure, irrigation buffering, and recurrent local hotspots.
Earth observation and GIS enable spatially continuous drought assessment where station networks are sparse. MODIS NDVI and EVI track vegetation response [
21], TVDI relates surface temperature to vegetation state [
22], and VHI combines vegetation condition with thermal stress [
23]. NDWI provides information on vegetation-canopy liquid-water status rather than direct root-zone soil moisture [
24]. These indicators represent different stages of drought propagation and may diverge because vegetation response is filtered by soil storage, crop calendars, and management. In cloud-prone, fragmented smallholder landscapes, multi-source integration is therefore preferable to reliance on one optical variable [
1,
12].
Google Earth Engine (GEE) provides scalable access to multi-temporal satellite and reanalysis archives [
25] and has supported long-term drought mapping in diverse basins [
26,
27], including the CRB [
16]. Its cloud-computing architecture enables consistent preprocessing, compositing, and spatial statistics over long periods without extensive local infrastructure. This capability is particularly valuable where ground observations and computing capacity are limited [
7,
12].
Important gaps remain. Comparative assessments show that agricultural and meteorological drought can differ substantially in timing and spatial expression [
28], while ENSO–drought teleconnections across mainland Southeast Asia are spatially variable and non-stationary [
29]. Regional studies commonly emphasize meteorological, vegetation, or model-specific indicators [
1,
5,
12,
14,
15,
16,
17], and Thai sectoral assessments often evaluate downstream impacts separately [
18]. Within the literature reviewed for this study, relatively few basin-scale frameworks simultaneously integrate climate variability, soil-water status, vegetation response, irrigation accessibility, and agricultural exposure while distinguishing structural vulnerability from transient hydroclimatic stress. External validation is also frequently constrained by sparse field records. Long-term CRB studies that distinguish irrigated from rainfed systems, quantify class-area changes, test weight sensitivity, validate thresholds, and identify persistent hotspots remain limited.
This study addresses these gaps through a GEE-based, multi-criteria ADRI that integrates rainfall deficit, vegetation health, soil moisture, irrigation accessibility, and agricultural land exposure. The framework represents physical drivers, ecological responses, and management-related modifiers within a common risk scale [
14,
16]. It explicitly distinguishes the irrigation-accessibility input from the derived irrigation risk layer and treats agricultural land exposure as the spatial presence of cropland rather than a complete socioeconomic-vulnerability measure. Unlike single-variable monitoring, ADRI is designed to explain why comparable rainfall conditions can produce contrasting agricultural risk across space. By combining satellite, reanalysis, and ancillary datasets, it is applicable to regions with sparse ground monitoring [
1] and supports evidence-based planning in climate-sensitive agricultural systems [
7,
15].
Specifically, the study: (1) maps ADRI for 2000, 2005, 2010, 2015, 2020, and 2025; (2) quantifies temporal changes and risk-class areas; (3) compares irrigated and rainfed agriculture; (4) identifies recurrent and persistent hotspots; (5) tests sensitivity to indicator weights; and (6) validates the mean 2015–2020 ADRI surface against the official recurring-drought dataset. The six benchmark years provide comparable multi-decadal snapshots while retaining complete MODIS-era inputs and capture relatively favorable, drought-intensification, extreme-drought, and recovery conditions. The principal contribution is therefore not a replacement for established drought indices, but a spatial decision-support framework that jointly evaluates hydroclimatic stress, ecological response, irrigation buffering, and agricultural exposure.
3. Results and Discussion
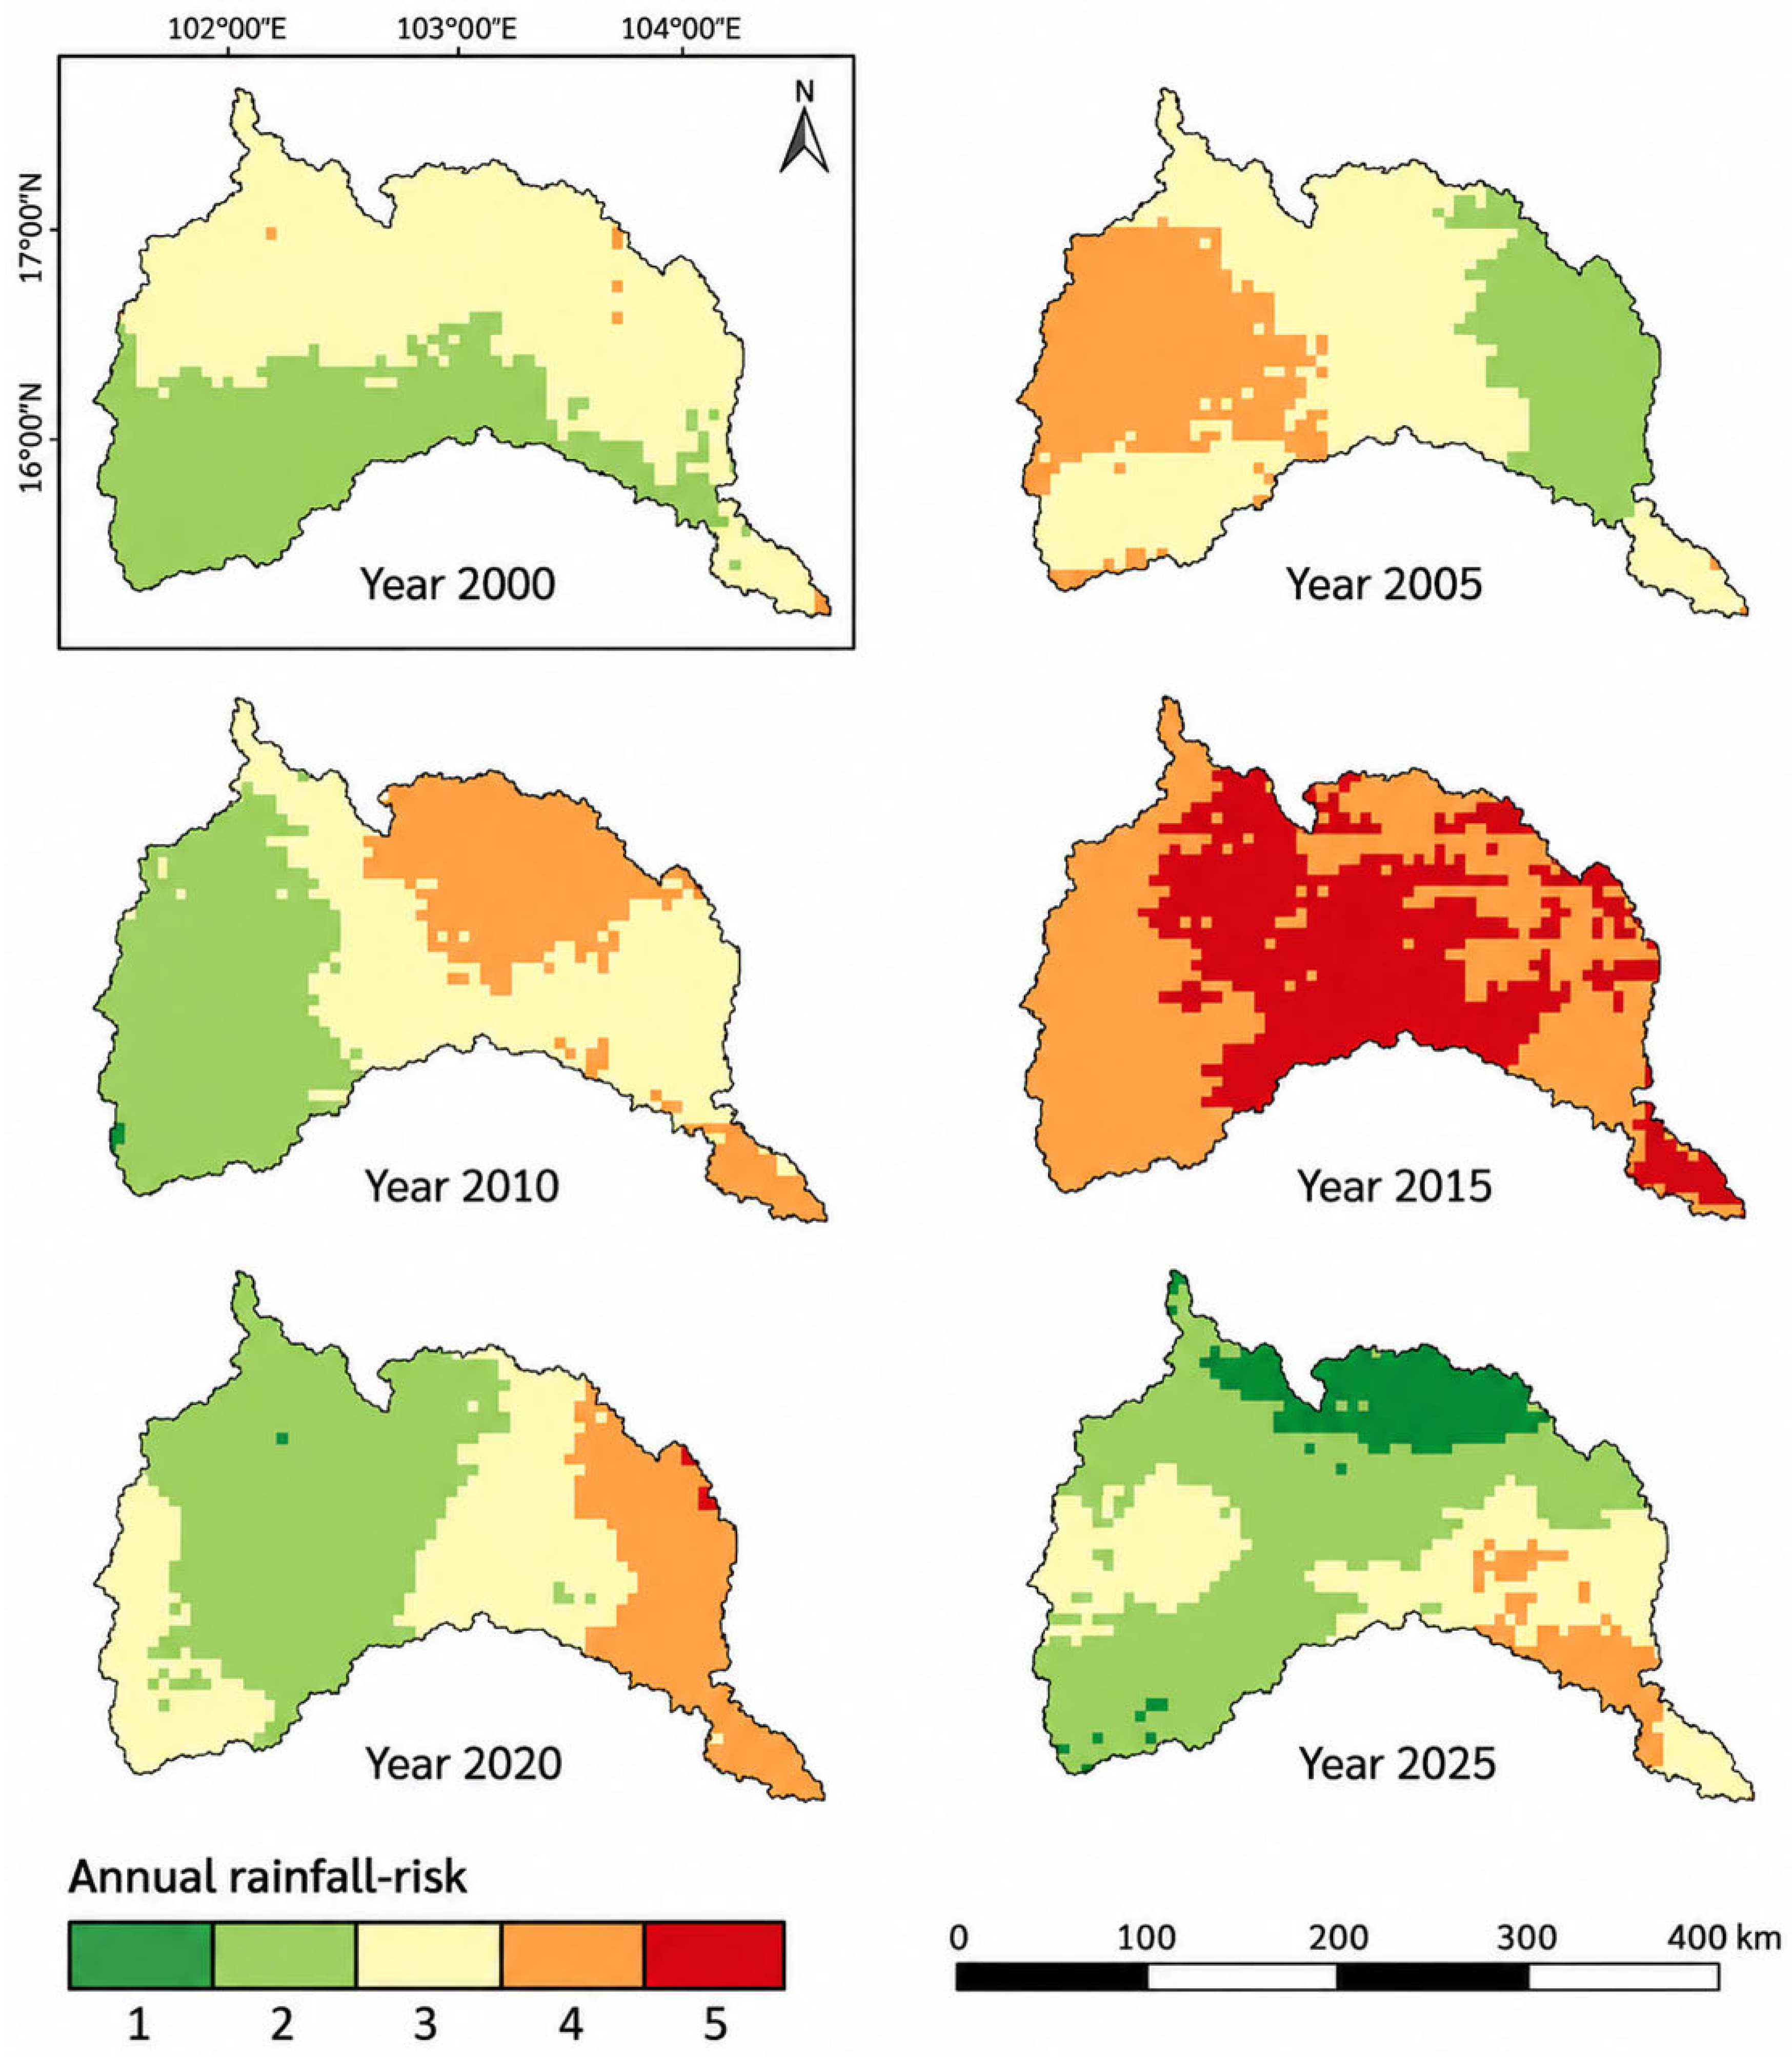
3.1. Annual Rainfall Risk Maps
Figure 2 presents annual rainfall-related drought risk derived from CHIRPS anomalies relative to the 2000–2025 mean. The maps show pronounced interannual and spatial variability, confirming that monsoon deficits did not affect the basin uniformly. In 2000, low to moderate risk dominated, especially in western and southwestern areas, whereas northern and eastern sectors were mainly moderate and only small areas reached high risk. This distribution provides the comparatively favorable rainfall baseline for interpreting later years.
In 2005, moderate–high risk expanded across western and central areas, while eastern sectors remained comparatively favorable. The resulting west–east contrast indicates spatially uneven monsoon penetration and convective rainfall rather than a uniform basin-wide deficit. In 2010, low risk persisted in the west but moderate–high classes expanded through central and southeastern areas, indicating incomplete rainfall recovery and localized persistence of meteorological drought.
The most severe pattern occurred in 2015, when high and very high risk covered much of the central, northern, and eastern basin. This distribution is consistent with the severe 2015–2016 Thai drought and with documented ENSO–drought teleconnections across mainland Southeast Asia [
13,
29]. Regional agricultural and hydrological studies also show how precipitation deficits propagate through vegetation and water-storage systems [
8,
10]. The event underscores the value of hydroclimatic monitoring and subseasonal-to-seasonal forecasting systems for the Mekong and wider South and Southeast Asian region [
31,
32].
By 2020, most western and central areas had returned to low risk, but moderate–high risk persisted in eastern and southeastern sectors, indicating that basin-wide recovery remained spatially uneven.
In 2025, very low to low risk dominated northern and central areas under positive rainfall anomalies. Only limited southeastern areas remained moderate–high risk, making 2025 the most favorable rainfall year among the later benchmarks.
Taken together, the rainfall maps show episodic rather than spatially uniform meteorological drought. The transition from favorable conditions in 2000 to severe deficit in 2015 and recovery by 2025 highlights strong interannual control by the monsoon. Nevertheless, eastern and southeastern sectors retained elevated risk during parts of the recovery period, and recurrently high values in central, eastern, and downstream areas indicate persistent spatial sensitivity. These contrasts support geographically differentiated reservoir operation, seasonal preparedness, and agricultural water allocation rather than basin-wide management based on a single rainfall average.
3.2. VHI-Based Agricultural Drought-Risk Maps
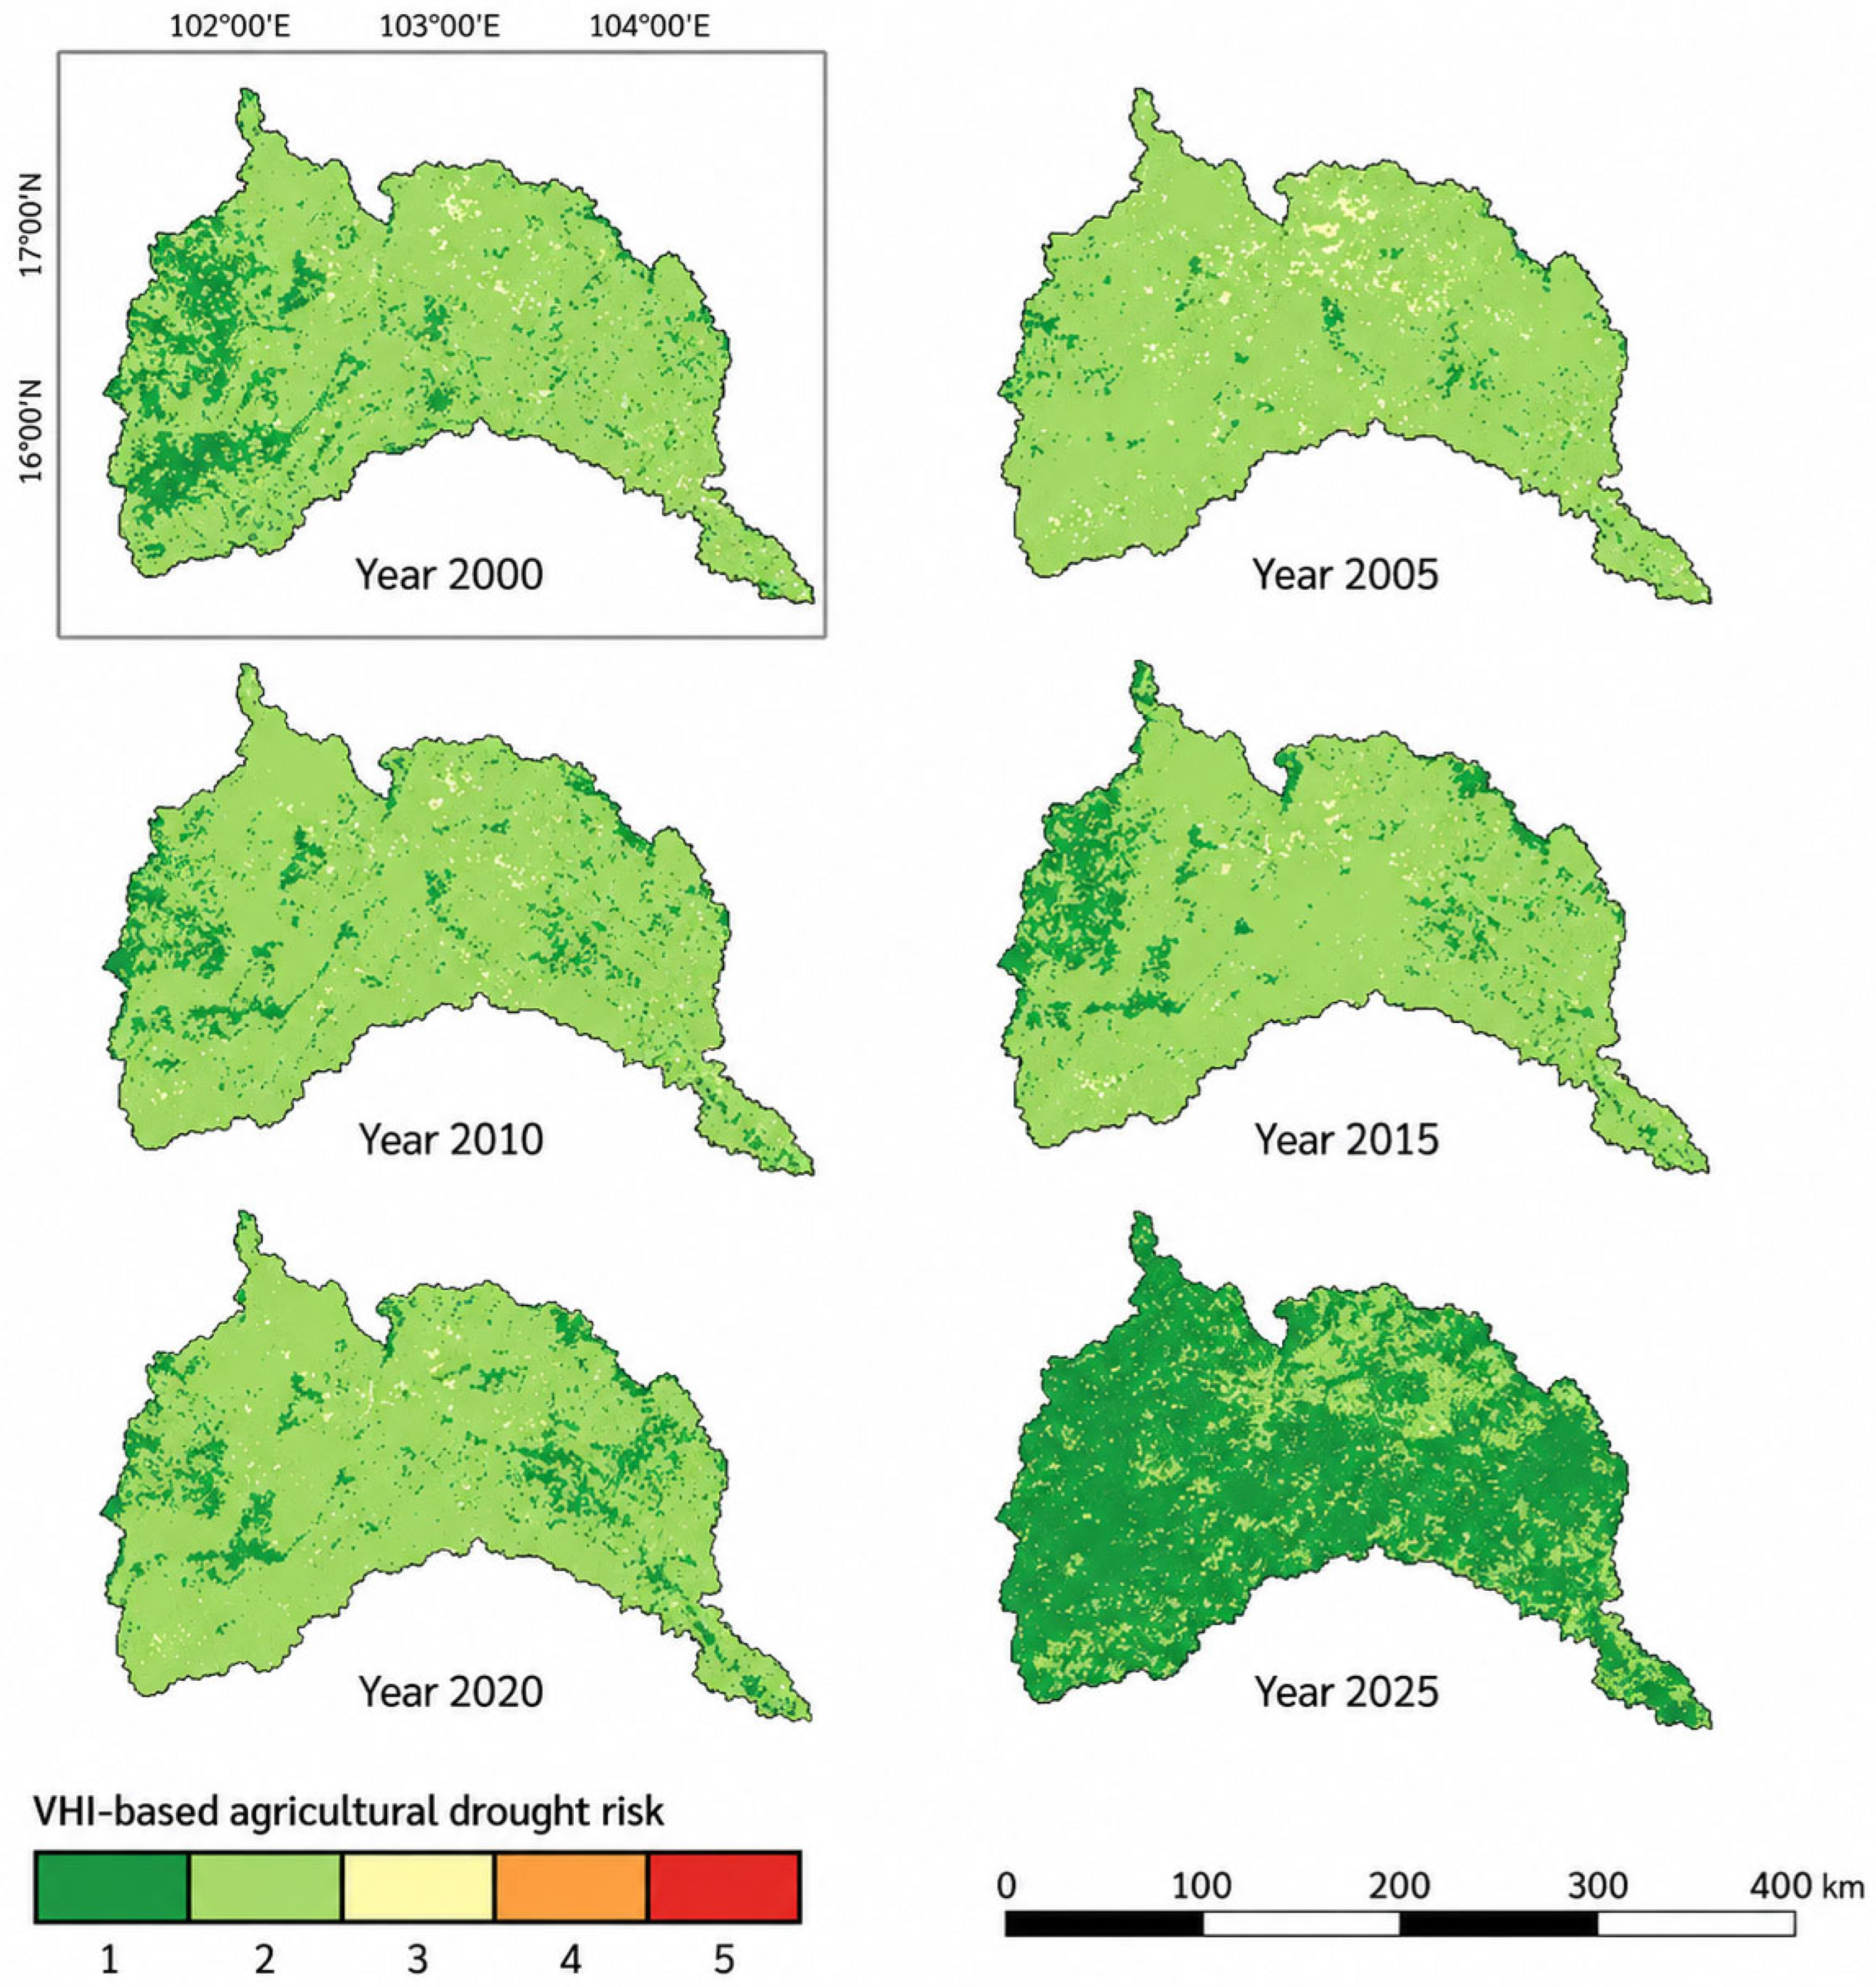
VHI translated annual greenness and thermal conditions into vegetation-stress risk (
Figure 3). The index integrates VCI and TCI and is widely used to characterize agricultural drought severity, timing, and spatial extent [
23,
33]; its application in rainfed basins further demonstrates its value for spatial drought quantification [
34]. Unlike rainfall risk, the VHI maps were predominantly very low to low and more spatially fragmented, indicating that vegetation response did not mirror precipitation anomalies directly. Differences in crop type, phenology, land cover, irrigation, and antecedent soil moisture can all modify this response.
Low-risk conditions dominated in 2000, 2005, and 2010. In 2000, very low-risk clusters were most evident in western and southwestern areas, with moderate stress confined to scattered patches. In 2005, vegetation stress became slightly more fragmented, including isolated moderate-risk zones in central and northern cropland. The 2010 map remained largely low risk even where rainfall risk had increased, implying buffering by antecedent moisture, irrigation, crop timing, or land-cover differences and confirming the lagged, spatially filtered nature of canopy response.
This decoupling was clearest in 2015: despite the strongest meteorological drought, much of the basin remained in low VHI-risk classes, while moderate stress expanded locally. Comparable studies demonstrate that drought vulnerability and food-security effects vary spatially among agricultural landscapes and farming systems [
35,
36]. The muted annual signal should not be interpreted as absence of crop impact, because brief stress during sensitive growth stages may be obscured by annual compositing, harvest cycles, or vegetation replacement. The result instead demonstrates why VHI should be interpreted jointly with rainfall, soil moisture, and management indicators.
In 2020, moderate VHI risk became more evident in eastern and northeastern sectors, potentially reflecting crop intensity, short-term thermal anomalies, or localized water limitations rather than a basin-wide vegetation decline. By 2025, very low-risk conditions dominated almost the entire basin. This widespread improvement is consistent with positive rainfall anomalies and suggests strong vegetation recovery across both irrigated and rainfed landscapes, although crop-specific outcomes cannot be inferred from annual VHI alone.
Overall, VHI captured physiological response and local resilience that rainfall anomalies alone could not represent. The comparison with
Figure 2 shows that meteorological and agricultural drought are related but not interchangeable: a precipitation deficit becomes agriculturally important only after being filtered through soil-water storage, crop condition, heat stress, and water management. VHI therefore contributes the response component of ADRI, while the other layers provide information on cause, buffering, and exposure.
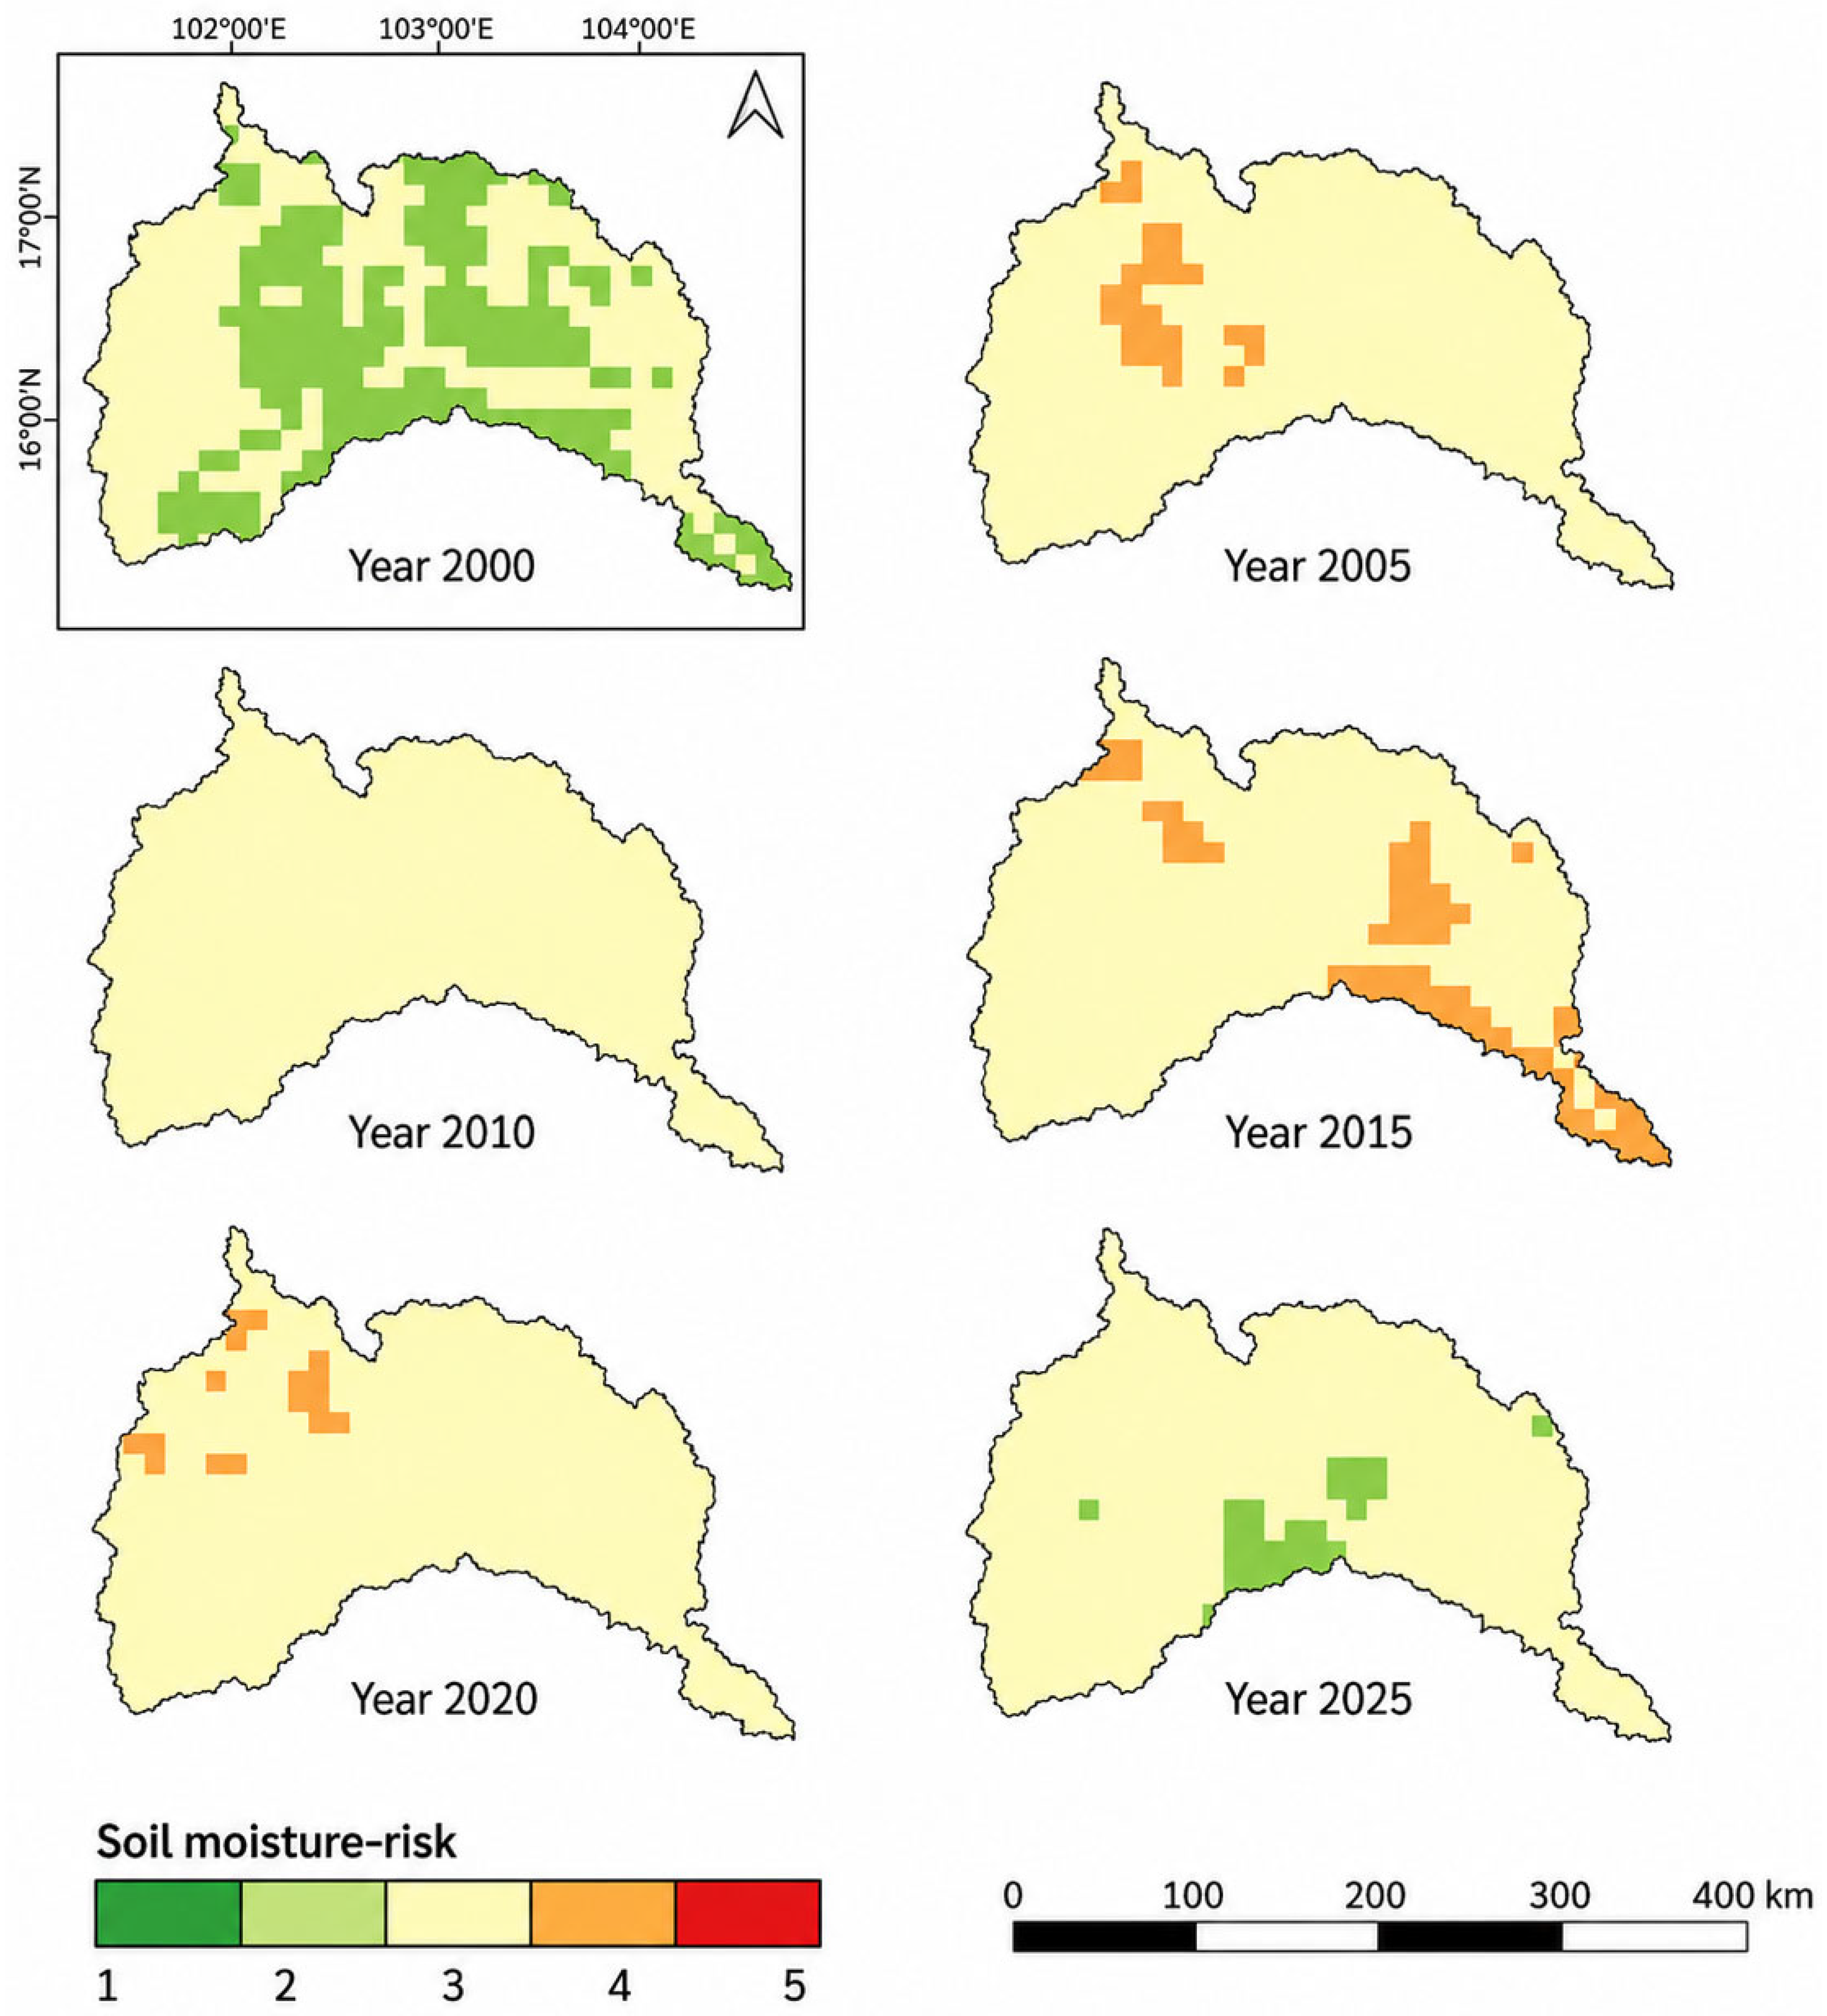
3.3. Soil Moisture-Risk Maps
Figure 4 presents ERA5-Land soil-moisture risk. Hydrologic modeling in the Mekong shows that soil-water deficits are central to agricultural drought onset and evolution [
10]. More broadly, drought assessments under strong regional warming show that persistent hydroclimatic stress can intensify vegetation and water-scarcity impacts [
37]. Annual anomalies were calculated relative to the 2000–2025 mean, so the maps represent departures from the basin’s long-term soil-water condition rather than absolute plant-available water. Compared with rainfall and VHI, soil-moisture patterns were smoother and more persistent because water storage changes gradually and because the native ERA5-Land grid is coarse. Both hydrological memory and data resolution therefore contribute to the observed spatial continuity.
Moderate soil-moisture risk dominated most benchmark years. This prevalence indicates that the basin commonly remained near its long-term mean rather than shifting entirely into either wet or severely depleted conditions. Nevertheless, localized departures were important because they occurred in agricultural sectors already exposed through limited irrigation or extensive cropland. The year-by-year maps therefore clarify how soil-water storage moderated, delayed, or prolonged the rainfall signal.
In 2000, low and moderate soil-moisture risk dominated. Low-risk areas occurred mainly in central and northern sectors, whereas high-risk patches were rare and spatially isolated. The pattern indicates relatively balanced soil-water storage and is consistent with the limited high ADRI observed in the same year.
In 2005, the basin shifted toward a more uniform moderate class, with localized high risk in the northwest. Soil-water deficits therefore increased modestly but did not become widespread, even though rainfall risk had expanded across western and central areas. This contrast suggests that antecedent storage and subsurface persistence delayed the full translation of rainfall deficit into soil-moisture stress.
The 2010 map was the most spatially homogeneous, with nearly the entire basin in the moderate class and little representation of either extreme. The contrast with heterogeneous rainfall risk suggests that soil storage buffered short-term precipitation variability and redistributed the annual signal through time. It also reflects the smoothing inherent in a coarse reanalysis product, which may not capture field-scale contrasts among soil types and land management.
In 2015, moderate–high risk expanded in southeastern and central areas, reflecting depletion under the severe regional drought. The response remained less spatially extreme than the rainfall anomaly, suggesting that antecedent storage and gradual soil-water decline buffered part of the meteorological shock. However, moderate basin-wide depletion can still be agronomically important when it coincides with high temperatures, sensitive crop stages, and limited irrigation.
In 2020, moderate risk remained widespread and localized high-risk patches persisted in western and northwestern sectors despite improved rainfall. These residual deficits may reflect differences in soil texture, evapotranspiration, land-use intensity, rooting depth, or irrigation access. Their persistence also illustrates that soil-moisture recovery may lag meteorological recovery.
Low-risk areas expanded in central and southern regions in 2025, corresponding with favorable rainfall and VHI conditions. Even so, much of the basin remained in the moderate class. The incomplete transition to low risk indicates that one favorable rainfall year does not necessarily restore all components of the soil-water system, particularly where storage capacity is limited or evaporative demand remains high.
Soil moisture therefore acted as an intermediate hydrological buffer between meteorological drought and vegetation response. Its smoother pattern partly reflects real storage persistence and partly the coarse native resolution of ERA5-Land. The layer is appropriate for basin-scale integration and for representing drought propagation, but localized near-surface soil moisture condition deficits and within-pixel variability may be underestimated. This scale limitation is considered explicitly in
Section 3.10.
3.4. Irrigation Risk and Agricultural Exposure Layers
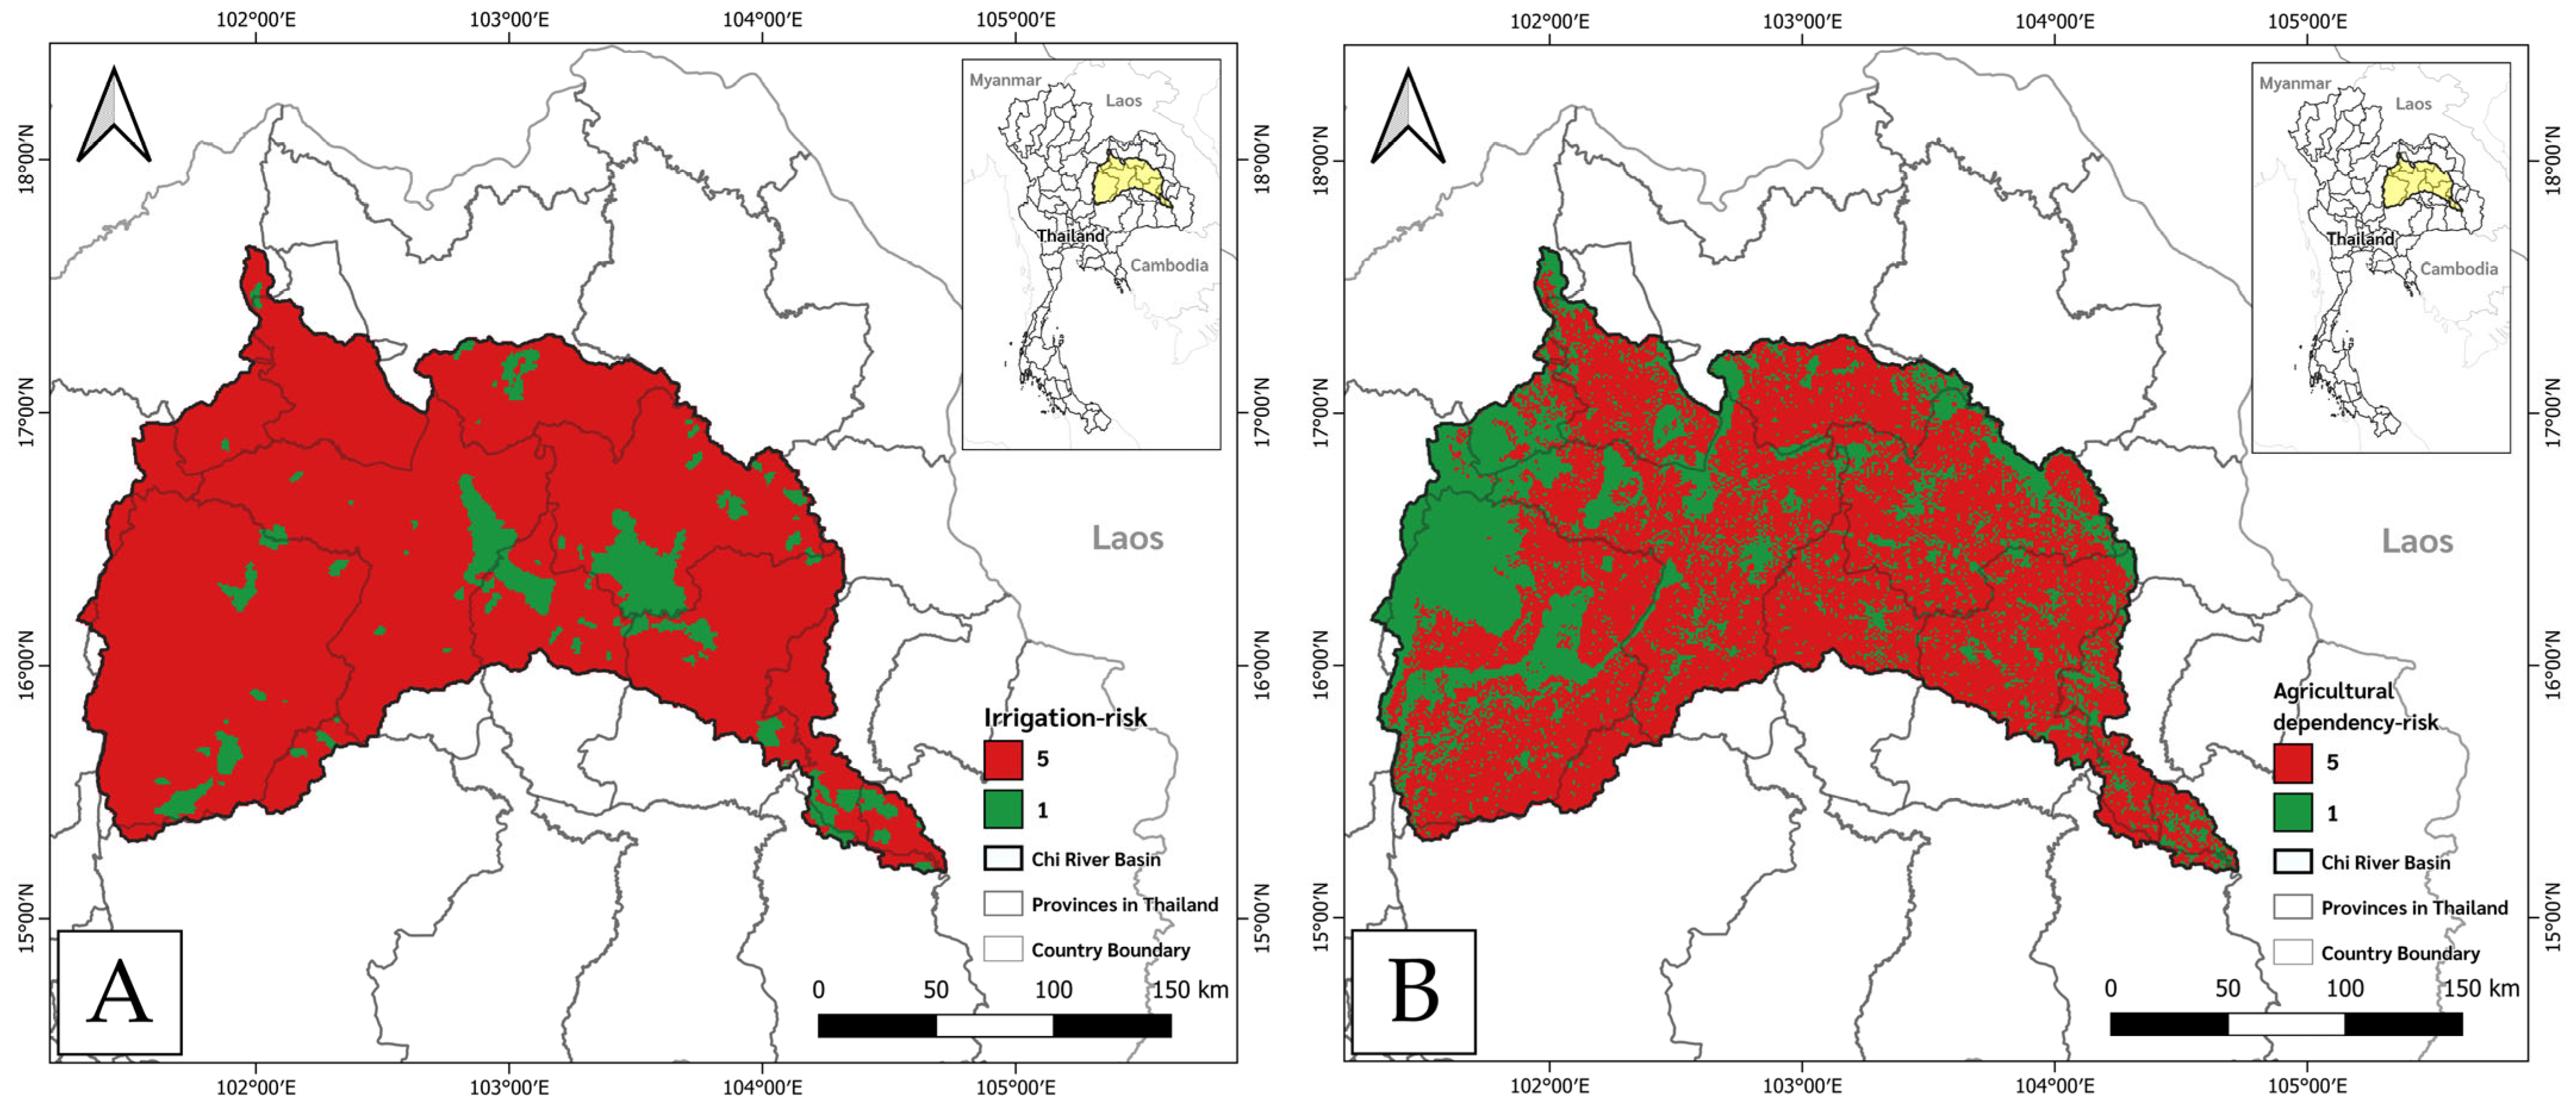
Figure 5 maps the two structural ADRI components. The irrigation risk layer distinguishes potential access to command-area infrastructure, whereas the agricultural land exposure layer identifies cropland directly subject to production losses. Unlike rainfall, VHI, and soil moisture, these layers are comparatively stable through time and describe where drought impacts may be buffered or amplified. Their inclusion is relevant because Lower Mekong rice production is highly drought-sensitive and irrigation adaptation may be required to offset yield losses in severely affected areas [
38].
Most of the basin was outside mapped irrigation command areas and therefore received high irrigation risk. Low-risk command areas were fragmented along central, eastern, downstream, river-corridor, and reservoir-supported zones, while large western and peripheral agricultural areas remained rainfed. This distribution confirms the dependence of regional agriculture on monsoon rainfall and the potential threat to Lower Mekong rice production [
38]. Global and regional agricultural drought frameworks commonly combine hazard, exposure, vulnerability, and mitigation or adaptive capacity [
39,
40,
41,
42]. Geospatial, fuzzy-logic, AHP, and machine-learning studies operationalize these components for spatial mapping and prioritization [
40,
43,
44,
45]. The irrigation layer operationalizes one component of adaptive capacity, although it does not measure actual service reliability.
The agricultural land exposure layer assigned high exposure to widespread cropland and low exposure to forest, protected, urban, and other non-agricultural areas. Cropland continuity was especially evident across central and eastern lowlands, where a regional drought can affect large production areas simultaneously. Because the layer is binary, it identifies where agricultural assets are present but does not distinguish crop value, seasonal planting, or differential crop sensitivity.
Irrigated zones were more common in lowland central and southeastern sectors than in western uplands, reflecting the distribution of reservoirs, rivers, irrigation projects, and intensified agriculture. Their fragmented geometry indicates that potential access is spatially uneven even within generally irrigated parts of the basin. These contrasts help explain why nearby agricultural areas may show different ADRI values under the same rainfall conditions.
The agricultural land exposure layer (
Figure 5B) shows that cropland occupies most of the basin and was assigned high exposure. Low-exposure areas correspond mainly to forested uplands, protected land, urban areas, water bodies, and other non-cultivated surfaces. The predominance of high exposure emphasizes that the basin-wide drought problem is fundamentally agricultural rather than confined to a small number of isolated farming districts.
Because exposed cropland depends directly on seasonal rainfall and soil moisture, its extensive distribution magnifies the potential production and socioeconomic consequences of drought. Exposure is especially consequential where a single dry season affects large contiguous rice or field-crop areas and where households have limited capacity to shift crops or supplement water. However, the present layer represents land exposure only and should not be interpreted as a direct measure of household vulnerability.
The overlap of high agricultural land exposure and high irrigation risk identifies compound-vulnerability zones. Rainfed cropland in these areas is simultaneously sensitive to rainfall deficit, soil-moisture depletion, and limited water-management capacity and therefore contributes disproportionately to high ADRI. Conversely, low exposure or potential irrigation access can reduce the integrated score even when one hydroclimatic indicator is unfavorable.
These structural layers make ADRI more policy-relevant by locating where environmental stress coincides with limited buffering and extensive agricultural exposure. Their stability also separates persistent vulnerability from rapidly varying annual hazard. Nevertheless, neither layer represents actual water delivery, crop-specific sensitivity, farm income, or household adaptive capacity. The results should therefore guide priority screening and data collection rather than serve as a complete socioeconomic risk assessment.
3.5. ADRI Maps for 2000, 2005, 2010, 2015, 2020, and 2025
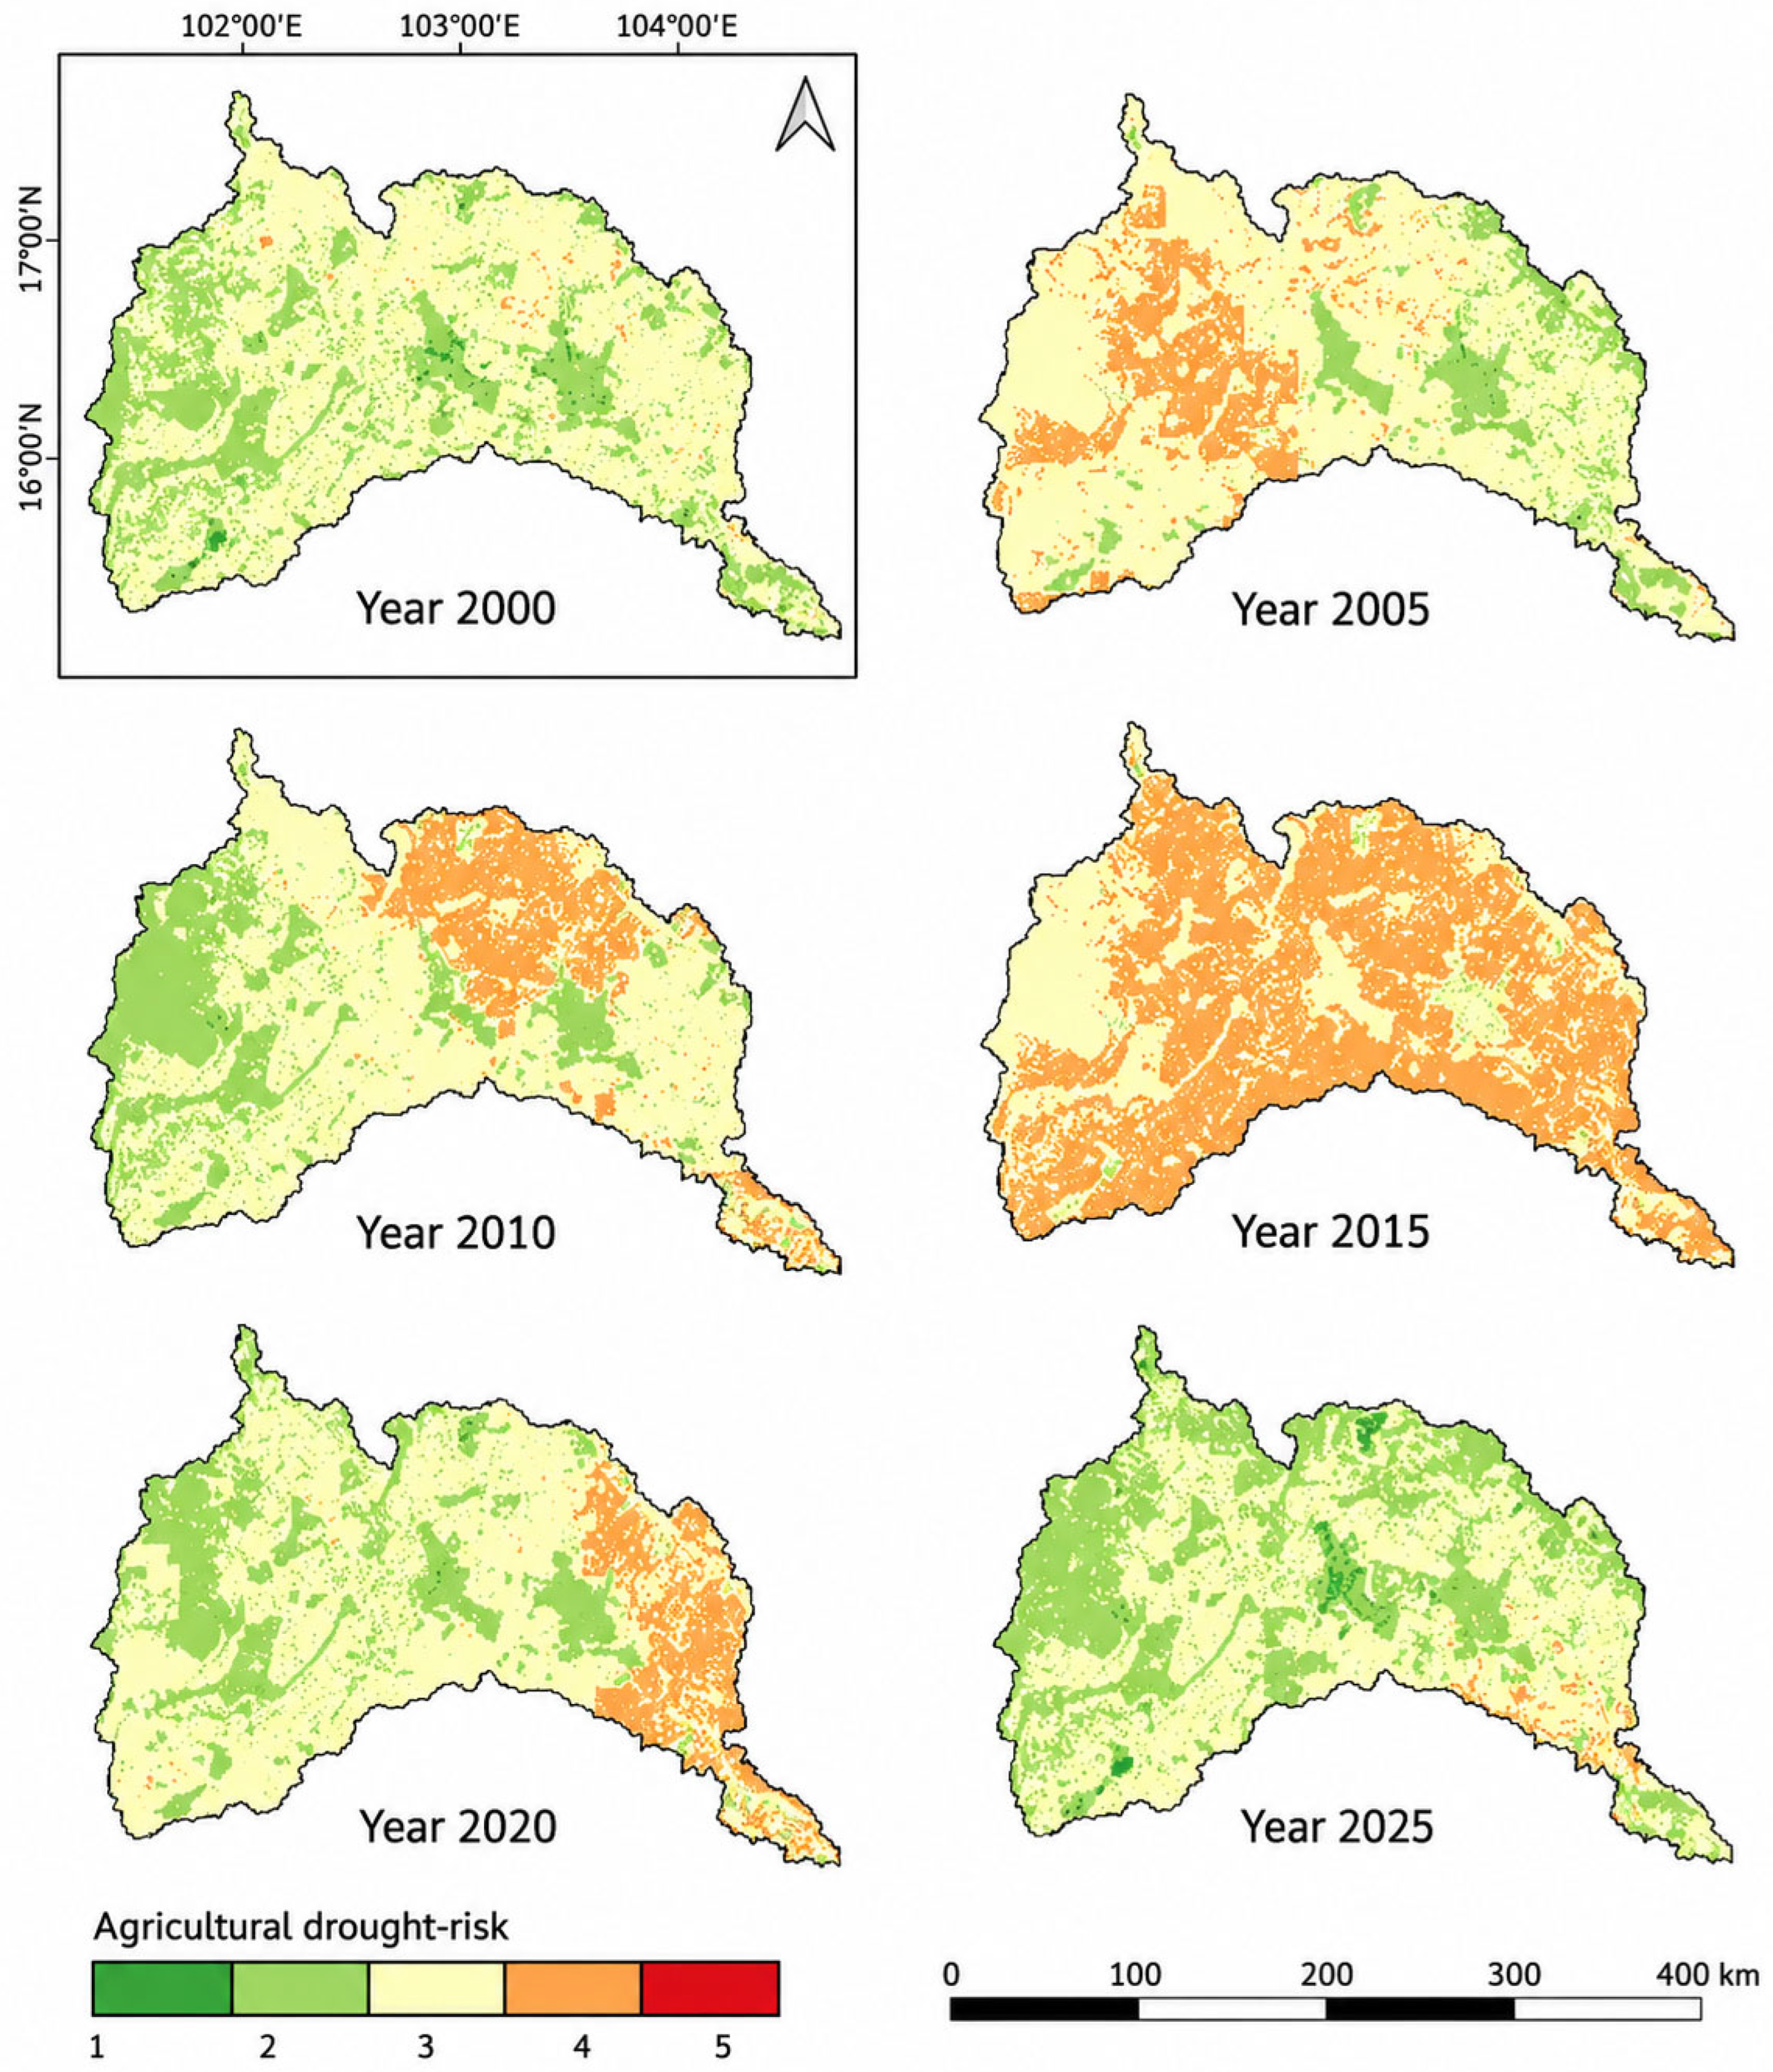
Figure 6 integrates the five normalized indicators into ADRI. The resulting maps represent meteorological stress, soil-water availability, vegetation response, irrigation buffering, and agricultural exposure within one spatial framework, consistent with integrated assessment approaches for irrigated agriculture [
46]. Because each layer is expressed on the same 1–5 scale, ADRI identifies locations where several moderate pressures combine as well as locations dominated by one severe component. The maps should therefore be interpreted as relative agricultural drought risk rather than direct crop-loss probability.
Moderate risk dominated the six benchmark years, but the location and extent of high risk changed substantially. This persistent moderate class reflects the combined effect of widespread cropland and rainfed conditions even when annual hydroclimatic indicators were favorable. Temporal changes were therefore expressed mainly through shifts between low, moderate, and high classes rather than through extensive very high risk.
In 2000, very low and low ADRI classes were concentrated in western and southwestern areas, while moderate risk occupied much of the center and east. High-risk areas were spatially limited. The integrated pattern is consistent with favorable rainfall, healthy vegetation, and relatively stable soil moisture and establishes the least-stressed early benchmark against which later intensification can be assessed.
In 2005, moderate–high risk expanded through western and central rainfed zones. Eastern areas retained lower values in places, indicating that local rainfall and potential irrigation access moderated the integrated drought signal. The map demonstrates how structural exposure and limited buffering can transform a spatially uneven rainfall deficit into broader agricultural risk.
In 2010, elevated ADRI expanded across central and northern sectors while parts of the west remained lower risk. This pattern occurred even though VHI and soil moisture were largely low to moderate. Combined atmospheric, hydrological, and exposure components can therefore raise integrated risk before severe canopy stress is evident, illustrating a key advantage of multi-index assessment [
47]. The result also cautions against using vegetation greenness alone as an early indicator of agricultural resilience.
The strongest basin-wide drought occurred in 2015, when high ADRI values covered much of the basin and low-risk area almost disappeared. Severe rainfall deficits, reduced soil moisture, extensive cropland, and limited irrigation jointly amplified vulnerability during the El Niño event. Although VHI remained comparatively moderate in many locations, the integrated framework identified the cumulative pressure on production systems and the limited capacity of rainfed areas to absorb the shock.
Conditions recovered in 2020, and low to moderate classes again dominated western and central sectors. Elevated risk nevertheless persisted in eastern and southeastern rainfed zones, indicating that recovery was spatially incomplete. These residual areas coincide with high agricultural exposure and uneven irrigation access and therefore remained vulnerable after basin-average rainfall improved.
By 2025, low risk dominated western, northern, and central areas, whereas only localized moderate risk persisted in the southeast. The spatial recovery was stronger than in 2020 and reflects simultaneous improvement in rainfall and vegetation conditions. Soil moisture remained more moderate, demonstrating that the components did not recover at identical rates.
Across all benchmark years, central, eastern, and downstream agricultural areas were consistently more drought-prone than western sectors. High agricultural exposure frequently coincided there with limited irrigation and recurrent rainfall deficit. Western areas often benefited from more favorable rainfall, vegetation condition, or localized buffering. These repeated contrasts provide the spatial basis for the hotspot analysis in
Section 3.8.
The ADRI maps demonstrate that basin-scale agricultural drought cannot be represented adequately by rainfall alone; severity reflects interacting climatic, hydrological, ecological, and management conditions. They also reveal that the same rainfall anomaly can produce different outcomes depending on soil-water persistence, vegetation response, irrigation access, and cropland distribution. This capacity to distinguish environmental stress from agricultural vulnerability is the principal decision-support contribution of ADRI and explains why the integrated patterns differ from each individual layer.
3.6. Drought-Risk Area Statistics
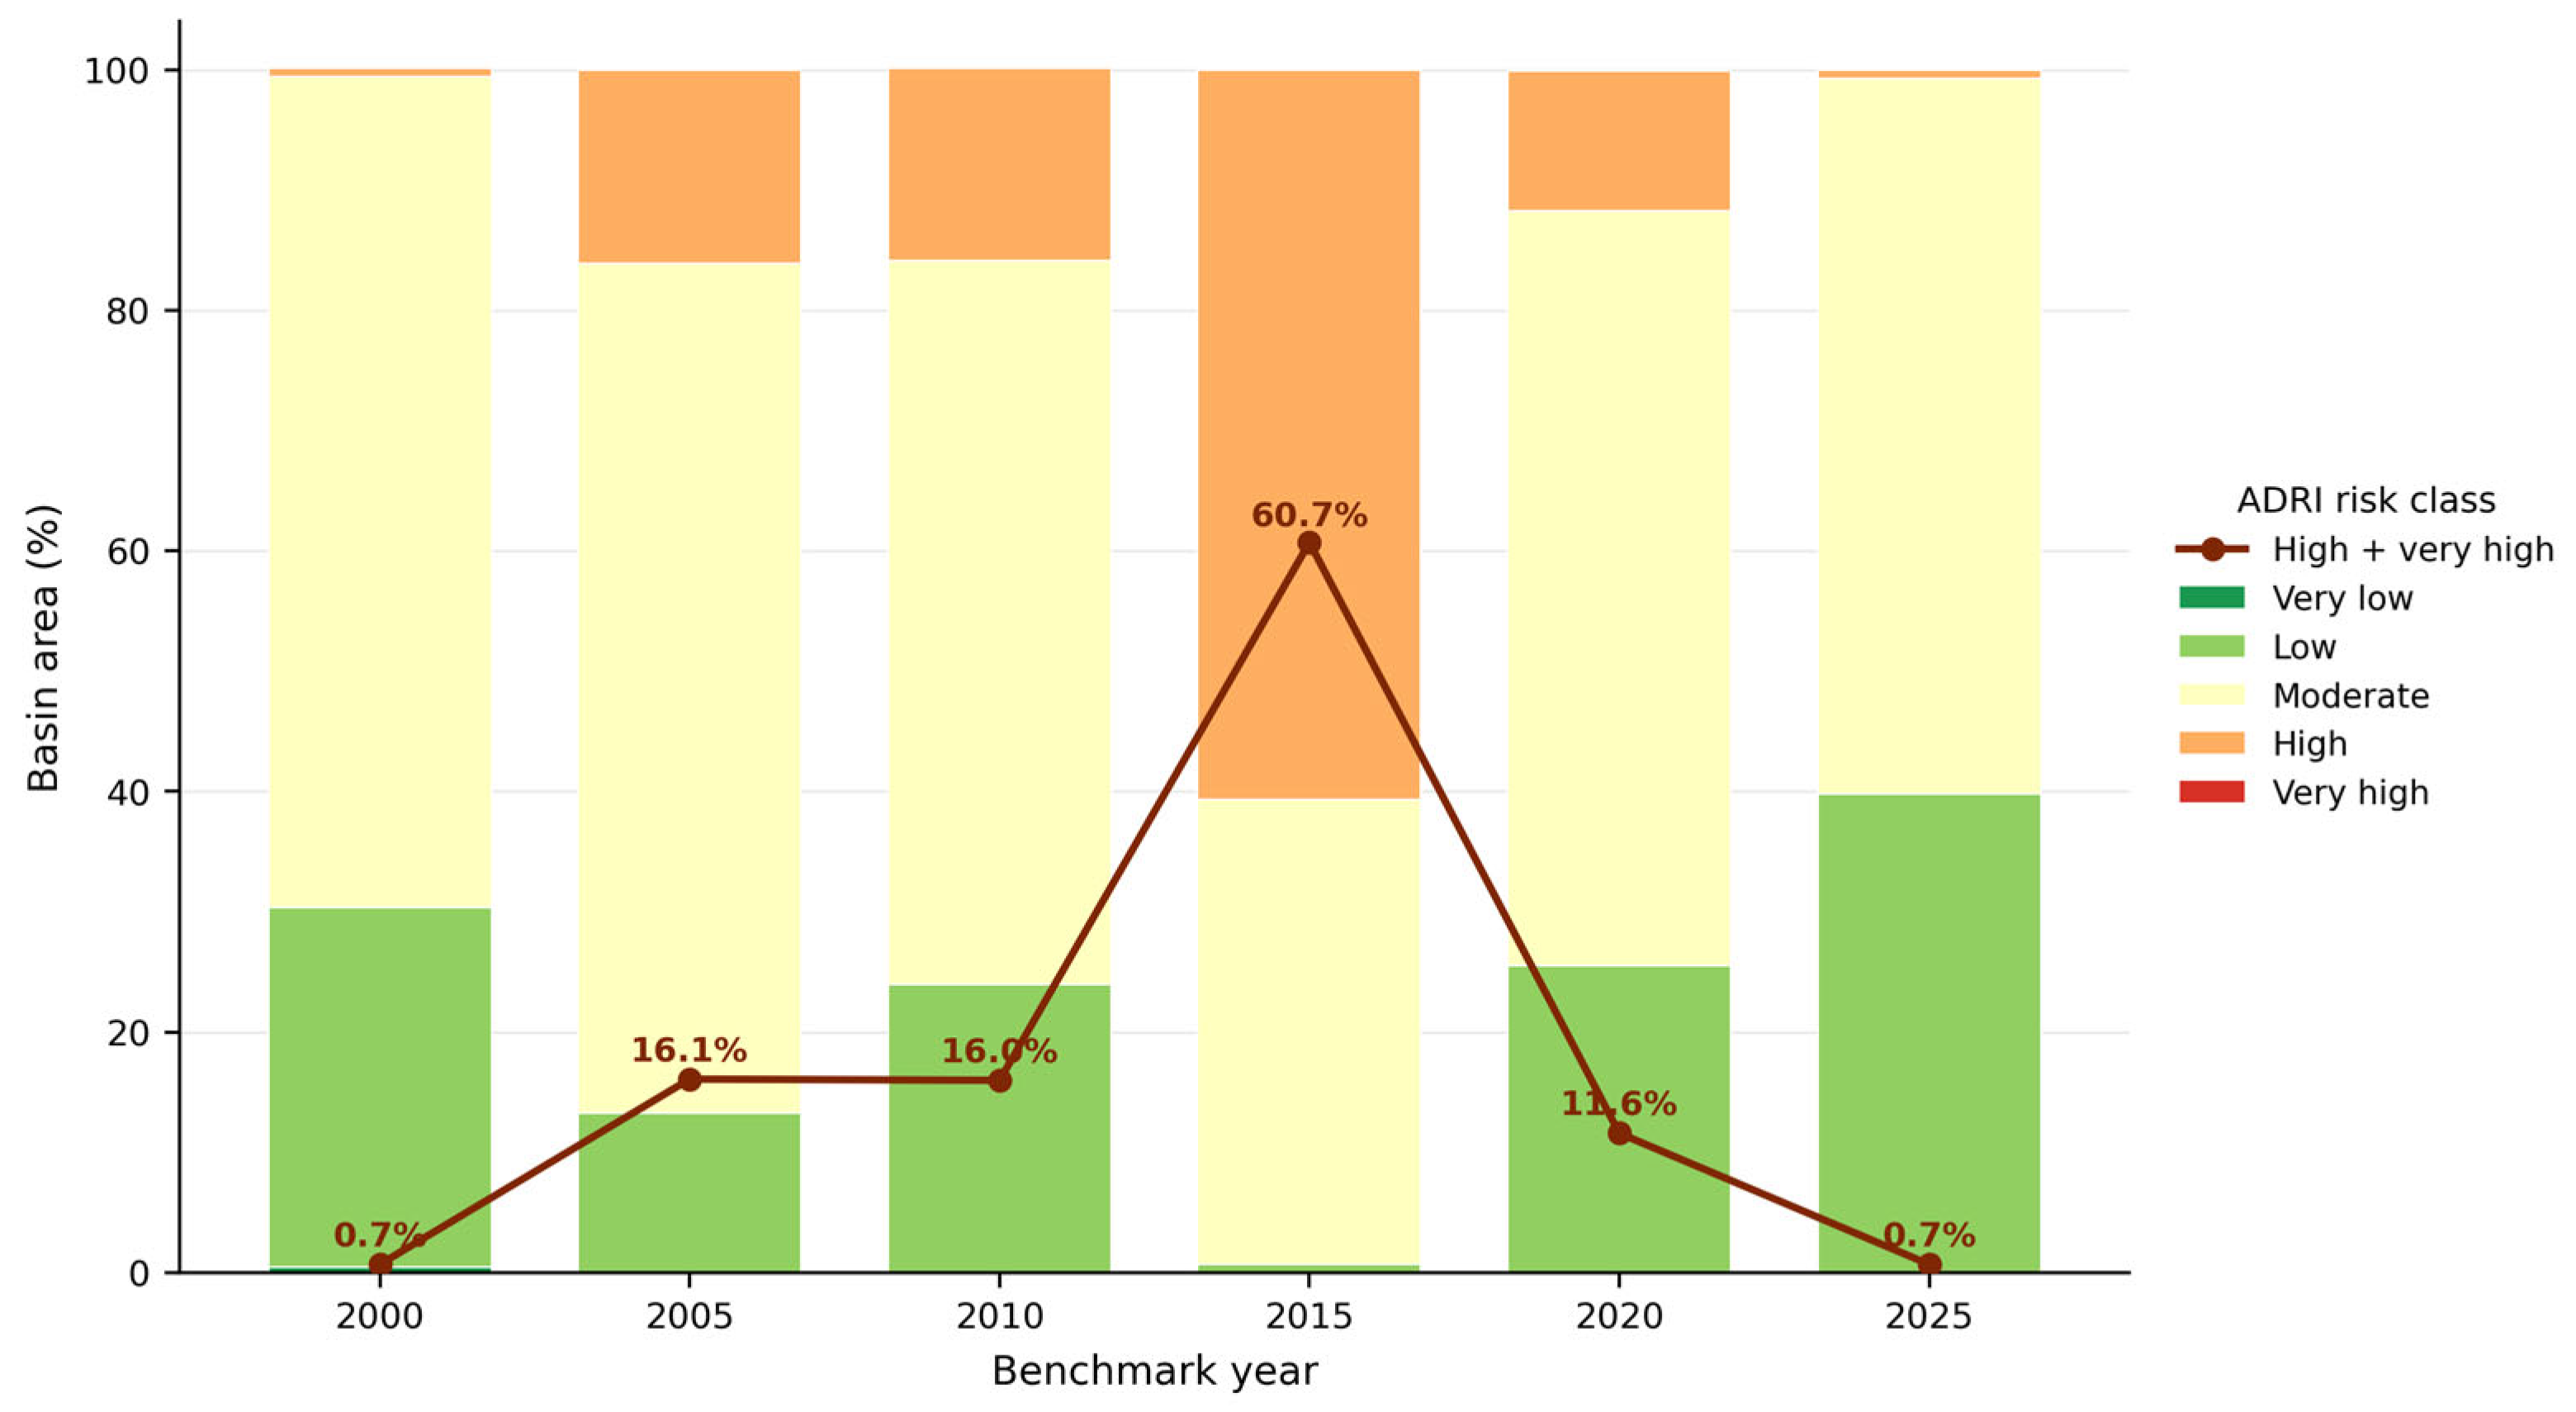
Area statistics confirm the temporal pattern shown in
Figure 7 and
Table 9 and provide a quantitative complement to the maps. Moderate risk was the largest class in five of the six benchmark years; high risk dominated in 2015. Very high risk was absent from the area summaries, whereas low and high classes varied sharply among years. The temporal signal is therefore expressed principally as redistribution around the persistent moderate baseline.
High-risk area increased from 0.7% in 2000 to 16.1% in 2005 and 16.0% in 2010, while low-risk area contracted. This change indicates progressive exposure to hydroclimatic stress during the first decade of the analysis. The similar high-risk percentages in 2005 and 2010 conceal different spatial arrangements, underscoring the need to interpret
Table 9 together with
Figure 6.
In 2000, moderate risk covered 69.0% of the basin, low risk 29.9%, and high risk only 0.7%. The very low class accounted for 0.5%, and no area reached very high risk. This distribution establishes a comparatively favorable baseline in which most agricultural systems remained below the high-risk threshold despite widespread structural exposure.
High-risk coverage rose sharply in 2005 and remained similar in 2010 (16.1% and 16.0%, respectively), while low-risk coverage was 13.3% and 24.0%. Moderate risk accounted for 70.6% in 2005 and 60.1% in 2010. These changes show that moderate vegetation and soil-moisture conditions did not fully offset increasing rainfall and exposure-related stress, but the larger low-risk share in 2010 indicates greater spatial heterogeneity than in 2005.
An abrupt peak occurred in 2015: high risk covered 60.7% and low risk only 0.7%, while moderate risk fell to 38.6%. This was not simply a small upward shift in average ADRI but a basin-wide transition into the high class. The result quantitatively confirms 2015 as the dominant agricultural drought year and demonstrates how multiple component deficits can synchronize during a major regional event.
Following the 2015 peak, low-risk coverage increased to 25.5% in 2020 and 39.8% in 2025, while high risk declined to 11.6% and 0.7%. Moderate risk remained extensive at 62.8% and 59.5%, respectively. The class redistribution demonstrates strong sensitivity to monsoon and vegetation recovery but also shows that widespread structural exposure prevented the basin from becoming predominantly very low risk.
This sequence is broadly consistent with CRB studies based on SPI, SPEI, TVDI, and SDI, which reported substantial spatiotemporal variability, different responses among drought metrics, and marked dry-season drought in 2005 [
15,
16]. ADRI is complementary rather than substitutive: standardized climatic indices characterize anomalies, while ADRI adds soil moisture, irrigation accessibility, and agricultural land exposure to identify where hydroclimatic stress coincides with low buffering capacity. Direct numerical comparison is inappropriate because the studies use different periods, indicators, seasons, and class boundaries, but the agreement in major temporal patterns supports the physical plausibility of the integrated results.
No benchmark year contained extensive very high-risk area. This may indicate that partial soil-water storage, irrigation support in selected command areas, and vegetation resilience limited transition to the highest class even during severe drought. It also reflects the weighted structure and class thresholds: a pixel generally requires simultaneous high scores across several components to exceed 4.20. The absence of Class 5 should therefore not be interpreted as absence of serious impact in 2015.
The ±10% sensitivity analysis did not materially change year rankings, class distributions, or major hotspots. The 2015 maximum and the relative recovery in 2020 and 2025 were preserved, as were the main eastern and downstream drought-prone areas. These results indicate that the principal findings were robust to moderate perturbations of individual weights, although they do not eliminate uncertainty associated with the overall climate-dominant weighting concept.
Together, the results support integrated, spatially explicit drought screening and align with recent GEE-based and multidimensional vulnerability frameworks [
48,
49]. Class-area statistics should be interpreted with the maps because similar basin-wide percentages can conceal different spatial concentrations and therefore different management priorities. The combined evidence identifies not only severe years but also where limited buffering and agricultural exposure repeatedly elevate risk, providing a clearer basis for sub-basin prioritization than a basin-average drought index alone.
3.7. Irrigated–Rainfed ADRI Comparison
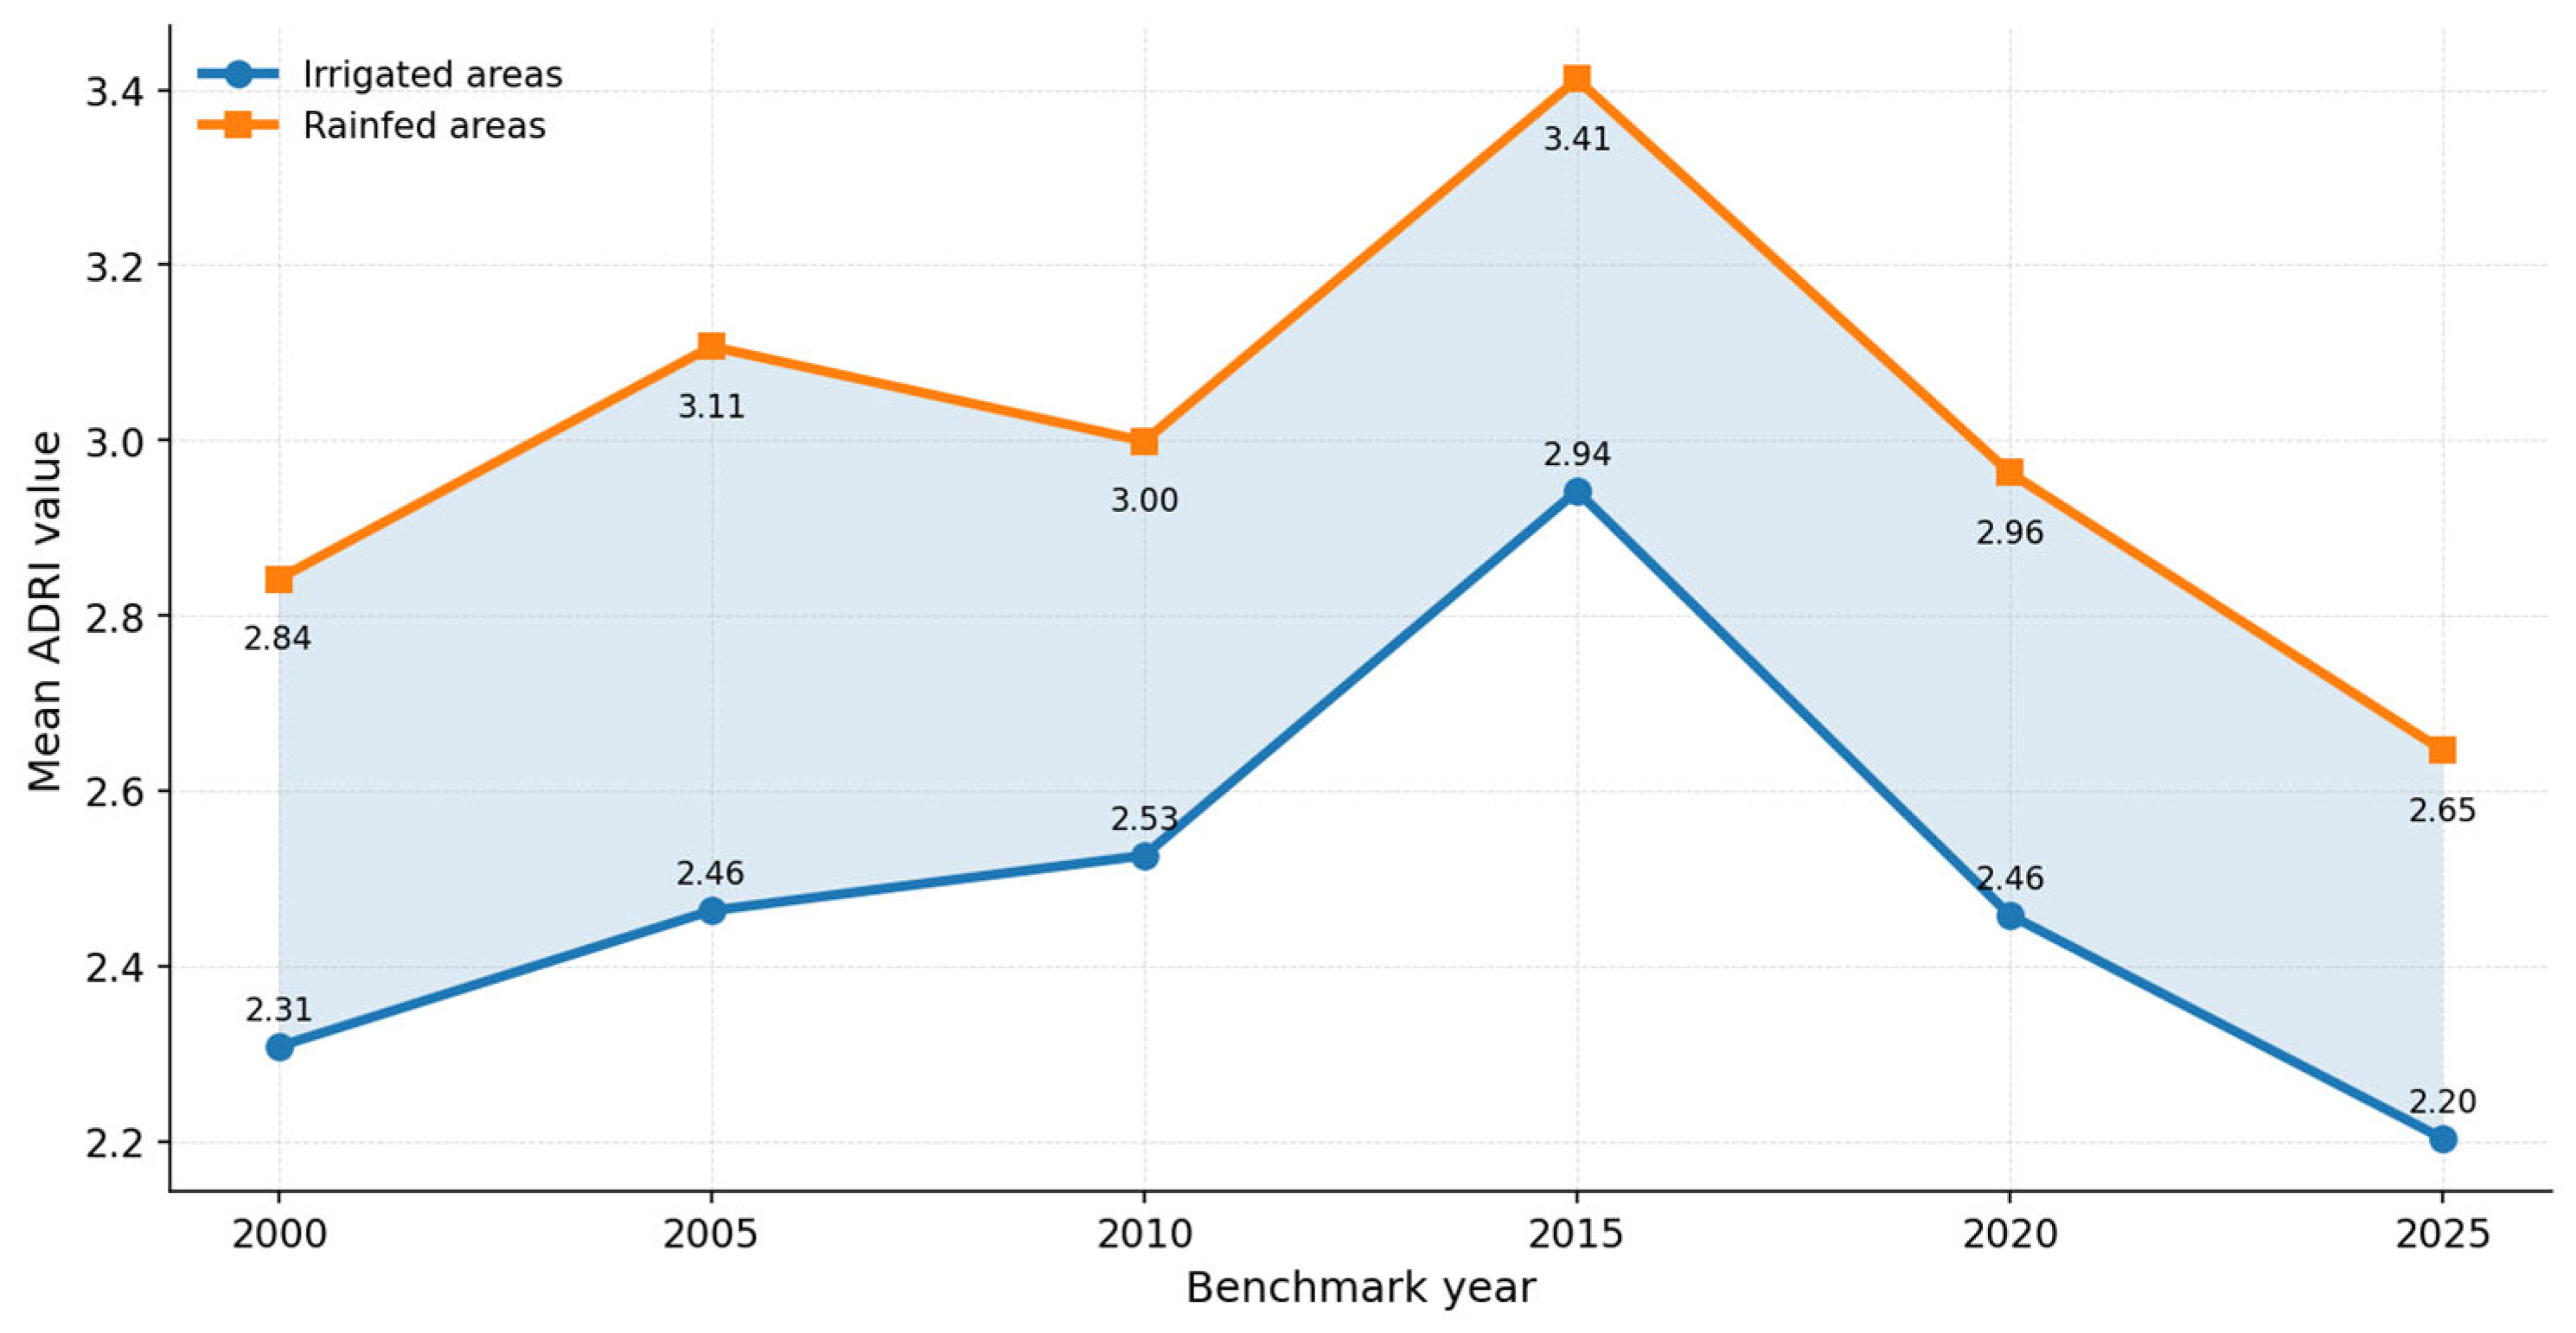
Figure 8 and
Table 10 show that mean ADRI was consistently higher in rainfed than irrigated agriculture. Both systems followed the same temporal pattern—increasing toward 2015 and declining thereafter—but irrigation accessibility reduced risk in every benchmark year. The comparison therefore supports the conceptual role assigned to the irrigation component, while the shared trend confirms that large-scale hydroclimatic forcing affected both systems.
The irrigated–rainfed difference ranged from 0.44 to 0.64 ADRI units. It was 0.53 in 2000 and largest in 2005 (0.64), when mean ADRI was 2.46 in irrigated areas and 3.11 in rainfed areas. The gap remained 0.47 in both 2010 and 2015; during the 2015 peak, means reached 2.94 and 3.41, respectively. Thus, irrigation changed the magnitude of risk more consistently than its temporal direction.
In 2000, mean ADRI was 2.31 in irrigated areas and 2.84 in rainfed areas. Both values remained within the low-to-moderate range, but the 0.53 difference indicates greater rainfall sensitivity outside command areas even during a comparatively favorable year. Structural water access therefore influenced risk before the onset of the most severe events.
The largest difference occurred in 2005 (0.64), when irrigated and rainfed means were 2.46 and 3.11. Irrigation accessibility provided its strongest relative buffering during a year of expanding rainfall and integrated drought risk. The result suggests that managed water access can prevent some areas from crossing from moderate into high relative risk, although actual delivery was not measured.
In 2010, mean ADRI was 2.53 in irrigated and 3.00 in rainfed areas. The persistent 0.47 gap confirms that structural vulnerability in rainfed agriculture was not confined to the most severe drought year. It also corresponds with the integrated map, which showed elevated central and northern risk despite relatively stable vegetation and soil-moisture conditions.
Both systems reached their highest means in 2015, but irrigated areas remained lower (2.94 versus 3.41). The result indicates that irrigation reduced, but could not eliminate, drought severity under strong regional hydroclimatic stress. When precipitation, soil moisture, and exposure simultaneously deteriorate, command-area status alone is insufficient to maintain low risk.
Both systems recovered in 2020 and 2025, but rainfed means remained higher (2.96 versus 2.46 in 2020; 2.65 versus 2.20 in 2025). The smallest difference occurred in 2025 (0.44), when favorable rainfall reduced risk across both systems. Irrigation thus buffered drought without eliminating severe-event exposure. Long-term adaptation must account for spatially heterogeneous irrigation effects [
50], evolving climate and socioeconomic exposure [
51,
52], and trade-offs among irrigated area, efficiency, and water storage [
53]. Together, these studies caution against assuming that irrigation expansion alone guarantees long-term drought resilience.
These findings support targeted irrigation improvement, water storage, drought-resilient cropping, and demand management rather than indiscriminate expansion of command areas. Priority should be given to improving reliability and equitable delivery within existing systems, supplementing vulnerable rainfed areas with decentralized storage or groundwater where sustainable, and aligning crop calendars with seasonal forecasts. Because the input layer represents potential access, field evaluation of water delivery is required before project-level investment decisions.
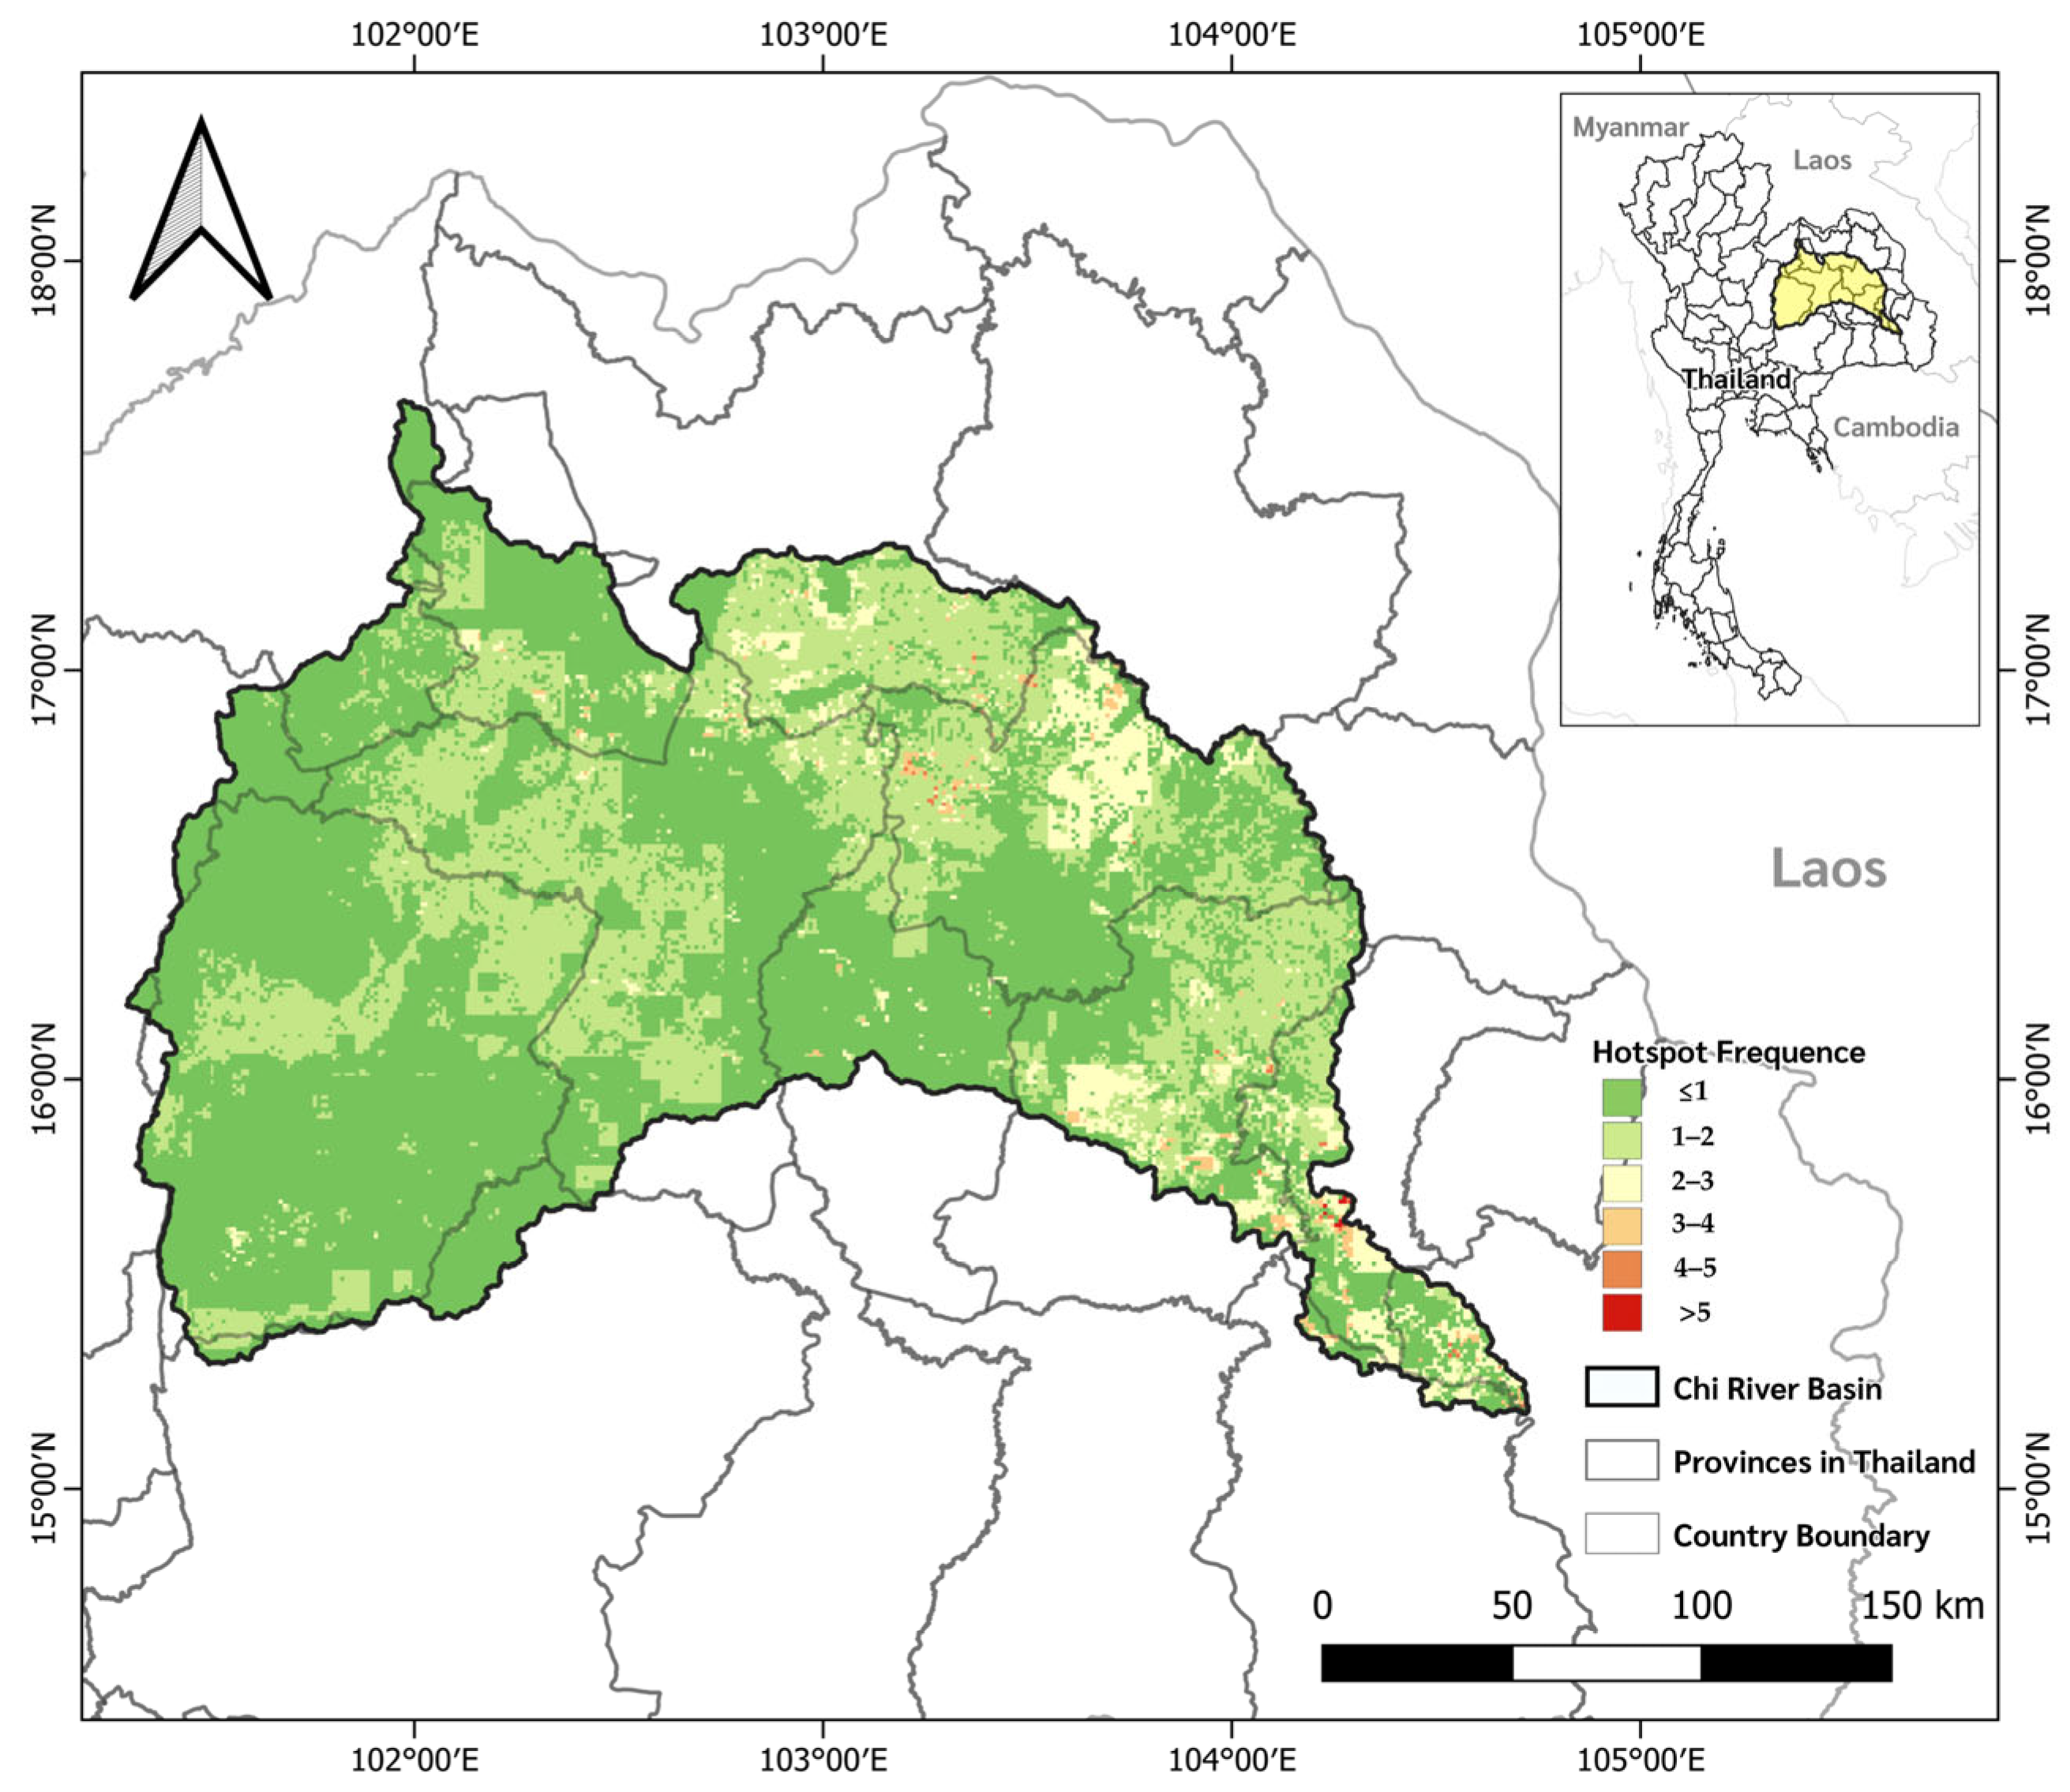
3.8. Persistent Agricultural Drought Hotspot Map
Figure 9 indicates that most of the basin experienced high ADRI only rarely or occasionally across the six benchmark years. Low hotspot-frequency classes dominated western, central, and much of the northern basin. Long-term persistence was therefore localized rather than basin-wide, even though an individual event such as 2015 produced widespread high risk. This distinction is important because event severity and chronic spatial vulnerability require different management responses.
Recurrent and persistent hotspots were concentrated in southeastern and downstream agricultural areas, with smaller moderate-frequency patches in central and eastern sectors. These locations repeatedly combined high agricultural exposure, rainfall sensitivity, and limited irrigation buffering. Their downstream setting may also reflect accumulated water-demand pressure and uneven access to managed supply, although this analysis does not directly model allocation or river-network connectivity.
Because 2015 produced widespread high risk but only selected areas remained recurrent hotspots, adaptation should prioritize these persistent zones for irrigation-service improvement, local storage, crop diversification, and field verification. Hotspot status should be interpreted as repeated relative risk rather than proof of crop loss, and local surveys are needed to distinguish persistent hydroclimatic stress from data or classification effects. Studies in tropical-humid and other data-constrained agricultural regions show that agricultural and meteorological drought can diverge spatially and temporally, supporting explicit hotspot mapping and local follow-up [
54,
55].
3.9. External Spatial Validation of ADRI
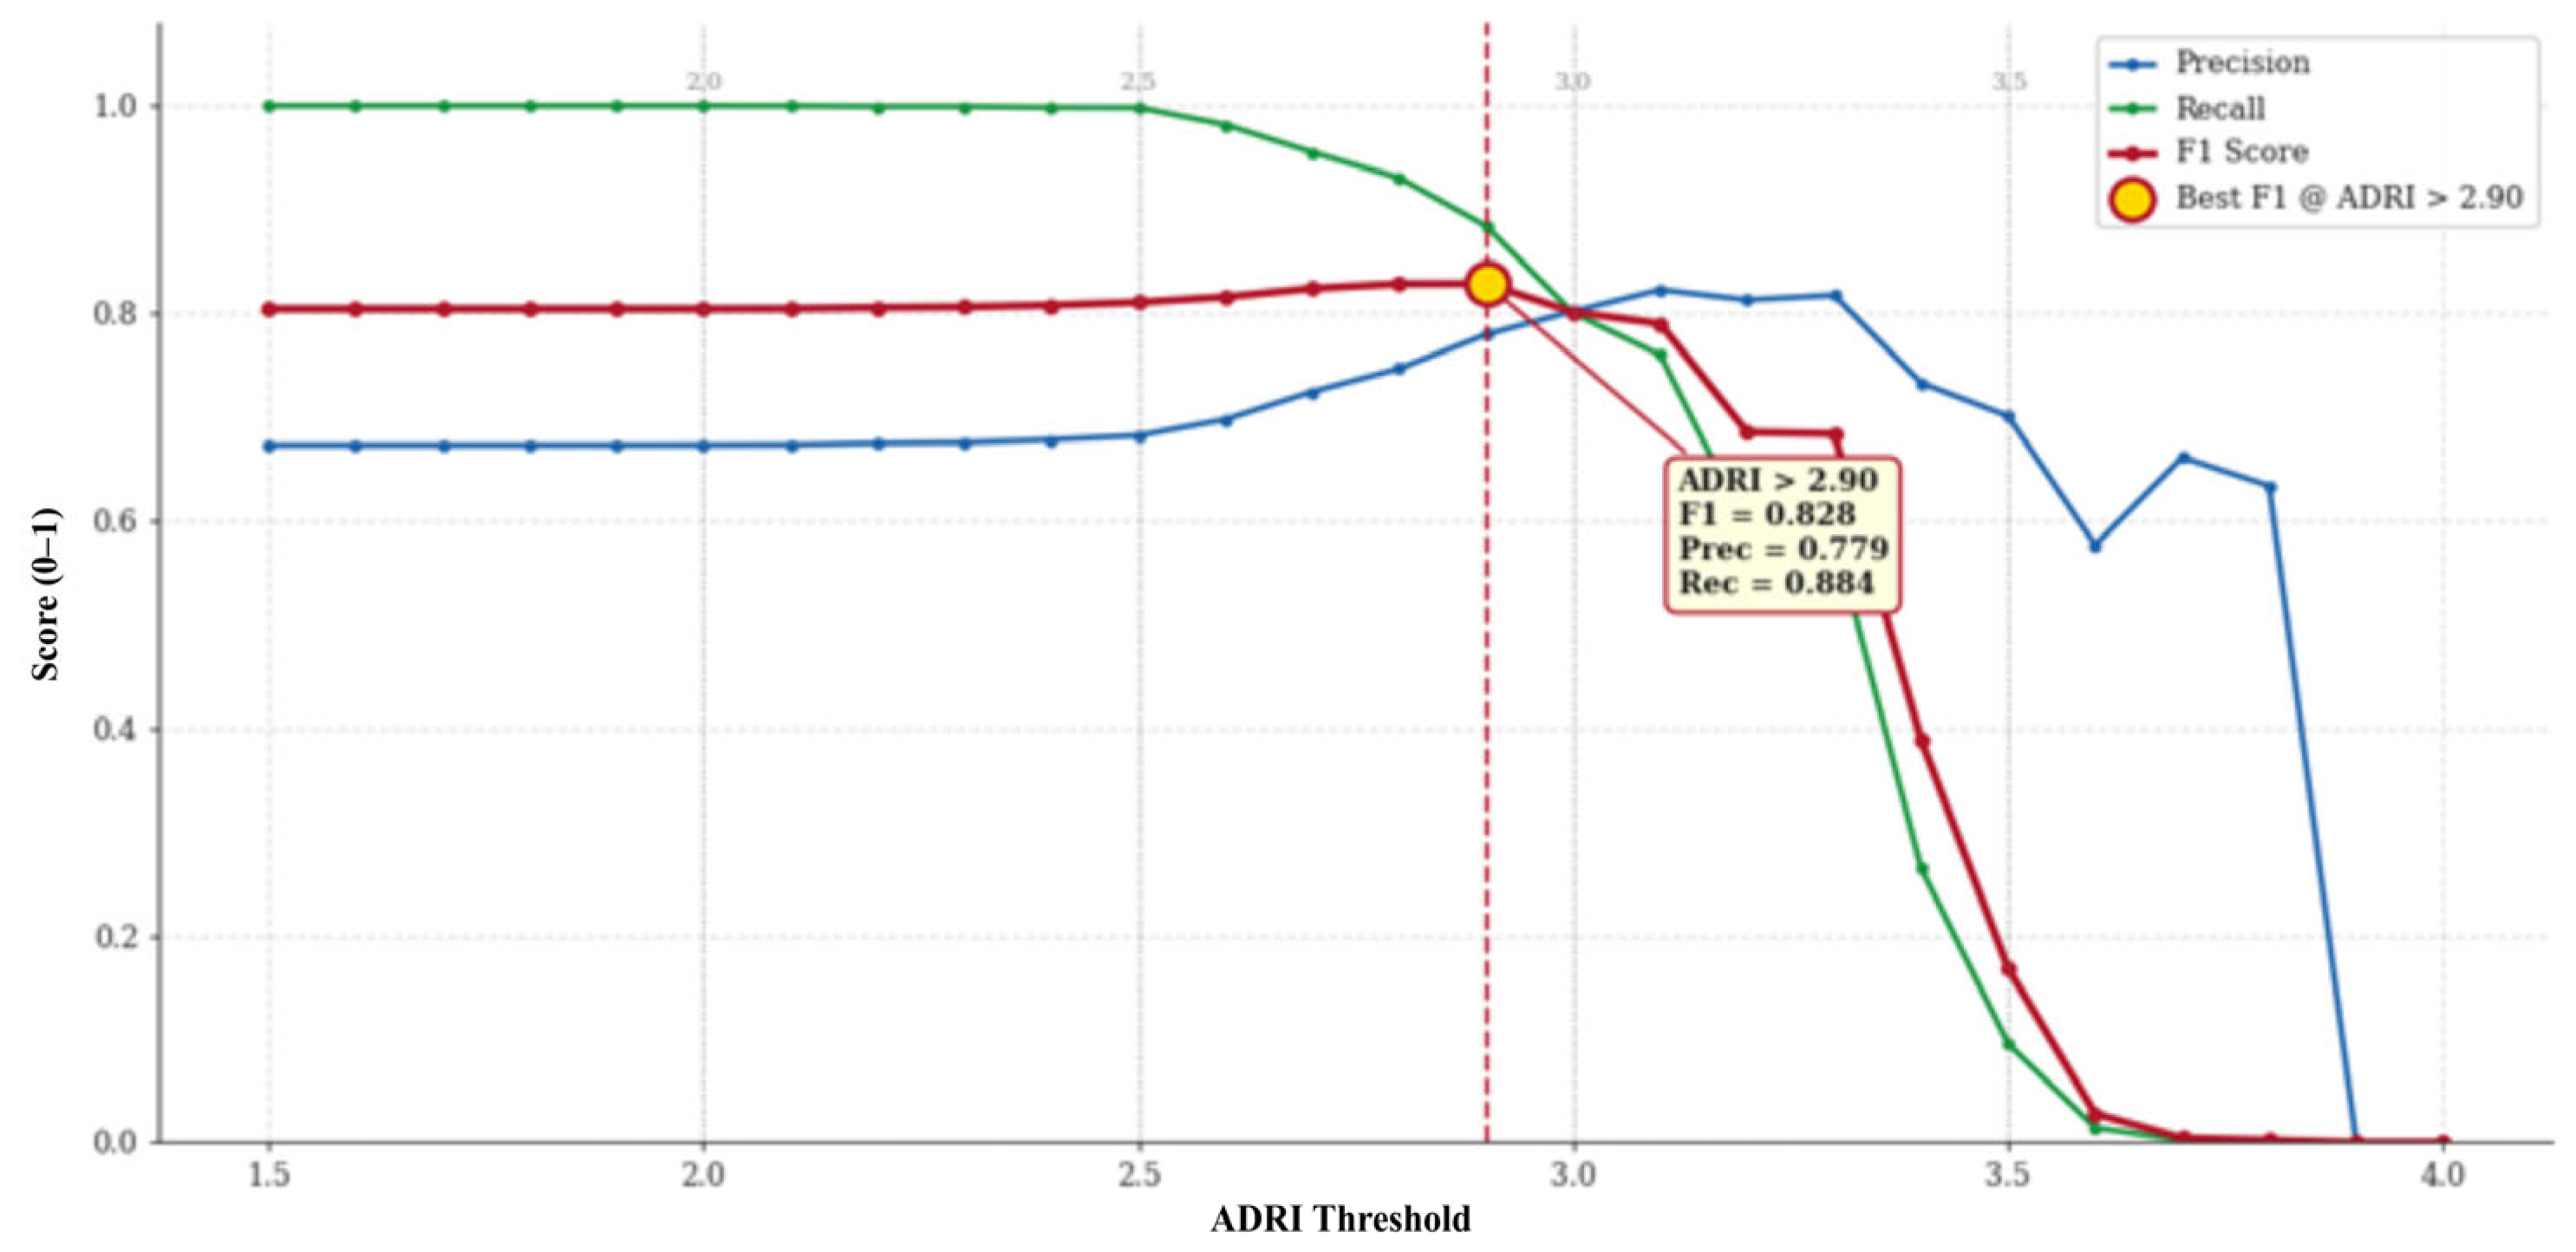
Threshold analysis identified ADRI > 2.90 as optimal for the mean 2015–2020 surface (
Figure 10). At raster level, 30,668 of 39,349 predicted drought pixels overlapped the LDD layer, giving precision 0.779, recall 0.884, and F1 0.828. The 998-point sample produced 598 true positives, 150 false positives, 91 false negatives, and 159 true negatives; precision was 0.799, recall 0.868, specificity 0.515, accuracy 0.759, and F1 0.832. Similar F1 values indicate stable threshold performance across full-raster and sampled evaluations. High recall shows that most reference drought locations were detected, while precision near 0.80 indicates that most ADRI-positive locations agreed with LDD. Moderate specificity reflects additional ADRI-positive areas outside historical LDD polygons. These differences are plausible because ADRI represents combined 2015–2020 hydroclimatic and agricultural conditions, whereas LDD summarizes recurrence over a different period and method. The threshold is therefore useful for basin-scale screening and prioritization but should not be interpreted as a definitive field classification or transferred elsewhere without recalibration.
3.10. Limitations and Future Directions
Several limitations constrain interpretation. First, inputs ranged from 10 m land cover to approximately 11 km ERA5-Land soil moisture. Harmonization to 1 km aligned grids but did not create fine-scale information and may smooth local cropland variability. The apparent pixel size should therefore not be interpreted as a uniform 1 km information resolution, and neighboring pixels may contain strongly correlated soil-moisture information. ADRI is appropriate for basin- and sub-basin screening, not parcel-level decisions or precise farm-boundary delineation.
Second, the binary irrigation risk layer represents potential command-area access, not delivered water, reservoir storage, allocation, conveyance, infrastructure condition, pumping, operating duration, or field-to-canal distance. It may overstate buffering within poorly served command areas and overstate risk where farms outside them use canals, reservoirs, groundwater, ponds, or informal systems. Consequently, the irrigated–rainfed difference should be interpreted as an infrastructure-access contrast rather than a causal estimate of irrigation performance or crop-water sufficiency.
Future versions should use a continuous accessibility index based on distance decay, canal and reservoir density, storage, conveyance capacity, operating period, reliability, and observed delivery. Seasonal reservoir status and canal operation would allow irrigation risk to vary through time instead of remaining structurally fixed. Farm ponds, groundwater abstraction, and informal pumping should also be represented where reliable data are available.
Third, agricultural land exposure was simplified to agricultural versus non-agricultural land and did not distinguish crop type, phenology, water demand, value, farm size, income, or adaptive capacity. An identical hydroclimatic condition can have very different consequences for rice, cassava, sugarcane, or mixed farming systems and for drought occurring at different growth stages. Crop-specific maps and calendars, socioeconomic indicators, insurance or damage records, and production statistics would improve exposure and vulnerability representation.
Fourth, LDD validation measured spatial agreement with a historical reference, not direct field performance. Temporal and definitional differences can generate false positives and negatives, and the 2.90 threshold requires recalibration in other periods or basins. Validation should incorporate field soil moisture, yield anomalies, reported losses, reservoir operations, and district- or provincial-level drought statistics. Independent event-based validation would clarify whether ADRI captures onset and recovery as well as spatial recurrence and whether the same threshold remains appropriate across wet and dry years.
Finally, six benchmark years are snapshots rather than a continuous record and may miss short events or transitions between selected years. Annual or seasonal mapping, crop-stage analysis, and data-driven or participatory weighting would strengthen operational use. The present ±10% sensitivity test indicates that the main conclusions are not weight-dependent under moderate perturbation, but broader structural scenarios, alternative normalization thresholds, and expert-derived weights should be assessed before transfer to other regions. These refinements would also permit uncertainty to be mapped explicitly rather than discussed only qualitatively.