


Abstract
Mediterranean coastal regions are increasingly affected by hydrometeorological hazards associated with high-impact weather events, including cyclones. Between 18 and 21 January 2026, the intense extratropical cyclone Harry affected Sicily, Sardinia, and Calabria, producing severe weather conditions including heavy precipitation, strong winds, and extreme wave activity. This study investigates both the meteo-marine characteristics of the event and its associated damage in Calabria, where the cyclone triggered multiple hazards (wave storms, landslides, flooding, and strong winds). Meteo-marine forcing was characterized using integrated rainfall data, wave parameters, and wind data. In situ observations, radar-derived precipitation estimates, satellite measurements, and model-based reanalysis products were combined to provide a comprehensive evaluation of the event. A georeferenced database of 195 damage records was compiled and classified according to the EU Floods Directive (2007/60/EC), allowing spatial analyses within a GIS framework. Although the cyclone produced exceptional rainfall totals, locally exceeding 580 mm in 90 h, the distribution of impacts reveals the predominance of coastal processes. Wave storm-related damage accounted for 68% of all recorded impacts, mainly affecting transportation and communication infrastructures, tourism facilities, and population. The prevalence of coastal damage appears to be linked not only to the intensity of marine forcing but also to its persistence which locally exceeded the maximum climatological persistence, suggesting that event duration plays a critical role in determining impact severity. Geomorphological analyses indicate that short-term coastal vulnerability is influenced not only by long-term shoreline evolution but also by local topographic characteristics and exposure to marine forcing. These findings contribute to improving risk assessment and mitigation strategies for Mediterranean coastal regions under a changing climate.
1. Introduction
The Mediterranean basin is one of the most cyclogenetically active regions in the world and is widely recognized as a climate change hotspot, where ongoing warming is expected to intensify extreme weather events and increase societal exposure to related hazards [1]. Mediterranean Cyclones (MCs) are predominantly synoptic-scale extratropical systems developing over the Mediterranean Sea through baroclinic processes involving the interaction between warm, moist, low-level air masses and colder upper-level air [2,3]. Their formation is strongly influenced by the complex surrounding orography, including the Alps, the Atlas Mountains, and the Anatolian Plateau, which contributes to the development of preferential cyclogenetic areas such as the Gulf of Genoa, the Atlas region, and the Cyprus area [4,5].
Mediterranean cyclones are frequently associated with high-impact weather conditions, including intense rainfall, flash floods, landslides, strong winds, storm surges, and coastal erosion, often producing compound effects across both inland and coastal environments [6]. Ref. [7] reviewed the current understanding of Mediterranean cyclones, emphasizing unresolved issues related to their dynamics, predictability, and impacts. More recently, ref. [8] examined their socioeconomic consequences, highlighting the severe effects that these systems can exert on public health, infrastructure, transportation, energy systems, agriculture, and cultural heritage throughout the Mediterranean region.
A subset of Mediterranean cyclones may acquire partial or full tropical-like characteristics, including a warm-core structure, organized deep convection, and eye-like features [9,10,11]. These systems, commonly referred to as Medicanes (Mediterranean hurricanes) or Tropical-Like Cyclones (TLCs), represent one of the most hazardous categories of Mediterranean weather systems [12]. Their classification, however, remains debated because many events exhibit hybrid dynamical characteristics intermediate between extratropical and tropical cyclones, often maintaining baroclinic forcing and transitioning between different dynamical regimes throughout their lifecycle [13]. Recent events such as Zorbas in 2018, Ianos in 2020, and Apollo in 2021 have been extensively investigated in this context [7,10]. Among them, Ianos is currently considered the strongest Medicane documented in the Mediterranean basin [14,15] widespread flooding, landslides, and severe infrastructure damage across the Ionian Islands and central Greece [16,17]. A long-term assessment of Medicane-related damage estimated that Italy experiences the highest expected annual losses (~33 million USD yr−1), with Mediterranean islands showing disproportionately high vulnerability relative to their size [18].
Nevertheless, the most destructive Mediterranean weather events are not limited to Medicanes. Intense extratropical cyclones of baroclinic origin, often characterized by strong moisture transport, persistent convection, and hazardous wind and wave conditions, can also produce catastrophic impacts [8]. One of the most dramatic recent examples is Cyclone Daniel (September 2023), an extratropical-origin cyclone that produced torrential rainfall over Libya, causing more than 5000 fatalities and becoming the deadliest Mediterranean cyclone in recorded history [19,20,21].
Several studies have identified sea surface temperature anomalies as one of the factors contributing to the intensification of Mediterranean Cyclones and associated extreme precipitation [21,22]. Climate projections consistently indicate that, although the total number of Mediterranean cyclones may remain stable or decrease, the intensity of the most extreme events is likely to increase under future warming scenarios [23,24,25]. Consequently, the number of people exposed to MC-related hazards is expected to increase across the Mediterranean basin [1].
Increasing risk, however, is not driven solely by climate change. Socioeconomic and demographic trends are also enhancing exposure and vulnerability throughout the Mediterranean region, particularly in the coastal areas. Mediterranean coasts are naturally dynamic environments exposed to hydrometeorological processes, but they have also experienced rapid urbanization, population growth, and the expansion of tourism and economic activities [26]. This progressive concentration of population and infrastructure along coastlines has substantially increased exposure to flooding, wave storm-related impacts, and coastal erosion. As a result, even in the absence of significant changes in hazard frequency, impacts can be intensified because of the increasing exposure and vulnerability. In this context, climate change acts as a risk multiplier, exacerbating existing pressures on densely populated coastal regions [1].
Between 19 and 22 January 2026, the intense extratropical Cyclone Harry affected the central Mediterranean, producing severe impacts in Tunisia and, in Italy, across Sicily, Sardinia, and Calabria. The storm generated heavy and persistent rainfall, strong winds, and extreme wave activity. Wind speeds locally exceeded 100 km h−1, while waves reached 9–10 m along the Ionian and Tyrrhenian coasts. The associated heavy precipitation caused widespread flooding, coastal erosion, and severe damage to infrastructure, including roads, railways, and port facilities. For the three affected regions in Italy, a state of emergency was declared by the Decree of the Presidency of the Council of Ministers (D.P.C.M.) of 26 January 2026. In Calabria, approximately €1.814 million has been allocated to support private property owners and businesses. Despite the severity of the event, no fatalities were reported in Italy, largely due to timely warnings and effective civil protection measures.
This study presents a synoptic overview of Cyclone Harry and focuses on its impacts in the Calabria region. Specifically, the study aims to characterize the spatial distribution of observed damage and to relate it to the associated meteo-marine forcing. Calabria represents a particularly suitable study area because of its central location within the Mediterranean basin and its high exposure to marine and atmospheric hazards. To achieve these objectives, an integrated methodological framework combining spatial datasets with meteorological and marine observations was adopted. The multi-source approach enabled a detailed reconstruction of the spatial variability of the event, providing a comprehensive assessment of its impacts at a regional scale. Understanding the impacts of Mediterranean cyclones is therefore essential to comprehensively assess the interactions between extreme meteo-marine events and coastal systems, providing critical insights to support risk assessment, inform strategic planning, and guide the development of effective mitigation and adaptation strategies across the region.
2. Regional Context
Calabria, located in Southern Italy, occupies a central position in the Mediterranean basin, making it particularly exposed to extreme meteorological events. Its complex geological structure and tectonic history, combined with a highly geomorphological landscape, strongly influence local environmental processes.
The region has approximately 745 km of coastline, consisting of sandy, pebbly, and rocky sectors. Calabria is among the Italian regions most affected by coastal erosion, with 26.2% of its coastline experiencing erosion during the period 2007–2019, representing one of the highest absolute values recorded nationwide [27]. This coastal retreat observed in recent decades is the result of multiple factors, including industrial and tourist development along the coast, reduced sediment supply from rivers and streams, tectonic subsidence, and the intense action of sea storms [28]. To mitigate these impacts, coastal protection measures have been progressively implemented, with approximately 167 km (22.4%) of the coastline currently protected by coastal defense structures [29]. The coastal areas of the region are predominantly occupied by residential settlements, road and railway infrastructures, and productive activities; they also represent the main hub of tourism-related activities, which constitute one of the key drivers of the local economy. Calabria also hosts several marinas along its Tyrrhenian and Ionian coasts, supporting nautical tourism and local economies. Figure 1 illustrates the distribution of tourist accommodation facilities in Calabria—including hotels and other collective accommodations—based on data extracted from the Calabria Open Data Portal [30]. Tourism represents a key economic sector, supported by the region’s natural landscape and cultural heritage. Between 2020 and 2024, most coastal municipalities recorded an increase in tourist arrivals ranging from 0.1% to 3.9% [31].
Figure 1.
(a) Synthetic map of Calabria showing physical-environmental features and location within the Mediterranean basin; (b) Map of Calabria showing tourist receptive accommodations within the coastal municipalities, harbors and coastal line (data extracted and modified from [31]). Touristic activities are classified into 4 types: 1 includes accommodation facilities (such as hotels, small-scale accommodation, tourist residences); 2 includes additional facilities (such as bed and breakfast, hostels, holiday homes); 3 includes outdoor facilities (holiday villages and campsites); 4 includes rural tourist accommodations (country houses, hiking lodges).
Climatically, Calabria is characterized by a typical subtropical Mediterranean regime. Precipitation exhibits strong spatial variability due to orography and its position between the Tyrrhenian and Ionian seas, ranging from less than 500 mm per year along the coasts to over 2000 mm in the mountains. Approximately 70–80% of the annual precipitation falls between October and March, with summer rainfall limited to around 10%. Intense summer storms are more frequent along the Ionian coast than the Tyrrhenian coast [32]. Recent analyses of rainfall trends [33] show decreasing annual rainfall, with seasonal variations: negative trends in winter and positive trends in summer [34]. The temporal distribution of extreme sub-daily rainfall has shifted, with peak values increasingly occurring in September rather than October in recent decades [35].
Calabria’s geological complexity, steep topography, climatic variability, and exposure to both the Tyrrhenian and Ionian seas make it an ideal study area for investigating the interactions between Mediterranean cyclones, extreme meteo-marine events, and associated hazards across coastal and inland environments.
3. Description of the Event
Cyclone Harry was an intense low-pressure system that developed between 17 and 22 January 2026, affecting large areas of the central and western Mediterranean, with particularly significant impacts over the Balearic Islands, northern Tunisia, Malta, southern Italy, and the major islands of Sicily and Sardinia. The storm was officially named on 17 January 2026 by AEMET (Agencia Estatal de Meteorología) [36], the Spanish national meteorological service, within the framework of the European storm naming program coordinated by EUMETNET [37], which aims to improve risk communication and public preparedness for high-impact weather events [38].
The evolution of the event can be divided into an initial formation and organization phase over the western Mediterranean between 17 and 18 January, an intensification and mature phase over the central Mediterranean between 19 and 21 January, and a final phase of gradual weakening and eastward displacement between 21 and 22 January. From a synoptic perspective, Harry can be framed within the context of baroclinic Mediterranean cyclogenesis associated with extratropical cyclones, characterized by surface low-pressure centers and frontal structures sustained by the interaction between relatively warm, moist low-level air masses and colder upper-level air [3]. In this case, however, the presence of a blocking anticyclone over central and eastern Europe slowed the eastward propagation of the system, favoring its persistence over the central Mediterranean and enhancing the duration and intensity of the atmospheric and marine forcing. The event was characterized by widespread and persistent precipitation, intense low-level winds, and severe sea-state conditions along the Ionian and Tyrrhenian sectors of the central Mediterranean, resulting in significant impacts on affected areas, with coastal zones particularly affected.
Synoptic Overview
Cyclone Harry developed within a broad low-pressure area whose core progressively reorganized, giving rise to secondary minima during its evolution over North Africa toward the central Mediterranean and the Strait of Sicily, where the system became quasi-stationary. The first evidence of the system can be identified on 17 January, when a relatively shallow low-pressure minimum was located over the Iberian Peninsula (Figure 2a). The cyclonic area progressively expanded, while the core deepened over the Algeria–Morocco region on 18 January (Figure 2b), inducing a warm and moist southerly flow toward the Strait of Sicily, which further intensified as the system propagated eastward. Between 18 and 19 January, as the system moved toward Tunisia, the depression evolved into a multi-centered configuration, characterized by secondary minima over North Africa, the Balearic Islands, and the Sardinia Channel, consistent with the development of secondary cyclogenesis along the frontal system (Figure 2c). During this phase, the pressure-field configuration generated intense and persistent southeasterly flow over the central Mediterranean, directly impacting the Ionian sectors of Sicily and Calabria. This synoptic configuration persisted through 20 January, when the main low-pressure minimum became established over the Strait of Sicily (Figure 2d). The overall pressure pattern remained nearly stationary until the evening of 21 January (Figure 2e), while the cyclone evolved only slowly before gradually shifting northward. The resulting advection of warm, moist air from the Ionian Sea produced widespread and persistent precipitation over the Ionian sectors of Sicily and Calabria [39,40], with local rainfall accumulations exceeding 200 mm in 24 h. Maximum cumulative rainfall totals reached 488 mm over the period from 19 to 21 January at the Fondachelli station, on the Ionian side of northeastern Sicily, and 583.2 mm at the San Sostene station, on the Ionian slope of the Serre massif, in Calabria, over the period 18–21 January. Significant rainfall was also recorded on the island of Sardinia, largely associated with the prolonged advection of moist air and widespread stratiform precipitation, which produced exceptionally high cumulative values. The largest accumulations were observed in the Ogliastra region, along the eastern coast of the island, where event-total precipitation locally exceeded 500 mm during the 18–21 January period. The event contributed substantially to the exceptional rainfall conditions observed across the island, with January 2026 becoming the wettest January in the regional observational record available since 1961 [41].
Figure 2.
Synoptic-scale evolution of Storm Harry derived from ERA5 reanalysis data. Panels (a–e) show the 850-hPa equivalent potential temperature (shaded), geopotential height (white contours), and horizontal wind field (black vectors) at (a) 16:00 UTC, 17 January; (b) 18:00 UTC, 18 January; (c) 18:00 UTC, 19 January; (d) 18:00 UTC, 20 January; and (e) 12:00 UTC, 21 January. The main low-pressure (L) and high-pressure (H) centers are also indicated.
At the same time, the combination of the intensity and persistence of the wind field and the extended fetch over the southern Mediterranean favored the development of extreme marine conditions along the exposed coastlines. As shown by data from the Rete Ondametrica Nazionale (RON) [42], the Italian national wave buoy network managed by the Italian Institute for Environmental Protection and Research (ISPRA), significant wave heights reached a maximum of 5.3 m approximately 5.2 km offshore of Catania, in eastern Sicily, at 20:00 on 19 January, with a corresponding maximum wave height of 9.8 m. Similar conditions persisted until around 23:00 on 20 January. Over the central Ionian coast of Calabria, approximately 1.2 km offshore of Crotone, the highest values were recorded at 07:00 on 21 January, with a significant wave height of 5.5 m and a maximum wave height of 8.5 m. These observations represent the maximum values in the RON datasets available online [43], although the observational records are relatively short. Specifically, significant wave height data are available from May 2021 at the Crotone buoy, while maximum wave height data are available from December 2024; the Catania buoy dataset starts in November 2024. Exceptional coastal impacts associated with Harry were also reported on the island of Sardinia. The persistent southeasterly wind forcing over a long Mediterranean fetch generated severe sea-state conditions along the southeastern coasts of Sardinia. The highest wave conditions were observed at the Siniscola wave buoy, located along the central eastern coast of the island, where the maximum individual wave height reached 8.8 m [44]. Severe coastal impacts associated with Cyclone Harry were documented on 20 January at Poetto Beach in the Cagliari area of southern Sardinia, a coastline directly exposed to the persistent southeasterly wind and wave forcing. These impacts, including coastal flooding and wave overtopping, are described in detail by Chatzipavlis et al. [45]. Finally, on 21 January, the meteorological structure weakened and lost coherence. Winds over the Ionian Calabria rotated clockwise and became aligned parallel to the coastline (Figure 2e).
Overall, Storm Harry represents a Mediterranean cyclogenesis event characterized by structural reorganization, persistence, and intense atmospheric and marine forcing, which produced severe regional-scale impacts across the central Mediterranean. A recent climate attribution study [46] suggested that although the minimum pressure anomaly associated with Harry was broadly consistent with historical analogs, the spatial structure of the cyclone differed from past events, showing a more pronounced northward extension under a background warming of approximately 1–2 °C. The study further indicated that the intensity of the associated low-level wind field may have been enhanced by anthropogenic climate change. In particular, locally enhanced wind speeds were estimated to be approximately 15% higher than those observed during similar past events.
4. Materials and Methods
In order to assess and characterize the impacts of Cyclone Harry in the Calabria Region, the methodological approach adopted in this study is based on the integrated analysis of meteo-marine forcing, the spatial distribution of the observed damage, and the geomorphological characteristics of the affected coastal sectors associated with the event that occurred between 18 and 21 January 2026. For this purpose, meteo-marine, damage, and geomorphological datasets were collected and analyzed.
4.1. Meteo-Marine Data
The characterization of the meteo-marine forcing includes rainfall data, wave parameters, and wind data. The integration of in situ observations, radar-derived precipitation estimates, satellite measurements, and model-based reanalysis products allowed a comprehensive characterization of the meteo-marine forcing associated with the event. This multi-source dataset enabled the reconstruction of both the spatial variability and temporal evolution of the meteo-marine conditions responsible for the observed impacts, providing a robust framework for linking damage patterns to their driving processes.
4.1.1. Wind Data
Wind speed and direction were retrieved from the ECMWF (European Center for Medium-Range Weather Forecasts) ERA5-Land reanalysis dataset, which provides hourly atmospheric variables on a global 0.1° grid (~9 km) from 1950 onward [47]. ERA5-Land is produced by replaying the land component of the ERA5 climate reanalysis at enhanced spatial resolution, using ERA5 atmospheric forcing fields. ERA5 can be considered a State-of-the-Art reanalysis that assimilates a wide range of heterogeneous observations, including satellite and in situ measurements.
To characterize the wind forcing associated with Cyclone Harry, the maximum hourly wind speed recorded during the event was computed for each grid cell of the ERA5-Land domain covering Calabria, providing a spatial representation of the peak wind conditions. Since ERA5-Land provides atmospheric variables only over land surfaces, the resulting maps describe the spatial distribution of wind intensity exclusively over the regional territory.
Mean wind direction was also evaluated by averaging hourly wind direction values over the entire event duration at each grid cell. The resulting spatial field provides a representation of the dominant wind patterns associated with the cyclone and their orientation relative to the regional topography and coastline. The significance of the observed wind conditions was assessed through a long-term climatological analysis based on the full ERA5-Land archive. For each grid cell, the maximum hourly wind speed values recorded during January over the 1950–2025 period were computed and used as a reference climatology against which event-related values were compared, allowing the relative severity of the storm to be evaluated at a regional scale.
Finally, the persistence of wind forcing during the event was quantified by computing for each grid cell the number of hours during which wind speed exceeded predefined threshold values. To assess whether the observed persistence was exceptional, a climatology of wind persistence was also constructed. For each grid cell, a moving time window having the same duration as Cyclone Harry (4 days) was applied to the hourly January ERA5-Land dataset over the 1950–2025 period. Within each window, the total number of hours during which wind speed exceeded the selected thresholds was calculated, thus obtaining a climatological distribution of persistence values. The persistence observed during Cyclone Harry was then compared with the maximum persistence derived from this climatology, allowing the climatological significance of both the intensity and persistence of the wind forcing to be evaluated consistently.
4.1.2. Wave Data
Wave conditions were characterized using significant and mean wave direction derived from the Copernicus Marine Service Mediterranean multiyear wave reanalysis (MEDSEA_MULTIYEAR_WAV_006_012), which provides hourly wave parameters over the Mediterranean Sea at 1/24° spatial resolution (~4–5 km) from 1985 onward [48]. The dataset is based on a wave model forced by ERA5 [49] wind fields and assimilates satellite-derived observations of significant wave height.
The analysis focused primarily on the significant wave height (Hs), available at hourly temporal resolution. Hs represents the average height of the highest one-third of waves within a given sea state and is widely adopted as a first-order proxy for storm intensity because of its direct relationship with wave energy [50,51]. Owing to its robustness and widespread availability in hindcast and satellite-derived datasets, Hs is commonly used for the characterization of wave climate, storm intensity, and coastal hazard conditions at regional scale [52,53].
To characterize the spatial distribution of marine forcing associated with Cyclone Harry, a regional domain encompassing Calabria and the surrounding sea was selected, and the maximum hourly Hs value recorded during the event was computed for each grid cell. This procedure yields an asynchronous map representing the peak storm conditions reached at each location during the event, allowing the identification of coastal sectors exposed to the highest wave energy. Mean wave direction was additionally evaluated by averaging hourly wave direction values over the event duration at each grid cell within the selected domain. The resulting spatial field provides a representation of the dominant wave approach patterns relative to the coastline during the storm.
To evaluate the significance of the observed wave conditions, a reference climatology was derived from the full reanalysis archive by computing for each grid cell the maximum hourly Hs values recorded during January over the 1985–2025 period. Event-related Hs values were then compared with this long-term reference dataset in order to assess the anomalous character of the storm on a regional scale.
Following the same climatological approach adopted for wind forcing, a climatology of wave persistence was constructed. For each grid cell, a moving time window having the same duration as Cyclone Harry (4 days) was applied with an hourly time step to the January wave reanalysis over the 1985–2025 period. Within each window, the total number of hours during which Hs exceeded predefined threshold values was computed, thus obtaining a climatological distribution of persistence values. The persistence observed during Cyclone Harry was then compared with the maximum persistence derived from this climatology. It should be noted that Hs represents a spatially averaged parameter describing sea-state conditions at the scale of the model grid and therefore does not explicitly resolve local-scale extremes that may occur at smaller spatial scales. Consequently, Hs is interpreted here as a proxy for the intensity of storm-related wave energy rather than as a direct estimate of maximum individual wave heights. Under typical storm conditions, maximum waves can locally reach heights on the order of approximately 1.8 times Hs [54,55].
4.1.3. Rainfall Data
Rainfall data were obtained from ground-based rain gauge stations and complemented with radar-derived precipitation estimates, allowing a more spatially continuous reconstruction of rainfall patterns associated with the event. In more detail, rainfall data were derived from both ground-based rain gauge measurements and radar-based precipitation estimates. In situ observations were provided by the regional rain gauge network operated by the Multi-Risk Functional Center of the Regional Agency for Environmental Protection (ARPACAL), Calabria Region. The network consists of 221 gauges distributed across the territory in a relatively homogeneous manner, with a mean inter-station distance of approximately 10 km, and provides high-frequency (1 min) measurements accessible through the institutional portal [56].
The event report describing Cyclone Harry from a meteorological and climatic standpoint was downloaded from the website of ARPACAL [39]. From this report, data from 221 rainfall stations and the corresponding values of cumulative rainfall recorded during Cyclone Harry over the four consecutive days (18–21 January 2026) were extracted.
Through the “historical data” section of the Multi-Risk Functional Center, the availability of a historical time series of at least 30 years, ending in 2026, was verified for the rain gauges that recorded data during the event, in order to analyze the severity of the event. A total of 87 rain gauge stations with at least 30 years of measurements ending in 2026 were identified as operational during the event. For each station, the following variables were extracted and organized into an Excel database: cumulated event rainfall (E, mm), mean January precipitation (, mm), mean annual precipitation (, mm), and length of the recording period (D, years). The severity of the event was then analyzed qualitatively through the definition of two key indicators .
Radar precipitation estimates were obtained from the Italian national radar mosaic product SRI (Surface Rainfall Intensity), produced by the Department of Civil Protection (DPC) from a network of 26 weather radars (mostly C-band) covering the Italian territory [57]. The Calabria region is mainly observed by the Monte Pettinascura radar (16.618° E, 39.370° N; ~1700 m a.s.l.), with additional coverage in the southern sector provided by the Monte Lauro radar (~980 m a.s.l.), as well as two X-band radars located at the Reggio Calabria and Catania airports. The SRI product is provided on a 1 km × 1 km regular grid with a 10 min temporal resolution and is distributed through the national radar platform [58].
The use of weather radar data provides a substantially improved description of the spatial structure of precipitation compared to rain gauge observations alone, allowing a more detailed representation of rainfall fields over the study area and therefore a more robust interpretation of the rainfall forcing associated with the observed ground impacts.
Despite these advantages, radar-based quantitative precipitation estimates are affected by several sources of uncertainty [59], mainly related to the indirect nature of the measurement. Weather radars estimate rainfall by analyzing the backscattered signal from atmospheric hydrometeors. Well-known sources of error include beam blocking, ground clutter, anomalous propagation, and uncertainties in the reflectivity–rainfall rate relationship [60]. For this reason, radar estimates are commonly combined with rain gauge measurements to reduce systematic biases and improve quantitative accuracy. The literature reports a range of correction strategies [61], including global correction methods such as the Mean Field Bias (MFB), which is uniformly applied over the entire radar domain [62], as well as more advanced techniques based on geostatistics such as kriging [63], and machine learning methods [64]. In simpler approaches, multiplicative local correction factors are computed at gauge locations and subsequently interpolated over the radar domain to derive a spatially distributed correction field [65,66].
A similar strategy is adopted in the present study, where a radar adjustment procedure is implemented based on local correction coefficients computed as the ratio between the observed rainfall accumulation at each gauge and the corresponding radar-estimated accumulation in the grid cell containing the gauge. These coefficients are then interpolated in space using an inverse distance weighting (IDW) scheme to generate a continuous correction field, which is applied to the radar precipitation estimates to obtain a bias-corrected rainfall product. This combined strategy integrates the high spatial resolution of radar observations with the accuracy of in situ measurements, resulting in a more reliable representation of the precipitation field. This is particularly relevant for identifying localized rainfall maxima that may not be captured by the rain gauge network alone and that cannot be recovered through interpolation of point measurements only.
4.2. Damage Data
To collect data concerning damage that occurred during Cyclone Harry, we consulted various sources, including national agencies (such as ANSA—National Associated Press Agency), regional and online newspapers (e.g., Gazzetta del Sud, Il Quotidiano del Sud, Eco dello Ionio). Additionally, we analyzed multimedia material (videos and photos) shared on social media platforms (such as Facebook and Instagram), videos posted on platforms (such as YouTube and Local Team) documenting the event’s impacts.
These sources were critically analyzed to gather data on the damage caused by different triggering phenomena: wave storms, landslides, flooding, urban flooding, and very strong winds. In this study, the term wave storm is used to indicate the occurrence of a severe meteo-marine event associated with the observed coastal damage. In the case of coastal damage, documentary sources generally allow the occurrence of a wave storm and its associated damage to be identified, but do not permit discrimination among the individual coastal processes involved (e.g., storm surge, wave setup, wave run-up, overtopping, coastal inundation, or beach erosion). Therefore, coastal Damage Records were classified according to the occurrence of the wave storm, whereas the individual coastal processes responsible for the observed damage were not distinguished.
First, regional newspapers were collected and analyzed, considering articles published from January 18 until ten days after the event, beyond which no additional information on damage directly attributable to Cyclone Harry was reported.
In parallel, further research was conducted on major social media platforms using specific keywords (e.g., Cyclone Harry, 18–21 January 2026, Calabria, the names of the most affected municipalities, wave storms, coastal erosion, landslides, flooding, urban flooding, very strong winds). This activity allowed us to find additional documentary material, including videos and photographs shared during the event. This material was particularly useful for subsequent georeferencing of damaged areas, as it was often shared in real time. We also consulted additional institutional and information sources, including the official websites of the municipalities where evacuation or safety orders have been issued, the Trenitalia website for updates on rail traffic disruptions, and the Motorionline.it website, which provides real-time updates on traffic conditions on a national scale.
Each source may report multiple damages occurring at the same or different locations, caused by the same or different phenomena. Sources reporting damage not directly associated with the considered triggering phenomena were excluded from the analysis. All collected data were organized in a structured Excel database, where each record represents a Damage Record (DR) associated with a specific triggering phenomenon and a certain site. In some cases, at the same site multiple phenomena may occur, affecting different exposed elements. For example, in a street within a municipality, both wave storm and urban flooding may occur simultaneously; wave storm may damage road infrastructure, while urban flooding may affect commercial activities. Consequently, the database includes two separate DRs referring to the same site, each associated with a specific damage type and triggering phenomenon.
For each DR, we recorded the following fields: damage ID, date of occurrence, site, municipality and province, damage category, damage subcategory, geographic coordinates (WGS84-UTM33N), location accuracy, triggering phenomenon, notes, information source (Table 1).
Table 1.
The architecture of the database summarizes the data fields included for each DR.
Regarding damage classification, the scheme proposed in the FloodCat catalog, developed within the framework of the European Floods Directive [67] on the assessment and management of flood risks, was adopted.
FloodCat classifies damage according to the type of exposed element affected, using a hierarchical structure consisting of damage categories and subcategories. The categories reported are environment; agriculture, livestock farming, fishing, and mining; economic activities (commercial, industrial, artisanal, and construction); touristic and recreational activities; cultural and landscape heritage; buildings and private properties; communication and transportation infrastructures; technological and service infrastructures; hydraulic works; population and human health; and public services and facilities.
Although FloodCat was originally developed for flood events, its damage classification scheme can also be applied to other hydro-meteorological hazards [68,69].
The classification of damage considers both direct and indirect damage. For example, if a tree falls onto the road due to strong winds, blocking traffic, the associated damage can be categorized as “communication and transportation infrastructures”.
The resulting database constitutes a structured inventory of Cyclone Harry damage data and provides the basis for subsequent georeferencing and spatial analysis of impacts.
Each DR was georeferenced using Google Earth and assigned a qualitative indicator of location accuracy, based on two accuracy levels, P0 and P1. P0 indicates a high positional accuracy of the damage, based on detailed data such as street names, obtained from image and video analysis, which allowed for precise georeferencing; P1 indicates a lower positional accuracy.
The georeferenced dataset was subsequently imported into a GIS environment for spatial analysis using the open-source software QGIS (version 3.26.3).
The analysis focused on the spatial distribution of damage according to the different administrative levels (provinces involved), triggering phenomenon, and category and subcategory of damaged elements.
4.3. Coastal Geomorphometric and Geomorphological Data
Coastal geomorphometric characteristics were analyzed to investigate their potential influence on the spatial distribution of storm-related impacts, as local morphological conditions may modulate the response of coastal sectors to extreme events in terms of damage extent and severity.
Coastal morphology was derived from 2 m resolution LiDAR-based digital terrain models (DTMs) provided by the Italian Ministry of Environment and Energy Security (MASE). For each Damage Record associated with wave storm events, elevation and the minimum orthogonal distance to the shoreline were extracted. In addition, local coastal slope was calculated from the DTM as a terrain gradient representative of conditions in the immediate vicinity of each damage location.
These geomorphometric variables were integrated with information from the ISPRA Coastal Portal (updated to 2020) [70] to derive coastline typology, shoreline evolution trends, and the presence of coastal defense structures. The shoreline evolution classification was used to distinguish between stable, erosional, and prograding coastal sectors.
5. Results
5.1. Meteo-Marine Analysis
5.1.1. Wind
Wind forcing during Cyclone Harry was characterized by a persistent southeasterly flow affecting most of the Ionian sector of Calabria (Figure 3a). The mean wind direction during the event was predominantly oriented from southeast to northwest over southern Calabria and along the Ionian coastline, consistent with the synoptic-scale pressure configuration associated with the cyclone. Over northern Calabria, the flow pattern appeared modulated by regional topography, with the wind field partially channeled through the Catanzaro Strait and subsequently deflected around the Sila massif, resulting in a more easterly mean flow over the Sibari Plain.
Figure 3.
(a) Maximum 10 m wind speed (km h−1) (shaded) and mean wind direction (arrows) during Storm Harry (18–21 January 2026) over the Calabria region from ERA5-Land reanalysis; (b) percentage ratio between the event maximum and the climatological January maximum wind speed for 1950–2025. Wind-related ground damage sites identified through post-event documentary analysis are indicated by black dots.
The highest wind speeds were observed over exposed coastal sectors along the Ionian side of Calabria, whereas the most intense peak values were detected along portions of the Tyrrhenian coast, particularly in the area surrounding the Gulf of Sant’Eufemia (Figure 3a). Comparison with the January climatological maxima derived from the ERA5-Land 1950–2025 archive indicates that the event produced anomalously intense wind conditions across large portions of the region (Figure 3b). Over most of the Ionian coastline, event-related wind maxima exceeded 80% of the corresponding climatological January maxima, while localized sectors along the Tyrrhenian coast reached or slightly exceeded the climatological reference values, with peak values locally approaching 105.5% of the climatological January maxima.
The persistence analysis further highlights the prolonged exposure of several sectors of Calabria to intense wind forcing during Cyclone Harry (Figure 4). Persistent wind conditions mainly affected southern Calabria and the Ionian side of the region, whereas inland mountainous sectors and northern Calabria generally experienced substantially lower persistence values (Figure 4a). As progressively higher wind-speed thresholds are considered, the spatial extent of persistent conditions becomes increasingly restricted to the most exposed coastal sectors. In particular, the areas characterized by the longest persistence of intense winds are concentrated along the southern Ionian coastline and along portions of the Tyrrhenian coast surrounding the Gulf of Sant’Eufemia (Figure 4b,c). These sectors largely correspond to those already identified in Figure 3 as exhibiting the highest peak wind intensities.
Figure 4.
Persistence of 10 m wind speed during Storm Harry (18–21 January 2026) over the region surrounding Calabria, based on ERA5-Land reanalysis data. (a–c) Maps showing the spatial distribution of hours with wind speed exceeding 30 km/h, 40 km/h, and 50 km/h, respectively. Points A, B, and C indicate locations for which the temporal evolution of wind speed is shown in panel (d) as examples.
The temporal evolution of wind speed at the three representative locations shown in Figure 4d indicates a coherent regional-scale behavior. Despite local differences in intensity, wind conditions progressively intensified from 18 January until the early hours of 21 January at all sites, followed by a rapid weakening phase. The highest absolute values were recorded at the Tyrrhenian coastal site, where wind speeds locally exceeded the January climatological maximum derived from the ERA5-Land archive. Overall, the similarity among the temporal evolutions suggests that the event was characterized by spatially coherent large-scale forcing over Calabria throughout most of its mature phase.
The climatological significance of wind persistence is illustrated in Figure 5, which shows the ratio between the persistence observed during Cyclone Harry and the maximum persistence obtained from a January climatology (1950–2025) constructed by applying a 4-day moving window with an hourly time step over the entire reanalysis period. For the 30 km h−1 threshold, the Ionian sector of Calabria experienced persistence values that locally matched or exceeded the climatological maximum (Figure 5a), indicating exceptionally prolonged moderate-to-strong wind conditions. At the higher thresholds (40 and 50 km h−1), the largest ratios shifted toward portions of the Tyrrhenian coast, where persistence locally approached or exceeded the climatological maximum (Figure 5b,c), highlighting the exceptional duration of the strongest winds in these sectors.
Figure 5.
Percentage ratio between the persistence of 10 m wind speed observed during Cyclone Harry (18–21 January 2026) and the maximum persistence derived from the January climatology (1950–2025) based on ERA5-Land reanalysis. Panels show wind speeds exceeding (a) 30 km h−1, (b) 40 km h−1, and (c) 50 km h−1. Persistence is expressed as the number of hours above each threshold within a four-day moving time window, consistent with the duration of the event.
5.1.2. Wave
Marine forcing during Cyclone Harry was dominated by a persistent southeasterly wave field impacting the Ionian coast of Calabria (Figure 6a). The mean wave propagation direction remained consistently oriented from southeast to northwest throughout the event, resulting in direct exposure of most of the Ionian coastline to incoming wave energy. Maximum significant wave height (Hs) values displayed a relatively homogeneous spatial distribution along the southern and central Ionian sectors, with peak hourly values approaching 7 m over large portions of the coastline between southern Calabria and the Crotone area. Farther north, localized reductions in wave intensity are observed, likely associated with partial coastal shielding effects related to coastline orientation and regional geometry.
Figure 6.
Regional-scale marine forcing associated with Storm Harry along the Calabrian coasts during 18–21 January 2026, based on Copernicus Marine Service wave reanalysis data. (a) Maximum significant wave height (shaded) recorded during the event, together with the mean wave propagation direction (arrows). Contours indicate significant wave height isolines. (b) Ratio between the event’s maximum significant wave height and the corresponding January climatological maximum for the 1985–2025 period, expressed as a percentage. Coastal impact locations associated with wave action, identified through post-event documentary analysis, are indicated by black dots.
The comparison with the January climatological maxima derived from the Copernicus Marine Service wave reanalysis (1985–2025) highlights the exceptional character of the event over the Ionian sector (Figure 6b). The southern Ionian coastal sectors locally exceeded 120% of the corresponding climatological January maxima, with peak values approaching 130%. A gradual northward decrease in relative intensity can be observed along the Ionian coastline, although wave heights remained close to or above the climatological January maxima across most exposed sectors of the regional coast.
The persistence analysis confirms the prolonged duration of energetic sea-state conditions along the Ionian coast during the mature phase of the cyclone (Figure 7). For all the analyzed Hs thresholds, the areas characterized by the longest persistence correspond to the sectors where the highest wave heights were observed, with durations progressively decreasing northward along the Ionian coastline. The longest persistence values were observed in the southernmost exposed sectors, where storm-wave conditions remained active for several consecutive hours even for the highest thresholds considered.
Figure 7.
Persistence of significant wave height (Hs), based on Copernicus Marine Service wave reanalysis data, during Storm Harry (18–21 January 2026) over the Calabria region. Panels (a–c) show the number of hours during which Hs exceeded 4 m, 5 m, and 6 m, respectively. Points A, B, and C indicate locations for which the hourly evolution of wave conditions is shown in panel (d) as representative examples.
The temporal evolution of Hs at the representative locations shown in Figure 7d reveals a coherent regional-scale evolution of marine forcing during the event. At all analyzed sites, wave conditions progressively intensified from 18 January until reaching peak values during the early hours of 21 January, after which a rapid decay phase occurred. Despite differences in peak intensity, the three time series exhibit a similar temporal evolution, suggesting the persistence of a large-scale and spatially coherent wave-generation mechanism over the Ionian basin throughout the mature phase of Cyclone Harry.
The climatological significance of wave persistence is illustrated in Figure 8, which shows the ratio between the persistence observed during Cyclone Harry and the maximum persistence obtained from a January climatology (1985–2025) constructed by applying a four-day moving window with an hourly time step over the entire wave reanalysis period. For all the analyzed Hs thresholds (4, 5, and 6 m), the Ionian coast of Calabria experienced persistence values that locally exceeded the climatological maximum, confirming the exceptional duration of energetic sea-state conditions during the event. The largest anomalies were observed along the southern Ionian coast, where persistence locally exceeded 140% of the climatological maximum. Even for the highest threshold (Hs ≥ 6 m), extensive sectors of the southern Ionian coastline experienced persistence values well above the climatological reference, locally exceeding 140%.
Figure 8.
Percentage ratio between the persistence of significant wave height (Hs) observed during Cyclone Harry (18–21 January 2026) and the maximum persistence derived from the January Copernicus Marine Service wave climatology (1985–2025), obtained using a 4-day moving window with an hourly time step. Panels show persistence for Hs exceeding (a) 3 m, (b) 4 m, and (c) 5 m.
Complementary information on sea-level variability is also available for the central-southern Ionian coast of Calabria. At Roccella Ionica, located along this coastal sector, one of the sea-level monitoring stations contributing to the Italian Tsunami Warning System (SiAM, Sistema di Allertamento nazionale per i Maremoti), observations are available through the TAD Server (Tsunami Alert Device), the web platform providing access to real-time and archived sea-level measurements [https://tsunami.isprambiente.it/TAD_Server/, accessed on 20 July 2026]. The storm surge can be estimated by subtracting the predicted tidal component from the measured sea level. During Cyclone Harry, the estimated storm surge reached a peak of just over 0.5 m in the early morning of 21 January (around 04:00 UTC). Although representing a single-point measurement, this observation provides an independent estimate of the local sea-level response associated with Cyclone Harry in one of the coastal sectors most severely affected by wave-storm impacts.
5.1.3. Rainfall
Rainfall data available on the website of the Calabria region’s Multi-Risk Functional Center highlight the extraordinary characteristics of the event. Considering the 221 rain gauges active on the date of cyclone occurrence, the maximum recorded cumulative rainfall values exceed 500 mm. Specifically, the San Sostene Alaco station (CZ) recorded 583.2 mm, and the Stilo station (RC) recorded 531.3 mm, both in about 90 h.
As mentioned in Section 4.1.3, for each rain gauge station, the indicators were calculated. Concerning the values of both indicators, 15 classes were defined as reported in Table 2.
Table 2.
Rainfall event severity classes based on a combination of both indicators.
Starting from the 87 rain gauge stations, with at least 30 years of measurements ending in 2026 and operational during the event, we excluded 26 rain gauges for which resulted ≤25, since such values were considered insufficient to adequately represent event severity.
The first indicator is coded with different colors (light green, green, yellow, orange, red), while the indicator is symbolized with different dimensions. Figure 9 shows also a cumulated rainfall event based on radar data and damage related to phenomena (urban flooding, flood, landslide) triggered directly by rainfall. It does not show empty classes of severity: 2, 3, 6, 7, 9, 10, 13, 14 (see Table 2). The table shows that, out of 87 rain gauges, 30% (26) fall into severity class 11, indicating that the rainfall recorded during the event ranged from 100% to 150% of the average monthly rainfall for January, and corresponds to a cumulative value between 10% and 20% of the average annual rainfall. The highest severity class (15), although based on a small number of rain gauges (4 out of 87), highlights that the southern part of Calabria was particularly affected by the most intense and severe rainfall, as the event rainfall exceeded 150% of the average January rainfall and more than 20% of the average annual rainfall. For the two rain gauges (San Sostene Alaco (CZ) and Stilo (RC)) that recorded the highest cumulative rainfall values for the event, it was not possible to determine the severity class due to a lack of historical data.
Figure 9.
Rainfall severity classes (see Table 2) for rain gauge stations. Triangles represent phenomena triggered by rainfall (landslides, floods and urban flooding) on the radar cumulative rainfall map.
The use of a locally calibrated radar rainfall product additionally allowed the reconstruction of the spatial rainfall field, highlighting localized precipitation maxima not directly sampled by the rain gauge network and suggesting that peak event accumulations may have exceeded the measured station values.
5.2. Damage Analysis
Damage data collected were organized into a database of 195 DRs, of which 132 were associated with wave storms, 26 with landslides, 21 with wind, 14 with urban flooding, and 2 with floods (Figure 10a).
Figure 10.
(a) Location of DRs by phenomenon; (b) Distribution of DRs by category.
The spatial distribution analysis shows that most damage occurred in Reggio Calabria province (41.5%), followed by Catanzaro (30.3%), Cosenza (14.4%), and Crotone (11.3%). The province of Vibo Valentia was affected by a low number of damages, accounting for 2.6% of the total cases.
Wave storms represent the main triggering phenomenon in most provinces. In particular, in Crotone and Catanzaro provinces, over 80% of the damage was caused by wave storms, while in Reggio Calabria province, they caused over 70% of the damage. The province of Cosenza shows a lower percentage of damage caused by wave storms (25%), while a significant proportion is caused by landslides (32.1%), urban flooding (25%), and wind (17.9%).
Table 3 summarizes the distribution of damage records by triggering phenomenon across the provinces.
Table 3.
Distribution of damage records by triggering phenomena across the provinces. The percentages are calculated row-wise for each province and express the number of damage records associated with a specific triggering phenomenon compared to the total number of damage records recorded in the same province. Therefore, percentage values are not reported for the total row.
The analysis of damage distribution by category (Figure 10b), according to the FloodCat catalog, highlights that the “communication and transportation infrastructures” category represents the most affected one, accounting for 47% of cases. Impacts on population and human health were recorded in 13% of cases, followed by damage to touristic and recreational activities (11%) and environment (11%). The other hit categories by Cyclone Harry in Calabria are present in the database with a percentage lower than 10%. For each category of damage, the hardest hit province was Reggio Calabria, except for “economic activities” category, for which most of the damage occurred in the province of Catanzaro.
Communication and transport infrastructures were damaged in almost half of the cases by wave storms (48.9%), followed by landslides (20.7%), wind (17.4%), urban flooding (10.9%), and floods (2.2%). The “population and human health” category was affected by wave storms in 85.2% of cases, while the remainder was affected by landslides. Touristic and recreational activities were affected exclusively by wave storms, whilst the environment was affected almost exclusively by wave storms (95.2%) and the remainder by urban flooding. Finally, 68.8% of buildings and private properties were affected by wave storms, 12.5% by both landslides and urban flooding, and 6.3% by wind. The distribution of damage categories by triggering phenomenon is shown in Figure 11.
Figure 11.
Damage categories by type of phenomenon.
A more detailed analysis of the damage subcategories provides further information on the specific elements affected.
Regarding damage to communication and transportation infrastructures (92 DRs), the most affected subcategory was municipal roads (53.3%), followed by national roads (16.3%), and provincial roads (13%). Concerning direct damage to population (27 DRs), 18 cases involved evacuations, the majority of which (66%) were ordered as a prevention measure. Damage to touristic activities mainly involved the beach establishments (76.2%), triggered in all cases by wave storms, mainly located in Reggio Calabria and Catanzaro provinces. The removal of debris carried by the sea or rivers is the only subcategory related to environmental damage. Damage included in the “buildings and private properties” category primarily involves residential buildings and private vehicles.
Representative examples of the observed damage are reported in Figure 12.
Figure 12.
Representative examples of damage caused by Cyclone Harry in Calabria: (a) wave storm impacts with debris deposition along the seafront in Siderno (photo by F.M.); (b) landslide affecting the road network in Antonimina (RC) (Source: Gazzetta del Sud); (c) wave storm impact in Catanzaro (Source: Gazzetta del Sud); (d) wind-related damage in Catanzaro (Source: Gazzetta del Sud).
5.3. Coastal Geomorphometric and Geomorphological Analysis
The analysis focused exclusively on wave storm-related damage, for a total of 132 records. Of these, 5 records were excluded due to lack of LiDAR coverage, resulting in a final dataset of 127 Damage Records.
The integration of LiDAR data with information from the ISPRA Coastal Portal allowed the characterization of the geomorphological setting of wave storm-affected sites in terms of coastal typology, shoreline evolution trends, the presence of coastal defense structures and port infrastructures, and morphometric parameters such as elevation, shoreline distance, and local slope.
All DRs occurred along low-elevation sandy coasts, confirming the high vulnerability of these environments to extreme marine events. Damages are almost evenly distributed between stable (39%) and eroding (37%) coastlines, with a lower proportion on prograding sectors (24%). Elevation values are strongly clustered within the 3–5 m a.s.l. range, further confirming the exposure of low-lying coastal areas to marine flooding and wave impact.
Morphometric parameters show marked spatial variability, with shoreline distance ranging from 15.4 m to 732 m and local slopes ranging from 0.2° to 12.5°. The correlation analysis between these variables (Figure 13) reveals a significant inverse relationship, indicating that sites closer to the shoreline generally exhibit steeper slopes (R2 = 0.52 according to a logarithmic fit, highlighting the role of coastal proximity in controlling site-scale geomorphological conditions.
Figure 13.
Relationship between coastal proximity and coastal profile slope.
Anthropogenic features are also prominent in the study area, including commercial and tourist ports with their associated infrastructures and coastal defense structures, which locally modify the natural geomorphological configuration. Only 10% of the DRs are associated with nearby coastal defense structures, whereas nearly half of the port areas and related infrastructures along the Calabrian coast were affected by wave storm-related damage.
6. Discussion
Between 18 and 21 January 2026, the intense extratropical Cyclone Harry, characterized by the simultaneous occurrence of persistent strong winds, exceptional wave conditions, and intense rainfall, generated a complex multiple hazard scenario across the Calabria region. The event produced extraordinary precipitation totals, with cumulative rainfall exceeding 580 mm at San Sostene Alaco (CZ) and 530 mm at Stilo (RC) in approximately 90 h. These values rank among the highest recorded during recent severe weather events in Calabria [71]. The exceptional character of the rainfall is further confirmed by the analysis of the severity classes identified based on the two defined indicators, which take into account the cumulative rainfall relative to the average monthly and average annual rainfall. Of the 87 rain gauges analyzed, 35% recorded a cumulative rainfall for the event ranging from 100% to 215% of the average monthly rainfall for January, and from 10% to 36% of the average annual rainfall, both calculated over at least 30 years. Despite the severity of the rainfall event, more than two-thirds of the documented damage was associated with wave storms. These findings suggest that marine forcing played a more important role than rainfall in determining the spatial distribution of damage across the Calabria region. Similar patterns have been reported for other Mediterranean cyclones, where coastal sectors experienced the most severe impacts associated with wave storms, wave action, and coastal flooding despite the concurrent occurrence of extreme rainfall inland [16].
The predominance of coastal impacts during Cyclone Harry appears to be related not only to the intensity of marine forcing, but also to its persistence throughout the event. Because the damage inventory was reconstructed from documentary sources, the present analysis focuses on the relationship between the meteo-marine conditions associated with the wave storm, particularly the intensity and persistence of wave conditions, and the spatial distribution of the observed coastal damage. Therefore, the analysis does not attempt to attribute each Damage Record to a specific coastal hydrodynamic process, such as storm surge, wave runup, overtopping, coastal inundation, or beach erosion. Future studies combining the present damage inventory with site-specific hydrodynamic modeling could help quantify the relative contribution of these individual coastal processes to the observed coastal impacts. The sectors characterized by the highest damage concentration, particularly along the Ionian coasts of the Reggio Calabria, Catanzaro, and Crotone provinces, largely coincide with those experiencing the longest duration of intense wind and wave conditions. In particular, the southern Ionian coast was exposed to energetic sea states for several consecutive hours, even at the highest wave-height thresholds considered. Prolonged exposure likely increased the cumulative effects of wave attack, promoting beach erosion, repeated overtopping episodes, and progressive damage to coastal infrastructures. These findings, together with the climatological analysis showing that the persistence of both wind and wave forcing locally exceeded previously observed maxima, suggest that persistence may represent an important indicator of potential impact during Mediterranean cyclones and, in some circumstances, may provide a better explanation of damage patterns than peak intensity alone [7,72].
The predominance of wave storm-related damage during Cyclone Harry reflects the combined influence of the temporal and directional characteristics of the meteo-marine forcing. Throughout the event, both wind and wave fields were dominated by a persistent southeasterly component. The resulting wave conditions generated prolonged exposure of the Ionian coastline to incoming wave energy, with significant wave heights locally reaching values close to 7 m and exceeding the January climatological maxima (1985–2025) over large portions of the coast. In the southern Ionian coastal sectors, significant wave height locally exceeded 120% of the corresponding climatological January maxima, with peak values approaching 130%. The climatological persistence analysis further shows that, over large sectors of the Ionian coast, the duration of energetic sea-state conditions also exceeded the maximum persistence observed in the climatological record, confirming that Cyclone Harry was exceptional not only in terms of wave intensity but also in terms of the persistence of the marine forcing. Consequently, the highest concentrations of damage were observed in the provinces of Reggio Calabria, Catanzaro, and Crotone, which together account for more than 80% of the documented impacts and correspond to the coastal sectors most directly exposed to southeasterly wave propagation. It is worth noting that, although wave anomalies were evaluated relative to the January climatological maxima in order to account for seasonality, the significant wave heights observed during Cyclone Harry locally corresponded to the highest values of the entire MEDSEA reanalysis record. In particular, along much of the southern Ionian coast of Calabria, the event-related Hs values represent absolute maxima within the full 40-year archive. This finding indicates that the event was exceptional not only in a seasonal context but also with respect to the complete multi-decadal record.
The wave propagation direction, predominantly oriented from southeast to northwest, and the distribution of impacts, concentrated mainly in the southern Ionian coastal sectors, highlight the fundamental role of coastline orientation in modulating local vulnerability, particularly in Mediterranean storm events where wave directionality and coastal exposure are key factors in shaping spatial impact patterns [7,73].
The geomorphological coastal analysis provides additional insight into the factors controlling coastal vulnerability. All wave storm-related damage occurred along sandy coastal environments characterized by low elevations. Most affected sites were located between 3 and 5 m a.s.l., confirming the high susceptibility of this coastal sector to wave impacts. Interestingly, damage was almost equally distributed between stable (39%) and eroding (37%) coastlines. This result suggests that short-term storm vulnerability is controlled not only by long-term shoreline trends but also by local topographic characteristics, particularly low elevation and direct physical exposure to marine forcing. In this context, physical exposure to wave forcing due to coastal orientation appears to be as important as the shoreline evolution trend in determining wave storm impacts during extreme events in Calabria.
The distribution of damage among categories further emphasizes the role of coastal exposure settings in controlling impact patterns. Nearly half of all damage records involved communication and transportation infrastructures, with municipal roads representing the most affected subcategory. This pattern reflects a well-known characteristic of Calabria, where major transport infrastructure frequently develops within narrow coastal plains and often runs very close to the shoreline. Consequently, even moderate shoreline retreats, wave overtopping, or coastal flooding can disrupt mobility and accessibility. The high proportion of damaged communication and transportation infrastructure observed during Cyclone Harry therefore highlights the specific vulnerability of linear infrastructure located in exposed coastal zones during extreme marine events, as widely documented in coastal flood impact studies [8,74]. Another category of damage that warrants attention is Environment, relating to the removal of debris and mud. Although it represents a relatively small percentage of the total recorded damage, this category has a significant economic impact and therefore requires careful consideration.
Tourism was also significantly affected. The concentration of damaged beach establishments along the Ionian coast, particularly in the provinces of Reggio Calabria and Catanzaro, highlights the vulnerability of Calabria’s coastal tourism activities to extreme marine events and the potential for increasing economic losses under future storm intensification. These findings are consistent with growing evidence that coastal tourism infrastructures are highly vulnerable to wave storms, coastal flooding, and other marine hazards [1,75]. In the Mediterranean region, cyclone-related compound hazards may further increase risks for tourism-dependent coastal communities [73]. Commercial and tourist ports and related infrastructures were also impacted. Nearly half of the port areas along the Calabrian coast experienced wave storm-related effects, highlighting their exposure to prolonged storm-wave conditions during Cyclone Harry. This finding is particularly relevant given the key role of port facilities in regional coastal systems [76].
Despite the occurrence of local exceptional wind speeds, direct wind-related damage accounted for only a limited fraction of the total impacts. Wind therefore appears to have acted primarily as the atmospheric driver of the marine response rather than as a direct source of damage. The localized wind maxima observed along the Tyrrhenian sector, particularly around the Gulf of Sant’Eufemia, likely reflect regional-scale modulation of the persistent southeasterly flow by the Calabrian topography, including channeling effects across the Catanzaro Strait and localized flow acceleration along the lee side of the main relief systems.
Finally, despite the severity of the event, no fatalities were recorded in the affected areas, while impacts on population mainly consisted of evacuations, including preventive ones, highlighting the role of civil protection actions and early warning procedures.
Limitations of Damage Data Sources
To collect data on damage, various information sources were used (national agencies, regional, online newspapers, multimedia material on social media platforms), which by their nature are characterized by a degree of incompleteness and uncertainty. This may represent a limitation of the database with respect to the completeness of the estimated damage that occurred across the entire regional territory during Cyclone Harry. Although post-event field surveys would provide a more direct and detailed assessment of local impacts, such surveys were not feasible given the regional spatial extent of Cyclone Harry and the widespread distribution of the affected areas. Therefore, the integration of multiple documentary sources represented the most suitable approach for reconstructing the spatial distribution and typology of damage at the regional scale.
7. Conclusions
This study highlights the dominant role of marine forcing in shaping the impacts observed in Calabria during Cyclone Harry. Despite the exceptional rainfall totals recorded during the event, damage distribution was mainly controlled by wave storm processes, with wave persistence and storm duration appearing more important than peak intensity alone. The spatial pattern of impacts clearly reflects the influence of a persistent south-easterly wave field, which exposed most of the Ionian coastline to sustained incoming wave energy. Wave conditions were not only exceptionally high compared to the climatological January maxima, but the persistence of energetic sea-state conditions also locally exceeded the maximum duration observed in the corresponding climatological reference, confirming the exceptional character of Cyclone Harry in terms of both wave intensity and persistence. In several sectors of the southern Ionian coast, both significant wave heights and the persistence of energetic sea-state conditions reached the highest values recorded in the full MEDSEA reanalysis archive (1985–2025).
Coastal communication and transportation infrastructures, tourism facilities, and port areas were the most affected, whereas wind-related damage remained limited despite the exceptional wind conditions. The observed correspondence between meteo-marine forcing and damage distribution in the study area highlights the role of these variables in explaining the spatial variability of coastal impacts and identifying areas potentially exposed to severe effects from similar future events in Calabria. Although these findings are specific to Cyclone Harry in the Calabria region, they demonstrate that the spatial distribution and type of damage are controlled not only by the characteristics of the meteo-marine event but also by the physical, geomorphological, and environmental properties of the affected coastal and inland area. Understanding the impacts of Mediterranean cyclones is therefore essential to comprehensively assess the interactions between extreme meteo-marine events and coastal systems, providing critical insights to support site-specific risk assessment and the development of effective mitigation and adaptation strategies in coastal areas exposed to Mediterranean cyclones.
Author Contributions
Conceptualization, C.V. and G.E.S.; data curation, C.V. and G.E.S.; investigation, C.V., G.E.S. and F.C.; methodology, C.V., G.E.S., L.A., D.B., F.C. and R.C.; supervision, L.A. and F.C.; writing—original draft, C.V., G.E.S., L.A. and F.C.; writing—review and editing, C.V., G.E.S., L.A., D.B., F.C. and R.C.; C.V. and G.E.S. should be considered co-first authors. All authors have read and agreed to the published version of the manuscript.
Funding
This research received no external funding.
Data Availability Statement
Datasets developed in this study are publicly available through the open-access Zenodo repository (https://doi.org/10.5281/zenodo.21370924). The repository includes a georeferenced damage database and a rainfall database supporting the analyses presented in this study.
Conflicts of Interest
The authors declare no conflicts of interest.
References
- Mediterranean Region. Climate Change 2022—Impacts, Adaptation and Vulnerability; Cambridge University Press: Cambridge, UK, 2023; pp. 2233–2272. [Google Scholar] [CrossRef] [Scilit]
- Trigo, I.F.; Davies, T.D.; Bigg, G.R. Objective Climatology of Cyclones in the Mediterranean Region. J. Clim. 1999, 12, 1685–1696. [Google Scholar] [CrossRef] [Scilit]
- Trigo, I.F.; Bigg, G.R.; Davies, T.D.; Trigo, I.F.; Bigg, G.R.; Davies, T.D. Climatology of Cyclogenesis Mechanisms in the Mediterranean. Mon. Weather Rev. 2002, 130, 549–569. [Google Scholar] [CrossRef] [Scilit]
- Campins, J.; Genovés, A.; Picornell, M.A.; Jansà, A. Climatology of Mediterranean Cyclones Using the ERA-40 Dataset. Int. J. Climatol. 2011, 31, 1596–1614. [Google Scholar] [CrossRef] [Scilit]
- Lionello, P.; Bhend, J.; Buzzi, A.; Della-Marta, P.M.; Krichak, S.O.; Jansà, A.; Maheras, P.; Sanna, A.; Trigo, I.F.; Trigo, R. Chapter 6 Cyclones in the Mediterranean Region: Climatology and Effects on the Environment. Dev. Earth Environ. Sci. 2006, 4, 325–372. [Google Scholar] [CrossRef] [Scilit]
- Lionello, P.; Conte, D.; Reale, M. The Effect of Cyclones Crossing the Mediterranean Region on Sea Level Anomalies on the Mediterranean Sea Coast. Nat. Hazards Earth Syst. Sci. 2019, 19, 1541–1564. [Google Scholar] [CrossRef] [Scilit]
- Flaounas, E.; Davolio, S.; Raveh-Rubin, S.; Pantillon, F.; Miglietta, M.M.; Gaertner, M.A.; Hatzaki, M.; Homar, V.; Khodayar, S.; Korres, G.; et al. Mediterranean Cyclones: Current Knowledge and Open Questions on Dynamics, Prediction, Climatology and Impacts. Weather Clim. Dyn. 2022, 3, 173–208. [Google Scholar] [CrossRef] [Scilit]
- Khodayar, S.; Kushta, J.; Catto, J.L.; Dafis, S.; Davolio, S.; Ferrarin, C.; Flaounas, E.; Groenemeijer, P.; Hatzaki, M.; Hochman, A.; et al. Mediterranean Cyclones in a Changing Climate: A Review on Their Socio-Economic Impacts. Rev. Geophys. 2025, 63, e2024RG000853. [Google Scholar] [CrossRef] [Scilit]
- Miglietta, M.M. Mediterranean Tropical-Like Cyclones (Medicanes). Atmosphere 2019, 10, 206. [Google Scholar] [CrossRef] [Scilit]
- Miglietta, M.M.; Flaounas, E.; González-Alemán, J.J.; Panegrossi, G.; Gaertner, M.A.; Pantillon, F.; Pasquero, C.; Schultz, D.M.; D’Adderio, L.P.; Dafis, S.; et al. Defining Medicanes: Bridging the Knowledge Gap between Tropical and Extratropical Cyclones in the Mediterranean. Bull. Am. Meteorol. Soc. 2025, 106, E1955–E1971. [Google Scholar] [CrossRef] [Scilit]
- Schultz, D.M.; Young, M.V.; Kirshbaum, D.J.; Schultz, D.M.; Young, M.V.; Kirshbaum, D.J. The Spanish Plume Elevated Mixed Layer: A Review of Its Use and Misuse within the Scientific Literature. Mon. Weather Rev. 2025, 153, 737–761. [Google Scholar] [CrossRef] [Scilit]
- Nastos, P.T.; Karavana Papadimou, K.; Matsangouras, I.T. Mediterranean Tropical-like Cyclones: Impacts and Composite Daily Means and Anomalies of Synoptic Patterns. Atmos. Res. 2018, 208, 156–166. [Google Scholar] [CrossRef] [Scilit]
- Givon, Y.; Hess, O.; Flaounas, E.; Catto, J.L.; Sprenger, M.; Raveh-Rubin, S. Process-Based Classification of Mediterranean Cyclones Using Potential Vorticity. Weather Clim. Dyn. 2024, 5, 133–162. [Google Scholar] [CrossRef] [Scilit]
- Lagouvardos, K.; Karagiannidis, A.; Dafis, S.; Kalimeris, A.; Kotroni, V.; Lagouvardos, K.; Karagiannidis, A.; Dafis, S.; Kalimeris, A.; Kotroni, V. Ianos—A Hurricane in the Mediterranean. Bull. Am. Meteorol. Soc. 2022, 103, E1621–E1636. [Google Scholar] [CrossRef] [Scilit]
- Panegrossi, G.; D’Adderio, L.P.; Dafis, S.; Rysman, J.F.; Casella, D.; Dietrich, S.; Sanò, P. Warm Core and Deep Convection in Medicanes: A Passive Microwave-Based Investigation. Remote Sens. 2023, 15, 2838. [Google Scholar] [CrossRef] [Scilit]
- Diakakis, M.; Mavroulis, S.; Filis, C.; Lozios, S.; Vassilakis, E.; Naoum, G.; Soukis, K.; Konsolaki, A.; Kotsi, E.; Theodorakatou, D.; et al. Impacts of Medicanes on Geomorphology and Infrastructure in the Eastern Mediterranean, the Case of Medicane Ianos and the Ionian Islands in Western Greece. Water 2023, 15, 1026. [Google Scholar] [CrossRef] [Scilit]
- Valkaniotis, S.; Papathanassiou, G.; Marinos, V.; Saroglou, C.; Zekkos, D.; Kallimogiannis, V.; Karantanellis, E.; Farmakis, I.; Zalachoris, G.; Manousakis, J.; et al. Landslides Triggered by Medicane Ianos in Greece, September 2020: Rapid Satellite Mapping and Field Survey. Appl. Sci. 2022, 12, 12443. [Google Scholar] [CrossRef] [Scilit]
- Bakkensen, L.A. Mediterranean Hurricanes and Associated Damage Estimates. J. Extrem. Events 2017, 4, 1750008. [Google Scholar] [CrossRef] [Scilit]
- Armon, M.; Shmilovitz, Y.; Dente, E. Anatomy of a Foreseeable Disaster: Lessons from the 2023 Dam-Breaching Flood in Derna, Libya. Sci. Adv. 2025, 11, eadu2865. [Google Scholar] [CrossRef] [Scilit] [PubMed]
- Normand, J.C.L.; Heggy, E. Assessing Flash Flood Erosion Following Storm Daniel in Libya. Nat. Commun. 2024, 15, 6493. [Google Scholar] [CrossRef] [Scilit] [PubMed]
- Argüeso, D.; Marcos, M.; Amores, A. Storm Daniel Fueled by Anomalously High Sea Surface Temperatures in the Mediterranean. npj Clim. Atmos. Sci. 2024, 7, 307. [Google Scholar] [CrossRef] [Scilit]
- Jangir, B.; Mishra, A.K.; Strobach, E. The Interplay between Medicanes and the Mediterranean Sea in the Presence of Sea Surface Temperature Anomalies. Atmos. Res. 2024, 310, 107625. [Google Scholar] [CrossRef] [Scilit]
- Zittis, G.; Almazroui, M.; Alpert, P.; Ciais, P.; Cramer, W.; Dahdal, Y.; Fnais, M.; Francis, D.; Hadjinicolaou, P.; Howari, F.; et al. Climate Change and Weather Extremes in the Eastern Mediterranean and Middle East. Rev. Geophys. 2022, 60, e2021RG000762. [Google Scholar] [CrossRef] [Scilit]
- Chericoni, M.; Fosser, G.; Flaounas, E.; Gaetani, M.; Anav, A. Unravelling Drivers of the Future Mediterranean Precipitation Paradox during Cyclones. npj Clim. Atmos. Sci. 2025, 8, 260. [Google Scholar] [CrossRef] [Scilit]
- Faranda, D.; Bourdin, S.; Ginesta, M.; Krouma, M.; Noyelle, R.; Pons, F.; Yiou, P.; Messori, G. A Climate-Change Attribution Retrospective of Some Impactful Weather Extremes of 2021. Weather Clim. Dyn. 2022, 3, 1311–1340. [Google Scholar] [CrossRef] [Scilit]
- Cosby, A.G.; Lebakula, V.; Smith, C.N.; Wanik, D.W.; Bergene, K.; Rose, A.N.; Swanson, D.; Bloom, D.E. Accelerating Growth of Human Coastal Populations at the Global and Continent Levels: 2000–2018. Sci. Rep. 2024, 14, 22489. [Google Scholar] [CrossRef] [Scilit] [PubMed]
- ISPRA. 2021. Available online: https://www.isprambiente.gov.it/files2022/pubblicazioni/rapporti/rapporto_dissesto_idrogeologico_italia_ispra_356_2021_finale_web.pdf (accessed on 3 June 2026).
- Barbaro, G. Master Plan of Solutions to Mitigate the Risk of Coastal Erosion in Calabria (Italy), a Case Study. Ocean Coast. Manag. 2016, 132, 24–35. [Google Scholar] [CrossRef] [Scilit]
- ISPRA Indicatori Ambientali. Available online: https://indicatoriambientali.isprambiente.it/it/tema/coste (accessed on 3 June 2026).
- Regione Calabria Home—Opendata Regione Calabria. Available online: https://dati.regione.calabria.it/ (accessed on 3 June 2026).
- IstatData. Available online: https://esploradati.istat.it/databrowser/ (accessed on 3 June 2026).
- Terranova, O.G.; Iaquinta, P. Temporal Properties of Rainfall Events in Calabria (Southern Italy). Nat. Hazards Earth Syst. Sci. 2011, 11, 751–757. [Google Scholar] [CrossRef] [Scilit]
- Chiaravalloti, F.; Caloiero, T.; Coscarelli, R. The Long-Term ERA5 Data Series for Trend Analysis of Rainfall in Italy. Hydrology 2022, 9, 18. [Google Scholar] [CrossRef] [Scilit]
- Library, W.O.; Brunetti, M.; Caloiero, T.; Coscarelli, R.; Gulì, G.; Nanni, T.; Simolo, C. Precipitation Variability and Change in the Calabria Region (Italy) from a High Resolution Daily Dataset. Int. J. Clim. 2012, 32, 57–73. [Google Scholar] [CrossRef] [Scilit]
- Chiaravalloti, F.; Coscarelli, R.; Caloiero, T. Characterization of 1-Hr Maximum Rainfall Values in Calabria, Southern Italy, by Means of the ERA-5 Reanalysis. Eur. Water 2024, 85, 25–35. [Google Scholar]
- AEMET Agencia Estatal de Meteorología Gobierno de España Borrasca Harry. Available online: https://www.aemet.es/es/conocermas/borrascas/2025-2026/estudios_e_impactos/harry (accessed on 27 May 2026).
- Cusack, E. Eumetnet Storm Naming Project. Available online: https://events.ecmwf.int/event/296/contributions/3331/attachments/1904/3424/UEF2022_Cusack.pdf (accessed on 10 June 2026).
- Kotroni, V.; Lagouvardos, K.; Bezes, A.; Dafis, S.; Galanaki, E.; Giannaros, C.; Giannaros, T.; Karagiannidis, A.; Koletsis, I.; Kopania, T.; et al. Storm Naming in the Eastern Mediterranean: Procedures, Events Review and Impact on the Citizens Risk Perception and Readiness. Atmosphere 2021, 12, 1537. [Google Scholar] [CrossRef] [Scilit]
- Centro Funzionale Multirischi Regione Calabria. Rapporto Di Evento Meteopluviometrico 18–21 Gennaio 2026; Centro Funzionale Multirischi Regione Calabria: Catanzaro, Italy, 2026. [Google Scholar]
- Centro Funzionale Decentrato Regione Sicilia. Rapporto Sull’evento Meteo-21 Gennaio 2026; Centro Funzionale Decentrato Regione Sicilia: Palermo, Italy, 2026. [Google Scholar]
- Regione Sardegna. Analisi Metereologica e Idrologica Post-Evento 18–21 Gennaio 2026; Regione Sardegna: Cagliari, Italy, 2026. [Google Scholar]
- Lo Re, C.; Nardone, G.; Picone, M.; Rossi, G.B.; Crenna, F.; Khalil, M. Advancements in the Italian National Wave Buoy Network: First Results from the Upgraded Stations. In Proceedings of the 2025 IEEE International Workshop on Metrology for the Sea; Learning to Measure Sea Health Parameters (MetroSea), Genoa, Italy, 8–10 October 2025; IEEE: New York, NY, USA, 2025; pp. 257–261. [Google Scholar] [CrossRef] [Scilit]
- ISPRA Rete Mareografica Nazionale. Available online: https://www.mareografico.it/it/mappa-interattiva.html (accessed on 3 June 2026).
- ISPRA Rete Ondametrica Nazionale—Dataset. Available online: https://inspire-geoportal.ec.europa.eu/srv/api/records/ispra_rm:Meta002RON_DT (accessed on 4 June 2026).
- Chatzipavlis, A.; Trogu, D.; Ruju, A.; Montes, J.; Usai, A.; Porta, M.; Coco, G.; De Muro, S.; Ciavola, P. Development and Validation of an Early Warning System for Coastal Flooding Operating on a Mediterranean Urban Beach. Nat. Hazards Earth Syst. Sci. 2026, 26, 1573–1601. [Google Scholar] [CrossRef] [Scilit]
- Faranda, D.; Alvarez-Castro, M.C.; Portal, A.; Reale, M.; Tang, H.; Alberti, T.; Krouma, M.; Lucarini, V.; Coppola, E. Strong Winds in Mediterranean Cyclone Harry Mostly Strengthened by Human-Driven Climate Change; ClimaMeter, Institut Pierre Simon Laplace, CNRS: Paris, France, 2026. [Google Scholar] [CrossRef]
- Muñoz-Sabater, J.; Dutra, E.; Agustí-Panareda, A.; Albergel, C.; Arduini, G.; Balsamo, G.; Boussetta, S.; Choulga, M.; Harrigan, S.; Hersbach, H.; et al. ERA5-Land: A State-of-the-Art Global Reanalysis Dataset for Land Applications. Earth Syst. Sci. Data 2021, 13, 4349–4383. [Google Scholar] [CrossRef] [Scilit]
- Mediterranean Sea Waves Reanalysis|Copernicus Marine Service. Available online: https://data.marine.copernicus.eu/product/MEDSEA_MULTIYEAR_WAV_006_012/description (accessed on 27 May 2026).
- Hersbach, H.; Bell, B.; Berrisford, P.; Hirahara, S.; Horányi, A.; Muñoz-Sabater, J.; Nicolas, J.; Peubey, C.; Radu, R.; Schepers, D.; et al. The ERA5 Global Reanalysis. Q. J. R. Meteorol. Soc. 2020, 146, 1999–2049. [Google Scholar] [CrossRef] [Scilit]
- Holthuijsen, L.H. Waves in Oceanic and Coastal Waters; Cambridge University Press: Cambridge, UK, 2007; ISBN 0521860288. [Google Scholar]
- De Leo, F.; Briganti, R.; Besio, G. Trends in Ocean Waves Climate within the Mediterranean Sea: A Review. Clim. Dyn. 2024, 62, 1555–1566. [Google Scholar] [CrossRef] [Scilit]
- Sartini, L.; Besio, G.; Cassola, F. Spatio-Temporal Modelling of Extreme Wave Heights in the Mediterranean Sea. Ocean Model. 2017, 117, 52–69. [Google Scholar] [CrossRef] [Scilit]
- De Leo, F.; Besio, G.; Mentaschi, L. Trends and Variability of Ocean Waves under RCP8.5 Emission Scenario in the Mediterranean Sea. Ocean Dyn. 2020, 71, 97–117. [Google Scholar] [CrossRef] [Scilit]
- Forristall, G.Z. Wave Crest Distributions: Observations and Second-Order Theory. J. Phys. Oceanogr. 2000, 30, 1931–1943. [Google Scholar] [CrossRef] [Scilit]
- Chun, H.; Suh, K.D. Empirical Formulas for Estimating Maximum Wave Height and Period in Numerical Wave Hindcasting Model. Ocean Eng. 2019, 193, 106608. [Google Scholar] [CrossRef] [Scilit]
- Centro Funzionale Multirischi—ARPACAL. Available online: https://www.cfd.calabria.it/ (accessed on 3 June 2026).
- Alberoni, P.P.; Ferraris, L.; Marzano, F.S.; Nanni, S.; Pelosini, R.; Siccardi, F. The Italian Radar Network: Current Status and Future Developments. In Proceedings of the ERAD 2002, Delft, The Netherlands, 18–22 November 2002; pp. 339–344. [Google Scholar]
- Dipartimento della Protezione Civile Piattaforma Radar. Available online: https://mappe.protezionecivile.gov.it/it/mappe-e-dashboard-rischi/piattaforma-radar/ (accessed on 3 June 2026).
- Krajewski, W.F.; Villarini, G.; Smith, J.A. Radar-Rainfall Uncertainties: Where Are We after Thirty Years of Effort. Bull. Am. Meteorol. Soc. 2010, 91, 87–94. [Google Scholar] [CrossRef] [Scilit]
- Borga, M.; Marra, F.; Gabella, M. Rainfall Estimation by Weather Radar. In Rainfall: Modeling, Measurement and Applications; Morbidelli, R., Ed.; Elsevier: Amsterdam, The Netherlands, 2022; pp. 109–134. ISBN 978-0-12-822544-8. [Google Scholar] [CrossRef] [Scilit]
- McKee, J.L.; Binns, A.D. A Review of Gauge–Radar Merging Methods for Quantitative Precipitation Estimation in Hydrology. Can. Water Resour. J./Rev. Can. Des Ressour. Hydr. 2016, 41, 186–203. [Google Scholar] [CrossRef] [Scilit]
- Seo, D.J.; Breidenbach, J.P.; Johnson, E.R. Real-Time Estimation of Mean Field Bias in Radar Rainfall Data. J. Hydrol. 1999, 223, 131–147. [Google Scholar] [CrossRef] [Scilit]
- Cassiraga, E.; Jaime Gómez-Hernández, J.; Berenguer, M.; Sempere-Torres, D.; Rodrigo-Ilarri, J.; Jaime Gómez-Hernández, J. Spatiotemporal Precipitation Estimation from Rain Gauges and Meteorological Radar Using Geostatistics. Math. Geosci. 2021, 53, 499–516. [Google Scholar] [CrossRef] [Scilit]
- Folino, G.; Guarascio, M.; Chiaravalloti, F. Learning Ensembles of Deep Neural Networks for Extreme Rainfall Event Detection. Neural Comput. Appl. 2023, 35, 10347–10360. [Google Scholar] [CrossRef] [Scilit]
- De Biase, M.; Lupiano, V.; Chiaravalloti, F.; Iovine, G.; Muto, M.; Terranova, O.; Tripodi, V.; Pisano, L. Integrated Rainfall Estimation Using Rain Gauges and Weather Radar: Implications for Rainfall-Induced Landslides. Remote Sens. 2025, 17, 3629. [Google Scholar] [CrossRef] [Scilit]
- Martens, B.; Cabus, P.; De Jongh, I.; Verhoest, N.E.C. Merging Weather Radar Observations with Ground-Based Measurements of Rainfall Using an Adaptive Multiquadric Surface Fitting Algorithm. J. Hydrol. 2013, 500, 84–96. [Google Scholar] [CrossRef] [Scilit]
- Directive-2007/60-EN-EUR-Lex. Available online: https://eur-lex.europa.eu/legal-content/EN/TXT/?uri=celex:32007L0060 (accessed on 27 April 2026).
- Vennari, C.; Salvati, P.; Bianchi, C.; Casarano, D.; Parise, M.; Basso, A.; Marchesini, I. AReGeoDatHa: Apulian Regional GeoDatabase for Geo-Hydrological Hazards. J. Environ. Manag. 2022, 322, 116051. [Google Scholar] [CrossRef] [Scilit]
- Biondi, D.; Scarcella, G.E.; Versace, P. CERCA (Cascading Effects in Risk Consequences Assessment): An Operational Tool for Geo-Hydrological Scenario Risk Assessment and Cascading Effects Evaluation. Hydrol. Res. 2023, 54, 189–207. [Google Scholar] [CrossRef] [Scilit]
- ISPRA Coste—Webgis. Available online: https://sinacloud.isprambiente.it/portal/apps/webappviewer/index.html?id=089e0739893f482e9e9b627360b6ff6d (accessed on 3 June 2026).
- Greco, A.; De Luca, D.L.; Avolio, E. Heavy Precipitation Systems in Calabria Region (Southern Italy): High-Resolution Observed Rainfall and Large-Scale Atmospheric Pattern Analysis. Water 2020, 12, 1468. [Google Scholar] [CrossRef] [Scilit]
- Tuel, A.; Martius, O. Weather Persistence on Sub-Seasonal to Seasonal Timescales: A Methodological Review. Earth Syst. Dyn. 2023, 14, 955–987. [Google Scholar] [CrossRef] [Scilit]
- Amores, A.; Marcos, M.; Carrió, D.S.; Gómez-Pujol, L. Coastal Impacts of Storm Gloria (January 2020) over the North-Western Mediterranean. Nat. Hazards Earth Syst. Sci. 2020, 20, 1955–1968. [Google Scholar] [CrossRef] [Scilit]
- Koks, E.E.; Rozenberg, J.; Zorn, C.; Tariverdi, M.; Vousdoukas, M.; Fraser, S.A.; Hall, J.W.; Hallegatte, S. A Global Multi-Hazard Risk Analysis of Road and Railway Infrastructure Assets. Nat. Commun. 2019, 10, 2677. [Google Scholar] [CrossRef] [Scilit] [PubMed]
- Durap, A.; Balas, C.E. Towards Sustainable Coastal Management: A Hybrid Model for Vulnerability and Risk Assessment. J. Coast. Conserv. 2024, 28, 66. [Google Scholar] [CrossRef] [Scilit]
- Sánchez-Arcilla, A.; Sierra, J.P.; Brown, S.; Casas-Prat, M.; Nicholls, R.J.; Lionello, P.; Conte, D. A Review of Potential Physical Impacts on Harbours in the Mediterranean Sea under Climate Change. Reg. Environ. Change 2016, 16, 2471–2484. [Google Scholar] [CrossRef] [Scilit]
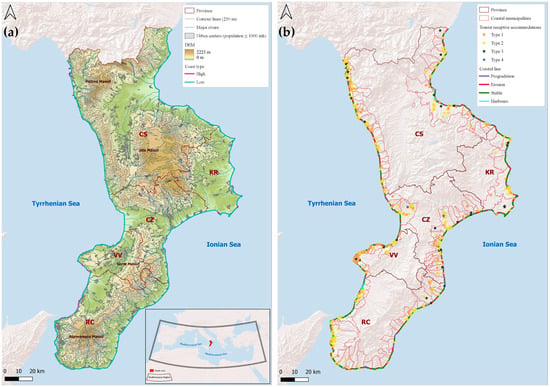
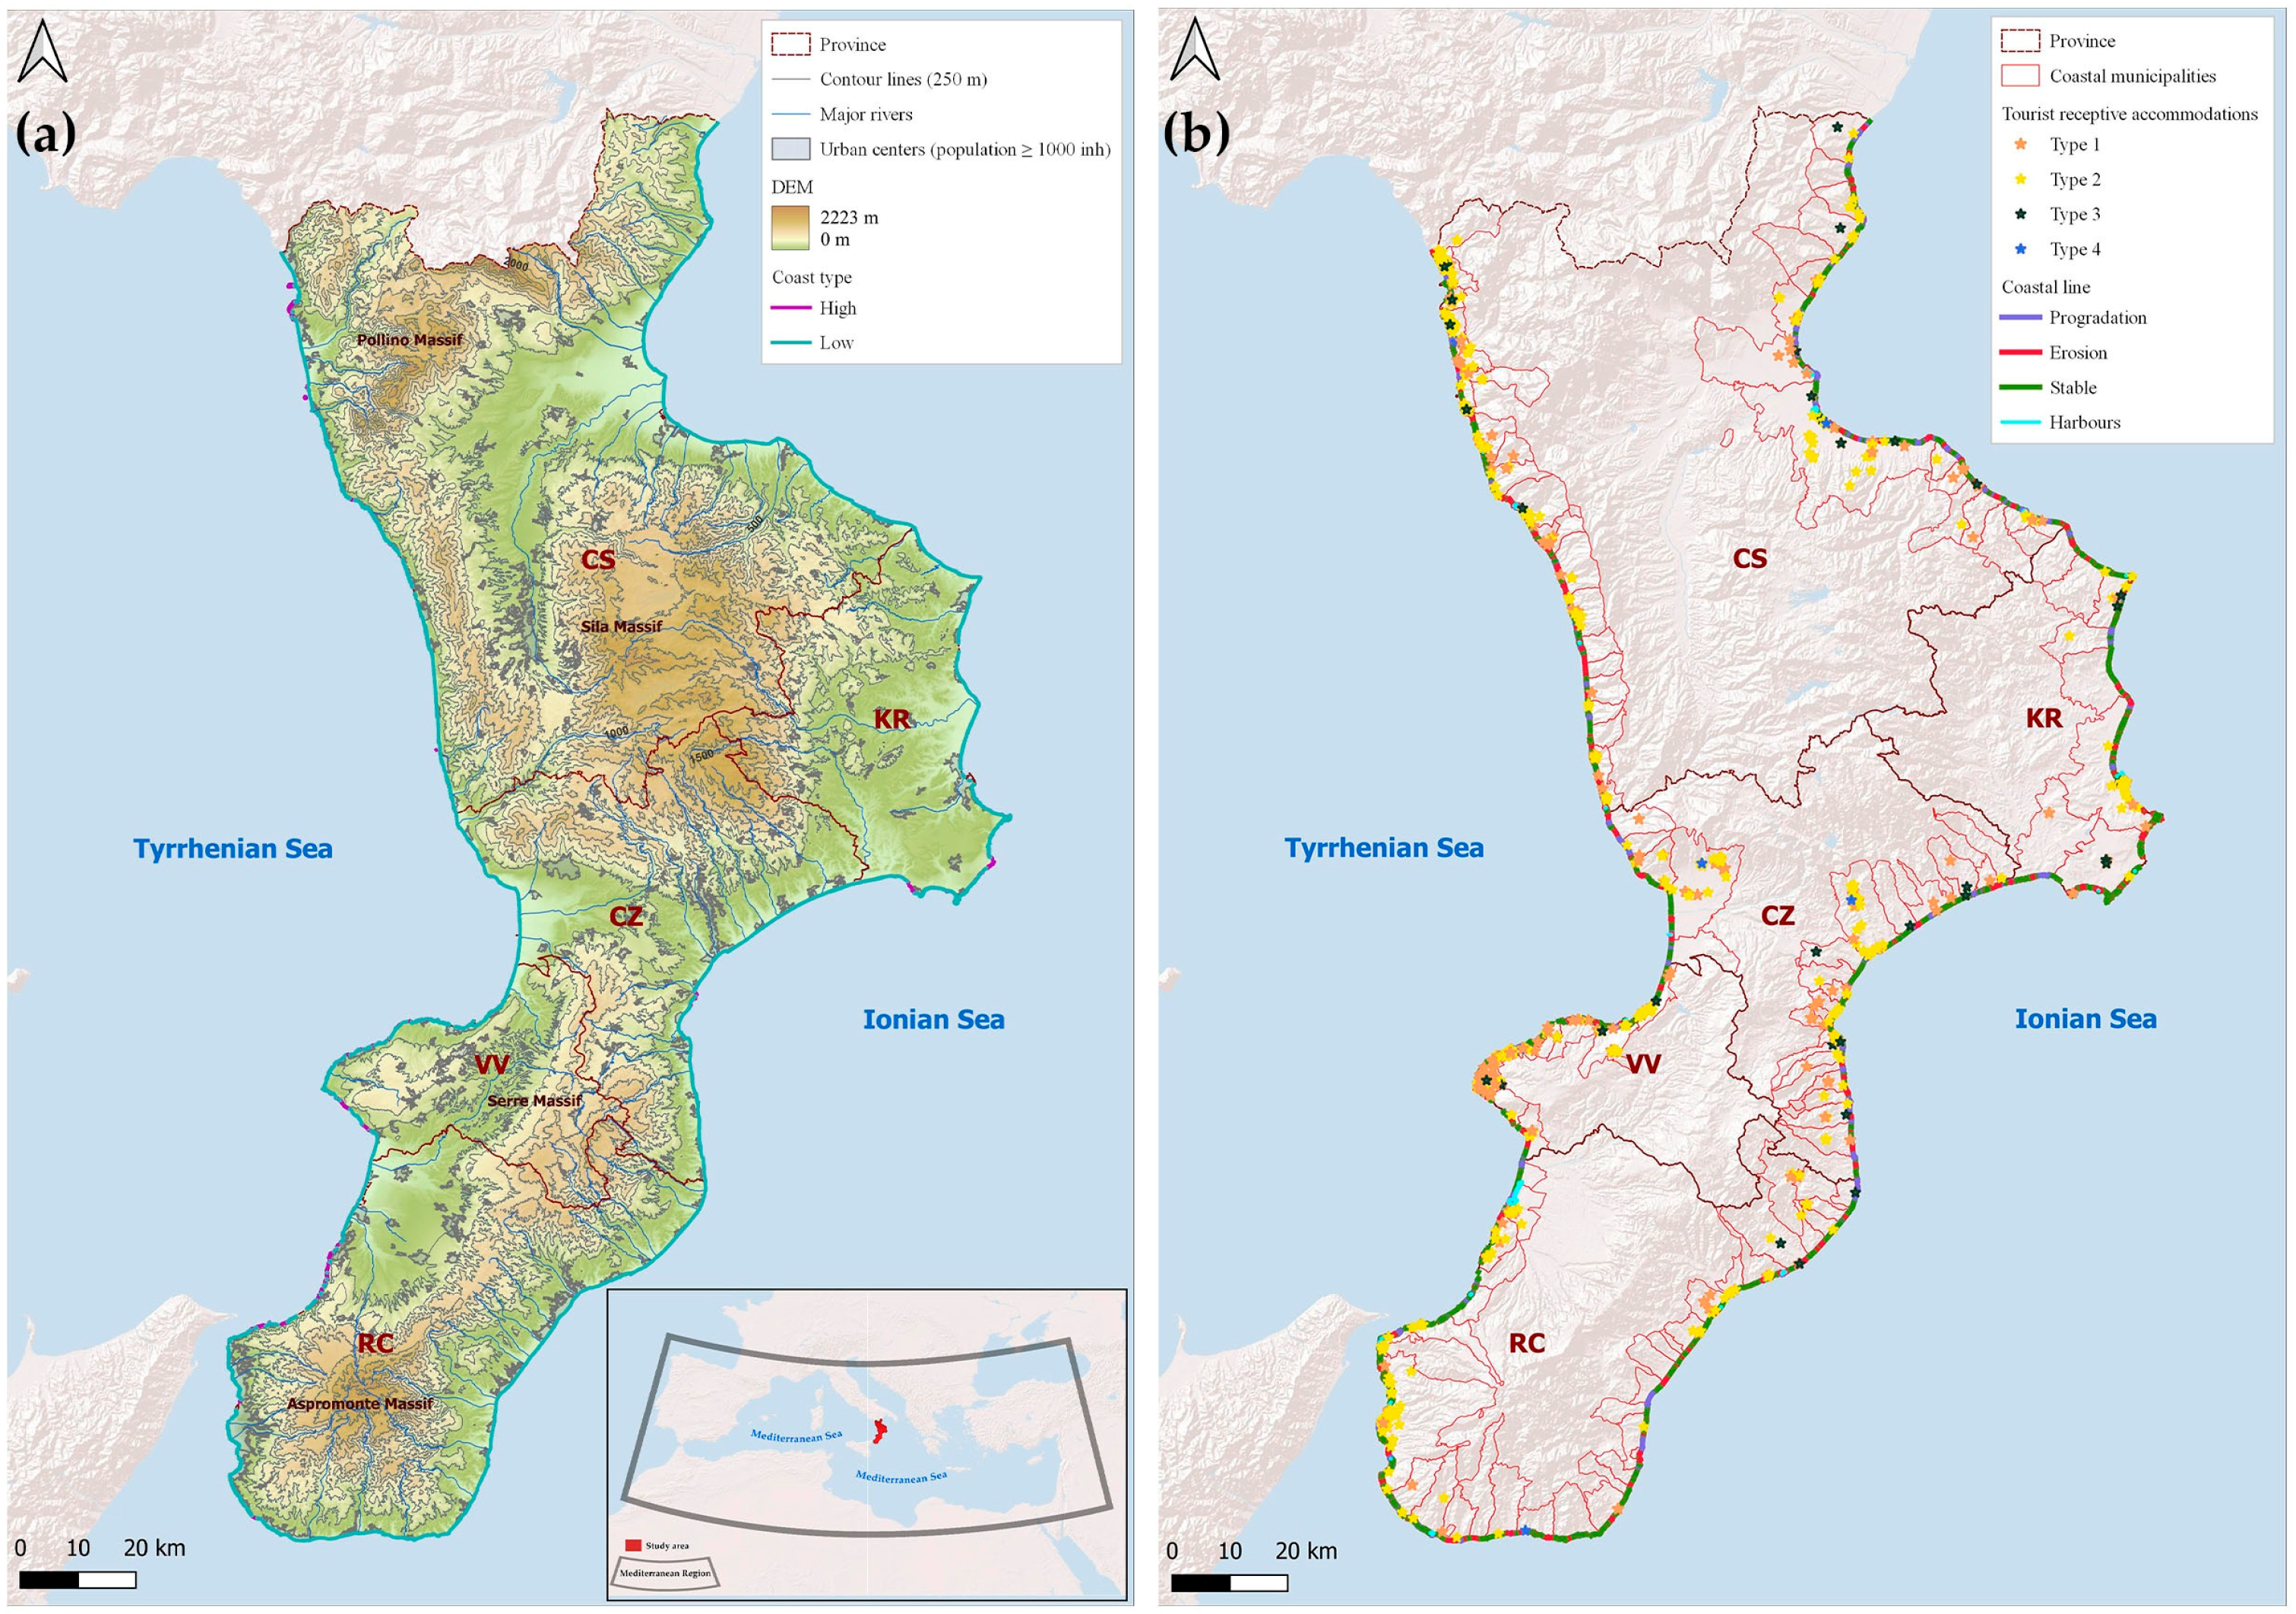
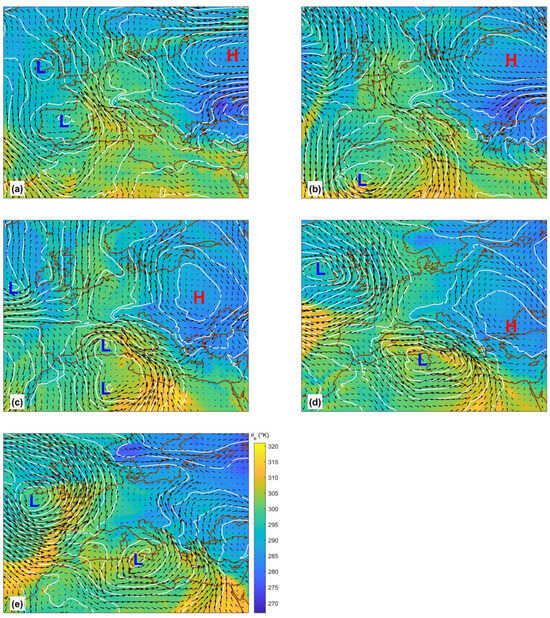
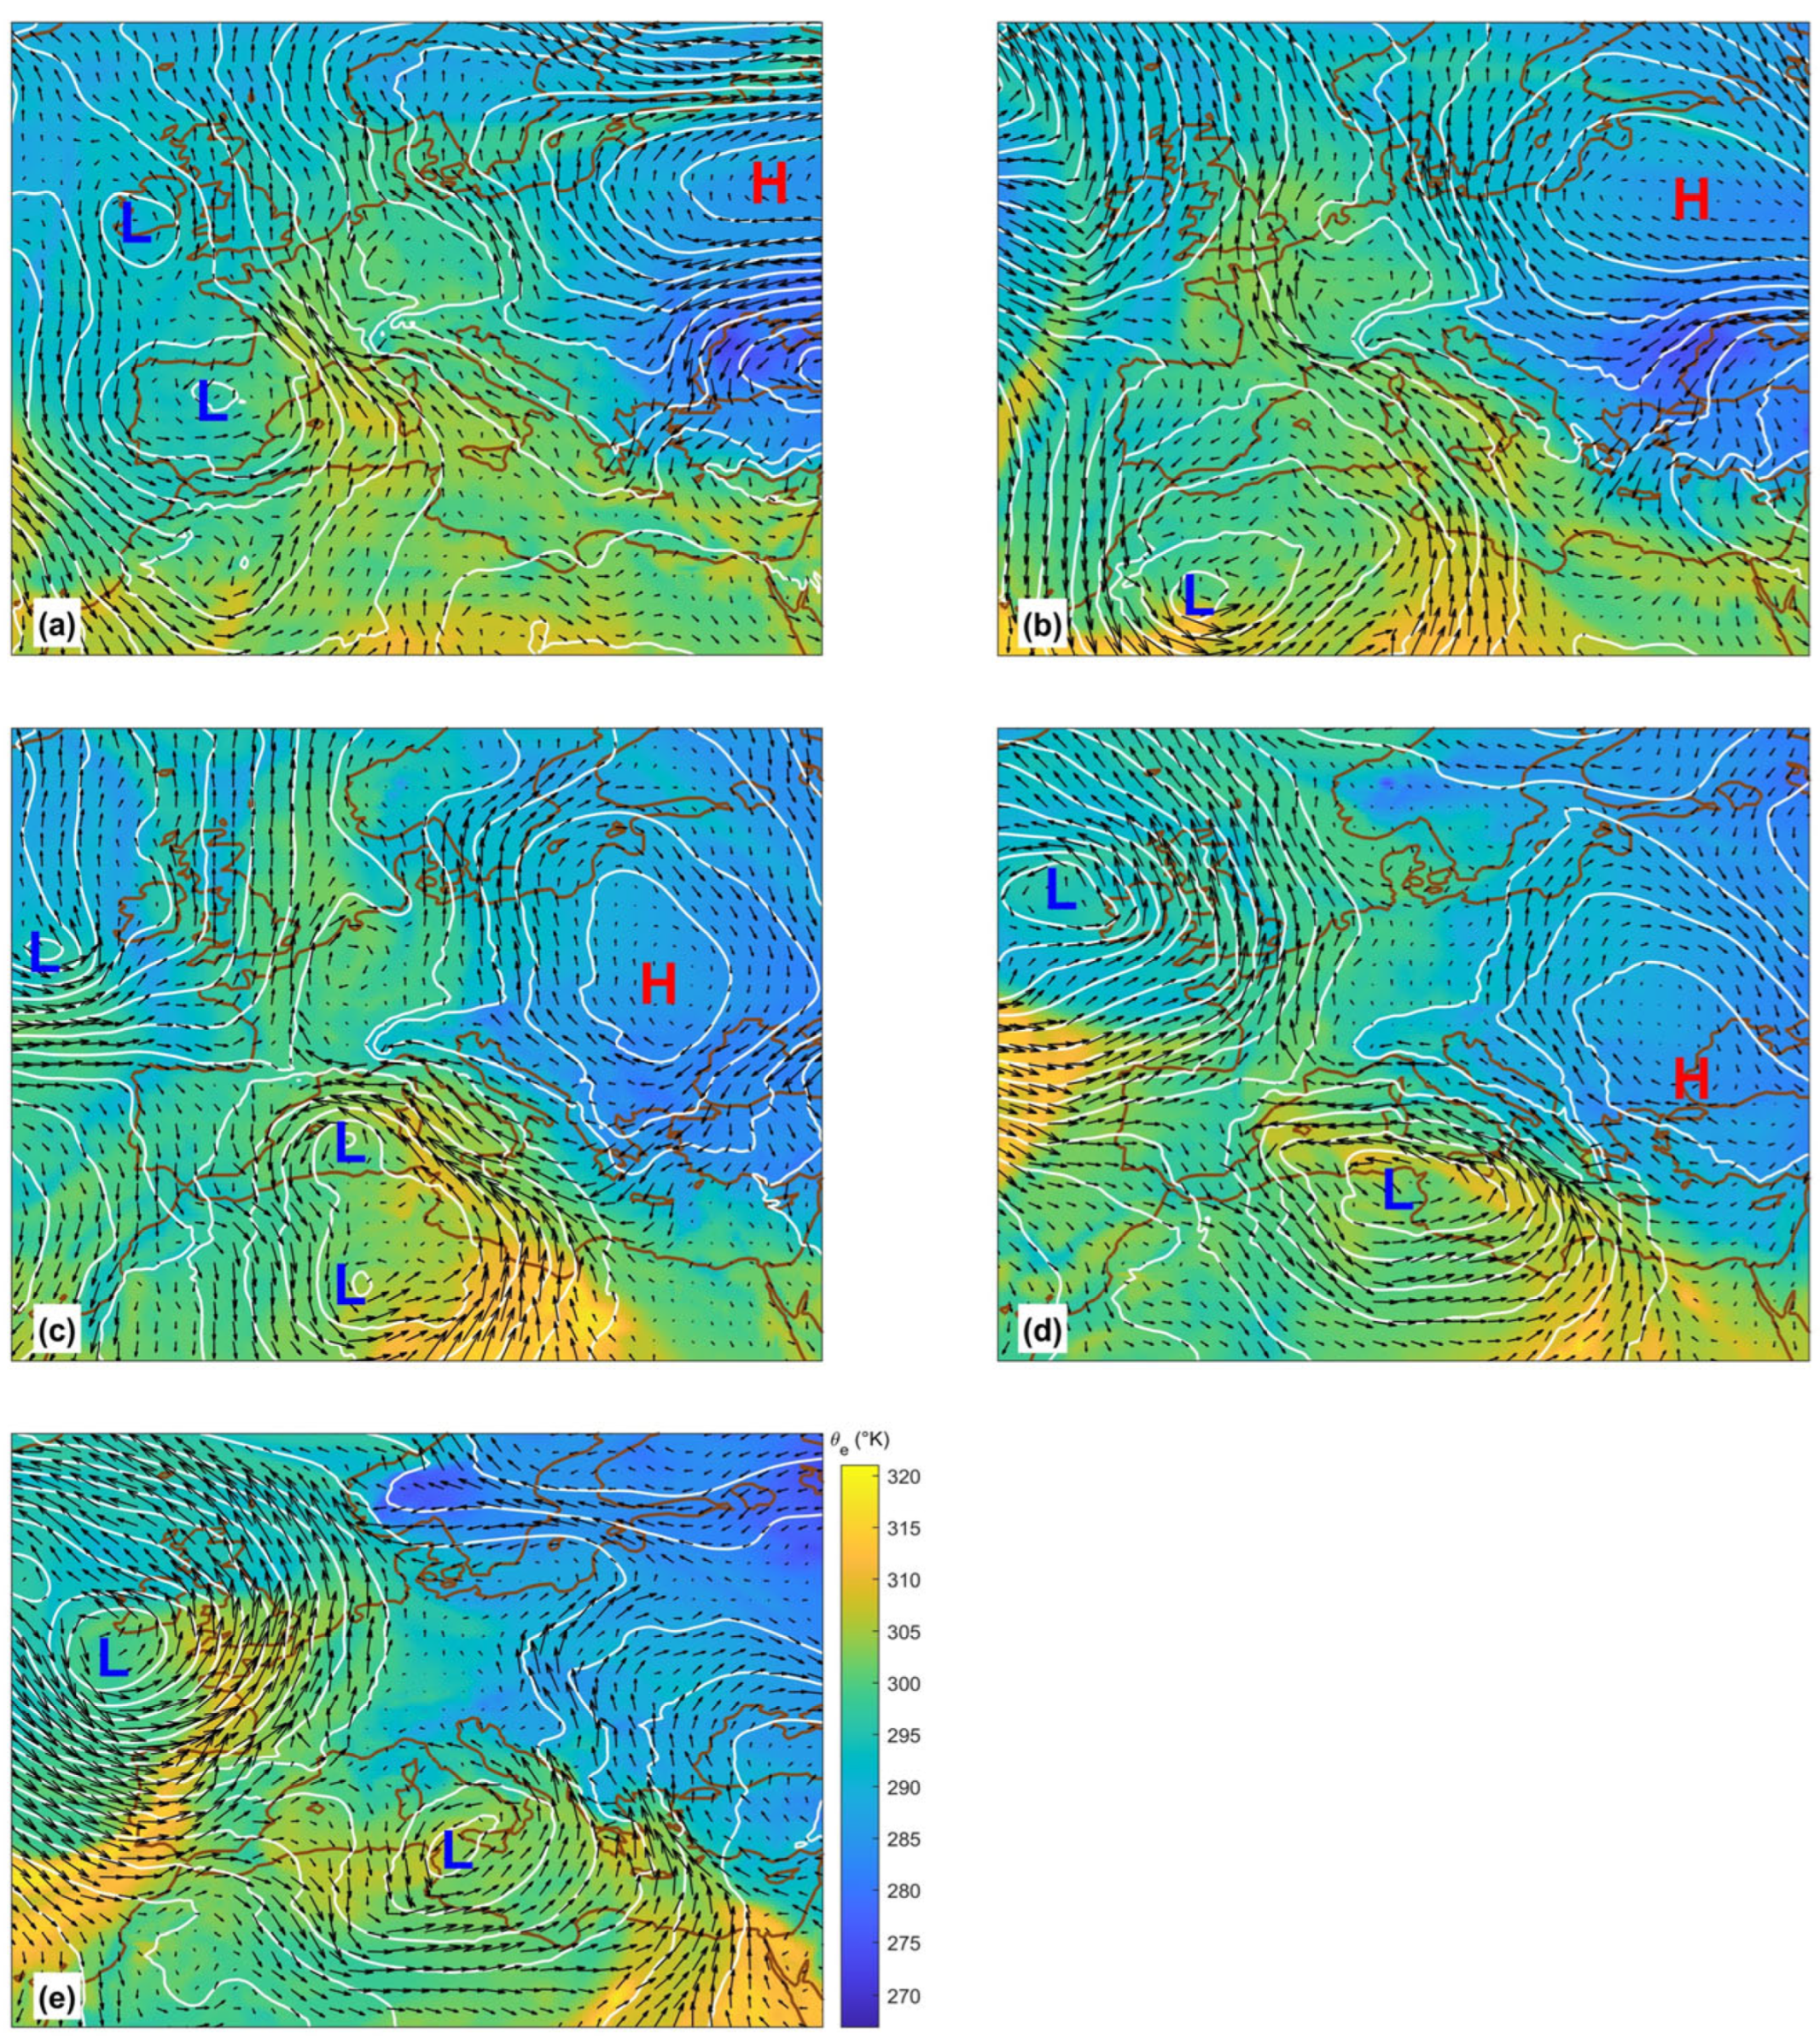
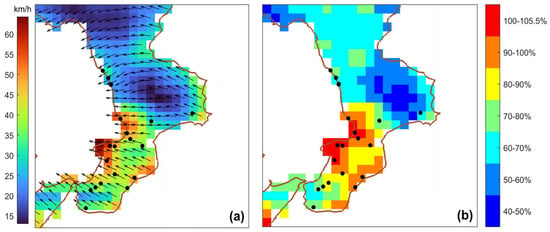
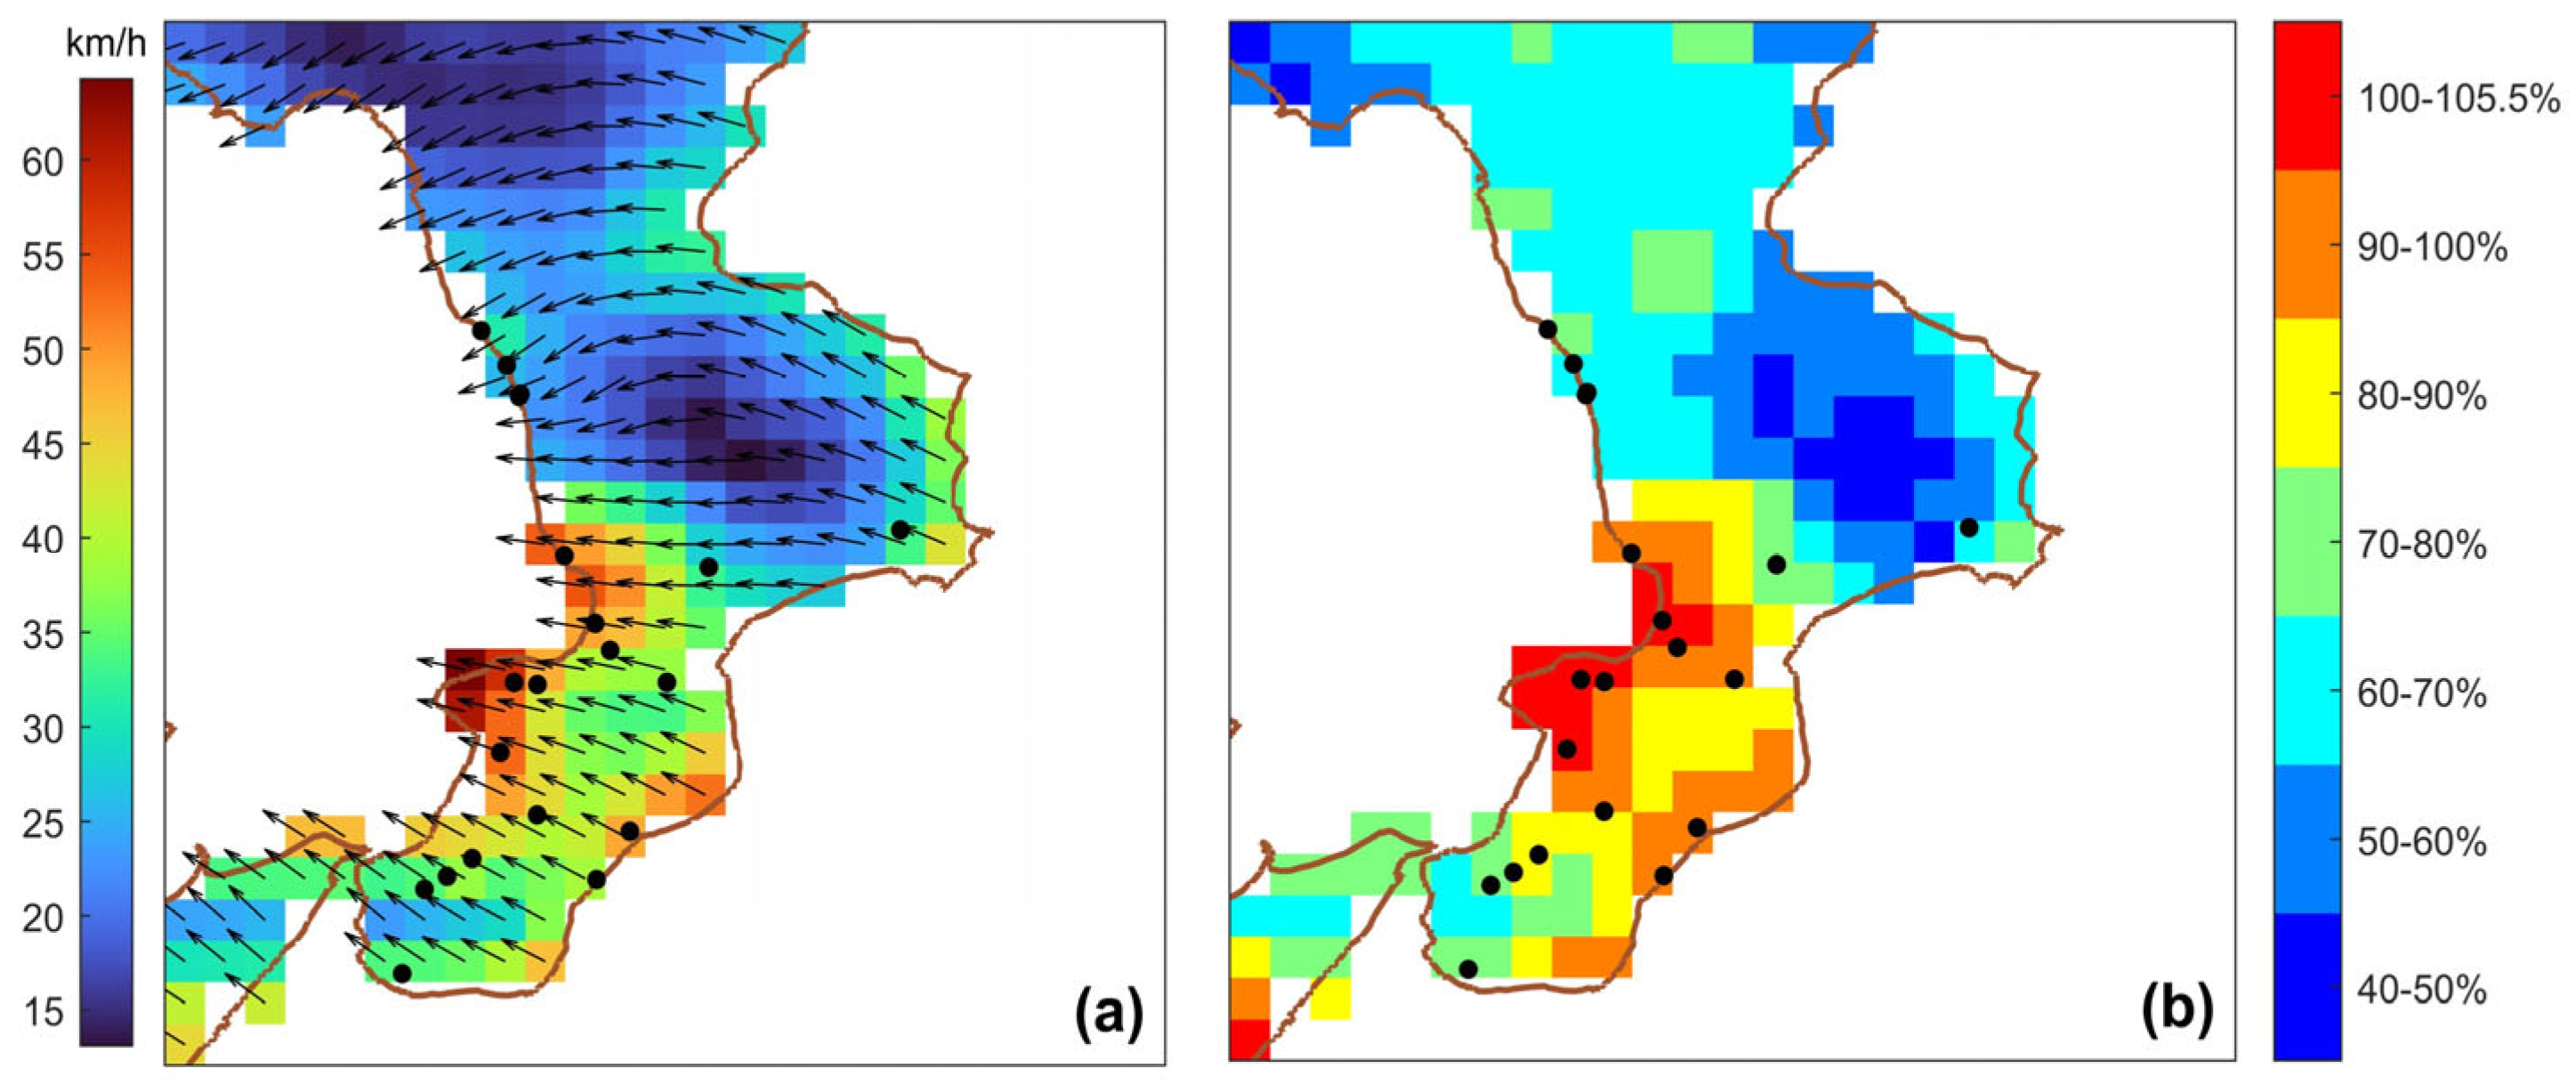
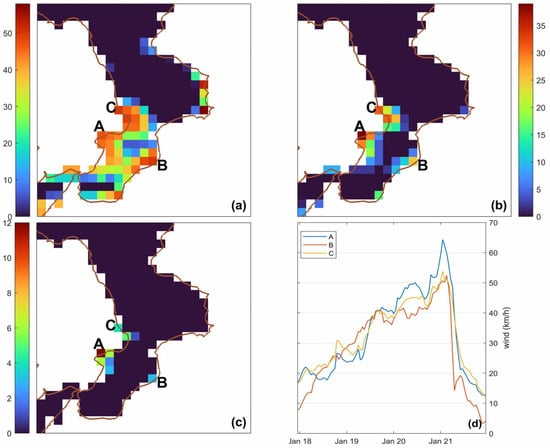
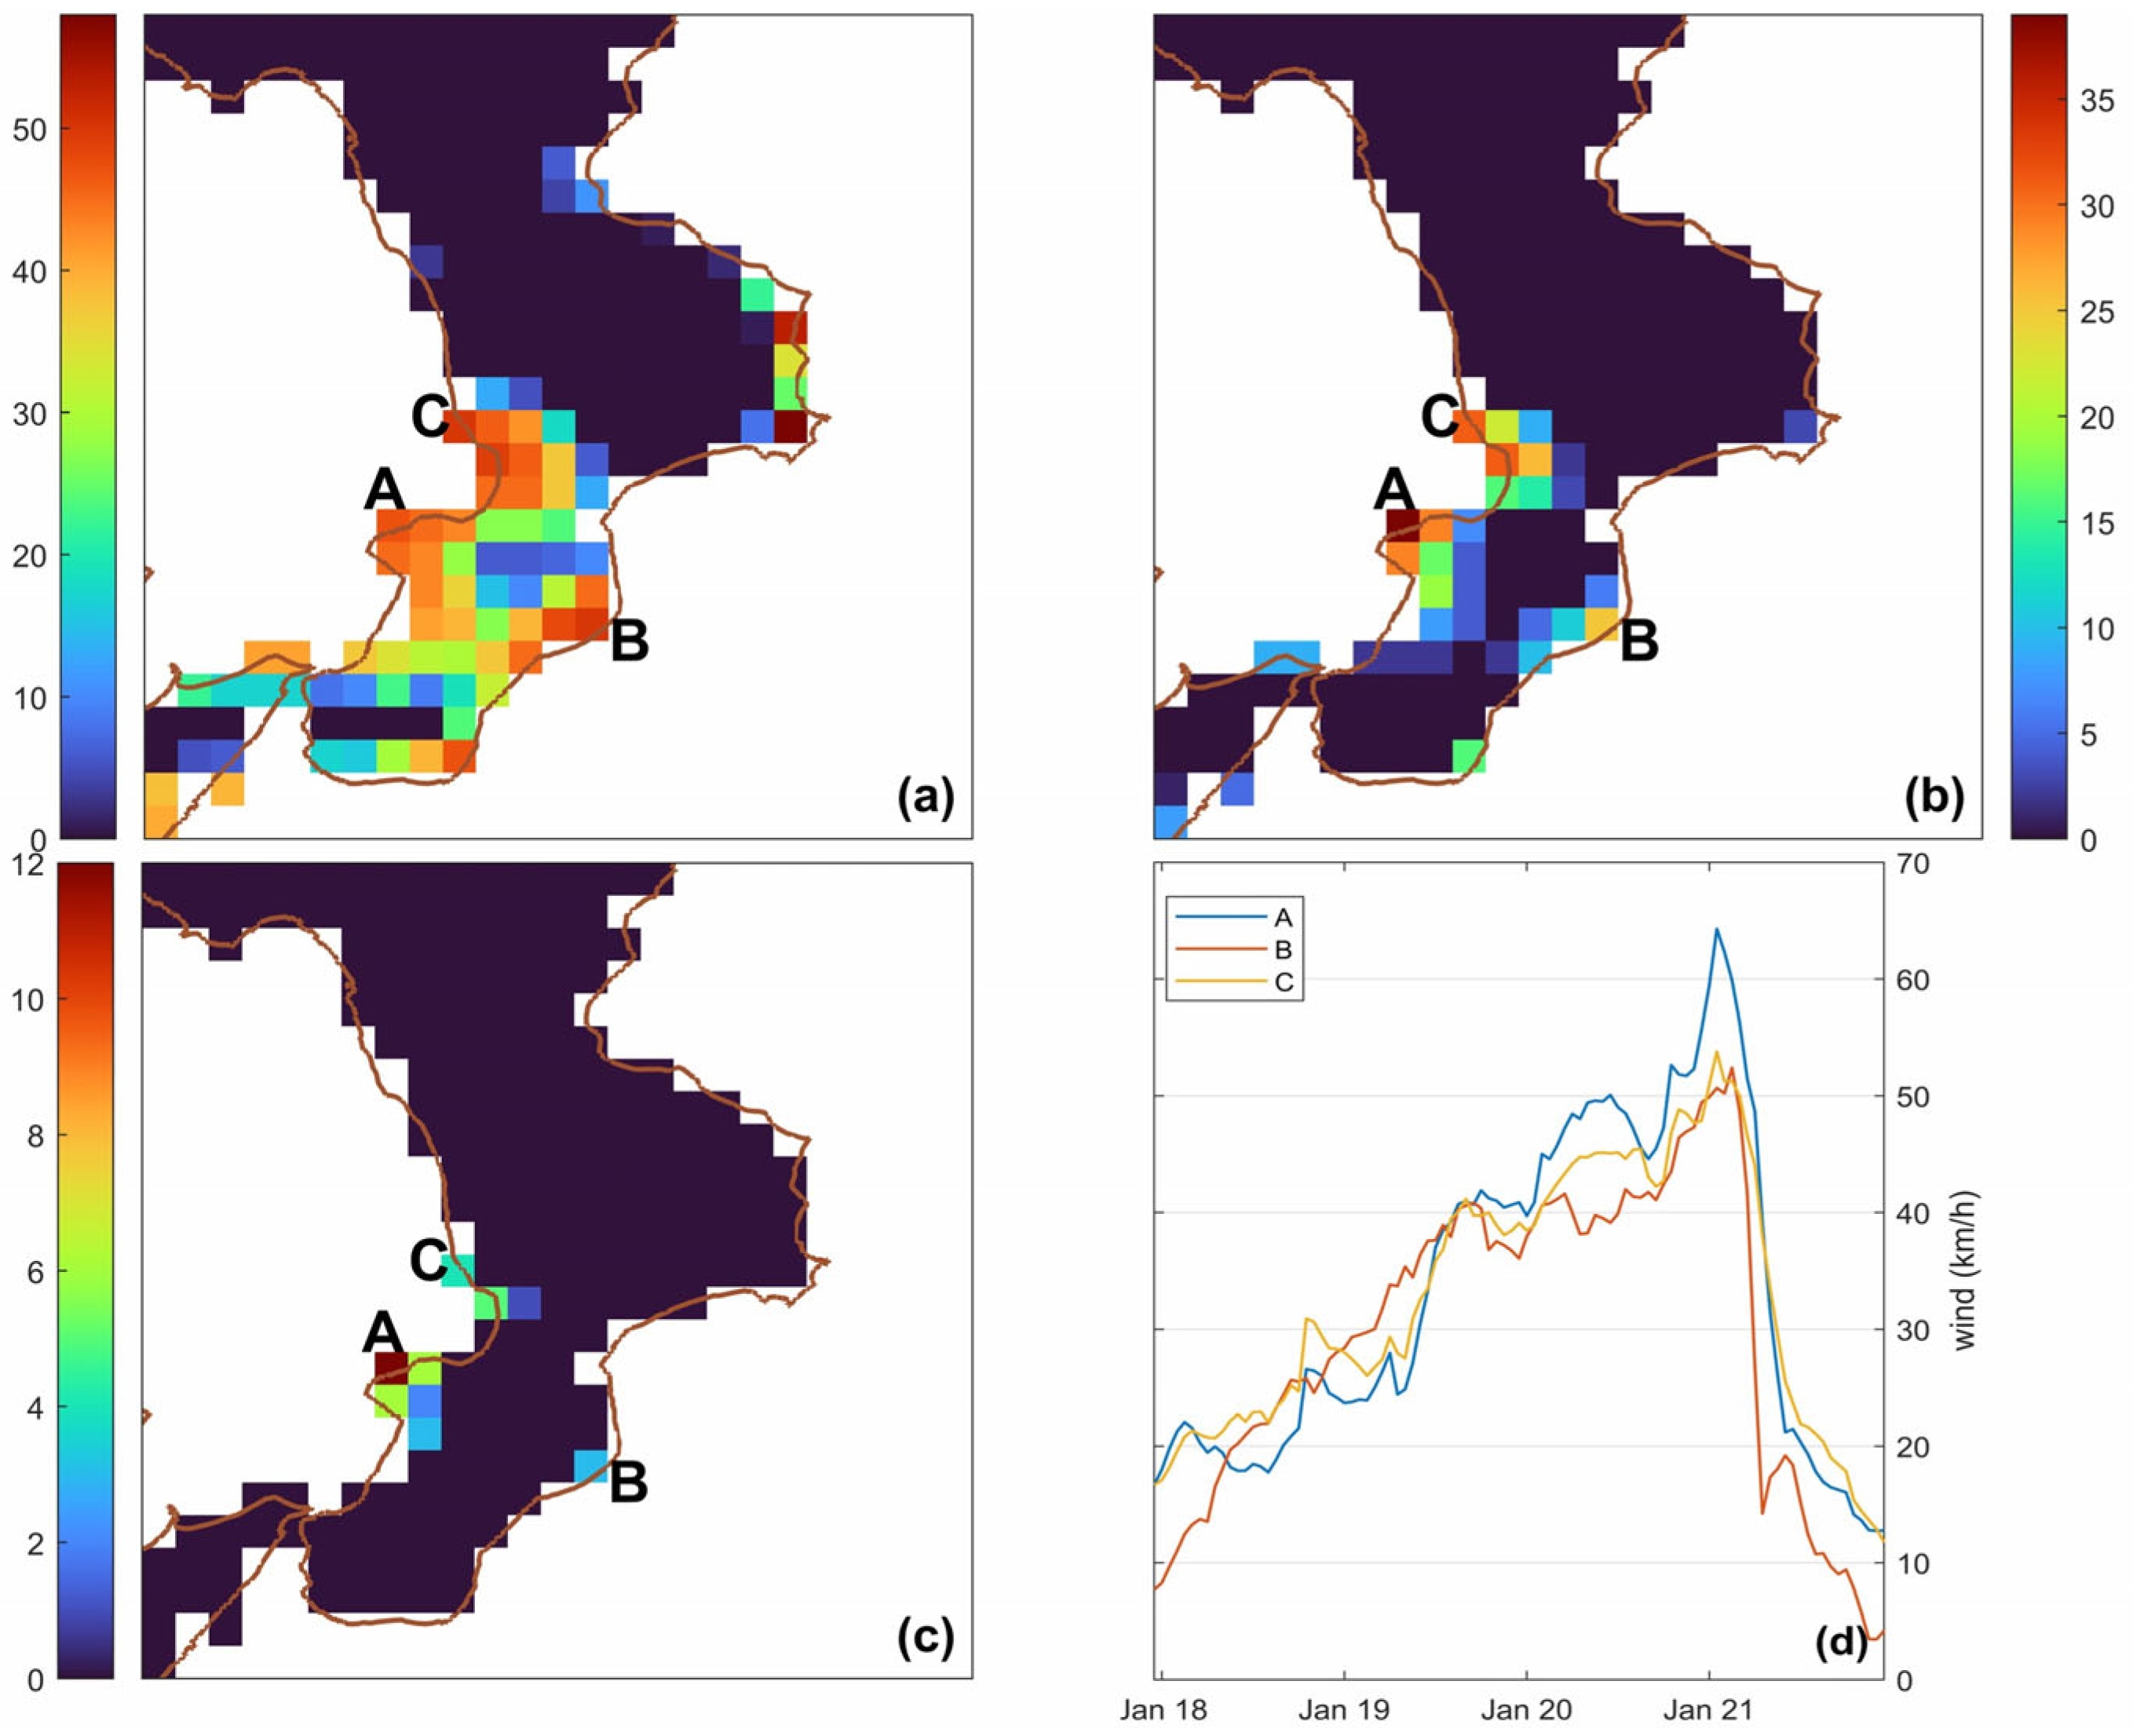
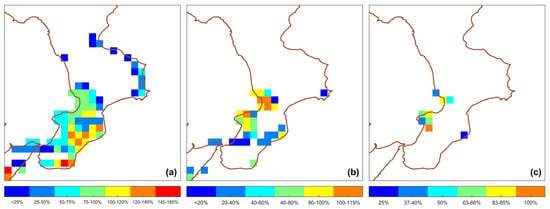
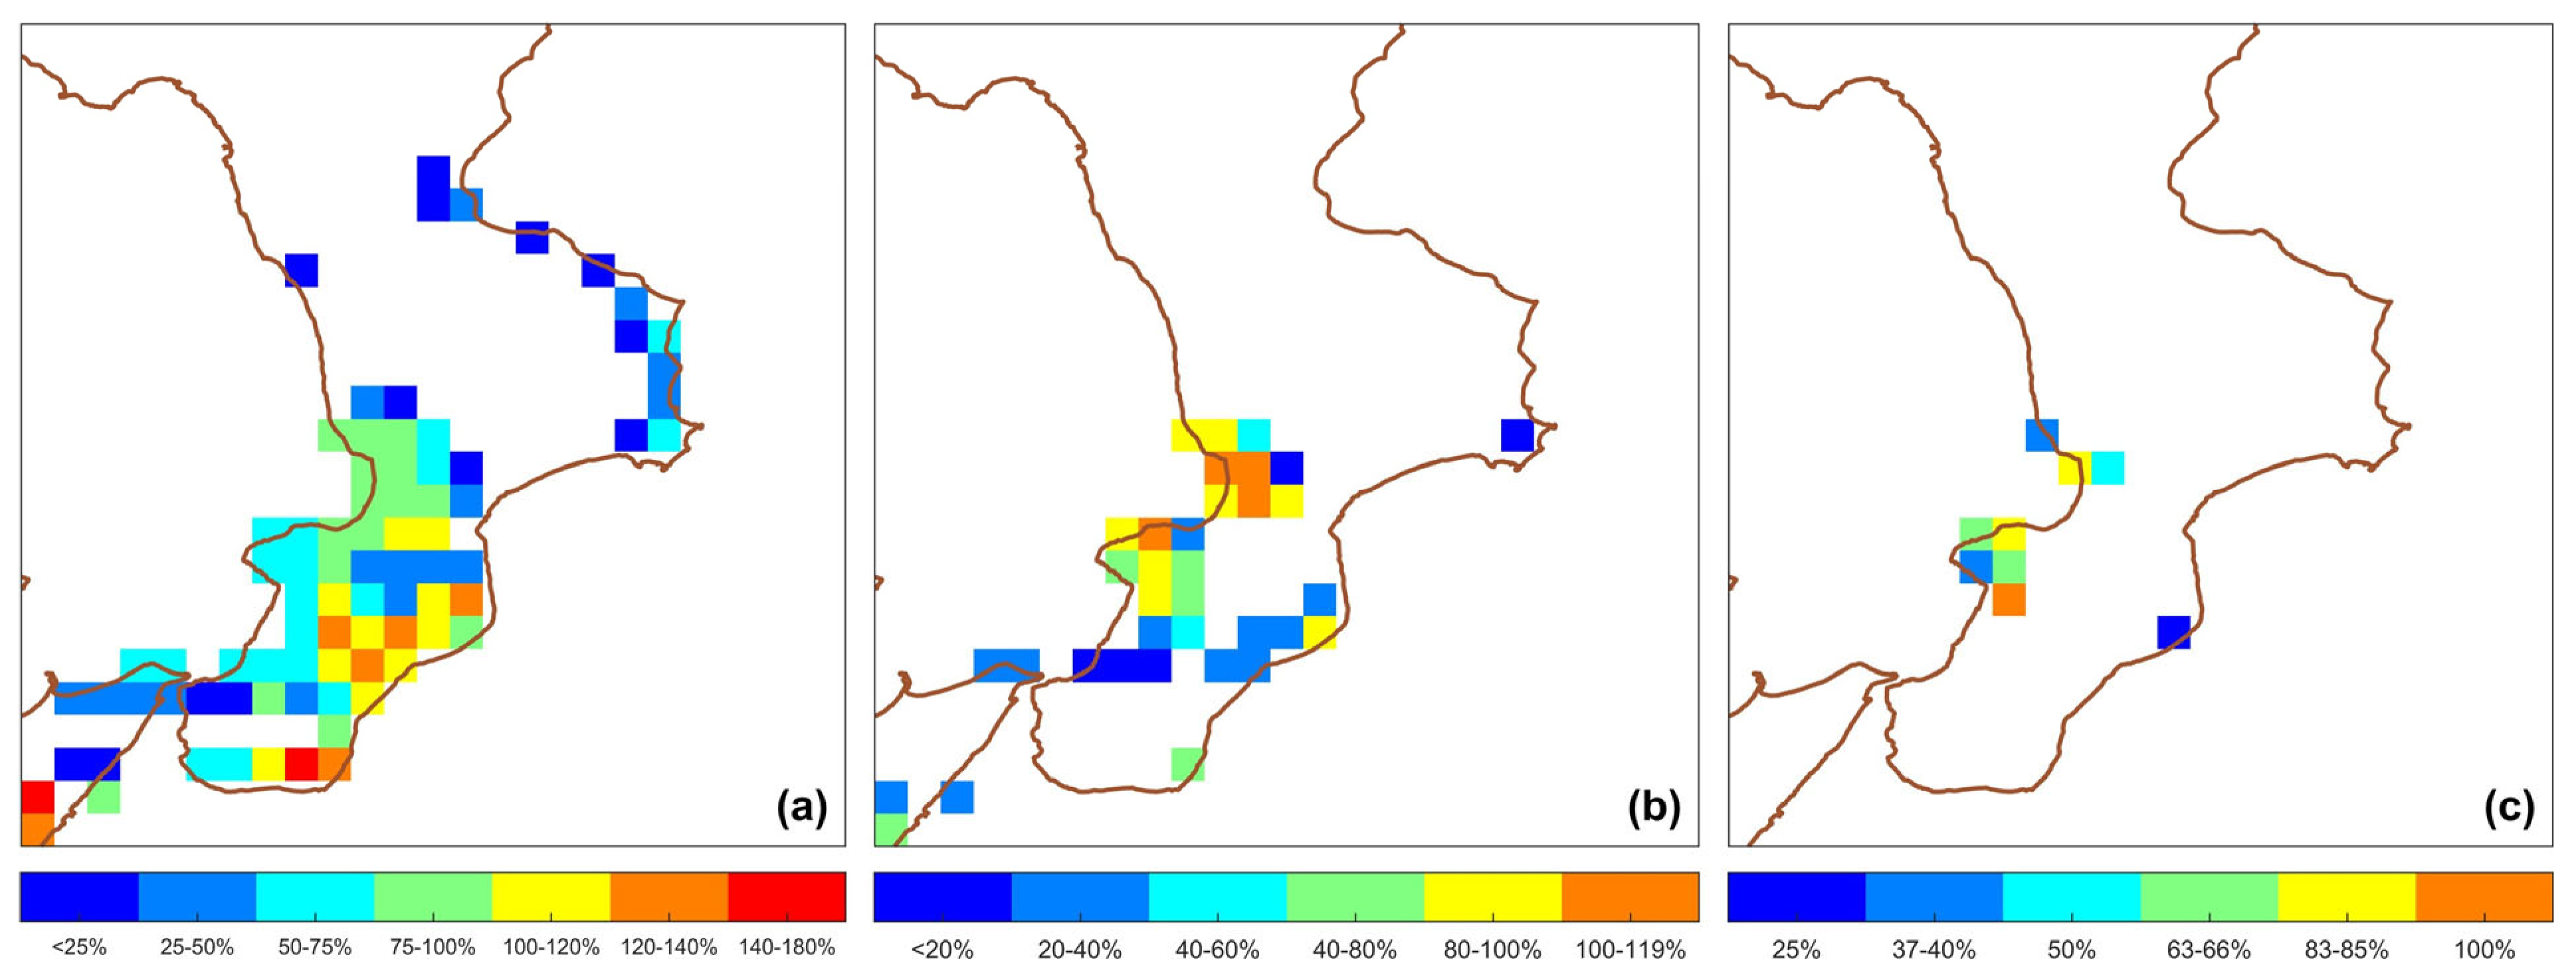
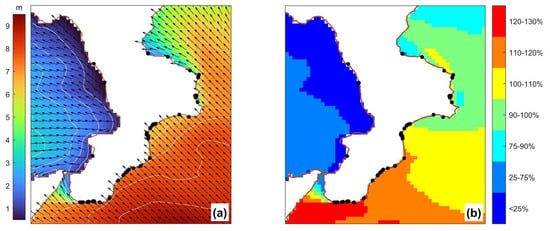
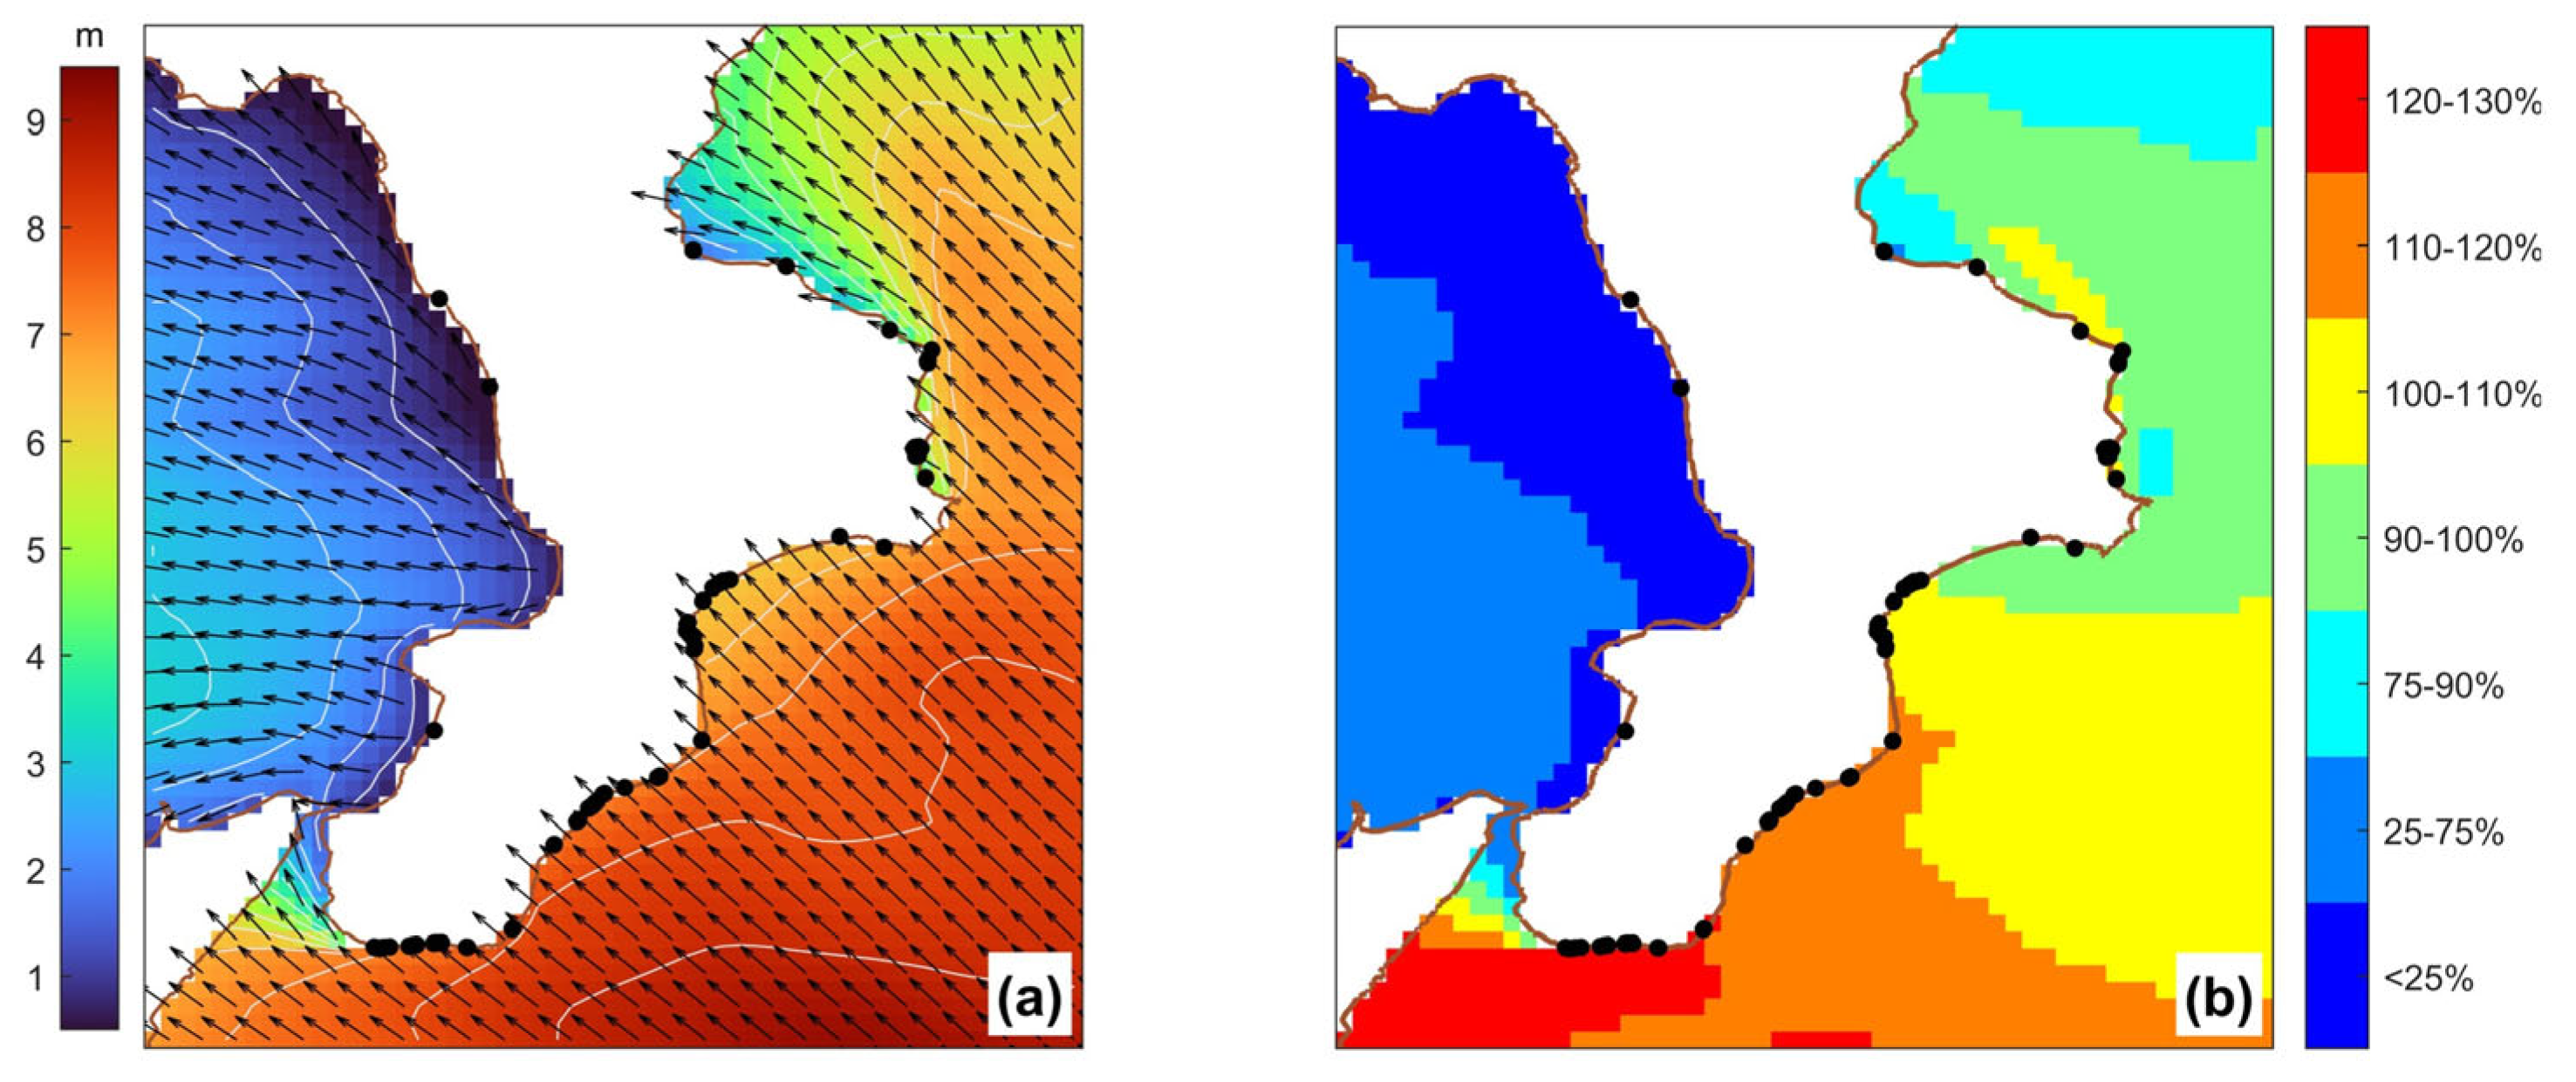
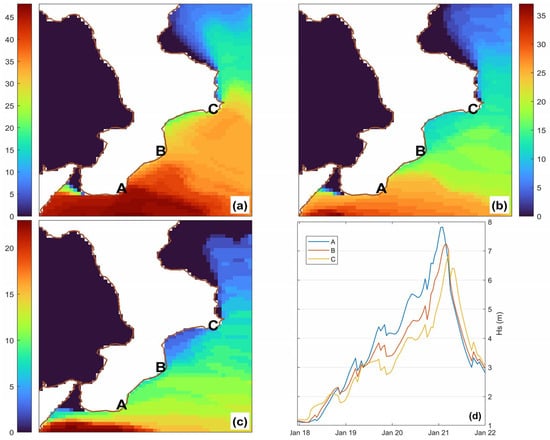
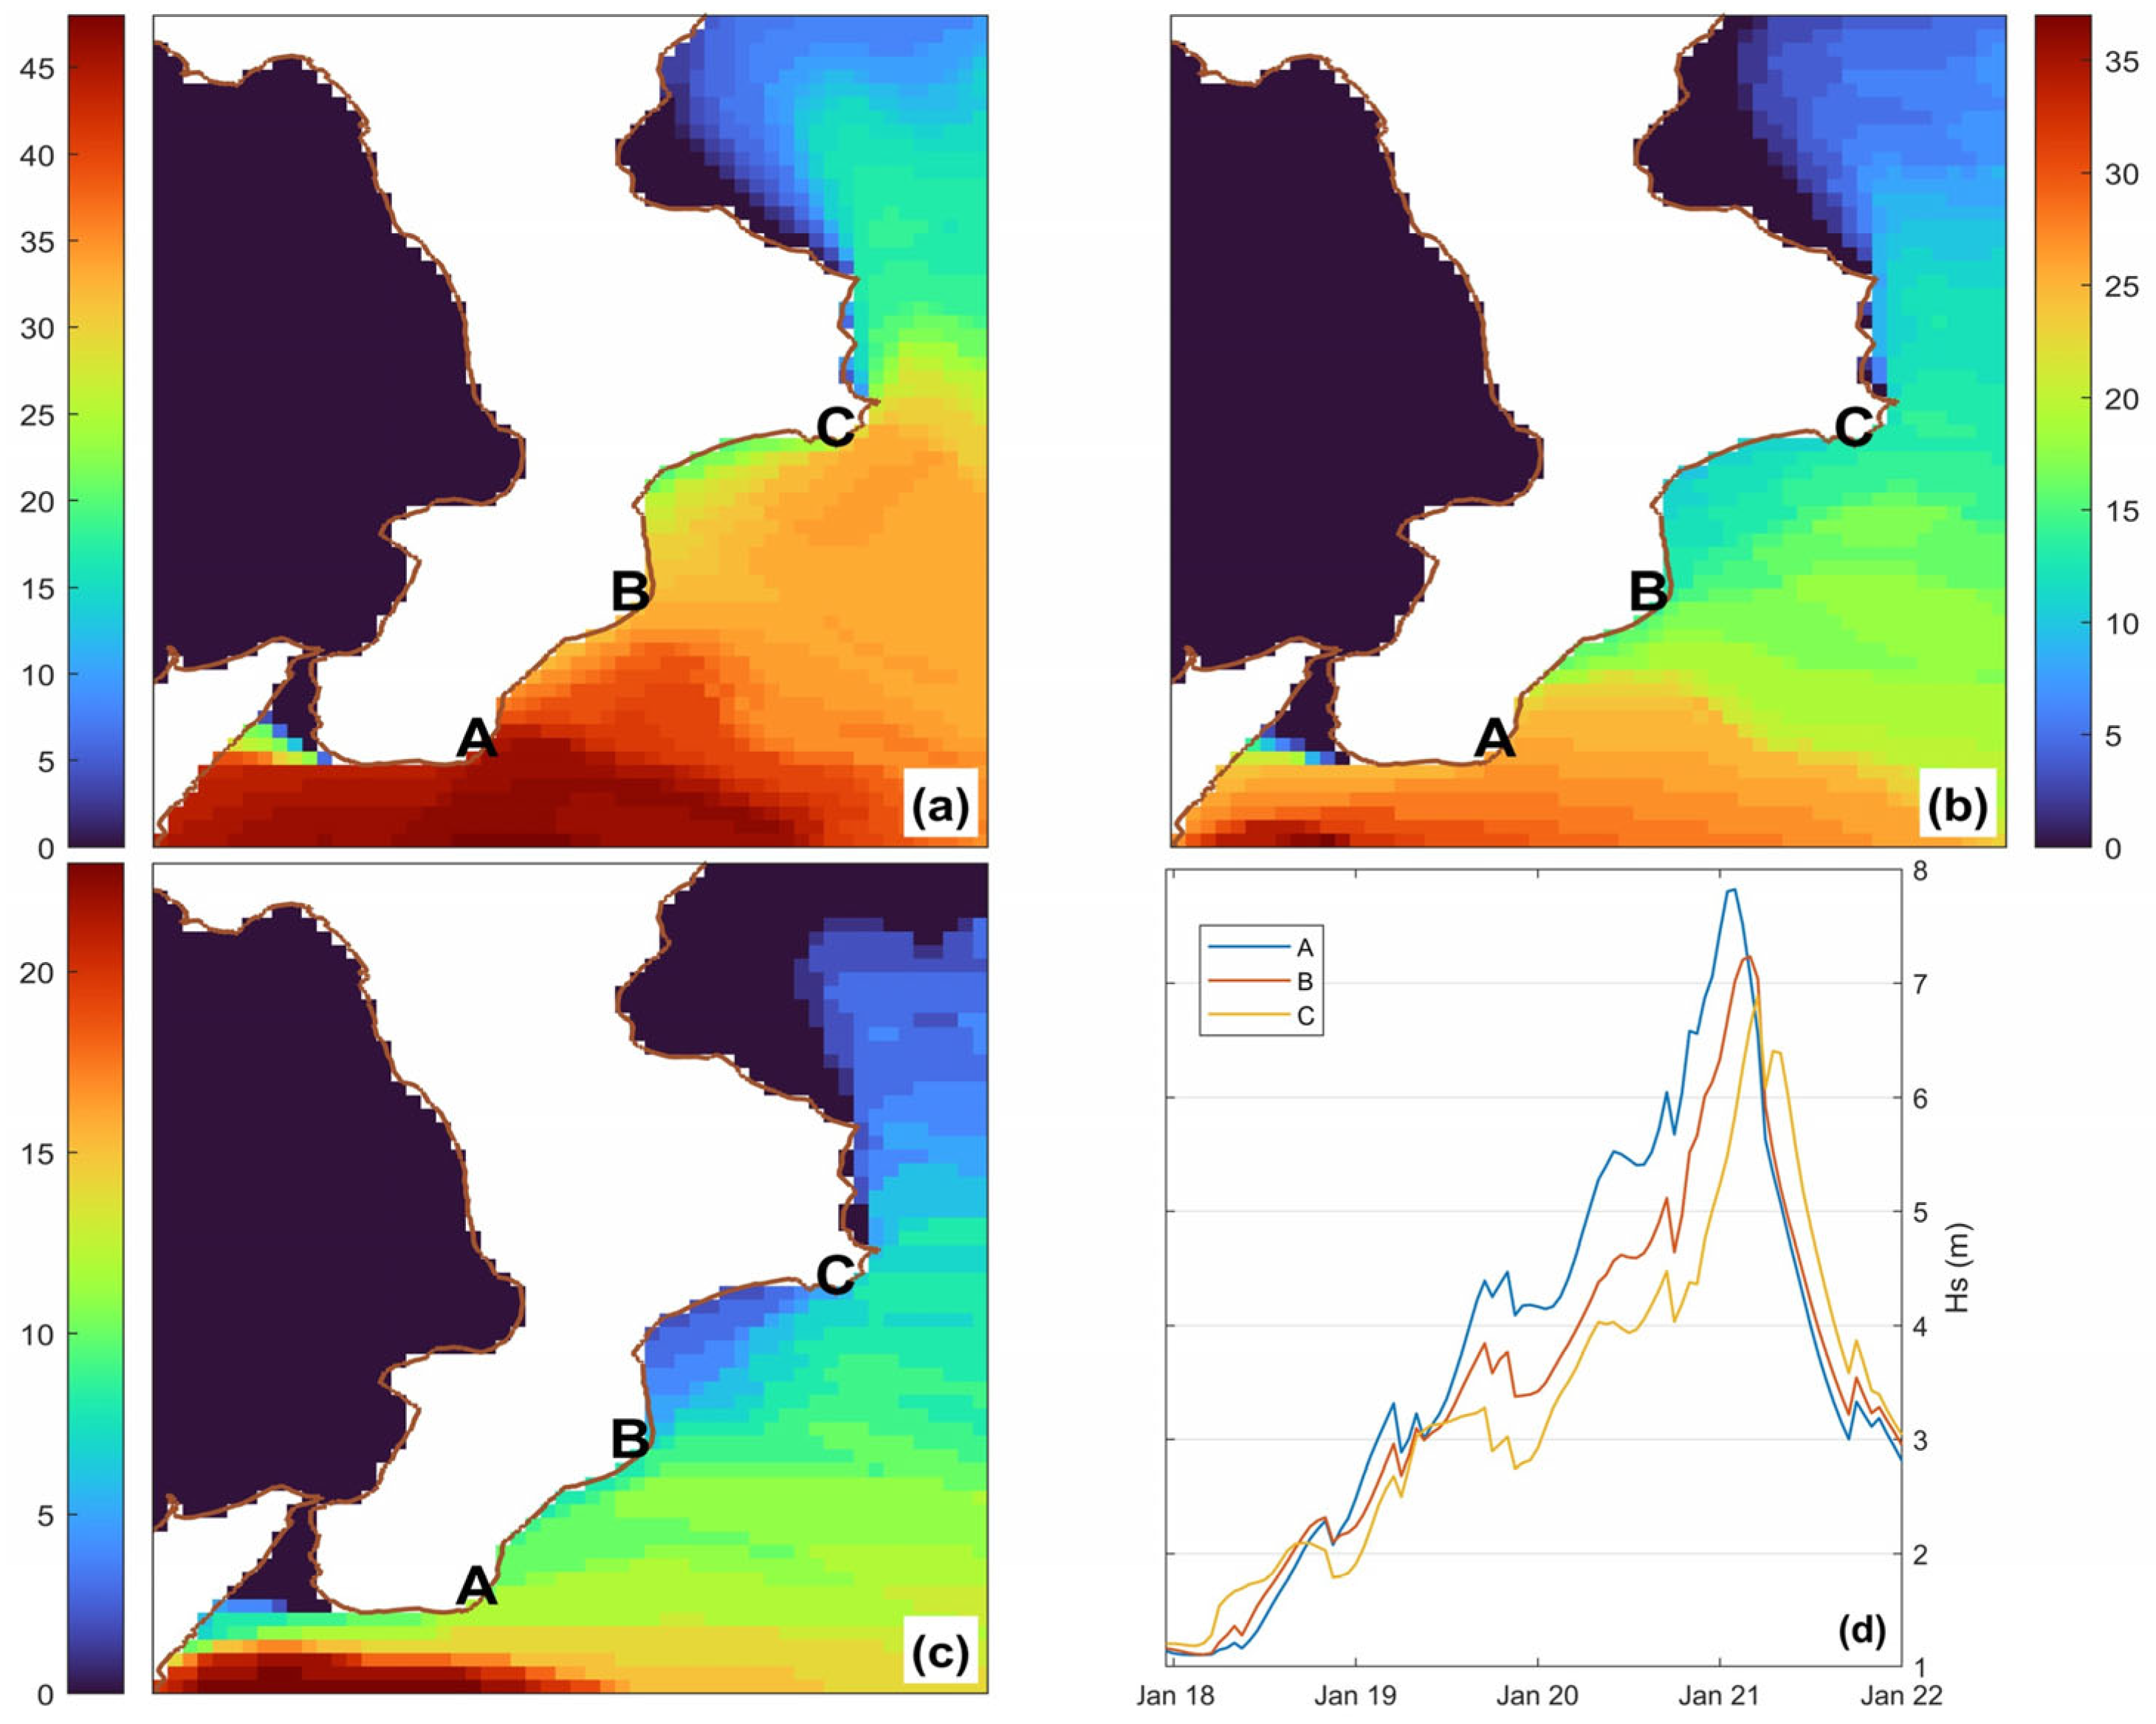
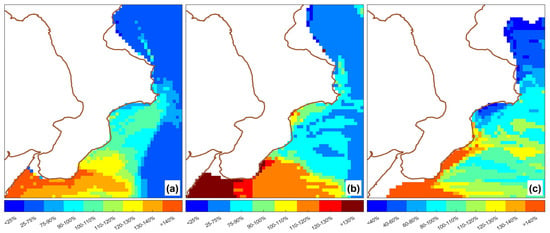
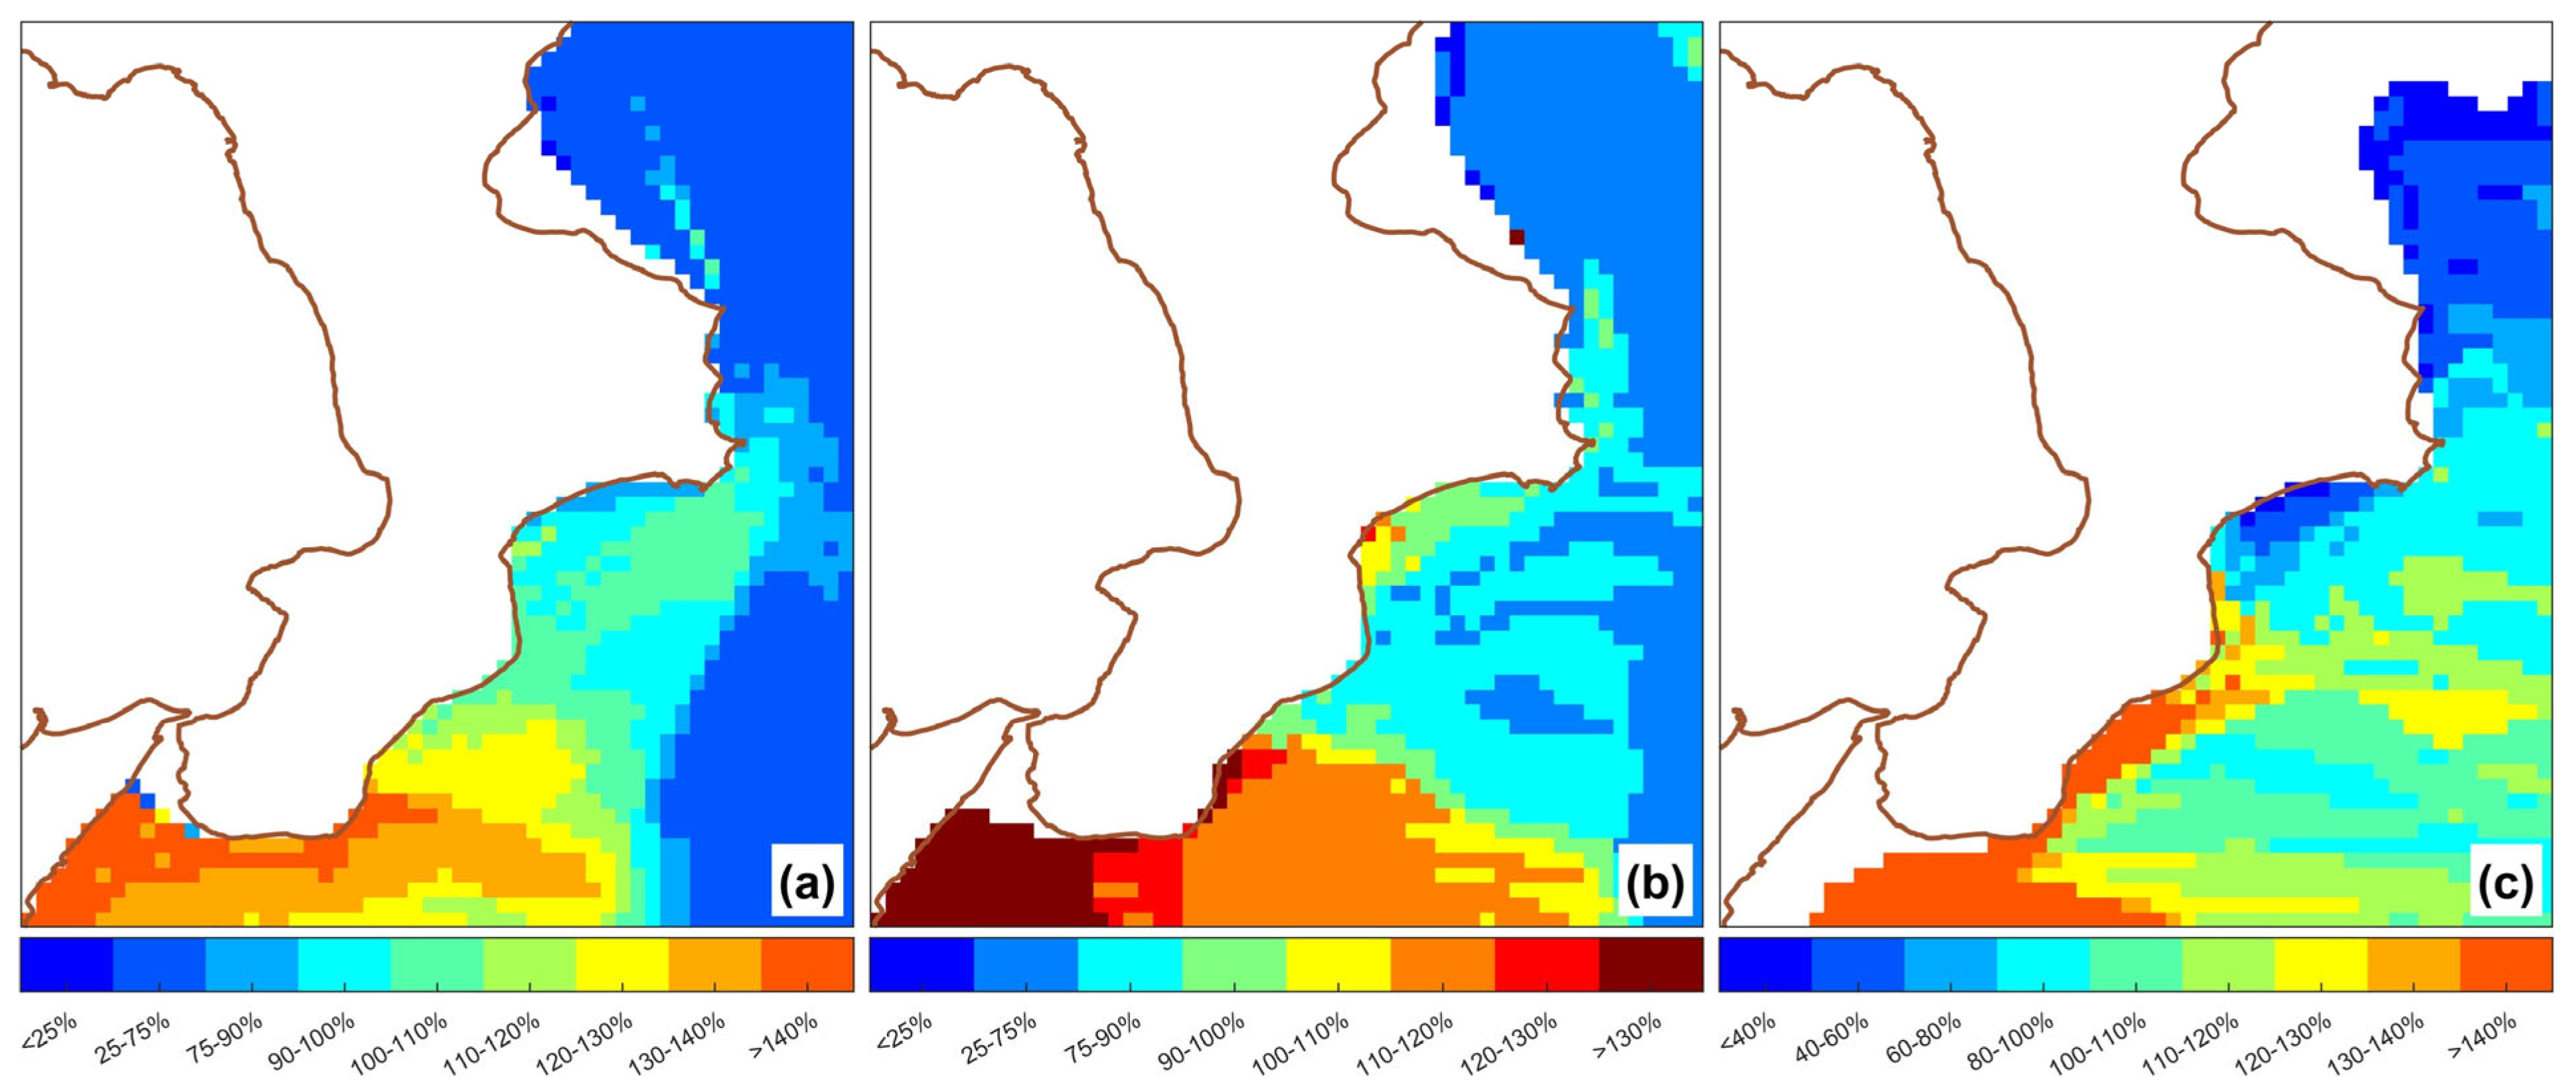
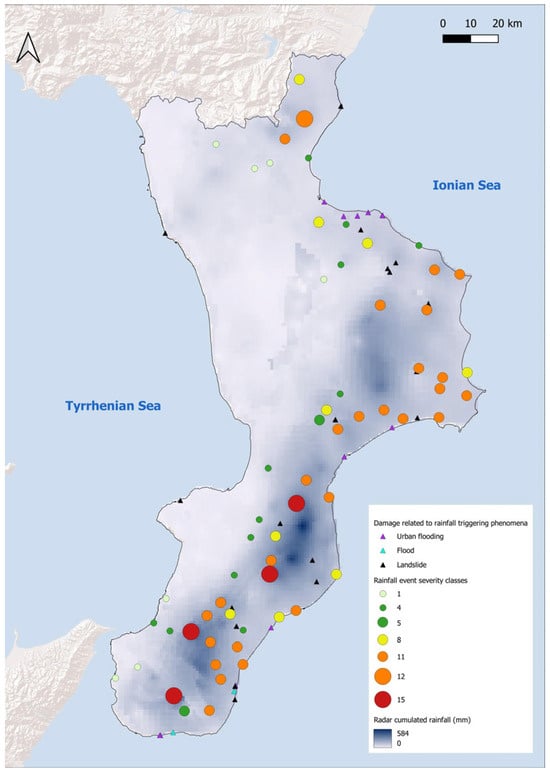
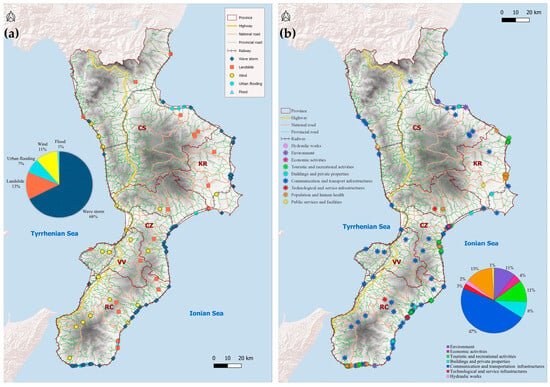
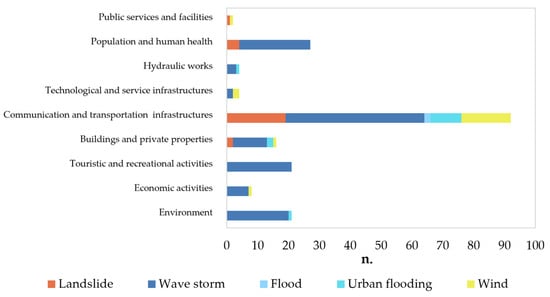
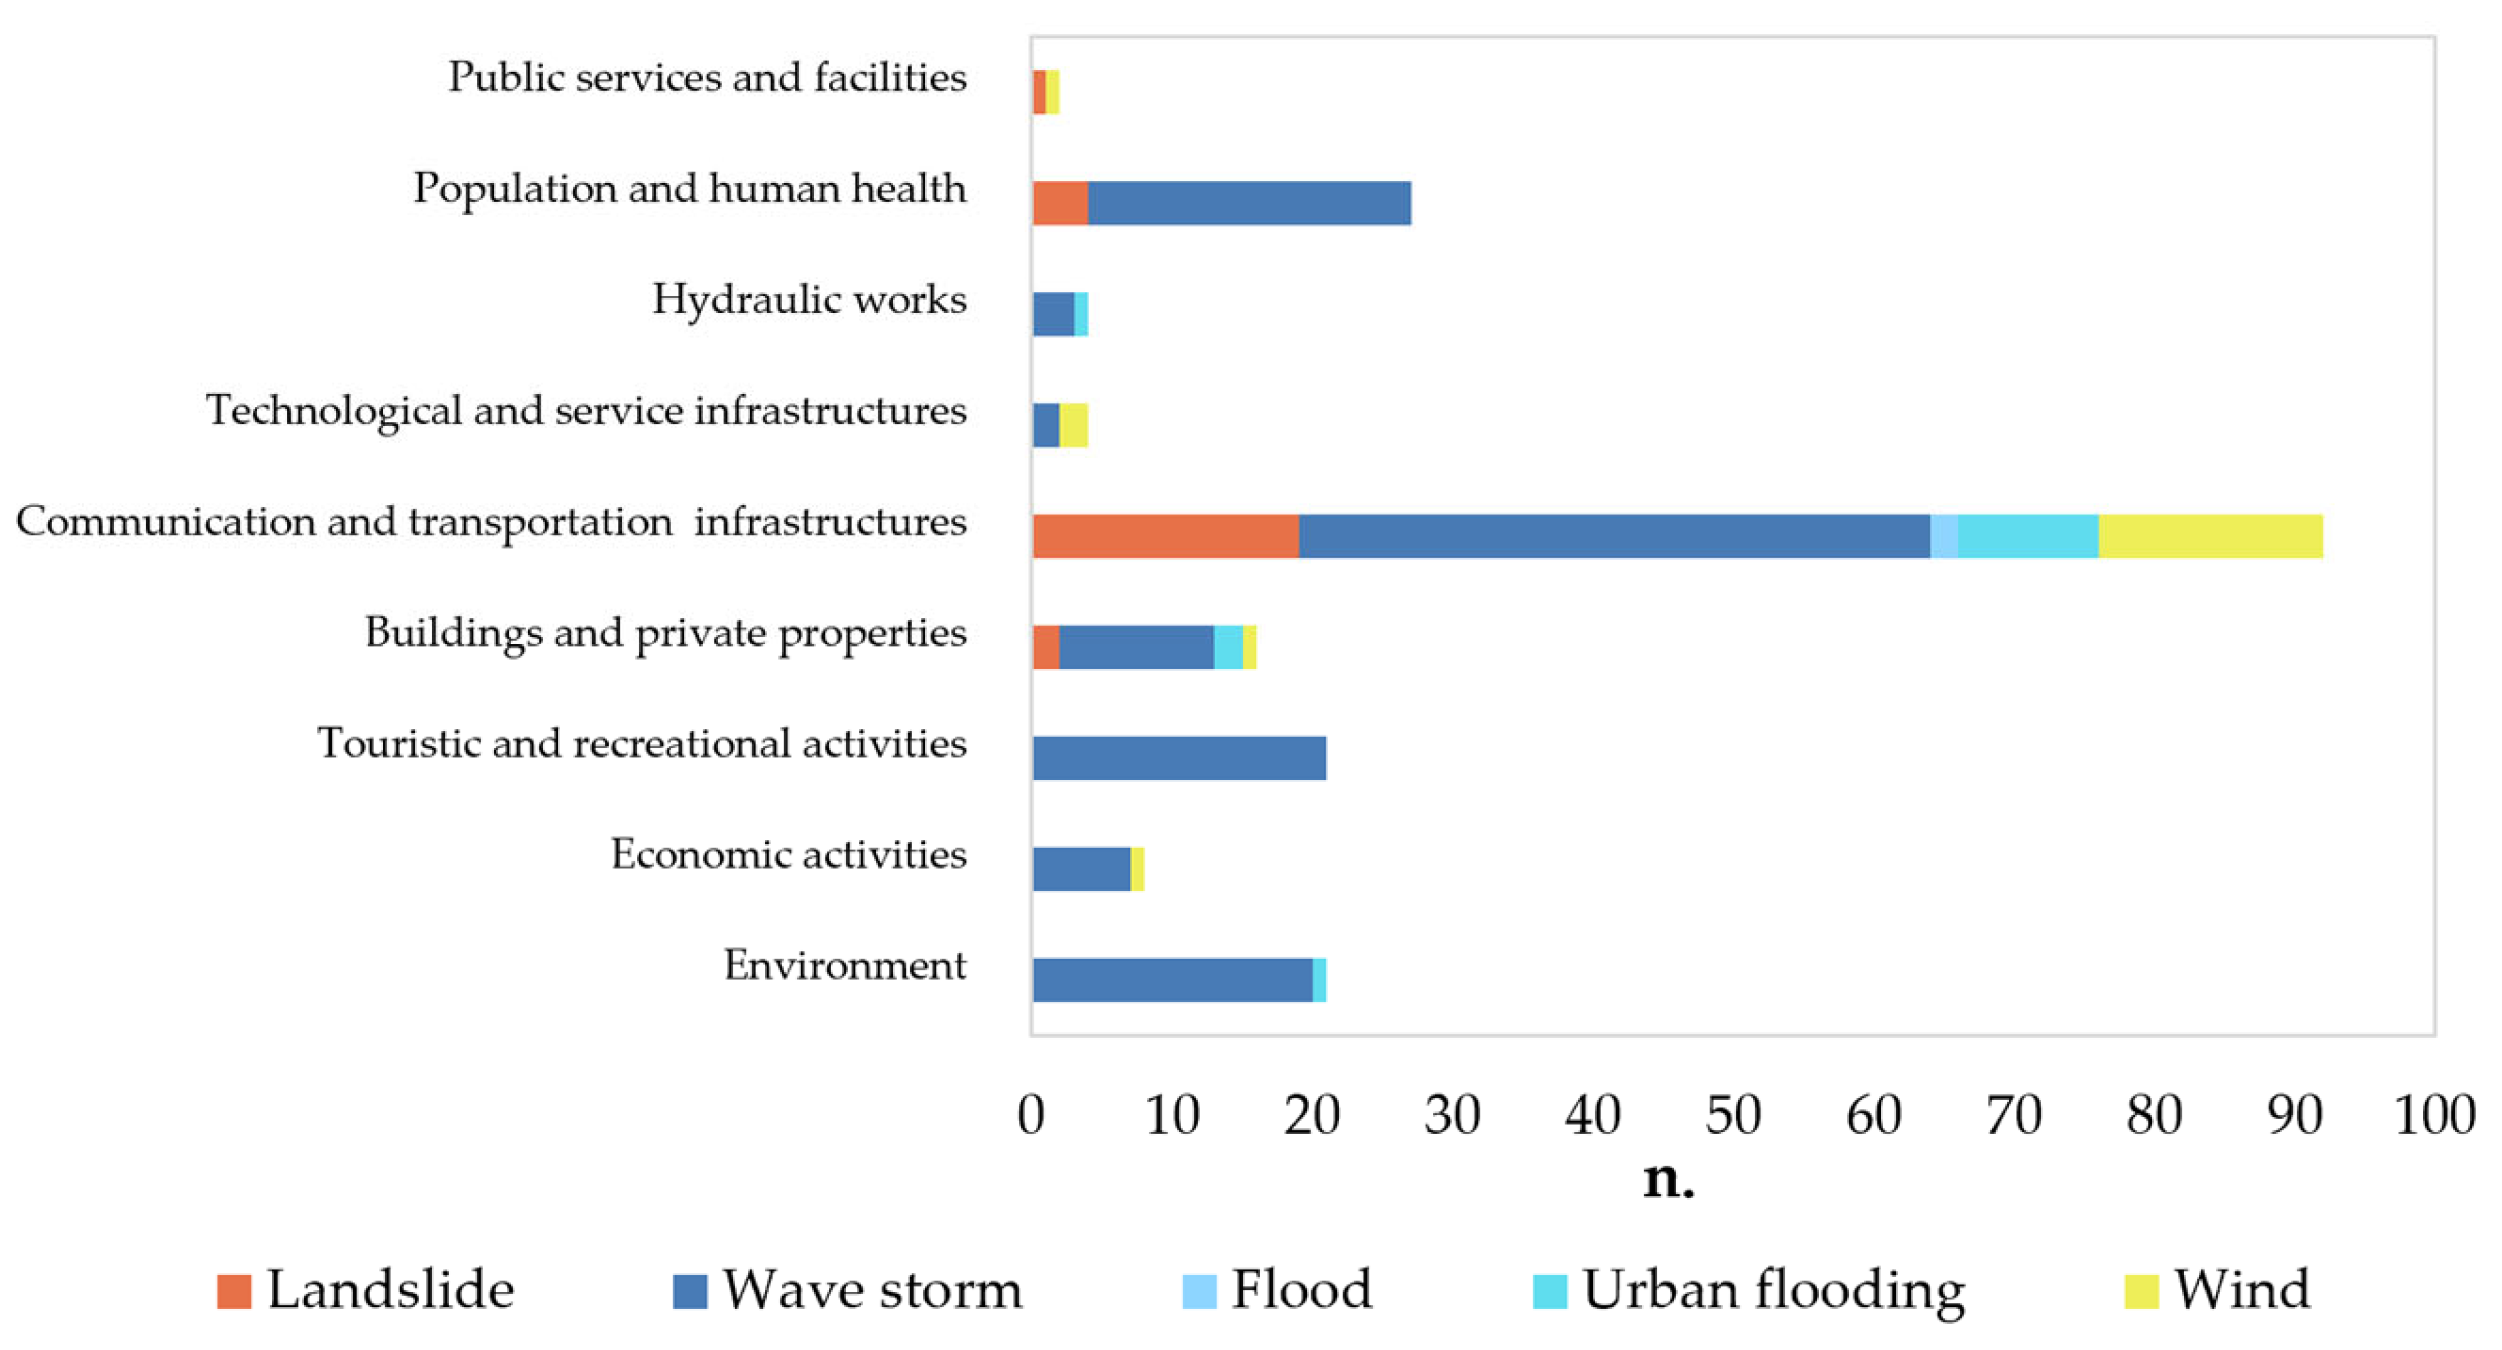
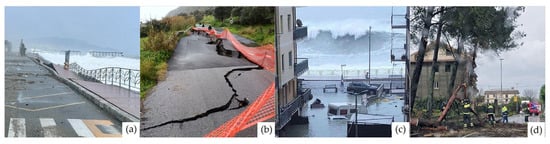
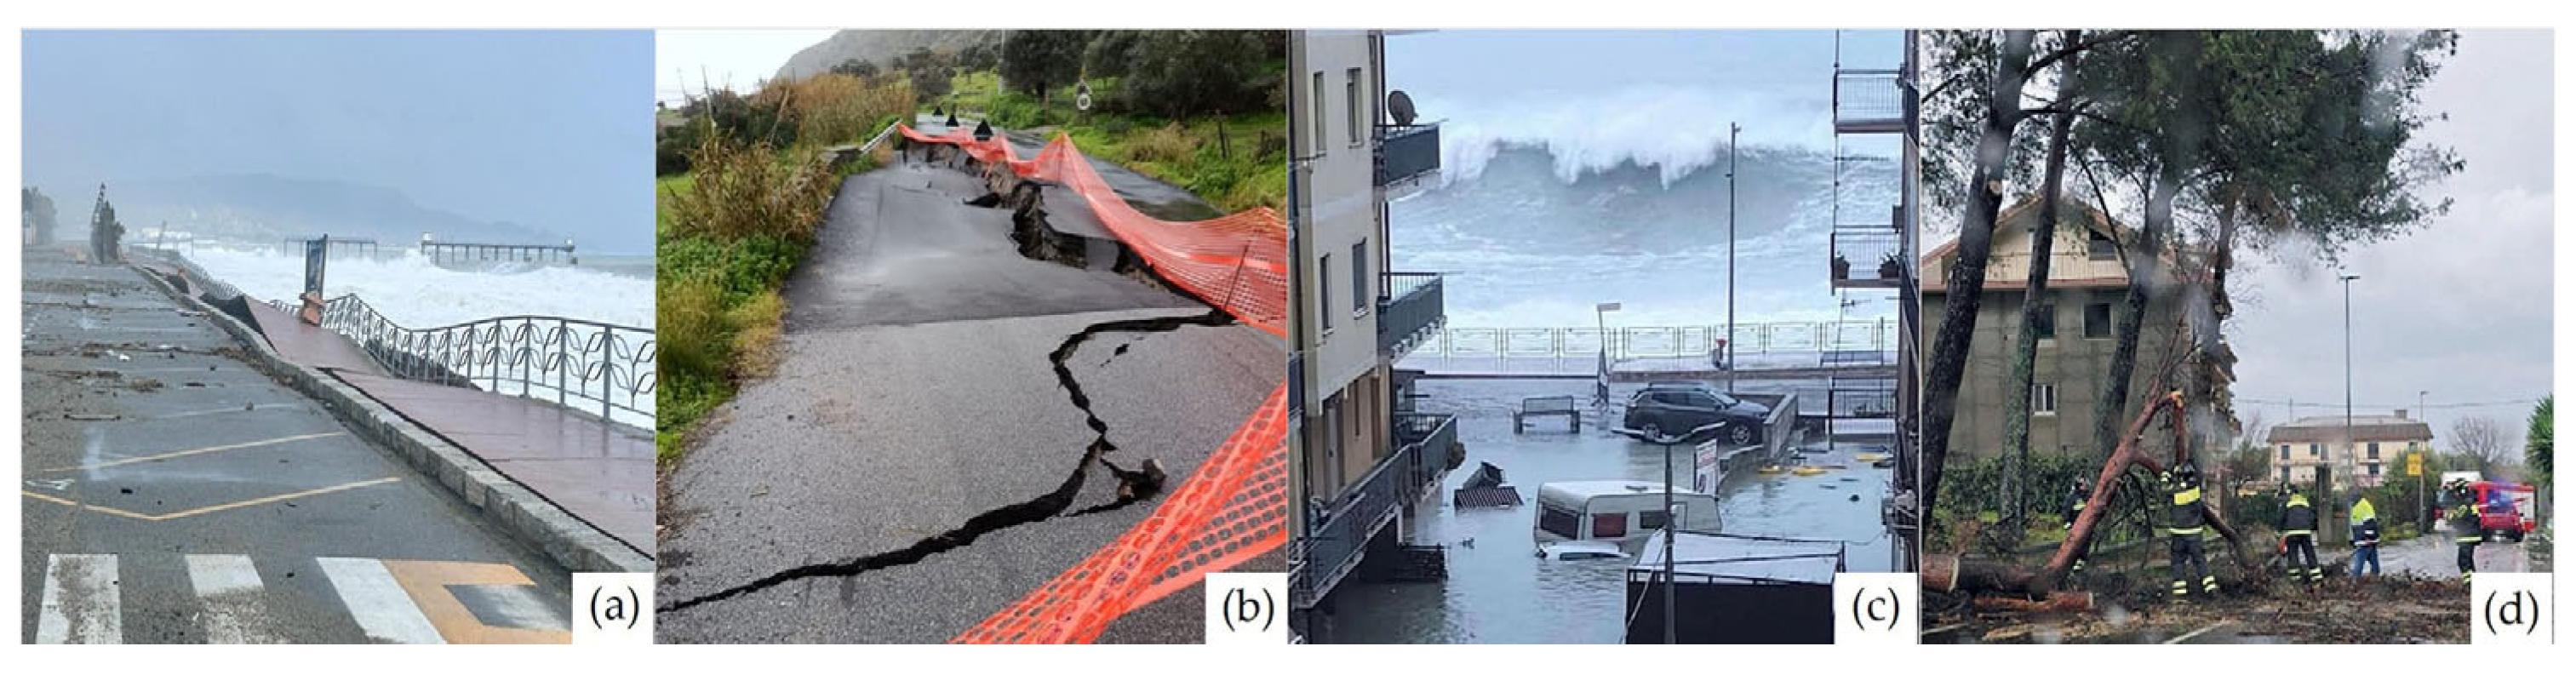
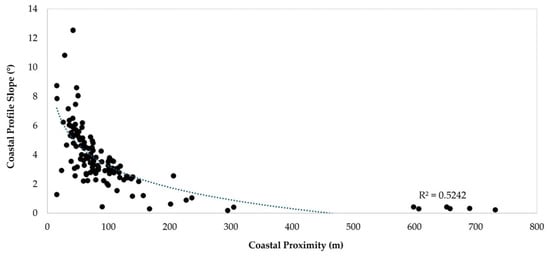
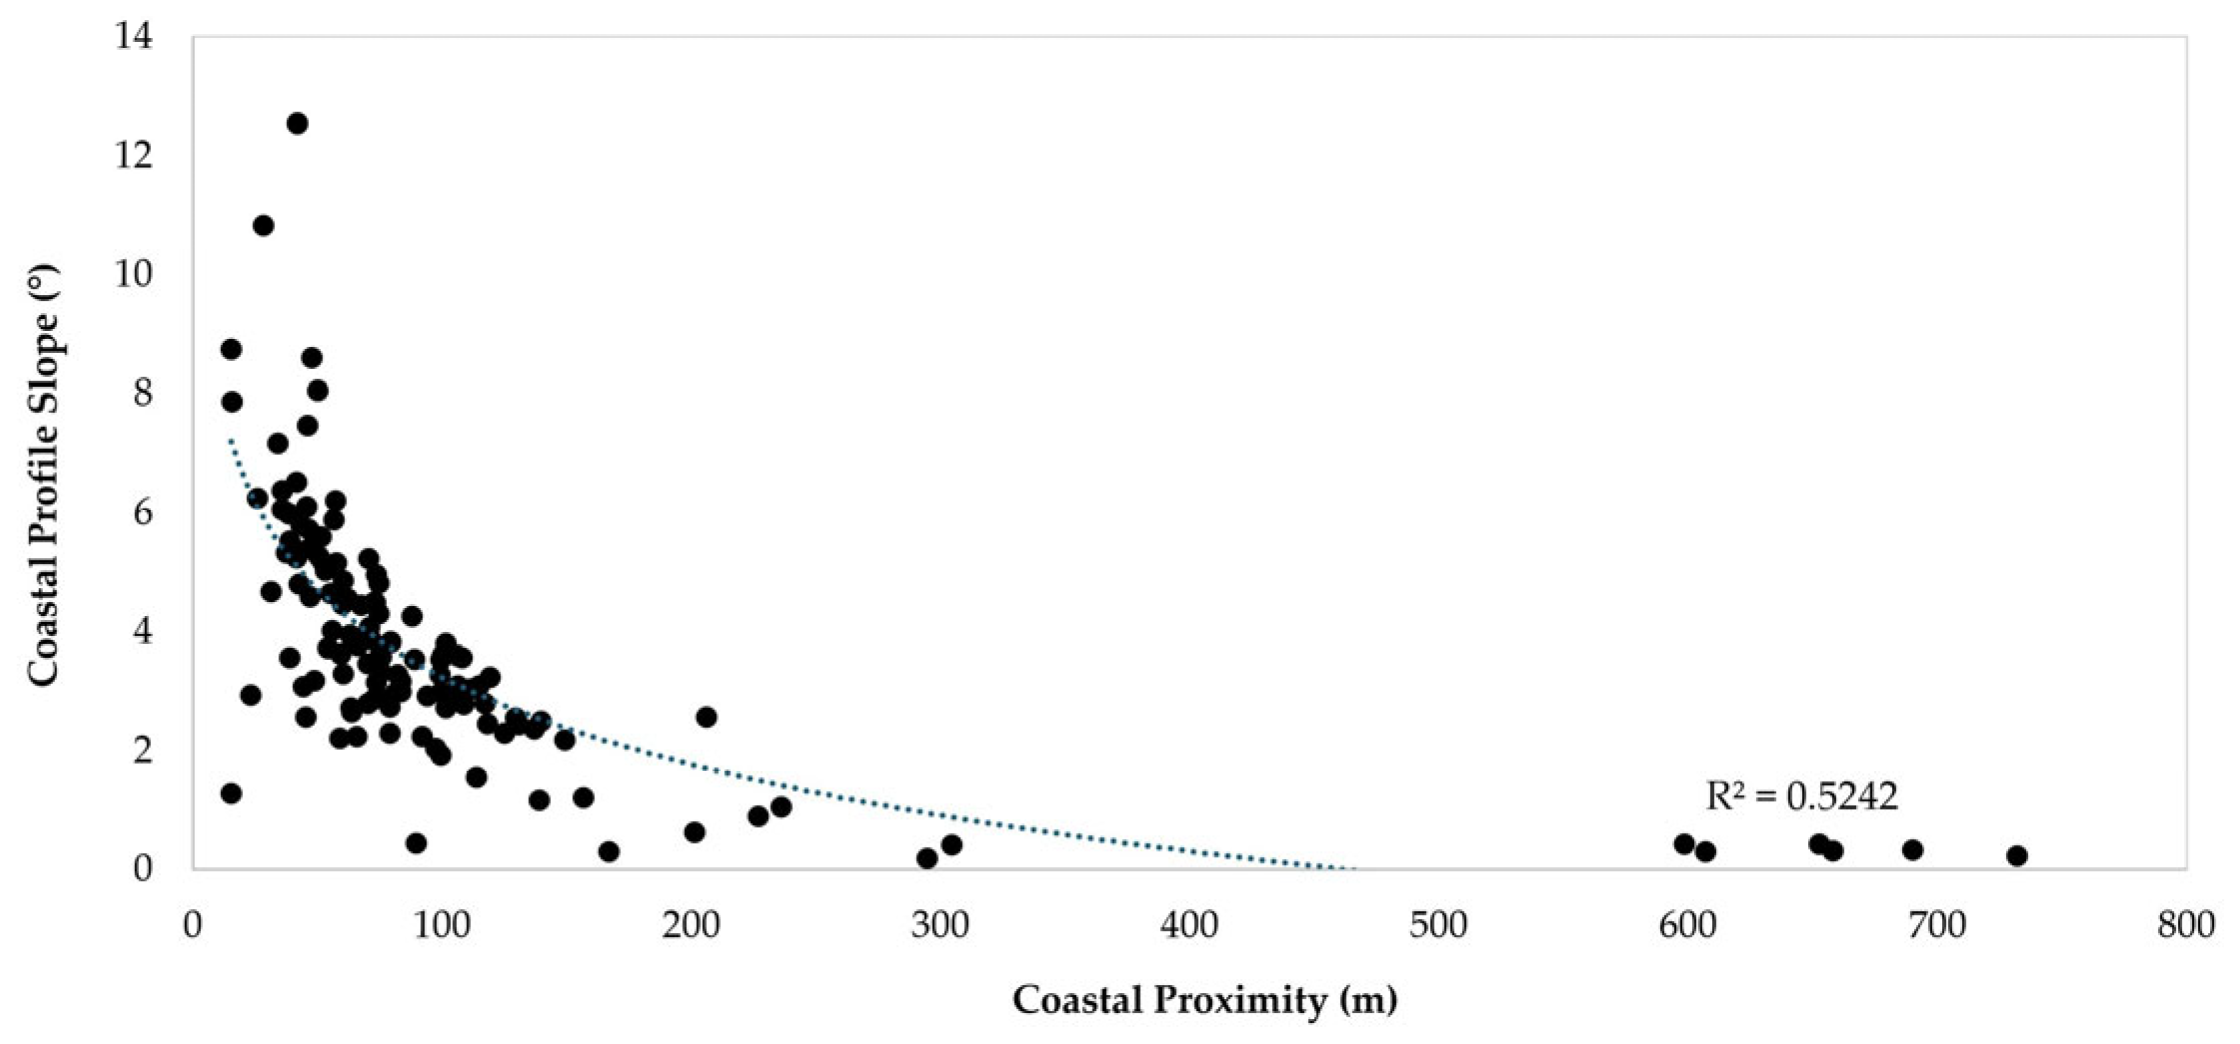



Disclaimer/Publisher’s Note: The statements, opinions and data contained in all publications are solely those of the individual author(s) and contributor(s) and not of MDPI and/or the editor(s). MDPI and/or the editor(s) disclaim responsibility for any injury to people or property resulting from any ideas, methods, instructions or products referred to in the content. |
© 2026 by the authors. Licensee MDPI, Basel, Switzerland. This article is an open access article distributed under the terms and conditions of the Creative Commons Attribution (CC BY) license.