Article

Precipitation-Driven Land Cover Dynamics in Türkiye: A Multi-Dataset Assessment Using CHIRPS, TerraClimate, and TRMM


1
Geography Department, Faculty of Arts and Sciences, Igdir University, Igdir 76000, Türkiye
2
Department of Geography, Nakhchivan State University, Nakhchivan AZ7012, Azerbaijan
3
Department of City and Regional Planning, Izmir Institute of Technology, Gülbahçe, Izmir 35430, Türkiye
4
Department of Civil Engineering, İstanbul Gelişim University, Istanbul 34310, Türkiye
*
Author to whom correspondence should be addressed.
Earth 2026, 7(4), 130; https://doi.org/10.3390/earth7040130
Submission received: 1 July 2026 / Revised: 22 July 2026 / Accepted: 22 July 2026 / Published: 4 August 2026

Abstract

This study investigates the spatiotemporal dynamics of Land Use/Land Cover (LULC) along precipitation gradients across Türkiye by integrating high-resolution satellite-based precipitation datasets (CHIRPS, TerraClimate, and TRMM) with the European Space Agency (ESA) WorldCover (10 m) product and multi-sensor Normalized Difference Vegetation Index (NDVI) composites (Landsat, MODIS, Sentinel-2). Türkiye’s heterogeneous climate, characterized by a sharp contrast between humid coastal belts and semi-arid interiors, serves as a natural laboratory to assess ecosystem responses to moisture availability. The results reveal a systematic and non-linear transformation of LULC classes as precipitation increases. In low-rainfall zones (200–400 mm), agricultural activities and bare surfaces predominate, reflecting human-induced land management in water-constrained environments. A critical ecological threshold was identified between 400 mm and 700 mm, where grassland areas expand rapidly, becoming the dominant class. Beyond the 900 mm isohyet, forest cover exhibits a sharp increase, approaching nearly 100% dominance in regions exceeding 1200 mm, effectively displacing other LULC categories. Comparative analysis of precipitation products shows that while all datasets capture the “coastal-wet/inland-dry” pattern, TRMM tends to overestimate winter precipitation (exceeding 100 mm), whereas CHIRPS and TerraClimate provide more conservative estimates (75–80 mm). Overlay analyses between seasonal NDVI and precipitation confirm a pronounced “time-lag effect” in vegetation phenology. Despite peak precipitation occurring in winter (~75 mm), NDVI reaches its minimum (~0.03) due to thermal limitations and dormancy. Conversely, vegetation greenness peaks during the dry summer months (NDVI ~0.14 to 0.40), utilizing antecedent soil moisture stored during the spring recharge. High-resolution Sentinel-2 data proved superior in delineating micro-topographic vegetation responses compared to Landsat and MODIS. These findings provide a scientific baseline for sustainable land management and climate adaptation strategies, highlighting that precipitation thresholds are the primary determinants of Türkiye’s ecological boundaries.

1. Introduction

The dynamics of land cover are changing rapidly due to the combined effects of climate change and growing anthropogenic pressures, which exert a strong influence on ecosystem structure and function [1,2,3]. Such alterations are not merely reflective of a change in surface features but also deeper changes in biogeophysical and biogeochemical processes that govern ecosystem activity. Therefore, to better interpret ecosystem reactions, gauge environmental resilience, and understand the effects of global change agents on ecological processes, it is necessary to know the dynamics of land cover [4,5]. Particularly in semi-arid and arid regions, the spatial and temporal distribution of precipitation stands out as a decisive control mechanism over land cover. In this context, studying land cover changes along precipitation gradients is of great importance for understanding the responses of ecosystems to climate variability [6,7].
Türkiye has a highly heterogeneous precipitation regime due to its location at the intersection of different climate types [8,9,10]. While high and regular rainfall is observed along the Black Sea coast, drier and more variable rainfall conditions prevail in the Central and Eastern Anatolia regions [11]. This diversity directly affects the spatial distribution of land cover, leading to the formation of different classes such as forests, pastures, agricultural areas, and bare surfaces. Therefore, studying land cover changes related to precipitation gradients across Türkiye is a critical research area for the sustainability of both natural ecosystems and agricultural production [12,13,14].
In recent years, the development of remote sensing and re-analysis datasets has made it possible to conduct long-term and high-resolution environmental analyses. Datasets such as CHIRPS (Climate Hazards Group InfraRed Precipitation with Station data), TerraClimate, and TRMM (Tropical Rainfall Measuring Mission), which are widely used in obtaining precipitation data, provide reliable information at different spatial and temporal resolutions [15,16]. The combined use of these datasets allows for a more comprehensive assessment of both long-term trends and short-term variability of precipitation. On the other hand, the ESA WorldCover dataset, used in land cover classifications, provides detailed land cover information on a global scale thanks to its high spatial resolution (10 m). In the literature, studies examining the relationship between land cover and precipitation have generally been limited to specific regions or have been based on analyses from a single dataset. However, the number of studies integrating different data sources is limited, and research that addresses land cover dynamics related to precipitation gradients with a holistic approach, especially on a Turkish scale, is not sufficiently developed. This situation necessitates demonstrating the advantages of using multi-source datasets together [17,18].
This research seeks to answer the following questions, which previous studies have not fully addressed: Under Türkiye’s heterogeneous climate regime, to what extent do different remote sensing-based precipitation datasets (CHIRPS, TerraClimate, TRMM) show consistent relationships with land cover classes, and under what conditions do the sensitivity differences between these datasets become most apparent? At which specific precipitation thresholds do nonlinear transitions between land cover classes occur along the precipitation gradient, and how can these thresholds be mapped at high resolution across the national scale? Finally, how much of a time-lag does vegetation’s phenological response to precipitation variability exhibit at the seasonal scale, particularly in semi-arid interior regions, and how can this lag be spatially demonstrated using multi-sensor NDVI data?
The existing literature has generally offered only partial answers to these questions, relying on single-source datasets, regional-scale analyses, or approaches that assume linear relationships. For instance, Karabulut [19] used NDVI time series to evaluate how extreme meteorological events, such as drought and excessive moisture, affect vegetation dynamics, focusing on the physiological resistance and temporal adaptation of different vegetation types under stress conditions. Similarly, Çelik [20] highlighted the value of integrating remote sensing data with climatic variables to determine the spatial extent and severity of drought, comparing the performance of different remote sensing- and climate-based drought assessment approaches. While such studies demonstrate the utility of individual remote sensing products for characterizing vegetation–climate interactions, they remain confined to single data sources or specific stress events, and studies providing an integrated, threshold-focused, and nationally scaled framework using multi-source data remain limited.
This study addresses this gap by integrating multi-source precipitation data (CHIRPS, TerraClimate, and TRMM) with ESA WorldCover and multi-sensor NDVI (Landsat, MODIS, Sentinel-2) products. The novelty of the research lies in presenting a comparative analysis of the spectral and spatial sensitivities of different remote sensing products, as well as in concretizing the control mechanism of climatic variability on land cover within a high-resolution spatial framework. The main objective of this study is to analyze land cover dynamics along precipitation gradients across Türkiye and to reveal these relationships through the integration of land cover data with different satellite-based precipitation datasets. In this context, long-term precipitation data (1998–2019) from CHIRPS, TerraClimate, and TRMM datasets are spatially overlaid with the 2021 ESA WorldCover land cover map to analyze the relationship between precipitation and land cover distribution.

2. Data and Methods

2.1. Study Area

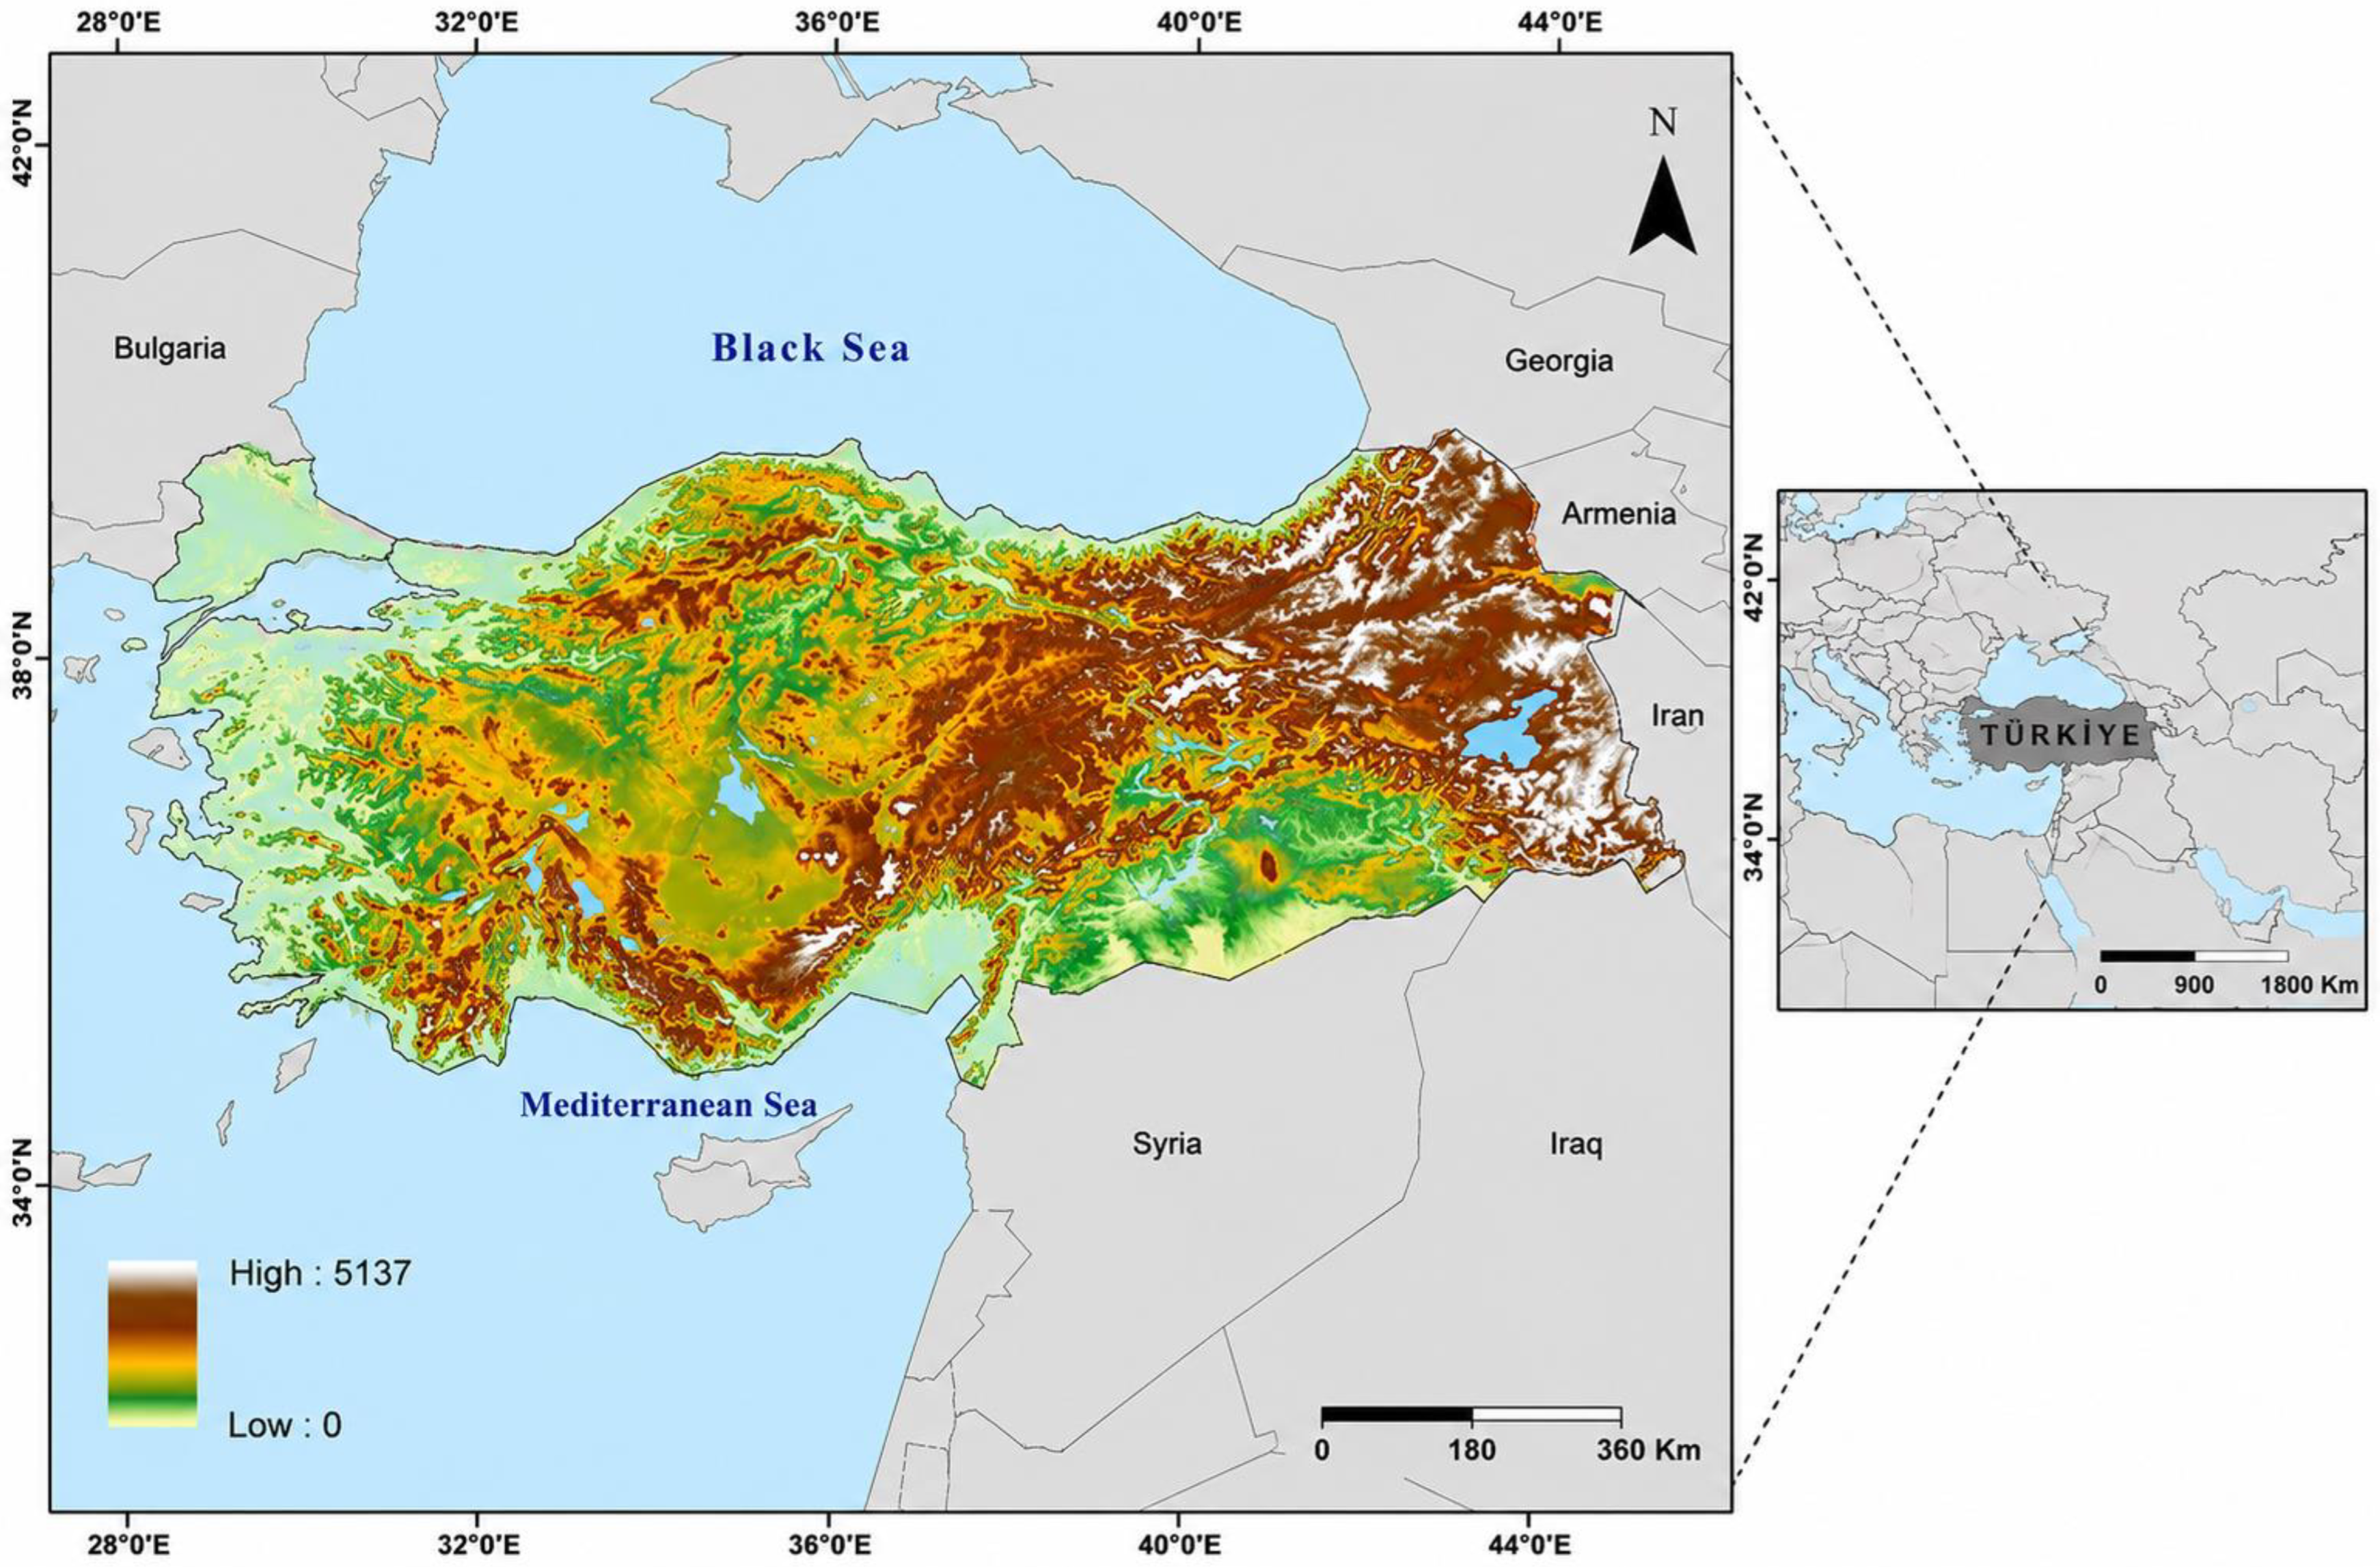
In Türkiye, agricultural areas constitute a significant portion of land use, covering approximately 30–35% of the total surface area [21,22]. These agricultural areas are concentrated in regions with extensive plains and favorable climatic conditions, primarily in Central Anatolia, Southeastern Anatolia, and the Aegean Region. In contrast, forests and scrubland comprise approximately 28–30% of the country’s surface area, and are widespread, particularly along the Black Sea and Mediterranean regions, due to the influence of humid and temperate climates [23]. Meadows and pastures cover approximately 18–20% of the total area, occupying a large area, especially in Eastern Anatolia, and playing a critical role in livestock farming [24]. Türkiye’s average elevation is approximately 1130 m (Figure 1), and the rugged topography significantly limits land use and determines the spatial distribution of agricultural activities. Climate diversity also directly influences land use patterns [25,26]. The Black Sea climate allows for a concentration of forests, the Mediterranean climate increases the diversity of agricultural products, and the continental climate leads to the prominence of pasture areas and grain production in the interior and eastern regions. In this context, land use patterns in Türkiye are shaped by the combined influence of topography and climate factors, exhibiting significant regional differences.

2.2. Data

CHIRPS is a high-resolution, long-term precipitation dataset based on a combination of satellite observations and ground station data. Spanning from 1981 to the present, this dataset has a spatial resolution of approximately 0.05° (~5 km) and is widely used in monitoring precipitation, particularly in semi-arid and arid regions. Thanks to the integration of infrared satellite data and station measurements, CHIRPS provides data continuity over wide areas and increases accuracy. The literature shows that it successfully represents the spatial distribution of precipitation in regions with complex topography, such as Türkiye; however, it may contain some uncertainties in mountainous areas and in cases of intense convective precipitation. Therefore, CHIRPS is considered a reliable data source for long-term precipitation analyses and the investigation of land cover-precipitation relationships [27,28,29].
TerraClimate is a high-spatial-resolution (~4 km) and globally comprehensive climate dataset, created by combining long-term climate normals with reanalysis data. It provides data on many climate variables, primarily precipitation, but also temperature, evapotranspiration, and water balance, on a monthly time scale. The dataset is specifically designed for hydrological and ecological studies and offers significant advantages in terms of both spatial detail and time-series consistency. Literature indicates that in regions with complex topography, such as Türkiye, TerraClimate data successfully represents the regional distribution of precipitation, although it may contain some discrepancies at the local level. In this study, the TerraClimate dataset was used to analyze the spatial and temporal variation in precipitation and to compare it with other satellite-based datasets [30,31,32].
TRMM is a satellite-based rainfall measurement mission developed by NASA and JAXA and active between 1998 and 2019. This dataset has a spatial resolution of approximately 0.25° and is designed specifically for monitoring rainfall in tropical and subtropical regions. Thanks to its radar and microwave sensors, TRMM offers estimates close to direct rainfall measurements, providing a significant advantage in identifying short-duration and intense rainfall events. However, its relatively low spatial resolution and limited data coverage at high latitudes present some disadvantages. Studies in mid-latitude regions like Türkiye indicate that TRMM data successfully represents the general distribution of rainfall, but may not fully reflect local variations, especially in mountainous areas. In this study, the TRMM dataset was evaluated in conjunction with other rainfall data sources to conduct comparative analyses [33,34,35].
ESA WorldCover is a highly detailed dataset developed by the European Space Agency (ESA) that provides land cover information at a spatial resolution of 10 m on a global scale (Table 1). Produced by combining data from the Sentinel-1 and Sentinel-2 satellites, this dataset covers various land cover classes such as forest, agricultural land, grassland/pasture, settlement area, and bare surface. Its high spatial resolution provides significant advantages, particularly in regional and local-scale land cover analyses. While the literature indicates that ESA WorldCover data provides reliable results in terms of classification accuracy and currency, it is also noted that it may contain classification errors in some complex transition zones. In this study, the ESA WorldCover dataset was used as the primary data source to analyze the spatial distribution of land cover classes depending on rainfall gradients [36,37,38].

2.3. Methods

To ensure consistency among the Landsat, MODIS, and Sentinel-2 NDVI datasets, a comprehensive preprocessing workflow was applied within the Google Earth Engine (GEE) platform. Cloud contamination was masked using the quality assessment (QA) bands and cloud probability layers provided with each product; atmospheric effects were minimized using the Sen2Cor-derived Level-2A surface reflectance products for Sentinel-2 and the ready-to-use surface reflectance products for Landsat. Temporal harmonization was achieved by generating monthly NDVI composites using the Maximum Value Composite (MVC) approach, in which the highest NDVI value within each month was selected; this approach reduces the influence of residual clouds and short-term variability while preserving peak vegetation signals. Due to differences in spatial resolution among the datasets (MODIS: 250 m, Landsat: 30 m, Sentinel-2: 10 m), all datasets were reprojected to a common coordinate reference system (WGS 84/UTM appropriate to the study area), and spatial alignment was ensured by matching pixel grids and geographic extents; where resolution conversion was required, the nearest-neighbor resampling method was applied to preserve original spectral characteristics, and no additional interpolation was applied to avoid introducing uncertainty into the NDVI values. The complete workflow including data acquisition, quality filtering, cloud masking, atmospheric correction, temporal compositing, spatial harmonization, and pixel-based information extraction was carried out within the Google Earth Engine environment, while final map preparation and cartographic visualization were completed using Geographic Information System (GIS 10.x) software.
NDVI was computed using the standard formulation based on red and near-infrared (NIR) spectral reflectance values, expressed as [39,40]. NDVI = (NIR − RED)/(NIR + RED). NDVI values theoretically range between −1 and +1, where higher values correspond to denser and more vigorous vegetation cover, whereas lower values indicate sparse vegetation, bare soil, or non-vegetated surfaces such as water bodies and built-up areas [41,42]. To minimize noise arising from atmospheric effects, cloud contamination, and sensor-specific inconsistencies, multi-year composite NDVI products were generated. In this context, datasets derived from Landsat, MODIS, and Sentinel-2 missions were harmonized through spatial and temporal alignment procedures and subsequently averaged to produce consistent NDVI layers suitable for long-term comparative analysis [43,44].
Precipitation data derived from the CHIRPS dataset were used to characterize hydro-climatic gradients across the study area. In order to evaluate the influence of rainfall variability on vegetation and land use/land cover (LULC) patterns, precipitation values were reclassified into discrete zones [45,46]. Two principal classes were defined as low-to-moderate precipitation regions (200–1600 mm) and high precipitation regions (>1600 mm). These thresholds were selected to capture the dominant climatic transitions within the region and to enable a systematic comparison of vegetation responses under contrasting moisture conditions. A spatial overlay framework was implemented to quantify the interrelationships among precipitation regimes, vegetation greenness, and land cover structure. Initially, precipitation classes derived from CHIRPS data were spatially intersected with ESA WorldCover LULC products to evaluate the distribution of land cover types across hydro-climatic gradients [47,48]. Subsequently, seasonal NDVI composites generated from Landsat, MODIS, and Sentinel-2 datasets [49,50] were overlaid with corresponding seasonal precipitation layers. This procedure enabled the assessment of vegetation responses to temporal precipitation variability at a seasonal resolution. All spatial datasets were resampled to a common spatial resolution to ensure analytical consistency. The overlay operations were conducted within a GIS environment using raster-based spatial intersection techniques. Following these procedures, zonal statistical analyses were applied to extract mean NDVI values for each precipitation class and LULC category, thereby facilitating quantitative comparisons across environmental gradients. The relationship between precipitation variability and vegetation dynamics was evaluated through comparative analysis of NDVI distributions across predefined precipitation zones and seasonal intervals. Variations in NDVI were interpreted as proxies for changes in vegetation productivity, ecosystem vigor, and surface greenness response to hydro-climatic forcing. Furthermore, LULC distributions within distinct precipitation regimes were analyzed to identify potential shifts in land cover composition associated with changes in moisture availability. This integrative approach enabled the assessment of coupled interactions among precipitation, vegetation dynamics, and land cover structure [51,52].
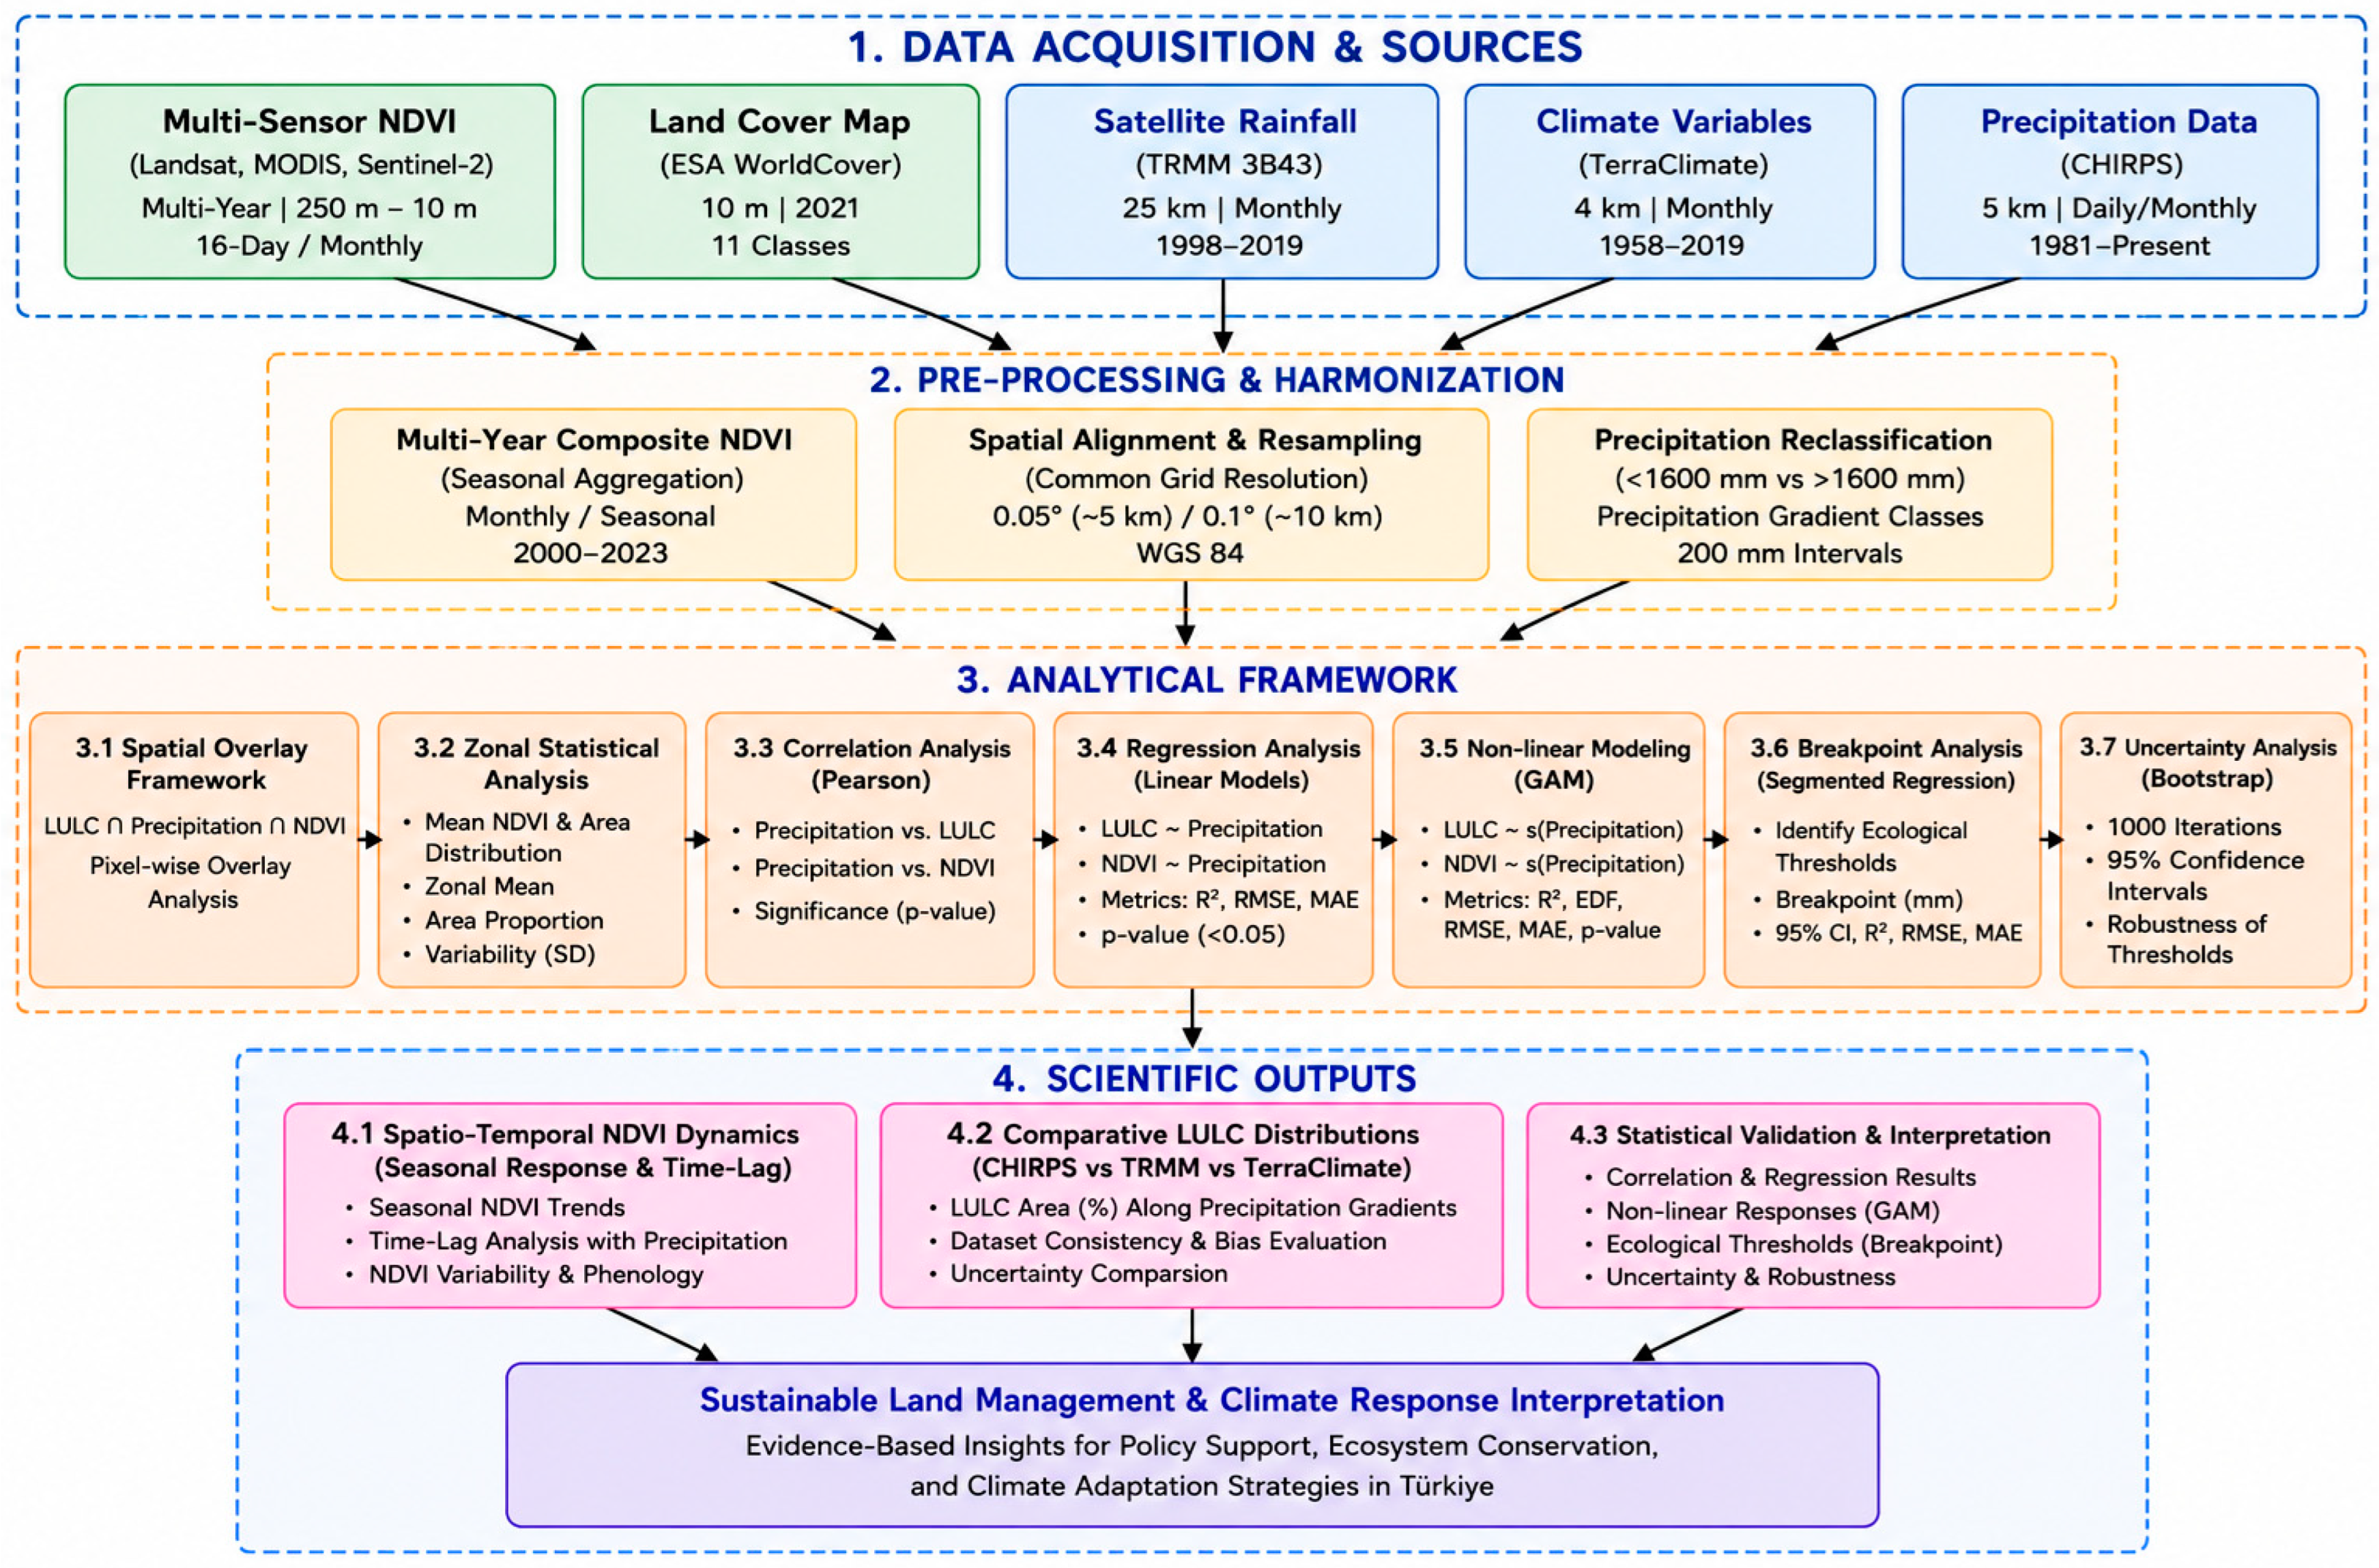
The overall methodological framework consists of sequential analytical steps encompassing data acquisition and preprocessing of CHIRPS, TerraClimate, TRMM, ESA WorldCover, and multi-sensor NDVI datasets, followed by precipitation classification into predefined thresholds (Figure 2). Seasonal NDVI composites were subsequently derived and integrated with precipitation and LULC layers through spatial overlay analysis. Zonal statistics were then extracted to quantify spatial patterns, and the resulting outputs were interpreted to elucidate spatiotemporal vegetation–climate relationships. This integrated methodological design provides a robust and reproducible framework for evaluating the impacts of precipitation variability on vegetation dynamics and land cover distribution.

3. Results

3.1. Comparative Analysis of LULC Distribution Along Precipitation Gradients

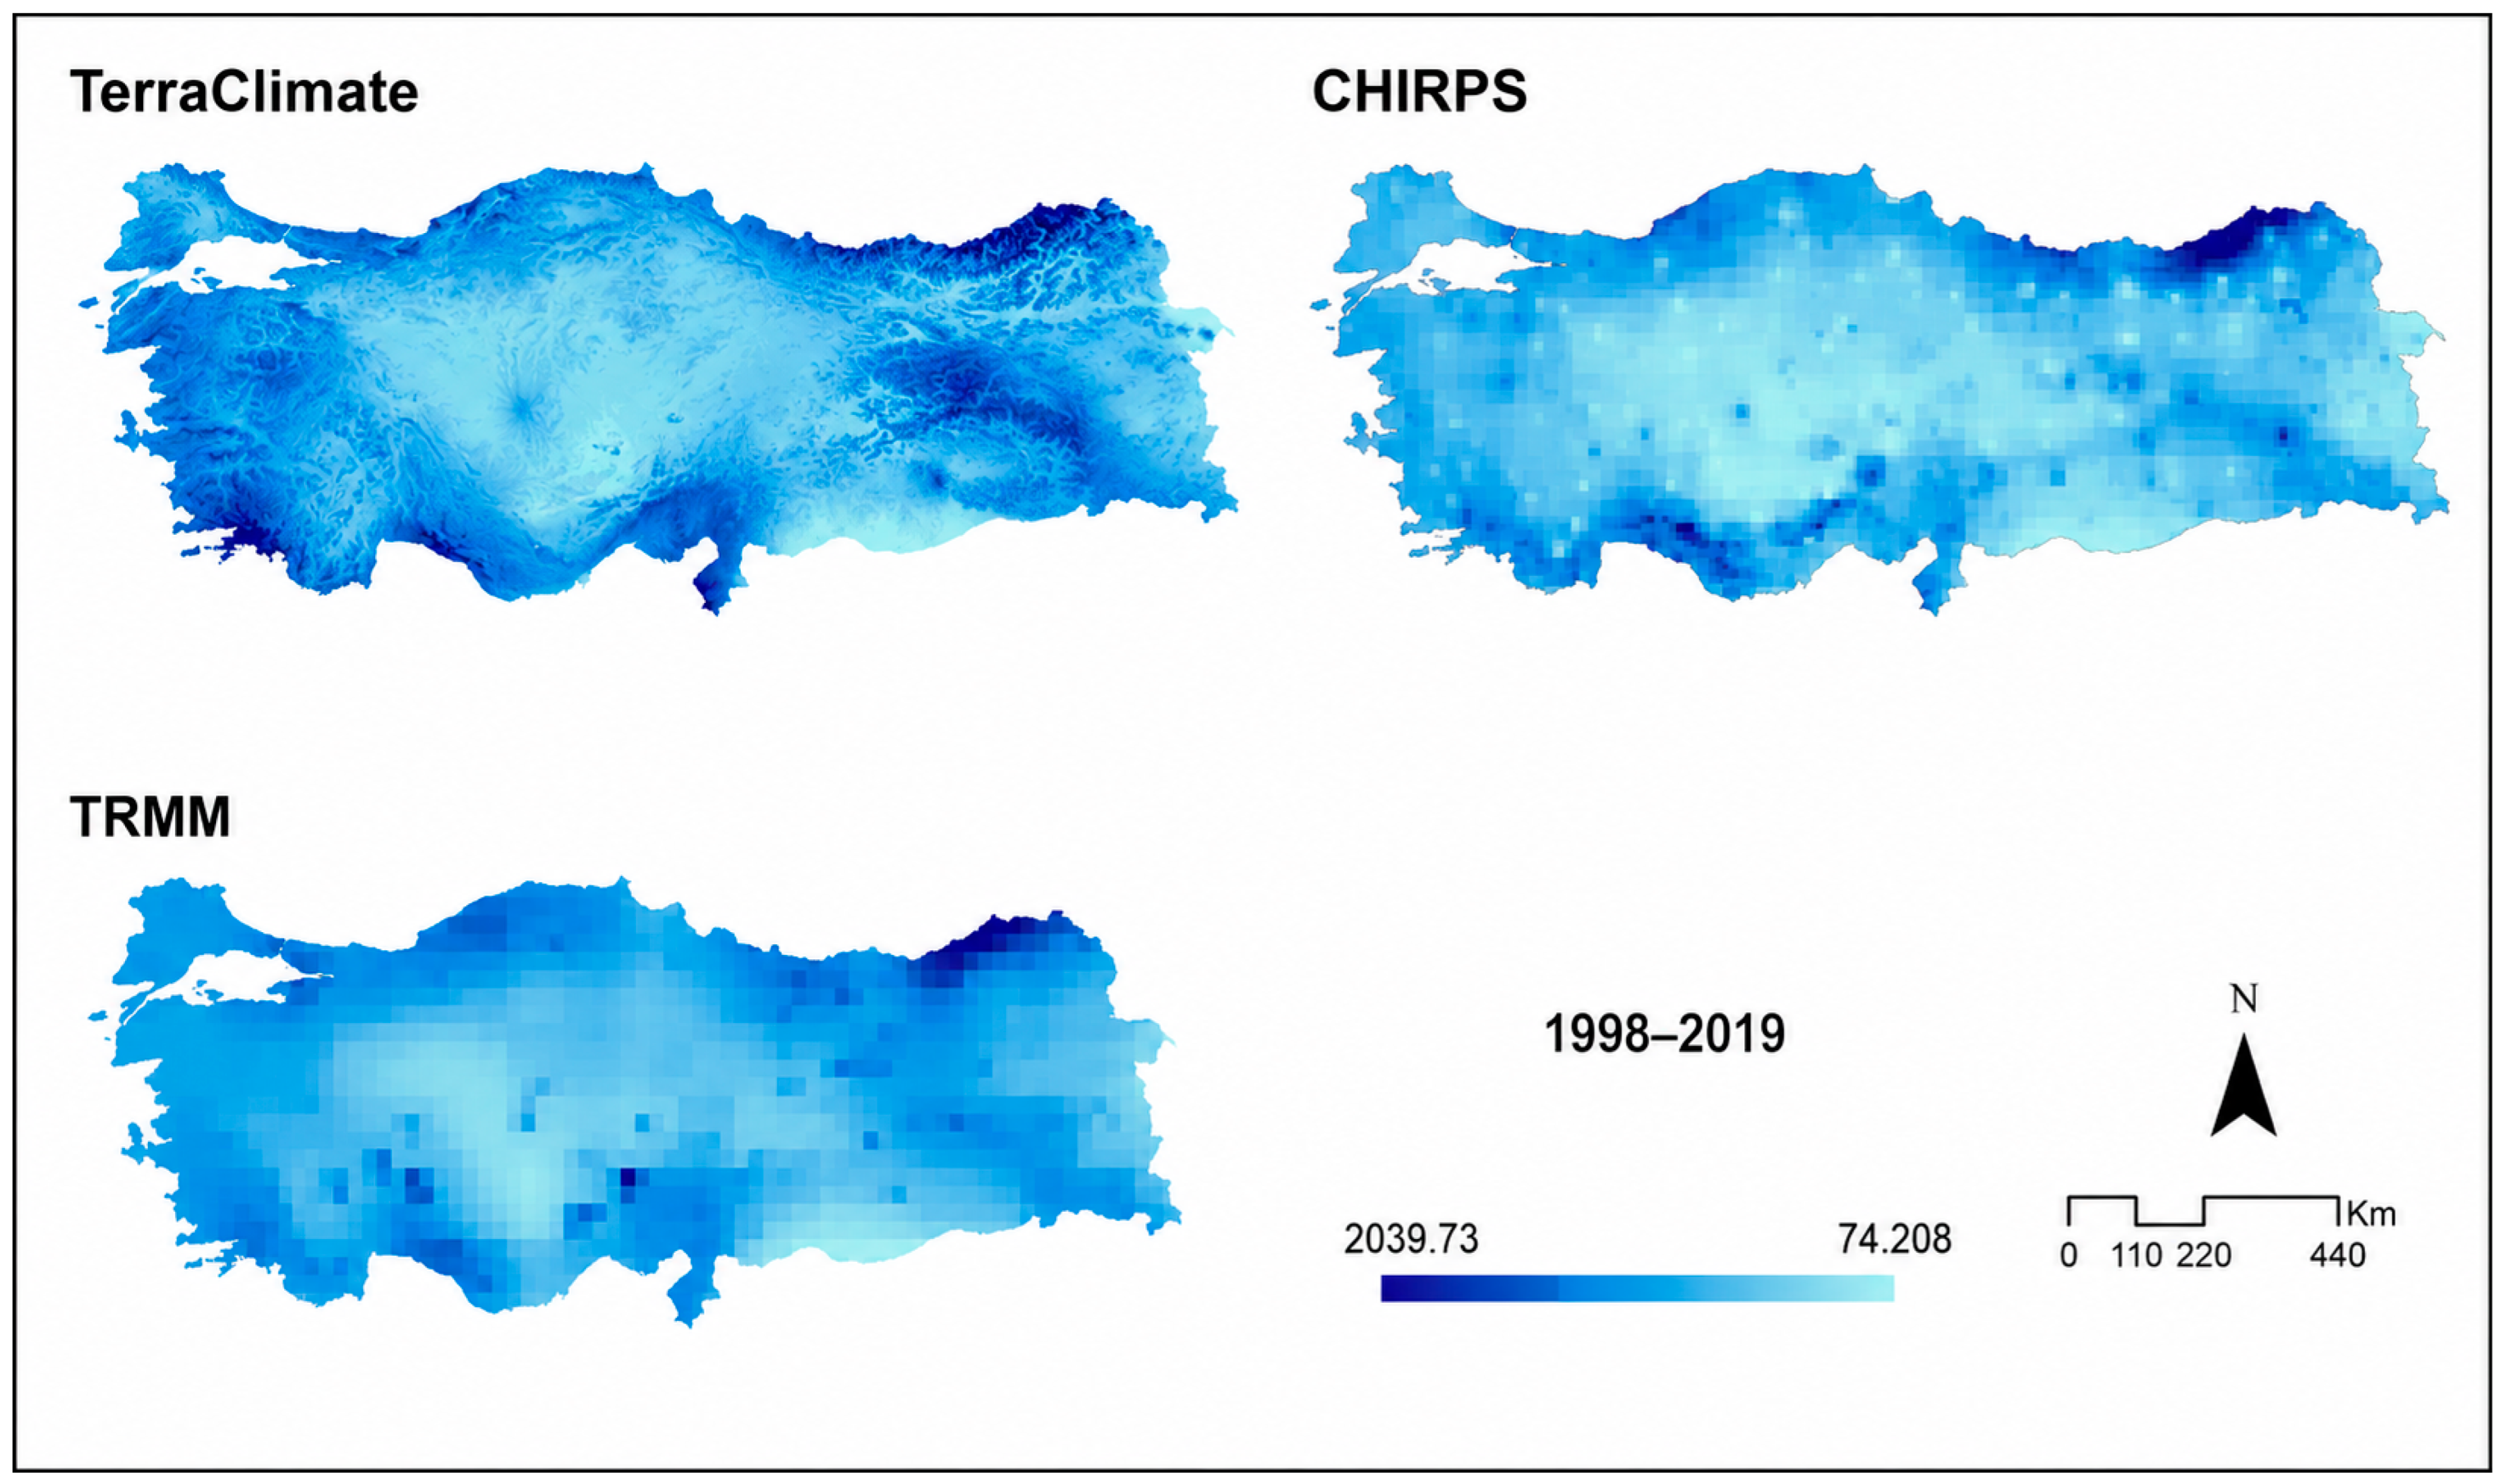
Figure 3 shows the annual average rainfall distribution across Türkiye for the period 1998–2019 using three different rainfall datasets (TerraClimate, CHIRPS, and TRMM), and reveals the differences in resolution/sensitivity between these datasets. All three datasets successfully represent Türkiye’s fundamental hydroclimatological characteristic: “high rainfall in coastal areas, low rainfall in inland areas.” The concentration of maximum rainfall, particularly in the Eastern Black Sea coastal zone, and the arid areas in Central and Southeastern Anatolia are clearly visible on all maps.
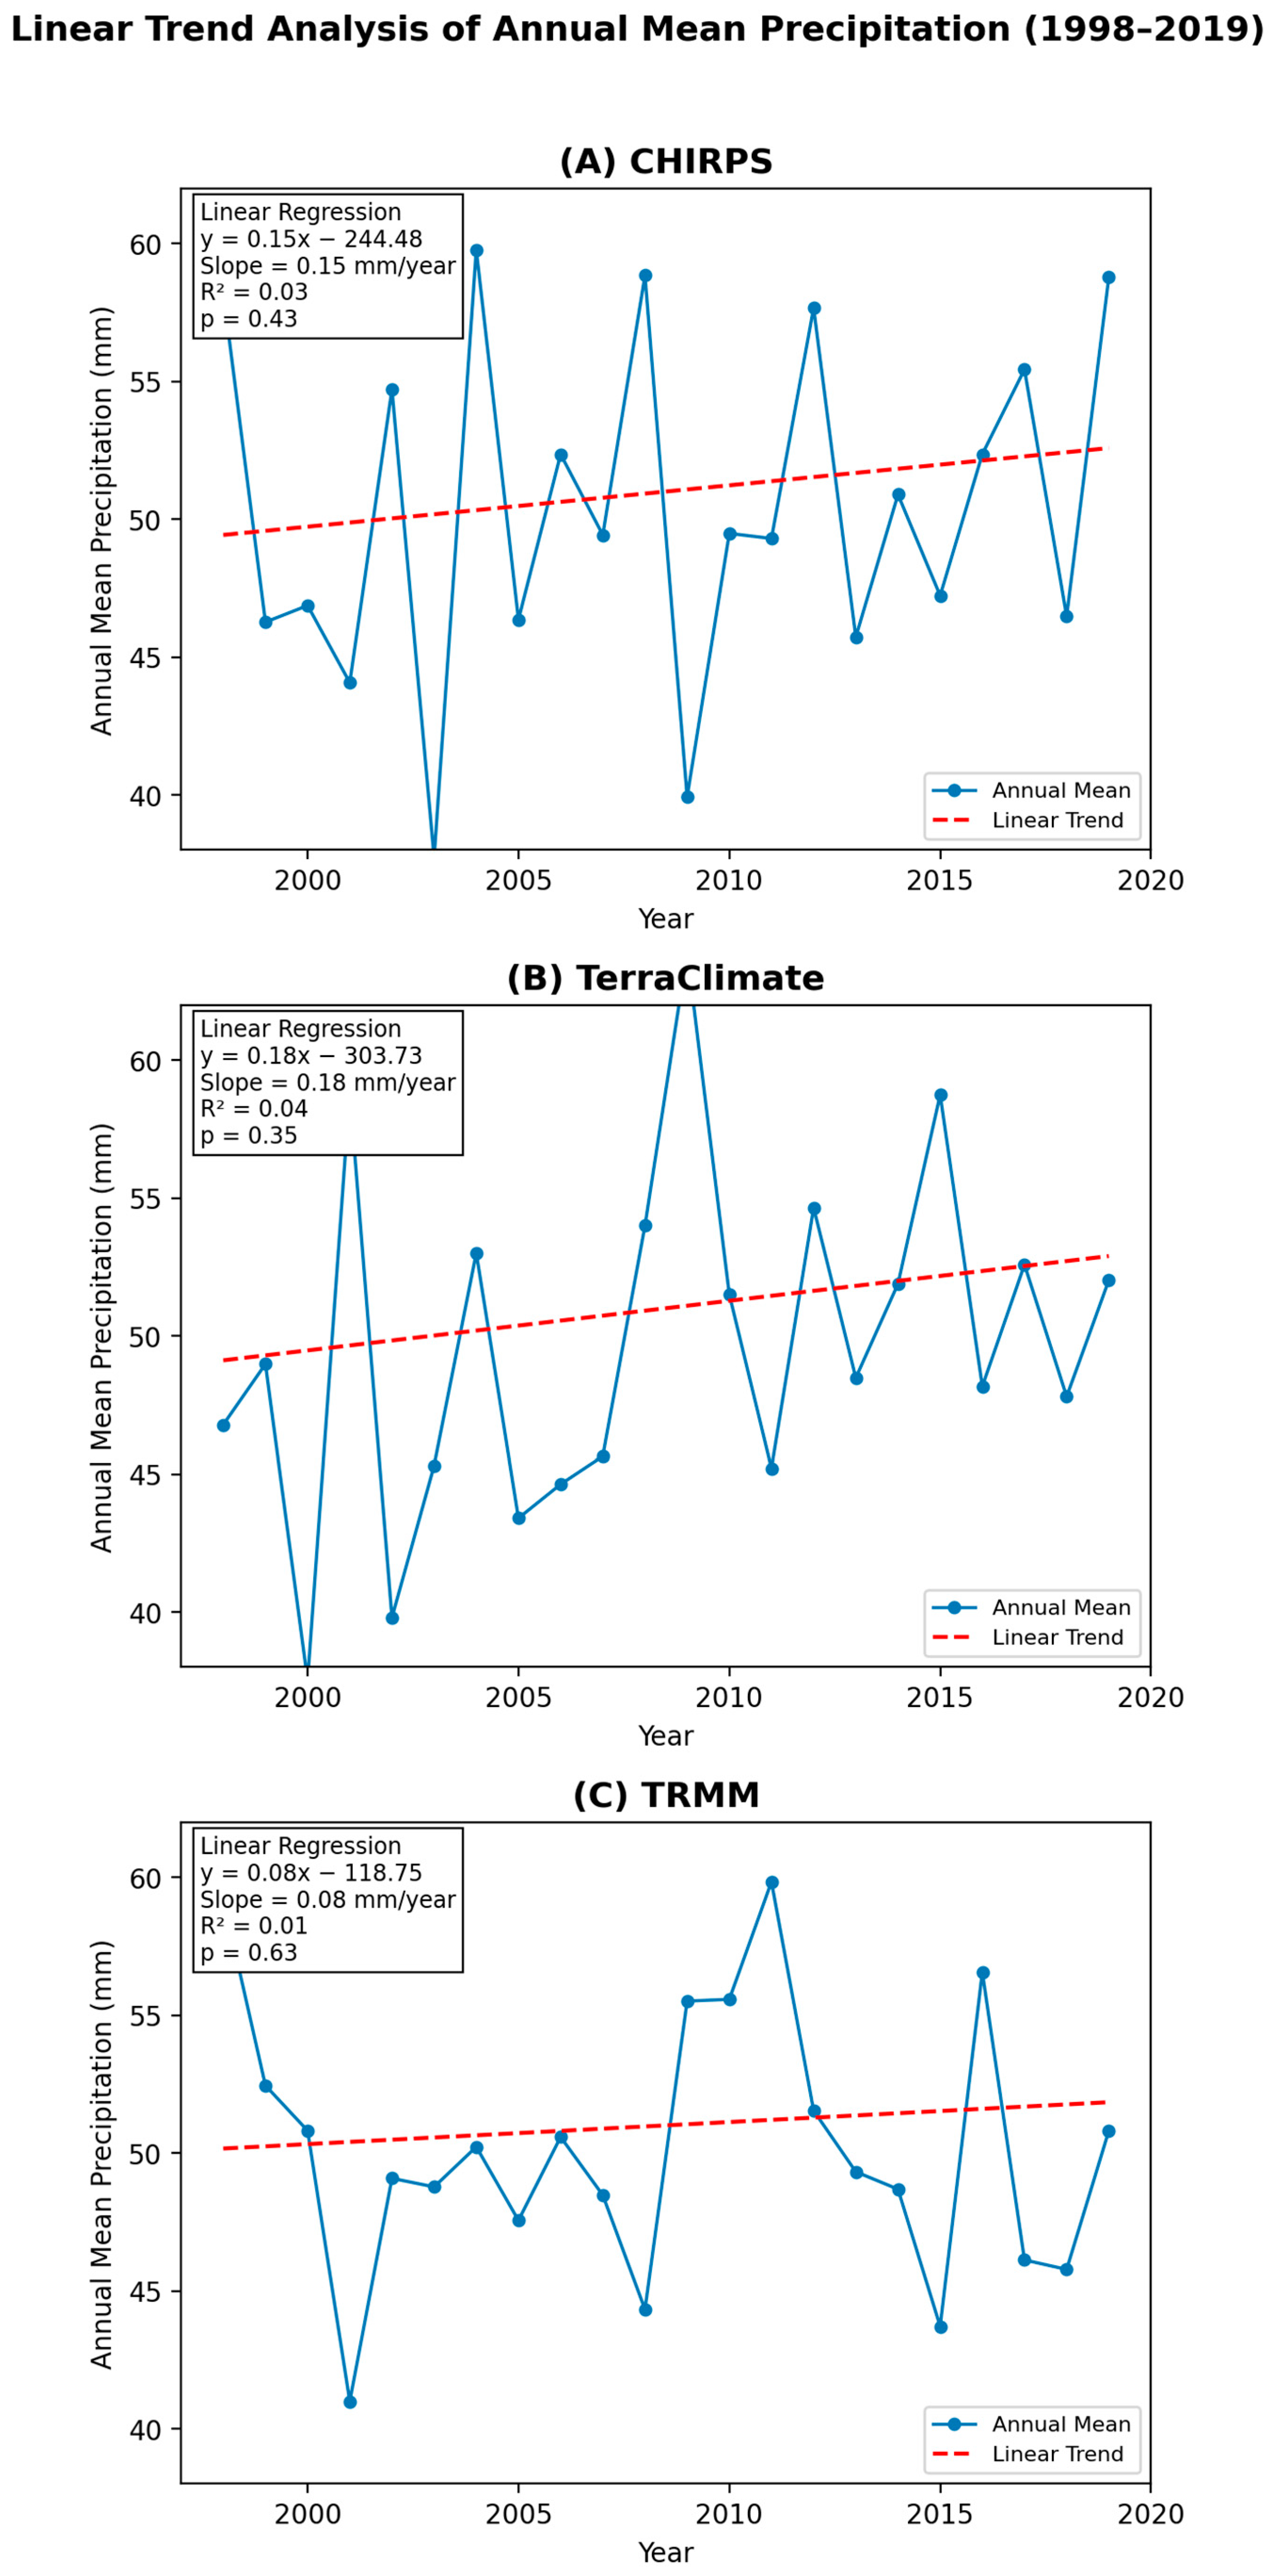
Figure 4 presents the linear trends in annual mean precipitation derived from the CHIRPS, TerraClimate, and TRMM datasets for the period 1998–2019. All three datasets indicate a slight positive trend in annual precipitation over the study period, as reflected by the positive regression slopes. TerraClimate shows the strongest increasing trend (0.18 mm year−1), followed by CHIRPS (0.15 mm year−1), whereas TRMM exhibits the weakest trend (0.08 mm year−1). Despite these positive slopes, the coefficients of determination are very low (R2 = 0.03–0.04 for CHIRPS and TerraClimate, and R2 = 0.01 for TRMM), indicating that only a very small proportion of the interannual variability is explained by the linear trend. Furthermore, the relatively high p-values (CHIRPS: p = 0.43; TerraClimate: p = 0.35; TRMM: p = 0.63) demonstrate that none of the observed trends are statistically significant at the 95% confidence level (p < 0.05). The annual precipitation series also exhibits substantial year-to-year fluctuations, with pronounced wet and dry years occurring throughout the observation period. These large interannual variations dominate the precipitation record and largely obscure any long-term linear tendency. Overall, the results suggest that annual precipitation remained relatively stable between 1998 and 2019, with only weak, statistically insignificant increasing trends consistently detected across all three precipitation products.
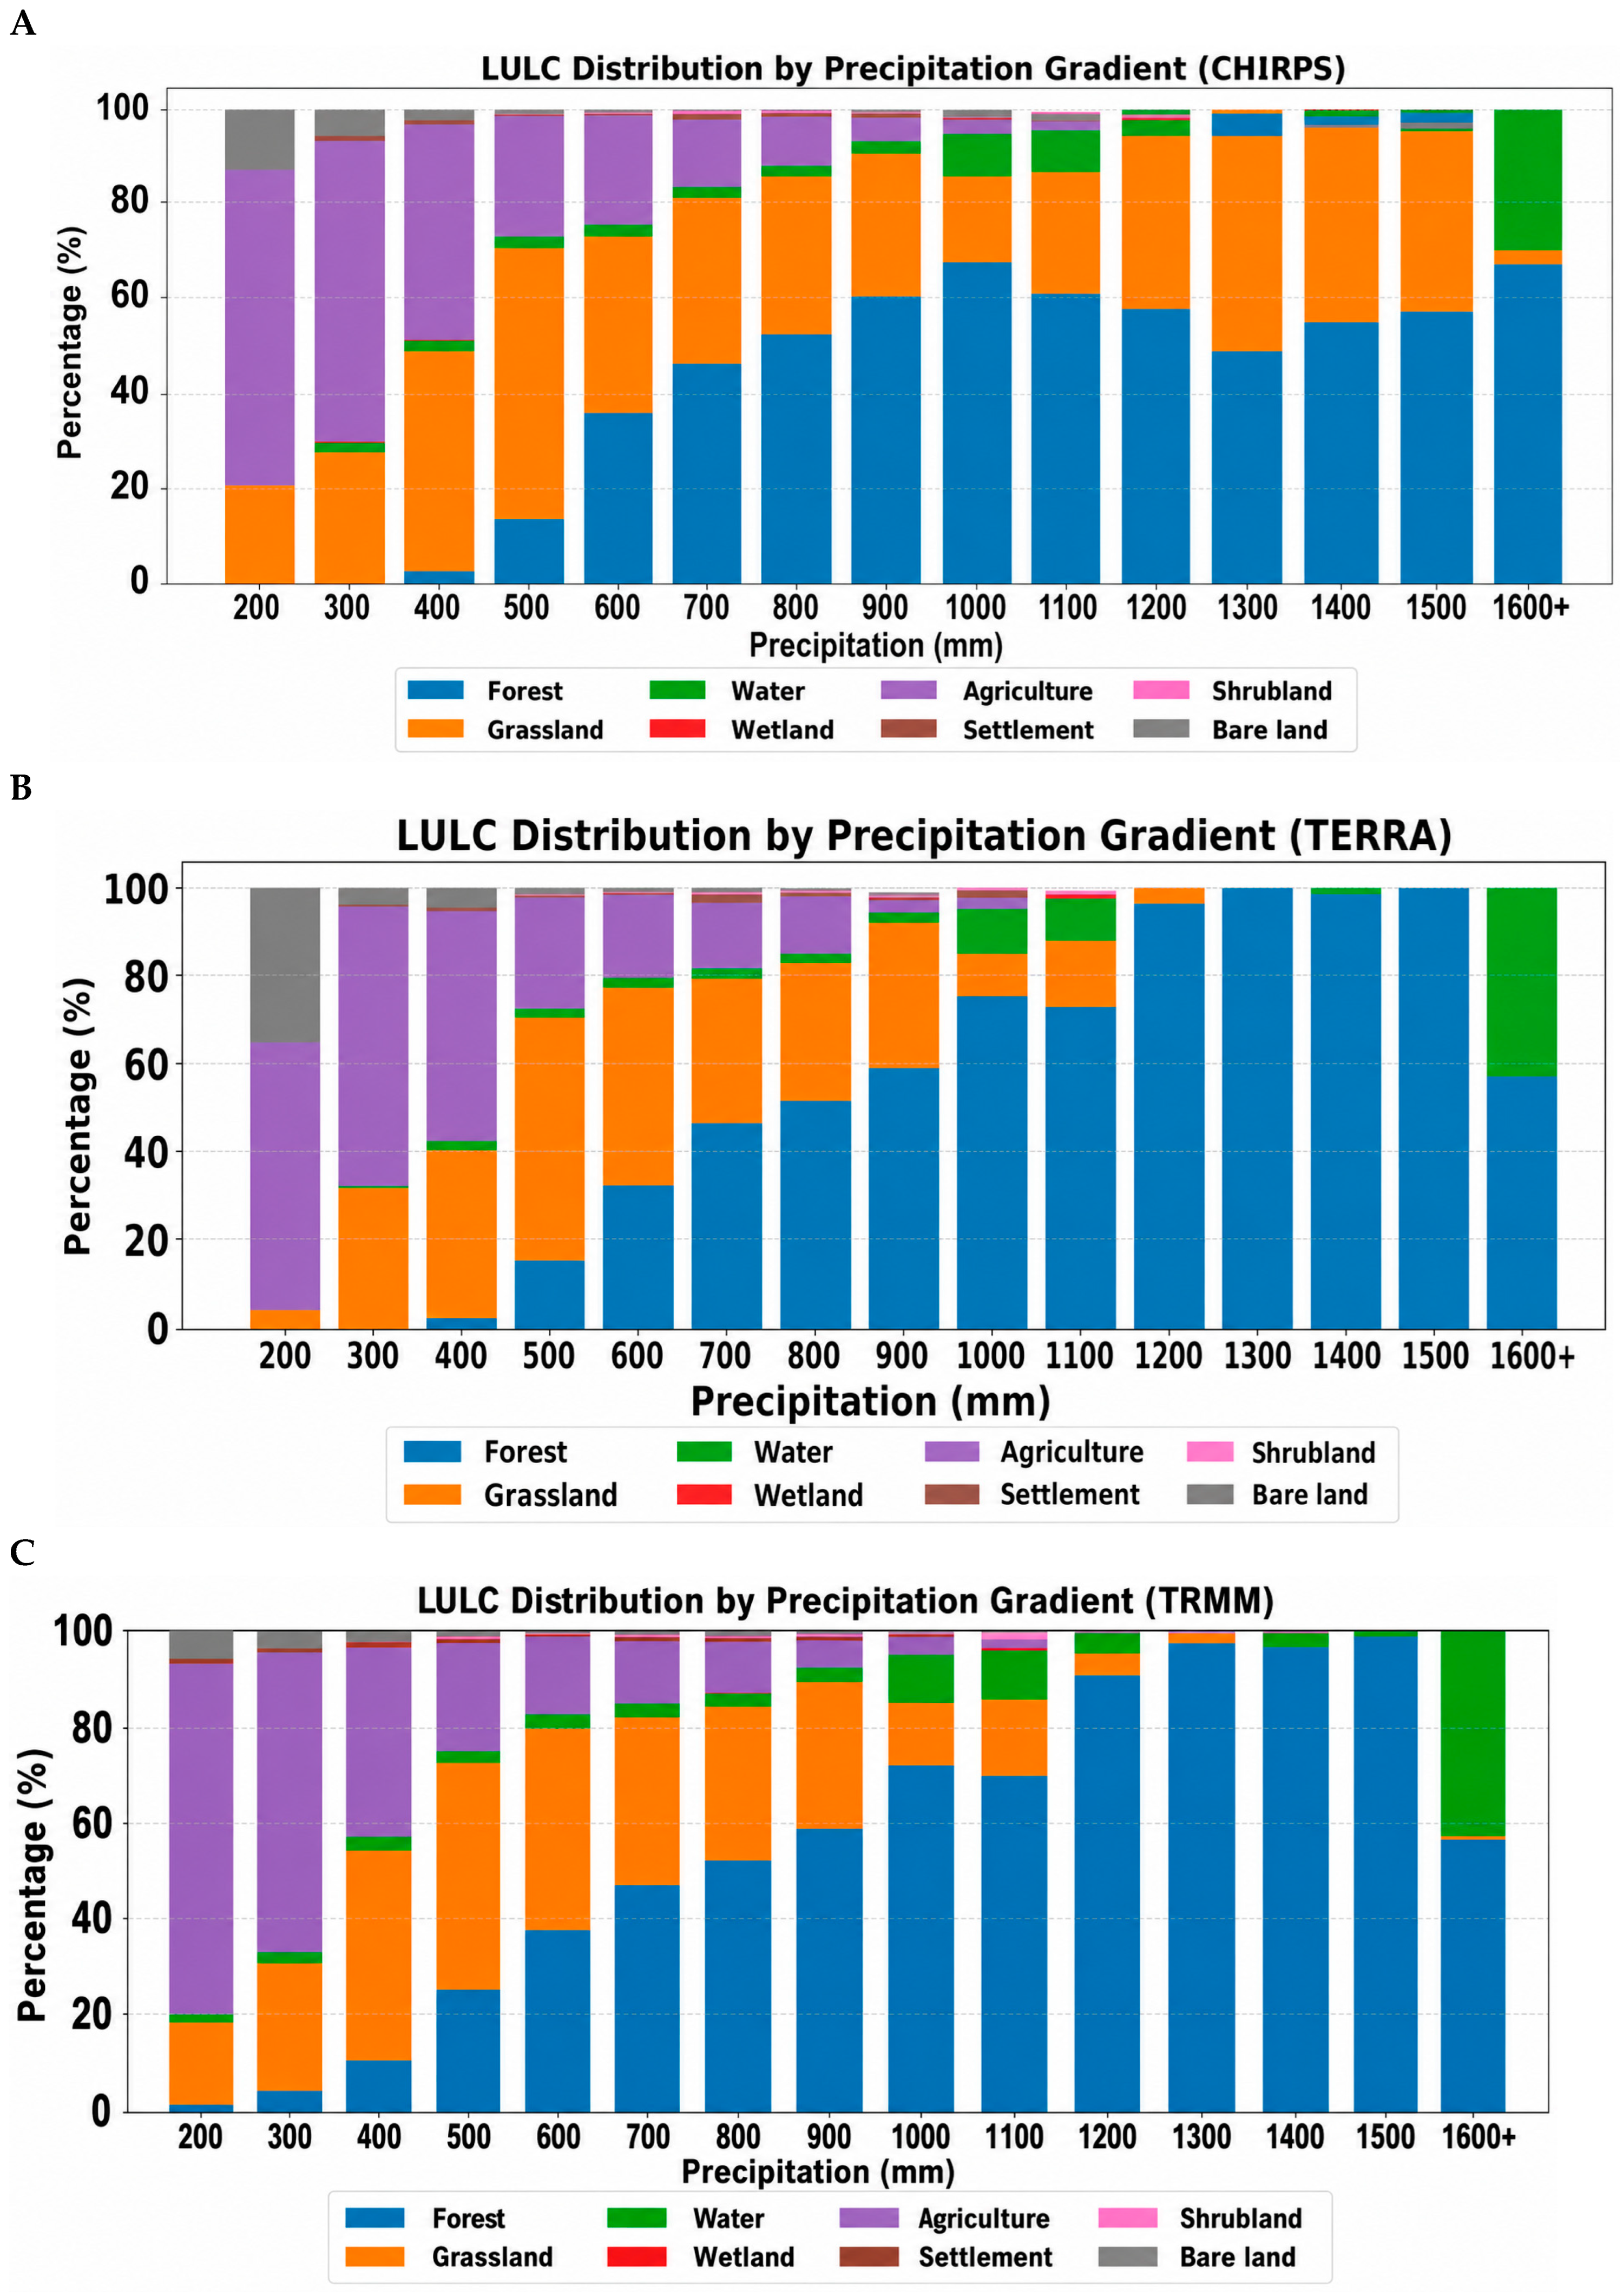
The LULC distribution along the rainfall gradient based on CHIRPS data shows a significant and systematic change in land cover classes as rainfall increases. At low rainfall levels (200–400 mm), agricultural areas and bare surfaces dominate, reflecting water scarcity and sparse vegetation. As rainfall reaches moderate levels (400–700 mm), grassland areas increase significantly and become the dominant class, indicating that increased moisture conditions support herbaceous plant growth. Above 600 mm, forest areas begin to increase rapidly and become the most dominant land cover class after approximately 900 mm. In high rainfall regions (>1200 mm), forest ecosystems become clearly dominant, while agricultural and bare areas almost completely disappear. Furthermore, the observed increase in water surfaces, especially at rainfall levels above 1600 mm, may reflect both hydrological accumulation and the enhanced capability of the satellite-derived dataset to capture seasonal and temporary variations in surface water extent under wetter conditions. Overall, the results reveal a strong positive relationship between precipitation and vegetation density, suggesting that precipitation is among the key factors influencing land cover distribution in Türkiye (Figure 5A). The LULC distribution along the precipitation gradient based on TerraClimate data reveals a significant and sharp transformation in land cover classes depending on the increase in precipitation. At low precipitation levels (200–300 mm), bare areas and agricultural lands are dominant, indicating the prevalence of arid and semi-arid conditions. As precipitation increases to the 300–700 mm range, pasture areas rapidly increase and become the most dominant land cover class in this range. At the same time, a gradual decrease in the proportion of agricultural lands is observed in this transition zone. As precipitation rises above 700 mm, forest areas increase significantly and become the dominant class, especially in the 900–1200 mm range. After 1200 mm, forest cover increases very sharply, reaching almost 100%, and other land cover classes largely disappear. This situation shows that TerraClimate data represents forestation more dominantly and sharply in high-rainfall regions. On the other hand, a significant increase in water surfaces is observed at rainfall levels of 1700 mm and above. The dominance of water surfaces, especially at the 2000 mm level, reflects both the hydrological effects of high rainfall and the sensitivity of the dataset in these regions. Overall, the results show that TerraClimate data represents the relationship between rainfall and land cover with sharper transitions and predominantly highlights forest and water classes, especially in high-rainfall regions (Figure 5B). The LULC distribution along the rainfall gradient based on TRMM data shows a gradual and consistent transformation in land cover classes parallel to the increase in rainfall. Under low rainfall conditions (200–400 mm), agricultural areas are overwhelmingly dominant, revealing that human activities play a decisive role in water-limited environments. Bare areas and low-density vegetation are also noteworthy in the same range. As rainfall increases to the 400–800 mm range, grassland areas rapidly increase and become dominant in this transition zone. This clearly shows that moderate rainfall supports herbaceous vegetation. A significant decrease in agricultural land is also observed in this range. Above 800 mm, forest areas increase rapidly and become the dominant land cover class after approximately 1000 mm. In the 1200–1600 mm range, forest cover reaches almost 100%, largely eliminating all other land cover classes. This demonstrates that TRMM data strongly represents forest ecosystems under high rainfall conditions. At even higher rainfall levels (>1600 mm), a significant increase in water surface area is observed. The rapid increase in water class, particularly in the 1800–2000 mm range, reflects both the hydrological effects of increased rainfall and the sensitivity of the TRMM dataset to high rainfall regions. Overall, the TRMM results reveal a strong and linear relationship between rainfall and land cover; showing a clear dominance of agriculture in low rainfall, pasture in moderate rainfall, and forest in high rainfall (Figure 5C).
Segmented regression revealed distinct precipitation thresholds for different LULC classes, indicating that land-cover responses to annual precipitation are non-linear. Water exhibited the highest breakpoint (1763.03 mm) and the strongest model fit (R2 = 0.99), highlighting its close dependence on precipitation. Forest (873.82 mm; R2 = 0.83) and agriculture (773 mm; R2 = 0.98) also showed well-defined thresholds, suggesting that precipitation is a dominant driver of their spatial distribution. In contrast, wetlands (200 mm; R2 = 0.38), settlements (843 mm; R2 = 0.47), and shrublands (621 mm; R2 = 0.46) exhibited weaker relationships, implying that additional factors such as hydrology, topography, soil properties, and anthropogenic influences substantially contribute to their distribution (Table 2).
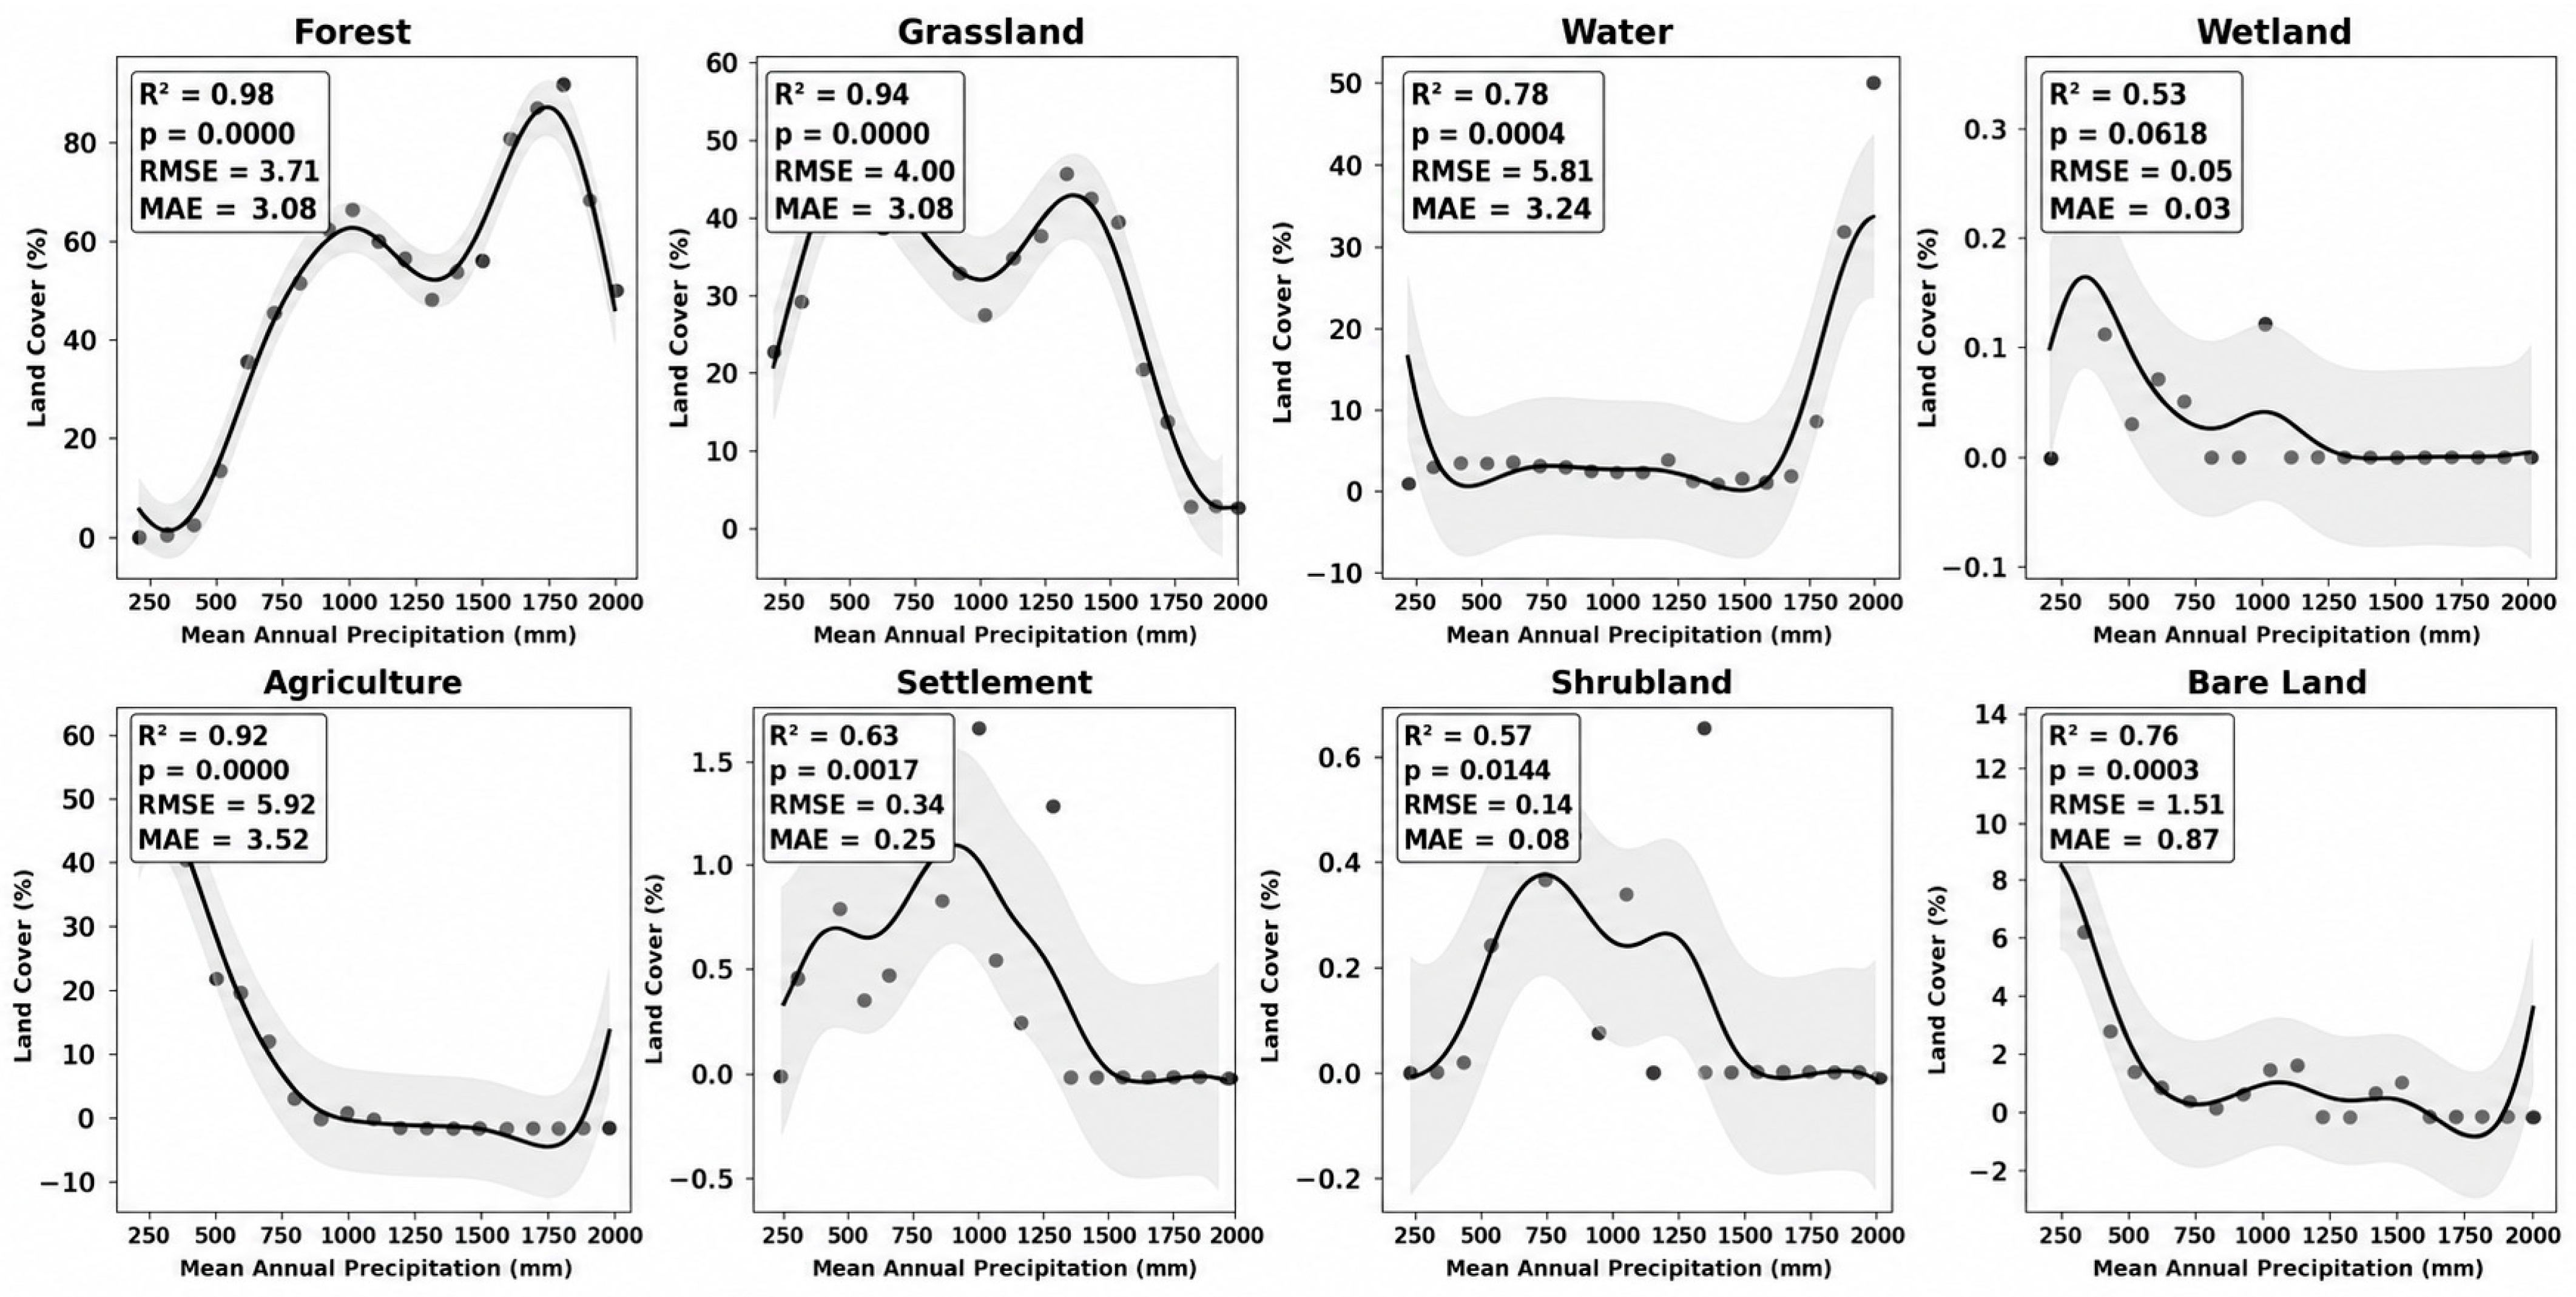
Figure 6 illustrates the nonlinear relationships between mean annual precipitation and the major land cover classes using Generalized Additive Models (GAMs). Overall, the results demonstrate that the response of land cover to precipitation is highly nonlinear, with different land cover types exhibiting distinct ecological thresholds and response patterns. The generally high coefficients of determination for most classes (R2 = 0.52–0.98) indicate that precipitation is an important driver of land cover distribution, although its influence varies among ecosystems. Forest exhibits the strongest model performance (R2 = 0.98, p < 0.001), with forest cover increasing rapidly as precipitation rises to approximately 800–900 mm, remaining relatively high under intermediate precipitation conditions, and reaching a maximum at around 1700–1800 mm before showing a slight decline. Grassland also shows a strong nonlinear relationship (R2 = 0.94, p < 0.001), where cover increases under moderate precipitation, peaks near 1200–1400 mm, and then declines sharply under very humid conditions, suggesting a transition toward forest-dominated landscapes. Water bodies display a pronounced threshold response (R2 = 0.78, p < 0.001). Water cover remains relatively stable across most of the precipitation gradient but increases abruptly under extremely wet conditions (>1700 mm), indicating that perennial water bodies become substantially more abundant only in the wettest environments. Wetlands exhibit a weaker but still significant relationship (R2 = 0.52, p = 0.0618), characterized by relatively higher cover under low precipitation followed by a gradual decline and stabilization, implying that factors such as topography, groundwater, and hydrological conditions likely exert stronger controls than precipitation alone. Agricultural land demonstrates a very strong inverse relationship with precipitation (R2 = 0.92, p < 0.001). Agricultural cover is highest under relatively dry conditions and decreases rapidly as annual precipitation increases, remaining low throughout humid environments. This pattern suggests that agricultural activities in Türkiye are concentrated primarily in semi-arid and sub-humid regions rather than in the wettest climatic zones. Settlement areas exhibit a moderate nonlinear relationship (R2 = 0.63, p = 0.0017). Settlement cover increases under moderate precipitation conditions, reaches its highest values around 800–1100 mm, and subsequently stabilizes or declines slightly, indicating that human settlements preferentially occur in climatically favorable regions but are also strongly influenced by socioeconomic and geographical factors. Shrubland also displays a significant hump-shaped response (R2 = 0.57, p = 0.0144), with maximum cover occurring under intermediate precipitation before declining toward wetter environments, reflecting its adaptation to semi-arid and transitional climatic conditions. Bare land shows a strong negative relationship with precipitation (R2 = 0.76, p < 0.001). Bare surfaces dominate under dry climates but decline rapidly with increasing precipitation, approaching minimal values across intermediate and humid environments where vegetation becomes increasingly established. Collectively, these GAM results indicate that precipitation exerts substantial but highly nonlinear control over land cover distribution in Türkiye, with clear ecological thresholds separating arid, transitional, and humid landscape types.
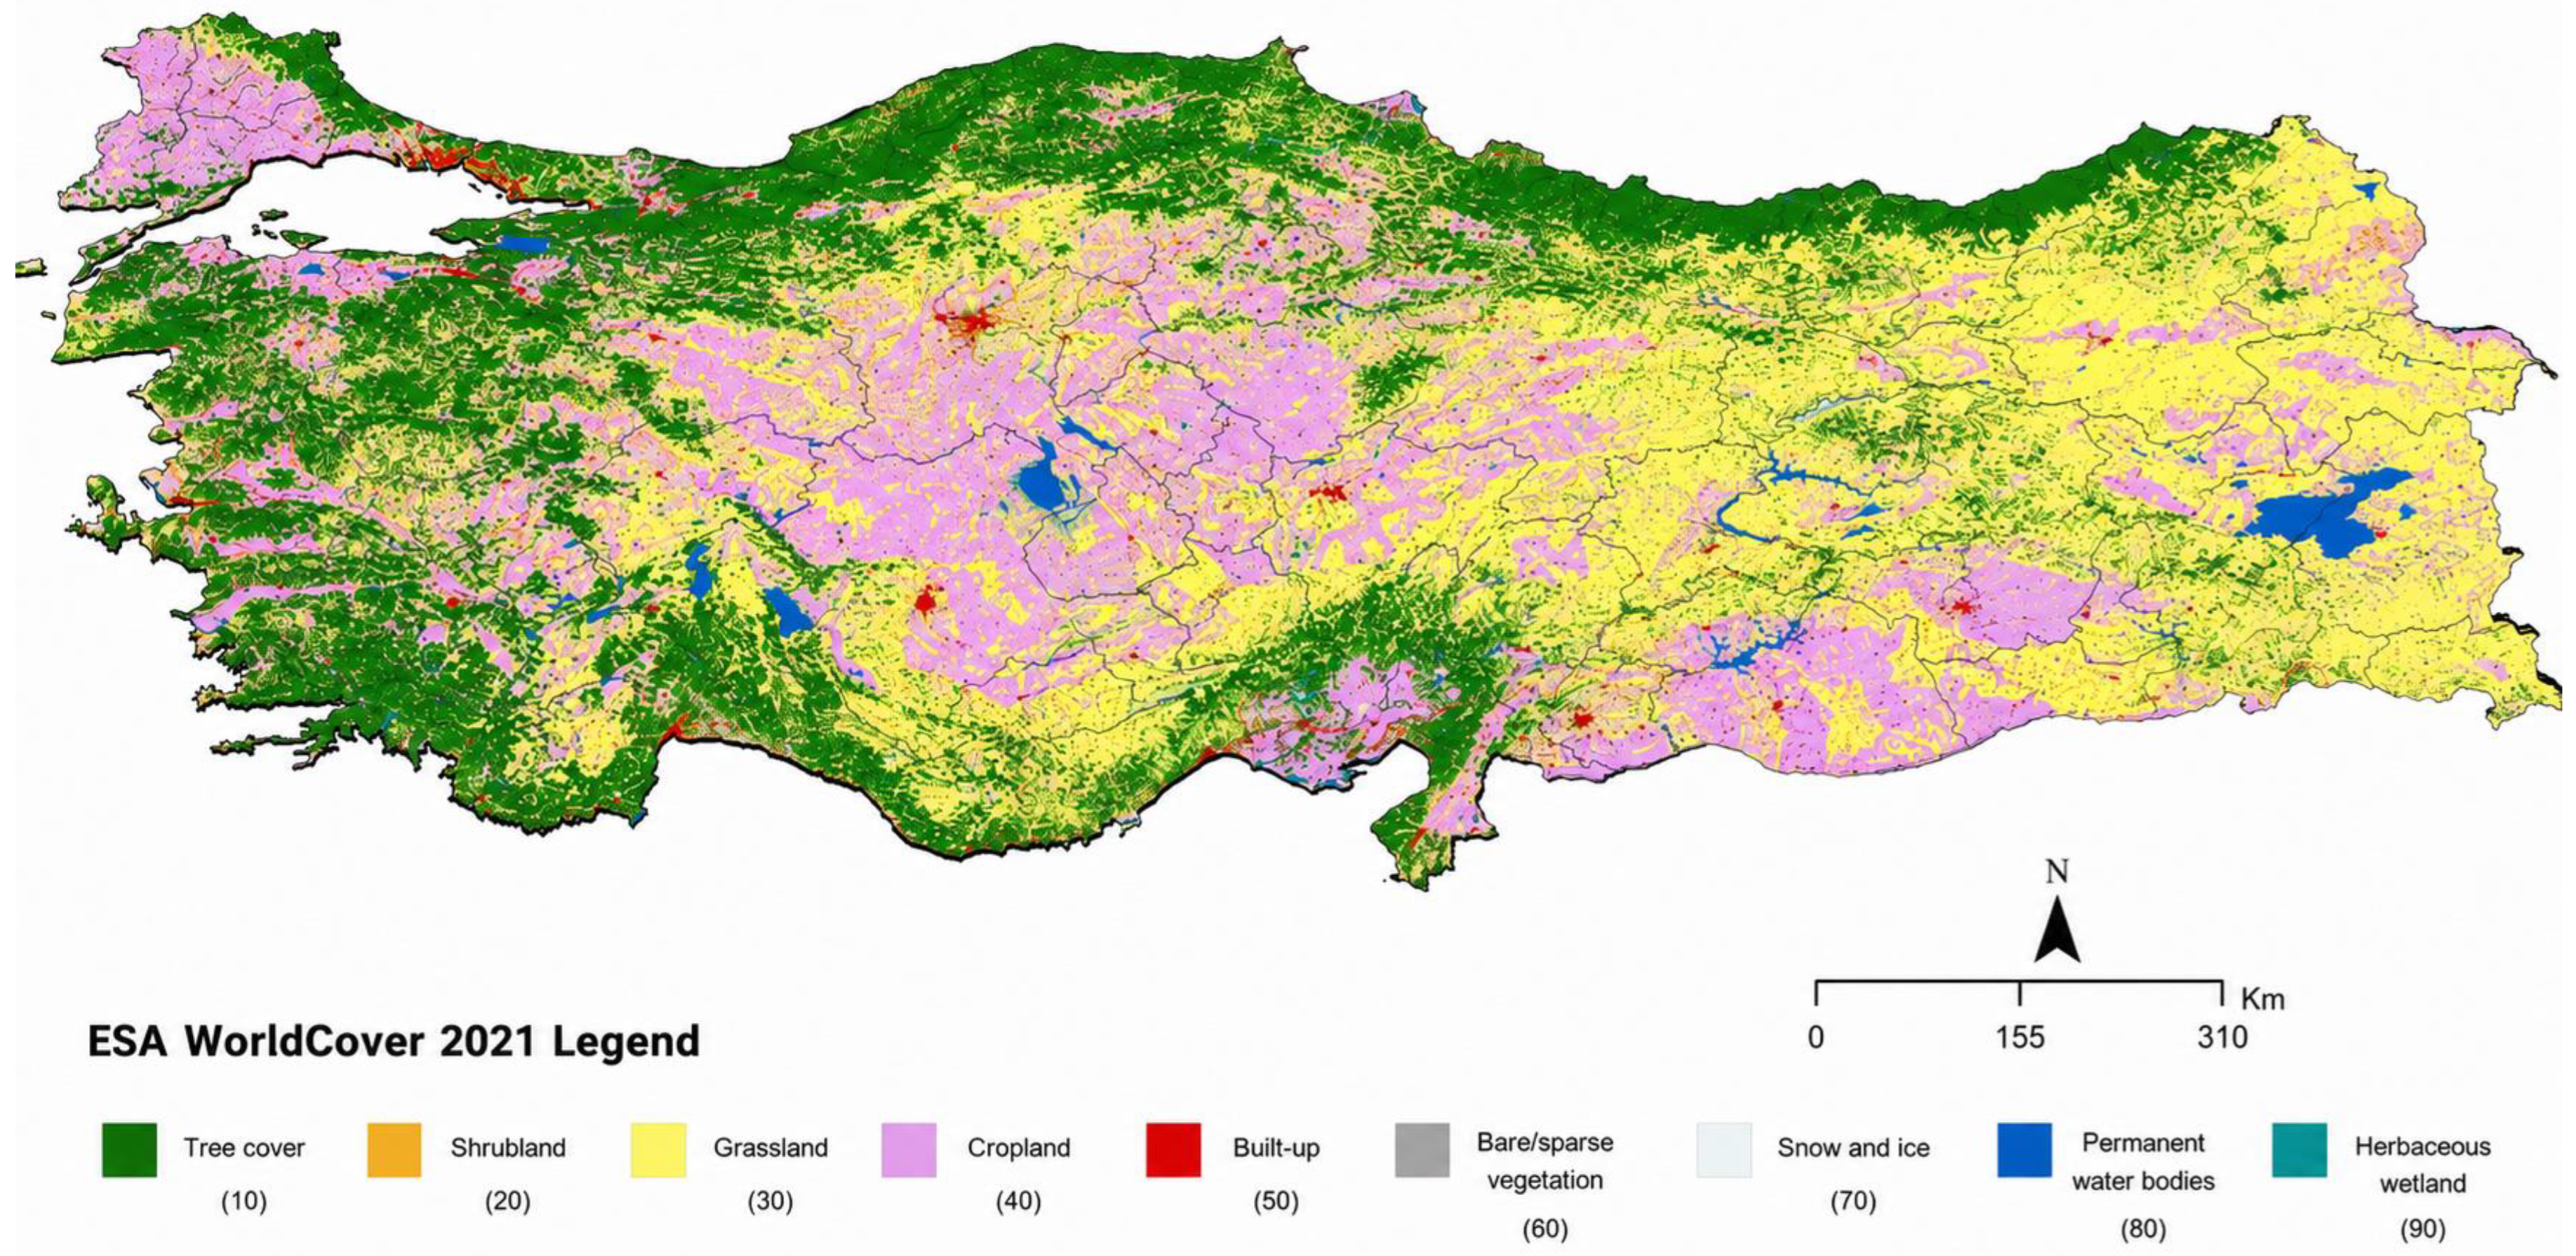
The land cover map of Türkiye, based on ESA WorldCover data, reveals significant spatial differences and strong geographical patterns across the country. Examination of the map shows that forest areas are concentrated particularly along the Black Sea coast and in the mountainous regions of Western Anatolia. This distribution is consistent with the high rainfall and humidity conditions in these regions, reflecting the influence of climatic factors that support the development of forest ecosystems. In contrast, agricultural areas and pastures dominate large parts of Central and Eastern Anatolia. Lower and more variable rainfall conditions in these regions lead to limited natural vegetation, and land use driven by human activities takes center stage. The prevalence of pastures, especially in steppe-like areas, is indicative of semi-arid climate conditions. While settlements are concentrated around and around large cities, water surfaces are limited to lakes and dam reservoirs. Lake Van, Lake Tuz, and large dams are prime examples of this. Furthermore, bare areas and sparse vegetation are observed particularly in arid and topographically challenging regions. Overall, the findings suggest that the distribution of land cover in Türkiye is largely influenced by climatic factors, particularly precipitation patterns and topography. This spatial pattern supports the strong relationship between precipitation and land cover, which is the main objective of this study (Figure 7).

3.2. Overlay Analysis Between the NDVI and Precipitation

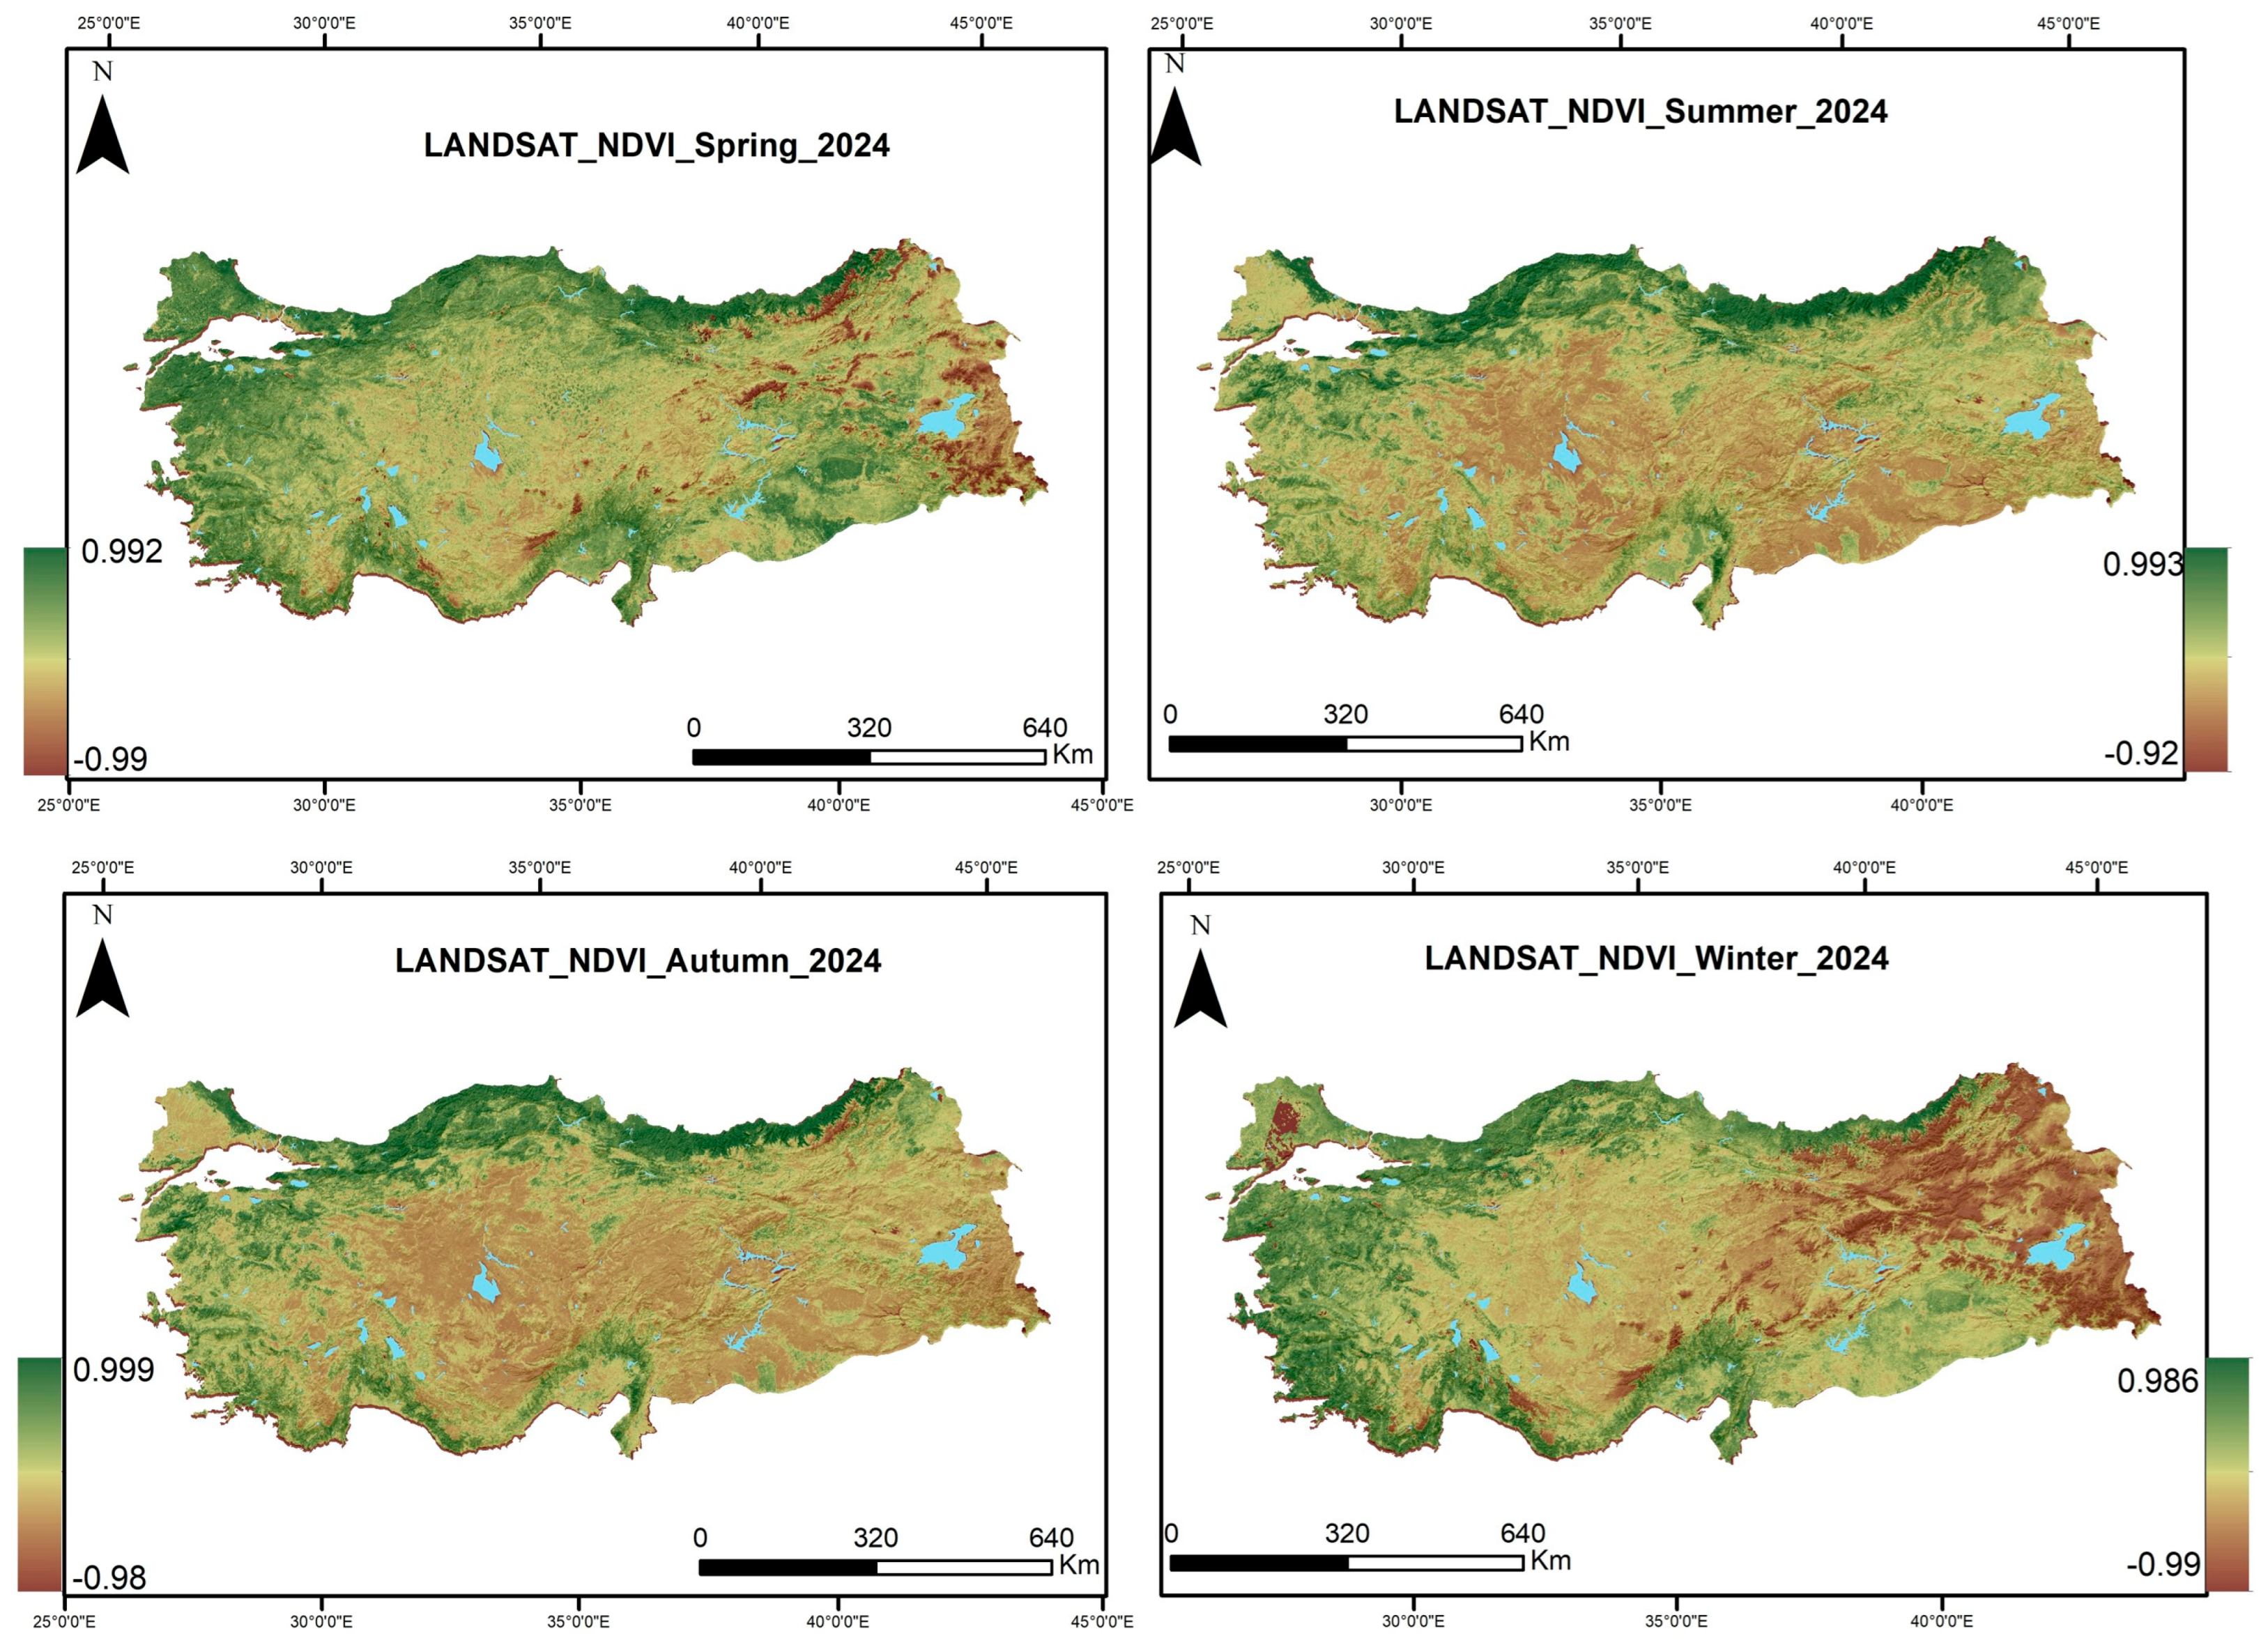
Figure 8 represents the seasonal variation in NDVI derived from Landsat data for 2024, showing vegetation density across Türkiye. Given that NDVI values range from −1 to +1, dark green areas on the map represent dense and healthy vegetation (forests, agricultural areas), while brown/yellow tones represent sparse vegetation or bare surfaces. Vegetation activity is observed to reach its maximum in spring throughout the country (especially in coastal areas). During the summer months, a significant decrease (browning) in NDVI values is observed in the inland and southeastern regions of Türkiye. This situation can be explained by the drying out of herbaceous plants and the barrening of agricultural fields after harvest due to high evapotranspiration and decreased precipitation.
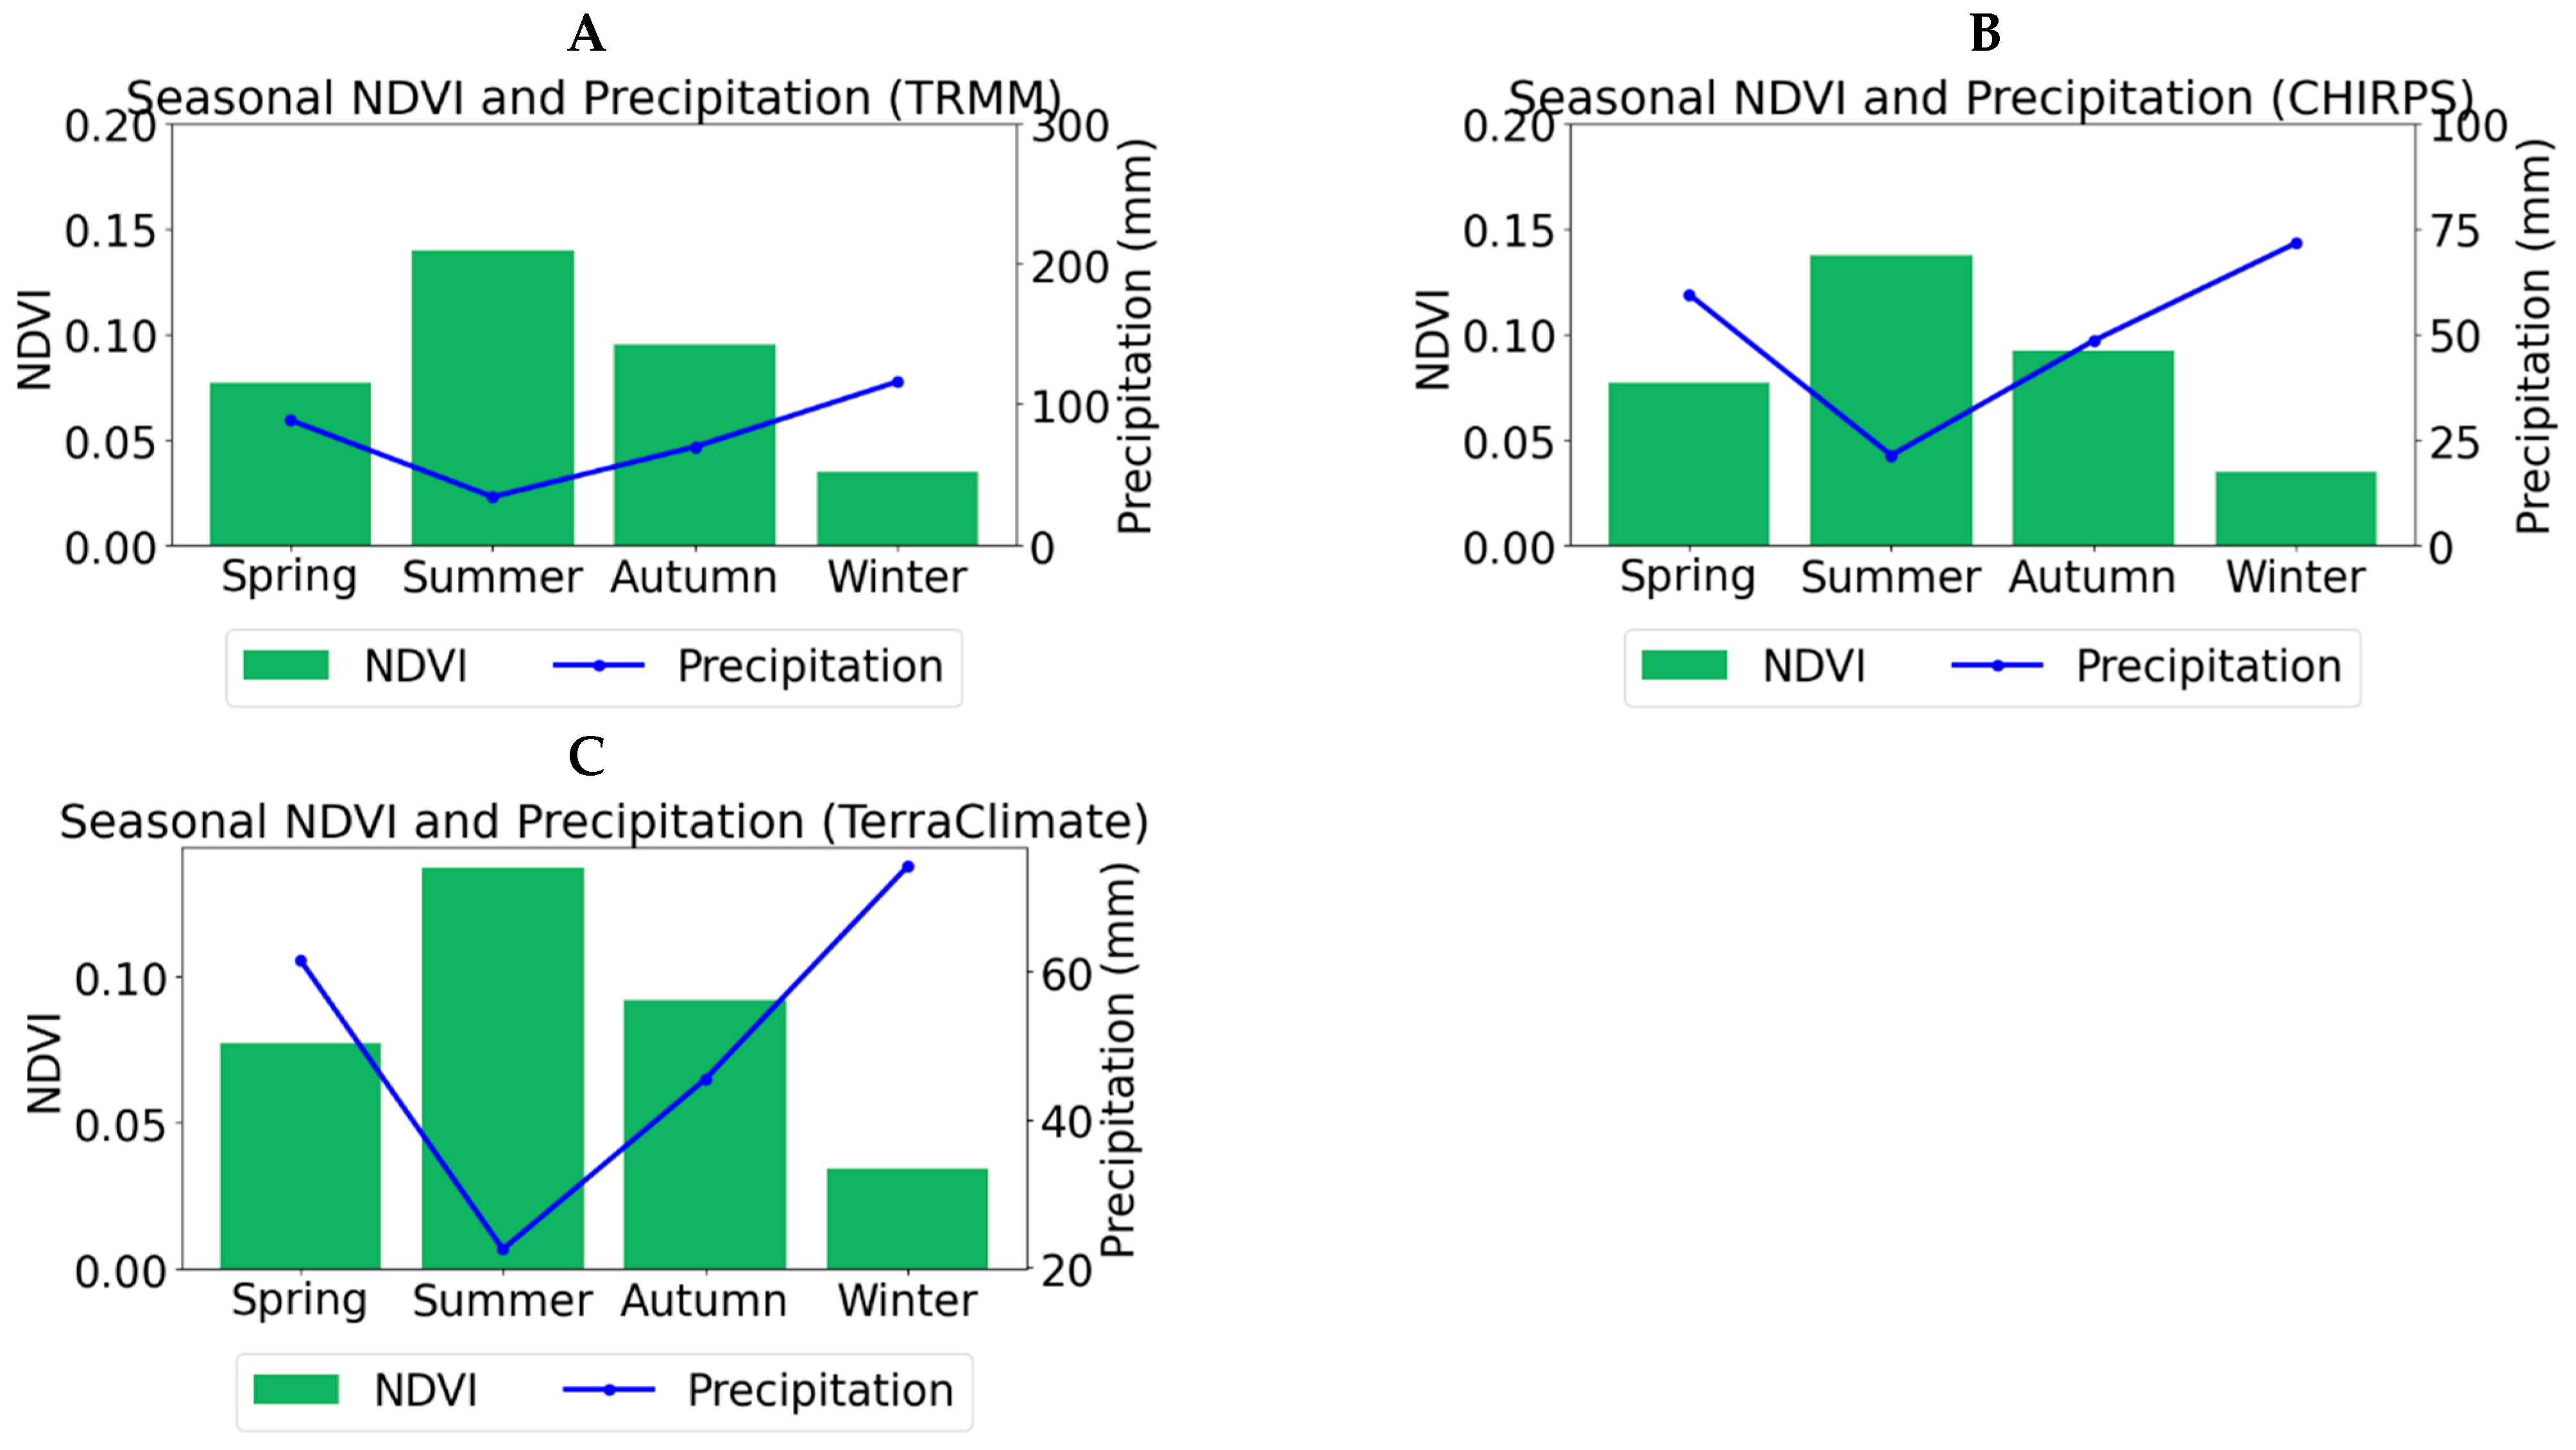
Figure 9A shows the covariation of Landsat NDVI and TRMM precipitation data. NDVI levels reach their maximum during the summer and their minimum during the winter. NDVI shows a rapid increase in spring, peaks in summer, and gradually decreases in autumn. Figure 9B shows the relationships between seasonal NDVI and precipitation variables. NDVI values reach a maximum of approximately 0.14 in summer and a minimum of approximately 0.03 in winter. In contrast, precipitation reaches its highest value in winter at 70–75 mm and its lowest level in summer at approximately 20 mm. This creates the impression of a superficially negative relationship between the two variables. NDVI values drop to a minimum level (~0.03) during winter due to low temperatures or plant dormancy despite heavy rainfall; they increase with spring rainfall and reach a peak (~0.14) in summer. This inverse phase pattern between NDVI and rainfall scientifically confirms the “time-lag effect” in vegetation response to rainfall and that the main limiting factor for plant growth is temperature in winter and soil moisture in summer. The overall NDVI amplitude remaining below 0.15 indicates that the study area is characterized by sparse vegetation or semi-arid steppe formations (Figure 9C).
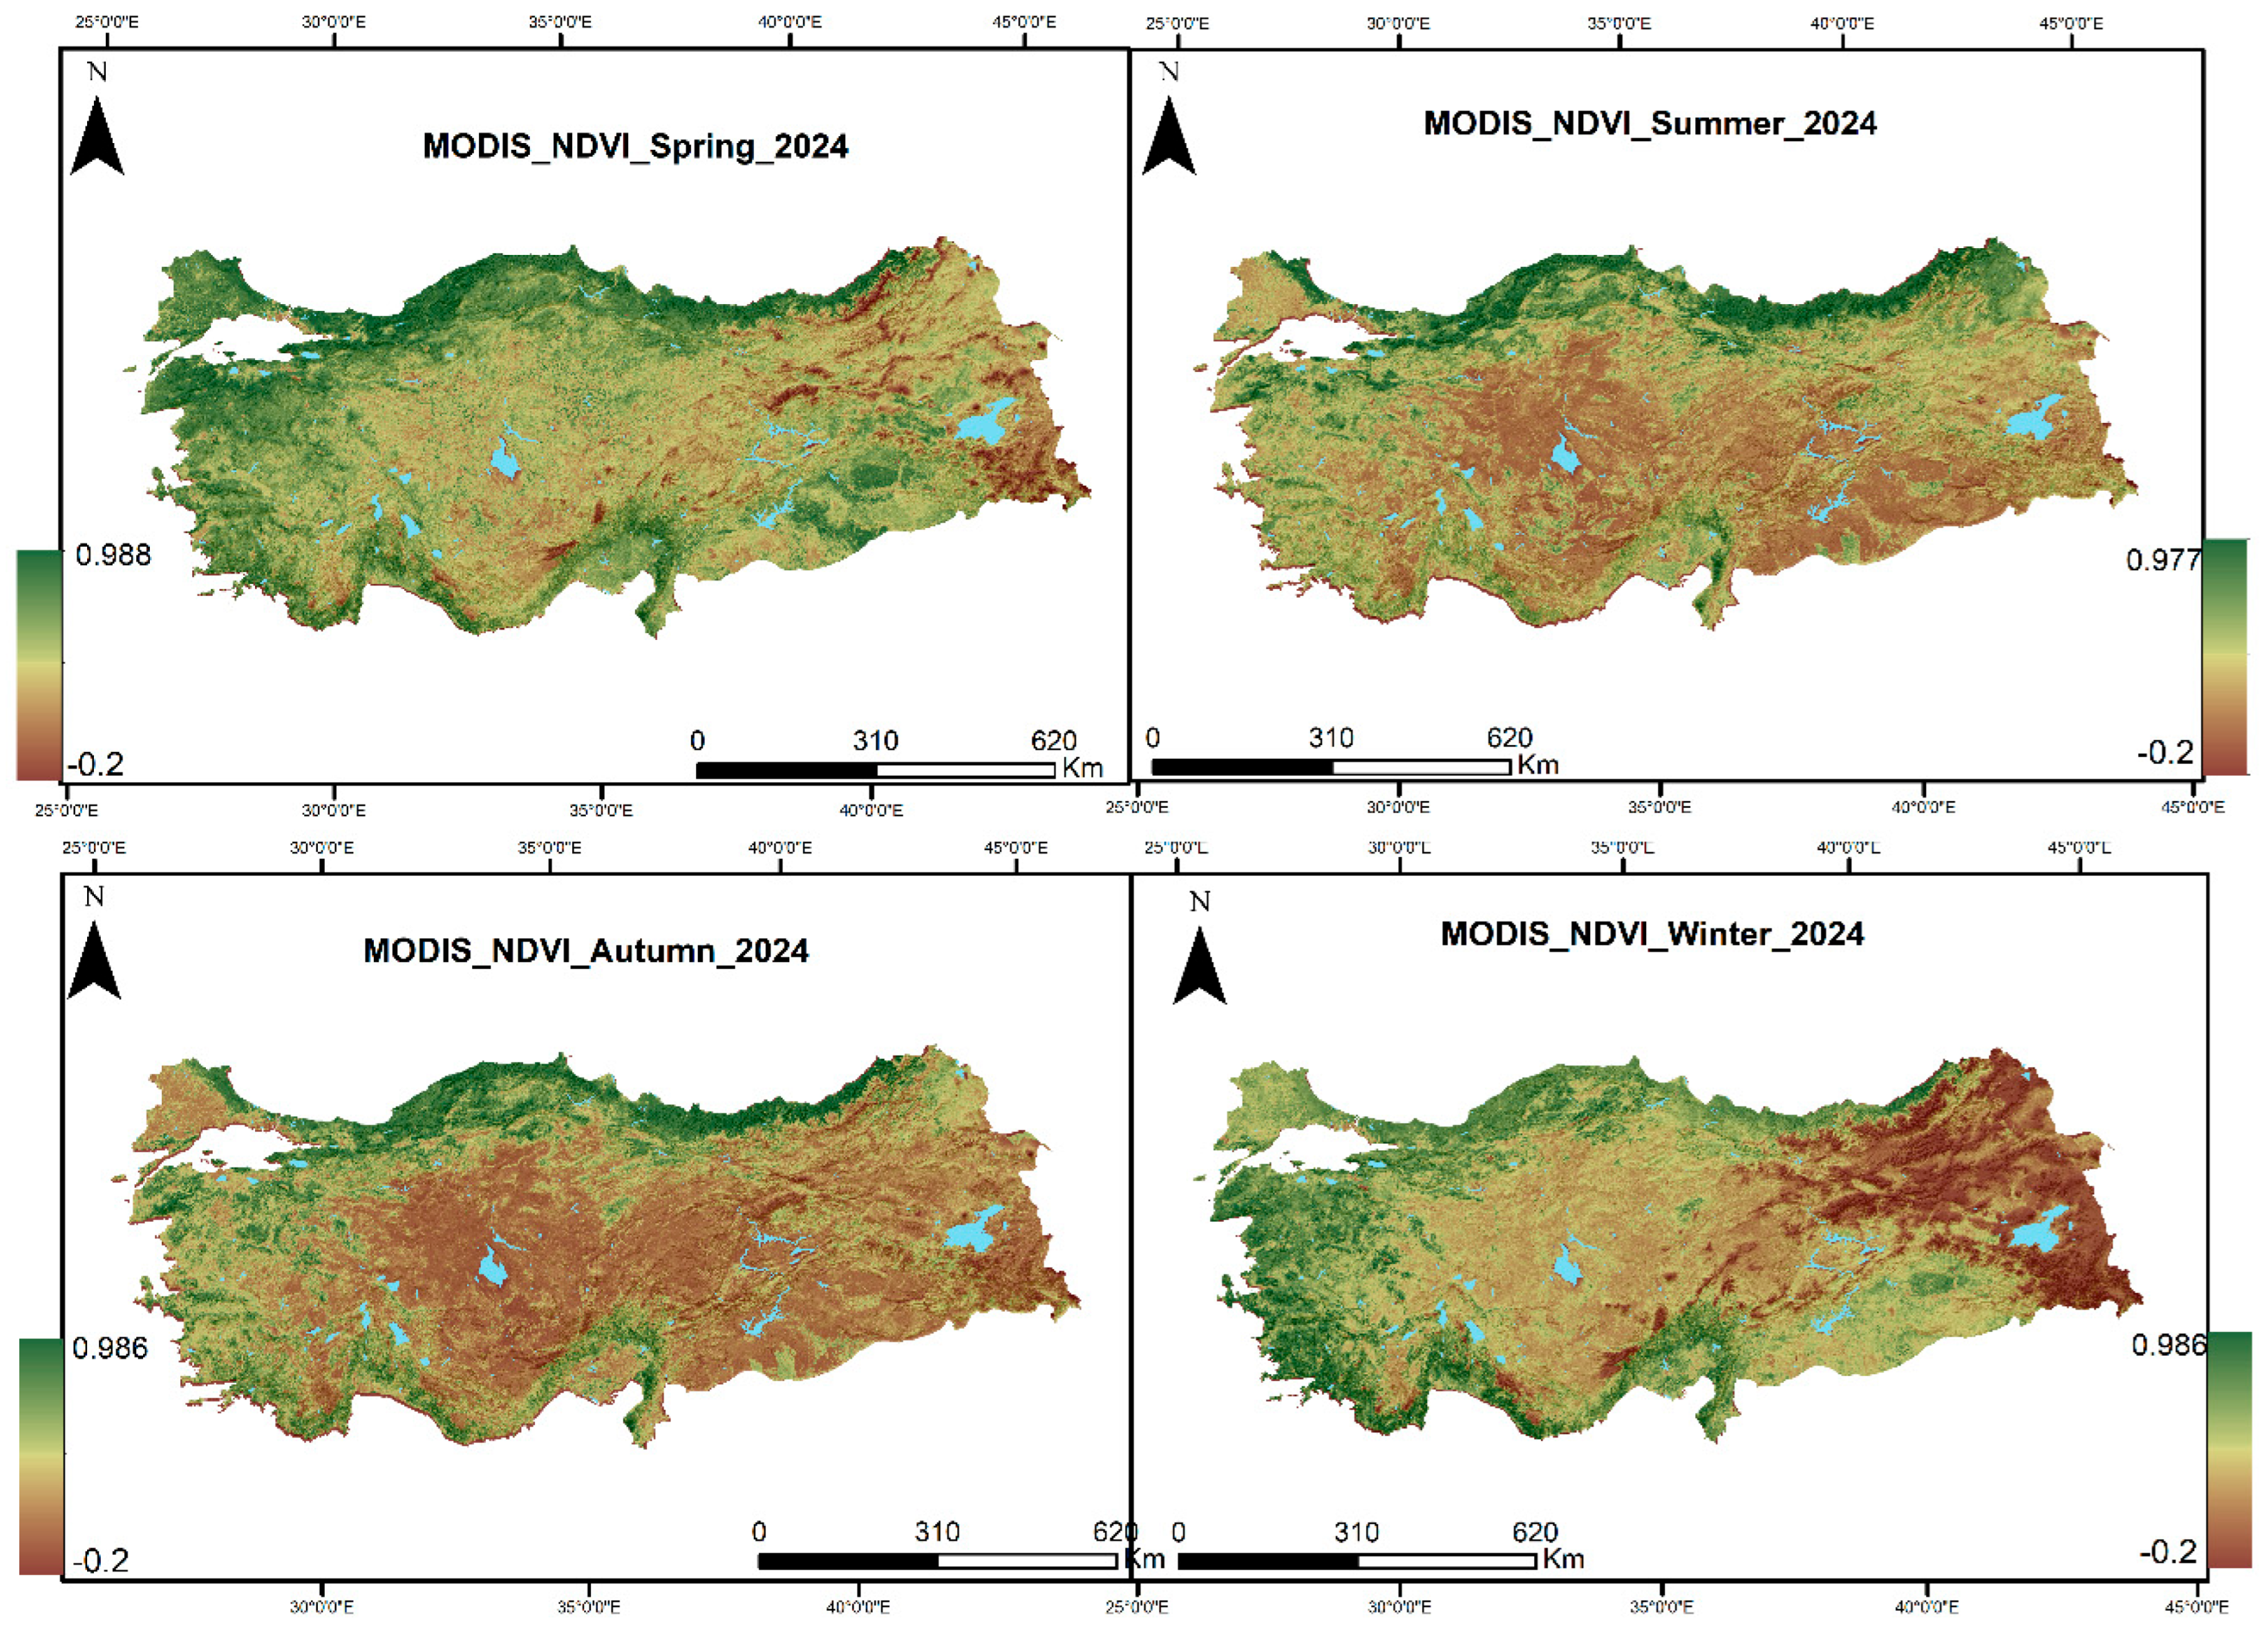
Figure 10 shows the seasonal NDVI variation derived from the MODIS sensor for the year 2024. Landsat maps (30 m) offer high-resolution details of local topography and small-scale agricultural areas, while MODIS (250 m/500 m) provides a more generalized spatial view. MODIS data, thanks to its high radiometric resolution and daily pass-through capacity, reflects seasonal “greening-up” and “browning” processes more stably. In the Summer panel, it is observed that vegetation stress in Central and Southeastern Anatolia is highlighted with a more homogeneous brown tone compared to Landsat, and is more free from local noise.
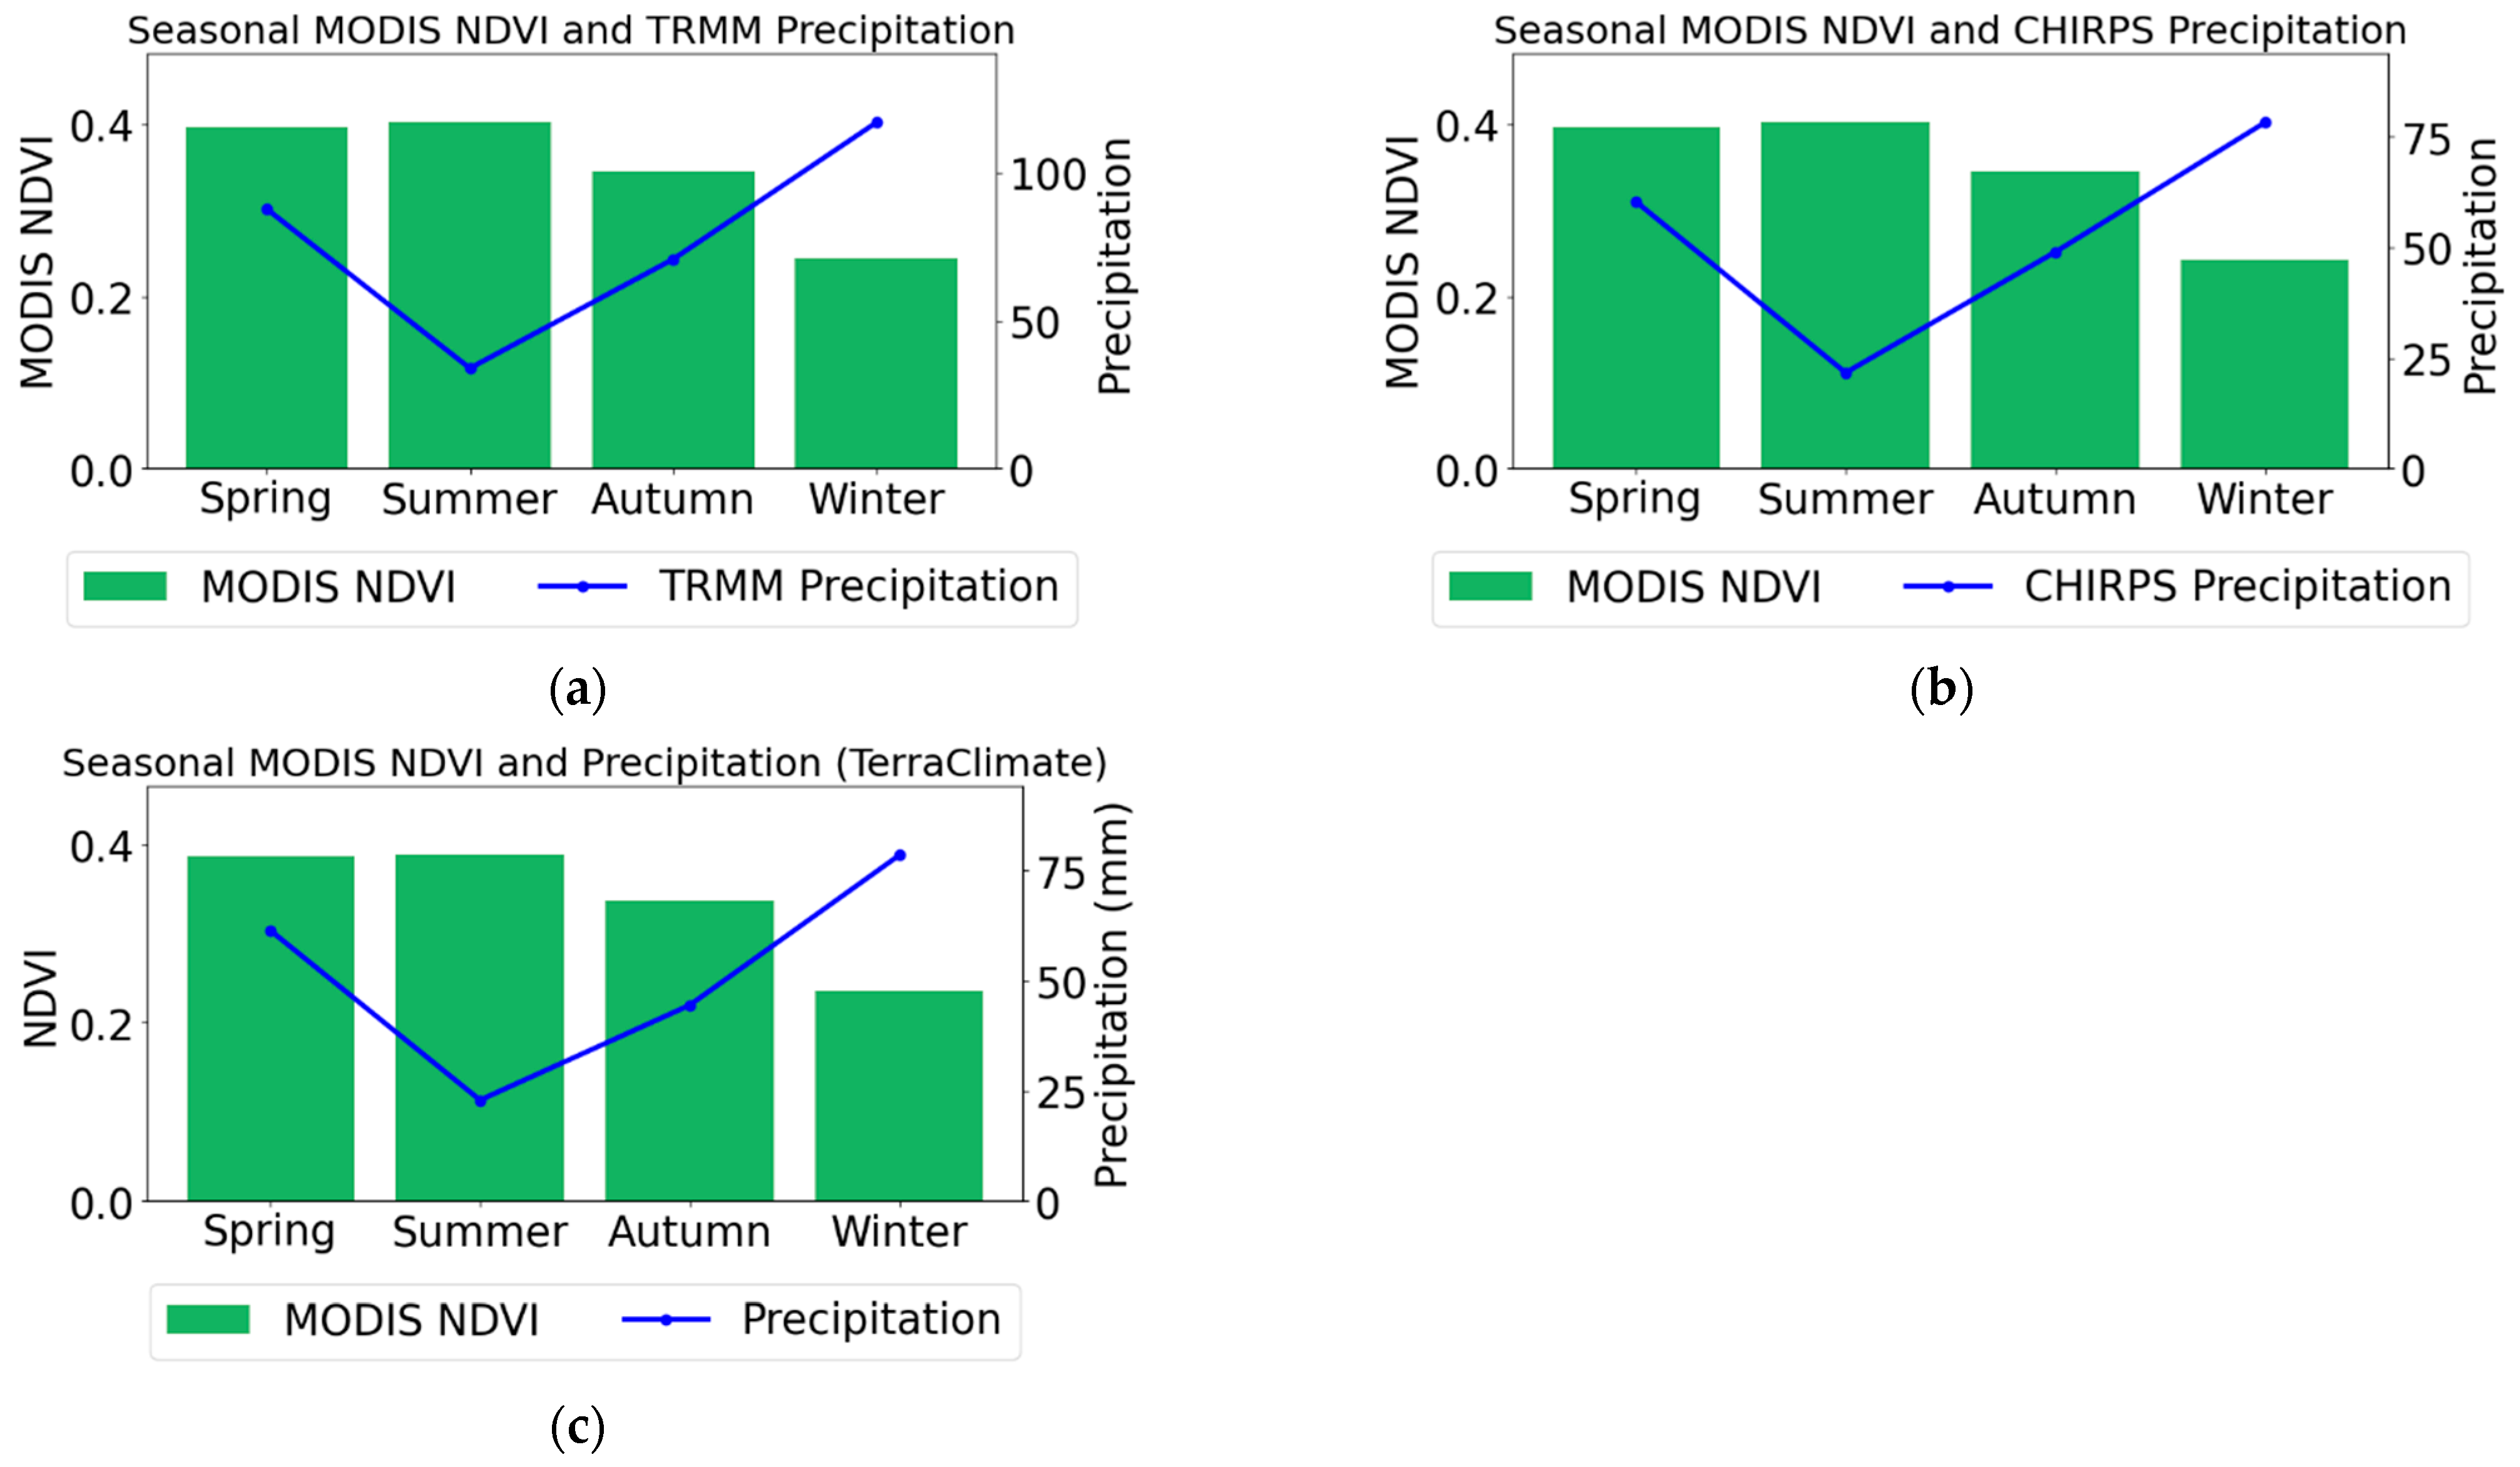
The MODIS NDVI trend shows a distinct seasonal increase and decrease pattern. Vegetation activity reaches its maximum level in spring and summer, and NDVI values rise to approximately 0.40. In autumn, a slight decrease in NDVI values is observed due to the decrease in vegetation, and the values fall to approximately 0.35 (Figure 11a). MODIS-based NDVI and CHIRPS precipitation data reveal the seasonal eco-climatological dynamics of the study area. The precipitation regime shows a distinct winter rainy-summer dry climate structure, with maximum values (~75 mm) in winter and minimum values (~20 mm) in summer. In contrast, the fact that NDVI values reach a maximum (~0.40) during the summer period when precipitation is lowest indicates that vegetation development depends on hydrological accumulation in previous periods rather than instantaneous precipitation conditions. This situation reveals that the response of vegetation to hydrological inputs exhibits a time-lag character and that ecosystem dynamics are controlled by phenological processes (Figure 11b). In Türkiye, the fact that vegetation activity peaks in spring and summer after the maximum rainfall (~75 mm) observed during the winter season, reaching NDVI values of ~0.40, may indicate that the vegetation exhibits a significant time-delayed response in its growth cycle and that winter cumulative rainfall acts as a buffer against summer drought through soil moisture (Figure 11c).
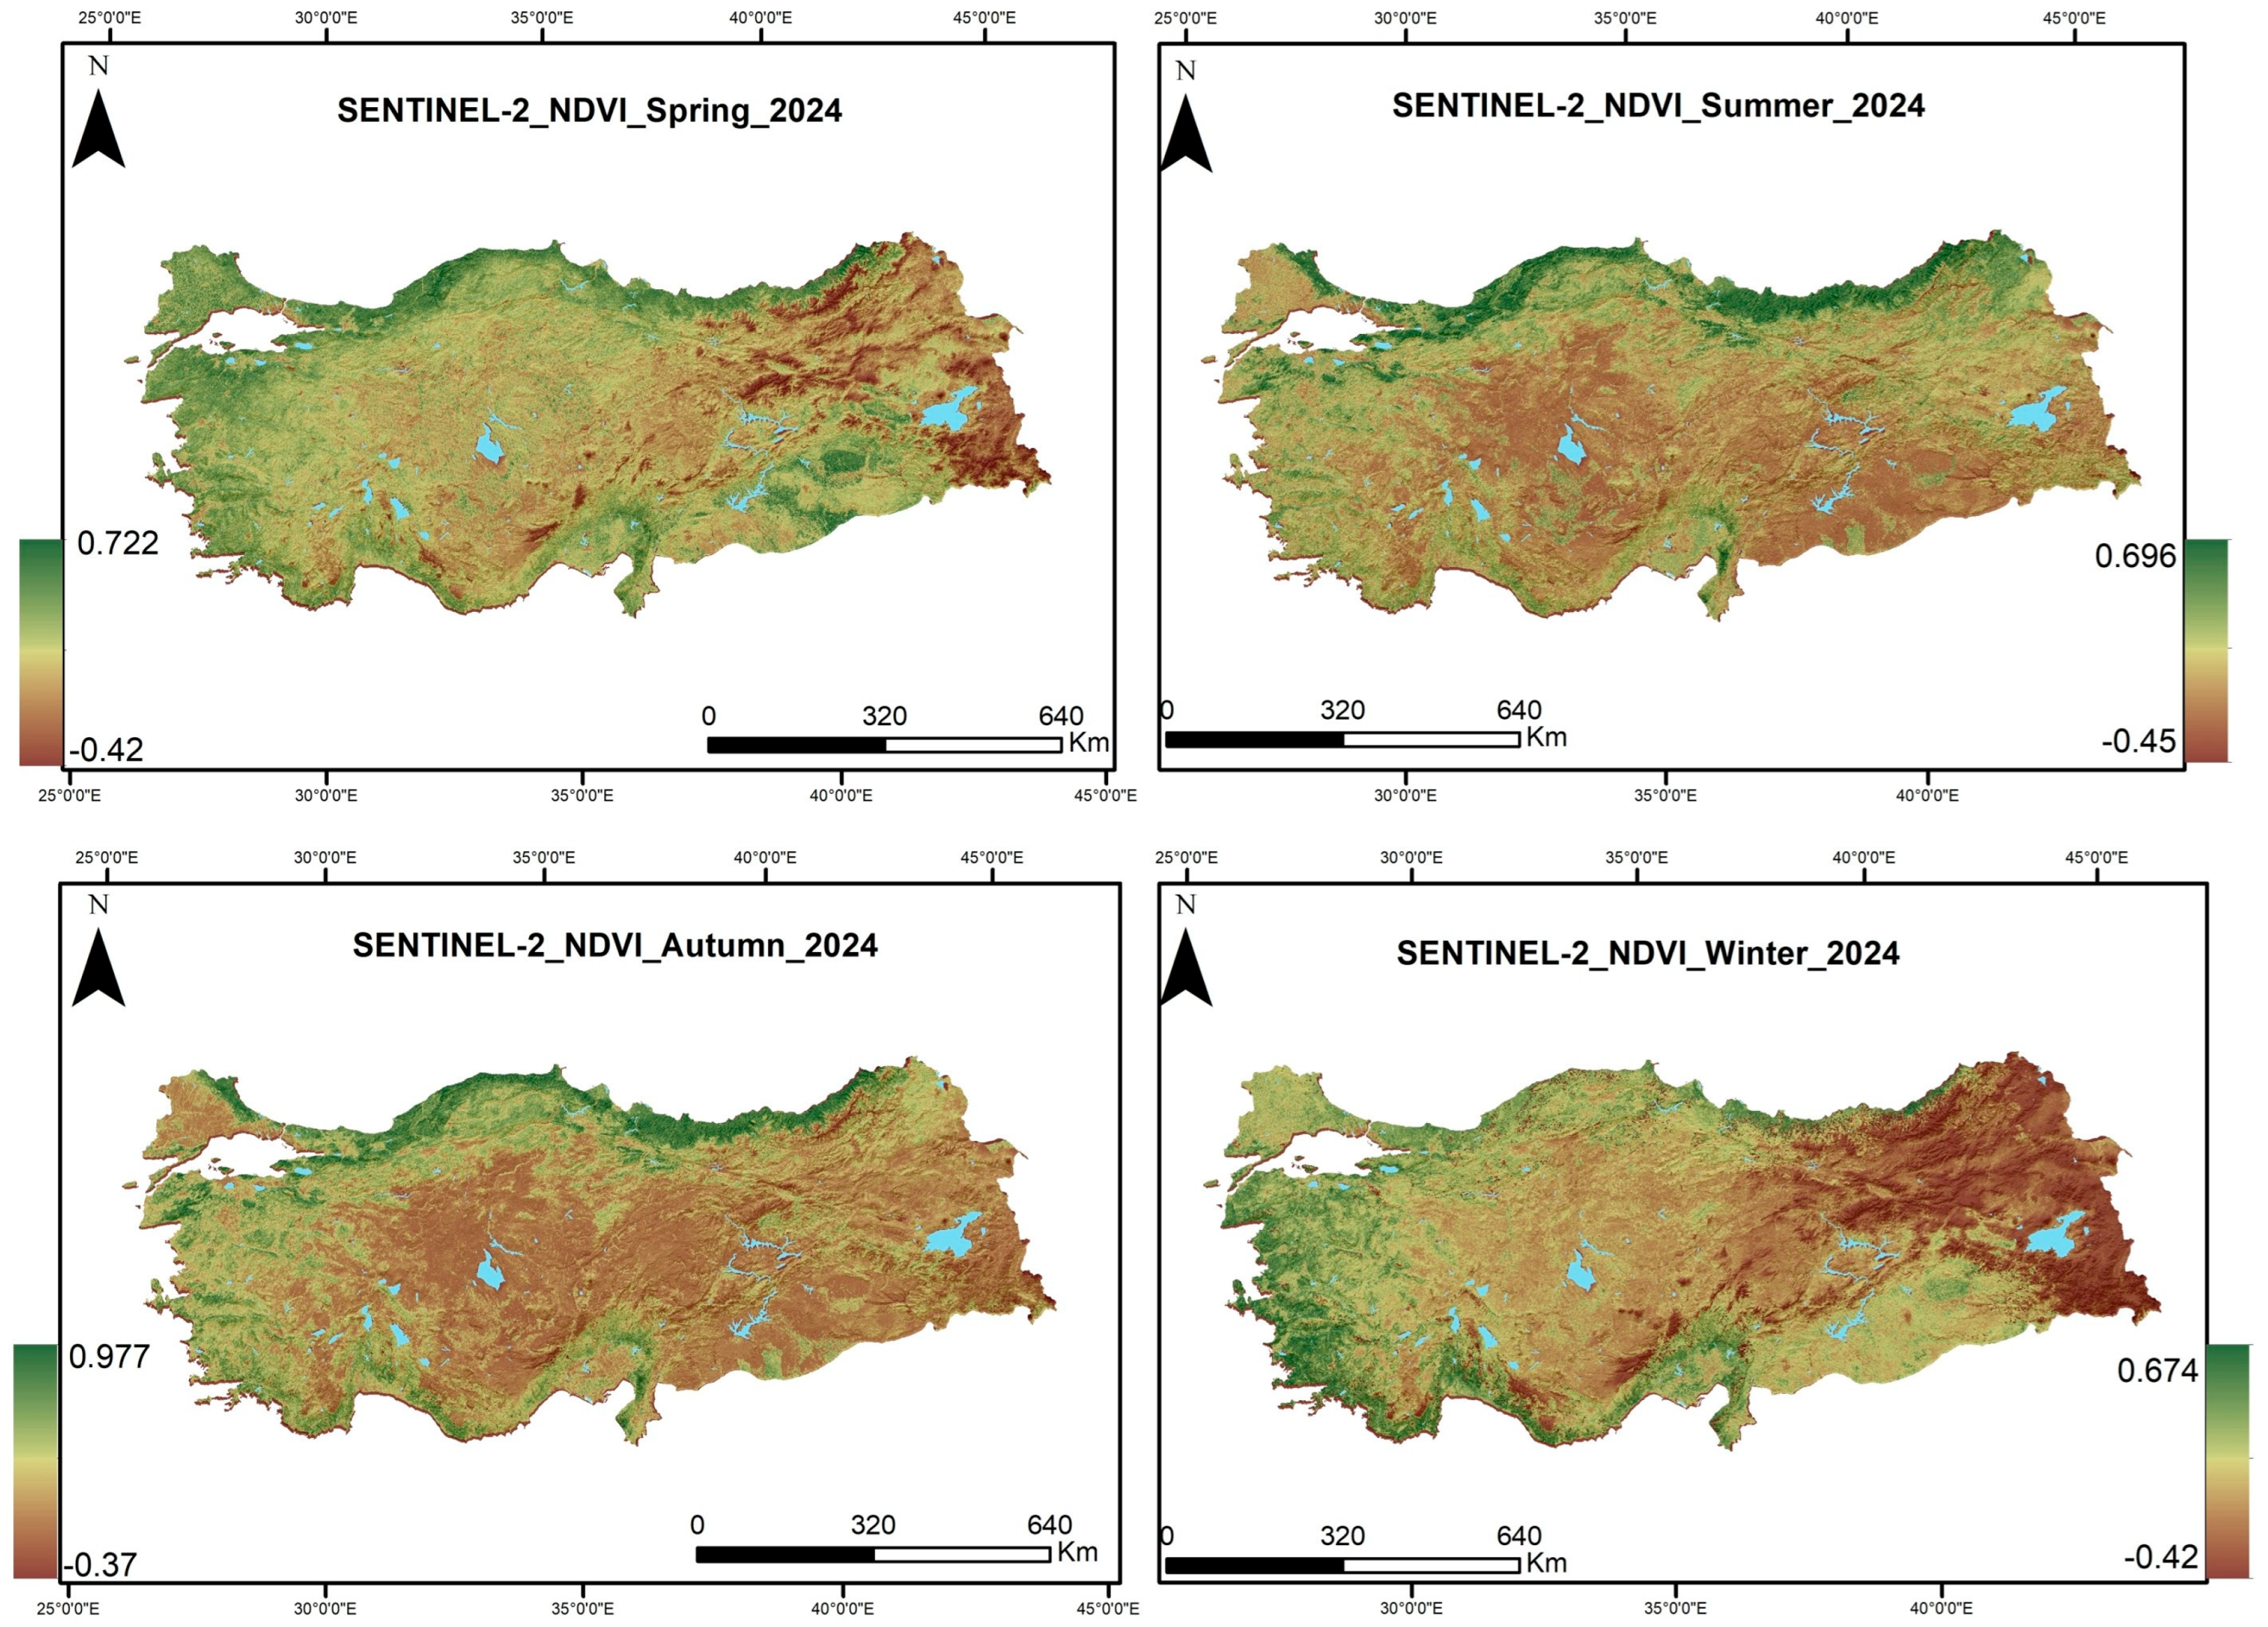
Sentinel-2 presents seasonal NDVI variation derived from satellite data. Because Sentinel-2 has a much higher spatial resolution of 10 m compared to both Landsat (30 m) and MODIS (250 m), it has the potential to reflect the land cover dynamics of Türkiye down to the finest detail (micro-topography, plot-based agriculture, vegetation along riverbeds). Sentinel-2 maps, particularly in the Spring and Summer panels, have been the dataset that most clearly distinguishes the boundaries between agricultural areas and natural vegetation. Sentinel-2 maps show that maximum values (between 0.72 and 0.97) vary seasonally. The highest upper value of 0.977 reached in the Autumn map is likely due to the spectral differentiation of post-harvest second crops or permanent forest cover (Figure 12).
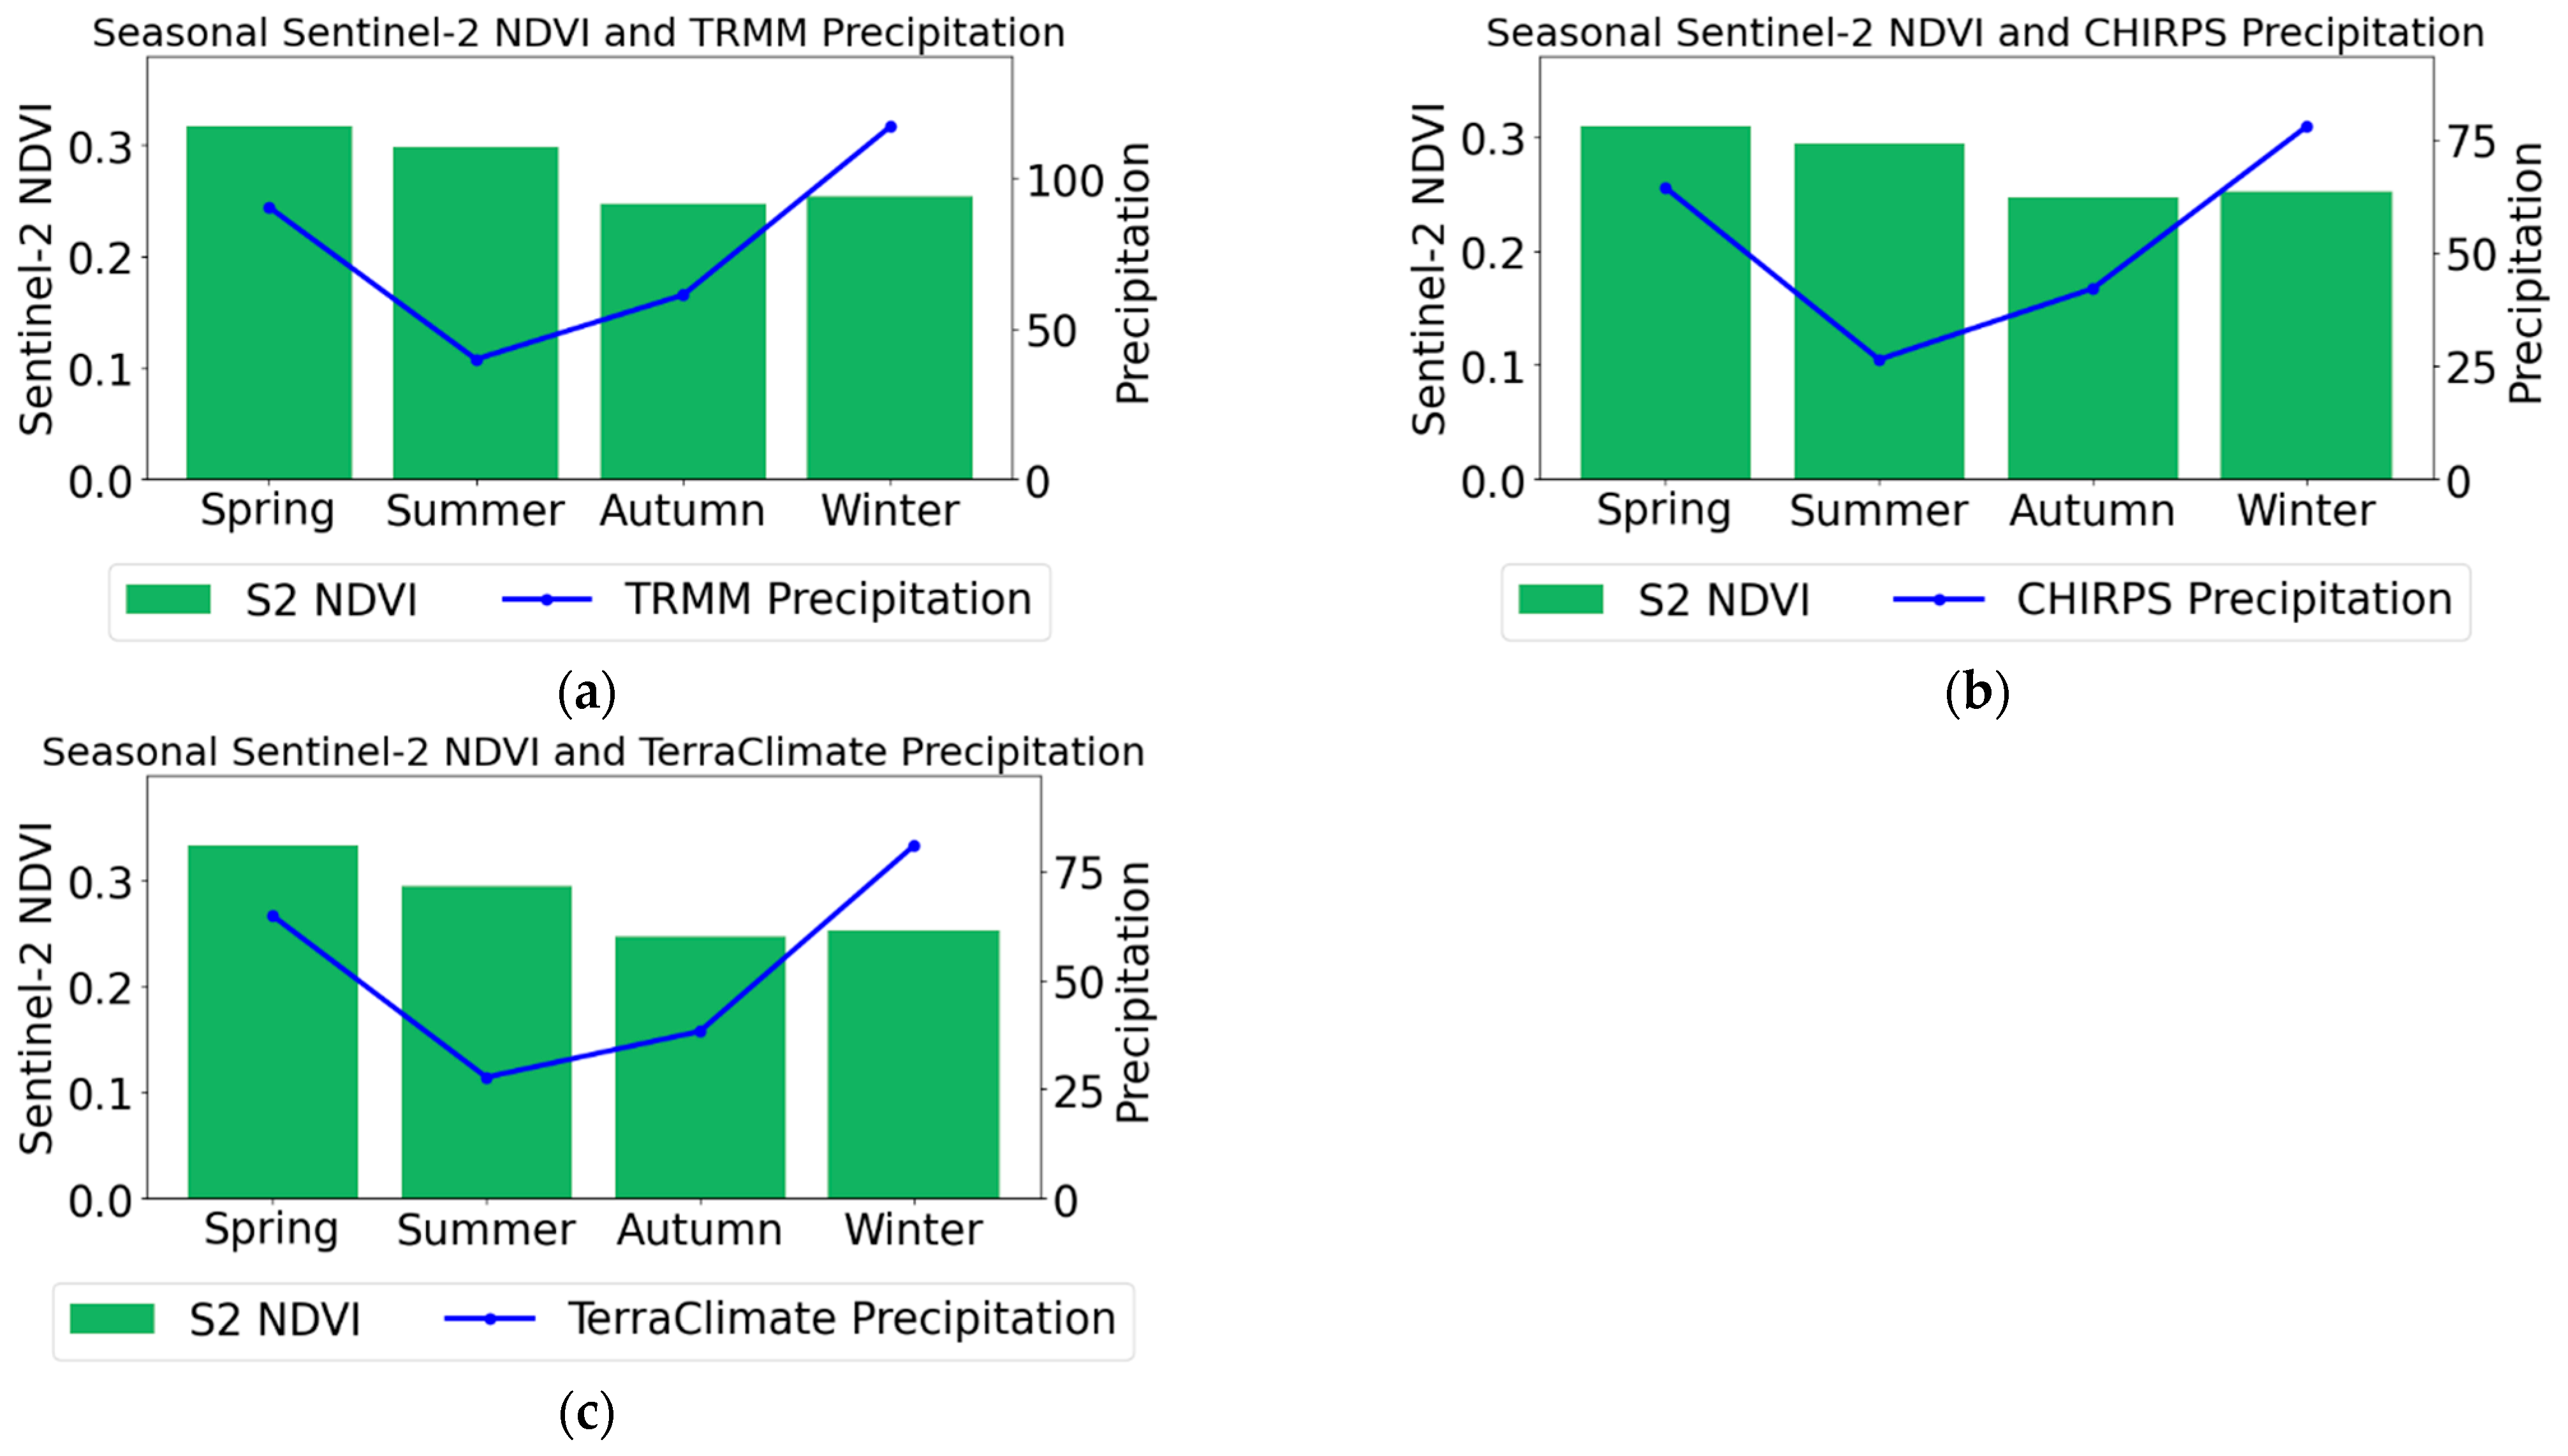
This study comparatively reveals the seasonal agreement between Sentinel-2-based NDVI data and different precipitation datasets (TRMM, CHIRPS, and TerraClimate). All three analyses consistently show a typical time-lag eco-hydrological cycle where vegetation activity peaks in spring (~0.32), remains high throughout summer, and precipitation reaches its maximum in winter. The main difference between the datasets lies in the precipitation amplitudes: TRMM data provides a higher estimate of winter precipitation, showing over 100 mm, while CHIRPS and TerraClimate data follow a more similar and conservative trend within the 75–80 mm range (Figure 13).

4. Discussion

This study reveals the sensitivity of land cover dynamics to rainfall gradients across Türkiye through high-resolution satellite data and vegetation indices. The findings confirm that rainfall is a dominant, though not exclusive, control mechanism governing land cover patterns across Türkiye, reflecting the country’s heterogeneous topography and climatic diversity. In particular, annual rainfall between 400 mm and 700 mm constitutes a critical ecological threshold in the transition from steppe ecosystems to forest ecosystems in Türkiye’s interior regions. This threshold behavior indicates that vegetation responds nonlinearly to precipitation, with abrupt changes occurring when certain limits are exceeded [53]. Even small changes in precipitation can lead to large differences in land cover. When the relationship between LULC distribution and rainfall gradient is examined, the dominance of agricultural areas and bare surfaces in low-rainfall regions (200–400 mm) indicates that human activities (irrigation, fallow, etc.) are decisive in water-constrained ecosystems. In particular, human activities in these areas significantly shape land cover dynamics by altering natural processes [54]. However, at rainfall values of 800 mm and above, the forest density approaching 100% as seen in ESA WorldCover data proves that biophysical constraints become more dominant than human intervention. Similar relationships between precipitation and vegetation distribution have been widely reported in the literature; this relationship is particularly evident in semi-arid to humid transition zones where water is the primary limiting factor [55,56].
Many studies have investigated the interactions between land-cover changes and climatic processes in the Mediterranean Basin, where Türkiye is located. Carvalho Santos et al. [57] evaluated the separate and combined effects of land-cover changes and future climate scenarios on hydrological services in the Vez watershed, northern Portugal, which has similar hydroclimatic characteristics to the Mediterranean climate zone that includes Türkiye. Using the SWAT (Soil and Water Assessment Tool) model, the study demonstrated that the eucalyptus/pine-dominated land-cover scenario reduced annual water availability by approximately 7% and decreased summer streamflow by up to 17%. Although future climate conditions had a limited effect on annual discharge, they caused more pronounced reductions in low flows during dry periods, ranging from 15% to 38%. Furthermore, the combined assessment of climate change and land-cover scenarios revealed that forest plantations with high evapotranspiration capacity may intensify pressure on water resources during dry seasons, whereas agricultural expansion may increase soil erosion and nitrate losses. The authors emphasized that climate variability and land-cover dynamics should be considered together to develop sustainable watershed-scale management strategies. von Keyserlingk et al. [58] investigated how ecosystem resilience of dry rangelands in southern Cyprus to climatic disturbances such as drought is regulated by grazing intensity and environmental conditions using a 28-year Landsat NDVI time series and the BFAST (Breaks For Additive Seasonal and Trend) change detection approach. Their study provided important insights into the relationships among climate variability, vegetation dynamics, and land-use characteristics in Mediterranean ecosystems. The results showed that areas with more favourable environmental conditions, including higher NDVI values and northern slope orientation, exhibited greater resistance to climate variability and faster recovery after drought events. In contrast, areas characterized by unfavourable environmental conditions and high grazing pressure showed reduced vegetation recovery rates after drought and developed less responsive ecosystem states under climatic stress. Furthermore, low grazing intensity positively influenced the NDVI recovery trend after drought, although it did not significantly improve long-term resistance to climate variability. These findings demonstrate that drought impacts in Mediterranean ecosystems cannot be explained solely by climatic factors such as reduced precipitation or increased temperature, but are also influenced by land-cover characteristics and vegetation conditions. Long-term satellite-based NDVI analyses provide an effective approach for assessing climate change impacts on vegetation dynamics and evaluating ecosystem resilience under different environmental conditions. Therefore, in regions such as Türkiye, where Mediterranean climatic influences, increasing drought trends, and land degradation processes coexist, integrating climate variability with land-cover dynamics is essential for sustainable land management and ecosystem conservation strategies.
The findings of this study reveal the current relationships between land cover dynamics and precipitation gradients in Türkiye and also provide a strategic framework for future research. In this context, it is necessary to develop various research orientations to gain a more holistic understanding of land cover and climate interactions. Firstly, it is crucial to integrate the current LULC–precipitation relationships with future climate scenarios such as CMIP6-based SSP2-4.5 and SSP5-8.5, taking into account ecological threshold values. This integration will allow for the modeling of changes in the spatial distribution of land cover classes and bioclimatic shifts that may occur until 2100. This approach is particularly critical for predicting potential changes in the horizontal and vertical boundaries of forest and steppe ecosystems. Furthermore, beyond this study, where precipitation is the primary determining factor, it is necessary to address topographic and edaphic variables in more detail. The combined assessment of variables such as soil moisture, potential evapotranspiration (PET), and land surface temperature (LST) will contribute to a more comprehensive explanation of land cover changes. The use of deep learning algorithms in conjunction with machine learning methods (Random Forest, Support Vector Machines) in this process will enable a more effective revelation of nonlinear relationships between variables. Since explaining land cover changes solely through climatic factors is insufficient, the impact of human activities must also be included in the analysis. In this context, integrating indicators such as the Human Influence Index into the methodology is crucial to differentiate the effects of urban expansion, agricultural land conversion, and land-use decisions on natural vegetation. This will allow for a clearer understanding of the relative contributions of anthropogenic and natural processes to land cover. High-resolution local modeling is also needed to advance the analytical approach. Macro-scale assessments across Türkiye should be supported by micro-scale analyses in ecologically sensitive areas such as the humid ecosystems of the Eastern Black Sea or the saline basins of Central Anatolia. For this purpose, using sources such as high-resolution satellite data or unmanned aerial vehicle (UAV) images with resolutions below 10 m will increase spatial accuracy. Finally, the scientific findings obtained need to be integrated into policy-making processes. Implementing dynamic land management approaches is crucial for protecting ecosystems sensitive to land cover changes and developing climate change adaptation strategies. In this context, the inclusion of scientific outputs in national climate change action plans is considered a critical requirement for Türkiye’s long-term ecological sustainability.

4.1. Beyond Climatic Determinism: The Role of Anthropogenic Drivers

The present findings attribute LULC distribution primarily to precipitation amount, climatic gradients, and hydro-climatic conditions; however, climatic variables alone may be insufficient to fully explain land cover patterns in a country like Türkiye, where human-landscape interactions are pronounced. For instance, the dominance of agriculture and bare surfaces in low-rainfall zones (200–400 mm) is attributed to “human-induced land management,” yet the specific anthropogenic mechanisms underlying this pattern are not examined in detail raising the risk that precipitation thresholds are overstated as causal drivers when the observed patterns may partly reflect the spatial footprint of human intervention rather than climatic forcing alone.
Incorporating the following human-driven factors would strengthen the interpretive power of the results:
Agricultural expansion: The dominance of agriculture in low-rainfall zones may reflect not only water-constrained natural response but also active encroachment on natural steppe and grassland areas. Since ESA WorldCover lacks the temporal depth to distinguish expanding from stable agricultural boundaries, the reported precipitation–agriculture relationship may partly represent a static land-use pattern rather than a climatic response.
Irrigation practices: In semi-arid/arid regions such as Central and Eastern Anatolia, agricultural presence may depend more on groundwater and surface irrigation infrastructure than on natural precipitation regimes. Without distinguishing irrigated from rain-fed agricultural land, the precipitation–land cover relationship may be overstated.
Afforestation programs: The 400–700 mm steppe-to-forest transition threshold is presented as a purely natural ecological boundary; however, state-supported afforestation and erosion-control programs in Türkiye are often concentrated precisely in these transition zones. Part of the observed forest expansion may therefore stem from planned afforestation rather than a natural precipitation threshold.
Urban growth: Near-saturated forest cover in high-rainfall zones (>1000 mm) is attributed to climatic forcing overriding land-use pressures. Yet the Black Sea coastal zone is also under considerable urbanization pressure, and the effect of built-up expansion on the forest–agriculture balance is not treated as a separate variable, leaving an incomplete picture.
Socioeconomic factors: Population growth, land management and agricultural policies, and rural population shifts (particularly rural-to-urban migration) are long-term drivers of land cover change. Rural depopulation in parts of Central Anatolia, for example, has led to agricultural abandonment and natural revegetation a process unrelated to increased precipitation. Omitting such socioeconomic dynamics risks mistaking what may be partly socioeconomic thresholds for purely ecological ones.
In conclusion, while the precipitation–land cover relationships identified in this study offer a valuable hydro-climatic framework, the assumption that climatic variables alone constitute a sufficient explanatory model should be reconsidered. Future work should quantitatively incorporate agricultural expansion, irrigation infrastructure, afforestation programs, urban growth, and socioeconomic indicators (e.g., via a Human Influence Index or land-use change statistics) to disentangle the relative contributions of climatic and anthropogenic drivers and strengthen the causal interpretation of the findings.

4.2. Limitations and Future Directions

This study has several limitations that should be acknowledged. First, the precipitation datasets used (CHIRPS, TerraClimate, and TRMM) have different spatial resolutions (approximately 5–25 km), and although resampling procedures were applied, resolution mismatches with the finer-scale land cover and NDVI products (ESA WorldCover, Landsat, MODIS, Sentinel-2) may still introduce uncertainties particularly in representing orographic precipitation processes across Türkiye’s topographically complex terrain. These satellite-based precipitation estimates were not validated against ground station observations, and their accuracy is known to decline in high-mountainous areas and during extreme precipitation events, warranting cautious interpretation of extreme-value results. Second, the analyses rely exclusively on remote sensing products; important environmental drivers such as temperature, soil properties, evapotranspiration, topography, and land management practices were not quantitatively incorporated, which may limit the explanatory completeness of the precipitation–land cover relationships identified. Third, the analyses are primarily descriptive and do not employ statistical tests (e.g., regression, correlation, significance testing) to quantify the strength or significance of these relationships. Fourth, classification uncertainties persist in ecotones and semi-arid transition zones, where spectral similarity between bare and sparsely vegetated surfaces can reduce mapping accuracy. Fifth, human-induced land-use changes such as irrigation, deforestation, and urban expansion were discussed qualitatively but could not be statistically isolated from climatic effects, as these anthropogenic interventions can obscure signals associated with the natural precipitation gradient. Finally, the study is based on current and historical conditions only and does not incorporate future climate projections (e.g., CMIP6 SSP scenarios) to assess potential future land-cover trajectories. Addressing these limitations through ground-truth validation, inclusion of additional biophysical variables, formal statistical modeling, and explicit separation of anthropogenic and climatic drivers represents an important direction for future research.
Future research should extend this framework by incorporating projected climate scenarios, such as SSP2-4.5 and SSP5-8.5, to assess how anticipated precipitation decline and intensified drought conditions may drive spatial reorganization of vegetation zones across Türkiye. Such scenario-based projections would allow the ecological thresholds identified in this study to be evaluated under future climatic trajectories, providing a stronger scientific basis for climate change adaptation and sustainable land management strategies. In addition, coupling these projections with quantitative statistical modeling and ground-based validation, as noted in the Limitations section, would further strengthen the reliability of vulnerability assessments for ecosystem stability and associated services in Türkiye.

5. Conclusions

This study aimed to examine the spatiotemporal dynamics of land use/land cover (LULC) along precipitation gradients across Türkiye, using a multi-source remote sensing approach that integrates CHIRPS, TerraClimate, and TRMM precipitation datasets with the ESA WorldCover (10 m) land cover product and multi-sensor NDVI composites (Landsat, MODIS, Sentinel-2). The most important scientific findings show that precipitation acts as the dominant environmental control on land cover distribution across Türkiye. A clear ecological threshold was identified between 400 and 700 mm of annual precipitation, marking a sharp transition from steppe-dominated landscapes to woody vegetation systems. Below 400 mm, land cover is characterized by sparse vegetation, bare soil, and irrigation-dependent agriculture, while regions receiving more than 1000 mm particularly along the Black Sea coast show near-saturated forest cover, indicating that climatic forcing overrides land-use pressures in humid zones. Seasonal NDVI dynamics further reveal that vegetation greenness tracks precipitation variability closely, with a delayed ecohydrological response evident in semi-arid interior regions. The scientific contribution and novelty of the study lie in providing a reproducible, transferable methodological framework that harmonizes precipitation datasets of differing spatial resolution (5–25 km) with 10 m land cover products within a cloud-based geospatial environment. Comparative evaluation shows that while all precipitation datasets capture broad climatic gradients, CHIRPS is more sensitive to orographic variability, whereas TerraClimate performs more stably in representing long-term land–atmosphere water balance a comparative dimension that moves beyond prior single-dataset studies in the literature. These findings carry direct implications for policy. The identified ecological thresholds indicate that even modest reductions in annual precipitation could trigger substantial shifts in land cover, particularly in grassland–forest ecotones. This underscores the need to embed threshold-sensitive, dynamic land-use planning into national climate adaptation strategies, prioritizing vulnerability hotspots where ecosystem stability is most exposed to hydro-climatic variability. Ultimately, this study demonstrates that precipitation thresholds are the primary determinants of Türkiye’s ecological boundaries, making science-based, threshold-driven land management no longer optional but an urgent imperative for safeguarding the country’s ecosystems under a changing climate.

Author Contributions

M.A.Ç. and F.A.: Conceptualization, Data curation, Investigation, Resources, and Writing—review and editing. A.B.: Software, Data curation, Validation, Visualization, and Investigation. Y.P.: Formal analysis, Visualization, and Review and editing. All authors have read and agreed to the published version of the manuscript.

Funding

This research received no external funding.

Institutional Review Board Statement

This study did not involve human participants, human data, human tissue, or animals. Therefore, ethics committee approval was not required.

Informed Consent Statement

Not applicable.

Data Availability Statement

The precipitation datasets analyzed in this study are publicly available: CHIRPS data can be accessed at https://www.chc.ucsb.edu/data/chirps (accessed on 18 February 2026); TerraClimate data are available at https://www.climatologylab.org/terraclimate.html (accessed on 18 February 2026); TRMM data can be ob-tained from the NASA Earthdata portal at https://disc.gsfc.nasa.gov (accessed on 18 February 2026). The ESA World-Cover (10 m) land cover product is openly available at https://esa-worldcover.org/en (accessed on 18 February 2026). Multi-sensor NDVI composites were generated using Landsat, MODIS, and Sentinel-2 imagery obtained through the USGS Earth Explorer (https://earthexplorer.usgs.gov, accessed on 18 February 2026). The derived datasets generated during this study are available from the corresponding author upon reasonable request.

Acknowledgments

During the preparation of this manuscript, the authors used AI-assisted language tools solely for language editing, grammar correction, and translation support. These tools were not used to generate scientific ideas, study design, methodology, data analysis, results, interpretations, or conclusions. The authors carefully reviewed and edited the final manuscript. The authors take full responsibility for its content.

Conflicts of Interest

The authors declare that they have no competing interests.

References

  1. Roy, P.S.; Ramachandran, R.M.; Paul, O.; Thakur, P.K.; Ravan, S.; Behera, M.D.; Sarangi, C.; Kanawade, V.P. Anthropogenic Land Use and Land Cover Changes—A Review on Its Environmental Consequences and Climate Change. J. Indian Soc. Remote Sens. 2022, 50, 1615–1640. [Google Scholar] [CrossRef]
  2. Huang, X.; Liu, Y.; Stouffs, R. Human-earth system dynamics in China’s land use pattern transformation amidst climate fluctuations and human activities. Sci. Total Environ. 2024, 954, 176013. [Google Scholar] [CrossRef] [PubMed]
  3. Valjarević, A.; Morar, C.; Brasanac-Bosanac, L.; Cirkovic-Mitrovic, T.; Djekic, T.; Mihajlović, M.; Milevski, I.; Culafic, G.; Luković, M.; Niemets, L.; et al. Sustainable land use in Moldova: GIS & remote sensing of forests and crops. Land Use Policy 2025, 152, 107515. [Google Scholar] [CrossRef]
  4. Zeng, X.; Hu, Z.; Chen, A.; Yuan, W.; Hou, G.; Han, D.; Liang, M.; Di, K.; Cao, R.; Luo, D. Global decline in the sensitivity of vegetation productivity to rainfall from 2001 to 2018. Glob. Change Biol. 2022, 28, 6823–6833. [Google Scholar] [CrossRef] [PubMed]
  5. Sousa, L.; Montenegro, A.; Silva, M.; Almeida, T.; Carvalho, A.; Da Silva, T.; Lima, J. Spatial and Temporal Analysis of Rainfall and Drought in a Semi-Arid Basin of Brazil: Land Use and Land Cover Dynamics. Remote Sens. 2023, 15, 2550. [Google Scholar] [CrossRef]
  6. Pontifes, P.; García-Meneses, P.; Gómez-Aíza, L.; Monterroso-Rivas, A.; Chávez, M. Land use/land cover change and extreme climatic events in the arid and semi-arid ecoregions of mexico. Atmósfera 2018, 31, 355–372. [Google Scholar] [CrossRef]
  7. Laaribya, S.; Alaoui, A. Spatio-Temporal Trends and Climate Change Impacts on Land Cover Dynamics in Talassemtane National Park (Morocco) Using Artificial Intelligence and Google Earth Engine. J. Sustain. For. 2025, 44, 289–318. [Google Scholar] [CrossRef]
  8. Öztürk, M.Z.; Çetinkaya, G.; Aydin, S. Köppen-Geiger İklim Sınıflandırmasına Göre Türkiye’nin İklim Tipleri. J. Geogr. 2017, 35, 17–27. [Google Scholar] [CrossRef]
  9. Yılmaz, E.; Çiçek, İ. Detailed Köppen-Geiger climate regions of TurkeyTürkiye’nin detaylandırılmış Köppen-Geiger iklim bölgeleri. J. Hum. Sci. 2018, 15, 225–242. [Google Scholar] [CrossRef]
  10. Taşoğlu, E.; Öztürk, M.Z.; Yazıcı, Ö. High Resolution Köppen-Geiger Climate Zones of Türkiye. Int. J. Climatol. 2024, 44, 5248–5265. [Google Scholar] [CrossRef]
  11. Türkeş, M. Spatial and Temporal Variations in Precipitation and Aridity Index Series of Turkey. In Mediterranean Climate; Springer: Berlin/Heidelberg, Germany, 2003; pp. 181–213. [Google Scholar] [CrossRef] [PubMed]
  12. Onder, D.; Aydın, M.; Berberoglu, S.; Onder, S.; Yano, T. The use of aridity index to assess implications of climatic change for land cover in Turkey. Turk. J. Agric. For. 2009, 33, 305–314. [Google Scholar] [CrossRef]
  13. Sarış, F.; Hannah, D.; Eastwood, W. Spatial variability of precipitation regimes over Turkey. Hydrol. Sci. J. 2010, 55, 234–249. [Google Scholar] [CrossRef]
  14. Küçük, M.; Aslan, S. Analysis of Land Cover/Use Change According to Geographical Regions in Türkiye. ÇOMÜ Ziraat Fakültesi Derg. 2025, 13, 95–104. [Google Scholar] [CrossRef]
  15. Aksu, H.; Akgül, M. Performance evaluation of CHIRPS satellite precipitation estimates over Turkey. Theor. Appl. Climatol. 2020, 142, 71–84. [Google Scholar] [CrossRef]
  16. Khorrami, B.; Sahin, O.; Gunduz, O. Comprehensive comparison of different gridded precipitation products over geographic regions of Türkiye. J. Appl. Remote Sens. 2024, 18, 034503. [Google Scholar] [CrossRef]
  17. Prakash, S. Performance assessment of CHIRPS, MSWEP, SM2RAIN-CCI, and TMPA precipitation products across India. J. Hydrol. 2019, 571, 50–59. [Google Scholar] [CrossRef]
  18. Irvem, A.; Ozbuldu, M. Evaluation of Satellite and Reanalysis Precipitation Products Using GIS for All Basins in Turkey. Adv. Meteorol. 2019, 2019, 4820136. [Google Scholar] [CrossRef]
  19. Karabulut, M. An Examination of Relationships Between Vegetation and Rainfall Using Maximum Value Composite AVHRR-NDVI Data. Turk. J. Bot. 2003, 27, 93–101. [Google Scholar]
  20. Çelik, M.A. Kozan Ilçesi’nde (Adana) Kurak Koşullarin Farkli Arazi Örtüleri Üzerine Etkisinin Incelenmesi. Marmara Coğrafya Derg. 2016, 34, 283–299. Available online: https://dergipark.org.tr/tr/pub/marucog/article/260880 (accessed on 21 June 2026).
  21. Bellitürk, K. Vermicomposting in Turkey: Challenges and opportunities in future. Eurasian J. For. Sci. 2018, 6, 32–41. [Google Scholar] [CrossRef]
  22. Doğruer, M.K.; Kahraman, M.; Doğan, M.; Yeginbayeva, A. Spatial variation of agricultural land in Turkey using CORINE data. J. Bulg. Geogr. Soc. 2023, 49, 89–99. [Google Scholar] [CrossRef]
  23. Şen, G.; Aktürk, E. Spatiotemporal forest and land cover change in Türkiye: The role of economic factors in driving environmental transformations. Turk. J. For. 2024, 25, 176–189. [Google Scholar] [CrossRef]
  24. Kara, A. Determination of the factors affecting utilization rate of Eastern Anatolian semiarid public rangelands in Turkey. Int. J. Agric. Environ. Food Sci. 2020, 4, 119–129. [Google Scholar] [CrossRef]
  25. Ustaoglu, E.; Aydınoglu, A.C. Regional variations of land-use development and land-use/cover change dynamics: A case study of Turkey. Remote Sens. 2019, 11, 885. [Google Scholar] [CrossRef]
  26. Zeren Cetin, I.; Varol, T.; Ozel, H.B.; Sevik, H. The effects of climate on land use/cover: A case study in Turkey by using remote sensing data. Environ. Sci. Pollut. Res. 2023, 30, 5688–5699. [Google Scholar] [CrossRef] [PubMed]
  27. Funk, C.; Peterson, P.; Landsfeld, M.; Pedreros, D.; Verdin, J.; Shukla, S.; Husak, G.; Rowland, J.; Harrison, L.; Hoell, A.; et al. The climate hazards infrared precipitation with stations—A new environmental record for monitoring extremes. Sci. Data 2015, 2, 150066. [Google Scholar] [CrossRef] [PubMed]
  28. Shen, Z.; Yong, B.; Gourley, J.; Qi, W.; Lu, D.; Liu, J.; Ren, L.; Hong, Y.; Jianyun, Z. Recent global performance of the Climate Hazards group Infrared Precipitation (CHIRP) with Stations (CHIRPS). J. Hydrol. 2020, 591, 125284. [Google Scholar] [CrossRef]
  29. Hsu, J.; Huang, W.; Liu, P.; Li, X. Validation of CHIRPS Precipitation Estimates over Taiwan at Multiple Timescales. Remote Sens. 2021, 13, 254. [Google Scholar] [CrossRef]
  30. Abatzoglou, J.; Dobrowski, S.; Parks, S.; Hegewisch, K. TerraClimate, a high-resolution global dataset of monthly climate and climatic water balance from 1958–2015. Sci. Data 2018, 5, 170191. [Google Scholar] [CrossRef] [PubMed]
  31. Cepeda, E.; Cañon, J. Performance of High-resolution Precipitation Datasets CHIRPS and TerraClimate in a Colombian High Andean Basin. Geocarto Int. 2022, 37, 17382–17402. [Google Scholar] [CrossRef]
  32. Çelik, M.A.; Bilik, A.; Türkeş, M. Spatio-Temporal Analysis of Observed Drought Events in the Tigris–Euphrates Basin during the 1960–2023 Period Via SPI and SPEI Drought Indices. Pure Appl. Geophys. 2025, 183, 655–692. [Google Scholar] [CrossRef]
  33. Gebere, S.; Alamirew, T.; Merkel, B.; Melesse, A. Performance of High Resolution Satellite Rainfall Products over Data Scarce Parts of Eastern Ethiopia. Remote Sens. 2015, 7, 11639–11663. [Google Scholar] [CrossRef]
  34. Ebrahimi, S.; Chen, C.; Chen, Q.; Zhang, Y.; Ma, N.; Zaman, Q. Effects of temporal scales and space mismatches on the TRMM 3B42 v7 precipitation product in a remote mountainous area. Hydrol. Process. 2017, 31, 4315–4327. [Google Scholar] [CrossRef]
  35. Zhang, Y.; Li, Y.; Ji, X.; Luo, X.; Li, X. Fine-Resolution Precipitation Mapping in a Mountainous Watershed: Geostatistical Downscaling of TRMM Products Based on Environmental Variables. Remote Sens. 2018, 10, 119. [Google Scholar] [CrossRef]
  36. Chaaban, F.; Khattabi, J.; Darwishe, H. Accuracy Assessment of ESA WorldCover 2020 and ESRI 2020 Land Cover Maps for a Region in Syria. J. Geovis. Spat. Anal. 2022, 6, 31. [Google Scholar] [CrossRef]
  37. Venter, Z.; Barton, D.; Chakraborty, T.; Simensen, T.; Singh, G. Global 10 m Land Use Land Cover Datasets: A Comparison of Dynamic World, World Cover and Esri Land Cover. Remote Sens. 2022, 14, 4101. [Google Scholar] [CrossRef]
  38. Xu, P.; Tsendbazar, N.; Herold, M.; De Bruin, S.; Koopmans, M.; Birch, T.; Carter, S.; Fritz, S.; Lesiv, M.; Mazur, E.; et al. Comparative validation of recent 10 m-resolution global land cover maps. Remote Sens. Environ. 2024, 311, 114316. [Google Scholar] [CrossRef]
  39. Hameed, R.; Georg, L.; Sayyid, B. Modified Vegetation Detection Index Using Different-Spectral Signature. Iraqi J. Sci. 2021, 62, 4208–4217. [Google Scholar] [CrossRef]
  40. Pamuji, R.; Mahardika, A.; Wiranda, N.; Saputra, N.; Adini, M.; Pramatasari, D. Utilizing Electromagnetic Radiation in Remote Sensing for Vegetation Health Analysis Using NDVI Approach with Sentinel-2 Imagery. Kasuari Phys. Educ. J. 2023, 6, 127–135. [Google Scholar] [CrossRef]
  41. Kattimani, J.; Prasad, T. Normalised Differenciative Vegetation Index (NDVI) Analysis in South-East Dry Agro-Climatic Zones of Karnataka Using Rs and Gis Techniques. Int. J. Approx. Reason. 2016, 4, 1952–1957. [Google Scholar] [CrossRef] [PubMed]
  42. Huang, S.; Tang, L.; Hupy, J.; Wang, Y.; Shao, G. A commentary review on the use of normalized difference vegetation index (NDVI) in the era of popular remote sensing. J. For. Res. 2020, 32, 2719. [Google Scholar] [CrossRef]
  43. Chen, J.; Jönsson, P.; Tamura, M.; Gu, Z.; Matsushita, B.; Eklundh, L. A simple method for reconstructing a high-quality NDVI time-series data set based on the Savitzky-Golay filter. Remote Sens. Environ. 2004, 91, 332–344. [Google Scholar] [CrossRef]
  44. Zeng, L.; Wardlow, B.; Hu, S.; Zhang, X.; Zhou, G.; Peng, G.; Xiang, D.; Wang, R.; Meng, R.; Wu, W. A Novel Strategy to Reconstruct NDVI Time-Series with High Temporal Resolution from MODIS Multi-Temporal Composite Products. Remote Sens. 2021, 13, 1397. [Google Scholar] [CrossRef]
  45. Ngoma, H.; Wen, W.; Ojara, M.; Ayugi, B. Assessing current and future spatiotemporal precipitation variability and trends over Uganda, East Africa, based on CHIRPS and regional climate model datasets. Meteorol. Atmos. Phys. 2021, 133, 823–843. [Google Scholar] [CrossRef]
  46. Du, H.; Tan, M.L.; Zhang, F.; Chun, K.P.; Li, L.; Kabir, M.H. Evaluating the effectiveness of CHIRPS data for hydroclimatic studies. Theor. Appl. Climatol. 2023, 155, 1519–1539. [Google Scholar] [CrossRef]
  47. Duarte, D.; Fonte, C.; Costa, H.; Caetano, M. Thematic Comparison between ESA WorldCover 2020 Land Cover Product and a National Land Use Land Cover Map. Land 2023, 12, 490. [Google Scholar] [CrossRef]
  48. Wang, Y.; Sun, Y.; Cao, X.; Wang, Y.; Zhang, W.; Cheng, X. A review of regional and Global scale Land Use/Land Cover (LULC) mapping products generated from satellite remote sensing. ISPRS J. Photogramm. Remote Sens. 2023, 206, 311–334. [Google Scholar] [CrossRef]
  49. Nguyen, M.; Baez-Villanueva, O.; Bui, D.; Nguyen, P.; Ribbe, L. Harmonization of Landsat and Sentinel 2 for Crop Monitoring in Drought Prone Areas: Case Studies of Ninh Thuan (Vietnam) and Bekaa (Lebanon). Remote Sens. 2019, 12, 281. [Google Scholar] [CrossRef]
  50. Habibie, M.; Nurda, N. Downscaling of vegetation indices from multi-satellite throughout-season maize. IOP Conf. Ser. Earth Environ. Sci. 2023, 1230, 012143. [Google Scholar] [CrossRef]
  51. Mallick, J.; AlMesfer, M.K.; Singh, V.P.; Falqi, I.I.; Singh, C.K.; Alsubih, M.; Kahla, N.B. Evaluating the NDVI–Rainfall Relationship in Bisha Watershed, Saudi Arabia Using Non-Stationary Modeling Technique. Atmosphere 2021, 12, 593. [Google Scholar] [CrossRef]
  52. Aksoy, E. Drought vulnerability assessment of a climate sensitive GI crop using earth observation: The Korkuteli Karyağdı pear. Front. Environ. Sci. 2026, 14, 1770300. [Google Scholar] [CrossRef]
  53. Mehmood, K.; Anees, S.A.; Muhammad, S.; Hussain, K.; Shahzad, F.; Liu, Q.; Ansari, M.J.; Alharbi, S.A.; Khan, W.R. Analyzing vegetation health dynamics across seasons and regions through NDVI and climatic variables. Sci. Rep. 2024, 14, 11775. [Google Scholar] [CrossRef] [PubMed]
  54. Uyar, N. Index-Driven Soil Loss Mapping Across Environmental Scenarios: Insights from a Remote Sensing Approach. Sustainability 2025, 17, 7913. [Google Scholar] [CrossRef]
  55. Rishmawi, K.; Prince, S.; Xue, Y. Vegetation Responses to Climate Variability in the Northern Arid to Sub-Humid Zones of Sub-Saharan Africa. Remote Sens. 2016, 8, 910. [Google Scholar] [CrossRef]
  56. Sohoulande Djebou, D.C.; Singh, V.P.; Frauenfeld, O.W. Vegetation response to precipitation across the aridity gradient of the southwestern United states. J. Arid Environ. 2015, 115, 35–43. [Google Scholar] [CrossRef]
  57. Carvalho-Santos, C.; Nunes, J.P.; Monteiro, A.T.; Hein, L.; Honrado, J.P. Assessing the effects of land cover and future climate conditions on the provision of hydrological services in a medium-sized watershed of Portugal. Hydrol. Process. 2015, 30, 720–738. [Google Scholar] [CrossRef]
  58. von Keyserlingk, J.; de Hoop, M.; Mayor, A.G.; Dekker, S.C.; Rietkerk, M.; Foerster, S. Resilience of vegetation to drought: Studying the effect of grazing in a Mediterranean rangeland using satellite time series. Remote Sens. Environ. 2021, 255, 112270. [Google Scholar] [CrossRef]
Figure 1. Location map and digital elevation model (DEM) of Türkiye.
Earth 07 00130 g001
Figure 2. Methodological workflow of the study.
Earth 07 00130 g002
Figure 3. Spatial distribution of mean annual precipitation (mm) across Türkiye derived from TerraClimate, CHIRPS, and TRMM datasets for the 1998–2019 period.
Earth 07 00130 g003
Figure 4. Linear trend analysis of annual mean precipitation derived from (A) CHIRPS, (B) TerraClimate, and (C) TRMM datasets for the period 1998–2019. The regression equation, coefficient of determination (R2), and p-value are shown in each panel.
Earth 07 00130 g004
Figure 5. LULC distribution along precipitation gradient in Türkiye based on CHIRPS, TRMM and TerraClimate datasets.
Earth 07 00130 g005
Figure 6. The Generalized Additive Model (GAM) showing the nonlinear relationship between mean annual precipitation and land cover classes.
Earth 07 00130 g006
Figure 7. Land Use/Land Cover Map of Türkiye (ESA WorldCover 2021).
Earth 07 00130 g007
Figure 8. Landsat-based seasonal NDVI maps for Türkiye (2024).
Earth 07 00130 g008
Figure 9. The relationship between seasonal total precipitation (mm) and Landsat NDVI values in the study area ((A): TRMM, (B): CHIRPS, (C): TerraClimate).
Earth 07 00130 g009
Figure 10. MODIS-based seasonal NDVI maps for Türkiye (2024).
Earth 07 00130 g010
Figure 11. The relationship between seasonal total precipitation (mm) and MODIS NDVI values in the study area ((a): TRMM, (b): CHIRPS, (c): TerraClimate).
Earth 07 00130 g011
Figure 12. Sentinel-based seasonal NDVI maps for Türkiye (2024).
Earth 07 00130 g012
Figure 13. The relationship between seasonal total precipitation (mm) and Sentinel-2 NDVI values in the study area ((a): TRMM, (b): CHIRPS, (c): TerraClimate).
Earth 07 00130 g013
Table 1. Summary of geospatial and climate datasets used in the study.
Data SetData TypeStart Year of Data ProductionSpatial ResolutionTemporal ResolutionData SourceMain Areas (General)Period Used in This StudyPurpose of Use in This Study
CHIRPSPrecipitation1981–present~0.05° (~5 km)Daily, monthlyStatistical derivation of CRU + JRA55 reanalysis dataDrought analysis, hydrological modeling, climate change studies1998–2019Used to characterize long-term precipitation gradients and to define precipitation classes for spatial overlay with LULC and NDVI data
TerraClimateMultiple climate variables (precipitation, temperature, PET, etc.)1958–present~1/24° (~4 km)MonthlyStatistical derivation of CRU + JRA55 reanalysis dataClimate trend analysis, water balance, agricultural modeling1998–2019Used for comparative validation of the spatial and temporal precipitation distribution against CHIRPS and TRMM
TRMMPrecipitation1998–2019~0.25° (~25 km)3 h, daily, monthlySatellite radar and microwave sensorsTropical rainfall analysis, flood modeling, atmospheric studies1998–2019Used for comparative evaluation of satellite-based precipitation estimates, particularly winter precipitation overestimation relative to CHIRPS/TerraClimate
ESA WorldCoverLULC2020 (and updated versions)10 mAnnualSentinel-1 and Sentinel-2 satellite data + machine learningLand use change, ecosystem analysis, carbon stock studies2021Used as the reference land cover map for spatial overlay with precipitation classes to analyze LULC distribution along precipitation gradients
Table 2. Breakpoint (segmented regression) results for the relationships between annual precipitation and major LULC classes across Türkiye.
LULC ClassBreakpoint (mm)R2
Forest873.820.831
Grassland1400.000.737
Water1763.030.994
Wetland200.080.383
Agriculture773.400.983
Settlement843.330.475
Shrubland621.150.458
Bare Land421.290.965
Disclaimer/Publisher’s Note: The statements, opinions and data contained in all publications are solely those of the individual author(s) and contributor(s) and not of MDPI and/or the editor(s). MDPI and/or the editor(s) disclaim responsibility for any injury to people or property resulting from any ideas, methods, instructions or products referred to in the content.