


Abstract
Urban flooding in coastal megacities remains a critical challenge, with recurrent inundation driven by extreme rainfall, inadequate drainage, and topographic vulnerability. This study investigated the spatio-temporal dynamics of flooding in Mumbai between 2018 and 2025 using Sentinel-1 SAR data (VV and VH polarizations) along with automated thresholding and unsupervised classification techniques. The VV polarization consistently detected a larger flood extent than VH, with maximum inundation reaching 152 km2 in 2024, compared to 67 km2 with VH, highlighting VV’s superior sensitivity to surface water. Ward-wise analysis revealed that Chembur West (16.47 km2), Matunga (12.33 km2), and Ghatkopar (5.43 km2) were the most flood-prone areas, while Colaba and Marine Lines experienced lower exposure due to higher elevation and better drainage infrastructure. Annual flood variation corresponded with intense rainfall events, particularly those exceeding 300 mm/day in 2020, 2023, and 2024. Validation with Brihanmumbai Municipal Corporation (BMC) reported flood data confirmed a strong spatial agreement with SAR-derived flood zones, supporting the reliability of the geospatial model. The integration of remote sensing, rainfall data, and ward-level analysis offers a scalable framework for urban flood risk mapping. These findings emphasize the need for resilient drainage planning, green infrastructure, and real-time flood monitoring systems.
1. Introduction
Flooding has become one of the most pressing global environmental concerns, increasingly intensified by climate change and rapid urbanization [1,2,3]. According to the United Nations Office for Disaster Risk Reduction (UNDRR), over 90% of all major disasters between 1998 and 2025 were climate-related, with floods alone accounting for approximately 40% of such events [4]. The rising frequency of extreme rainfall events, coupled with urban expansion and aging drainage infrastructure, has heightened flood risks in cities worldwide [2,5,6]. Major urban centers such as New York City (2023 flood), Jakarta (2024 flood), Manila, and Beijing (2025 flood) have recently witnessed devastating flood events driven by storm surges, poor drainage, and land subsidence [5,7]. In New York, overwhelmed sewers led to extensive street inundation, whereas e sea-level rise and blocked drainage systems caused recurrent coastal flooding in Lagos. Similar patterns are emerging in Bangkok and Manila, where intense monsoon rains have resulted in widespread pluvial flooding, especially in densely populated informal settlements [8,9]. These global events underscore the multidimensional nature of urban floods driven by a combination of hydrometeorological extremes and unregulated urban development [10,11,12,13]. Additionally, warming-induced increases in precipitation intensity are amplifying the frequency of flash floods in low-permeability urban landscapes [10,13,14]. The consequences are far-reaching, with infrastructure damage, public health risks, and socioeconomic disruption creating a vicious cycle of vulnerability [15,16]. Urban flooding is therefore no longer a localized problem but a systemic global challenge requiring integrated technological solutions.
In the Indian context, urban flooding has emerged as a recurrent hazard across both coastal and inland cities [11]. The monsoon-dominated climate combined with poorly maintained drainage systems makes Indian cities particularly susceptible to pluvial flooding [1,17]. Mumbai, India’s largest coastal metropolis has faced repeated flood events, notably in 2005, 2021, 2022, and 2024, leading to widespread disruption of transportation and economic activity [18,19,20]. Other cities such as Chennai in 2015 and 2023, Bengaluru in 2022, Nagpur in 2023 and Ahmedabad in 2024 have also experienced flooding due to high-intensity rainfall, low elevation, and impermeable built-up surfaces [21,22,23]. While the causes vary, a common thread is the lack of integrated urban planning that takes hydrological and land-use factors into account [24]. Moreover, informal settlements in floodplains are disproportionately affected due to limited infrastructure and early warning systems [25]. Reports from municipal agencies such as the Brihanmumbai Municipal Corporation [26] and institutions like the National Institute of Urban Affairs [27] emphasize the need for updated flood management frameworks but note persistent challenges in their implementation. The growing complexity of these cities such as rising population densities, expanding built-up areas, and degraded wetlands makes it imperative to adopt spatially informed flood risk monitoring strategies. This necessitates the use of advanced geospatial and satellite-based technologies that offer high-resolution, real-time insights into urban hydrodynamics.
One such promising technology is Synthetic Aperture Radar (SAR), particularly data from the Sentinel-1 mission, which provides reliable, high-resolution, and weather-independent imagery [28]. Unlike optical remote sensing datasets, which are often restricted by cloud cover and poor visibility during heavy rainfall events, SAR imagery can acquire data under all-weather and day–night conditions, making it highly effective for monsoon-period flood monitoring in densely urbanized regions [29,30]. SAR’s ability to detect changes in surface water through backscatter analysis makes it highly suitable for flood mapping, especially during cloud-covered monsoon seasons [31,32,33]. Sentinel-1 images, when analyzed with dual polarizations (VV and VH), can capture the variation in backscatter responses between flooded and non-flooded surfaces [34,35]. Research shows that flooded zones exhibit increased backscatter and decreased coherence in interferometric pairs, which can be effectively used to delineate inundated areas [36]. To enhance accuracy, automated thresholding methods are commonly applied to extract flood extents from SAR time series data, with adjustments made for local topography and land cover [37,38]. However, traditional thresholding methods often suffer from speckle noise and require post-processing corrections. Advanced geospatial techniques such as Markov Random Fields, machine learning models, and neighborhood-based ratio algorithms have been developed to improve accuracy and suppress noise [39,40]. Sentinel-1 has been successfully used for flood analysis in various regions, including Kerala [41], South Kalimantan [42], and urban India, supporting its effectiveness in densely populated areas. Integration with GIS tools further allows the analysis of flood extent in relation to population density, drainage layout, and infrastructure exposure, providing actionable insights for planners and emergency responders [43,44].
Mumbai’s urban landscape, characterized by a high-density population, low-lying reclaimed land, and proximity to the Arabian Sea, makes it particularly vulnerable to urban flooding. Despite the recurring nature of flood events, there exists a critical gap in multi-year, spatially resolved flood analyses that can inform long-term urban planning and infrastructure resilience. Most previous flood studies in Mumbai and other Indian cities have primarily focused on single-event flood mapping, short-term rainfall analysis, or localized inundation assessment, with limited emphasis on long-term spatio-temporal flood dynamics using consistent satellite observations [1,11]. In addition, earlier studies rarely integrated satellite-derived flood extent with ward-level urban infrastructure characteristics and municipal flood records, limiting their applicability for long-term urban flood management and policy planning. To address this gap, the present study proposes a comprehensive analysis of urban flooding in Mumbai from 2018 to 2025 using Sentinel-1 SAR data and automated geospatial thresholding techniques. A key contribution of this study is the development of a multi-year SAR-based flood monitoring framework that combines dual-polarization analysis (VV and VH), automated threshold extraction, rainfall variability assessment, and GIS-based hotspot identification within a single analytical platform. Beyond flood mapping, this study investigates how temporal variations in SAR backscatter respond to changing urban flood conditions across different monsoon periods and how urban morphology, drainage limitations, and land-use intensity influence flood persistence and spatial distribution. The study also examines whether multi-temporal SAR observations can provide a consistent scientific basis for identifying recurring flood hotspots and understanding long-term flood behavior in rapidly urbanizing coastal environments. The novelty of this research lies in its integration of SAR-based flood detection with temporal trend analysis and land-use overlays, thereby enhancing both spatial precision and temporal relevance. By applying advanced thresholding algorithms to time-series SAR data, the study captures flood dynamics across multiple monsoon cycles, enabling year-wise comparison and identification of flood hotspots. Moreover, the use of GIS-based spatial overlays allows for the correlation of flood extent with urban infrastructure, population exposure, and topographic risk zones.
Study Area
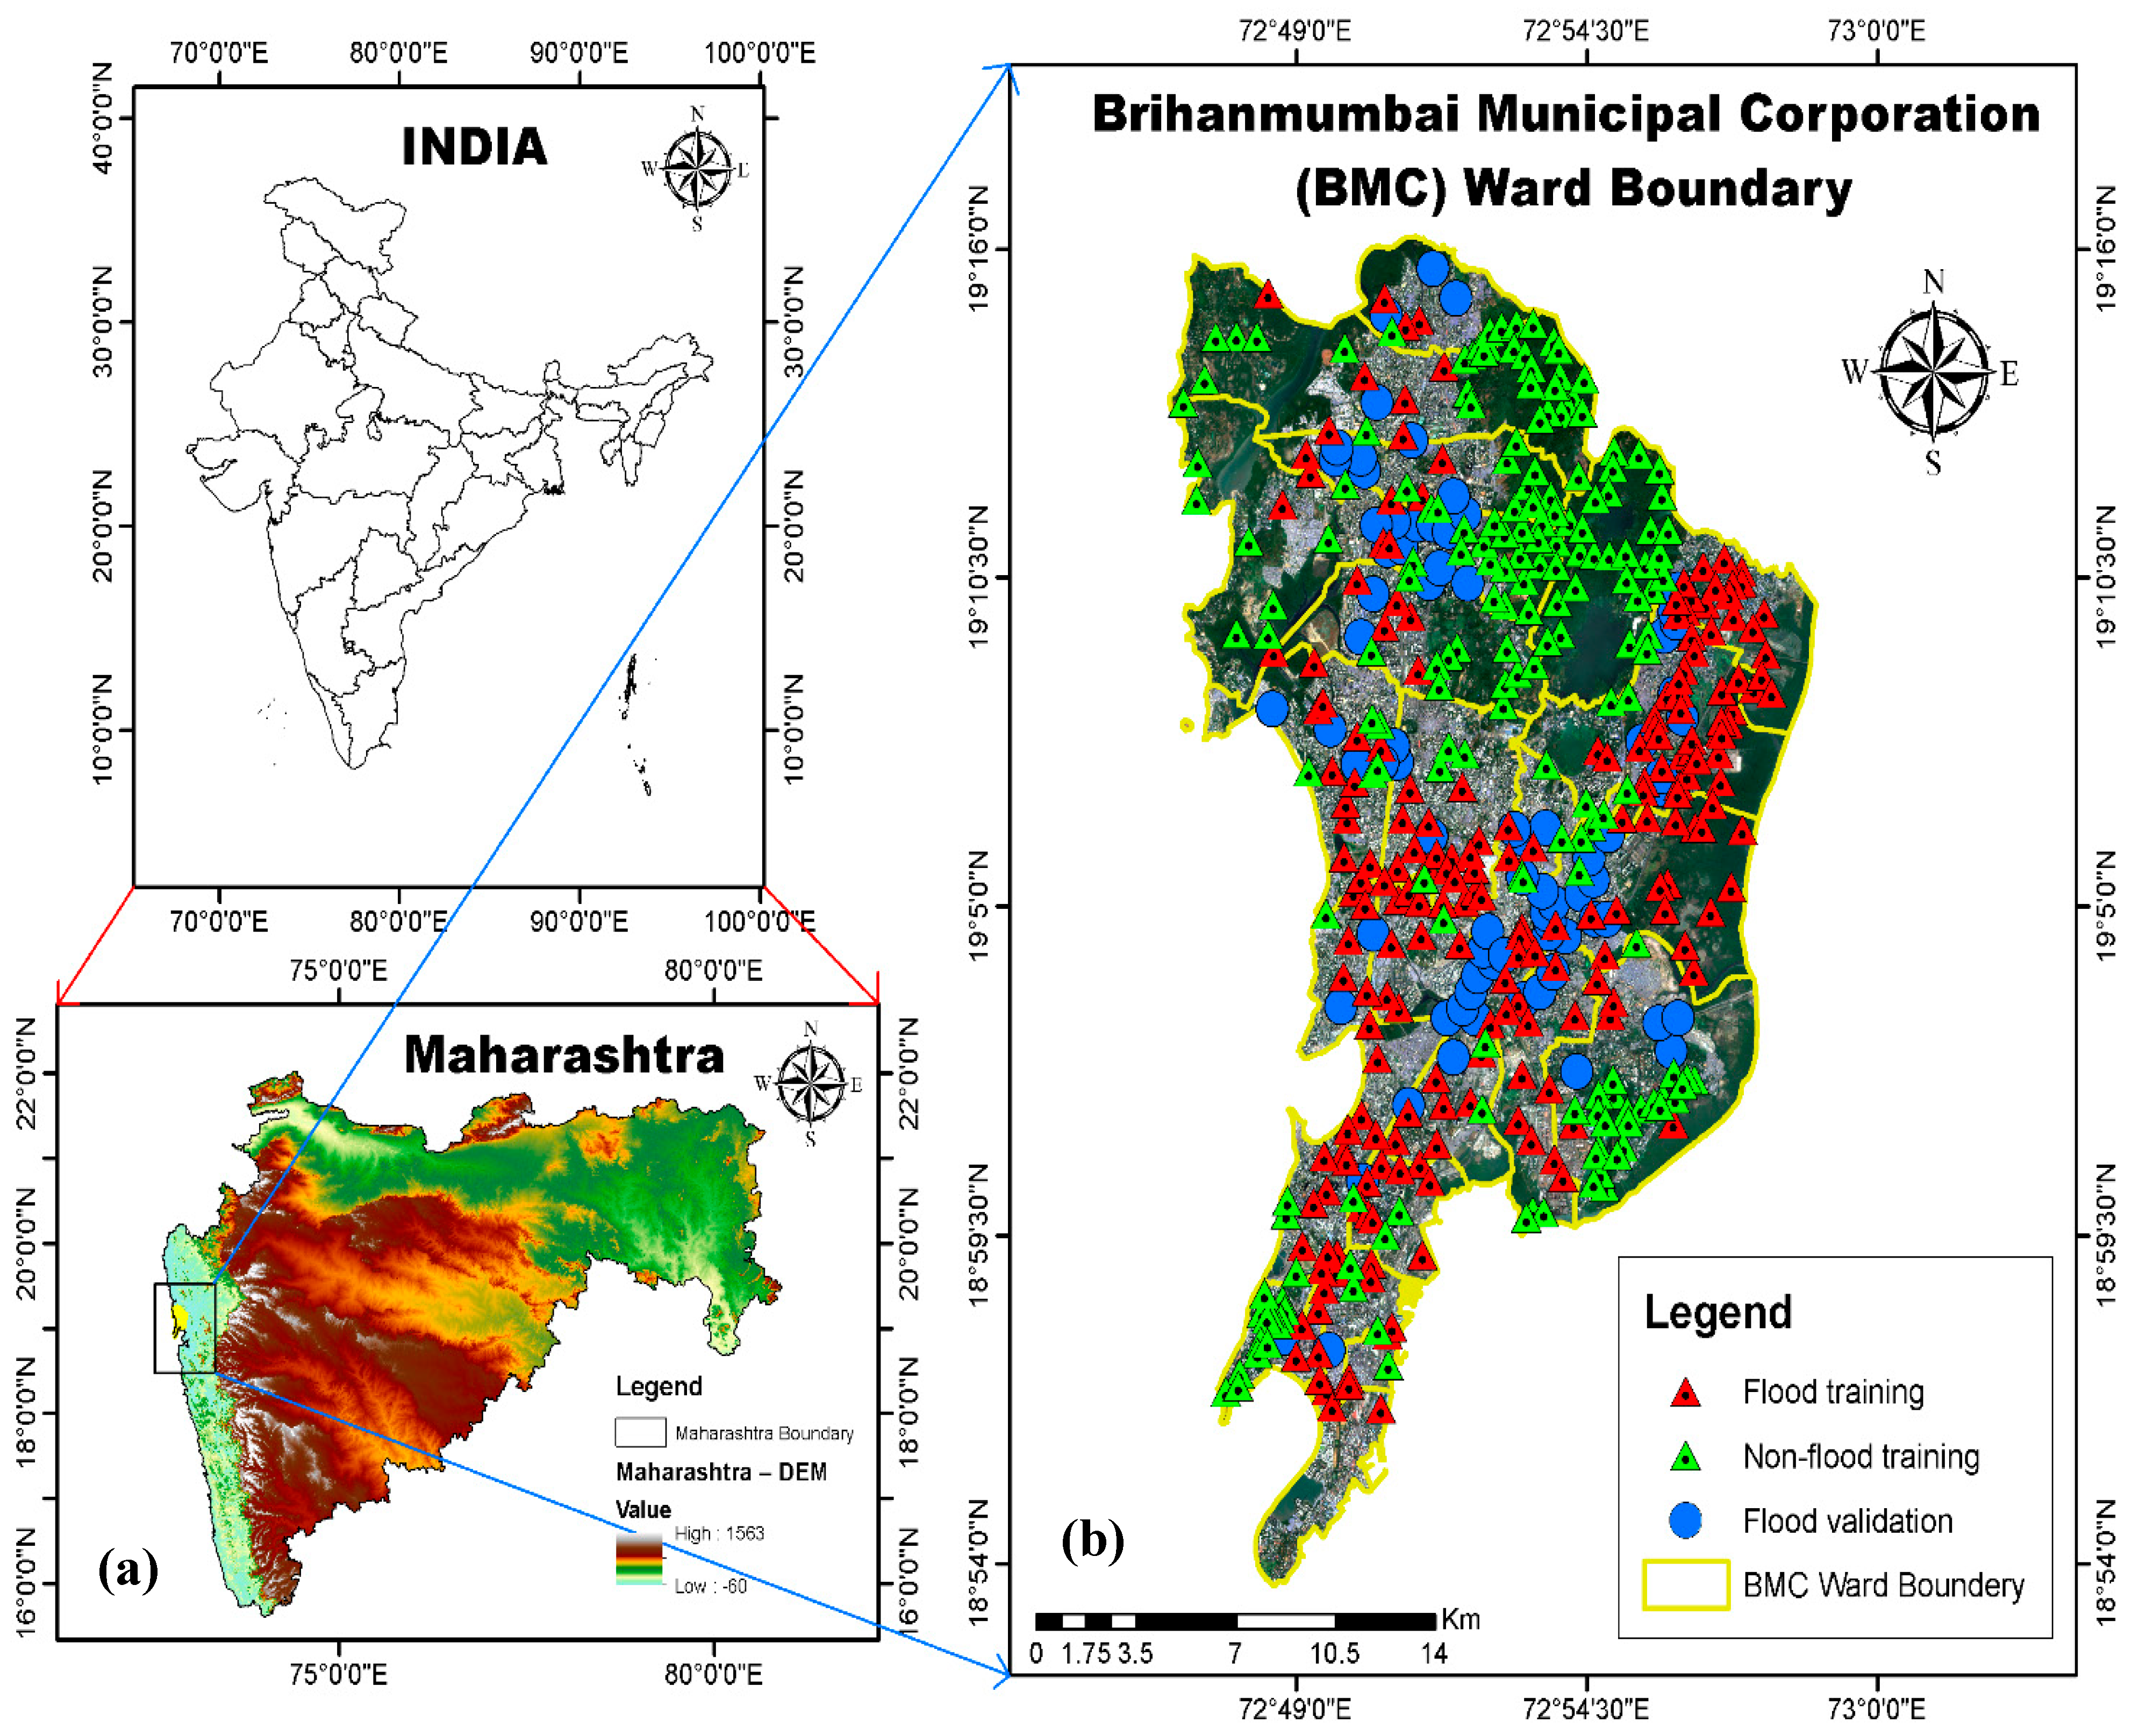
The present study is conducted in Greater Mumbai, a densely populated coastal megacity situated on the western coast of India, along the Arabian Sea (Figure 1). Geographically, the city spans from 18°53′ N to 19°16′ N latitude and 72°00′ E to 72°59′ E longitude, covering an area of approximately 434 square kilometers under the jurisdiction of the Brihanmumbai Municipal Corporation (BMC). This administrative region encompasses both the Island City and the Mumbai Suburban District, forming one of the world’s largest urban agglomerations. As of 2019, Mumbai’s population was estimated at 12.87 million, highlighting its intense demographic pressure and urban sprawl [45]. Economically, it contributes over 6% to India’s GDP and serves as a hub for financial institutions, shipping ports, and global commerce [46]. The city displays stark socio-economic contrasts, where affluent areas like Malabar Hill coexist with Dharavi, one of Asia’s largest informal settlements, increasing the complexity of urban vulnerability during disasters [47].
Figure 1.
Location map of the study area showing: Greater Mumbai within the state of Maharashtra, India (a); the Brihanmumbai Municipal Corporation (BMC) ward boundaries along with flood training, non-flood training, and flood validation points used for model calibration and accuracy assessment (b).
Mumbai’s tropical monsoon climate brings intense seasonal rainfall between June and September, with average annual precipitation exceeding 2400 mm, which frequently overwhelms its aged drainage system [18]. The city is flanked by natural water bodies including the Mithi, Dahisar, Poinsar, and Oshiwara rivers, all of which serve as critical stormwater conduits but often suffer from encroachment and siltation [26]. Additionally, the Tulsi, Vihar, and Powai lakes located in the northern parts contribute to both water supply and local flood hydrology. Due to its low elevation, much of Mumbai is highly vulnerable to tidal surges, sea-level rise, and monsoon-driven floods, particularly in reclaimed and low-lying areas [1]. The city’s narrow drainage gradient and high percentage of impervious surfaces hinder stormwater percolation, contributing to frequent waterlogging during peak rainfall events [48].
Urbanization has significantly altered the city’s natural hydrology, where wetlands, estuaries, and creeks have been replaced by built infrastructure. Encroachments on floodplains and the obstruction of natural outflows have increased runoff and reduced drainage capacity [24]. This makes Mumbai a high-priority location for urban flood risk analysis, especially using spatially explicit techniques. Given its coastal exposure, demographic concentration, and hydrological constraints, Mumbai offers a representative case for studying the spatio-temporal dynamics of urban flooding in South Asia. The spatial distribution of flood-prone areas, training points, and BMC ward boundaries used in this study are illustrated in Figure 1.
2. Materials and Methods
2.1. Urban Flood Inundation Mapping
This study employed multi-temporal Sentinel-1 C-band SAR data to analyze flood inundation across Greater Mumbai between 2018 and 2025. Sentinel-1 images, acquired in Interferometric Wide Swath (IWS) mode, with dual polarizations (VV and VH), offer 10-m spatial resolution and a 6 to 12-day revisit cycle, making them ideal for monsoon-related urban flood assessment (Table 1). These datasets were downloaded from the Copernicus Open Access Hub. In total, sixteen image pairs (pre- and post/during flood) were selected to capture major flood events, especially during monsoon peaks (Table 2).
Table 1.
Datasets utilized in the study.
Table 2.
Metadata of SAR data.
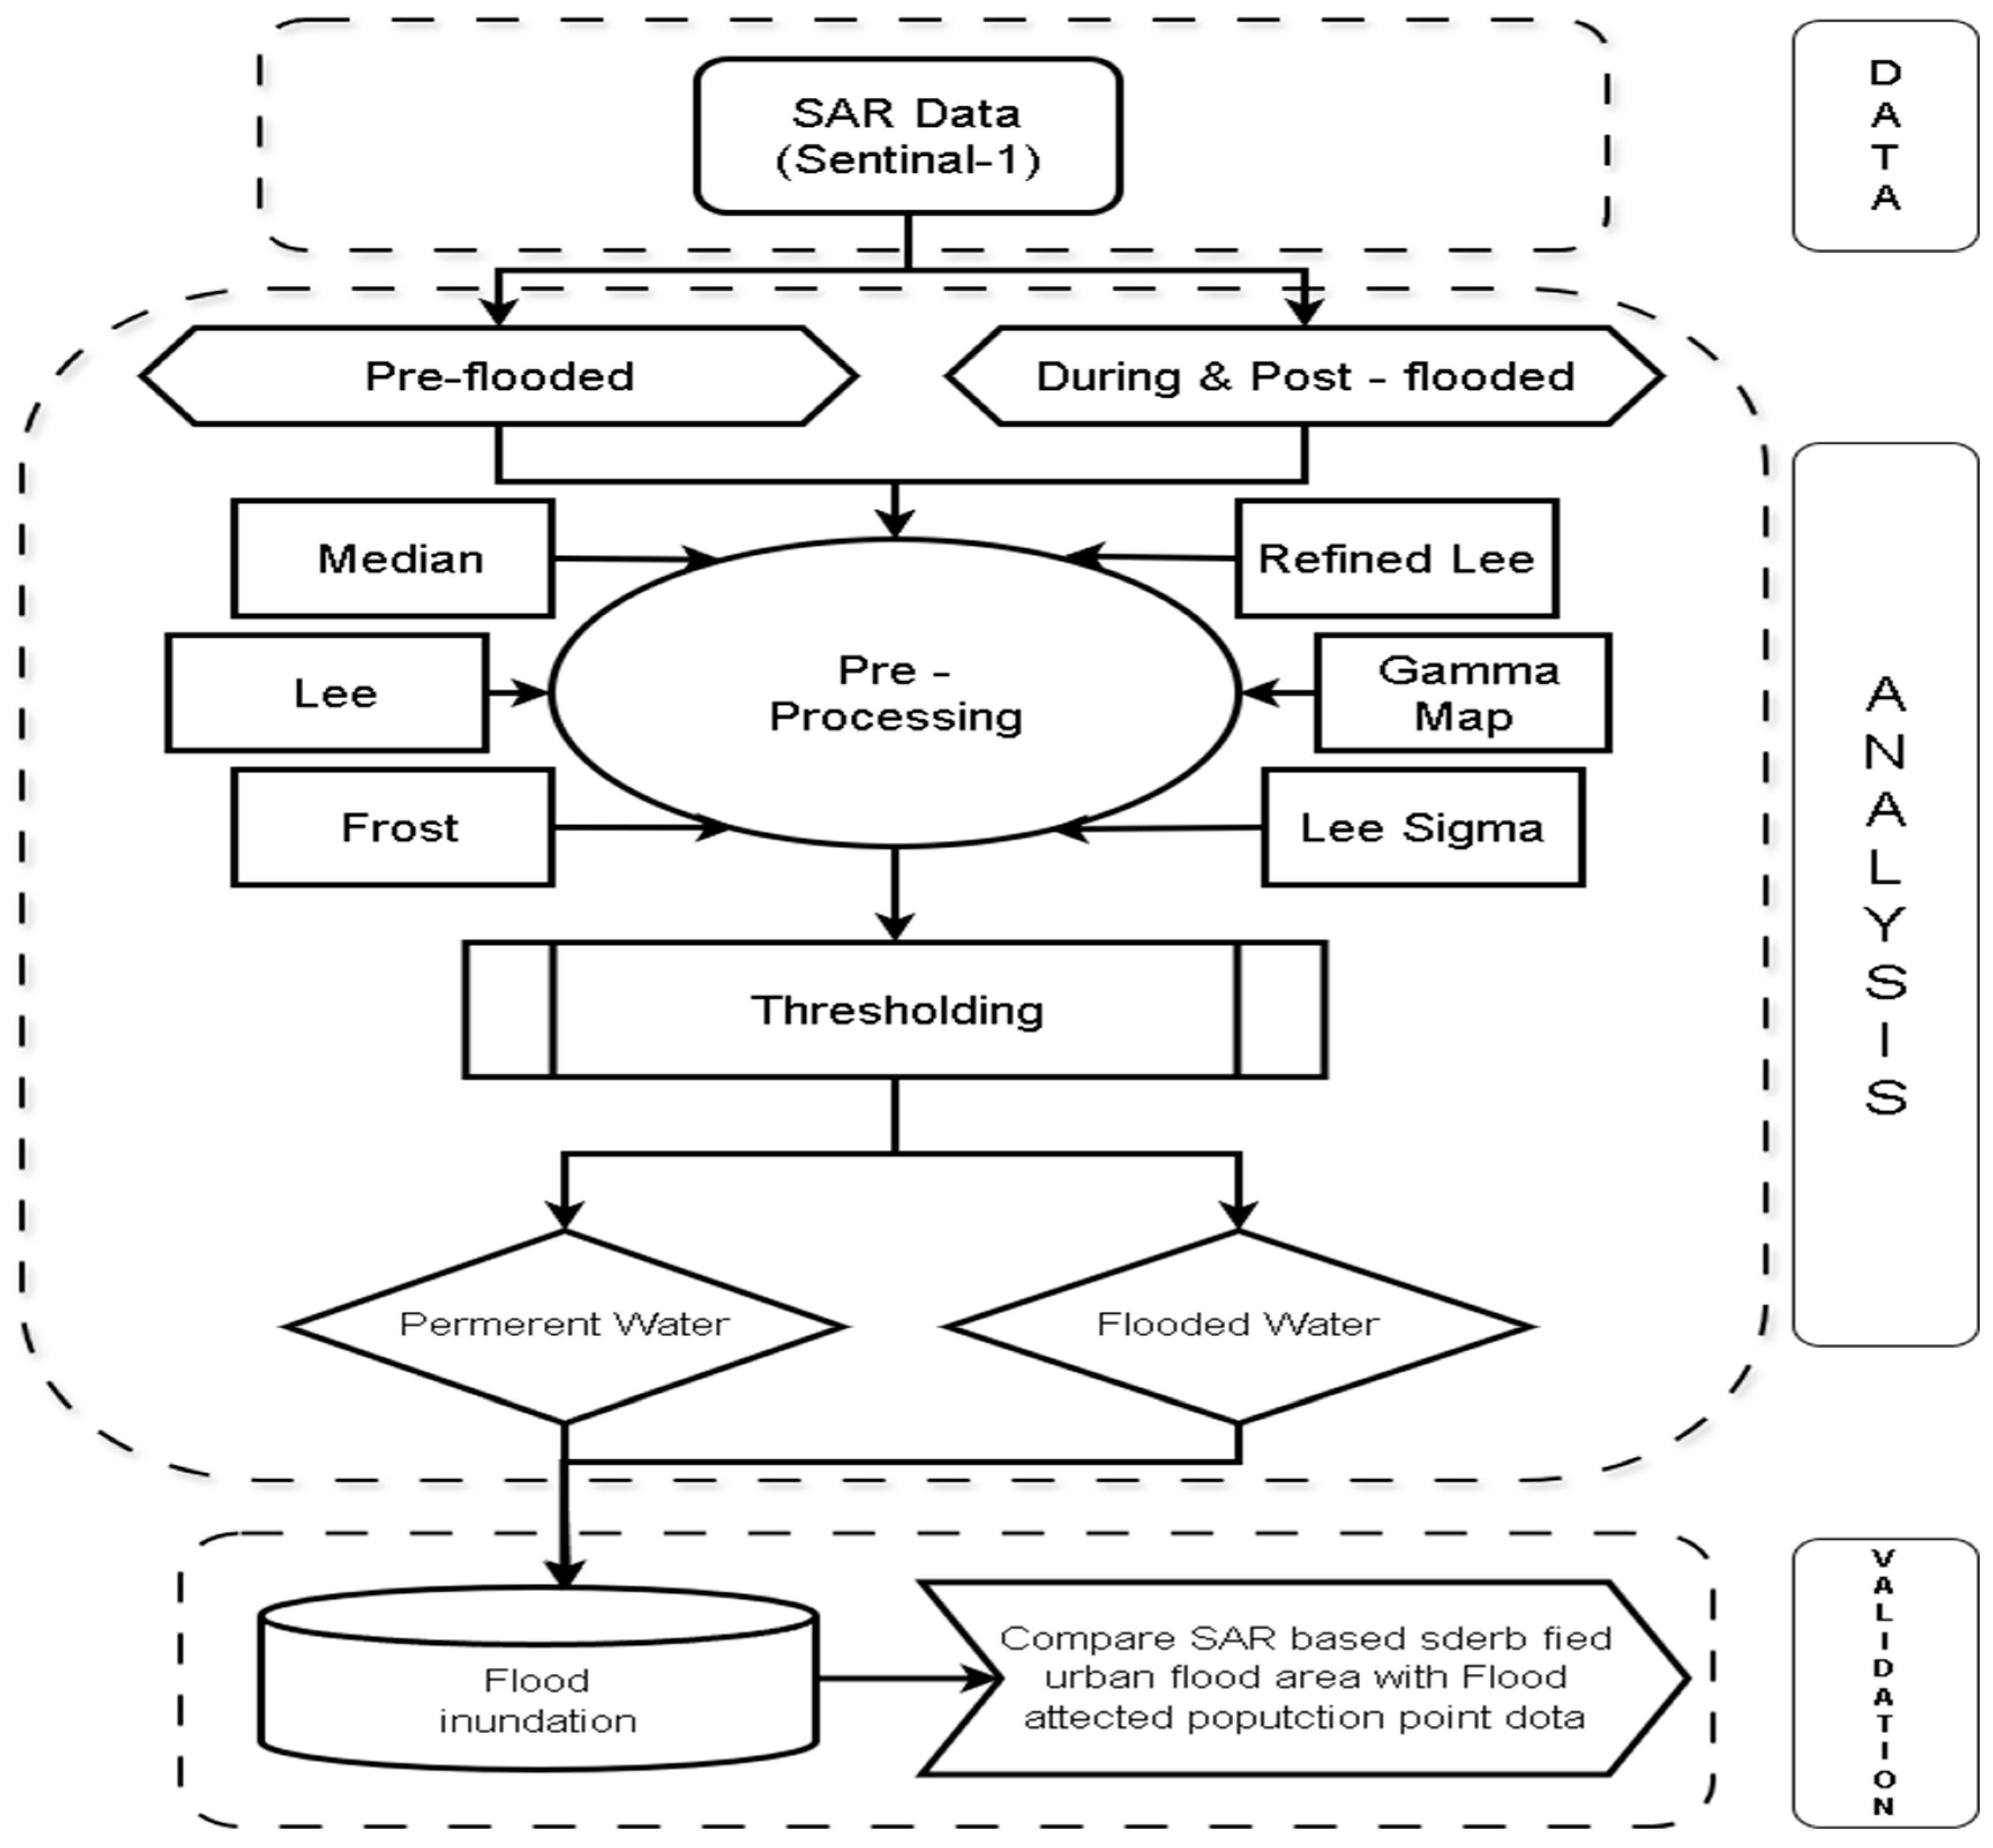
Additional datasets were used to complement SAR-based flood detection. The Global Surface Water Seasonality (GSWS v1.4) dataset, developed by JRC, provided historical information on permanent water bodies for filtering out background water. A Digital Elevation Model (DEM) with ~30 m resolution from NASA/USGS was used for topographic correction, shadow masking, and drainage context. However, due to its moderate spatial resolution, the DEM was primarily utilized for regional topographic reference rather than detailed urban-scale terrain analysis. Consequently, localized elevation variations, micro-drainage pathways, slope gradients, and surface convergence characteristics may not be fully represented, particularly in highly built-up low-lying areas of Mumbai. Therefore, the DEM-based analysis should be interpreted as a broad topographic assessment rather than a high-precision urban hydrodynamic evaluation. Daily precipitation data were retrieved from the CHIRPS rainfall product to confirm rainfall-triggered flooding events across each observation year. Because the CHIRPS dataset has a spatial resolution of approximately 5 km, it was mainly used to identify regional rainfall trends and major precipitation events rather than localized urban-scale rainfall variability. Therefore, the rainfall analysis in this study should be interpreted as a broad climatic indicator supporting the occurrence of flood events across Mumbai, rather than a high-resolution representation of local extreme rainfall conditions. The workflow adopted in this study is illustrated in Figure 2, which shows the three main stages: SAR data preprocessing, flood classification, and flood validation.
Figure 2.
Flowchart methodology adopted in this study.
2.2. Sentinel-1 SAR Image Processing
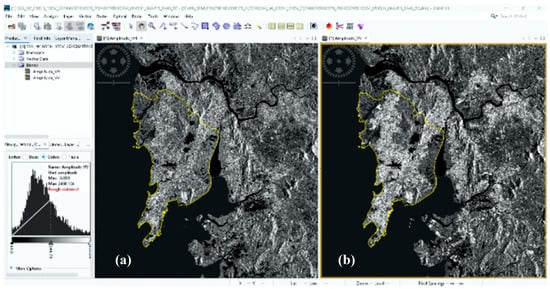
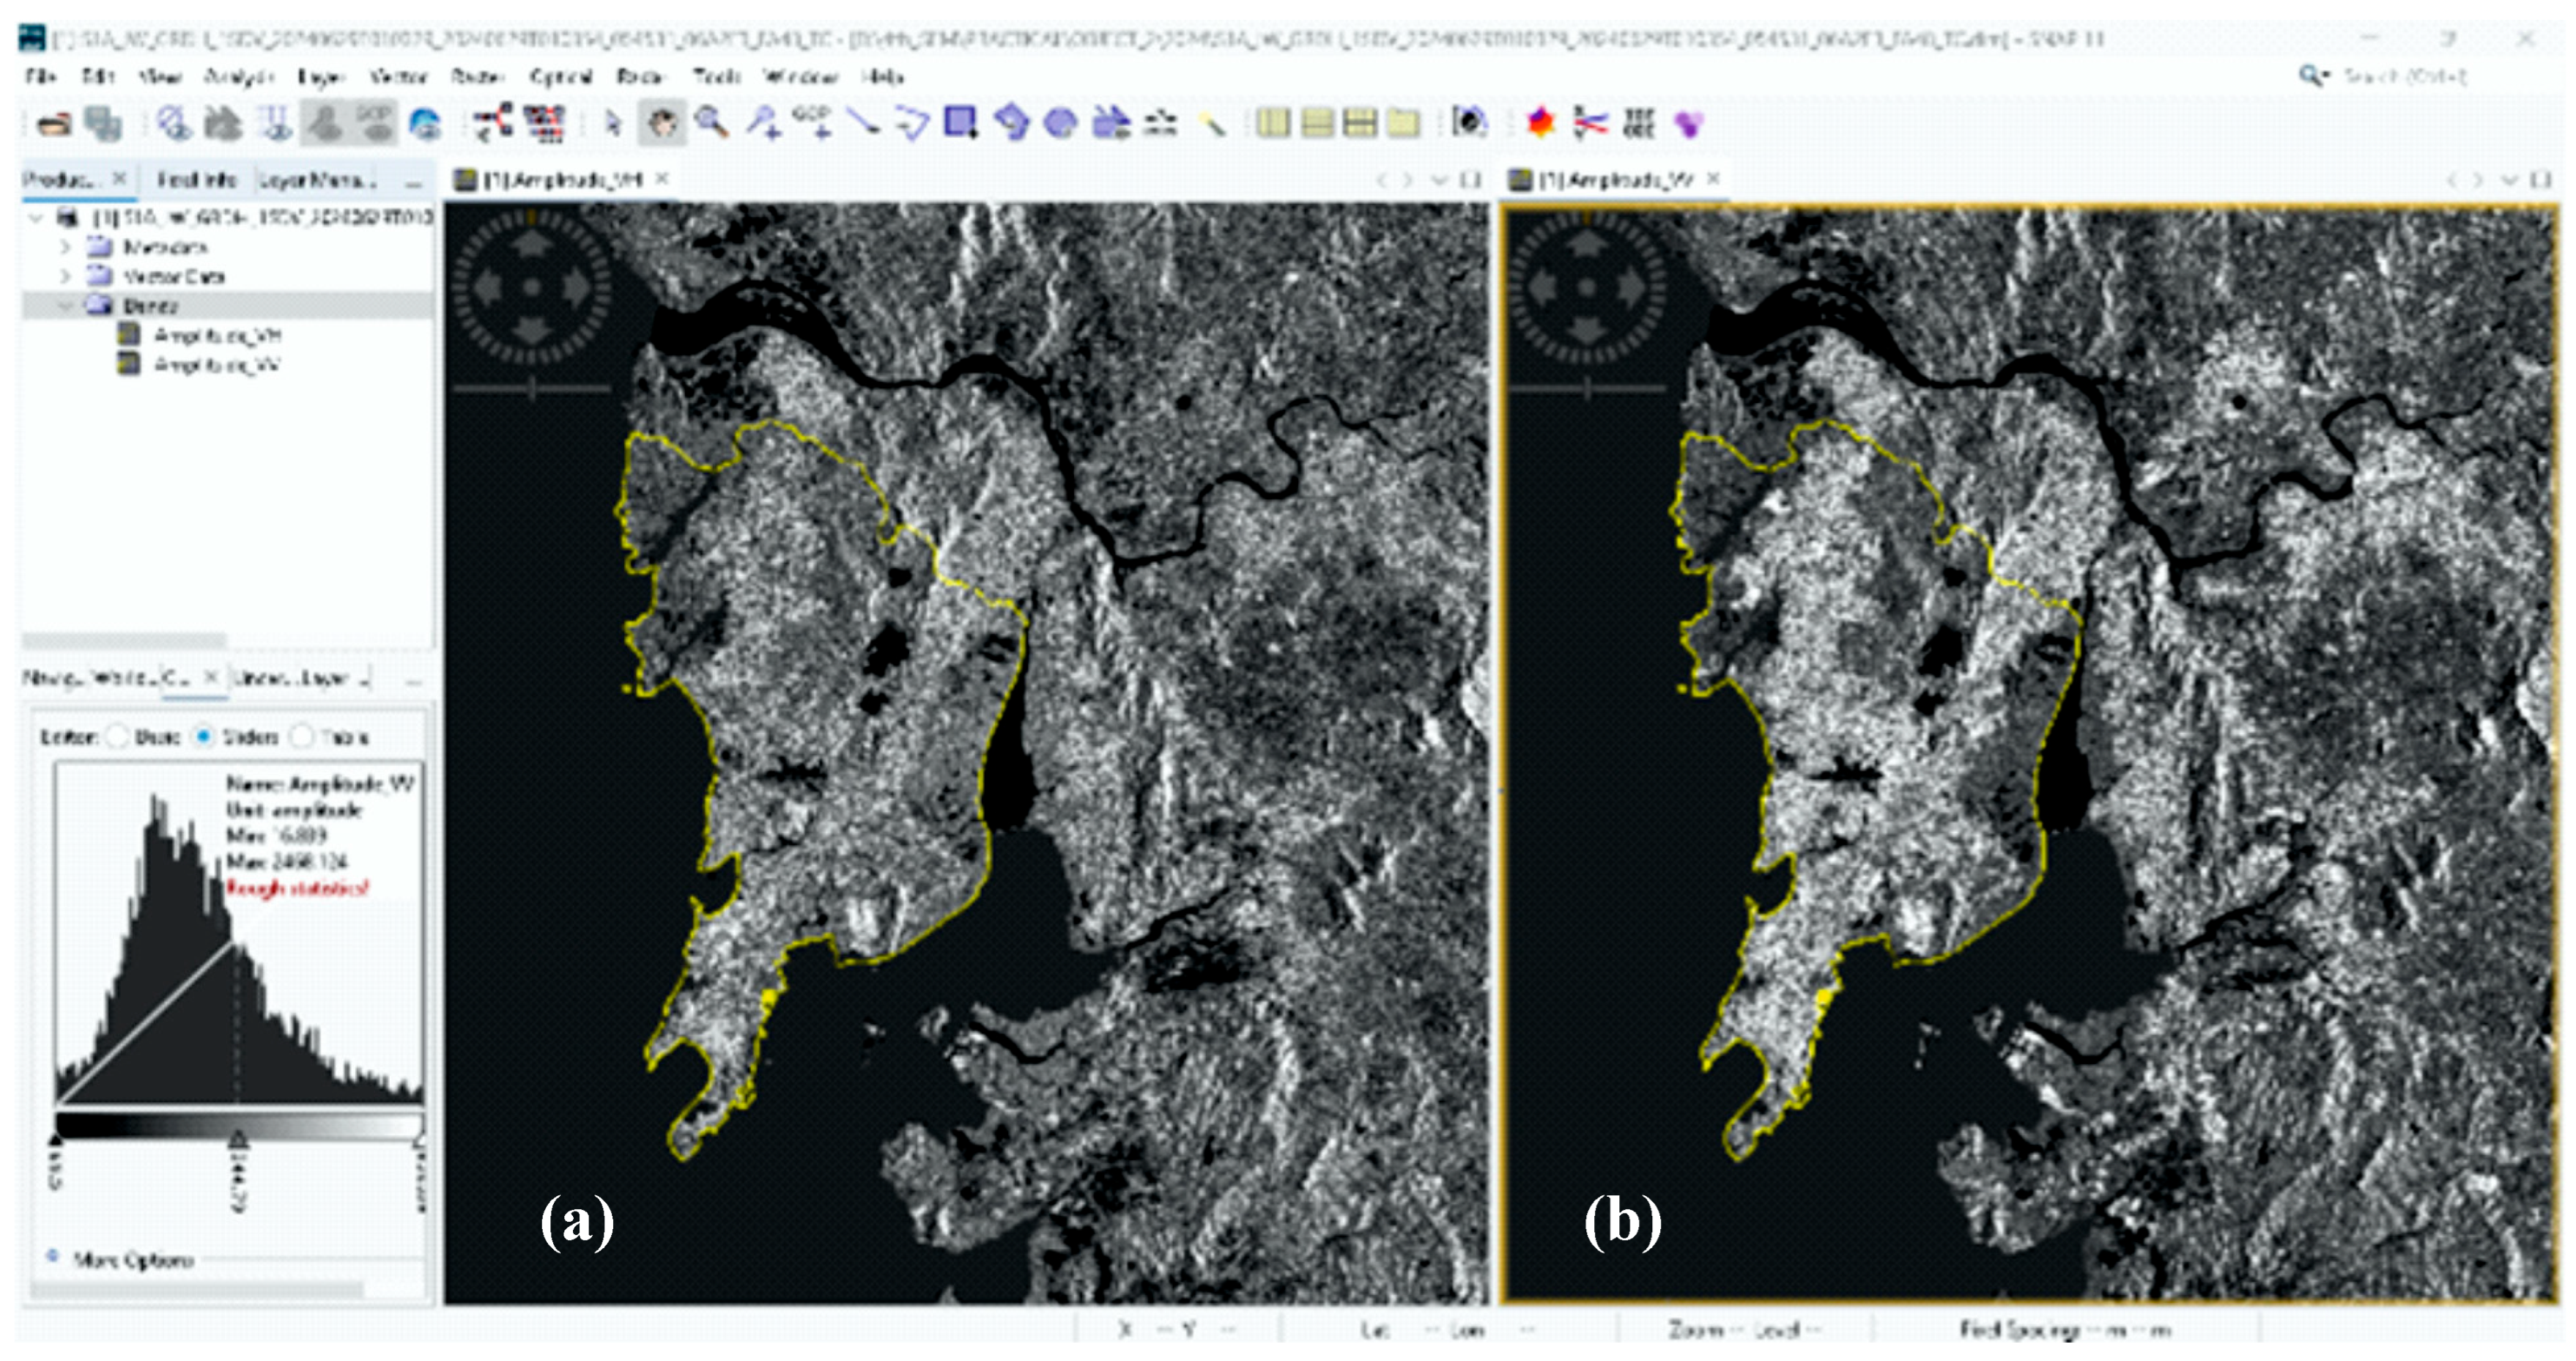
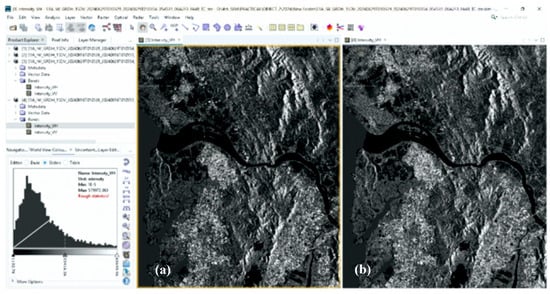
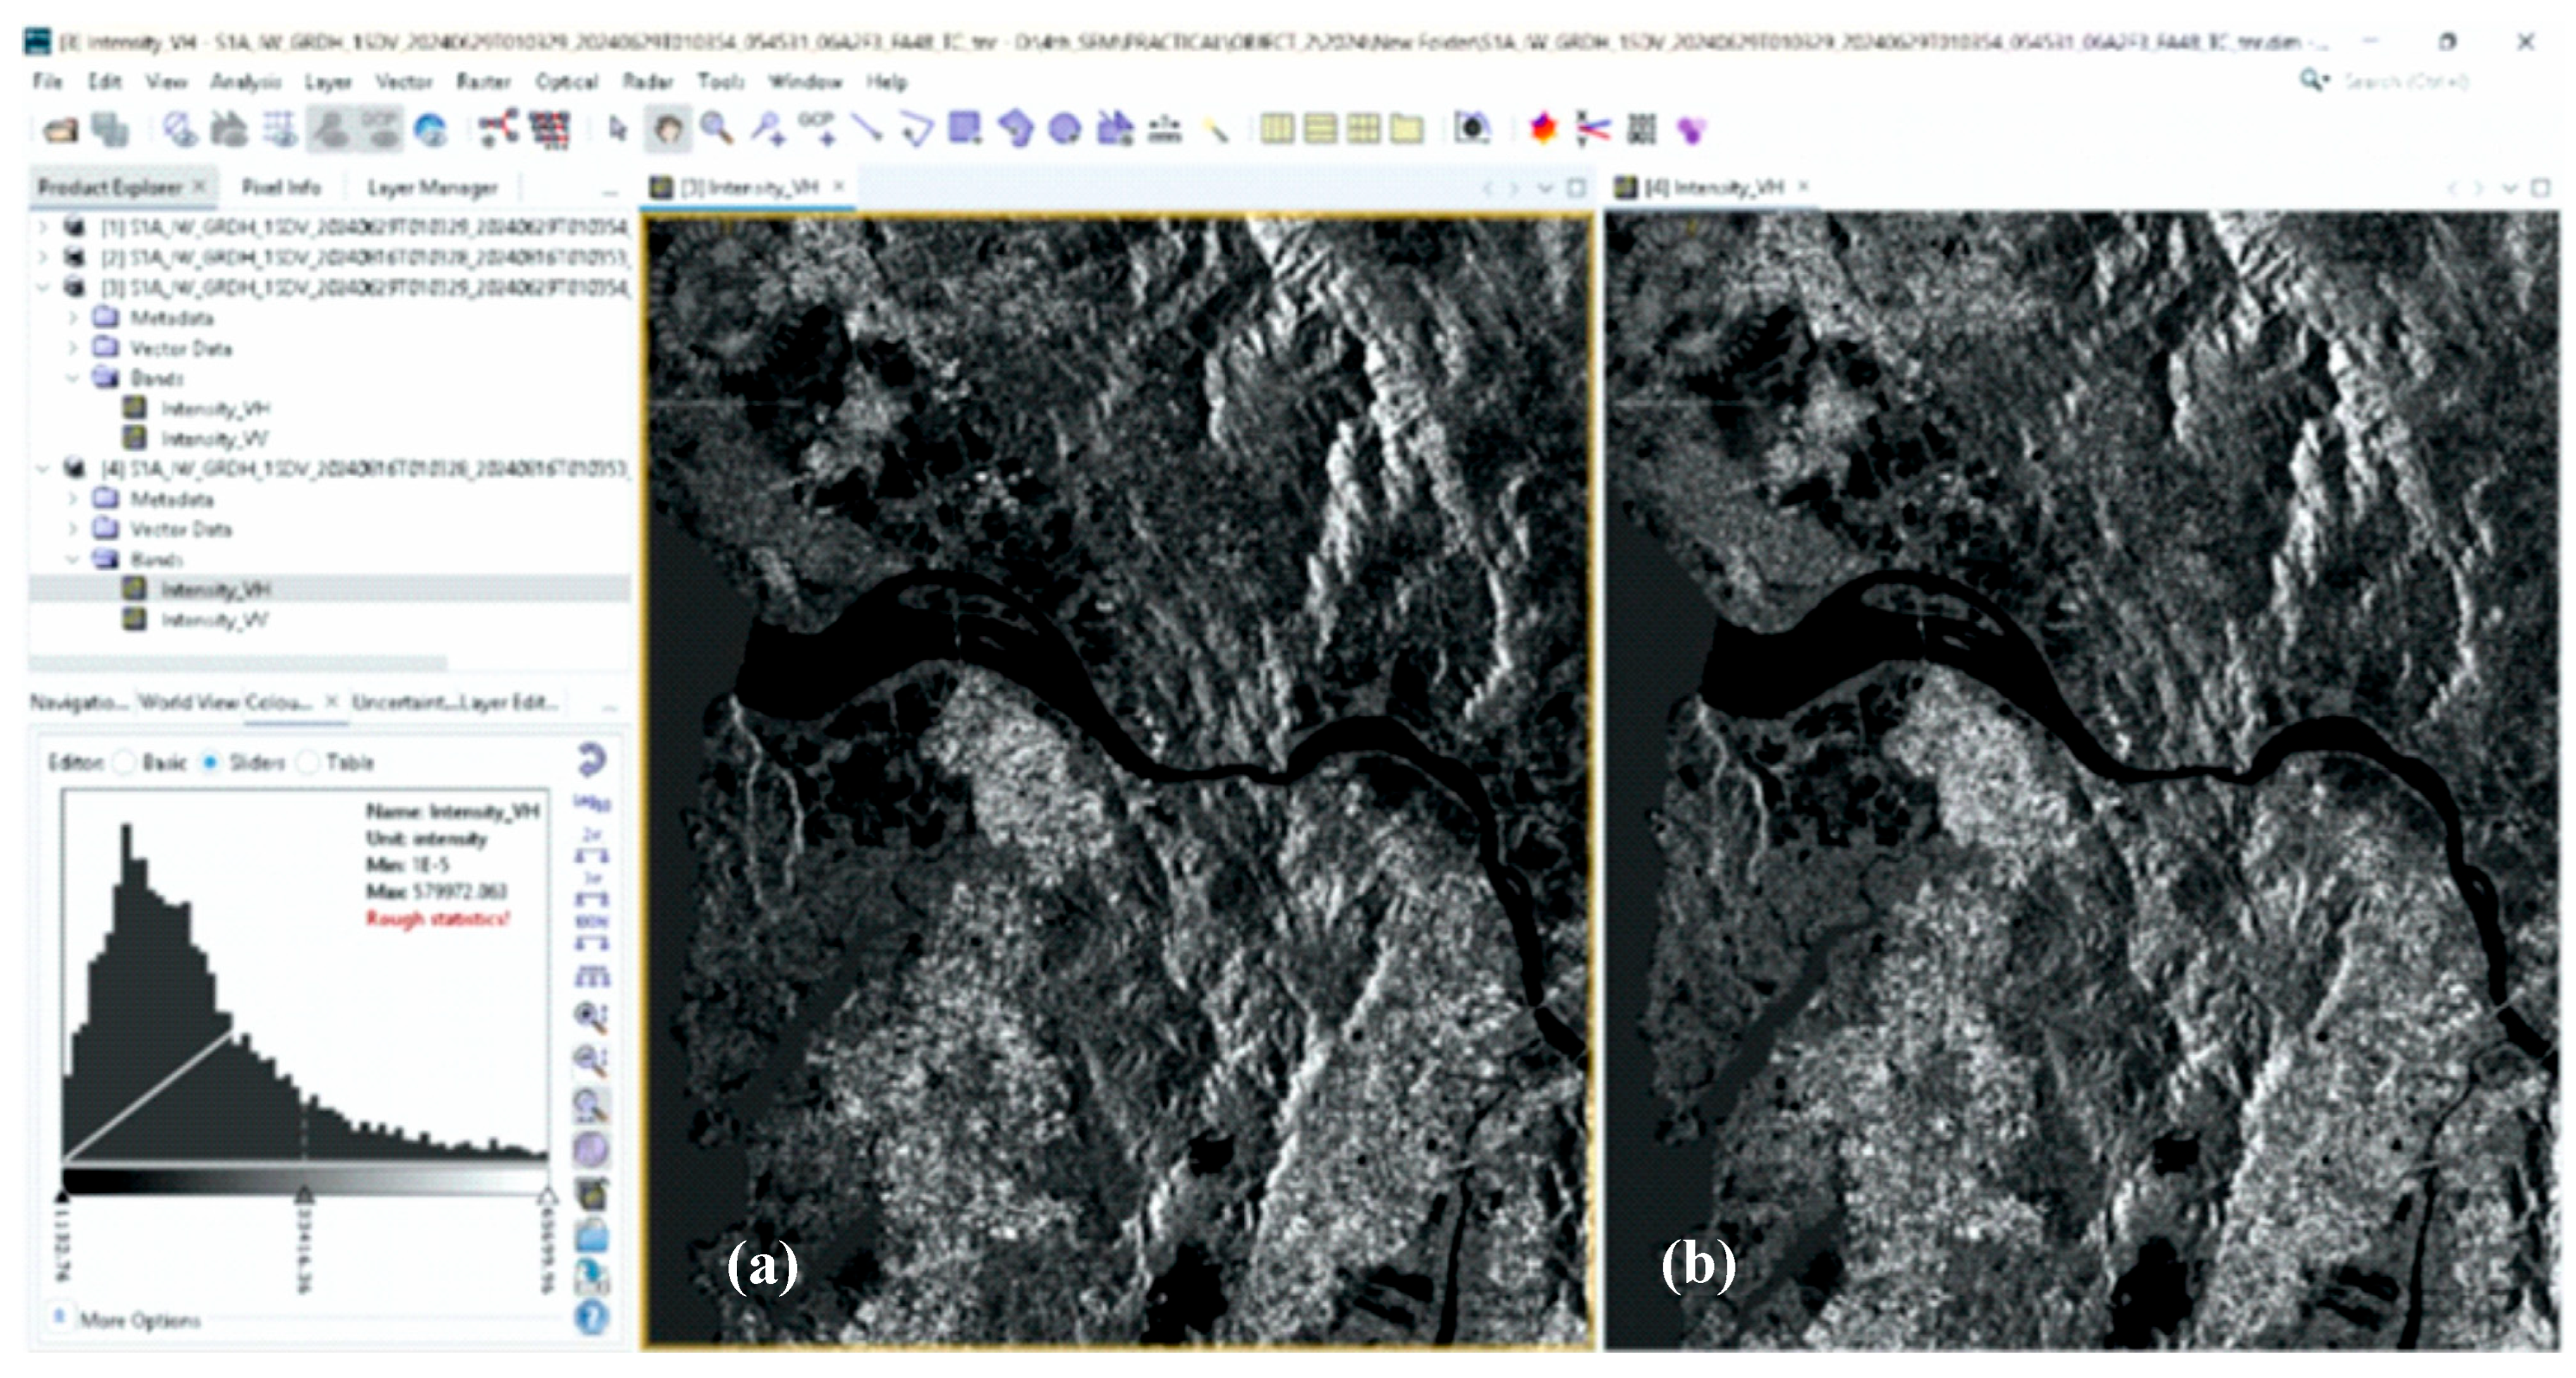
SAR image preprocessing involved several key steps to enhance the accuracy of flood detection. The first step was precise co-registration of pre-flood and post-flood image pairs using orbital metadata and an external DEM to correct for terrain distortions (Figure 3). This ensured accurate pixel alignment between temporal image pairs.
Figure 3.
Image showing the clipped and spatially aligned Sentinel-1 SAR scenes for the Mumbai region, depicting VH polarization (a) and VV polarization (b).
Following co-registration, thermal noise removal and border correction were applied to clean edge effects in the SAR scenes using the ESA Sentinel Application Platform (SNAP, v9.0) (Figure 4). Speckle noise, an inherent artifact in SAR imagery, was reduced using standard SAR filtering techniques available in SNAP, including Lee, Frost, Gamma, and Lee Sigma filters. Among these, the Lee Sigma filter demonstrated optimal performance in preserving edge features while effectively suppressing speckle noise (Figure 5).
Figure 4.
Image illustrating thermal noise removal and border correction applied to Sentinel-1 SAR scenes for the Mumbai region, depicting pre-flood (a) and post-flood (b) periods.
Figure 5.
Image showing the application of radiometric filtering on Sentinel-1 SAR imagery using Lee Sigma (a) and Boxcar (b) filters to reduce speckle noise while preserving textural information.
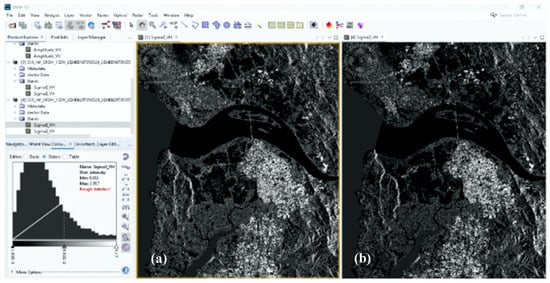
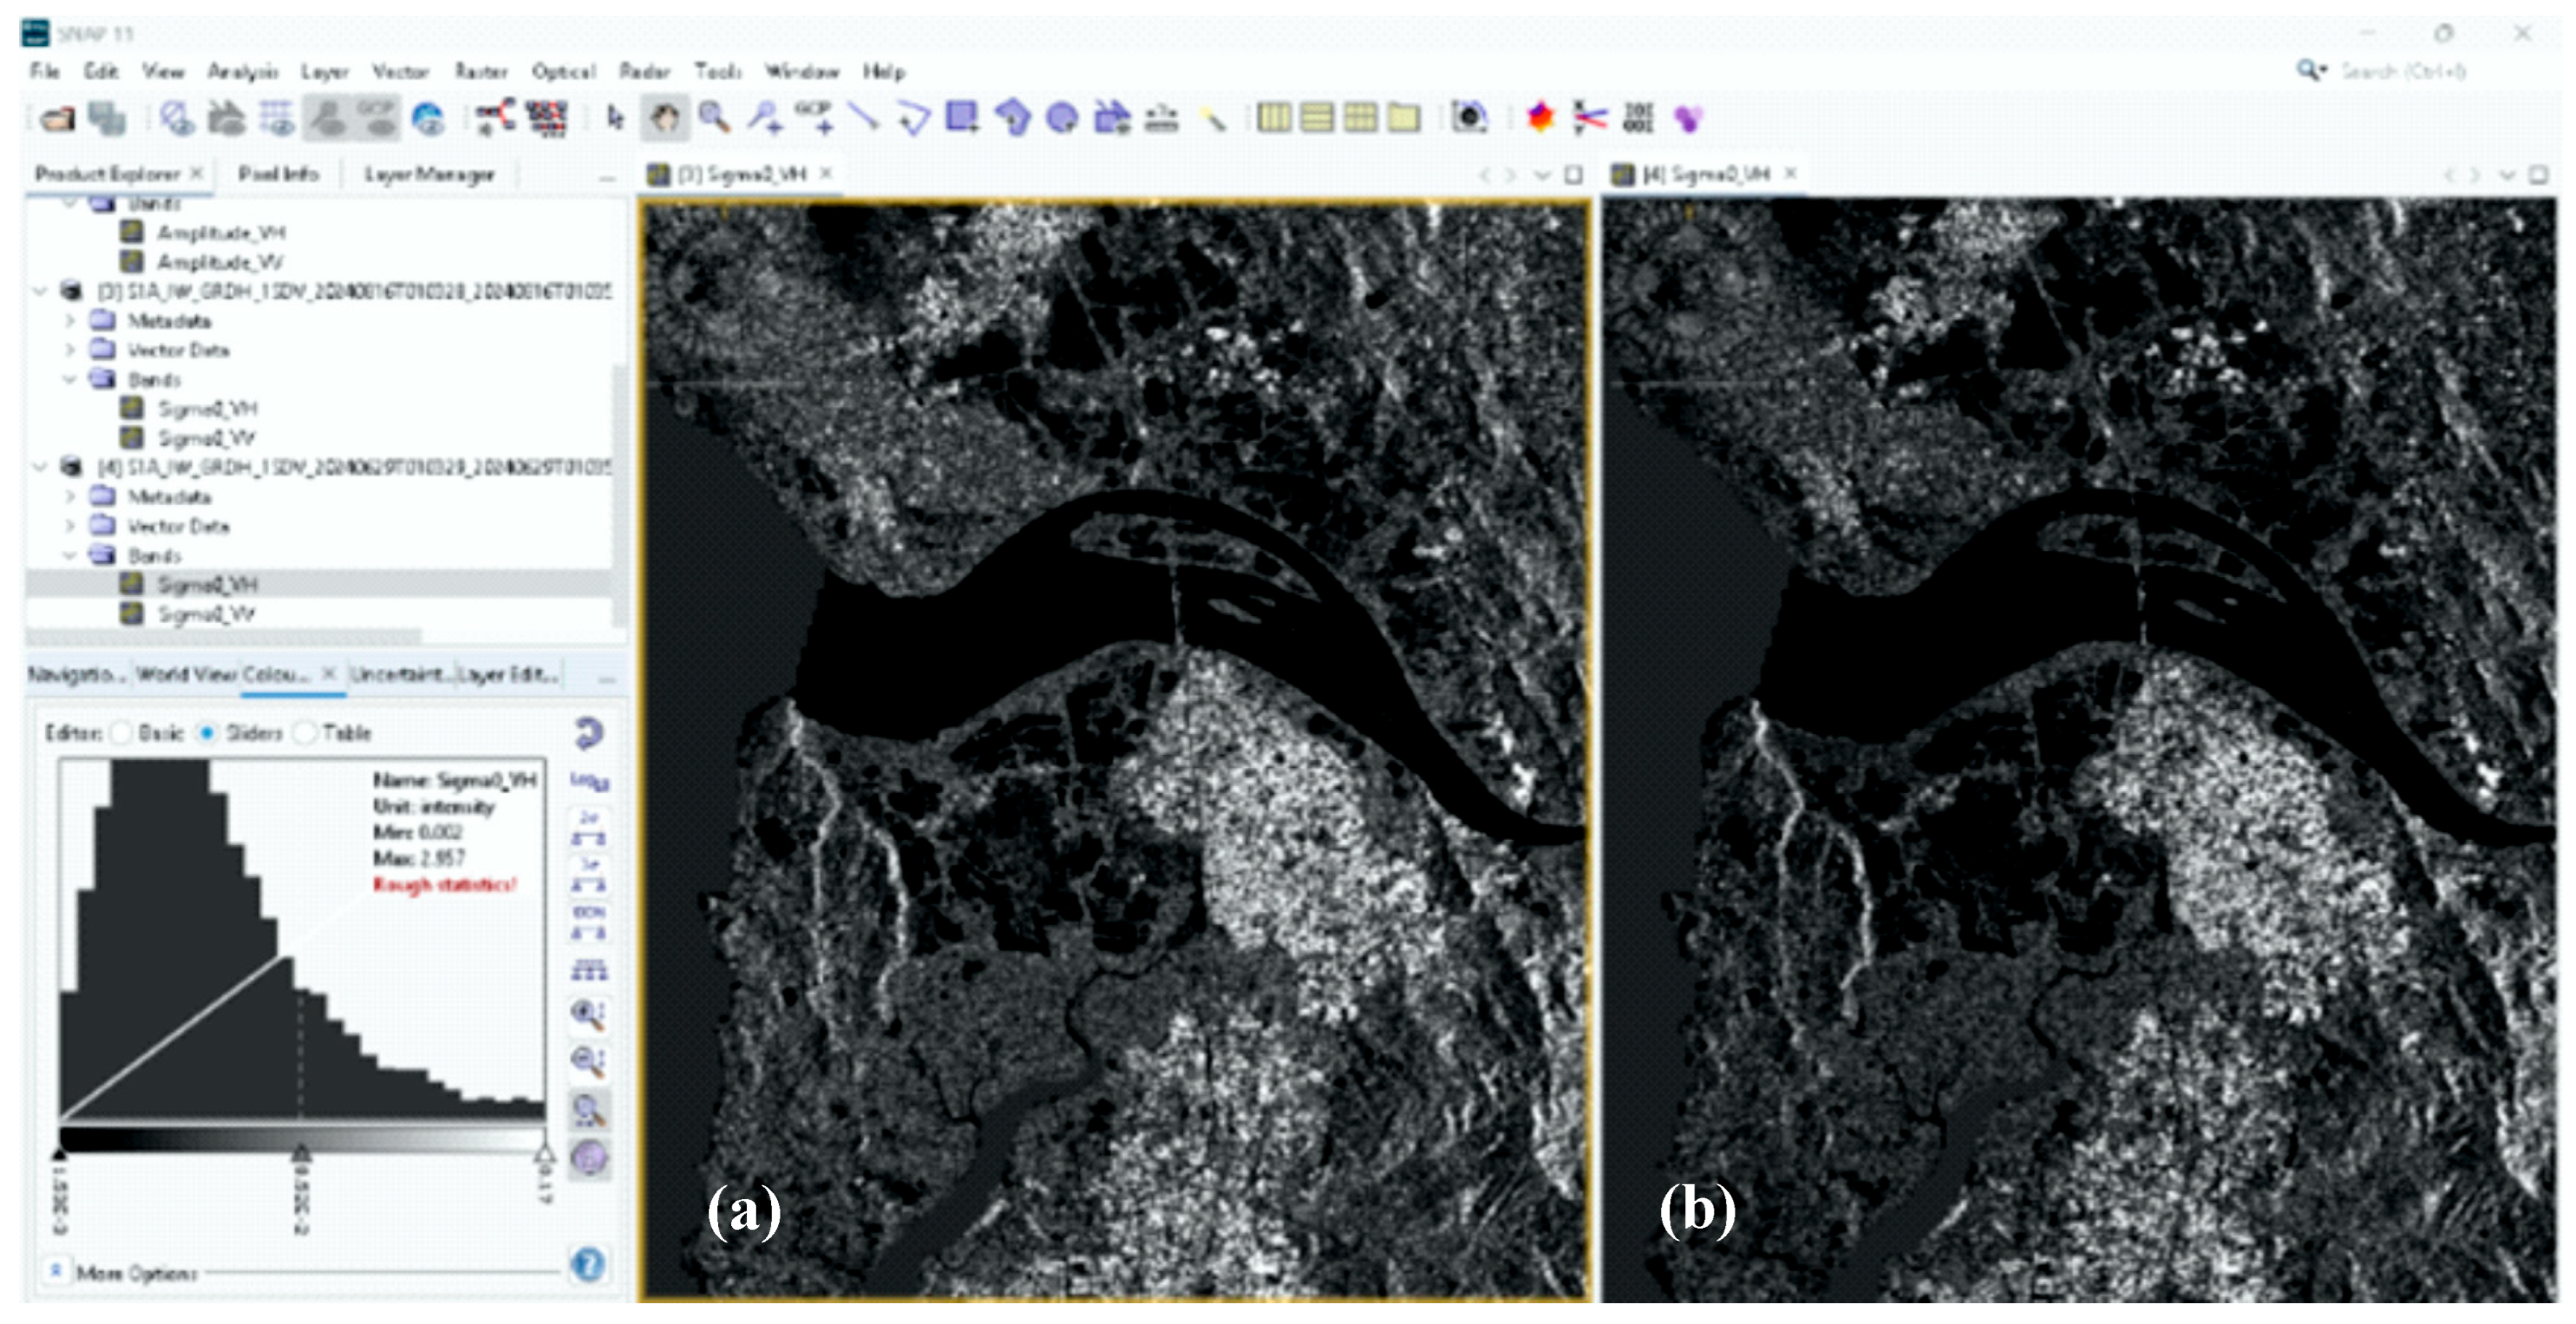
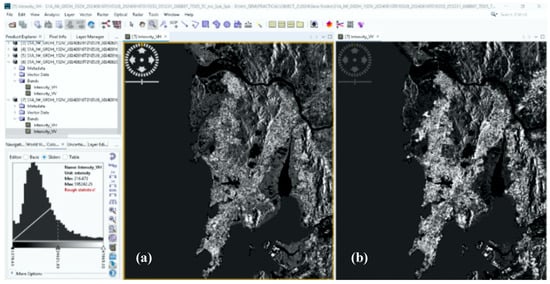
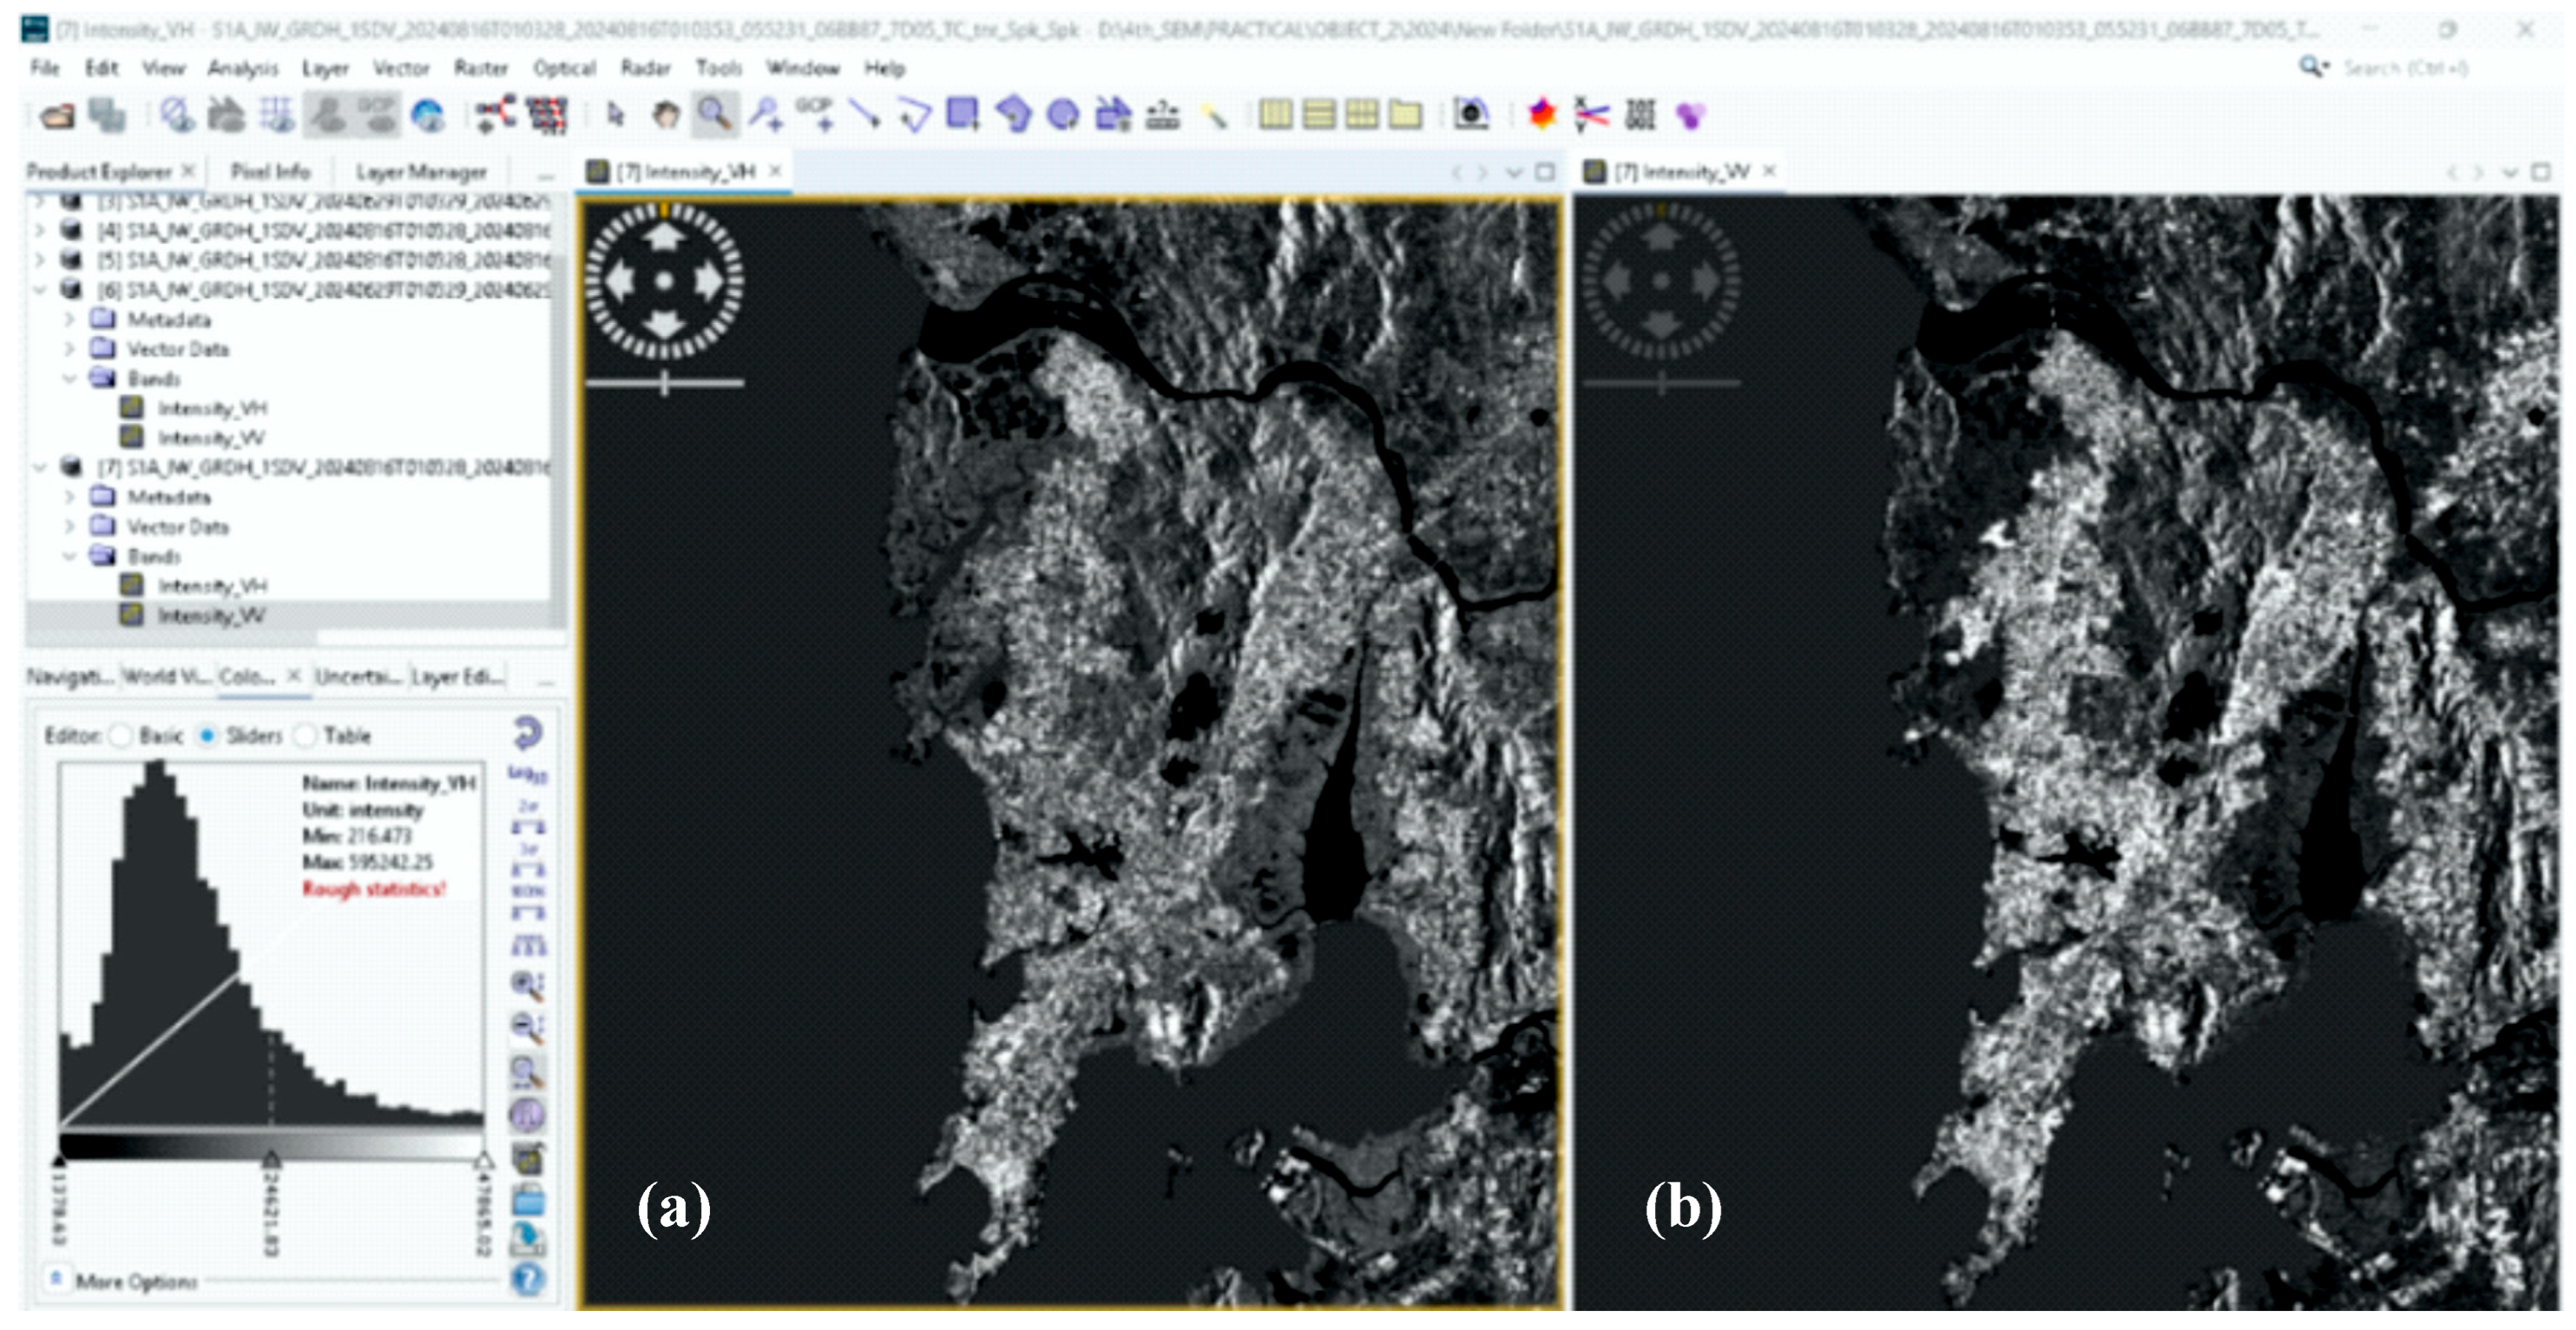
Once filtered, radiometric calibration was performed to convert backscatter values into decibel (dB) scale for interpretability and standardization. The SAR images in dB units were further analyzed to detect variations in backscatter intensity due to flooding (Figure 6). This transformation enhances contrast between flooded and non-flooded areas, aiding classification.
Figure 6.
Image illustrating the radiometrically calibrated Sentinel-1 SAR scene for the post-flood event (16 August 2024), displaying VH polarization (a) and VV polarization (b).
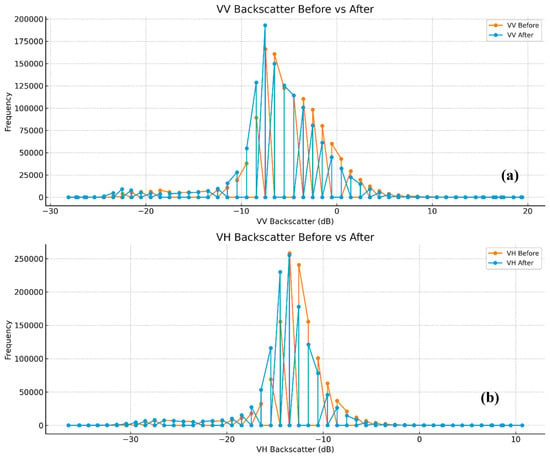
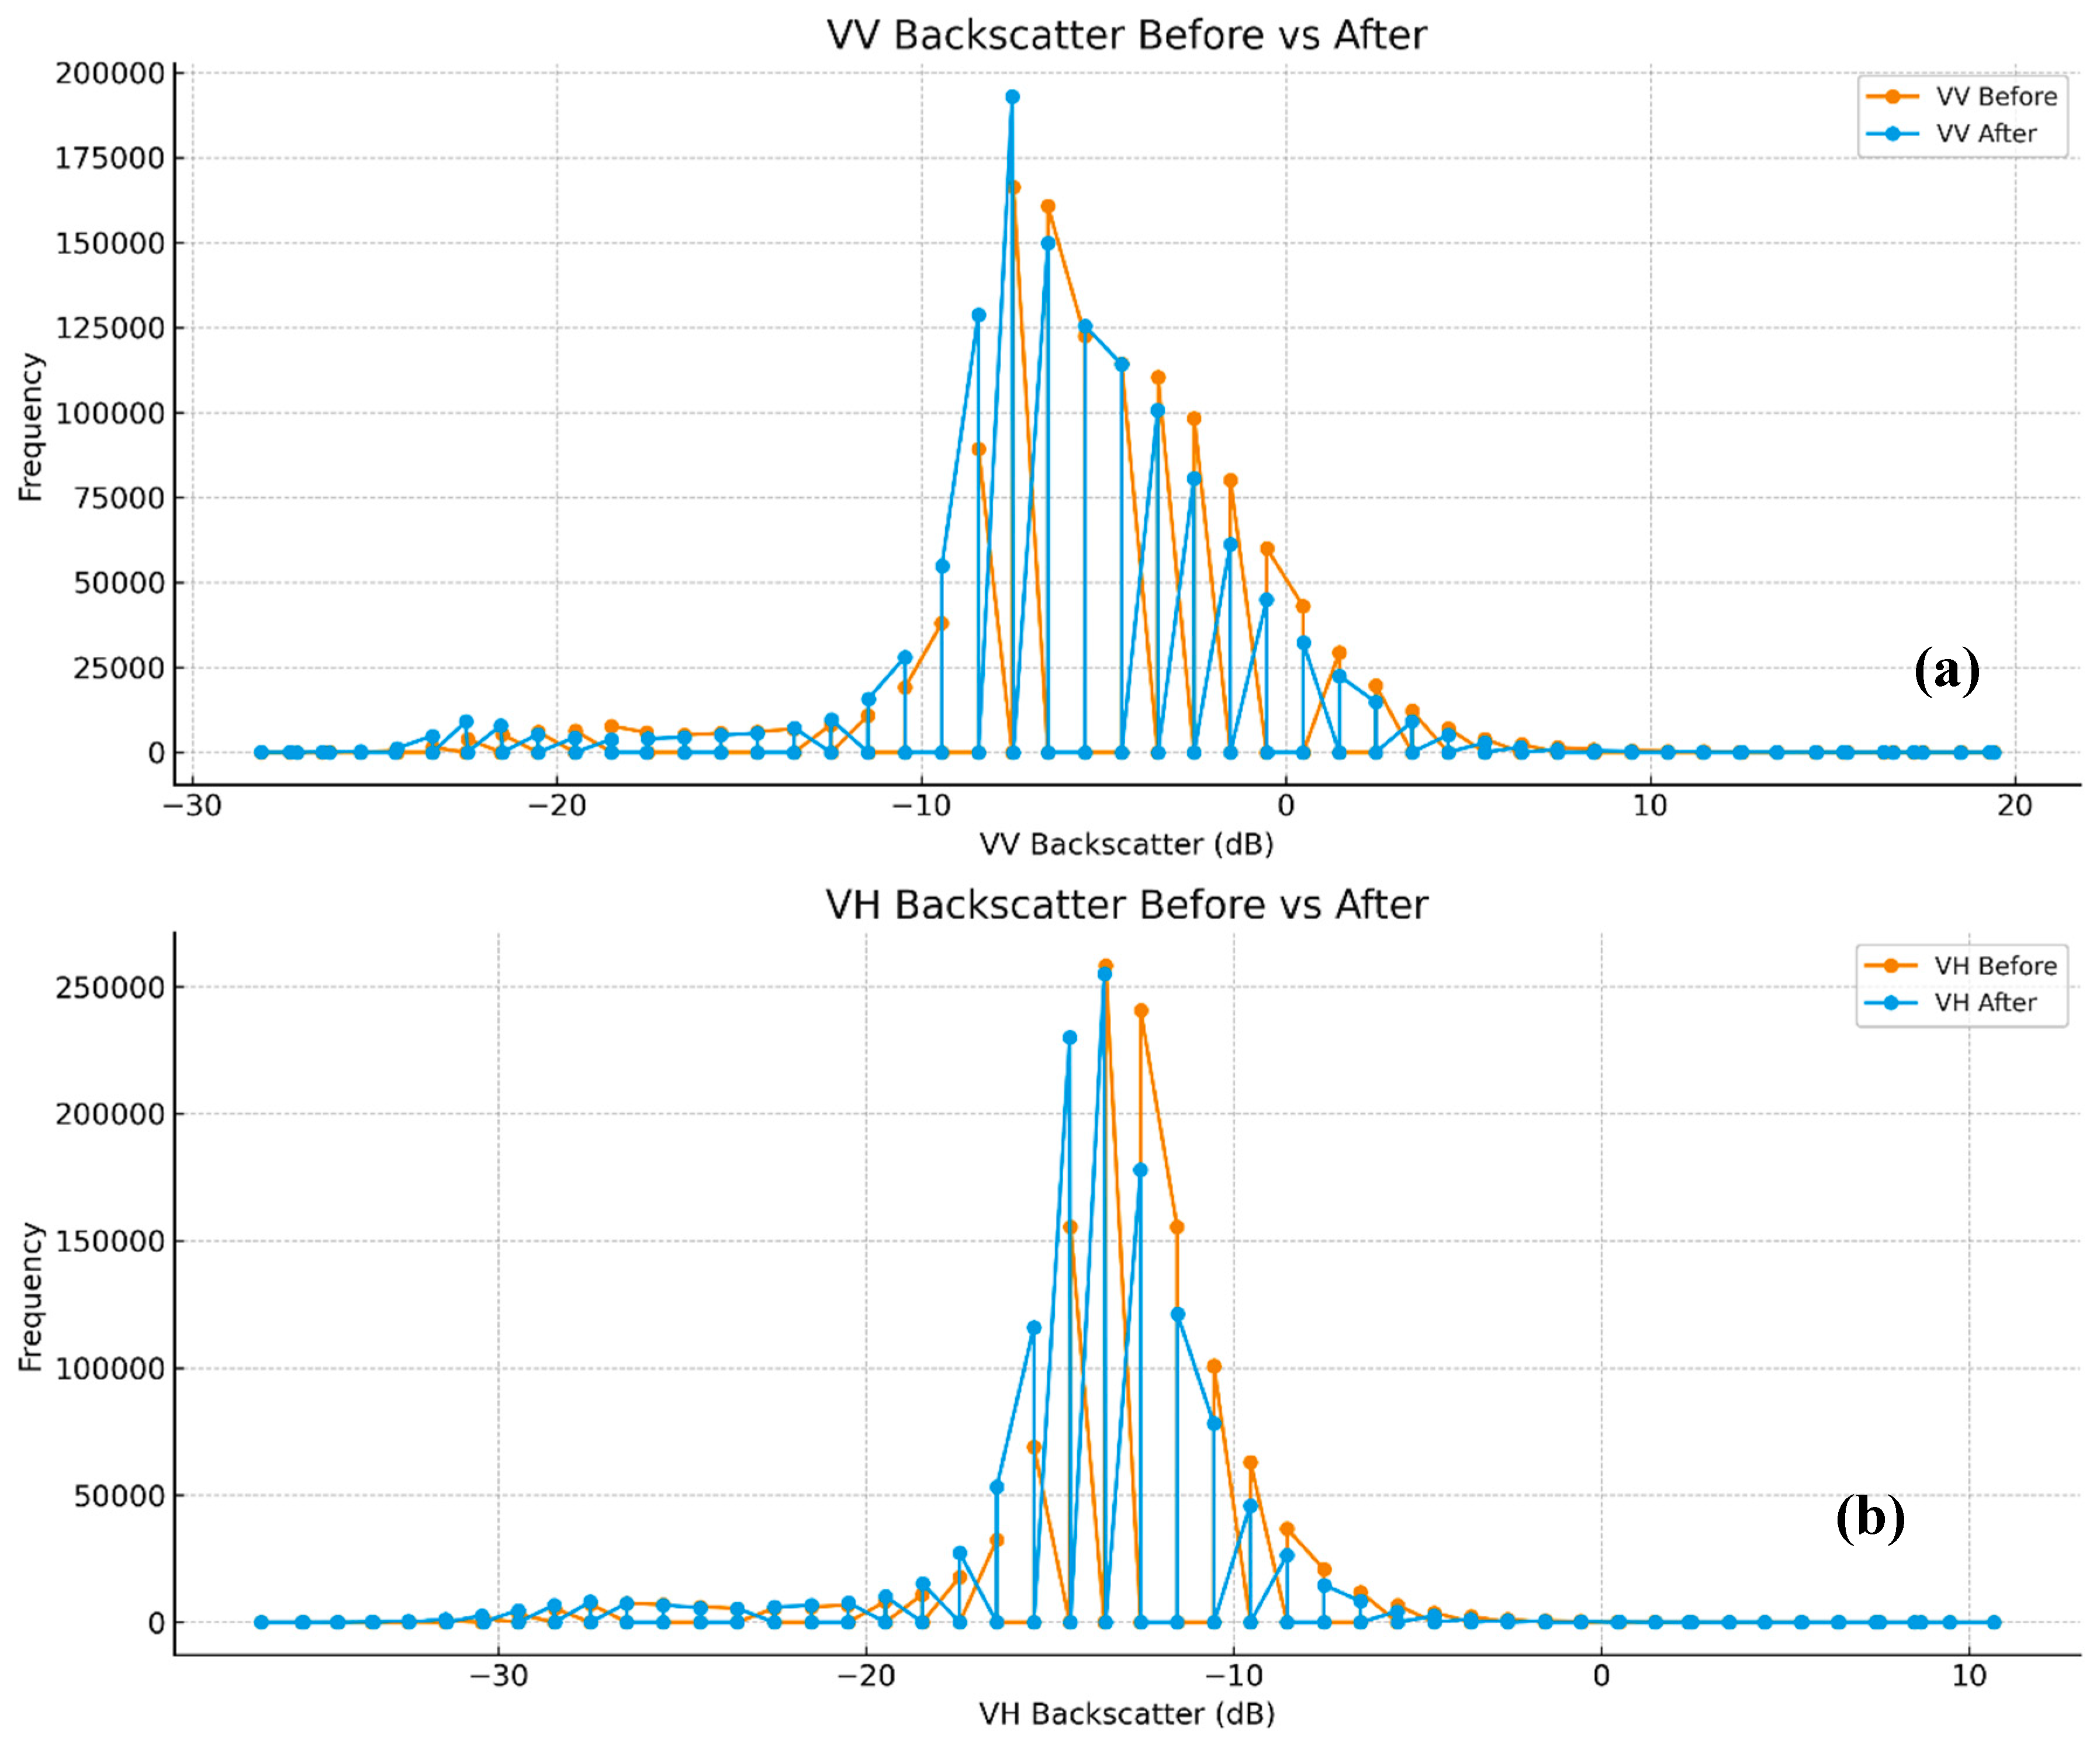
The comparison of VV and VH backscatter intensities before and after floods was performed on radiometrically calibrated σ0 (sigma-nought) backscatter coefficients expressed in decibels (dB). Incidence angle normalization was applied during preprocessing to minimize angular effects across the swath, ensuring consistent comparison between temporal acquisitions. The analysis revealed significant changes in flooded zones, where water bodies typically exhibit reduced VV backscatter due to specular reflection, while VH polarization captures flooded vegetation and debris more effectively (Figure 7).
Figure 7.
Histogram showing comparison of VV backscatter (a); and VH backscatter (b) over the Mumbai region before vs. after floods.
2.3. Water Mask Extraction and Flood Classification
Water and flood classification involved thresholding techniques applied to SAR backscatter histograms. To account for spatial heterogeneity, the SAR image was divided into smaller analysis blocks. For each block, the backscatter histogram was examined for bimodality, which is indicative of the coexistence of water and non-water surfaces. Hartigan’s Dip Test was applied to statistically assess the presence of bimodal distributions (Dip statistic > 0.05), and only blocks exhibiting significant bimodality were retained for threshold determination. For these selected blocks, Kernel Density Estimation was used to identify the local minimum between the two dominant modes, which was defined as the optimal flood threshold separating water from non-water pixels. A coarse water mask was then generated using unsupervised segmentation, followed by morphological filtering to remove noise and fill gaps. Permanent water bodies were excluded using the GSWS dataset as a reference mask. Although the GSWS dataset represents water seasonality information from 1984 to 2021, it was used in this study as a stable reference layer for identifying long-term permanent water bodies such as rivers, lakes, reservoirs, and coastal zones. Because these permanent water features in Mumbai exhibit limited spatial variation over short temporal periods, the GSWS dataset remained suitable for distinguishing stable water surfaces from temporary flood inundation during 2018–2025. The GSWS-derived mask was also cross-checked with recent Sentinel-1 observations to minimize temporal inconsistencies. This procedure was repeated for all 16 flood events (2018–2025), resulting in a multi-year spatio-temporal urban flood archive for Mumbai.
2.4. Validation and Accuracy Assessment
Flood classification results were validated using crowd-sourced flood point data, field reports, and ground-truth locations compiled from the Brihanmumbai Municipal Corporation (BMC) flood management portal and NIUA annual reports [20,26]. Over 500 validation points were spatially compared with SAR-derived flood maps to assess detection accuracy and consistency. The validation process in this study focused primarily on spatial agreement and consistency between observed flood locations and SAR-derived inundation zones, rather than pixel-based supervised classification accuracy assessment using confusion matrices or Kappa statistics. Therefore, the validation should be interpreted as a spatial consistency evaluation of flood-prone zones identified from Sentinel-1 SAR observations. Validation revealed high correspondence in flood-prone zones, particularly along the Mithi River, Kurla, Sion, and low-lying suburbs such as Chembur and Andheri East. This confirms the reliability of Sentinel-1-based flood mapping, especially in detecting short-duration pluvial floods and inundation from tidal backflow.
3. Results
3.1. Flood Mapping from 2018 to 2025
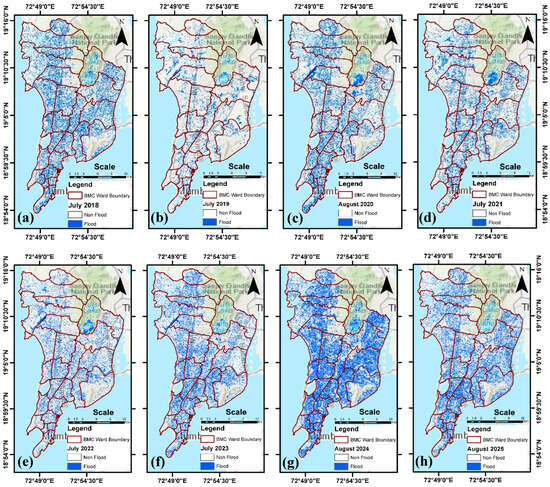
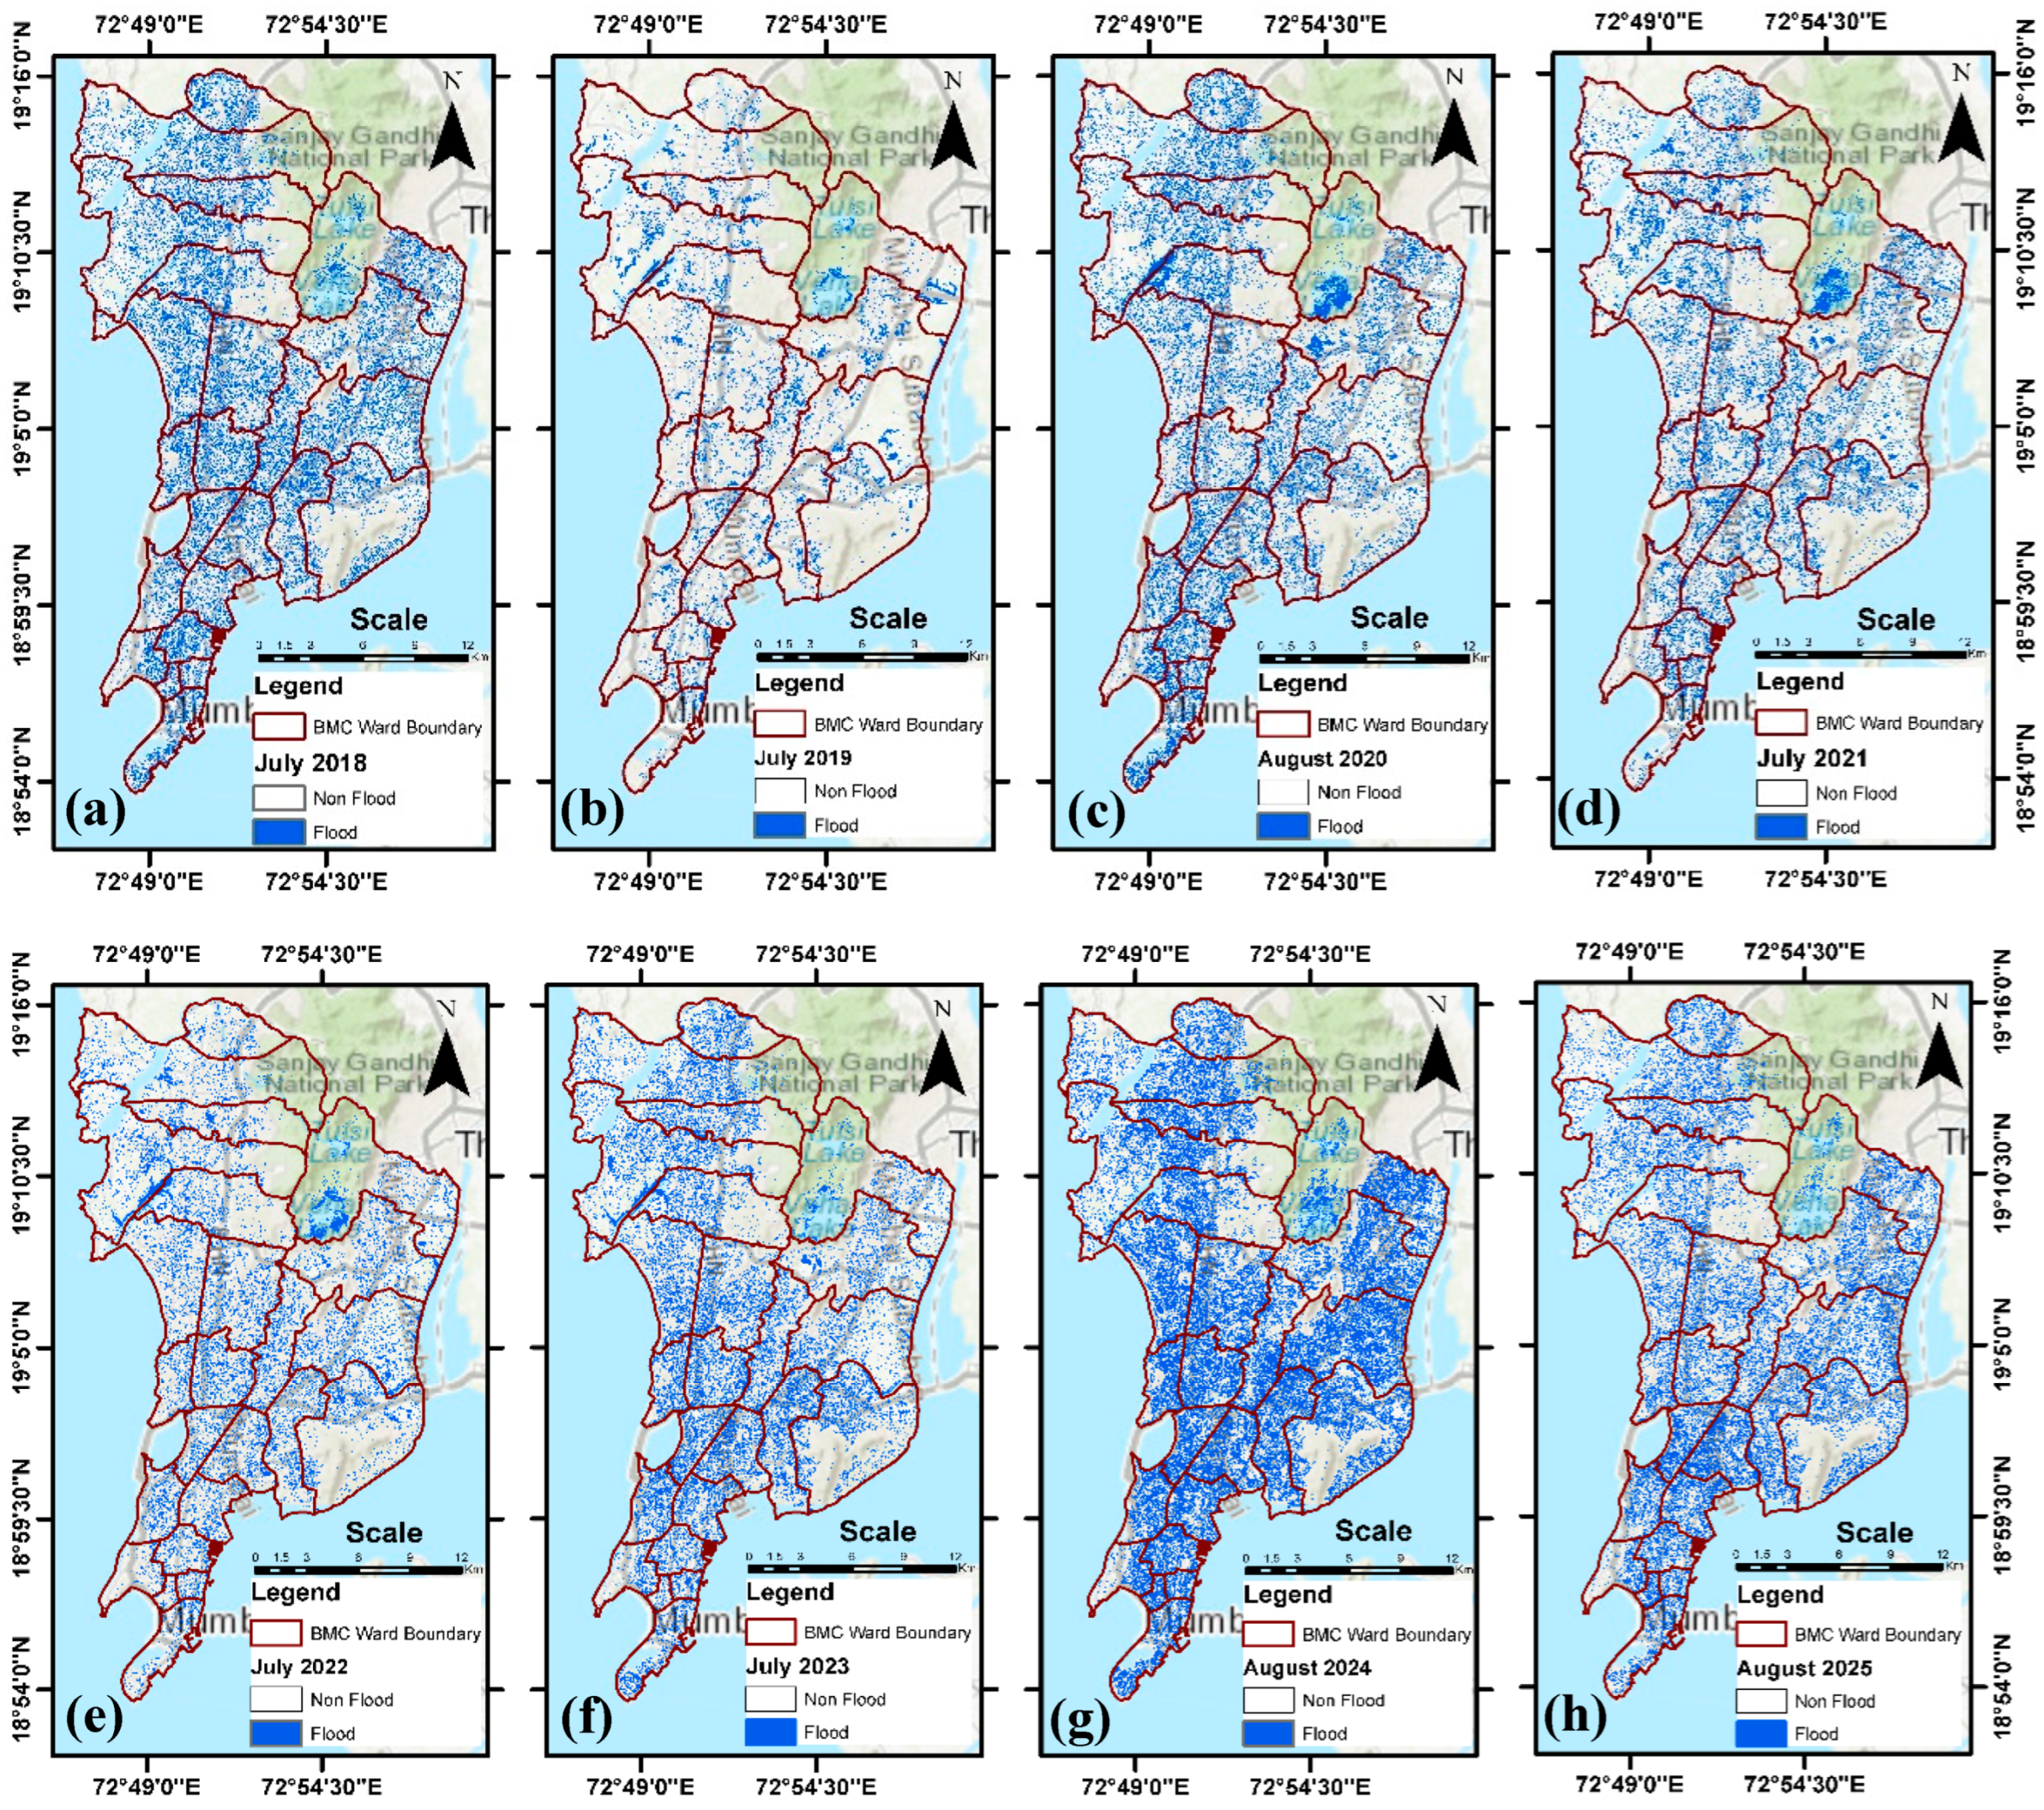
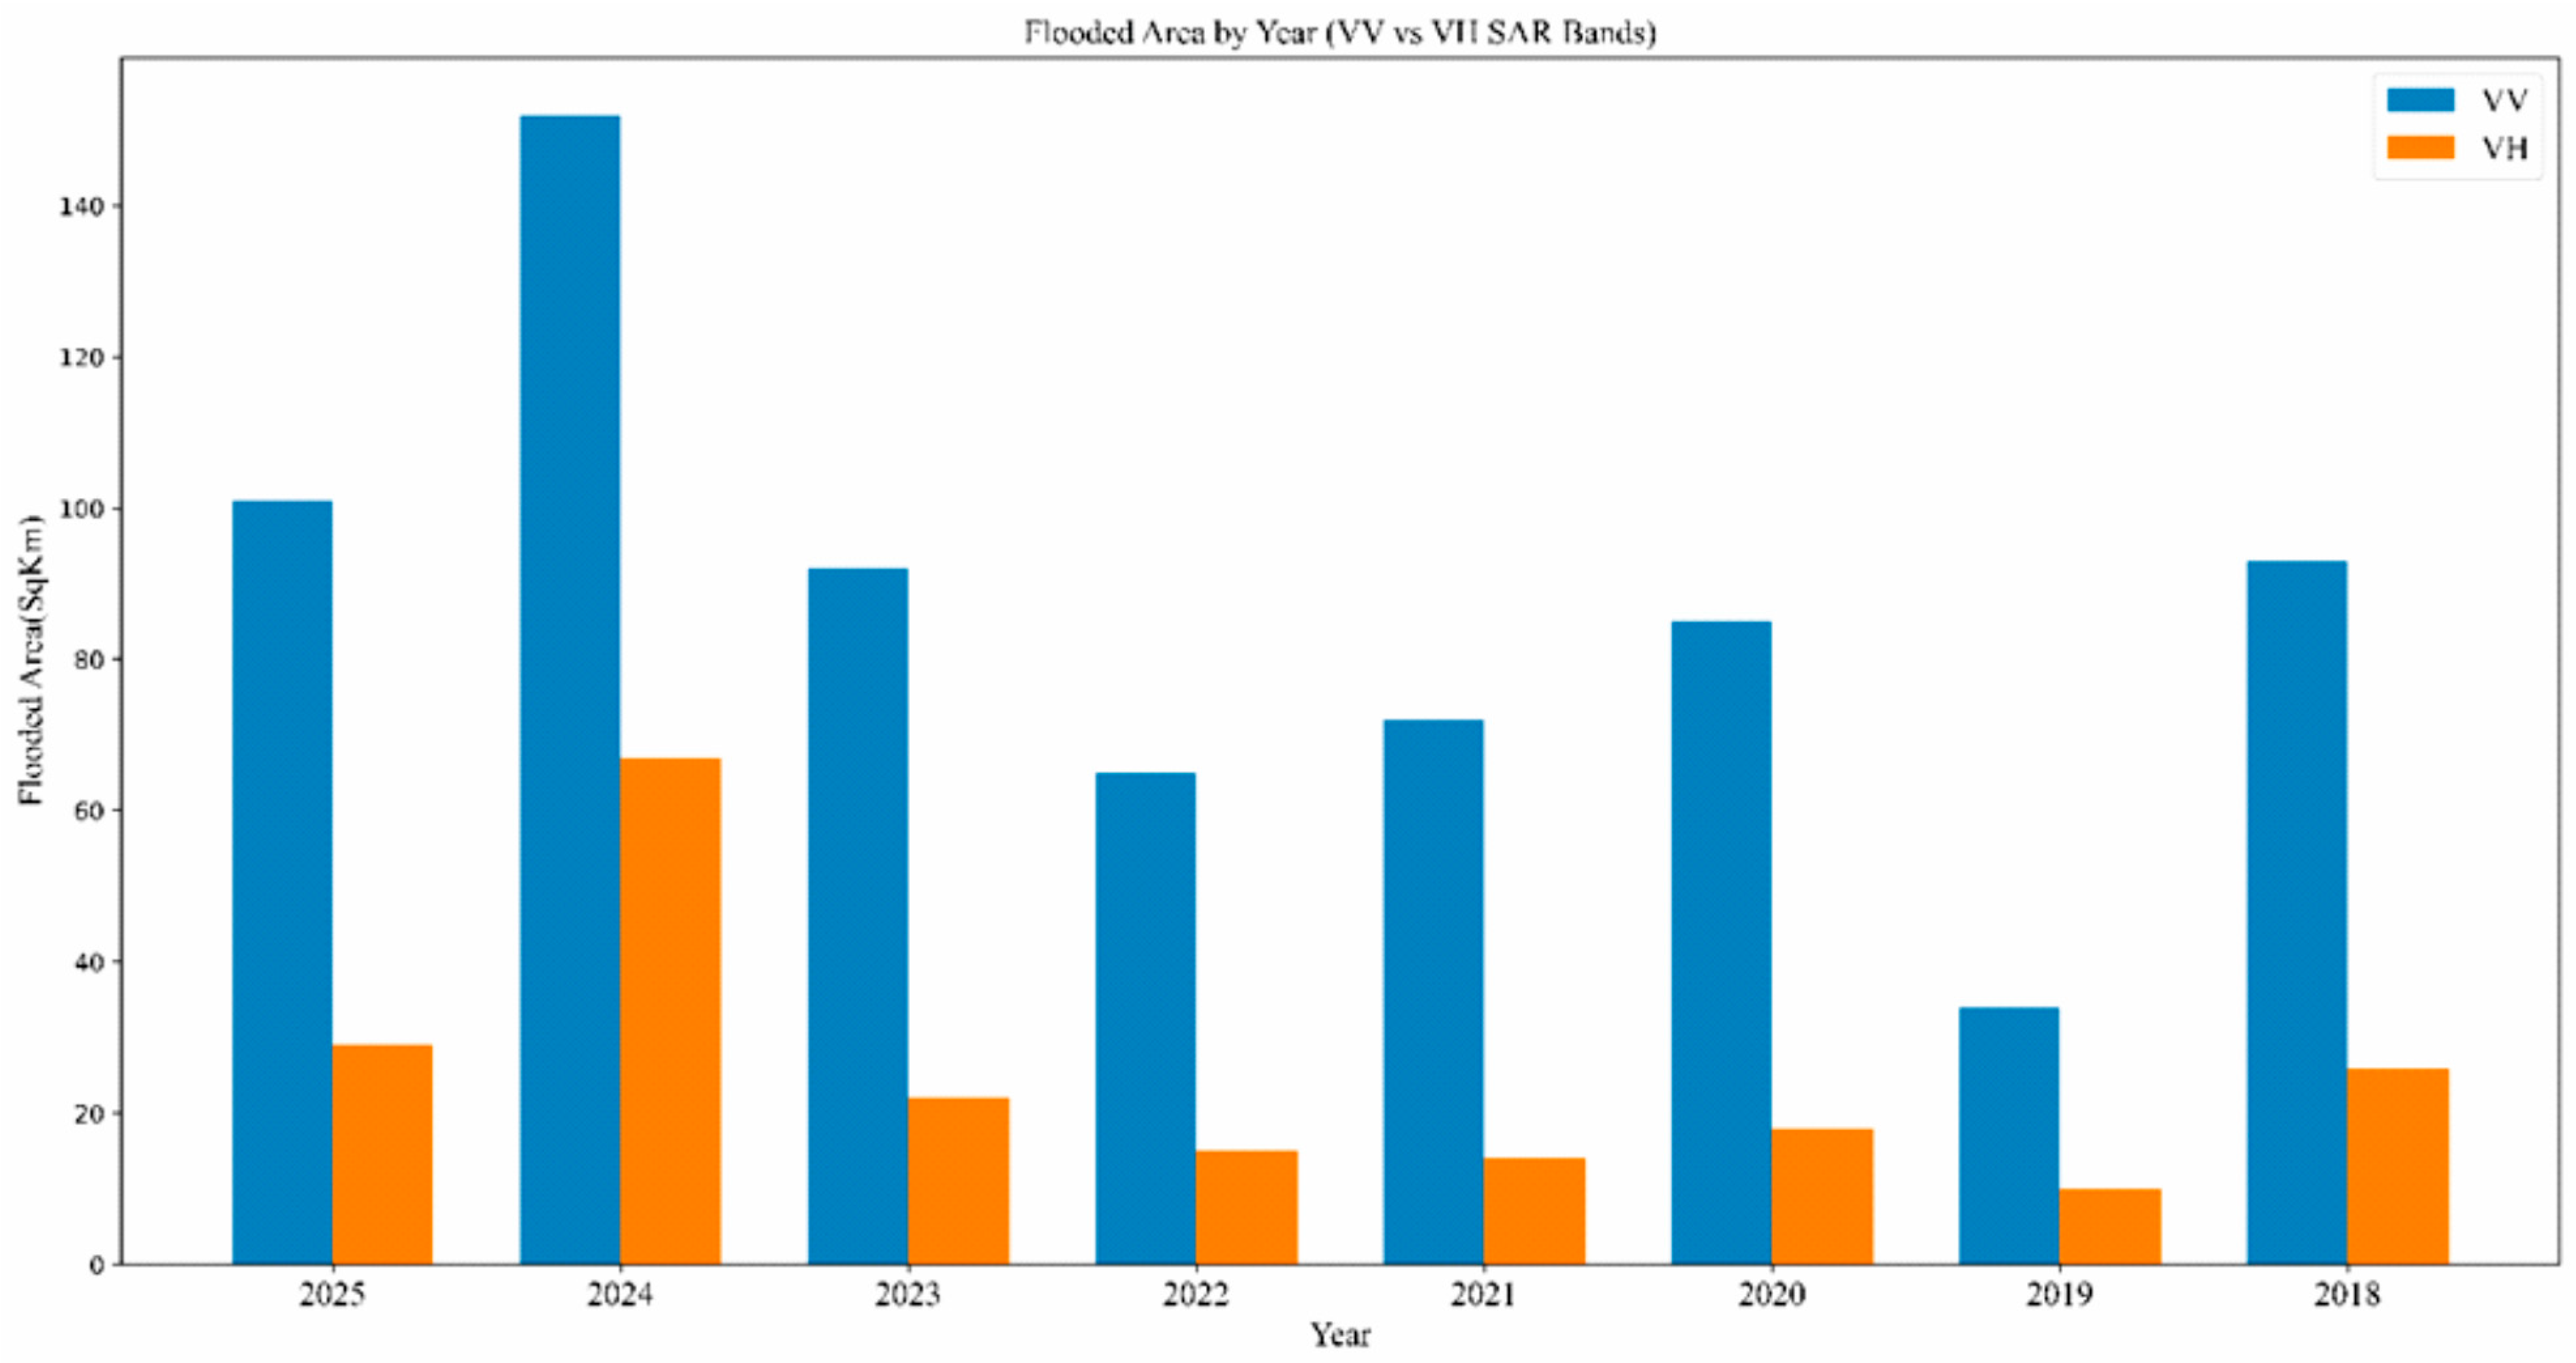
The spatial dynamics of flooding across Mumbai from 2018 to 2025 were analyzed using Sentinel-1 SAR data (Figure 8). These maps show the evolution of flood-prone zones, where inundated areas are marked in blue and non-flooded regions in white. The 2018 and 2019 maps show scattered flooding, mostly confined to riverbanks and low-lying areas. During 2019, the total flooded area detected using VV polarization was comparatively lower at 34 km2, indicating limited inundation during that monsoon period. Flood extent increased quantitatively from 34 km2 in 2019 to 85 km2 in 2020 and 72 km2 in 2021, indicating a measurable rise in inundation during consecutive monsoon years, particularly across central and eastern wards. The 2024 and 2025 maps show a noticeable expansion in flood extent, particularly in 2024, where central and northern Mumbai experienced widespread inundation. The maximum flood extent was recorded in 2024, reaching 152 km2 using VV polarization, while heavily affected wards included Chembur West (16.47 km2), Matunga (12.33 km2), and Dahisar (12.63 km2). In 2025, although the situation improved slightly, many areas still exhibited prolonged waterlogging, possibly due to inadequate drainage and residual saturation from previous events.
Figure 8.
Map showing the flooding observed during July 2018 (a); July 2019 (b); August 2020 (c); July 2021 (d); July 2022 (e); July 2023 (f); August 2024 (g); and August 2025 (h).
3.2. Annual Flooded Area Estimation from VV and VH Bands
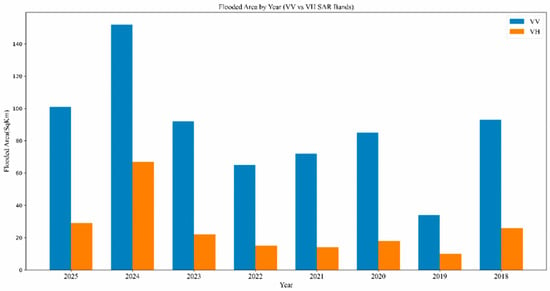
The SAR-derived estimates of total flooded areas from 2018 to 2025 using both VV and VH bands are presented in Figure 9 and Table 3. The VV band consistently detected higher flood extents than the VH band due to its stronger backscatter response to water surfaces. The most significant flooding event occurred in 2024, with VV-based estimates exceeding 150 km2. The lowest flood extents were recorded in 2019 and 2022. These fluctuations may reflect yearly variations in rainfall intensity, drainage infrastructure performance, and urban land cover changes.
Figure 9.
Plot showing Flooded area as detected by VV and VH SAR Bands (Year 2018–2025).
Table 3.
Flooded area (km2) by Year (VV vs. VH SAR Bands).
3.3. Spatial and Temporal Flood Distribution at Ward Level
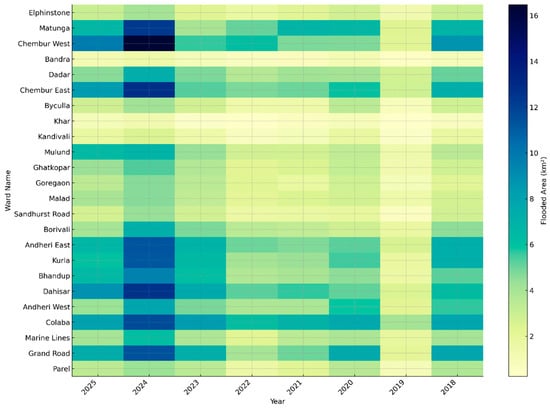
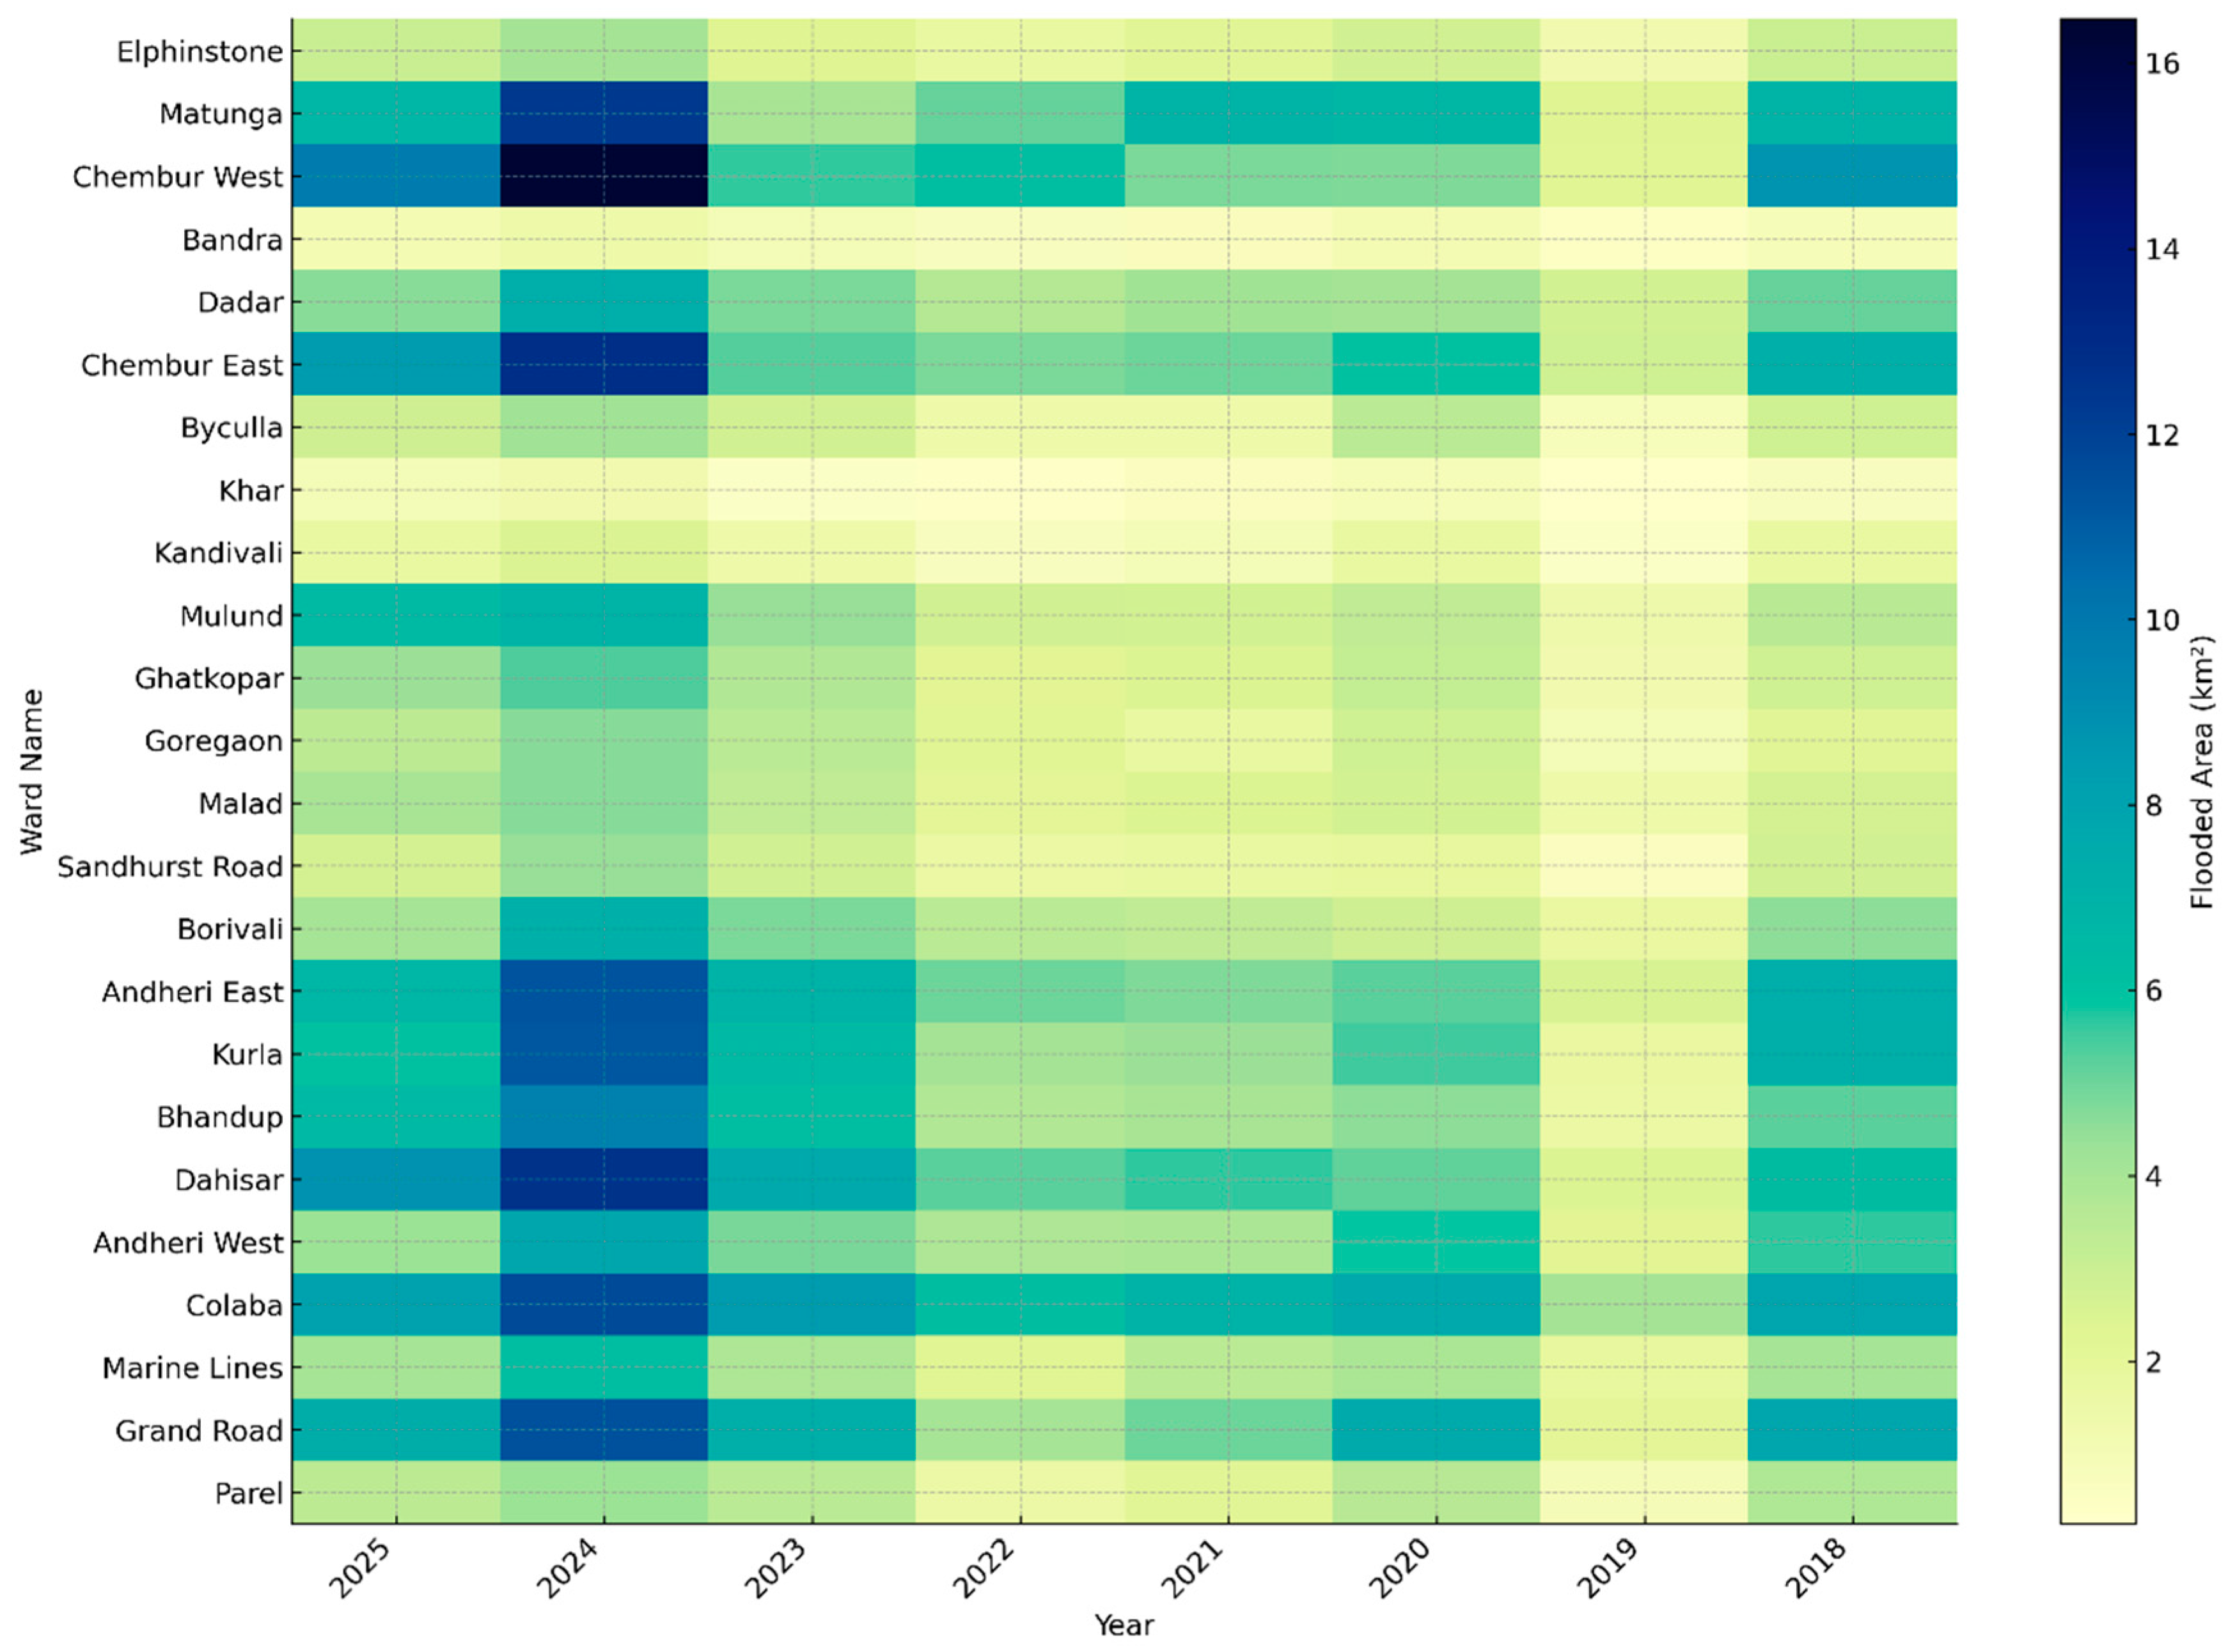
Flood distribution was further analyzed at the ward level from 2018 to 2025, shown in Figure 10 and Table 4. Wards such as Chembur West, Chembur East, Dahisar, Colaba, and Grand Road consistently exhibited the highest levels of inundation, with Chembur West recording the peak flooded area of 16.47 km2 in 2024. Chembur West remained among the top three most flood-affected wards in all analyzed years, with multi-year flood extents generally exceeding 5 km2 after 2020. Similarly, Dahisar and Colaba repeatedly recorded flood extents above 6 km2 during major flood years, indicating persistent spatial vulnerability. In contrast, wards like Bandra, Khar, and Kandivali showed relatively minor flood extents throughout the period.
Figure 10.
Diagram illustrating Ward-wise Flooded area distribution (Year 2018–2025).
Table 4.
Ward-wise Flooded area (km2) (Year 2025–2018).
The average flooded area across wards increased from approximately 3.3 km2 in 2018 to nearly 8.9 km2 in 2024, representing a substantial rise in urban flood exposure during the study period. The ward-level data reinforces the identification of chronic flood zones and reveals spatial disparities in vulnerability due to varying urban morphology, topography, and drainage infrastructure.
3.4. Rainfall Patterns During Flood Seasons
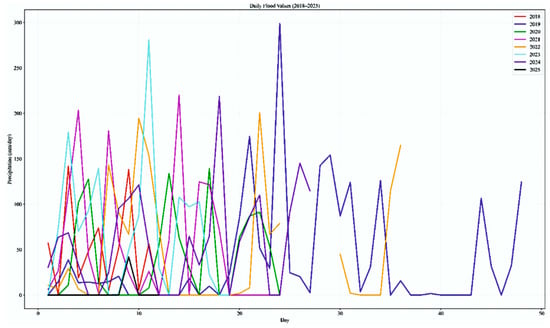
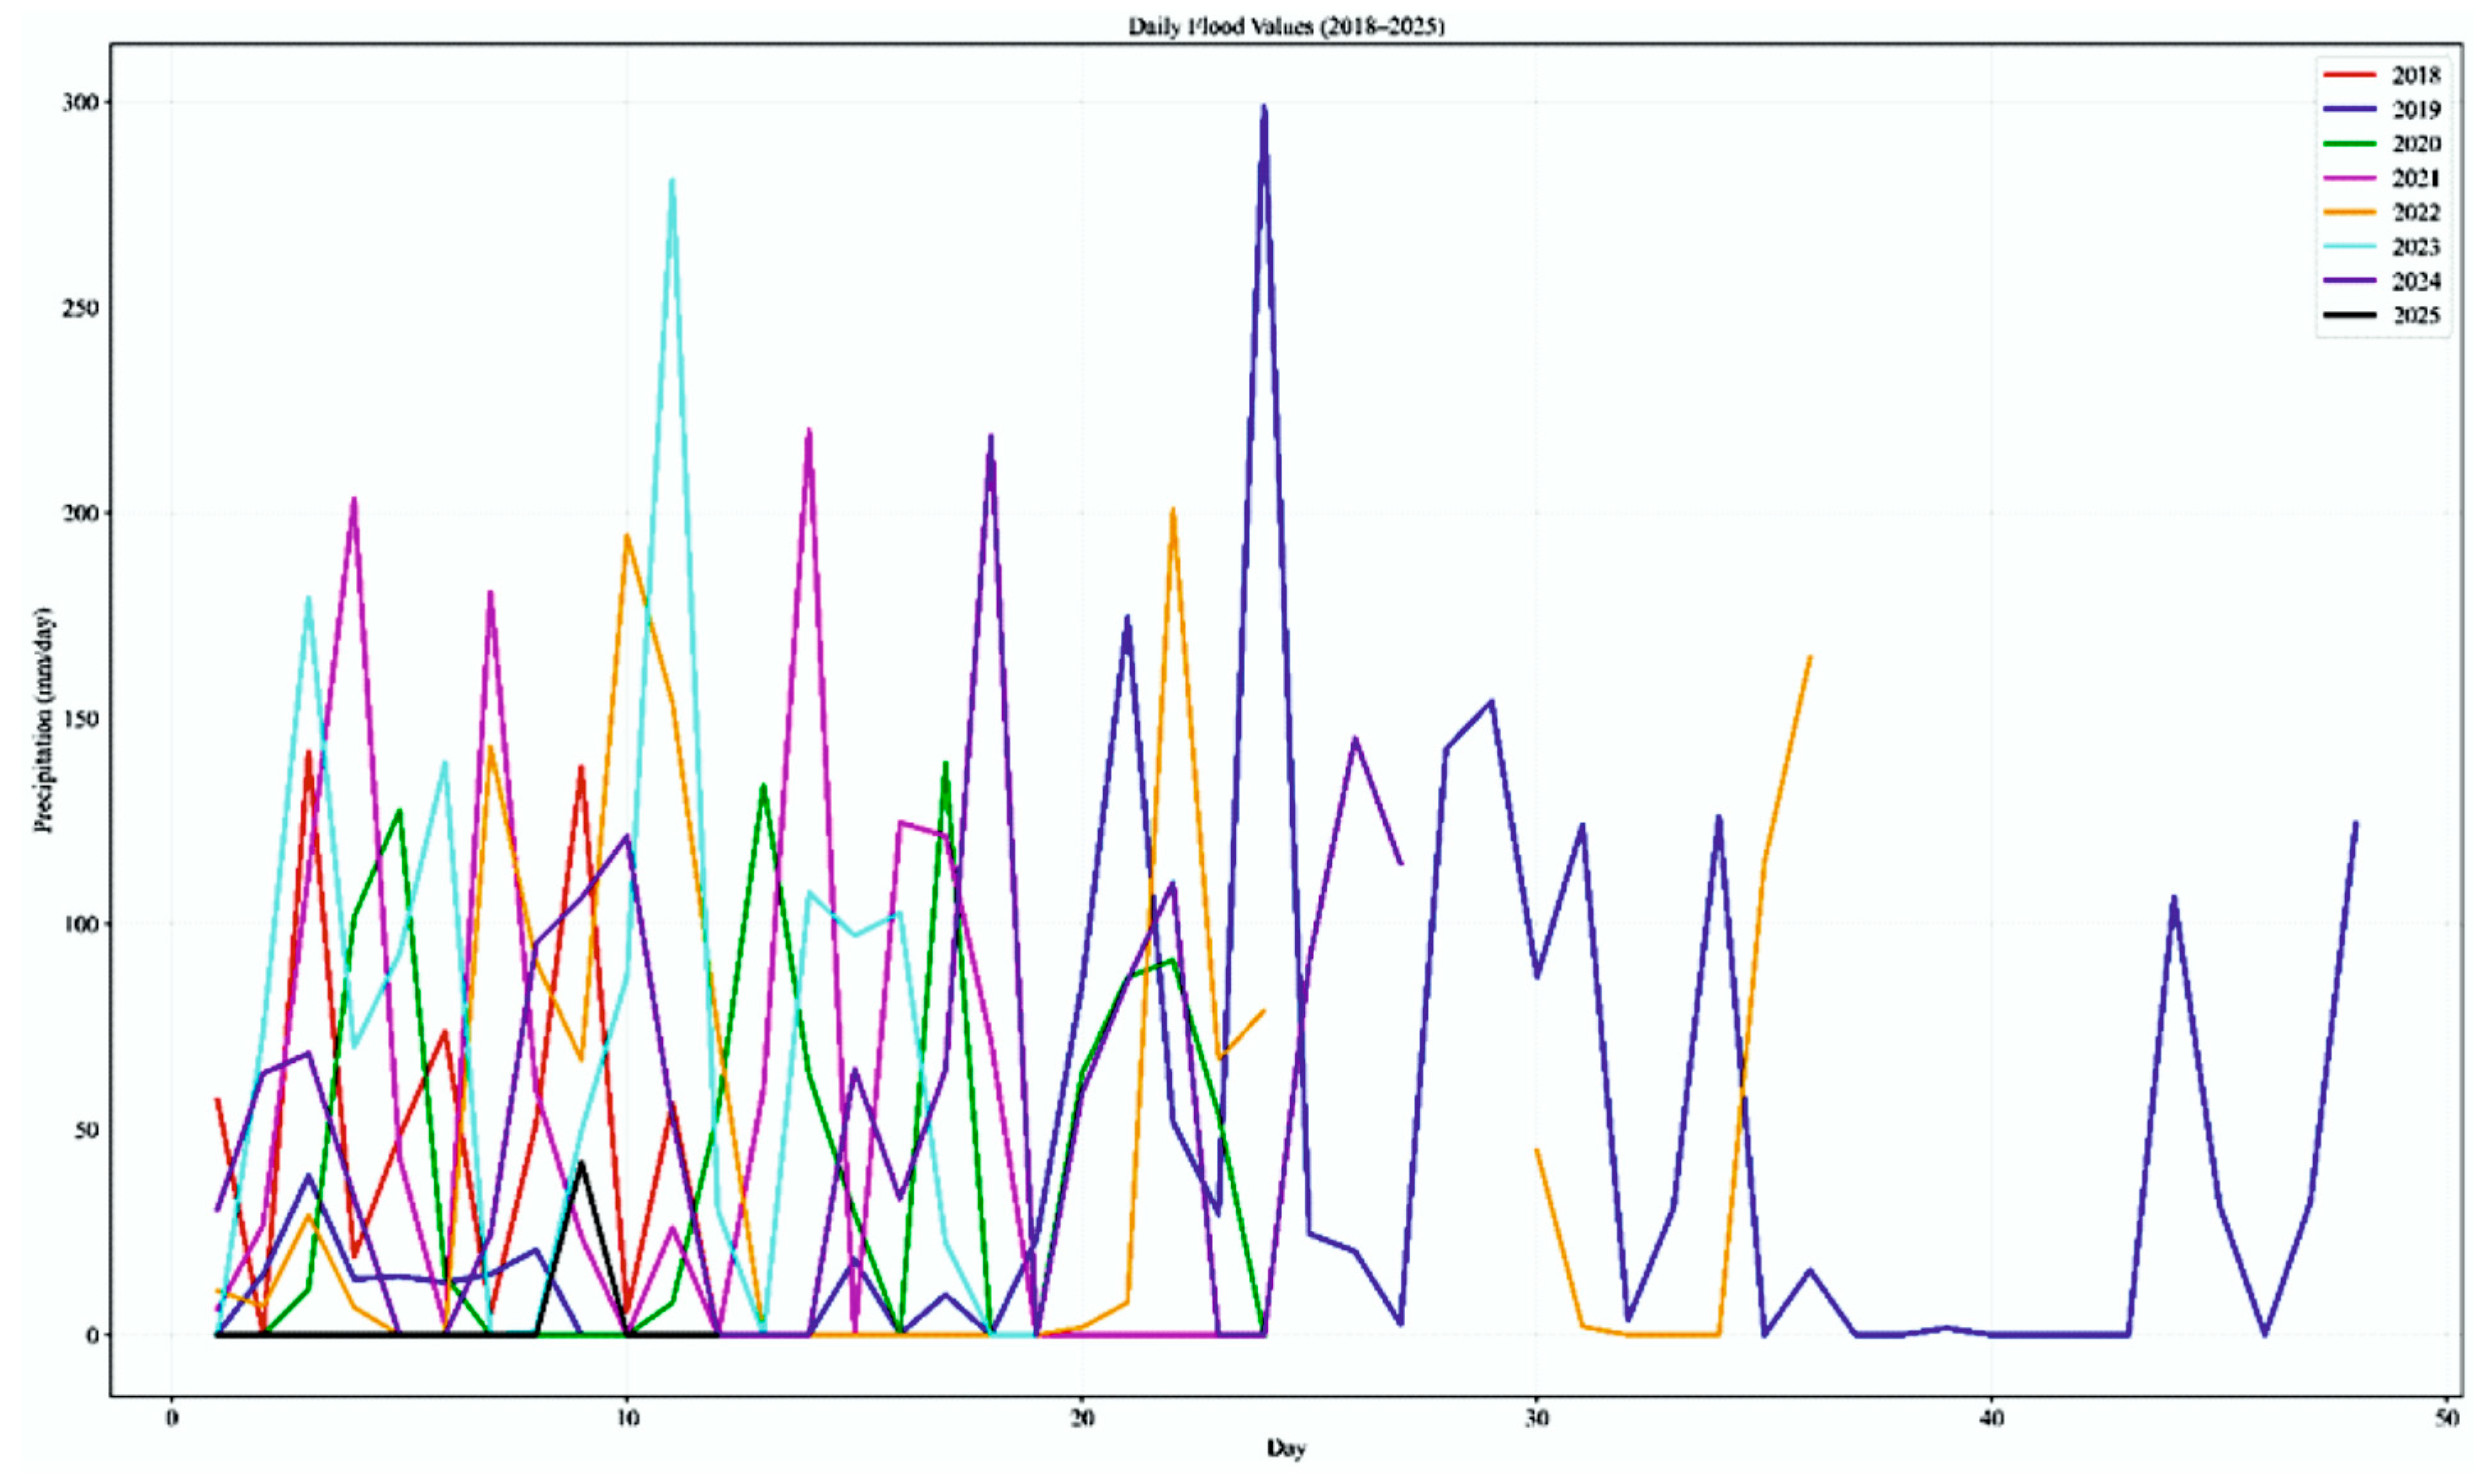
Daily precipitation patterns during the monsoon seasons from 2018 to 2025 are illustrated in Figure 11. Years exhibiting larger flood extents, particularly 2020, 2023, and most prominently 2024, coincide with multiple extreme rainfall events exceeding 250 mm day−1, indicating the role of short-duration, high-intensity rainfall in triggering urban flooding. It is important to note that the rainfall curves shown in Figure 11 are not continuous. This is because the analysis only includes rainfall observations corresponding to active flood periods, specifically pre-flood, during-flood, and immediate post-flood days identified from SAR-based flood detection. Days without observed flooding were intentionally excluded to focus on rainfall conditions directly associated with inundation events. Although rainfall intensity in 2025 was comparatively lower than in 2024, several urban zones continued to exhibit localized inundation patterns during the selected flood-event periods, indicating spatial variability in flood persistence across the city.
Figure 11.
Plot showing daily rainfall during active flood periods (pre-flood, during-flood, and post-flood days) for monsoon seasons from 2018 to 2025. Note that rainfall curves are non-continuous because days without flood occurrence were excluded from the analysis.
3.5. Model Validation
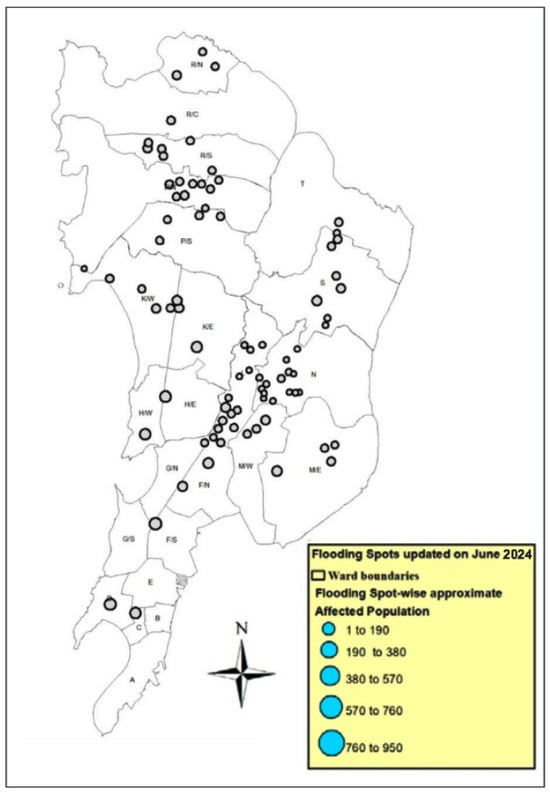
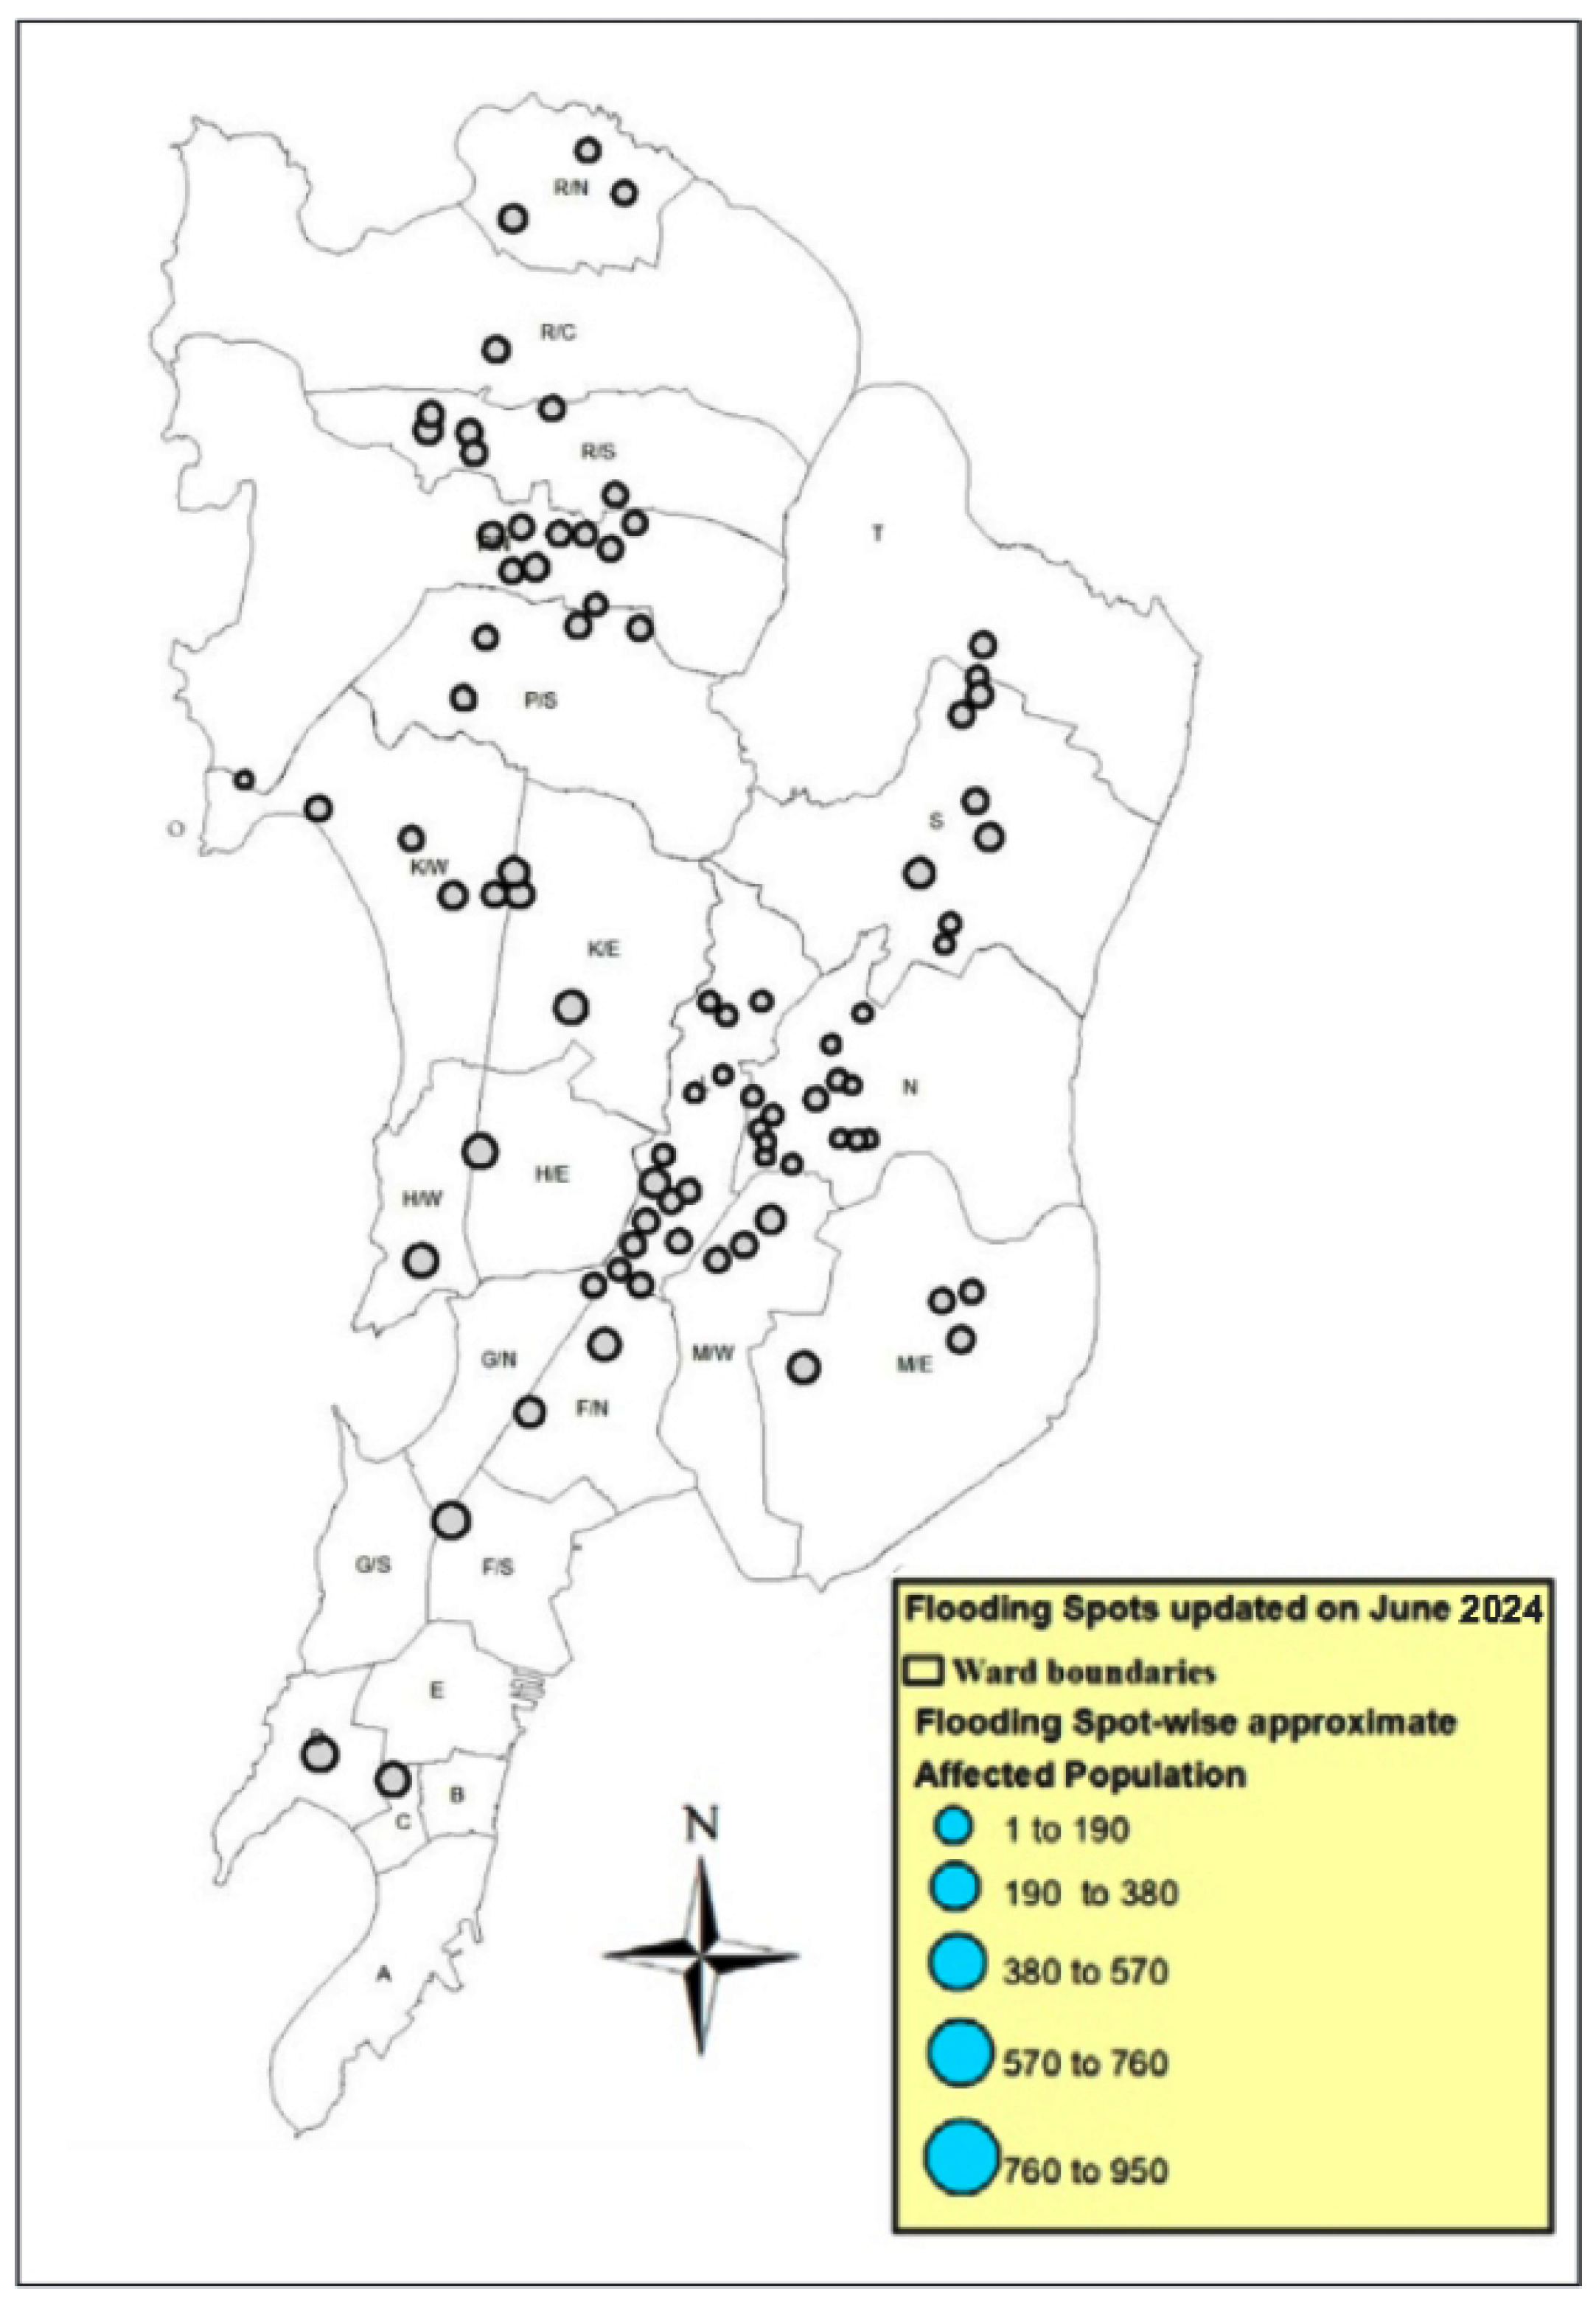
To assess the consistency of the SAR-derived flood mapping, this study cross-validated its findings using flood incident records from the Brihanmumbai Municipal Corporation (BMC) (Figure 12). The map highlight’s locations across Mumbai that repeatedly experience flooding, with circle sizes representing estimated population exposure. Notably, wards such as Chembur East (M/E), Chembur West (M/W), and Ghatkopar (N) showed substantial spatial overlap between SAR-detected flood zones and BMC-reported flood hotspots. Conversely, areas in the southern coastal region, including Colaba (A) and Byculla (E), which exhibited comparatively lower SAR backscatter anomalies, were also identified by BMC as having lower flood exposure. The observed spatial agreement between SAR-derived inundation patterns and municipal flood records indicates that the proposed methodology is capable of identifying major flood-prone zones across different urban settings in Mumbai.
Figure 12.
Map illustrates ward-level flooding hotspots updated as of June 2024 obtained from the BMC’s publicly available disaster management portal.
4. Discussion
The spatio-temporal analysis of urban flooding in Mumbai between 2018 and 2025 highlights a clear intensification in both flood frequency and magnitude. The total flooded area detected using VV polarization increased from approximately 93 km2 in 2018 to a peak of 152 km2 in 2024, representing an increase of about 63%, indicating a substantial escalation in urban flood exposure over the study period. Flooding has thus evolved from sporadic weather-induced disturbances into an annual recurring urban hazard. Central and northern wards such as Chembur West, Ghatkopar, Dahisar, and Matunga emerged as persistently affected zones, largely due to high built-up density, informal settlements, and aging drainage infrastructure. A notable observation was the persistence of flooding in 2025 despite lower cumulative rainfall compared to 2024, suggesting the influence of residual surface saturation and limited drainage recovery capacity. These outcomes are consistent with international studies linking urban morphology and hydrological bottlenecks to elevated flood risk in coastal zones [1,6]. In contrast, southern coastal wards such as Colaba and Marine Lines experienced relatively minor inundation, likely due to higher elevation gradients and better-engineered stormwater systems. This spatial heterogeneity underscores the critical role of topography and infrastructure resilience in shaping flood vulnerability and demonstrates that flood risk in Mumbai is driven not only by extreme events but also by long-term land-use transitions and drainage constraints.
Sentinel-1 SAR imagery proved to be a robust tool for detecting urban flooding under persistent monsoonal cloud cover, with VV polarization consistently delineating larger inundated areas than VH. In 2024, the flooded area derived from VV exceeded 150 km2, compared to only 67 km2 detected using VH, highlighting the superior sensitivity of VV polarization to smooth open-water surfaces in dense urban settings. This difference is primarily related to SAR backscatter behaviour, where flooded surfaces act as smooth reflectors that reduce radar return in VV polarization through specular reflection, thereby improving the contrast between water and surrounding urban surfaces. In contrast, VH polarization is more strongly affected by vegetation structure, double-bounce scattering, and surface roughness, which can reduce its sensitivity to shallow urban floodwater. Similar observations have been reported in previous SAR-based flood studies [49,50,51], which demonstrated that VV polarization generally performs better for open-water flood detection in urban and mixed land-cover environments. Beyond confirming findings from earlier studies, this work advances existing literature by providing a multi-year, ward-level quantification of flood intensification across an entire coastal megacity, rather than focusing on isolated flood events or single-year analyses. Validation against BMC flood incident records demonstrated strong spatial agreement in chronic hotspots such as Chembur East, Chembur West, and Ghatkopar, while low-exposure wards like Colaba and Byculla consistently showed minimal overlap, reinforcing the model’s spatial reliability in heterogeneous urban environments. The analysis also indicated that flood-prone wards shared common characteristics: dense impervious cover, limited pervious surfaces, and congested infrastructure, reinforcing the synergistic effect of land cover and drainage inefficiency [52,53]. Rainfall–flood relationship analysis further supports these findings. A statistically significant positive correlation (Pearson’s r = 0.72, p < 0.01) was observed between daily peak rainfall and total flooded area across the study years, confirming that short-duration, high-intensity rainfall events are a primary driver of urban inundation in Mumbai. Years with multiple extreme rainfall events, notably 2020, 2023, and 2024, corresponded closely with peak flood extents, while the 2025 event highlights the compounding effect of antecedent wetness and drainage inefficiency. This substantiates findings from other global urban basins where high-intensity, short-duration rainfall triggers flash flooding due to limited infiltration and rapid runoff accumulation [54,55]. The integration of multi-source geospatial data and ground validation presents a cost-effective and scalable methodology for flood hazard detection and risk planning in rapidly urbanizing regions.
Despite its significant contributions, the study faces certain limitations. The primary strength lies in the use of multi-temporal high-resolution Sentinel-1 SAR imagery, which allows for flood detection under cloud-covered monsoon conditions [56]. Furthermore, the integration of BMC data enhances the model’s operational credibility and relevance for urban governance. However, the inability to accurately estimate flood depth due to the absence of high-resolution DEMs, and the use of static built-up land layers without annual updates, may restrict detailed hydrodynamic insights. Additionally, Sentinel-1 SAR lacks capacity to capture flood duration and flow direction, critical parameters for evacuation planning and infrastructure design. Future studies should explore the integration of DEM-based hydrological modelling, real-time rainfall-runoff simulations, and socio-economic vulnerability layers for holistic risk assessment. Incorporating climate scenario-based simulations, especially under SSP pathways, can support adaptive infrastructure planning for long-term resilience.
5. Conclusions
This study has demonstrated the effectiveness of using multi-temporal Sentinel-1 SAR data, combined with automated geospatial thresholding techniques, to detect, monitor, and evaluate urban flooding across Mumbai between 2018 and 2025. The analysis revealed that VV polarization consistently detected larger flood extents than VH, indicating its greater sensitivity to surface water reflectance. The maximum flooded area reached 152 km2 in 2024 using VV polarization, while VH detected 67 km2 during the same event, highlighting the improved capability of VV for urban flood delineation. The peak inundation was observed in 2024, with extensive flooding across Chembur West (16.47 km2), Matunga (12.33 km2), and Ghatkopar, confirming these as recurring hotspots influenced by low elevation, dense impervious surfaces, and inefficient drainage infrastructure. Notably, in 2025, despite reduced rainfall, flooding persisted in central zones, highlighting the role of residual surface saturation and insufficient drainage response mechanisms.
The spatial trends in flood exposure highlighted that low-lying topographies, dense built-up areas, and ageing infrastructure were major contributing factors to repeated flood risks. In contrast, southern coastal wards like Colaba and Marine Lines experienced relatively lower inundation, likely due to their higher elevation gradients and more effective stormwater management systems. The integration of SAR-derived flood detection with municipal flood records from the Brihanmumbai Municipal Corporation (BMC) validated the reliability of this approach and confirmed its applicability in real-world urban flood risk assessments. A major contribution of this study is the development of a scalable and reproducible SAR-based urban flood mapping framework that integrates automated thresholding, rainfall analysis, and ward-level flood assessment for long-term monitoring of flood-prone coastal cities. These results offer data-driven insights that can support urban planning, infrastructure upgrading, and disaster mitigation, especially under the mounting pressures of climate-driven rainfall extremes. From a global perspective, this research provides a replicable and cost-effective model for flood monitoring in rapidly urbanizing coastal megacities, many of which face similar infrastructural and climatic challenges.
Author Contributions
G.P.: Software, analysis, validation, formal analysis, investigation, writing, original draft preparation; K.J. and S.K.S.: Conceptualization, Supervision, investigation, methodology, software, analysis, writing, original draft preparation and review and editing. K.K.B.A.: Conceptualization, Supervision, investigation, methodology, software, analysis, Funding Acquisition, and review and editing. All authors have read and agreed to the published version of the manuscript.
Funding
This research received no external funding.
Data Availability Statement
Data will be available upon request.
Acknowledgments
The authors wish to express their gratitude to the various national and international organizations that provided the essential data for this research. We acknowledge the European Space Agency (ESA) and the Copernicus Open Access Hub for providing the Sentinel-1 SAR imagery, as well as the ESA for the SNAP software used in processing. We thank the Joint Research Centre (JRC) for the Global Surface Water Seasonality dataset. We acknowledge NASA and the USGS for providing the digital elevation model (DEM) data, and the University of California, Santa Barbara Climate Hazards Group (UCSB-CHG) for the CHIRPS precipitation dataset. KJ, GP, and SKS express their sincere gratitude to the Central University of Jharkhand for providing the necessary laboratory facilities and support for this research.
Conflicts of Interest
The authors declare no competing interests.
Abbreviations
The following abbreviations are used in this manuscript:
| UNDRR | United Nations Office for Disaster Risk Reduction |
| SAR | Synthetic Aperture Radar |
| BMC | Brihanmumbai Municipal Corporation |
| GSWS | Global Surface Water Seasonality |
| DEM | Digital Elevation Model |
References
- Avashia, V.; Garg, A. Implications of Land Use Transitions and Climate Change on Local Flooding in Urban Areas: An Assessment of 42 Indian Cities. Land Use Policy 2020, 95, 104571. [Google Scholar] [CrossRef] [Scilit]
- Rosenzweig, B.R.; Herreros Cantis, P.; Kim, Y.; Cohn, A.; Grove, K.; Brock, J.; Yesuf, J.; Mistry, P.; Welty, C.; McPhearson, T.; et al. The Value of Urban Flood Modeling. Earth’s Future 2021, 9, e2020EF001739. [Google Scholar] [CrossRef] [Scilit]
- Amellah, O.; El Morabiti, K.; Maftei, C.; Papatheodorou, C.; Buta, C.; Bounab, A.; Ouchar Al-Djazouli, M. Topographic Indices and Two-Dimensional Hydrodynamic Modelling for Flood Hazard Mapping in a Data-Scarce Plain Area: A Case Study of Oued Laou Catchment (Northern of Morocco). Geocarto Int. 2022, 37, 13596–13617. [Google Scholar] [CrossRef] [Scilit]
- UNDRR. The Human Cost of Disasters: An Overview of the Last 20 Years (2000–2020); UNDRR: Geneva, Switzerland, 2023. [Google Scholar]
- IPCC. Climate Change 2022—Impacts, Adaptation and Vulnerability: Working Group II Contribution to the Sixth Assessment Report of the Intergovernmental Panel on Climate Change, 1st ed.; Cambridge University Press: Cambridge, UK, 2023. [Google Scholar]
- Li, Z.; Song, K.; Peng, L. Flood Risk Assessment under Land Use and Climate Change in Wuhan City of the Yangtze River Basin, China. Land 2021, 10, 878. [Google Scholar] [CrossRef] [Scilit]
- Ma, Y.; Cui, Y.; Tan, H.; Wang, H. Case Study: Diagnosing China’s Prevailing Urban Flooding—Causes, Challenges, and Solutions. J. Flood Risk Manag. 2022, 15, e12822. [Google Scholar] [CrossRef] [Scilit]
- Limthongsakul, S.; Nitivattananon, V.; Arifwidodo, S.D. Localized Flooding and Autonomous Adaptation in Peri-Urban Bangkok. Environ. Urban. 2017, 29, 51–68. [Google Scholar] [CrossRef] [Scilit]
- Marks, D.; Baird, I.G. The Urban Political Ecology of Worsening Flooding in Phnom Penh, Cambodia: Neopatrimonialism, Displacement, and Uneven Harm. Int. J. Disaster Risk Reduct. 2025, 118, 105229. [Google Scholar] [CrossRef] [Scilit]
- Akinsanola, A.A.; Singhai, P.; Taguela, T.N.; Folorunsho, A.H.; Adeyeri, O.E.; Morakinyo, T.E.; Adebiyi, A.A. A Review of Urban Resilience to Weather and Climate Extremes. City Built Environ. 2025, 3, 24. [Google Scholar] [CrossRef] [Scilit]
- Aziz, F.; Wang, X.; Mahmood, M.Q.; Awais, M.; Trenouth, B. Coastal Urban Flood Risk Management: Challenges and Opportunities—A Systematic Review. J. Hydrol. 2024, 645, 132271. [Google Scholar] [CrossRef] [Scilit]
- Deopa, R.; Thakur, D.A.; Kumar, S.; Mohanty, M.P.; Asha, P. Discerning the Dynamics of Urbanization-Climate Change-Flood Risk Nexus in Densely Populated Urban Mega Cities: An Appraisal of Efficient Flood Management through Spatiotemporal and Geostatistical Rainfall Analysis and Hydrodynamic Modeling. Sci. Total Environ. 2024, 952, 175882. [Google Scholar] [CrossRef] [Scilit] [PubMed]
- Mahmood, M.Q.; Wang, X.; Aziz, F.; Dogulu, N. Urban Flood Modelling: Challenges and Opportunities—A Stakeholder-Informed Analysis. Environ. Model. Softw. 2025, 191, 106507. [Google Scholar] [CrossRef] [Scilit]
- Trenberth, K. Changes in Precipitation with Climate Change. Clim. Res. 2011, 47, 123–138. [Google Scholar] [CrossRef] [Scilit]
- Cappelli, F.; Costantini, V.; Consoli, D. The Trap of Climate Change-Induced “Natural” Disasters and Inequality. Glob. Environ. Change 2021, 70, 102329. [Google Scholar] [CrossRef] [Scilit]
- Singer, M.E.; Rosenthal, A.; Shapira, S.; Natour, S.; Porat, I.; Negev, M. Exploring the Climate Change, Infrastructure, Health Nexus and Everyday Adaptation among Vulnerable Populations. Habitat Int. 2025, 164, 103535. [Google Scholar] [CrossRef] [Scilit]
- Singh, H.; Nielsen, M.; Greatrex, H. Causes, Impacts, and Mitigation Strategies of Urban Pluvial Floods in India: A Systematic Review. Int. J. Disaster Risk Reduct. 2023, 93, 103751. [Google Scholar] [CrossRef] [Scilit]
- Mohanty, S.; Swain, M.; Nadimpalli, R.; Osuri, K.K.; Mohanty, U.C.; Patel, P.; Niyogi, D. Meteorological Conditions of Extreme Heavy Rains over Coastal City Mumbai. J. Appl. Meteorol. Climatol. 2023, 62, 191–208. [Google Scholar] [CrossRef] [Scilit]
- Rana, A.; Foster, K.; Bosshard, T.; Olsson, J.; Bengtsson, L. Impact of Climate Change on Rainfall over Mumbai Using Distribution-Based Scaling of Global Climate Model Projections. J. Hydrol. Reg. Stud. 2014, 1, 107–128. [Google Scholar] [CrossRef] [Scilit]
- Tripathy, S.S.; Chaudhuri, S.; Murtugudde, R.; Mhatre, V.; Parmar, D.; Pinto, M.; Zope, P.E.; Dixit, V.; Karmakar, S.; Ghosh, S. Analysis of Mumbai Floods in Recent Years with Crowdsourced Data. Urban Clim. 2024, 53, 101815. [Google Scholar] [CrossRef] [Scilit]
- Islam, S.; Karipot, A.; Bhawar, R.; Sinha, P.; Kedia, S.; Khare, M. Urban Heat Island Effect in India: A Review of Current Status, Impact and Mitigation Strategies. Discov. Cities 2024, 1, 34. [Google Scholar] [CrossRef] [Scilit]
- Patil Suvarna Thakare, S. GIS and Remote Sensing as a Decision Support Tool for Analysis and Recommendations in Urban Flooding: A Case Study of Vasana Ward of Ahmedabad. Int. J. Sci. Res. 2024, 13, 552–558. [Google Scholar] [CrossRef] [Scilit]
- Radhakrishnan, S.; Duraisamy Rajasekaran, S.K.; Sujatha, E.R.; Neelakantan, T.R. A Comparative Study on 2015 and 2023 Chennai Flooding: A Multifactorial Perspective. Water 2024, 16, 2477. [Google Scholar] [CrossRef] [Scilit]
- Khatri, S.; Kokane, P.; Kumar, V.; Pawar, S. Prediction of Waterlogged Zones under Heavy Rainfall Conditions Using Machine Learning and GIS Tools: A Case Study of Mumbai. GeoJournal 2022, 88, 277–291. [Google Scholar] [CrossRef] [Scilit]
- Karmegam, D.; Ramamoorthy, S.; Mappillairaju, B. Near Real Time Flood Inundation Mapping Using Social Media Data as an Information Source: A Case Study of 2015 Chennai Flood. Geoenviron. Disasters 2021, 8, 25. [Google Scholar] [CrossRef] [Scilit]
- BMC. Disaster Management Plan 2022; Municipal Corporation of Greater: Mumbai, India, 2022. [Google Scholar]
- NIUA. Annual Report 2020–2021; National Institute of Urban Affairs: New Delhi, India, 2021. [Google Scholar]
- Zhang, Q.; Hu, X. Urban Flood Mapping by Fully Mining and Adaptive Fusion of the Polarimetric and Spatial Information of Sentinel-1 Images. Int. J. Appl. Earth Obs. Geoinf. 2024, 135, 104251. [Google Scholar] [CrossRef] [Scilit]
- Das, S.; Chatterjee, B.; Roy Choudhury, M.; Dutta, S.; Mondal, B.P.; Awasthi, A. Synthetic Aperture Radar for a Changing Planet: A 25-Year Global Synthesis in Hazard Assessment, Urban Development, and Ecological Applications. Ecol. Inform. 2025, 92, 103477. [Google Scholar] [CrossRef] [Scilit]
- Anusha, N.; Bharathi, B. Flood Detection and Flood Mapping Using Multi-Temporal Synthetic Aperture Radar and Optical Data. Egypt. J. Remote Sens. Space Sci. 2020, 23, 207–219. [Google Scholar] [CrossRef] [Scilit]
- Clement, M.A.; Kilsby, C.G.; Moore, P. Multi-temporal Synthetic Aperture Radar Flood Mapping Using Change Detection. J. Flood Risk Manag. 2018, 11, 152–168. [Google Scholar] [CrossRef] [Scilit]
- Schlaffer, S.; Matgen, P.; Hollaus, M.; Wagner, W. Flood Detection from Multi-Temporal SAR Data Using Harmonic Analysis and Change Detection. Int. J. Appl. Earth Obs. Geoinf. 2015, 38, 15–24. [Google Scholar] [CrossRef] [Scilit]
- Twele, A.; Cao, W.; Plank, S.; Martinis, S. Sentinel-1-Based Flood Mapping: A Fully Automated Processing Chain. Int. J. Remote Sens. 2016, 37, 2990–3004. [Google Scholar] [CrossRef] [Scilit]
- Tazmul Islam, M.; Meng, Q. An Exploratory Study of Sentinel-1 SAR for Rapid Urban Flood Mapping on Google Earth Engine. Int. J. Appl. Earth Obs. Geoinf. 2022, 113, 103002. [Google Scholar] [CrossRef] [Scilit]
- Zhuang, H.; Wang, P.; Hao, M.; Fan, H.; Tan, Z. Flood Inundation Mapping in SAR Images Based on Nonlocal Polarization Combination Features. J. Hydrol. 2025, 646, 132326. [Google Scholar] [CrossRef] [Scilit]
- Xu, Q.; De Vos, L.F.; Shi, Y.; Rüther, N.; Bronstert, A.; Zhu, X.X. Urban Flood Modeling and Forecasting with Deep Neural Operator and Transfer Learning. J. Hydrol. 2025, 661, 133705. [Google Scholar] [CrossRef] [Scilit]
- Berezowski, T.; Niemiec, S.; Chybicki, A. Floodsar: Automatic Mapping of River Flooding Extent from Multitemporal SAR Imagery. SoftwareX 2024, 26, 101717. [Google Scholar] [CrossRef] [Scilit]
- Lang, F.; Zhu, Y.; Zhao, J.; Hu, X.; Shi, H.; Zheng, N.; Zha, J. Flood Mapping of Synthetic Aperture Radar (SAR) Imagery Based on Semi-Automatic Thresholding and Change Detection. Remote Sens. 2024, 16, 2763. [Google Scholar] [CrossRef] [Scilit]
- Anees, S.A.; Mehmood, K.; Khan, W.R.; Sajjad, M.; Alahmadi, T.A.; Alharbi, S.A.; Luo, M. Integration of Machine Learning and Remote Sensing for above Ground Biomass Estimation through Landsat-9 and Field Data in Temperate Forests of the Himalayan Region. Ecol. Inform. 2024, 82, 102732. [Google Scholar] [CrossRef] [Scilit]
- Chen, J.; Chen, S.; Fu, R.; Li, D.; Jiang, H.; Wang, C.; Peng, Y.; Jia, K.; Hicks, B.J. Remote Sensing Big Data for Water Environment Monitoring: Current Status, Challenges, and Future Prospects. Earth’s Future 2022, 10, e2021EF002289. [Google Scholar] [CrossRef] [Scilit]
- Dhanabalan, S.P.; Abdul Rahaman, S.; Jegankumar, R. Flood Monitoring Using Sentinel-1 SAR Data: A Case Study Based on an Event of 2018 and 2019 Southern Part of Kerala. Int. Arch. Photogramm. Remote Sens. Spat. Inf. Sci. 2021, XLIV-M-3–2021, 37–41. [Google Scholar] [CrossRef] [Scilit]
- Febriansyah, M.N.; Bioresita, F.; Hayati, N. Analysis of Deformation and Flood Inundation Spatial Distribution Using Sentinel-1 SAR Data for The 2021 South Kalimantan Floods. In Proceedings of the IOP Conference Series: Earth and Environmental Science; IOP Publishing: Bristol, UK, 2024; Volume 1406, p. 012016. [Google Scholar] [CrossRef] [Scilit]
- Singha, C.; Rana, V.K.; Pham, Q.B.; Nguyen, D.C.; Łupikasza, E. Integrating Machine Learning and Geospatial Data Analysis for Comprehensive Flood Hazard Assessment. Environ. Sci. Pollut. Res. 2024, 31, 48497–48522. [Google Scholar] [CrossRef] [Scilit] [PubMed]
- Tikuye, B.G.; Ray, R.L.; Abeysingha, N.S.; Gurau, S. Integrating Multi-Criteria Decision Analysis and Geospatial Data for Flood Susceptibility Mapping in Texas, USA. Prog. Disaster Sci. 2025, 28, 100462. [Google Scholar] [CrossRef] [Scilit]
- MCGM. Mumbai City Development Plan; Brihanmumbai Municipal Corporation: Mumbai, India, 2019. [Google Scholar]
- NITI. Aayog India’s Housing Conundrum; NITI: New Delhi, India, 2020.
- UN-Habitat. World Cities Report 2022: Envisaging the Future of Cities; United Nations Human Settlements Programme: Nairobi, Kenya, 2022. [Google Scholar]
- Sansare, D.A.; Mhaske, S.Y. Storm Water Management of Mumbai City by Using Pervious Concrete on GIS Based Platform. Int. J. Recent Technol. Eng. 2019, 8, 4400–4406. [Google Scholar] [CrossRef] [Scilit]
- Garg, S.; Dasgupta, A.; Motagh, M.; Martinis, S.; Selvakumaran, S. Unlocking the Full Potential of Sentinel-1 for Flood Detection in Arid Regions. Remote Sens. Environ. 2024, 315, 114417. [Google Scholar] [CrossRef] [Scilit]
- Kandus, P.; Karszenbaum, H.; Pultz, T.; Parmuchi, G.; Bava, J. Influence of Flood Conditions and Vegetation Status on the Radar Backscatter of Wetland Ecosystems. Can. J. Remote Sens. 2001, 27, 651–662. [Google Scholar] [CrossRef] [Scilit]
- Martinis, S.; Rieke, C. Backscatter Analysis Using Multi-Temporal and Multi-Frequency SAR Data in the Context of Flood Mapping at River Saale, Germany. Remote Sens. 2015, 7, 7732–7752. [Google Scholar] [CrossRef] [Scilit]
- Bibi, T.S.; Reddythta, D.; Kebebew, A.S. Assessment of the Drainage Systems Performance in Response to Future Scenarios and Flood Mitigation Measures Using Stormwater Management Model. City Environ. Interact. 2023, 19, 100111. [Google Scholar] [CrossRef] [Scilit]
- Löwe, R.; Urich, C.; Sto Domingo, N.; Mark, O.; Deletic, A.; Arnbjerg-Nielsen, K. Assessment of Urban Pluvial Flood Risk and Efficiency of Adaptation Options through Simulations—A New Generation of Urban Planning Tools. J. Hydrol. 2017, 550, 355–367. [Google Scholar] [CrossRef] [Scilit]
- Cao, W.; Zhou, Y.; Güneralp, B.; Li, X.; Zhao, K.; Zhang, H. Increasing Global Urban Exposure to Flooding: An Analysis of Long-Term Annual Dynamics. Sci. Total Environ. 2022, 817, 153012. [Google Scholar] [CrossRef] [Scilit]
- Wan Mohtar, W.H.M.; Abdullah, J.; Abdul Maulud, K.N.; Muhammad, N.S. Urban Flash Flood Index Based on Historical Rainfall Events. Sustain. Cities Soc. 2020, 56, 102088. [Google Scholar] [CrossRef] [Scilit]
- Kumar, S.; Parida, B.R.; Basheer Ahammed, K.K. Flood risk assessment of the Kosi River basin in North Bihar using Synthetic Aperture Radar (SAR) data and AHP approach. Nat. Hazards Res. 2025, 5, 618–632. [Google Scholar] [CrossRef] [Scilit]

Disclaimer/Publisher’s Note: The statements, opinions and data contained in all publications are solely those of the individual author(s) and contributor(s) and not of MDPI and/or the editor(s). MDPI and/or the editor(s) disclaim responsibility for any injury to people or property resulting from any ideas, methods, instructions or products referred to in the content. |
© 2026 by the authors. Licensee MDPI, Basel, Switzerland. This article is an open access article distributed under the terms and conditions of the Creative Commons Attribution (CC BY) license.