


Abstract
Togolese agriculture is vulnerable to climate variability. In this context, this study aims to analyze the seasonal variability of climatic parameters and its effects on food production in the western Plateaux region. To achieve this, climatic data (from stations in Agou-Gare, Adéta, Amou, Badou, Kouma Konda, and Atakpamé) and agricultural data (yields, production, and areas of maize, rice, cowpea, cassava, and yam) from 1991 to 2020 were processed using RStudio 4.4.0. A methodology integrating both daily rainfall and changes in available soil water (ASW) was used to determine the rainy seasons and their durations. Seasonal rainfall totals were used to analyze spatial variability. Finally, an ordinary least squares (OLS) regression model with a threshold of 10% was used to assess the effect of climate parameters on food production. The results reveal a transition from a bimodal rainfall regime to a monomodal regime, characterised by a dry season of 4–5 months and a rainy season of 7–8 months. This transition is accompanied by an increase in temperatures ranging from 24.69 °C to 34.7 °C. The results also reveal an uncertain start to the long rainy season (early or late), an extension of the short season and dry spells lasting between 11 and 34 days that affect crops. Finally, spatial variability in precipitation remains significant during the long rainy season. Agroclimatic analysis reveals that maximum temperature positively influences cowpea yields (p = 0.0079) but negatively influences cassava (p = 0.00013) and rice (p = 0.050) yields. These results could inform the development of effective adaptation strategies tailored to this environment, helping to maintain and increase food production in the context of climate change.
1. Introduction
Climate change is a threat worldwide [1]. Climate change, characterized by long-term changes in weather patterns, has generated strong climate variability across the world, with differentiated effects across regions and economic sectors [2]. These changes have major repercussions for global agricultural systems, weakening food production and supply chains essential to food security [3]. In Africa, this situation is even more critical. According to the report by the Food and Agriculture Organization of the United Nations [4], the continent is facing an increase in extreme weather events, affecting crop yields. Climate variability is disrupting traditional agricultural calendars, reducing yields, and exacerbating the vulnerability of smallholder farmers [5].
In West Africa, agriculture is a major issue in terms of economic weight, employment, income source, food security, and regional integration [6]. It is predominantly traditional and rain-fed agriculture, dependent on climatic conditions. Climate change has a significant impact on crop yields in sub-Saharan Africa [7]. According to the Intergovernmental Panel on Climate Change [2] report, agricultural systems in West Africa are highly vulnerable to increasing climate hazards, including rainfall variability and rising average temperatures. These hazards compromise crop stability, thereby exacerbating food insecurity. This climate instability undermines prospects for sustainable rural development and increases the dependence of populations on food aid.
Agriculture plays an important role in the Togolese economy. It ensures food security for Togolese people; it represents on average 38% of national wealth; it provides a livelihood for two-thirds of the working population and offers the greatest opportunities to accelerate growth, create jobs, contribute to increasing the trade balance and the development of the agro-industry [8]. This type of agriculture is characterized by primarily subsistence production. Subsistence crops in Togo represent 70% of all crops produced [9]. Food crops such as maize, rice, cowpeas, cassava, and yams remain the most consumed and are part of the daily diets of most of the population [10]. Like other countries in the sub-region, Togo is experiencing the increasing effects of climate variability. In recent years, food production has been unstable and low. According to Togo’s Fourth National Communication on Climate Change [11], maize, rice, and yam yields have declined significantly due to droughts and rainfall fluctuations. This is paradoxical given that Togo is a country that should have favorable conditions for the development of food crops. Many factors influence agricultural productivity, but climatic variations are increasingly becoming a major determinant in rainfed agricultural systems.
The western part of the plateau region in southern Togo is a food production area. Agriculture is the main source of income for more than 60% of the population [12]. It enjoys an equatorial climate with a long rainy season (March to July), a short dry season (July to August), a short rainy season (September to November) and a long dry season (November to March) [12]. The soil in the western part of the Plateaux region consists mainly of ferralitic and tropical ferruginous soils, as well as poorly developed erosion soils. These soils are suitable for growing food crops such as corn, rice, cowpeas, yams and cassava [13]. In this area, which is a key agroecological zone in Togo, food production relies mainly on rain-fed crops. Fieldwork indicates that maize, cowpeas, yams and cassava are cultivated during the two rainy seasons. However, maize, yams and cassava are cultivated more extensively during the long rainy season, whereas cowpeas are cultivated more extensively during the short rainy season. Rice is only grown during the short rainy season, except in one village where it is grown during both rainy seasons thanks to an irrigated site
Togo’s Fourth National Communication on Climate Change [11] highlights the progressive degradation of climatic conditions, which is disrupting agriculture in this area. These conditions compromise agricultural yields and undermine the resilience of subsistence farms, which are often family-run and have low levels of mechanisation.
According to [14], the western part of the Plateaux region has undergone a significant climatic shift characterised by the spread of the tropical climate to this area, which was previously classified as sub-equatorial. Although climate variability is a reality in Togo, as highlighted by [15,16,17,18,19,20] and other authors, existing studies have not precisely defined the rainy seasons by incorporating available soil water, nor have they systematically compared the different responses of five major food crops (including yams and cassava) to climatic parameters. It is therefore important to study seasonal variability and its effects on food production (maize, rice, cowpea, cassava, and yam) in the western plateau region. This research analyzed the effects of seasonal variability on food production in order to identify the climatic factors that impact food production in the study area and find solutions to cope with the effects of climate hazards. The results of the study will enable public and local authorities to develop effective adaptation strategies tailored to this environment in order to maintain and increase food production despite the effects of climate variability and thus meet the food needs of the population, especially in urban areas. The overall objective of the study is to analyze the effects of seasonal variability on the production of maize, rice, cowpeas, cassava, and yams in the western part of the Plateaux Region. The following secondary objectives stem from this general objective:
- -
- Analyze the seasonal variability of the climate in the western part of the Plateaux region in Togo from 1991 to 2020.
- -
- Determine the effect of this seasonal variability on food production in this region.
2. Materials and Methods
2.1. Study Area
Located in southwestern Togo’s Plateaux Region, the western part of the Plateaux Region is a productive area. It enjoys a sub-equatorial climate similar to that of Guinea, with two dry seasons and two rainy seasons conducive to agricultural production. Figure 1 shows the western Plateaux Region in its regional configuration and the surrounding areas.
Figure 1.
Geographical location of the western part of the plateau region According to Figure 1, The western part of the Plateaux region is located in southwestern Togo, in the Plateaux region within an area between 6°30′ and 8°00′ north latitude and between 0°30′ and 1°10′ east longitude. It is bordered to the north by the central region, to the west by Ghana, to the east by the eastern part of the plateau region, and to the south by the maritime region. Administratively, the study area comprises seven prefectures: Agou, Kloto, Kpélé, Danyi, Amou, Wawa, and Akébou [21]. It covers an area of 7509.8 km2, representing 43.13% of the area of the Plateaux region or 13.26% of the national territory.
2.2. Materials and Methods
In the context of this study, the methodology is based on literature review, data collection and data processing.
2.2.1. Documentary Research
A review of theses and dissertations from the Central Library, the Agronomy Library and the Laboratory for Research on the Dynamics of Environments and Societies (LARDYMES) at the University of Lomé focused on the influence of climate change on agricultural production and the solutions proposed to address its effects. These documents were useful for understanding the impact of climate change on agricultural production in Togo. Online publications provided insight into studies examining the effects of climate change on agricultural production in general and food production in particular in Africa and worldwide. This research also provided insight into studies focusing on the Plateau region. These various online resources yielded abundant information on the effects of climate variability on food production, helping us to better define the scope of this research. The literature review was complemented by data collection.
2.2.2. Data Collection
Data collection was carried out by drawing up production areas to be studied and collecting climatic and agricultural data.
- Sampling of production areas
To cover the entire region and ensure adequate representation, the choice was made to focus on the prefectures in the west of the Plateaux region, which produce more maize, rice, cowpeas, cassava and yams. According to food production data by prefecture in the western part of the Plateaux region, collected by the Directorate of Agricultural Statistics, Information Technology and Documentation in Togo (DSID) over 34 years (1990–2023), are presented in Table 1.
Table 1.
Distribution of food production by prefecture in the western Plateaux region in 1990 and 2023.
Table 1 shows that, between 1990 and 2023, the Agou prefecture in the western part of the Plateaux region ranked first for yam production with 21.29% of the total, while the Kpélé prefecture ranked first for rice production with 23.59%. The Amou prefecture was the leading producer of maize and cowpeas in the area, accounting for 24.13% and 31.14% of total production respectively. The Wawa prefecture led in cassava production with 27.92% of the total. Therefore, the Agou prefecture was selected for yams, the Kpélé prefecture for rice, the Amou prefecture for maize and cowpeas, and the Wawa prefecture for cassava. The choice of markets was based on purposive non-probability sampling, targeting the main towns in each prefecture. These were Agou-Gadzépé in the Agou prefecture, Adéta in the Kpélé prefecture, Amou-Oblo in the Amou prefecture and Badou in the Wawa prefecture.
- Climate data
The climate data used in this study were provided by the National Meteorological Agency of Togo (ANAMET). These data include temperature readings from the Kouma Konda and Atakpamé synoptic stations, and rainfall readings from the Agou-Gare, Adéta, Amou and Badou rain gauge stations, covering the period 1991–2020. These data were used to perform a quantitative statistical analysis highlighting the seasonal variability of the climate in the study area and its impact on food production.
- Agricultural data
The agricultural data were collected from the Directorate of Agricultural Statistics, Information and Documentation (DSID). These data concern maize yields, production and cultivated areas in the Amou prefecture; rice yields, production and cultivated areas in the Kpélé prefecture; cowpea yields, production and cultivated areas in the Amou prefecture; cassava yields, production and cultivated areas in the Wawa prefecture; and yam yields, production and cultivated areas in the Agou prefecture, for the period 1991–2020. This information enabled the evolution of food production in the western part of the Plateaux region to be analysed, as well as the impact of climate variability on this production.
2.2.3. Data Processing
- ➢
- Climate data processing
Rainfall data from the rain gauge stations of Agou, Kpélé, Amou, and Wawa, along with temperature data from the synoptic stations of Kouma Konda and Atakpamé for the period 1991–2020, were processed using RStudio 4.4.0. Temperatures from Kouma Konda, the station closest to Agou and Kpélé, were used to analyze the thermal variability of these two prefectures, while those from Atakpamé were used to study that of Amou and Wawa. The rainfall data were used to calculate the standard deviation and determine the length of seasons over 30 years, in order to characterize seasonal variability and assess its influence on food production.
Missing data from rain gauge stations was supplemented using ANAMET’s merging technique. This method involves downloading CHIRPS satellite data corresponding to the coordinates of the relevant areas. According to the IRI ENACTS project in Colombia, CHIRPS precipitation data has a spatial resolution of approximately 0.05° × 0.05° (5 km × 5 km). This means that each pixel represents an area of approximately 5 km2. This resolution forms the spatial basis for merging: the point observations from ANAMET stations are merged into this 5 km grid. Climate Data Tools (CDT) software (version 8.0) offers precise settings that control how station data contributes to the satellite grid. The CDT software then defines the maximum distance around each CHIRPS grid within which it will search for stations to use for interpolation or correction of the satellite value. Fusion is performed using the land station closest to the location for which data is unavailable and for which satellite data is to be corrected. Prior to fusion, the temporal resolution of the two datasets must be harmonised, since CHIRPS data can be daily, pentad, decadal or monthly. The final merged product generally retains the spatial resolution of 0.05° of CHIRPS. The result is a precipitation grid that combines CHIRPS’ globally consistent satellite signals with accurate local observations from stations.
Methodology for Determining Rainy Seasons and Calculating Their Duration
The determination of rainy seasons relies on a methodology adapted from Sivakumar (cited by [22]), integrating both daily rainfall and changes in soil water capacity (WWC). The data used are daily rainfall series, associated with their dates.
The useful reserve (UR)
It is defined as the maximum capacity of water usable by plants in the soil. It is fixed at 60 mm and is simulated daily according to the following relationship:
where the daily ETP is assumed to be constant at 4 mm/day [23].
The areas studied have four seasons: major rainy season, minor rainy season, major dry season and minor dry season.
Defining key dates
- -
- Start of the main season (DDS_Main):
From 15 March, the first day where rainfall is greater than or equal to 20 mm (in one day or cumulative total of two days), without a dry period exceeding 10 days in the following 30 days.
- -
- End of the main season (DFS_Main):
From 15 July, the first date on which the RU becomes zero.
If the RU remains positive until the short season, the end corresponds to the beginning of the latter.
- -
- Start of the short season (DDS_Petite):
From 15 August, the first day when rainfall is greater than or equal to 10 mm (in one day or cumulative over two days).
- -
- End of the short season (DFS_Petite):
From 1 November, the first date on which the RU becomes zero.
Calculating durations
For each year, the duration of each rainy season is defined by the difference between the corresponding end date and start date.
This approach makes it possible to identify potential shifts in growing seasons and to detect disruptions related to dry spells. Since meteorological data alone are insufficient to assess the impact of climate variability on food production, agricultural data were also integrated into the analysis.
Agricultural data processing
Data on the yields of corn, rice, cowpeas, cassava and yams for the period 1991–2020 were analysed using RStudio 4.4.0 software. Descriptive statistics and ordinary least squares (OLS) linear regression models were combined to assess the effect of precipitation (Pcp) and maximum temperature (Tx) on agricultural yields. Diagnostic tests were applied to each model, including the Shapiro–Wilk test to check that the residuals were normally distributed and the Breusch–Pagan test to check that the residuals were homoscedastic.
Missing data were only observed in the rice and yam yield series, representing 16.67% of each complete series. These missing values were automatically excluded during the OLS model estimation process. All model results, along with the associated diagnostics, are presented in the corresponding crop-specific tables.
3. Results
3.1. Seasonal Variability of Climatic Parameters in the Western Plateau Region from 1991 to 2020
The study of seasonal climate variability is essential because it affects the calendar and agricultural production.
3.1.1. Evolution of Rainfall and Temperature in the Western Part of the Plateaux Region of Togo from 1991–2020
The western part of the Plateaux region is a climatic transition zone that previously enjoyed a bimodal equatorial climate with two dry seasons and two rainy seasons [24]. Figure 2 shows the evolution of rainfall and temperature from 1991 to 2020 in the western Plateaux region, based on data from two synoptic stations (Kouma Konda and Atakpamé).
Figure 2.
Ombrothermic curve of the Kouma Konda (a) and Atakpamé (b) stations.
Figure 2 shows the ombrothermic diagram for the western part of the Plateaux region, displaying the ecologically rainy and dry months. Figure 2 displays the ombrothermic curves for the synoptic stations of Kouma-Konda (Figure 2a) and Atakpamé (Figure 2b) from 1991 to 2020. At Kouma-Konda, two seasons are observed: a dry season and a rainy season. The dry season runs from November to February and the rainy season from March to October. The wettest months are June, July, September and October, with rainfall totals of 199.6 mm, 177.1 mm, 212.5 mm and 182.4 mm respectively. Monthly rainfall totals vary from 20.26 mm in January to 228.71 mm in September. The average annual rainfall total for the study period is 1430.1 mm. Average monthly temperatures range from 27.7 to 34.7 °C. March is the hottest month, with an average temperature of 34.8 °C. The average annual temperature over the same study period is 31.5 °C. At the Atakpamé station, average monthly rainfall varies from 6.38 mm to 217.16 mm. There are two seasons: a dry season from November to March, and a rainy season from April to October. July, August and September are the wettest months, with respective rainfall totals of 217.2 mm, 195.8 mm and 192.0 mm. The total average annual rainfall over the study period is 1283.8 mm. Average monthly temperatures range from 24.69 to 29.04 °C, with a maximum of 29.0 °C in February. The average annual temperature is 26.9 °C.
The alternation of these two seasons regulates food production in the area. Indeed, the seasonal change in climatic parameters, characterised by a single-mode rainfall pattern and relatively high temperatures, weakens the growing season and consequently reduces food production in the area.
3.1.2. Characterization of the Beginning and End of the Rainy Season in the Western Part of the Plateau Region
Determining the start and end dates of the rainy season is fundamental in characterizing the seasonal variability of the western plateau region.
Characterization of the Beginning and End of the Rainy Season in the Prefecture of Agou
Defining the start and end of the rainy season emphasises the temporal dynamics of the seasonal calendar, particularly the variability of the dates. Figure 3 illustrates the evolution of the start and end dates of the major and minor rainy seasons in the Agou prefecture over a 30-year period (1991–2020).
Figure 3.
Interannual variability of the start and end dates of the long rainy season (a) and the short rainy season (b) in the Agou prefecture from 1991 to 2020.
According to Figure 3, the main rainy season (Figure 3a) begins between mid-March and the end of June (15 March and 24 June), with an average start date of the end of March. Analysis of the start date of the main rainy season in the Agou Prefecture reveals significant variability from year to year. This variability is characterised by an early start to the rainy season in some years (e.g., 15 March 1991, 15 March 2005 and 15 March 2018), while in others it starts later (as late as 2 June 1992, 2 June 1999 and 18 May 2010). This indicates uncertainty in the actual onset of the rainy season. This variation may be due to the effect of climate variability, which alters rainfall patterns and influences seasonal phenology. In contrast, the end date of the main rainy season shows relative stability over the studied period. End dates generally fall between 24 June and 13 August, with a significant concentration around mid-July to early August. This demonstrates a certain stability in the end-of-season calendar, despite some years having longer or shorter seasons.
Analysis of the short rainy season (Figure 3b) shows that it generally begins between mid-August and early September. The start of this season is relatively consistent, peaking around 20 August. However, there are a few exceptions, such as a late start to the rainy season in September (e.g., in 1998, 2001, 2011, 2013, 2015 and 2016), which indicates instability at the beginning of the season. The end of the short rainy season shows a more pronounced trend towards variability, with interannual variation in the end-of-season date ranging from early November to early December. In recent years (2017, 2019 and 2020), the season has sometimes ended as late as the end of December (e.g., 29 December 2019), suggesting an extension of the short rainy season or a shift in the rainfall pattern towards the end of the year. This increasing trend in the end-of-season date indicates a notable lengthening of the short rainy season in the Agou Prefecture, which may be due to the direct effect of climate variability, particularly in the form of a shift in the rainfall pattern towards the end of the year.
Characterization of the Beginning and End of the Rainy Season in the Kpélé Prefecture
To better appreciate the changes affecting the rainfall calendar, Figure 4 illustrates the variations in the start and end dates of the rains during the long and short rainy seasons in the Kpélé prefecture.
Figure 4.
Interannual variability of the start and end dates of the long rainy season (a) and the short rainy season (b) in the Kpélé prefecture from 1991 to 2020.
Analysis of the start and end dates of the rainy seasons in the Kpélé Prefecture between 1991 and 2020 (Figure 4) reveals significant variability from year to year, particularly for the main rainy season. This season typically begins between mid-March and early May, though in some years it starts very late (e.g., late May 2010 and May 2014, and early June 2016), or very early (e.g., mid-March 1992, mid-March 2001, mid-March 2002 and mid-March 2003). This means that the onset of the rains necessary for the start of the agricultural season is occurring later and later, which compromises planting and thus increases the risk of water stress at the beginning of the season. The end remains relatively stable, usually oscillating between late July and mid-August, with seasons sometimes being shortened (mid-July 1994 and mid-July 2004) or prolonged (late August 2006 and August 2011).
A shorter season exhibits greater stability, typically beginning around mid-August and ending between early and mid-November. However, some years show notable variations, such as ending as early as 1 November or extending into early December. These irregularities likely reflect the influence of climate variability, particularly after 2010, when the dates became more unpredictable.
Characterization of the Beginning and End of the Rainy Season in the Amou Prefecture
In order to characterize the variability of the seasonal rainfall regime in the Amou prefecture, Figure 5 shows the start and end dates of the major season (a) and the minor season (b) over the period 1991–2020.
Figure 5.
Interannual variability of the start and end dates of the long rainy season (a) and the short rainy season (b) in the Amou prefecture from 1991 to 2020.
Figure 5 illustrates the characteristics of the agricultural seasons in the commune of Amou between 1991 and 2020. Examination of this figure reveals significant temporal variability. The main season usually begins between mid-March and early April, though it sometimes starts earlier (mid-March 1995, mid-March 1997, mid-March 2001, mid-March 2002, mid-March 2011 and mid-March 2013) or later (early May 1993, early May 2012 and early May 2018). It usually ends between late July and mid-August, though it can occasionally extend to the end of August (in 2012 and 2015), or end early around mid-July (in 1995, 2004 and 2018). This variability in the timing of the season tends towards a gradual shift to later dates, while the end remains generally stable around mid-August. This suggests a potential reduction in the effective length of the season. A late start to the main season can compromise crops by reducing their optimal growing period.
In contrast, the shorter season is more regular and generally begins around mid-August. However, there are notable variations in some years, such as in early September in 2002, 2013 and 2015. It mainly ends between early and mid-November, sometimes extending into December (in 2005 and 2019). This trend reflects a gradual lengthening of the shorter season. The lengthening of the season could have significant implications for certain short-cycle crops or the risk of moisture-related diseases. The seasonal variation observed in the Amou prefecture reflects the influence of climate variability and possibly regional changes in the intra-seasonal distribution of rainfall.
Characterization of the Beginning and End of the Rainy Season in the Prefecture of Wawa
Figure 6 shows the interannual evolution of the start and end dates of the rainy seasons in the Wawa prefecture, distinguishing the major season (a) from the minor season (b).
Figure 6.
Interannual variability of the start and end dates of the long rainy season (a) and the short rainy season (b) in the Wawa prefecture from 1991 to 2020.
According to the figure, the main rainy season (MRS) in Wawa Prefecture begins between the third ten-day period of March and the end of June (approximately 21 March at the earliest and 29 June at the latest), with an average start date of around the third ten-day period of May. Analysis of the start date reveals significant variability from year to year: some years see an early start to the season (e.g., 16 March 2015, 17 March 2016 and 22 March 2018), while others experience late starts (e.g., 24 June 1999 and 25 June 2011). This irregularity in the onset of rainfall can lead to uncertainty in the agricultural calendar, potentially delaying planting or exposing early crops to early-season droughts. This phenomenon can be attributed to interannual variability in rainfall patterns or the effects of climate change. In contrast, the end of the main rainy season remained relatively stable during the study period, generally fluctuating between early and late August, with a marked concentration around the first half of August. This stability suggests that the variability of the main rainy season in Wawa Prefecture is more closely linked to the start date than the end date.
Regarding the short rainy season, start dates generally fall between mid-August and the end of August, averaging around 15 August. This start date is relatively consistent, although some years show a slight delay (e.g., 1992, 2008 and 2013). However, the end date of the short rainy season is more variable, ranging from early to late November (1st to 28th November), with a tendency towards later dates, which moderately lengthens the season. This trend is likely linked to changes in the seasons. If the season is not subject to intra-seasonal dry spells, this moderate lengthening of the short rainy season could offer additional opportunities for certain crops, despite the fact that dry spells can compromise yield consistency.
3.1.3. Length of the Rainy Season in the Prefecture of Agou, Kpélé, Amou and Wawa
Length of the Rainy Season in the Agou Prefecture
Analysis of the length of the main rainy season in the Agou Prefecture reveals that it lasts from 40 to 149 days on average, with an estimated average length of around 113 days. Most years have a season lasting between 100 and 140 days, which generally corresponds to a period favourable for the development of long-season crops. However, some years experience significant shortening (e.g., 40 days in 1992, 65 days in 1999 and 67 days in 2000), reflecting anomalies such as a late start or early end to the rainy season. This can compromise yields. Conversely, exceptionally long durations of up to 149 days have also been observed, which can disrupt agricultural calendars by delaying harvests or increasing the risk of fungal diseases linked to prolonged humidity.
The short rainy season has an average duration of around 85 to 90 days, but with variability ranging from 56 to 132 days. Short seasons (e.g., 56 days in 2011, 61 days in 1998 and 62 days in 2001) reveal periods of high risk for crops due to reduced agro-climatic windows. Conversely, several recent years (e.g., 2004 and 2011: 111 days, 2007: 103 days; 2019: 132 days; and 2020: 109 days) have shown particularly long seasons, suggesting a trend towards lengthening. The short rainy season is more unstable, with frequent extremes throughout the series, which makes agricultural planning difficult and necessitates adaptation strategies.
Length of the Rainy Season in the Kpélé Prefecture
Analysis of the length of the main rainy season in the Kpélé Prefecture reveals a duration ranging from 64 to 167 days, with an estimated average of approximately 122–127 days. Most years have a season lasting between 120 and 155 days, which generally provides favourable conditions for growing long-cycle food crops such as maize, upland rice, cassava and yams. However, some years are characterised by a significant reduction in the length of the growing season, as evidenced by the following extreme cases: 2010 (64 days), 2014 (84 days) and 2016 (69 days). These shorter seasons can result from a late start to the rains, an early end to them or prolonged dry spells. This can jeopardise vegetative growth, flowering or crop maturation, thus threatening agricultural productivity. Conversely, exceptionally long periods of up to 167 days have also been recorded (in 2011), which are favourable to crop development, but can also lead to problems such as prolonged soil saturation and the proliferation of moisture-related pathogens, or delays to harvest schedules. This is particularly critical in this area of double annual cropping.
The average duration of the short growing season is around 80 to 85 days, but it exhibits significant interannual variability, ranging from 62 to 107 days. Short growing seasons expose crops to a high risk of water stress (e.g., 1992: 63 days, 2010: 66 days, 2011: 62 days). This reduces the time available for crop growth, even for short-cycle crops, thus compromising local food security. Conversely, some years have a longer growing season, with durations reaching 101 days in 2003 and 107 days in 1995. These episodes of temporary extension could indicate recent climatic trends towards greater variability or a shift in rainfall patterns.
Length of the Rainy Season in the Amou Prefecture
Data indicates that the main rainy season in the Amou Prefecture lasts between 71 and 155 days on average, reflecting a generally long and favourable season. In most years, the main rainy season lasts between 102 and 155 days, providing suitable climatic conditions for growing long-cycle food crops. However, some years have significantly shorter seasons, such as 71 days in 2018 and 104 days in 1993. These can be the result of a late start to the rains, an early end to them or dry spells, which can disrupt crop growth and maturation, posing risks to agricultural production. Such situations can disrupt crop growth and maturation, posing risks to agricultural production. Conversely, durations of up to 155 days were observed in 2000, which, while favourable for production, can lead to difficulties relating to soil saturation and crop management.
The short rainy season ranges from 57 to 109 days, with an average of 75 to 85 days. This season exhibits significant interannual variability; some years have very short rainy seasons (57 days in 2013 and 2017), which expose crops to significant water stress and limit the growing window for crop varieties. Conversely, other years are marked by an exceptionally long short rainy season (up to 107 days in 2005 and 109 days in 2019), which suggests notable climatic instability and indicates an extension of the short rainy season.
Length of the Rainy Season in Wawa Prefecture
Data shows that the length of the main rainy season in Wawa Prefecture can vary considerably, ranging from 52 to 155 days. This wide range reflects significant interannual variability. The majority of observations fall between 96 and 139 days, suggesting a generally moderate to long rainy season, which is favourable for the growth of food crops. However, some years show a very short rainy season, with durations of less than 70 days (e.g., 52 days in 1999, 68 days in 2011). 57 days, 1996: 68 days and 2014: 70 days and 1992: 81 days), which may indicate a delayed onset of the rains or an early interruption to the season. These short episodes compromise crop growth and maturation, exposing local agriculture to the risk of reduced yields. Conversely, years with a long growing season of up to 151 days (in 2016) and 155 days (in 2015) offer an extended favourable climate for agricultural production but can also lead to problems such as prolonged soil saturation or delays to the harvest schedule.
The short rainy season varies in duration from 71 to 101 days, with an approximate average of 80 to 90 days. This season is generally shorter than the long rainy season, but it is still long enough for some short-cycle crops. Variability is less pronounced than for the long rainy season, with durations mostly remaining between 78 and 99 days. This relative stability provides security for crops adapted to this season. However, durations of both 71 and 101 days have been recorded, indicating a degree of instability that necessitates flexible and adaptive agricultural planning.
3.1.4. Analysis of Dry Spells During the Rainy Season in the Prefecture of Agou, Kpélé, Amou and Wawa
The analysis of dry spells (periods without significant rainfall during the rainy season) is a relevant indicator of intra-seasonal rainfall variability, which can negatively impact agricultural yields.
Analysis of Dry Spells During the Rainy Season in the Agou Prefecture
The analysis of dry sequences in the prefecture of Agou shows a frequency of dry sequences during the major and minor rainy seasons as shown in Figure 7.
Figure 7.
Distribution of the duration of dry spells during the rainy seasons from 1991 to 2020 in the Agou prefecture.
Analysis of dry spells during the rainy season in the Agou prefecture (Figure 7) shows that the duration of dry spells during the main rainy season varies mainly between 10 and 21 days, with a stable median of around 11 with a minimum of 10 days and a maximum of 21 days (2015). Extreme values are rare, but peaks appear in some years (notably 2015 with 21 and 2016 with 17), reflecting isolated dry events. Overall, the distribution is relatively tight, indicating good rainfall regularity during this season. The main rainy season is less prone to prolonged droughts, making it a more reliable period for rainfed crops.
Dry spells during the short growing season are longer and more variable, ranging from 10 to 23 days. The median is around 12 days, with a minimum of 10 days and a maximum of 23 days (2020). Extreme values are common (e.g., 2000 and 2009 with 18 days, 2012 with 17 days, and particularly 2020 with 23 days, which is a record). This reflects marked instability and a higher risk of rainfall interruptions. The short growing season is climatically more unpredictable, with an increasing frequency of intra-seasonal droughts, making agricultural activities more vulnerable.
Analysis of Dry Spells During the Rainy Season in the Kpélé Prefecture
The study of dry sequences in the Kpélé prefecture highlights their high frequency during the two rainy seasons, in accordance with the results in Figure 8.
Figure 8.
Distribution of the duration of dry spells during the rainy seasons from 1991 to 2020 in the Kpélé prefecture.
Analysis of dry spells during the rainy season in the Kpélé prefecture shows that the duration of dry spells during the main rainy season mainly varies between 10 and 29 days. The median is stable at around 12 days, with a minimum of 10 days and a maximum of 29 days. While extreme values are rare, peaks do occur in some years (notably in 1992, 1994 and 2019, with 29, 18 and 17 days respectively), reflecting isolated dry events. Overall, the duration of dry spells (10–29 days) during the main rainy season reflects strong intra-seasonal variability in rainfall, with one or more periods of dry weather lasting approximately two weeks occurring during this supposedly wet period. These dry spells can reduce germination and flowering, leading to significant yield reductions during the main growing season.
Conversely, the short rainy season has a median dry spell of around 14 days, ranging from a minimum of 10 to a maximum of 24 days. Extreme values are frequent (e.g., 20 days in 1992, 19 days in 1998 and 17 days in 2010; particularly the record-breaking 18 and 24 days in 2018). These exceptionally long dry spells reflect pronounced irregularity in rainfall patterns during this season. This variability poses a significant risk to rainfed agriculture. Indeed, in such a short season, a dry spell lasting more than two weeks can result in losses of seedlings, stunted growth or early harvests with low yields. This instability makes the short season more unpredictable, with an increasing frequency of intra-seasonal droughts making agricultural activities and crops sensitive to water deficits or with a rapid cycle, more vulnerable.
Analysis of Dry Spells During the Rainy Season in the Amou Prefecture
Climate analysis indicates that dry spells are a frequent phenomenon in the Amou prefecture throughout the annual rainfall cycle, which is confirmed by Figure 9.
Figure 9.
Distribution of the duration of dry spells during the rainy seasons from 1991 to 2020 in the Amou prefecture.
Analysis of dry spells during the rainy season in Amou Prefecture shows a minimum duration of 10 days and a maximum of 29 days, with a median of around 11 days remaining stable. This relative stability of the median reflects a certain climatic regularity, which allows for a generally favourable progression of the main rainy season in most years. However, isolated peaks (e.g., 17 days in 1992 and 2000; 29 days in 2002; and 19 days in 2004) reveal episodes of significant water stress. Although rare, these prolonged dry spells can have negative impacts on rainfed crops. In particular, when they occur during the flowering or grain-filling stages, they reduce the yield of food crops.
Dry spells during the short rainy season are longer and more irregular than those observed during the long rainy season. They range from a minimum duration of 10 days to a maximum duration of 34 days, with a median of around 14 days. This increased variability reflects the rainfall instability that is characteristic of the short rainy season and which is often marked by prolonged dry spells. Relatively frequent extreme values (e.g., 18 and 24 days in 1991, 34 days in 2001, 20 days in 2002 and 19 days in 2008) highlight this season’s vulnerability to climatic hazards. This irregularity poses a major challenge for short-cycle rainfed crops, which are generally planted during this period (e.g., maize, beans and groundnuts). Dry spells lasting more than 15 days expose crops to severe water stress, which can compromise germination, flowering or ripening depending on the phenological stage. The longest sequences (e.g., 34 days in 2001) reflect critical years, which can lead to very high yield losses or even total failure of short-season agricultural campaigns.
Analysis of Dry Spells During the Rainy Season in the Wawa Prefecture
The examination of dry sequences in the Agou prefecture reveals the presence of periods without rain during both the major and minor rainy seasons, as illustrated in Figure 10.
Figure 10.
Distribution of the duration of dry spells during the rainy seasons from 1991 to 2020 in the Wawa prefecture.
Analysis of dry spells during the rainy season in Wawa Prefecture reveals that the duration of dry spells varies mainly between 10 and 12 days, with a stable median of around 11 days. There are no extreme values. Similarly, dry spells during the short season range from 11 to 17 days. The median is around 11 days, and the most extreme value recorded was 17 days in 2017. The low dispersion of dry spells during these two rainy seasons (narrow interquartile range) indicates relative stability in rainfall interruptions during this period. The absence of outliers during these two seasons further supports the notion of more predictable rainfall patterns. In an agricultural context, this means that crops sown during these seasons are less exposed to prolonged water stress and that the observed dry spells fall within timeframes compatible with the development of medium- or long-cycle crops. The reliability of these seasons makes them favourable periods for rainfed crops.
3.1.5. Analysis of Rainfall Quantity per Season in the Prefecture of Agou, Kpélé, Amou and Wawa
In order to analyze the spatial and seasonal variability of rainfall in the western part of the plateau region, the following Figure 11 shows the evolution of rainfall totals for the major and minor seasons in the prefectures of Agou, Amou, Kpélé and Wawa.
Figure 11.
Distribution of annual rainfall totals by season and by location.
Figure 11 illustrates the distribution of annual rainfall totals between 1991 and 2020. Statistical analysis of this figure reveals significant spatial and seasonal variability in rainfall. In Agou, 50% of rainfall totals during the main rainy season (MS) are below 495 mm, while 75% remain under 653 mm. During the minor rainy season (MR), 50% of totals do not exceed 332 mm, while 75% remain below 538 mm. This indicates that MS rainfall is significantly more abundant than MR rainfall in this locality, with marked variability within the seasons.
In Amou, the rainfall distribution during the main growing season shows particularly high levels: 50% of observations are below 734 mm and 75% are below 880 mm. In contrast, during the secondary growing season, the median is 415 mm and 75% of values do not exceed 502 mm. These results show that the main growing season provides sufficient rainfall for water-intensive crops, while the secondary growing season remains more modest.
A similar trend is observed in Kpélé, where 50% of rainfall during the main growing season (GS) falls below 732 mm, and 75% below 898 mm. For PS, the median is 417 mm, and the third quartile is 493 mm. Comparing the two seasons highlights the clear superiority of the GS, confirming that water availability varies significantly depending on the crop cycle.
Finally, in Wawa, the median GS rainfall is 652 mm and the Q3 is 804 mm, confirming substantial water inputs. However, PS stands out with relatively high values compared to other localities: 50% of observations are below 487 mm and 75% are below 562 mm. This gives Wawa a unique profile, where the short season offers more favourable rainfall potential than in other areas.
3.2. Effect of Seasonal Variability on Food Production in the Western Part of the Plateaux Region of Togo
3.2.1. Correlation of Climatic Parameters (Rainfall and Temperature) and Food Production in the Western Part of the Plateau Region
Identification of Factors Influencing Yam Yield
The OLS regression model (Table 2) using yield as the dependent variable revealed no statistically significant effect of climatic variables. Neither precipitation (p = 0.810) nor maximum temperature (p = 0.822) was found to significantly explain interannual variations in yield. The model’s explanatory power is extremely low (R2 = 0.005), and the negative adjusted R2 indicates an almost total absence of a linear relationship between the considered climatic factors and the observed yield. These results suggest that yam production is insensitive to climatic fluctuations over the studied period, or that other non-climatic factors, such as plant material quality, cultivation practices, fertilisation or soil conditions, play a significant role in yield variability.
Table 2.
Regression results for agricultural production models (Dependent variable: yam yield (tons/ha)).
Model diagnostics also confirm the validity of the basic assumptions of linear regression.
The Shapiro–Wilk test revealed no significant deviation from normality in the residuals (W = 0.924, p = 0.064). Similarly, the Breusch–Pagan test revealed no heteroscedasticity (BP = 2.86, df = 2, p = 0.239), indicating homogeneous residual variance. These results demonstrate that, despite the absence of significant linear relationships, the model satisfies the statistical conditions necessary for OLS regression (see Appendix A).
Identification of Factors Influencing Rice Yield
The OLS regression model, with rice yield as the dependent variable (see Table 3), produced mixed results. Precipitation has no significant effect on yield (p = 0.555), while maximum temperature has a marginally significant effect at the 10% threshold (p = 0.050). This suggests that rice may be sensitive to variations in temperature. However, the model’s overall explanatory power remains limited (R2 = 0.192; adjusted R2 = 0.119), indicating that the included climate variables capture only a small portion of the interannual variability in yields. Therefore, although the influence of temperature cannot be ruled out, it is possible that other agronomic or environmental factors not included in the model may play a more decisive role in the observed fluctuations in rice yield.
Table 3.
Regression results for agricultural production models (Dependent variable: rice yield (tons/ha)).
The Shapiro–Wilk test showed no significant deviation from normality in the residuals (W = 0.9395, p = 0.1444). Similarly, the Breusch–Pagan test indicates the absence of heteroscedasticity (BP = 3.86, df = 2, p = 0.145). Thus, the assumptions of normality and homoscedasticity are satisfied, providing the model estimates with acceptable robustness.
Identification of Factors Influencing Corn Yield
A multiple linear regression model was used to analyse the relationship between yield and precipitation and maximum temperature. No statistically significant effects were found. Precipitation (p = 0.621) and maximum temperature (p = 0.501) were not significant predictors of interannual yield variability. Furthermore, the model’s explanatory power remains very low (R2 = 0.025) and is even negative after correction (adjusted R2 = −0.048), indicating an absence of robust linear relationships between the included climate factors and the observed yield. These results suggest that, for this crop, climatic fluctuations are not major determinants of yield over the considered period and that other non-climatic factors (e.g., cultivation practices, soil fertility, varietal quality and pest pressure) probably play a more important role.
Model diagnostic tests using 30 observations show that the residuals do not meet the normality assumption (Shapiro–Wilk test: W = 0.900, p = 0.008), which may limit the robustness of inferences based on t- and F-tests. However, homoscedasticity is observed (Breusch–Pagan test: BP = 2.99, p = 0.224), indicating homogeneous residual variance.
Given the sample size (n = 30), the linear regression remains moderately robust to slight non-normality.
Analysis of the final model (Table 4) shows that cultivated area is the main determinant of production. The model explains approximately 34.3% of the variance (R2 = 0.343; adjusted R2 = 0.319), and this remains statistically significant (F = 14.61; p < 0.001). Assuming all other factors remain equal, an increase in cultivated area by one hectare is associated with an increase in production by 0.50 tons (p < 0.001). Initially, the complete model indicated a positive effect of temperature (≈10.55; p < 0.1), while precipitation had no significant effect. However, after simplification, only cultivated area retains a robust explanatory role, confirming that it is the main factor structuring production in our sample.
Table 4.
Regression results for agricultural production models (Dependent variable: Corn yield (tons/ha)).
Identification of Factors Influencing Cowpea Yield
The OLS regression model for cowpea (see Table 5) shows that maximum temperature has a positive and significant effect on yield (β = 0.269, p = 0.0079), whereas precipitation has no statistically significant effect (β = 7.26 × 10⁻⁵, p = 0.561). The combined effect of these two climate variables explains approximately 24% of the variance in yield (R2 = 0.238), and the model is significant overall (F = 4.207, p = 0.0257).
Table 5.
Regression results for agricultural production models (Dependent variable: Cowpeayield (tons/ha)).
However, the diagnostics highlight that the residuals are not normally distributed (Shapiro–Wilk test: W = 0.8545, p = 0.00077), which may limit the robustness of the classic t and F tests. Conversely, homoscedasticity is observed (Breusch–Pagan test: BP = 2.03, p = 0.363), indicating stable residual variance.
Identification of Factors Influencing Cassava Yield
The OLS regression model, with yield as the dependent variable (see Table 6), reveals that maximum temperature has a strong influence on interannual yield variation. Indeed, maximum temperature has a negative and highly significant effect (p = 0.00013), suggesting that rising temperatures significantly reduce yield. In contrast, precipitation has no statistically significant effect (p = 0.771). The model has moderate but substantial explanatory power (R2 = 0.433; adjusted R2 = 0.391), indicating that climatic variables, particularly temperature, explain a significant proportion of the observed variability in yield. These results highlight the crop’s sensitivity to heat stress, while the effect of precipitation appears limited over the study period. The Shapiro–Wilk test indicates that the residuals do not deviate significantly from normality (W = 0.948, p = 0.149), and the Breusch–Pagan test shows that the residual variance is homogeneous. Overall, the diagnostics confirm that the classical assumptions of linear regression are met, which reinforces the reliability of the results. The diagnostics confirm that the classical assumptions of linear regression are met, which reinforces the reliability of the results.
Table 6.
Regression results for agricultural production models (Dependent variable: Cassava yield (tons/ha)).
4. Discussion
4.1. Seasonal Climate Variability in the Western Plateau Region
The results of the study reveal that, in the western part of the Plateau region, the climate, long characterized by a bimodal rainfall regime (two dry seasons and two rainy seasons), has shifted to a unimodal rainfall regime (one rainy season and one dry season) with relatively high temperatures. Analysis of ombrothermic curves from the Kouma-Konda and Atakpamé synoptic stations between 1991 and 2020 reveals an alternating dry and rainy season. The dry season lasts from November to February or March, while the rainy season lasts from March or April to October. Monthly rainfall varies from 6.38 to 228.71 mm, with average monthly temperatures ranging from 24.69 to 34.7 °C. This alternation of seasons is a typical characteristic of the Sudano-tropical climate in northern Togo, with a dry season lasting 4 to 5 months and a rainy season lasting 7 to 8 months. These results are consistent with the work of [24]. According to this study, although the Kouma-Konda and Atakpamé stations are located in the Plateaux region, their Gaussen diagrams are closer to those of the Niamtougou station, which is located in the Kara region in northern Togo. This suggests a gradual transition from the Guinean tropical climate, which is characteristic of this region, to a Sudano climate. The author concludes that the climate formerly classified as ‘tropical Guinean’ in this area could be evolving towards a ‘tropical Sudanian’ (monomodal) climate. Similarly, seasonal climate variability is demonstrated by the interannual variation in the start and end dates of the main and minor rainy seasons in the western part of the plateau region. While the end of the main rainy season is relatively stable, the actual onset is uncertain. The start of the short rainy season is stable, but this season tends to end late. Furthermore, analysis of the length of the main rainy season in the western plateau region reveals an average duration of between 100 and 140 days, which is favourable for cultivation. However, in several years there has been a shortening of the main rainy season, reflecting anomalies such as a late start or early end to the rains. The short rainy season has an average duration of 80 to 90 days, which is shorter than the main rainy season, and lasts for several years during this period. It exhibits particularly long seasons, suggesting a trend towards lengthening of the short rainy season. Furthermore, analysis of dry spells in the study area reveals that, during the long rainy season, dry spells vary from 10 to 29 days, with a median average of 11–12 days. Dry spells during the short rainy season are longer and more variable, ranging from 10 to 34 days with an average of 11 to 14 days. This reflects instability and a high risk of rain interruption during this season. The duration of dry spells during this period reflects strong intra-seasonal variability in rainfall, with breaks in the rain lasting approximately two weeks. These results corroborate the work of [20,25,26,27]. The work of [25] shows that, in the southwestern plateau region of Togo, climate variability is characterised by a disruption to rainfall patterns, with respective decreases of 15% and increases of 19% at mountain stations. Additionally, the average ten-day temperature in Atakpamé has varied randomly from 23 to 31 °C (1971–2016), while in Kouma-Konda it has varied from 21 to 28 °C. The most notable sequences are those lasting 1 to 3 days (70%). Long dry sequences lasting from three to 14 days often occur during dry years and have a frequency of 20%. The discrepancy in results compared to those of [25] can be explained by the fact that the study area is limited to two prefectures (Kpélé and Kloto). Similarly, this study used data from 1971 to 2016 to determine spatio-temporal variability in rainfall and temperatures. Additionally, rainfall data from two synoptic stations, one weather station and one rainfall station were employed to ascertain the commencement, conclusion and duration of the seasons. Conversely, this research was predicated on data from rainfall stations in each prefecture selected to determine the commencement, conclusion and duration of the seasons. Similarly, the work of [20] reveals that, in Togo’s maritime region, rainfall variability manifests as a general downward trend. This decline varies from year to year and is characterised by high rainfall variability. According to [26], in northern Benin, the commune of Parakou experiences climate variability characterised by rising temperatures, late rainfall, pockets of drought during the rainy season and a reduction in the number of rainy days, from an average of 145 to 80. Similarly, the work of [27] in Madagascar indicates that climate variability is characterised by an increasing temperature range and a shift in the start and end of the rainy season in the Alaotra Mangoro Region between 2005 and 2015. However, according to [28], in the central-eastern part of the Ivory Coast, specifically the N’zi region, the rainy seasons have remained unchanged. Their duration remains the same, with no shift observed. However, the rainy seasons are generally characterised by a decrease in rainfall.
Furthermore, the cumulative or annual amount of rainfall from 1991 to 2020 in the western part of the plateau region reveals significant spatial and seasonal variability in rainfall. In the Agou prefecture, the main rainy season (MRS) is considerably heavier than the short rainy season (SRS), with marked variability within the seasons. In the Kpélé Prefecture, the MRS shows clear superiority in rainfall compared to the SRS, confirming high but contrasting water availability depending on the crop cycle. In the Amou Prefecture, the MRS provides sufficient volumes for water-intensive crops, while the SRS remains more modest. In the Wawa prefecture, the MRS provides substantial water, and the SRS offers more favourable rainfall potential than in other areas of the western plateaus. These findings align with those of [29], who demonstrated the spatial distribution of seasonal rainfall in Pakistani subregions for the period 1980–2018 in their study of seasonal trends in the China-Pakistan Economic Corridor. During the DJF (December to February) and MAM (March to May) seasons, the RI (hyperarid) and R-II (arid) regions received less than 50 mm of rainfall per month, whereas the R-III (humid) region received relatively more. Rainfall during the JJAS (July to September) season is more concentrated in the R-III region, while the other regions receive less rainfall, particularly the western part of the RI region. Compared to other seasons, rainfall during the JJAS season contributes 57.0%, 53.6% and 52.1% respectively to the total annual rainfall in regions RI, R-II and R-III. In contrast, it contributes only 24% to the total annual rainfall in region R-IV (the glacial region). During the ON season (October to November), Pakistan experiences drought and lower rainfall, contributing less than 5% to regions RI, R-II and R-III, and 9.3% to region R-IV. Rainfall during the ISM season (June to September) and the winter monsoon accounts for over 70% of the annual total in all regions except R-IV.
4.2. Effect of Seasonal Variability on Food Production in the Western Plateau Region
Analysis of the results shows a change in the climate, from a bimodal to a unimodal rainfall pattern, which impacts local food production. The unpredictable timing of the main rainy season (occurring early in some years and late in others) can affect planting, increasing the risk of water stress at the beginning of the season or reducing the optimal growing period. Conversely, a shorter rainy season can have significant implications for certain crops with a short growth cycle or increase the risk of moisture-related diseases. These results are confirmed by the work of [30] in Cameroon. Their research found that, in the Ntui district in central Cameroon between 1990 and 2022, heavy rainfall exceeding the normal average and very long seasons in the various production basins led to flooding. This resulted in tuber rot, crop asphyxiation and foliage destruction caused by strong winds. Conversely, the years 1995, 2011, 2015, 2018 and 2021 show relatively low average rainfall, suggesting drier periods due to the late start and abrupt cessation of rains. This plunges farmers into uncertainty. Climate variability in this district is also manifested by shifts in the start and end dates of the rainy season. In response to these changes, farmers must adjust their sowing dates based on their perception and analysis of the climate, which significantly impacts production and agricultural yields in different production basins. Similarly, in the western part of the plateau region, dry spells during the rainy seasons can reduce germination and flowering, consequently lowering agricultural production. The same is true in the production areas of the Ntui zone in central Cameroon. According to research in the Ntui zone in central Cameroon, temperature increases lead to droughts during rainy months such as March, April and June, which, according to producers, were responsible for 46% of the losses. The same is true in the production areas of the Ntui zone in central Cameroon. According to [30], in the Ntui zone, temperature increases lead to droughts during the rainy months of March, April and June. According to producers, these droughts were responsible for 46% of the resurgence of diseases and the development of pest species, such as stinking grasshoppers, cassava mealybugs and whiteflies, which attack the cassava crop and slow its growth.
Furthermore, in the Agou prefecture, the results revealed no statistically significant effect of climatic variables on yam yields. Neither precipitation (p = 0.810) nor maximum temperature (p = 0.822) significantly explains variations in yield from one year to the next. The explanatory power of the model is extremely low (R2 = 0.005), with an adjusted R2 that is negative, indicating an almost total absence of a linear relationship between the considered climatic factors and the observed yield. These results suggest that yam production is not sensitive to climatic fluctuations over the studied period. Other non-climatic factors, such as cultivation practices, fertilisation or soil conditions, may play a significant role in yield variability. According to fieldwork, the most widely grown yam varieties in the prefecture are the selective varieties ‘Kratsi’ and ‘Laboco’, with a maturity cycle of seven to eight months for ‘Kratsi’, yielding three to four tubers per plant or 15 tonnes per hectare, and five to six months for ‘Laboco’, yielding one tuber per plant or 14 tonnes per hectare [31]. In addition, the prefecture’s soils are fertile (85% are moderately rich in organic matter, 95% are very poor in phosphorus and 80% are poor in potassium) and suitable for food crops such as yams [13]. These factors may explain why climatic variables have an insignificant effect on yam yields.
These results are not confirmed by references [32,33]. In Benin, the work of [32] reveals that yam production depends weakly on temperature. In the Commune of Glazoué in Central Benin, rainfall and cultivated areas are the factors that influence yam production. Similarly, in the Southwest Dry Savannas region of Togo, a high-potential yam-producing area, the work of [33] shows that farmers unanimously reported that rainfall anomalies cause annual dry periods that disrupt the proper development of yam plants and thus lead to a decline in yam production. This finding can be explained by the fact that the western part of the Plateaux region, particularly the Agou prefecture with its mountains and dense vegetation, has long been considered the area in Togo with the best climatic conditions. In the Kpélé prefecture, the analysis shows that precipitation has no significant effect on rice yield (p = 0.555), while maximum temperature has a marginally significant effect at the 10% threshold (p = 0.050). This suggests that rice may be sensitive to variations in temperature. However, the model’s overall explanatory power remains limited (R2 = 0.192; adjusted R2 = 0.119), indicating that the included climate variables capture only a small proportion of the interannual variability in yields. These results imply that although temperature may have an impact, other agronomic or environmental factors not included in the model could be more influential in explaining the observed fluctuations in rice yield. This interannual variability in rice yields can be explained by the use of the IR841 rice variety, a selective, short-cycle variety (115–120 days) with a potential yield of six tons per hectare [31]. Added to this are the use of chemical inputs and an increase in the area under cultivation—all of which are adaptation strategies used by rice farmers to cope with the effects of climate variability and increase production [34]. These results are similar to those shown by the work of [35] in Côte d’Ivoire, which indicates that the coefficients associated with temperature and rainfall do not have a statistically significant influence on rice production volume in the different regions of Côte d’Ivoire (Haut Sassandra, Goh, Poro, Tonkpi, Gbêkê and N’Zi). Only the cultivated area and humidity have a significant effect on production volume. However, according to the work of [36], in the Zou and Collines departments in central Benin, rainfall has a positive short-term effect on rice production, but this effect does not persist in the long term. Similarly, in these departments, the cultivated area has a positive effect on rice production. However, relative humidity has a significant negative impact on rice production in the short and long term. In the western part of the plateau region, in the Amou prefecture, the OLS regression model reveals that there are no statistically significant coefficients for climate variables on corn yields (p = 0.621 for precipitation and p = 0.501 for temperature) when yield is used as the dependent variable. The model’s explanatory power is extremely low (R2 = 0.025), and the negative adjusted R2 suggests that climate variability does not significantly explain the observed yield fluctuations. This indicates that yield is not sensitive to interannual climate variations over the studied period, or that other agronomic factors (variety, fertilisation, cultivation practices) have a more decisive influence. According to field studies, the most widely grown corn variety in the prefecture is a selective variety called ‘Ikenne’, which has a maturity cycle of 100–105 days and a potential yield of 5 tonnes per hectare [31]. In addition, fertilizer use is widespread in the area to increase production. Added to this is the state of soil fertilisation in the prefecture: 70% of soils are moderately rich in organic matter; 99% are very poor in phosphorus; and 85% are poor in potassium. These soils are suitable for corn cultivation [13]. All these factors may explain why corn yields are not very sensitive to interannual climate variations.
These results are consistent with the findings of study [37] regarding the impact of climate change on maize cultivation in the Sahel region, which covers parts of Burkina Faso, Mali, Niger, Chad, Senegal, Mauritania, Ethiopia and Nigeria. The studies [38] show that there is no strong correlation between short-term variables, regardless of the region. However, rainfall, temperature and arable land positively impact long-term maize yields. Conversely, according to the work of [38], rainfall has a significant positive impact on maize yields in Senegal’s Groundnut Basin at a threshold of 10%. Average temperatures have a negative impact on maize yields at a threshold of 5%. In the Amou prefecture, the results show that precipitation has no significant effect on cowpea yields (p = 0.561), while maximum temperature does (p = 0.008). Nevertheless, the model’s explanatory power remains moderate (R2 = 0.238; adjusted R2 = 0.181), indicating that climate variability only partially explains the observed yield fluctuations. Despite the non-normality of the residuals, these results suggest that cowpeas are relatively insensitive to variations in precipitation but are positively influenced by maximum temperature, possibly in relation to pod growth and maturation. These results imply that, while maximum temperature positively influences cowpea yield, cowpeas remain generally insensitive to interannual climate variations.
Other agronomic factors, such as varieties, fertilisation and cultural practices, probably have a more decisive influence. According to a survey conducted by the head of the Institut de Conseil et d’Appui Technique (ICAT) in Amou, these factors may include the use of selective local short-cycle varieties, such as ‘Alin bé adé’, which has a maturity cycle of 80–90 days and a potential yield of 0.9–1.3 tons per hectare, and ‘Agoutchaka’, which has a maturity cycle of 70 days and a potential yield of 0.8–0.85 tons per hectare. In addition, fertilisers are used to increase production. The positive effect of maximum temperature on production can be explained by the ecological characteristics of cowpeas. According to these characteristics, cowpeas require a specific temperature for germination and to combat humidity, which causes plant diseases. This optimal temperature varies between 25 °C and 35 °C, which aligns with the area’s minimum and maximum temperatures. These results confirm those of the study in Benin by [39]. According to this study, the results show that temperature has a significant positive impact on cowpea production in northeastern Benin, but rainfall does not. However, based on the work of [38] in the Groundnut Basin in Senegal, rainfall has a significant positive impact on cowpea yields at a threshold of 10%. Average temperatures positively impact cowpea yields at a threshold of 1%. In Wawa Prefecture, the analysis reveals that maximum temperature has a strong influence on interannual variation in cassava yields. Maximum temperature has a negative and highly significant effect (p = 0.00013), suggesting that rising temperatures significantly reduce cassava yields. In contrast, precipitation has no statistically significant effect on cassava yield (p = 0.771). According to cassava’s agroecological characteristics, the plant’s optimal growth temperature varies between 25 and 30 °C [30]. An excessive drop or rise in temperature beyond this range leads to a reduction in yield. The average temperature in the western part of the region is 24.6 °C, which is favourable for cassava cultivation. However, temperatures in the region’s hottest months range from 29.04 °C to 34.07 °C, and the dry season lasts 4–5 months. This can negatively impact cassava yields, despite the fact that cassava can withstand a dry season of up to 6 months. These results are corroborated by the findings of [32] in Cameroon. In the Ntui region, variations in climatic parameters pose a significant threat to agricultural production. Increases in temperature above normal levels negatively impact cassava production, leading to drought and even the loss of foliage. Cassava cultivation becomes difficult, resulting in a yield deficit of around 15%. This is due to the temperature increase shortening growing cycles and causing water stress in these production areas through increased evaporation. This makes harvesting the tubers difficult due to the drought-affected soil quality. However, the impact of temperature changes is more pronounced than that of changes in rainfall because, following a likely decrease in rainfall, planting periods can be delayed.
5. Conclusions
An analysis of seasonal climate variability and its impact on food production in western Plateau highlights a transformation in the climate regime, characterised by a shift from a bimodal to a monomodal rainfall pattern associated with rising temperatures. This transition is characterised by an unpredictable start to the long rainy season, an extension of the short season and prolonged dry spells. These changes disrupt the availability of water for crops and affect agricultural yields, confirming the persistent vulnerability of local food production. Agroclimatic results reveal that maximum temperature positively influences cowpea yields but negatively impacts cassava and rice yields. Meanwhile, the effect of rainfall remains generally insignificant. In light of these findings, it is recommended that short-cycle varieties of maize and cowpea are promoted and that local seasonal forecasting tools are strengthened, in order to adapt cropping calendars, introduce heat-tolerant varieties of cassava, and adopt mulching to mitigate the impact of high temperatures. Water-intensive crops (e.g., rice) should also be introduced in areas with favourable rainfall, particularly in Wawa Prefecture during the short rainy season.
This study was conducted with the utmost rigour. However, it has certain limitations related to the small number of weather stations used, the exclusion of non-climatic factors (e.g., soil fertility, pests and diseases, and technological advances in agriculture) from the analyses, and the constraints of OLS models, which do not allow for the capture of the delayed effects of climatic variables. Future research could examine the impact of agronomic and technological factors on production and analyse the interactions between climate variability and soil quality.
Author Contributions
Conceptualization, B.K.P.K.; methodology, B.K.P.K. and V.V.A.A.; software, B.K.P.K. and V.V.A.A.; validation, K.Z.-K. and J.C.; formal analysis, B.K.P.K., K.Z.H. and V.V.A.A.; investigation, B.K.P.K.; resources, B.K.P.K.; writing—original draft preparation, B.K.P.K.; writing—review and editing, B.K.P.K., K.Z.H. and K.K.; visualization, K.Z.-K., J.C., K.Z.H. and K.K.; supervision, K.Z.-K. and J.C.; project administration, K.Z.-K. and J.C.; funding acquisition, B.K.P.K. All authors have read and agreed to the published version of the manuscript.
Funding
This research was funded by the Regional Centre of Excellence on Sustainable Cities in Africa (CERViDA-DOUNEDON), the Association of African Universities (AUA) and the World Bank.
Data Availability Statement
The data will be made available upon request.
Acknowledgments
The authors wish to thank the World Bank (WB) for the financial assistance that made this research possible through the African Centre of Excellence for Development Impact (CEA-Impact II) projects; the Regional Centre of Excellence on Sustainable Cities in Africa (CERViDA-DOUNEDON) and the Association of African Universities for training and support.
Conflicts of Interest
The authors declare that they have no conflicts of interest.
Appendix A
Table A1.
Summary statistics of rainy season characteristics in the four study areas (Amou, Agou, Kpélé, and Wawa): start and end dates, and lengths of the main and short rainy seasons (1991–2020).
References
- Food and Agriculture Organization of the United Nations (FAO). FAO’s Action on Climate Change; FAO: Rome, Italy, 2016. [Google Scholar]
- Intergovernmental Panel on Climate Change IPCC. Climate Change 2023: Synthesis Report of the Sixth Assessment Report of the IPCC (AR6); IPCC: Geneva, Switzerland, 2023. [Google Scholar]
- Food and Agriculture Organization of the United Nations (FAO); International Fund for Agricultural Development (IFAD); United Nations Children’s Fund (UNICEF); World Food Program (WFP); World Health Organization (WHO). The State of Food Security and Nutrition in the World 2022: Repurposing Food and Agricultural Policies to Make Healthy Diets More Affordable; FAO: Rome, Italy, 2022. [Google Scholar]
- Food and Agriculture Organization of the United Nations (FAO). Climate Change Impacts and Adaptation Options in the Agrifood System; FAO: Rome, Italy, 2023. [Google Scholar]
- Mosha, N.F.V.; Ngulube, P. Adoption of climate change mitigation and adaptation strategies among smallholder farmers in African countries: A systematic review. Discov. Sustain. 2025, 6, 1087. [Google Scholar] [CrossRef] [Scilit]
- Djalogue, A.K. Circular Agriculture in West Africa: Analysis of the Agricultural Sector’s Dependence on Fertilizers and Proposals for Circularity Strategies. Master’s Thesis, University of Sherbrooke, Sherbrooke, QC, Canada, 2025. [Google Scholar]
- Avena, C. Rural Africa in Motion: Dynamics and Factors of Migration in Sub-Saharan Africa; Food and Agriculture Organization of the United Nations (FAO) & CIRAD: Rome, Italy, 2018. [Google Scholar]
- TCNCC. Third National Communication on Climate Change of Togo; Ministry of Environment and Forest Resources; United Nations Framework Convention on Climate Change (UNFCCC): Bonn, Germany, 2015. [Google Scholar]
- Ministry of Agriculture, Livestock and Fisheries (MAEP). Togo Agricultural Policy Document 2015-2030 (Final Version of 30 December 2015); Togolese Republic: Lomé, Togo, 2015; Available online: https://agriculture.gouv.tg/wp-content/uploads/2020/06/Document-de-politique-agricole-du-Togo-Version-finale-du-30-12-2015.pdf (accessed on 1 January 2026).
- Ahoyo-adjovi, N.R.; Agboton, A.-A.G.; Quenum, F.; Miassi, Y.E.; Dossa, F.K.; Adedem, O. Climate variation and food production in southern Benin: The case of the commune of Bohicon. Afr. Sci. 2019, 15, 32–43. [Google Scholar]
- Ministry of the Environment, Sustainable Development and Nature Protection. Fourth National Communication of Togo on Climate Change; Ministry of the Environment, Sustainable Development and Nature Protection: Lomé, Togo, 2023; Available online: https://fr.scribd.com/document/853900003/QuatriemeOmmunicationNationaleDuTogoSurLesChangementsClimatiques (accessed on 1 January 2026).
- National Institute of Statistics and Economic and Demographic Studies (INSEED). 2019 Statistical Yearbook of the Plateaux Region; INSEED: Lomé, Togo, 2019. [Google Scholar]
- Ministry of Agriculture, Livestock and Rural Development (MAEDR). Recommendations for Main Crops According to Soil Fertility Status, Fact Sheet (25,26,27,28,29,30,31); MAEDR: Nairobi, Kenya, 2021. [Google Scholar]
- Adewi, E.; Badameli, K.M.S.; Dubreuil, V. Evolution of potentially useful rainy seasons in Togo from 1950 to 2000. Rev. Climatol. 2010, 7, 89–107. [Google Scholar] [CrossRef] [Scilit]
- Edou, K. Rainfall Variability and Agricultural Production in the Yoto Prefecture from 1962 to 2012. Geography Thesis, University of Lomé, Lomé, Togo, 2013. [Google Scholar]
- Odah, K. Peasant Adaptation Strategies to the Effects of Climate Change in the Ogou Prefecture (Plateau Region in Togo). Master’s Thesis, University of Lomé, Lomé, Togo, 2014. [Google Scholar]
- Otchotcho, K. Impacts of Climate Change on Agricultural Production and Farmers’ Adaptation Strategies in the Bas-Mono Prefecture in Southeast Togo. Master’s Thesis, University in Niamey, Niamey, Niger, 2016. [Google Scholar]
- Kola, E.; Sy, B.A. Climate change, farmers’ perceptions and adaptation strategies in the Kloto prefecture (Western Plateaus, Togo). Togol. J. Sci. 2017, 11, 28–43. [Google Scholar]
- Pilabina, S. Climate Dynamics in Central and Northern Togo. Master’s Thesis, University of Lomé, Lomé, Togo, 2019. [Google Scholar]
- Edou, K. Rainfall Variability and Agricultural Production in the Eastern Maritime Region of Togo. Ph.D. Thesis, University of Lomé, Lomé, Togo, 2021. [Google Scholar]
- Kola, E. Agrarian Crisis and Rural Changes in the Coffee and Cocoa Economy Zone of Togo. Ph.D. Thesis, University of Lomé, Lomé, Togo, 2008. [Google Scholar]
- Chédé, C.D. Vulnerability and Adaptation Strategies to Climate Change Among Farmers in the Collines Department of Benin: The Case of the Commune of Savè. Master’s Thesis, University in Niamey, Niamey, Niamey, Niger, 2012. [Google Scholar]
- Djaman, K.; Komla, G. Trend analysis in reference evapotranspiration and aridity index in the context of climate change in Togo. J. Water Clim. Change 2015, 6, 848–864. [Google Scholar]
- Bademeli, P.A. Rainfall variability in the Plateau Region of Togo. Int. J. Adv. Res. 2024, 12, 1590–1599. [Google Scholar] [CrossRef] [Scilit] [PubMed]
- Totin Vodounon, S.H.; Dotsevi, D.A.; Amoussou, E.; Yabi, I.; Houndenou, C. Variability and agro-climatic risks in the southwestern plateau region of Togo. In Proceedings of the XXXIInd International Colloquium of the AIC, Thessaloniki, Greece, 1 June 2019. [Google Scholar]
- Djohy, G.L.; Edja, A.H.; Nouatin, G.S. Climate variation and food production: Maize cultivation in the peri-urban agricultural system of the commune of Parakou in Northern Benin. Afr. Sci. 2015, 11, 183–194. [Google Scholar]
- Rabearintsoa, M.A.I. Analysis of the Impacts of Climatic Variability and Climate Change on Rice Production, Case of the Alaotra Mangoro Region. Master’s Thesis, University of Antananarivo, Antananarivo, Madagascar, 2017. [Google Scholar]
- Kadet, A. Impact of climate change on agricultural yield in the southern groundnut basin. Econ. Manag. Rev. 2024, 2. Available online: https://revues.imist.ma/index.php/EMR/article/view/50874 (accessed on 1 January 2026).
- Hounzinme, S.S.; Chanhoun, C.C.L.; Teka, O.; Oumorou, M. Effects of climate variability on the yield of some food crops in Northeast Benin. Eur. Sci. J. 2020, 16, 137–150. [Google Scholar]
- Fossou, R.M.N.; Soro, E.G.; Dosso, S.; Gone, L.D. Rainfall variability in West Africa: The case of the N’Zi region in east-central Côte d’Ivoire. Rev. Ivoirienne Des Sci. Technol. 2020, 36, 171–192. [Google Scholar]
- Shelton, S.; Dixon, R.D. Long-Term Seasonal Drought Trends in the China-Pakistan Economic Corridor. Climate 2023, 11, 45. [Google Scholar] [CrossRef] [Scilit]
- Nguekeu, C.; Amougou, J.A. Influence of climatic parameter variability on cassava production in the Ntui district in central Cameroon. Int. Soc. Sci. Educ. J. 2025, 3, 53–64. [Google Scholar]
- Ministry of Agriculture, Livestock and Fisheries (MAEP). Official Catalog of Plant Species and Varieties in Togo; MAEP: Lomé, Togo, 2017. [Google Scholar]
- Sognon, D.P.; Assongba, F.Y.; Ahouanvoegbe, P.; Vodounon, S.H.T.; Yoka, J. Climatic constraints and yam production in the commune of Glazoué in Central Benin, West Africa. Afr. Sci. 2020, 17, 207–222. Available online: http://www.afriquescience.net (accessed on 1 January 2026).
- Gnon Tchein, T.; Kodjo, T.A.; Komi, A.; Matotiloa, T. Farmers’ perceptions of the determinants of low yam (Dioscorea spp.) productivity and their levels of severity in the southwest of the dry savannas in Togo (West Africa). Eur. Sci. J. 2019, 15, 256–281. [Google Scholar]
- Kolou, B.K.P. Influence of Climate Variability on Rice Production and Peasant Adaptation Strategies in the Kpélé Prefecture of Togo. Master’s Thesis, University of Lomé, Lomé, Togo, 2020. [Google Scholar]
- Assi, Y.F. Impact of climatic parameters on rice production in the different regions of Côte d’Ivoire: The case of Haut Sassandra, Gôh, Poro, Tonkpi, Gbêkê, and N’zi. Eur. Sci. J. 2023, 19, 147. [Google Scholar]
- Ajavon, A.Y.C.; Kpatinnon, N.R.; Tente, A.H.B. Effects of climate change on rice production in the Zou and Collines departments in central Benin, West Africa. Int. J. Recent Adv. Multidiscip. Res. 2020, 7, 6024–6033. [Google Scholar]
- Nacanabo, A. Effect of climate change on the yield of millet, sorghum and maize in the Sahel: An ARDL model. Afr. Sci. J. 2025, 3. [Google Scholar] [CrossRef]
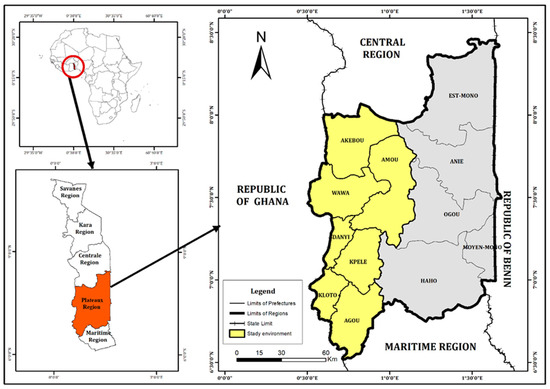
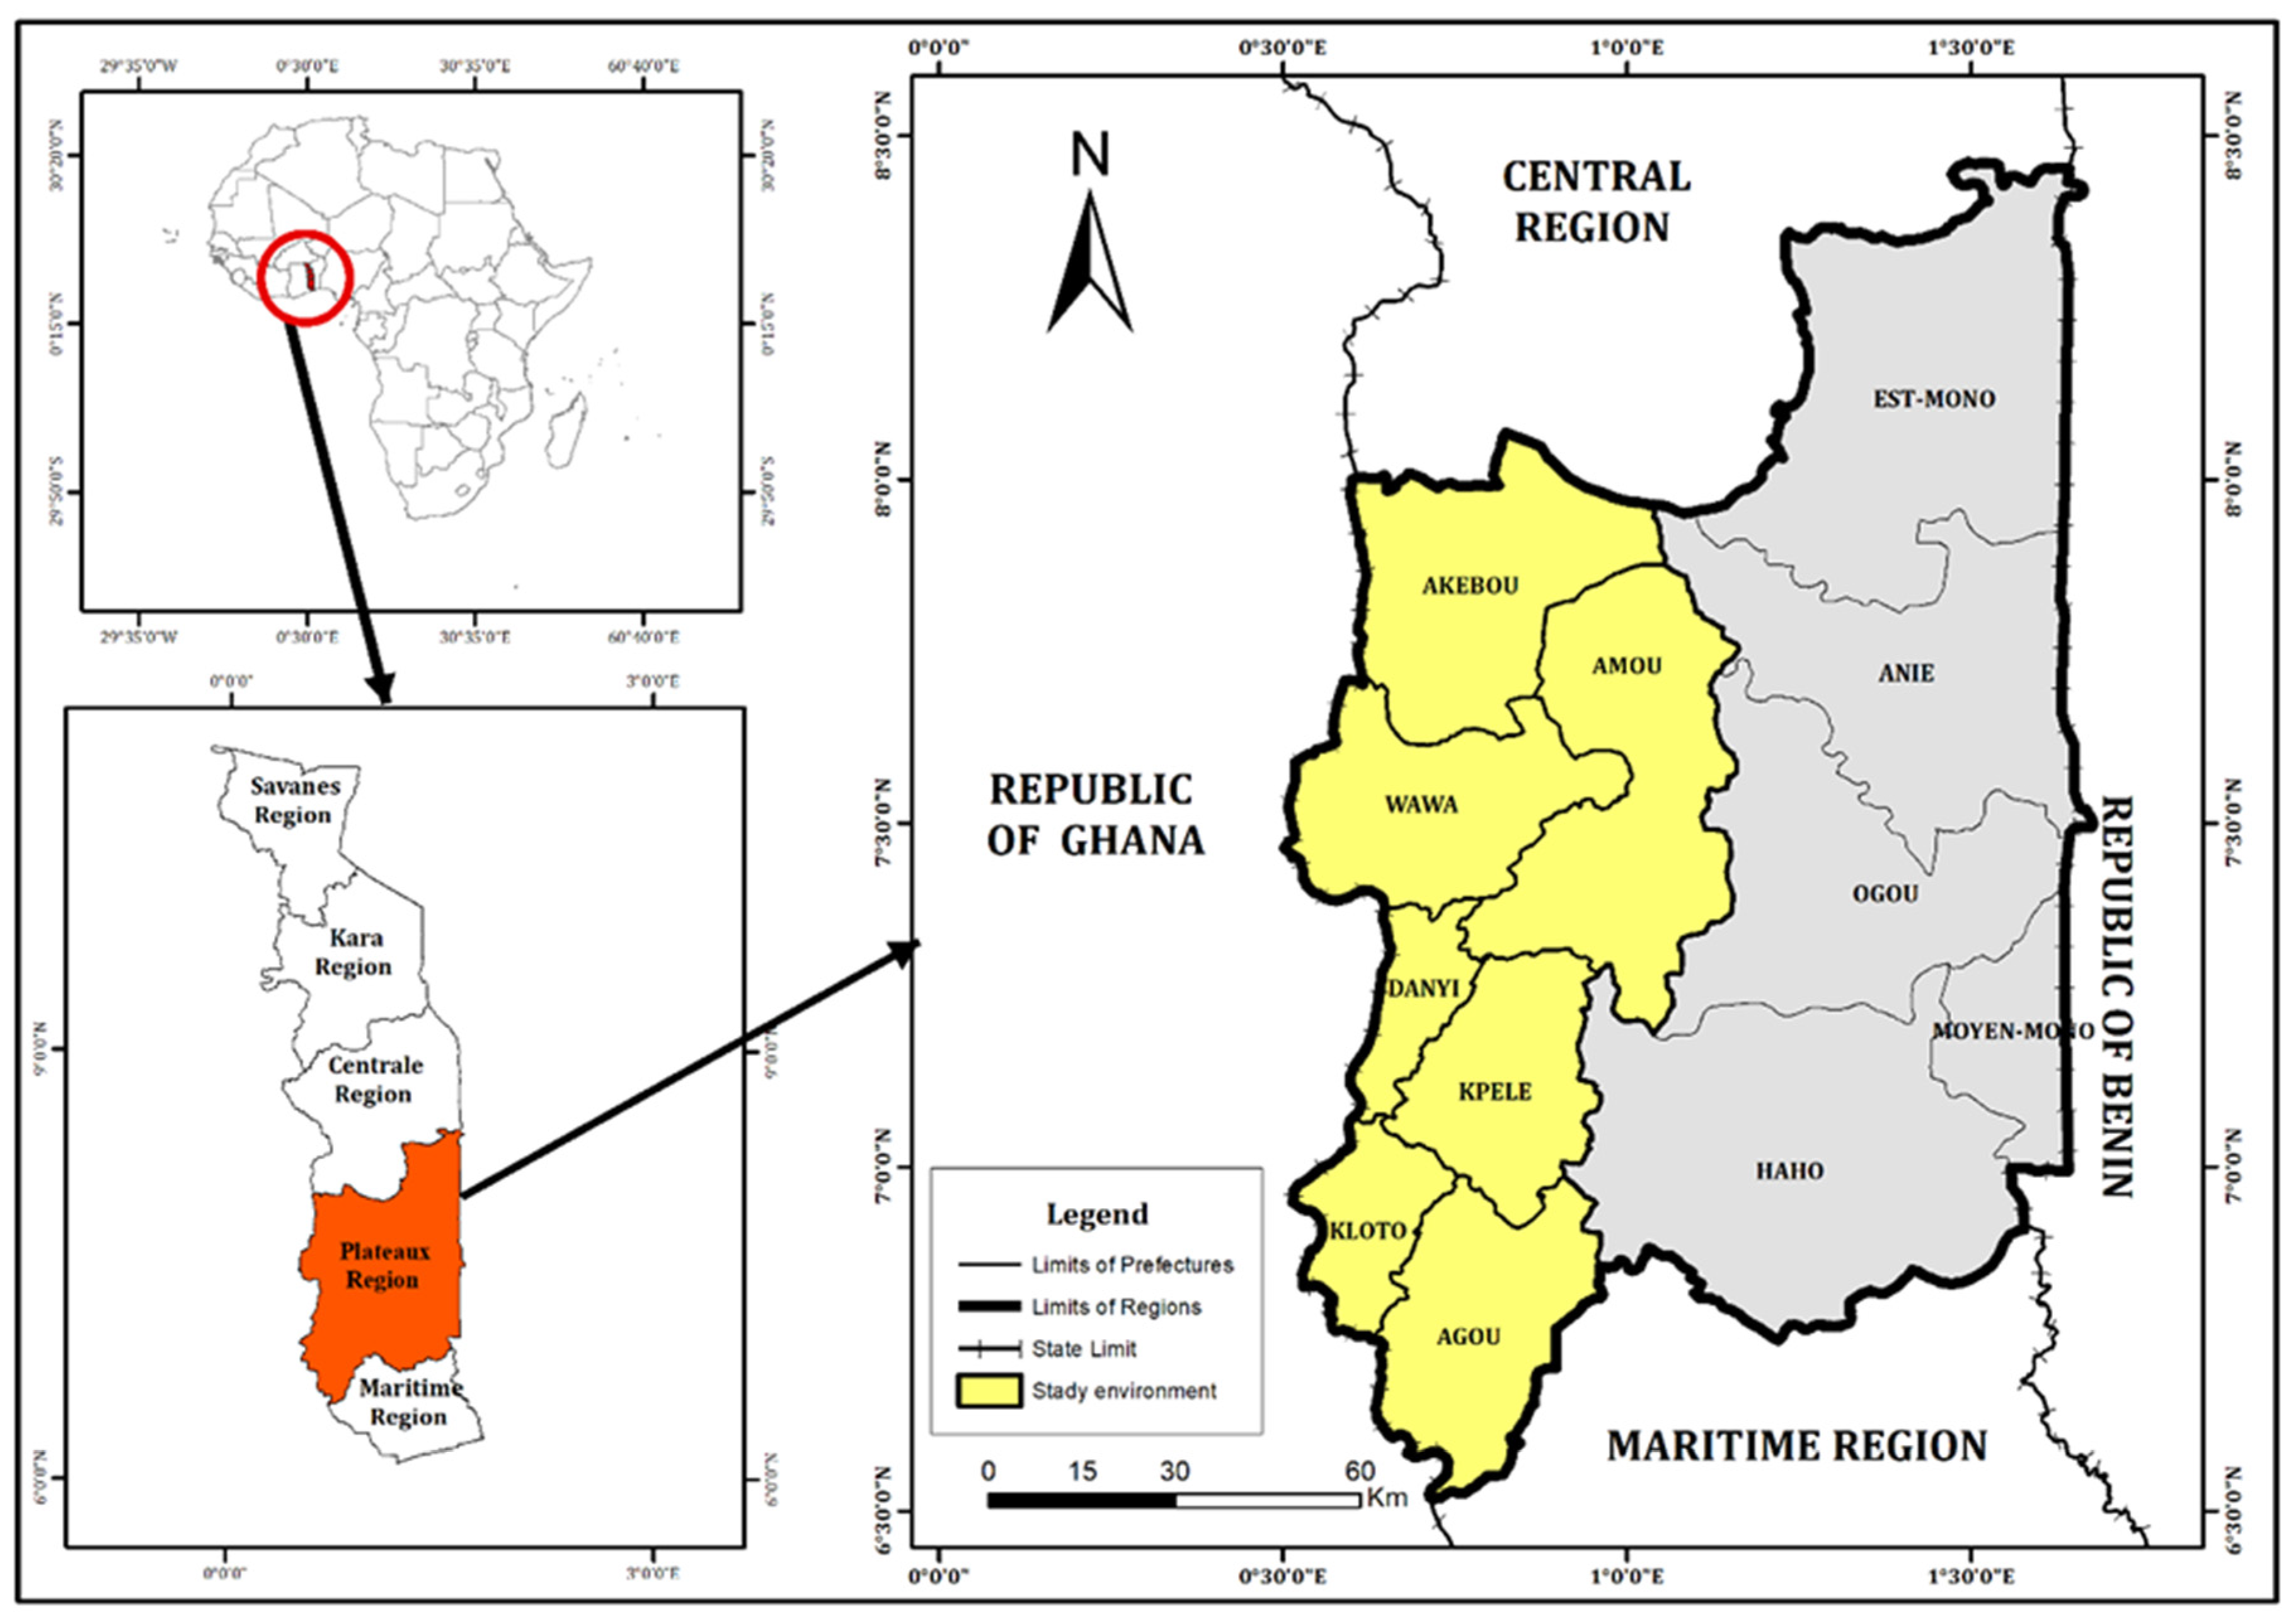
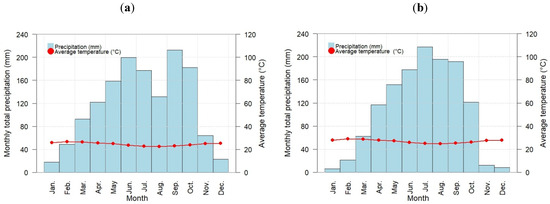
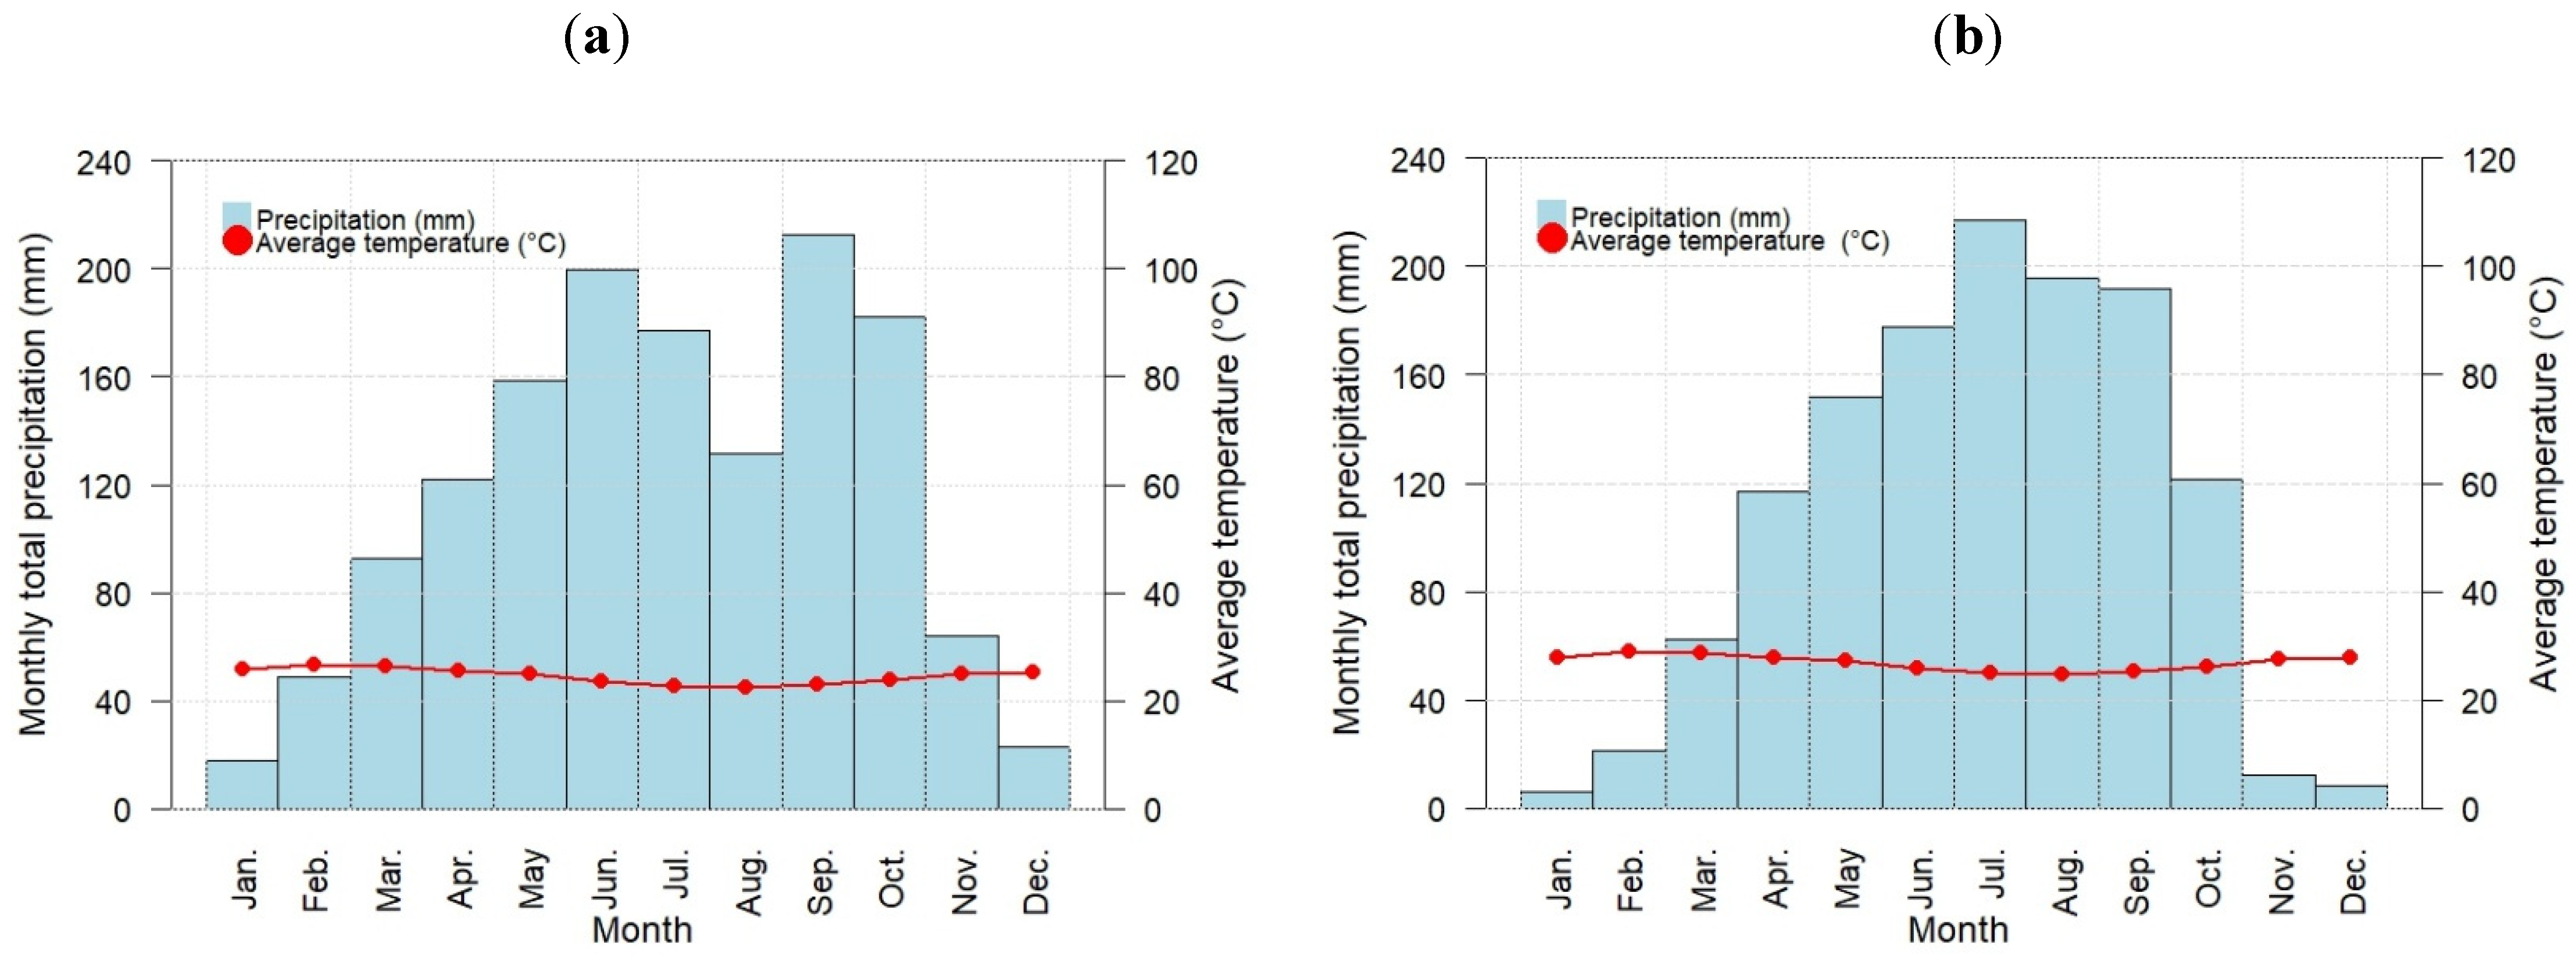
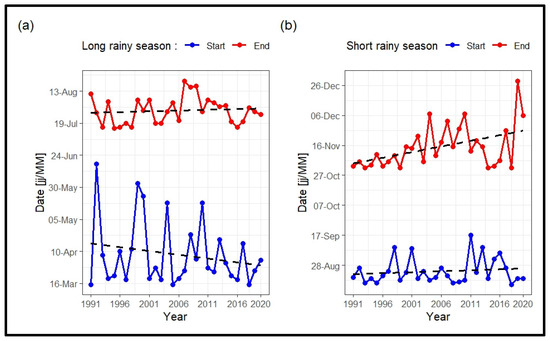
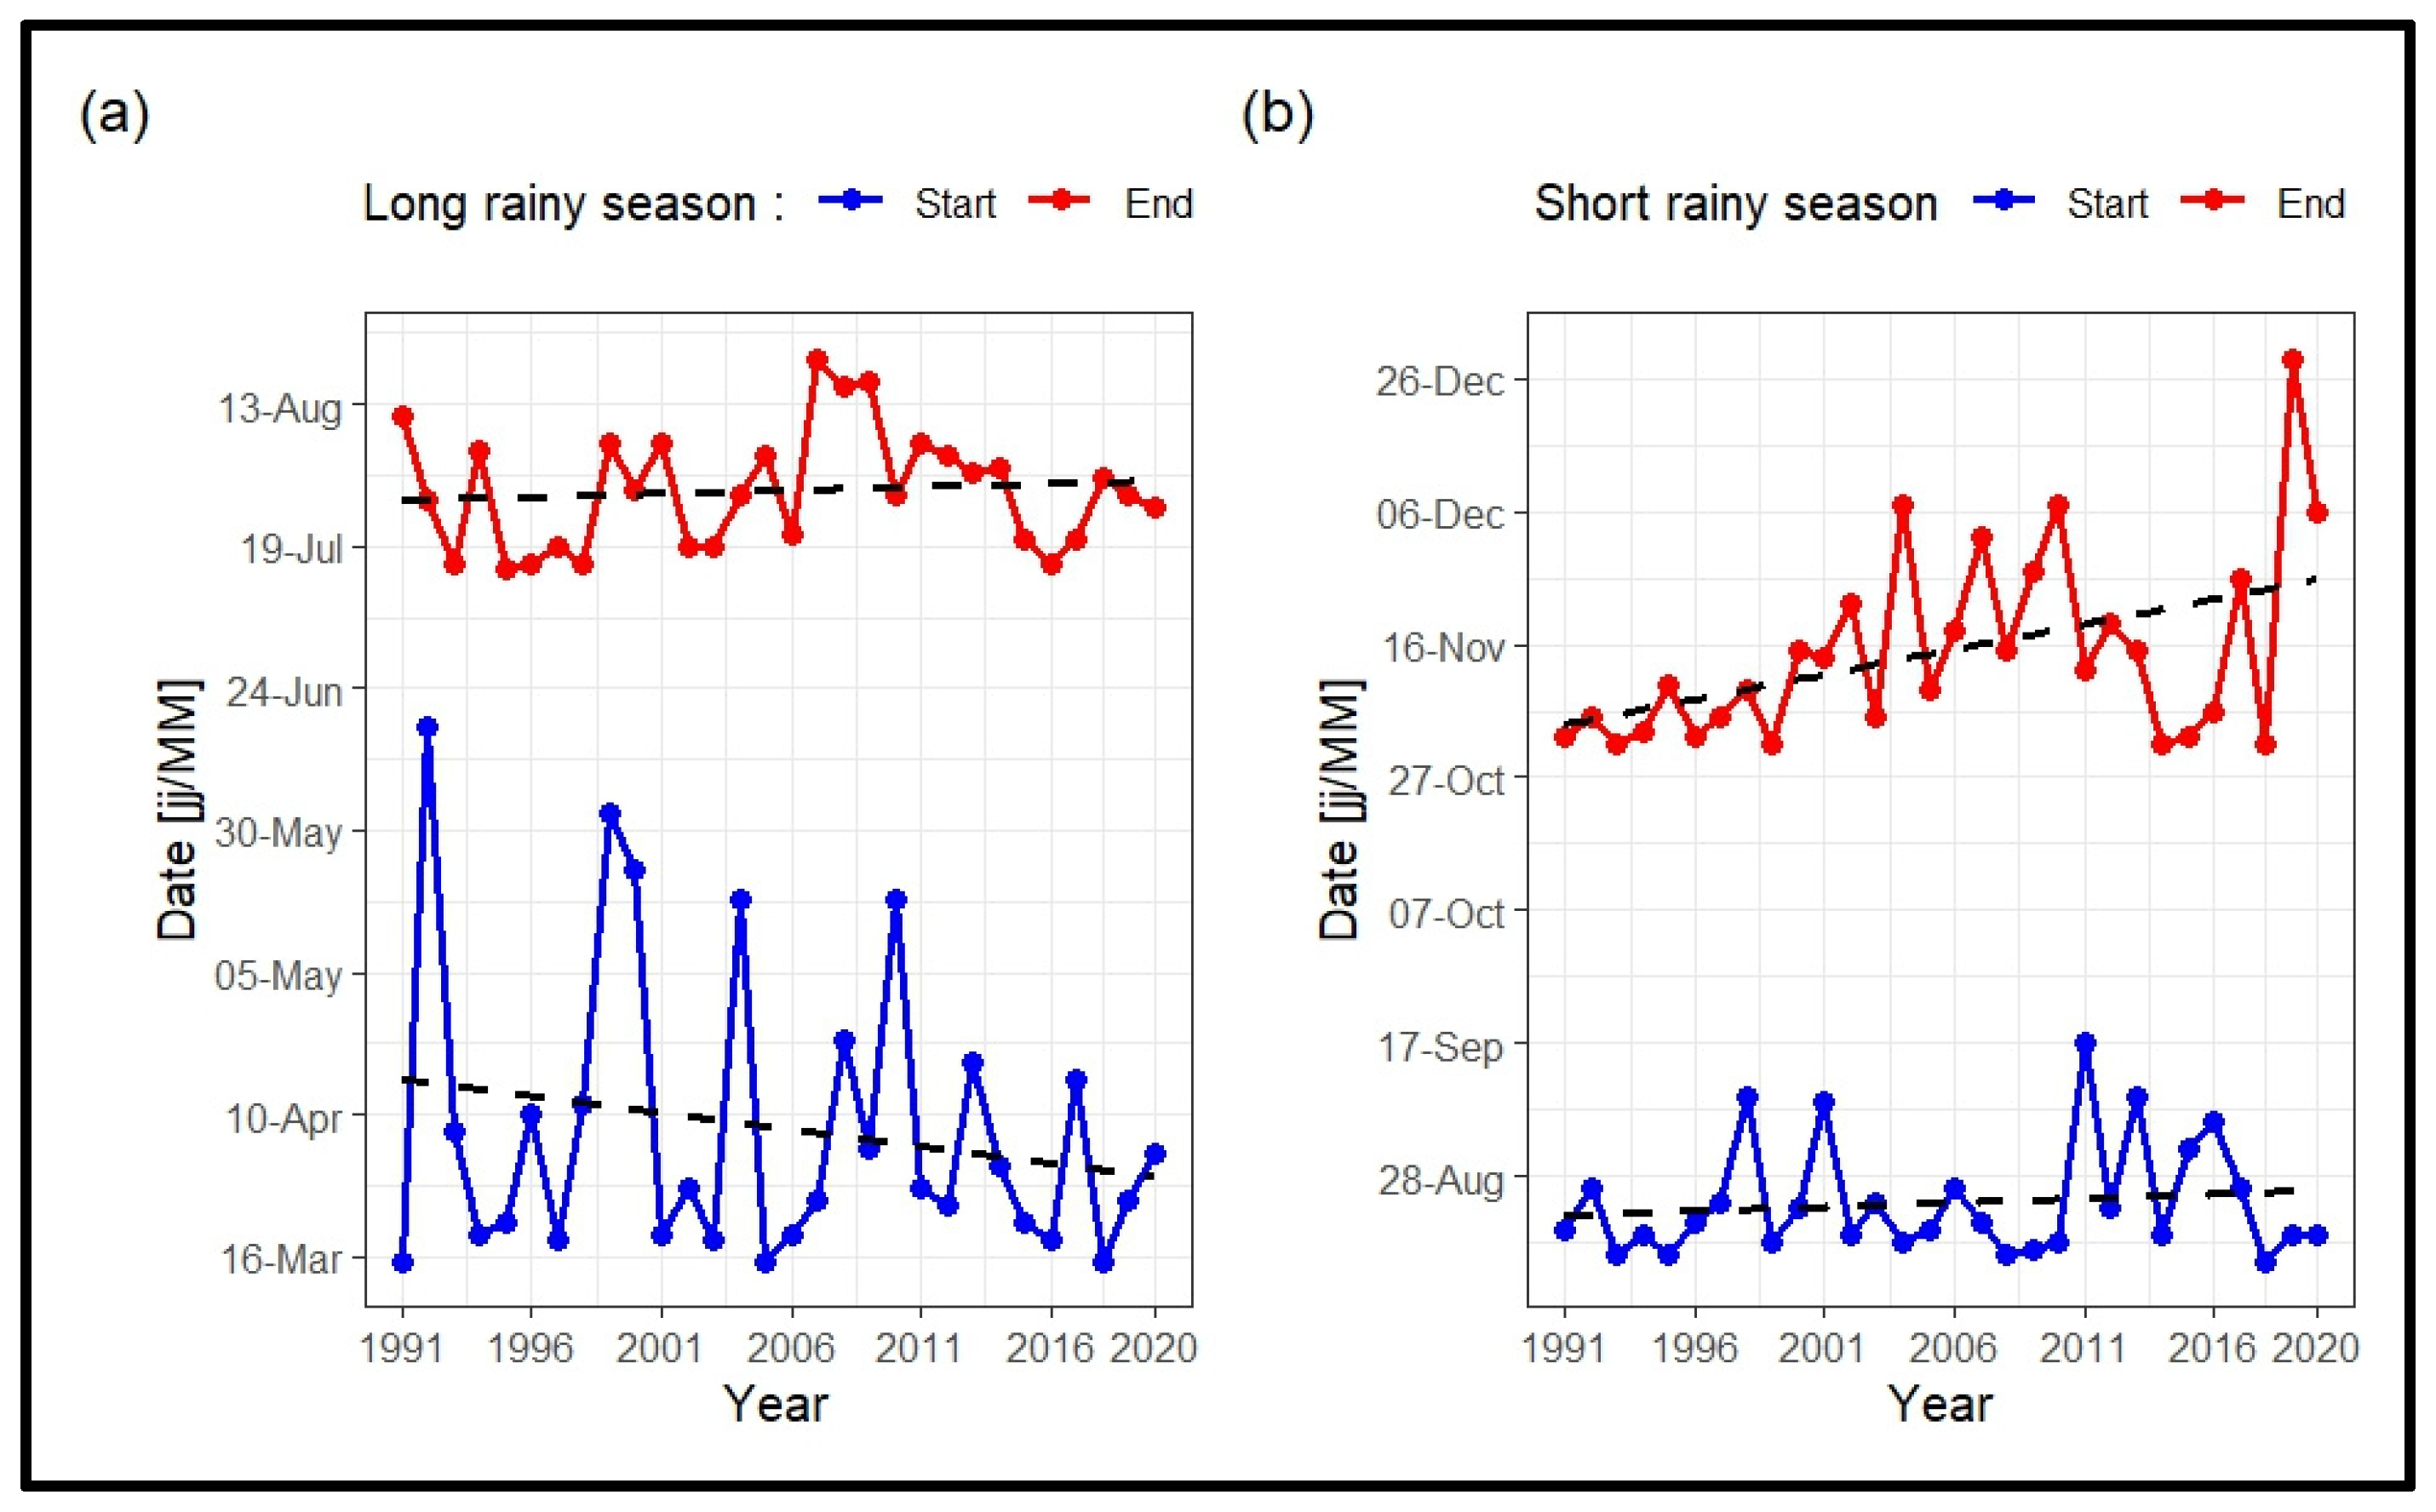
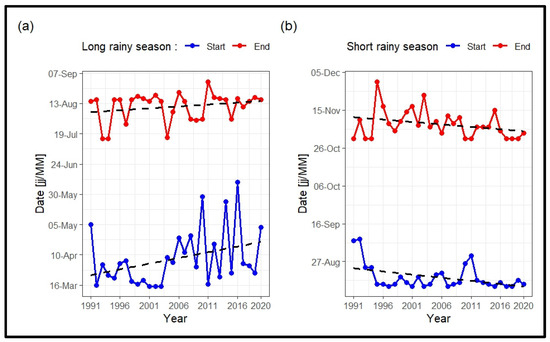
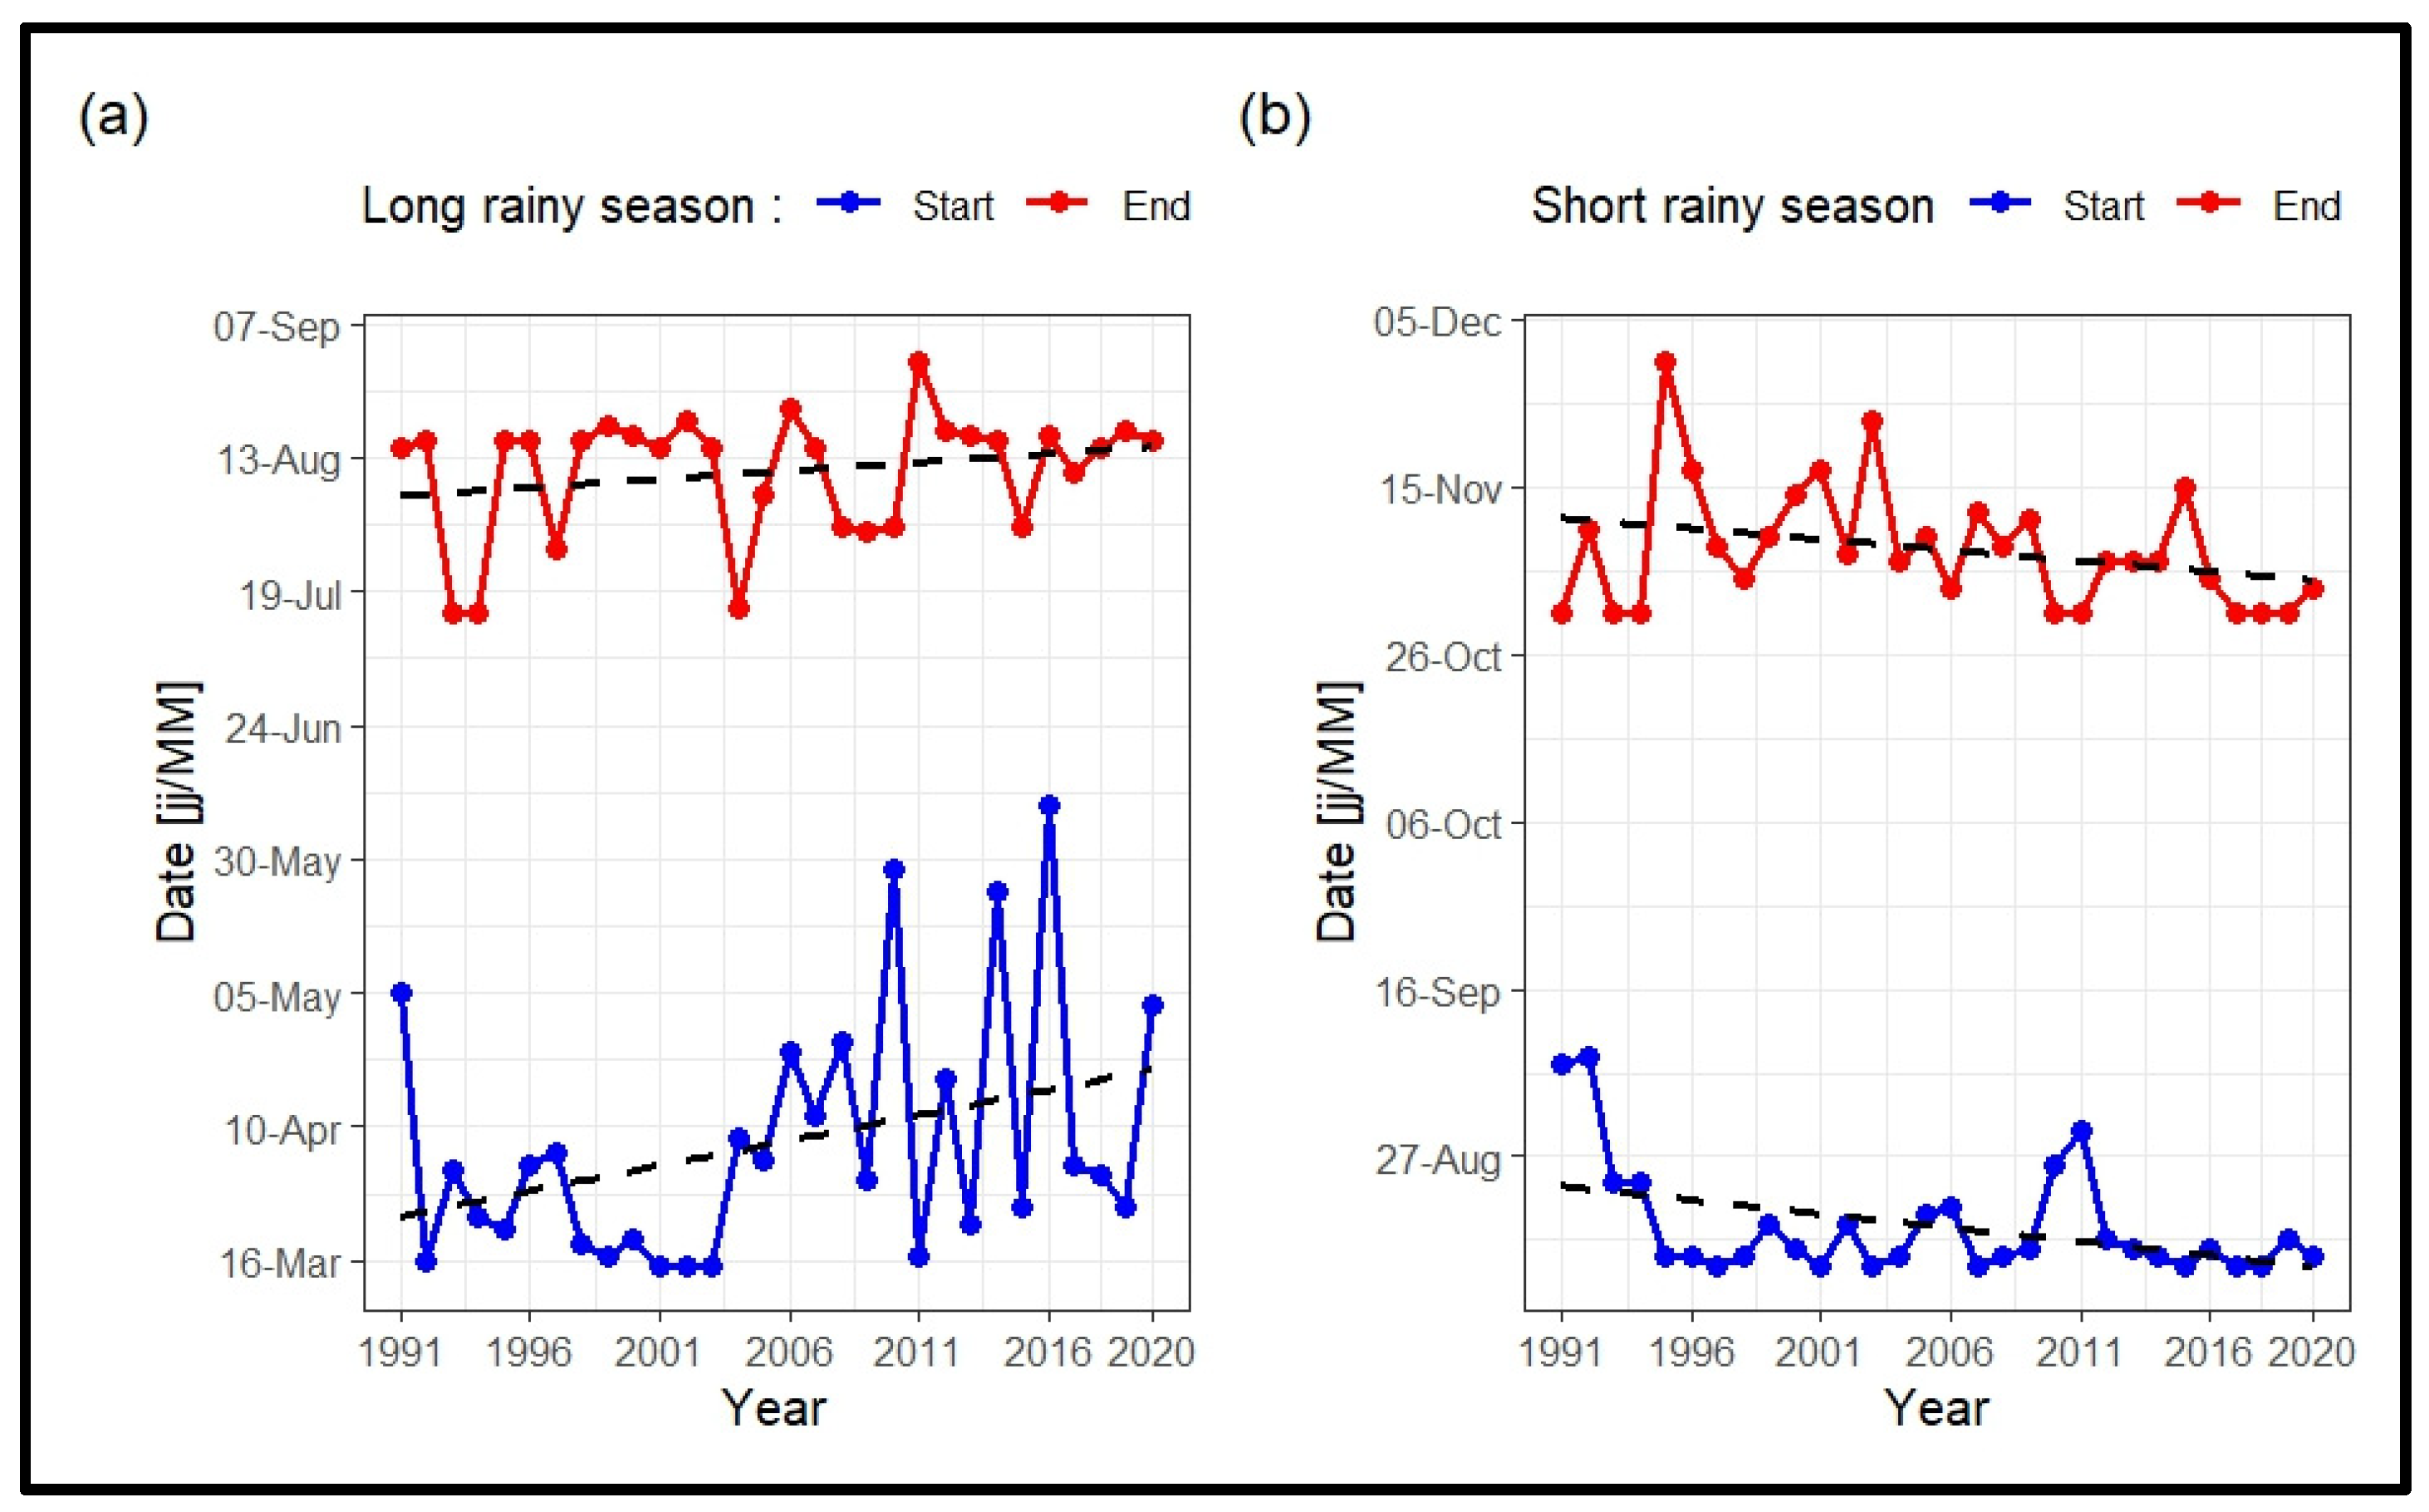
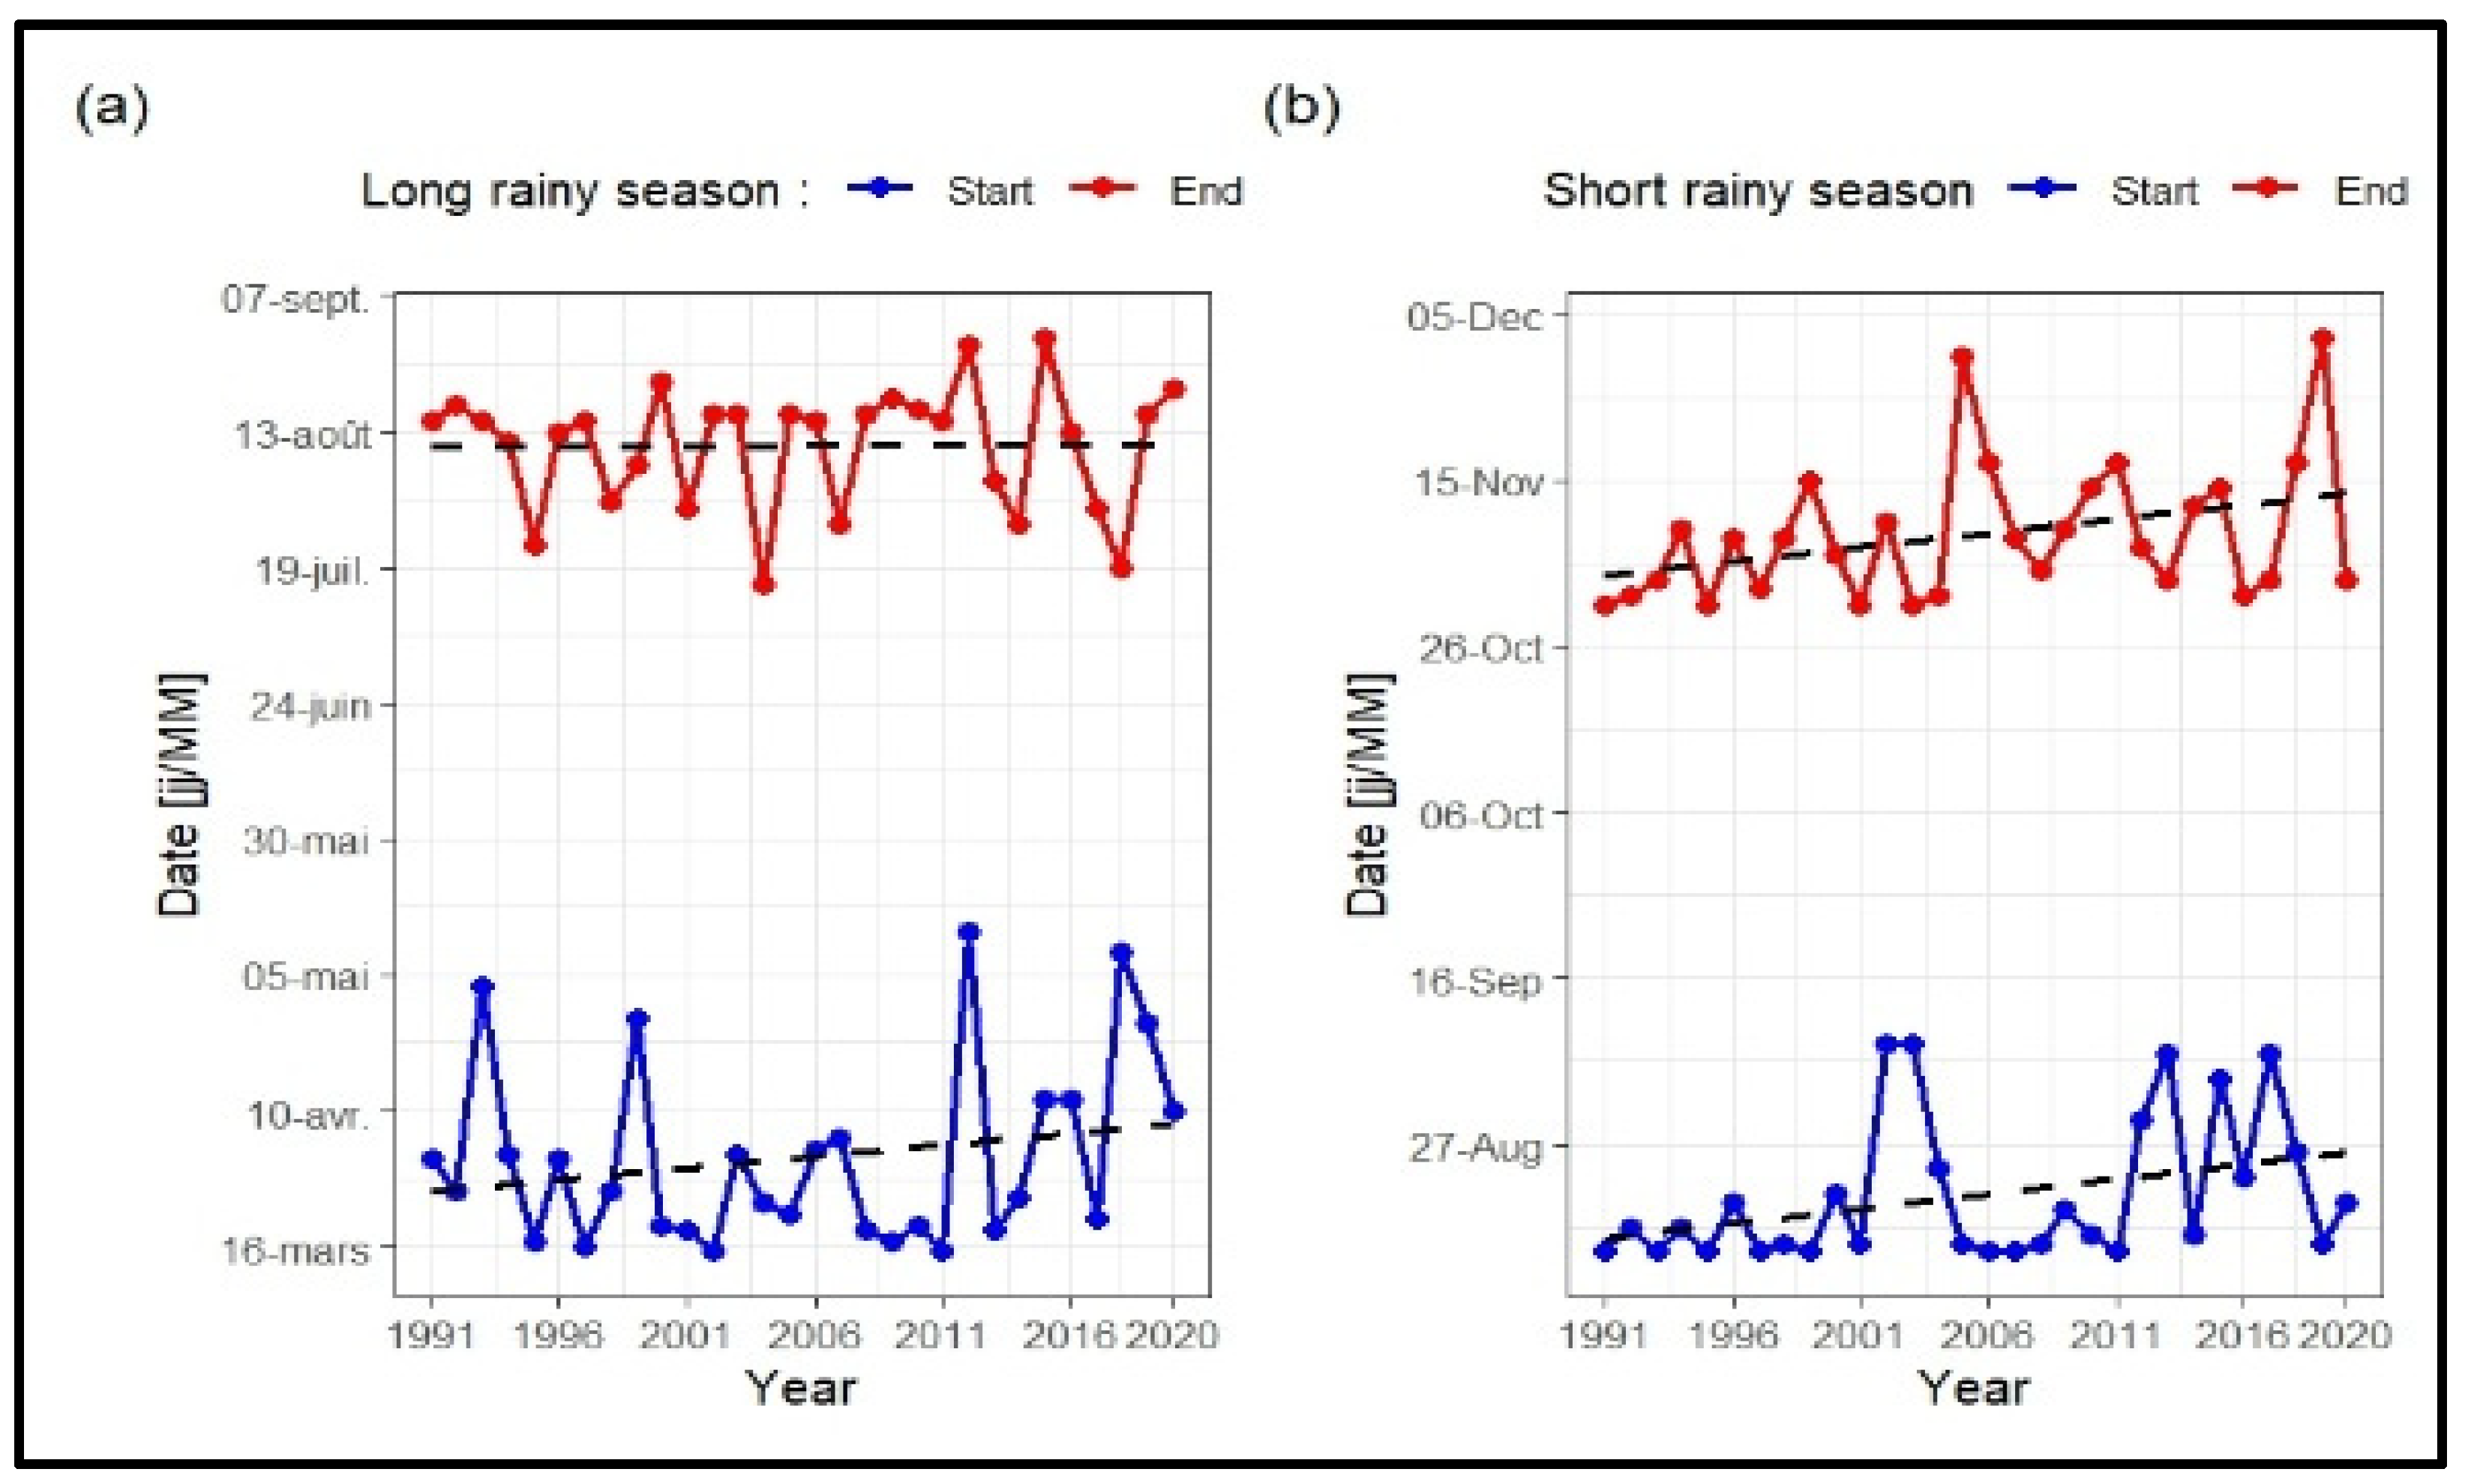
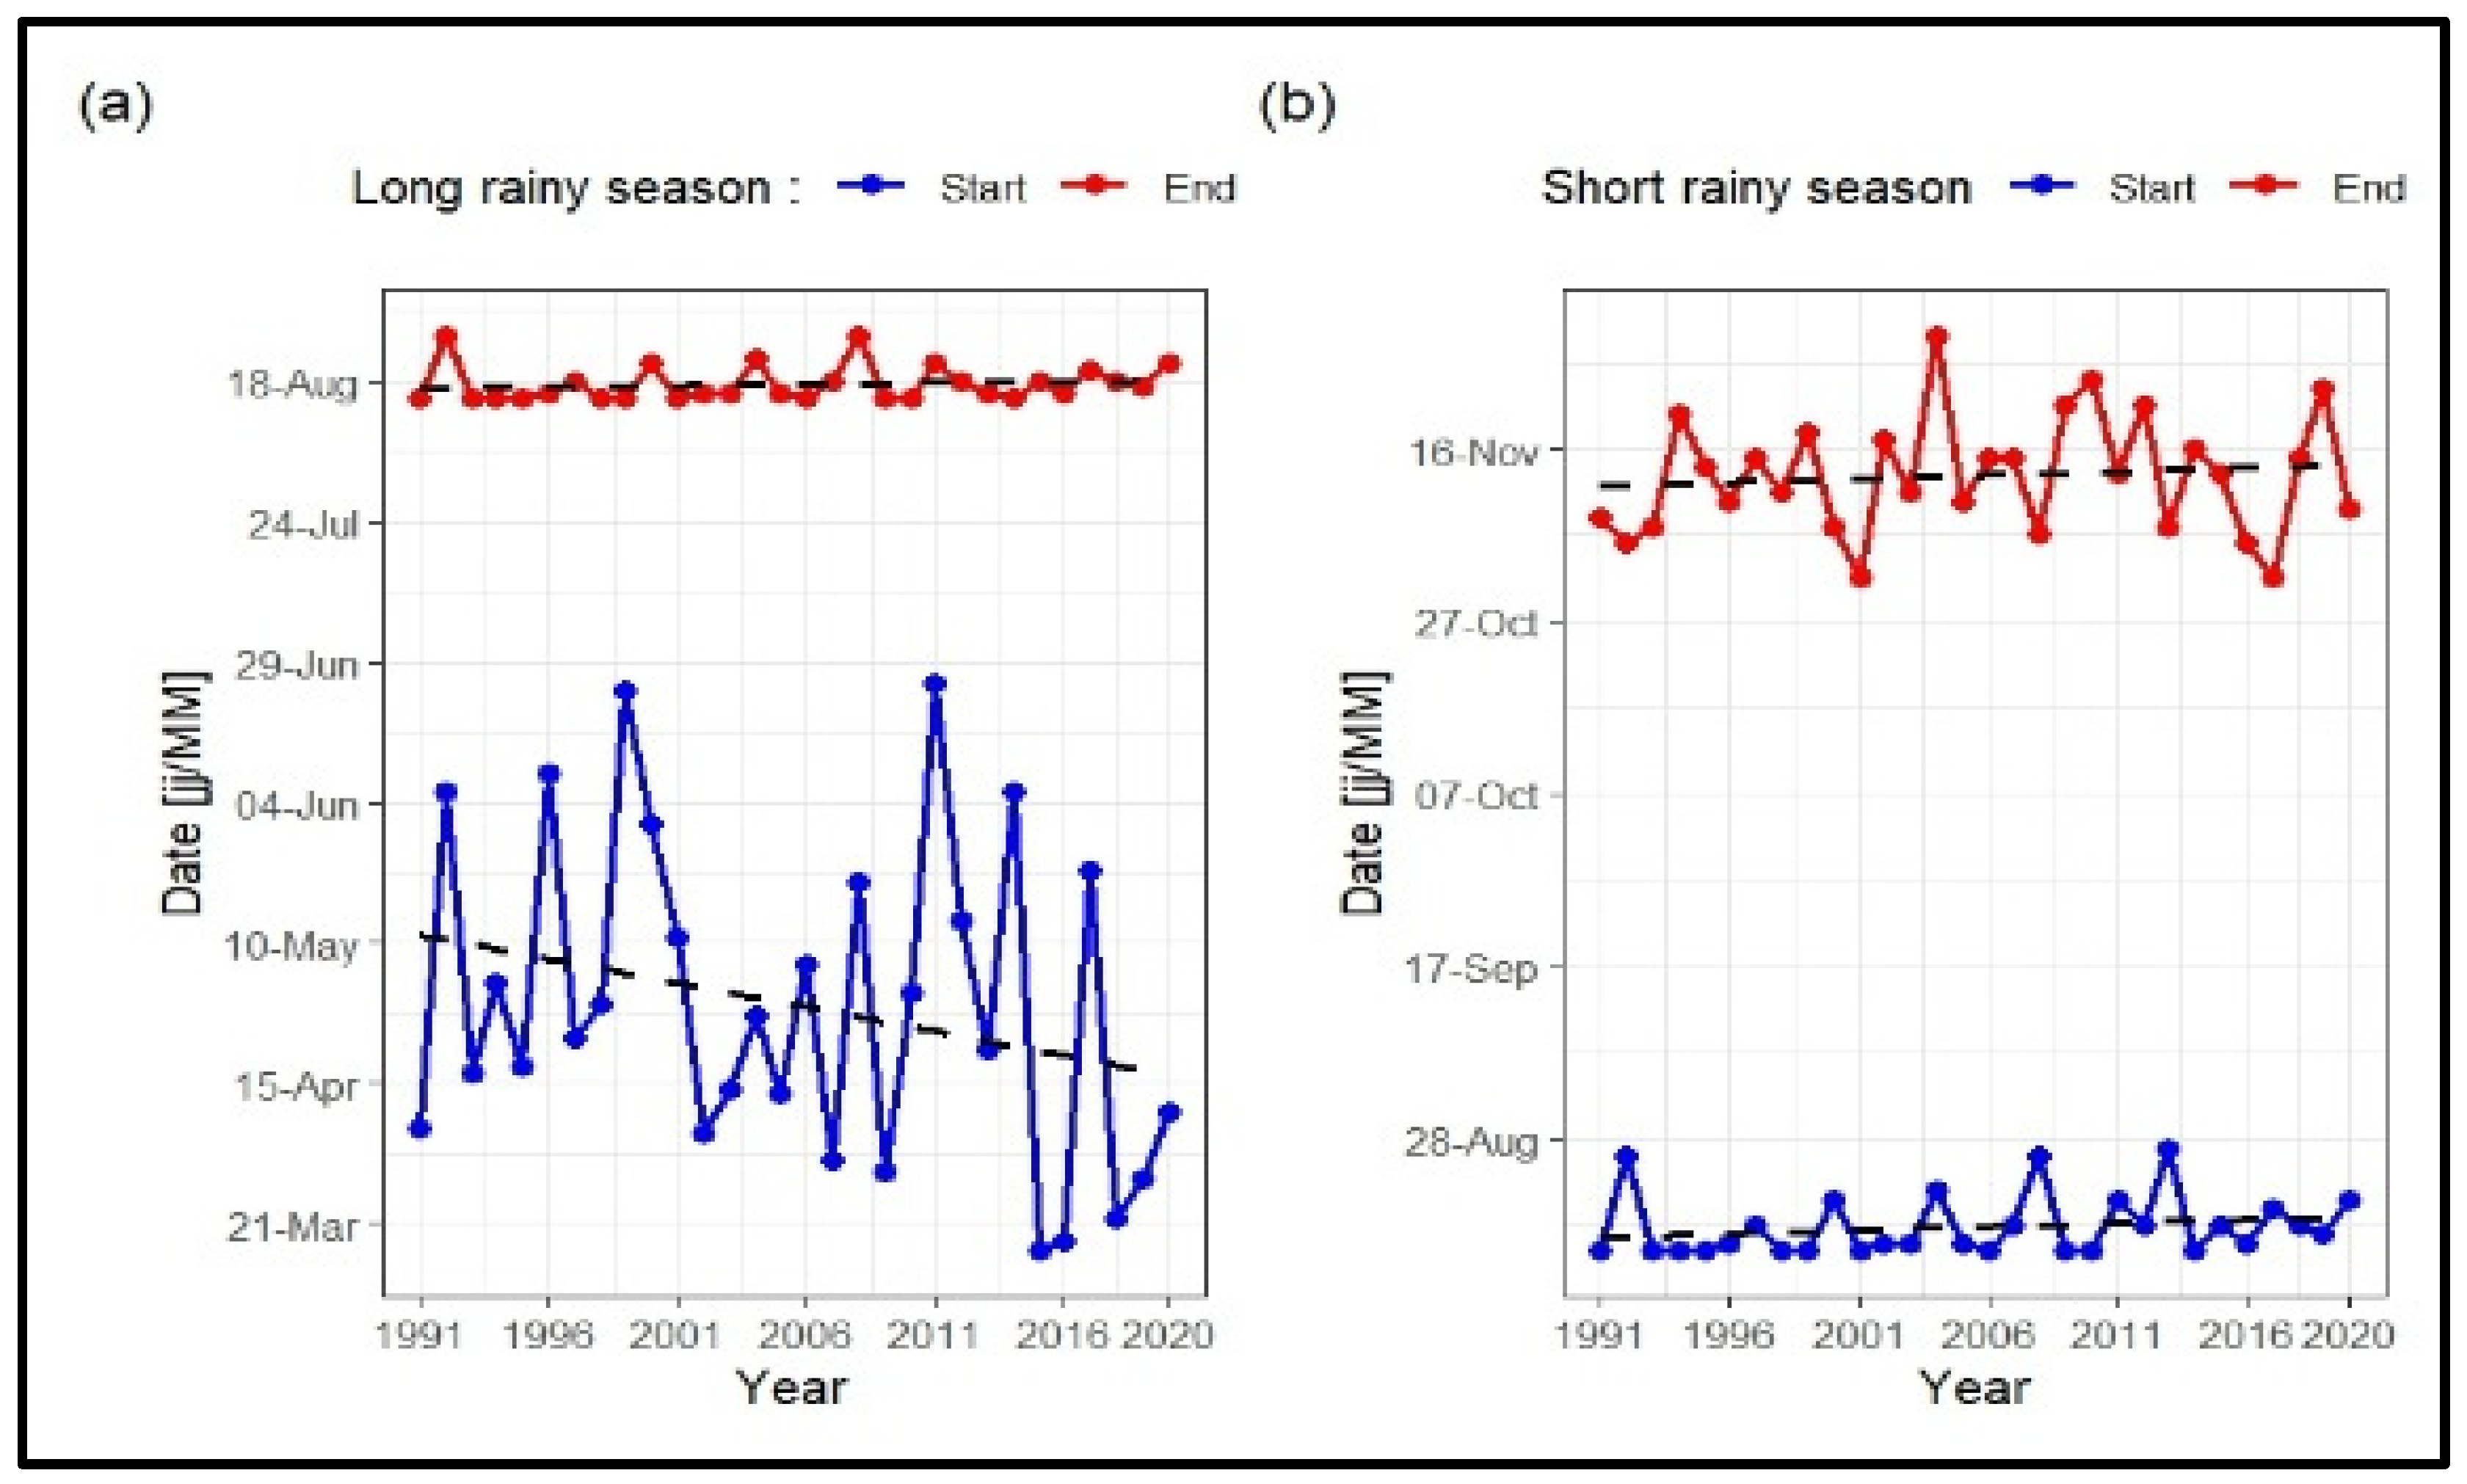
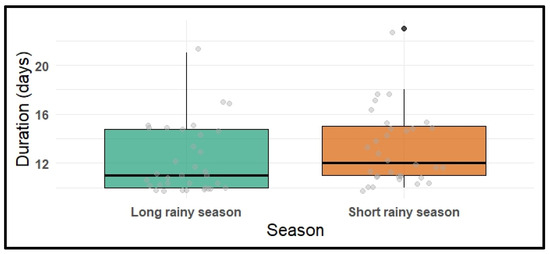
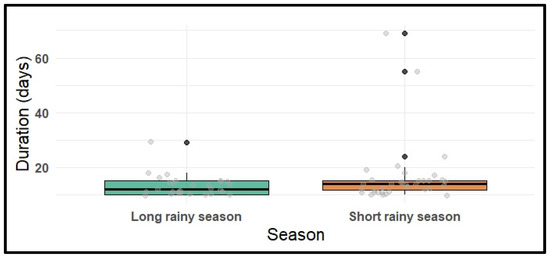
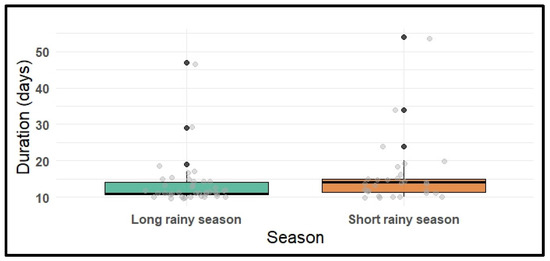
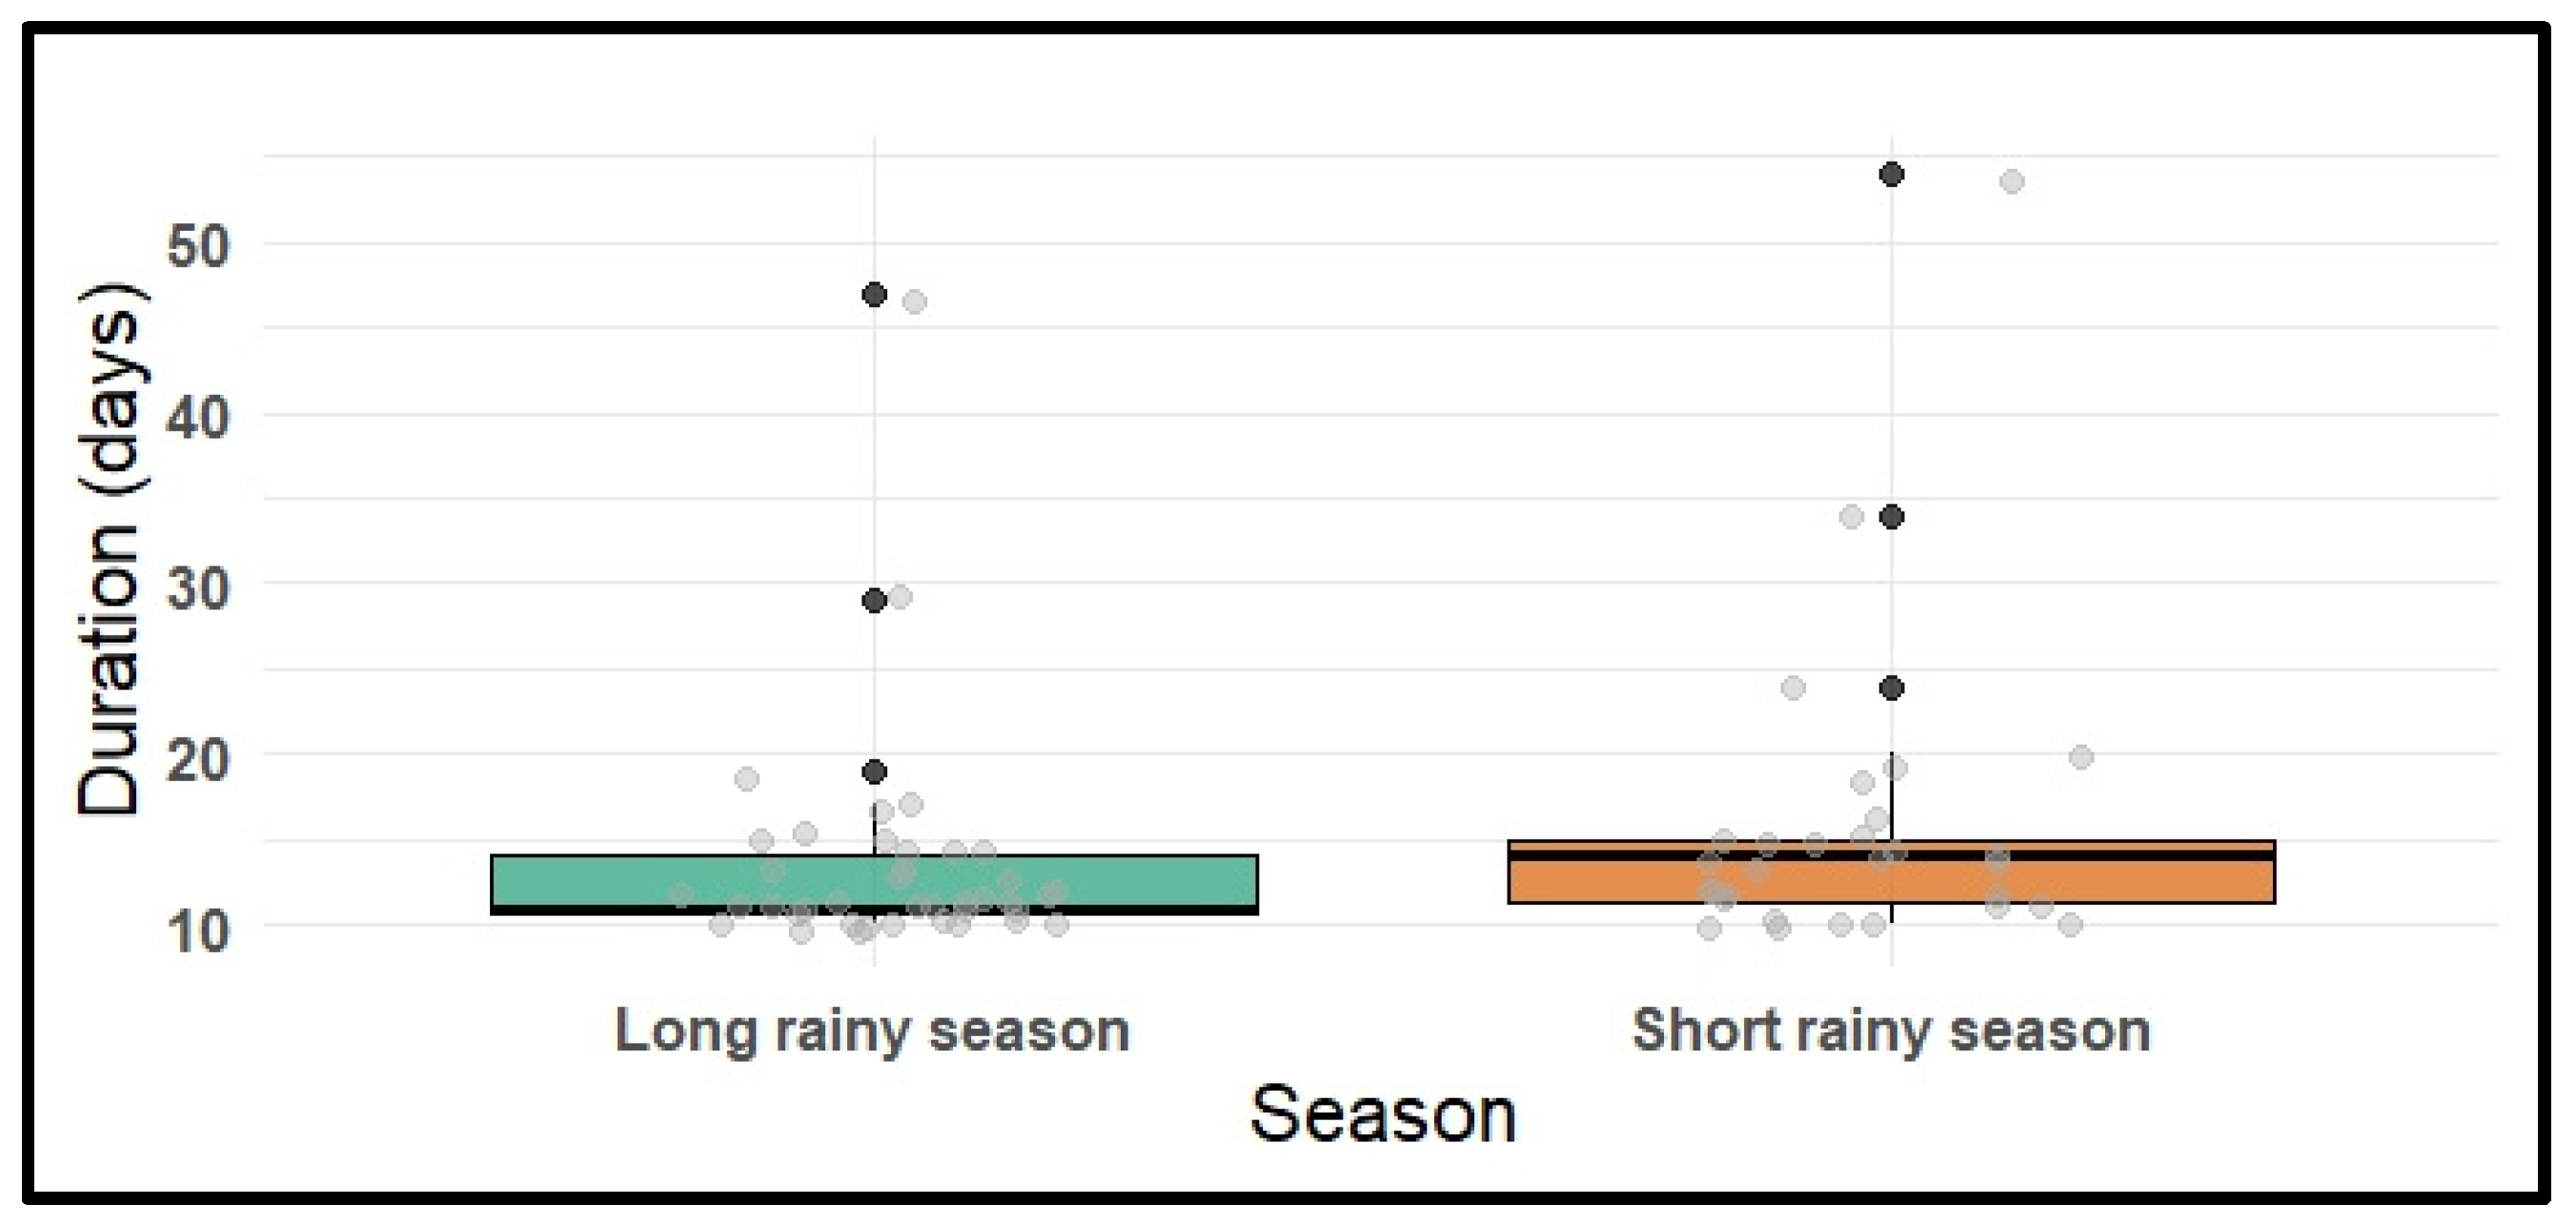
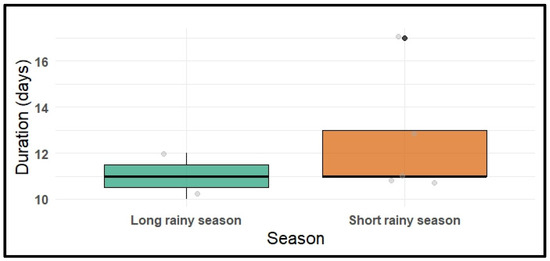
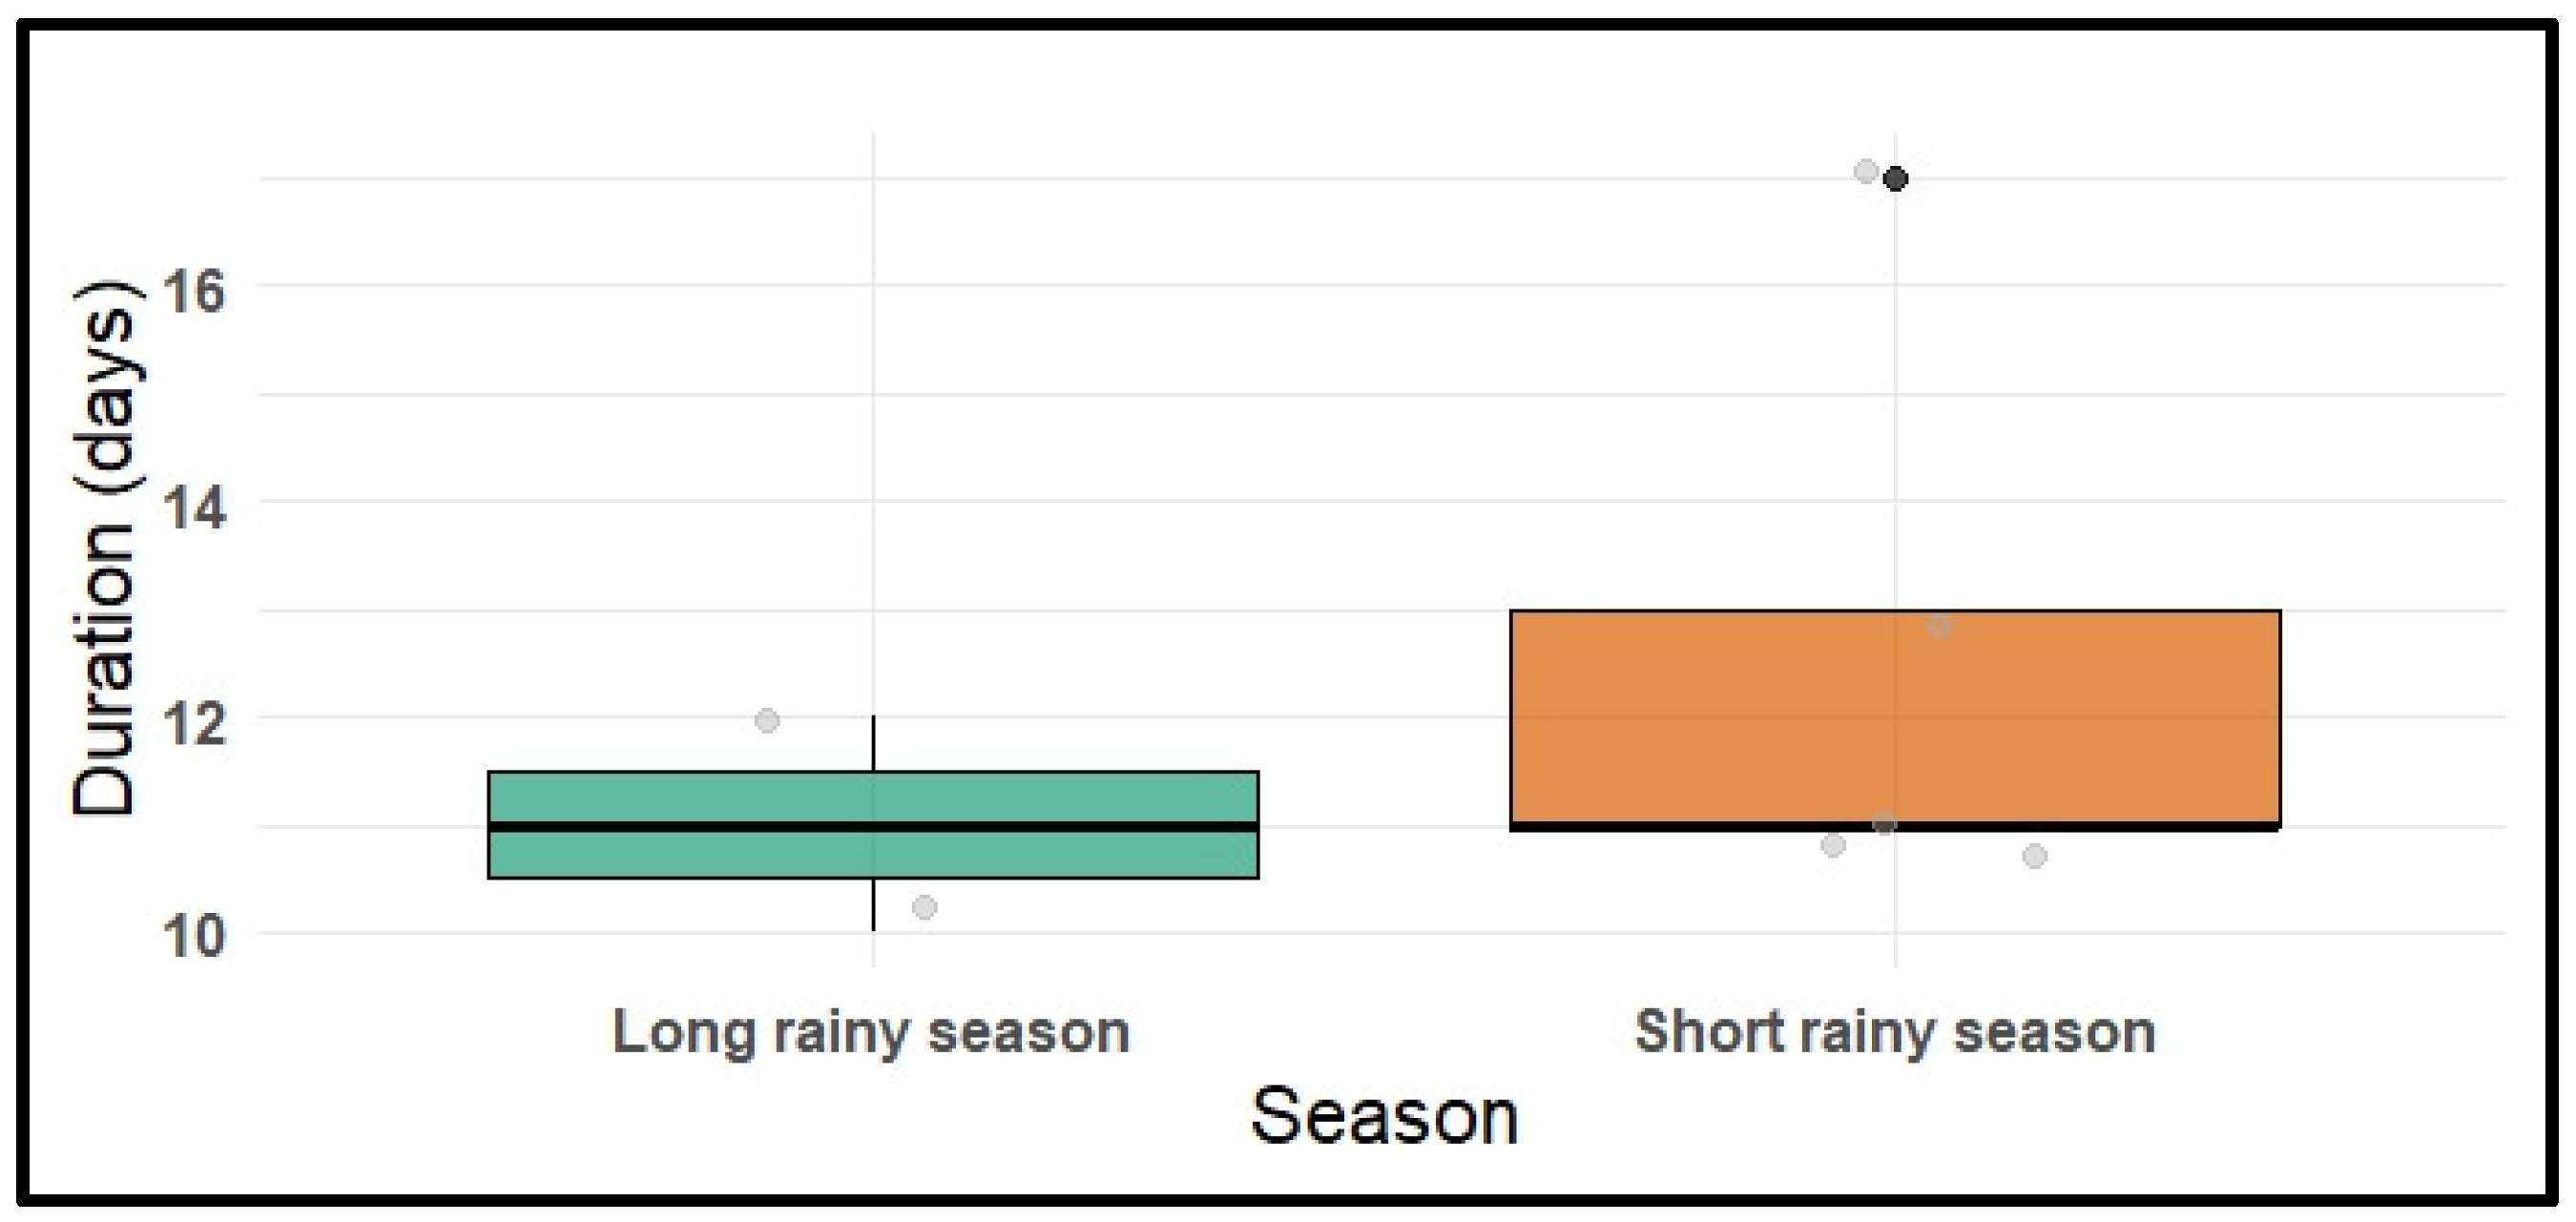
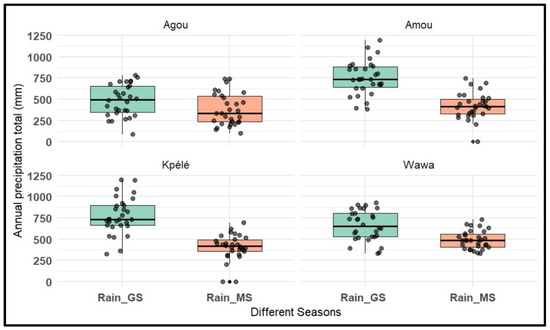
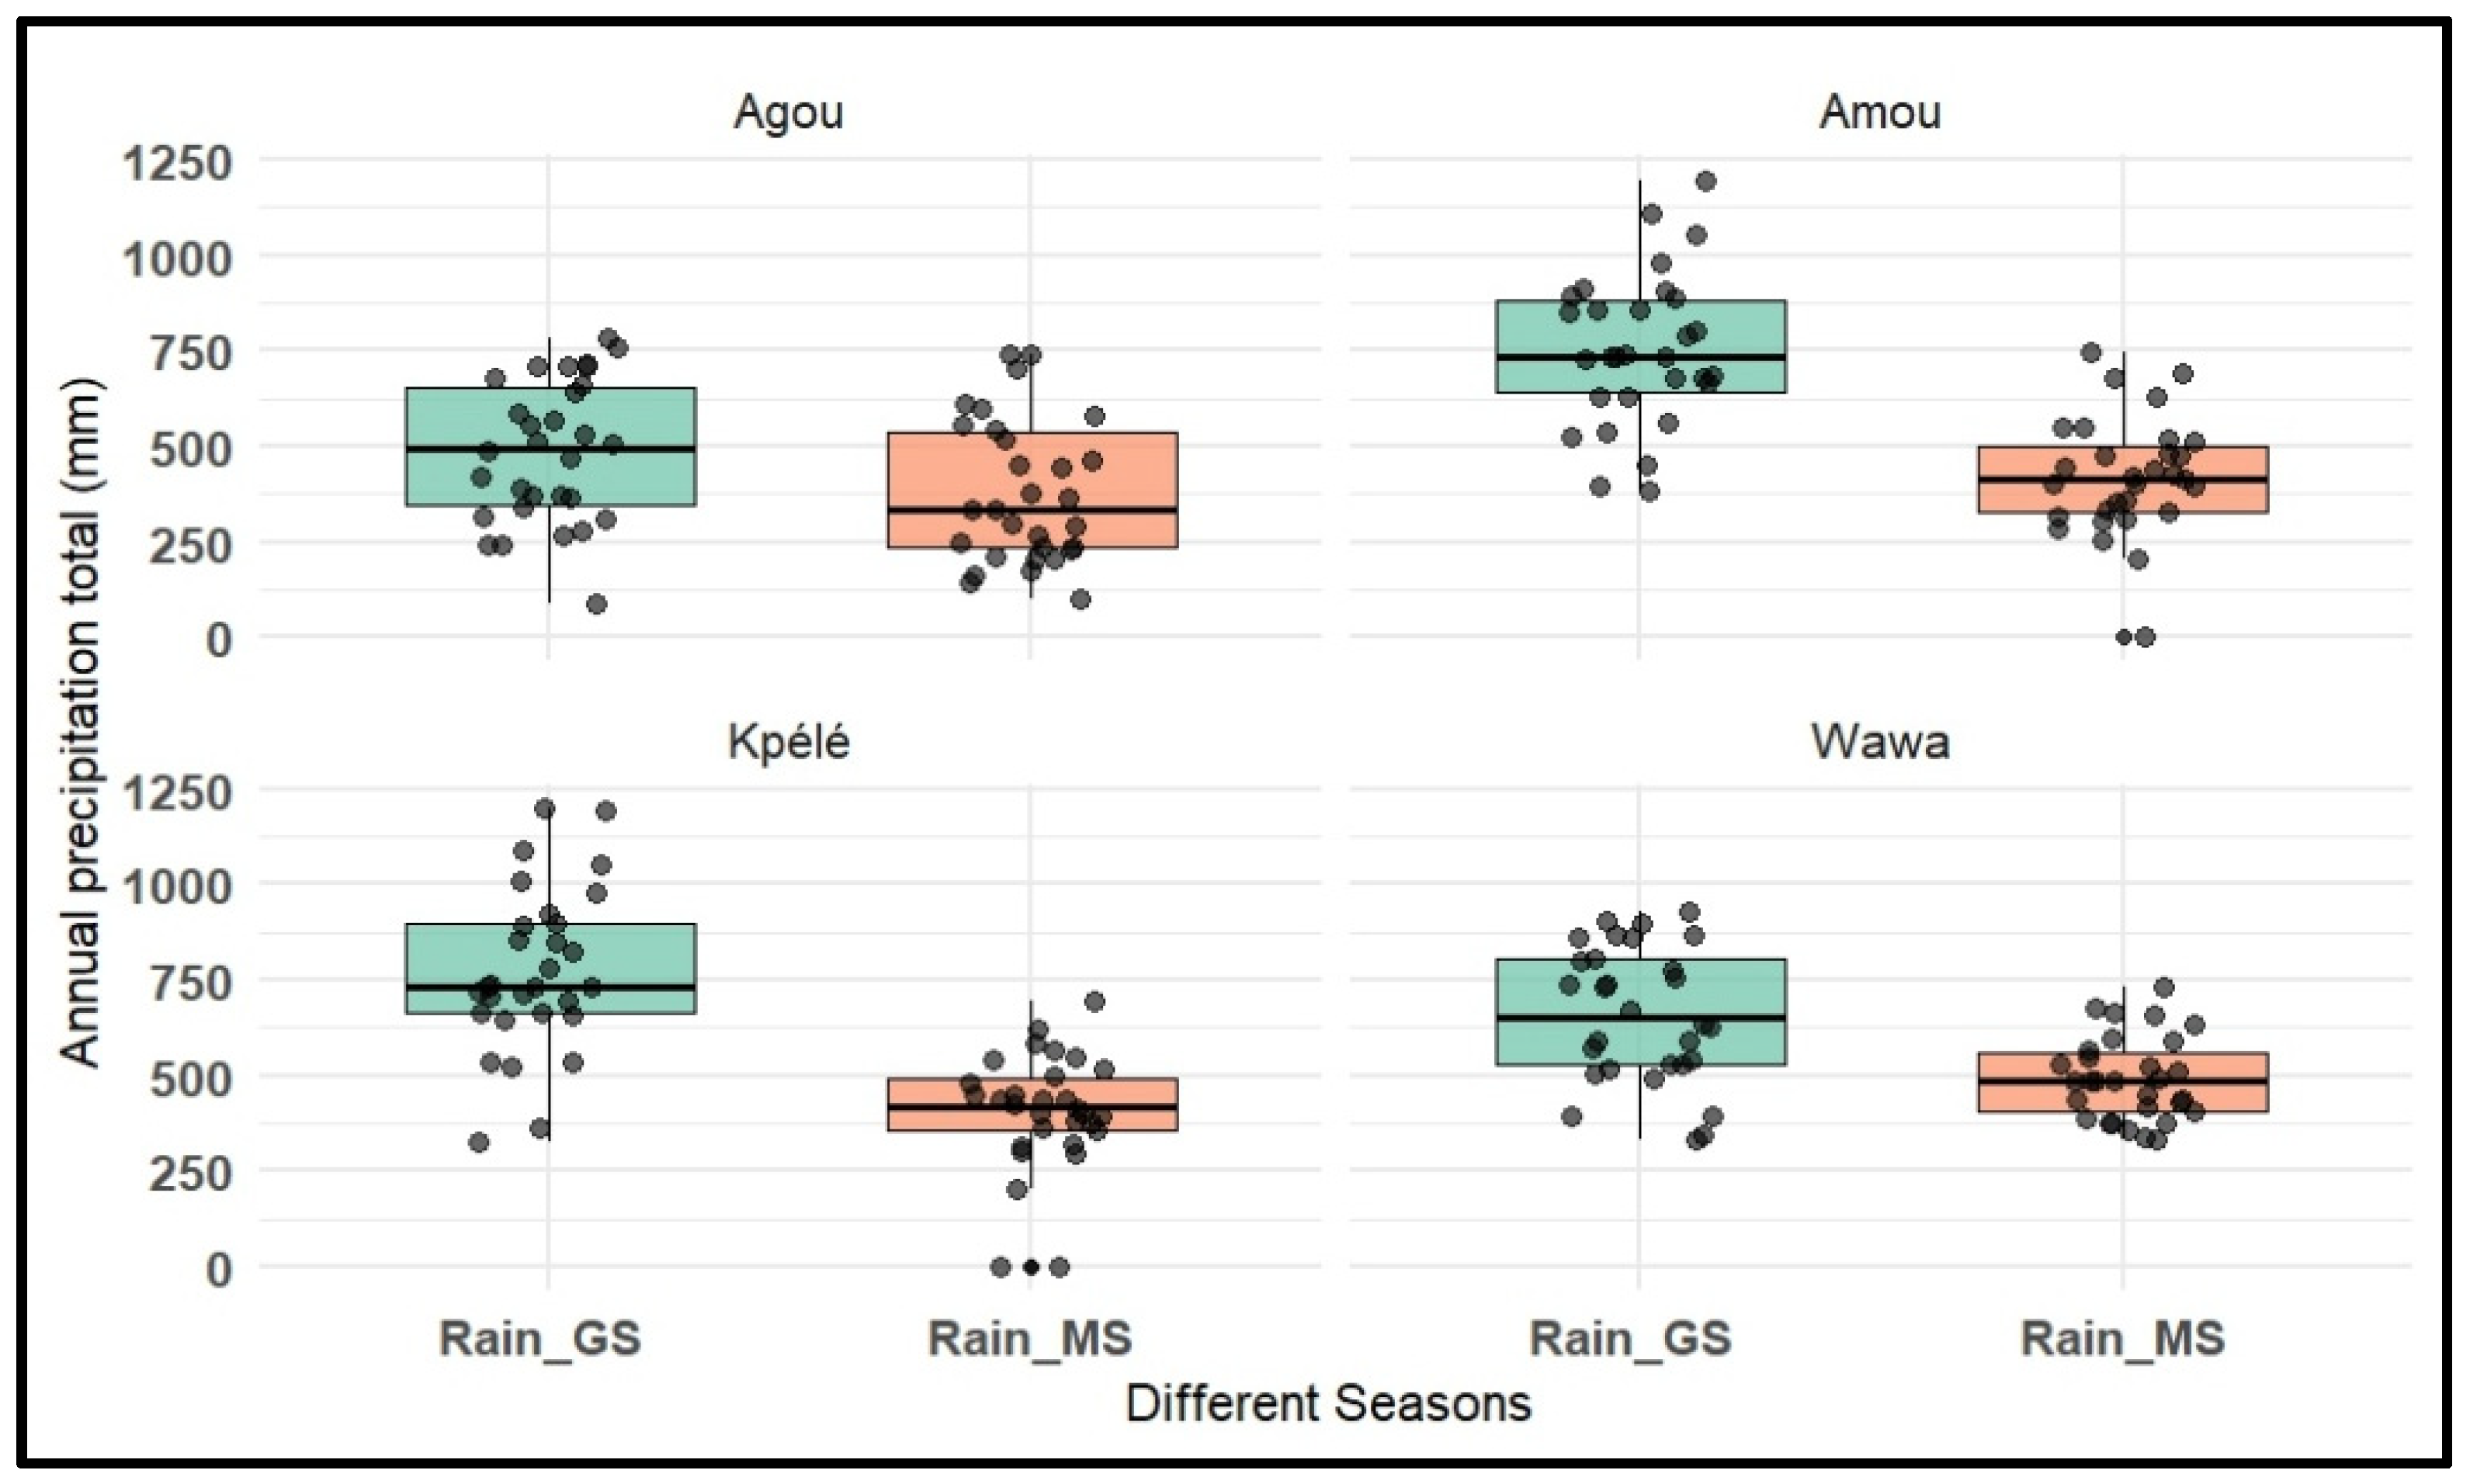

Disclaimer/Publisher’s Note: The statements, opinions and data contained in all publications are solely those of the individual author(s) and contributor(s) and not of MDPI and/or the editor(s). MDPI and/or the editor(s) disclaim responsibility for any injury to people or property resulting from any ideas, methods, instructions or products referred to in the content. |
© 2026 by the authors. Licensee MDPI, Basel, Switzerland. This article is an open access article distributed under the terms and conditions of the Creative Commons Attribution (CC BY) license.