


Abstract
Seismic Shake-e is a free app that provides valuable data and tools related to earthquakes, covering the stages before, during, and after seismic events. In this text, we describe the main features of the Seismic Shake-e 2.1 (SSe) app, the considerations that guided its development, examples of its use, and the challenges for future versions. Version 1.0 of this app was awarded as one of the winners of EOVALUE: Call for Innovative Apps in environmental and social fields, a project by the Joint Research Centre (JRC), the European Commission’s science and knowledge service. SSe recognizes two user levels: basic and intermediate/advanced. There are six modules for each level. The main topics of these modules for both user types are: (1) Accelerometer Networks (AN), (2) Seismograms Analyzer-e (SAe), (3) Seismic Design of Buildings (SDB), (4) Earthquake Preparedness (EP), (5) Earthquake Early Warning Systems (EEWS) & Tsunami Warning Systems (TWS), and (6) Earthquake Emergency Response & Recovery. The two key modules are AN and SAe: the first explains how to obtain seismic records, and the second provides tools for their analysis. We include some applications of SSe, along with their results and discussion. We also list the advantages of the main modules and discuss potential future developments and improvements. The uniqueness of this work is that we highlight the software’s essential features and demonstrate its applications.
1. Introduction
1.1. Software
Generating knowledge in seismology and earthquake engineering often demands significant computational resources, as well as specialized hardware and software. Additionally, applying expertise in these areas usually involves intensive computational processes. As a result, developing software and practically implementing the acquired knowledge has been essential for advancing seismology, earthquake engineering, and their applications. For example, today we use software for the following:
- Recording the ground motions (Scream! [1], Rockhound [2], etcetera).
- Performing probabilistic seismic hazard assessment (CRISIS2025 [3], etcetera).
- Modeling buildings and performing the structural analysis and the structural design of them (OPENSEES [4], etcetera).
- Processing the seismic ground motions (DEGTRA A4 [5], Seismosignal [6], “Strong ground motion data processing” (ESM) [7,8], etcetera):
- -
- DEGTRA A4 [5]. This is free software that processes seismic records from external sources.
- -
- Seismosignal [6] is an app with a commercial license, that enables processing of seismic ground motions obtained from external sources.
- -
- “Strong ground motion data processing” (ESM). This app is a web service or a web application for processing strong ground motion data [7,8]. In this case, the app serves as an additional tool for the seismic records database [9,10], which is also managed by the developers of this app.
1.2. Data
Data is a crucial element in developing research projects. Because of its importance, the European Commission, countries, and institutions have initiated projects to collect and share research-grade data. In the case of seismic records, notable examples include seismometer networks and web platforms for sharing seismic data. In this context, the Joint Research Centre (JRC) [11], part of the European Commission, developed EOVALUE: a call for innovative apps in environmental and social domains. One goal of this call was to help increase the use of valuable Earth data available on platforms created through various projects supported by the European Commission [12,13].
On the other hand, although there are no public seismic records for all regions of the world, valuable data exist in many areas in sufficient quantity and quality to increase their use and help generate more knowledge about earthquake phenomena. For example, the Mw = 7.6 earthquake that occurred on 1 January 2024, in Japan was recorded by 1050 seismic stations, and all the seismic records from these stations are publicly available [14].
1.3. Communication of Seismic Hazard and Seismic Risk
Regarding seismic risk, Musacchio et al. (2023) [15] recently highlighted that at-risk communities often lack awareness and preparedness. They also discuss the development of seismic risk communication and emphasize the need to pay more attention to its importance and how to improve it to increase the chances of success. In summary, various studies agree on the importance of expanding our communication strategies about seismic risk to reach a larger population, especially in hazard-prone areas [16,17,18,19].
1.4. Seismic Shake-e 2.1 App (SSe)
In developing version 2.1 of the Seismic Shake-e app, we considered the context described in Section 1.1, Section 1.2 and Section 1.3 to define the following three main objectives of SSe 2.1:
- Regarding the situation described in Section 1.2, SSe aims to promote greater use of earthquake-related data. For example, it includes statistics on seismic record availability, seismic data, ground motions features such as accelerations, velocities, and displacements, information on how seismic ground motions impact different types of structures (including response spectra of acceleration, velocity, and displacement), seismic building codes, seismic hazard data, seismic risk data, reports from Earthquake Early Warning Systems, damage assessments in cities using satellite imagery, and more. All these data sources are publicly accessible and can help deepen our understanding of earthquakes and their impacts. One of SSe’s primary goals is to share valuable earthquake-related data to generate new insights and support informed decision-making about earthquakes and their consequences.
- Regarding the scenario in Section 1.3, SSe aims to help share valuable knowledge in earthquake engineering and seismology. A few apps like this exist that provide earthquake-related data, such as seismic risk, to the general public. This information can help people make better decisions. For example, each individual can decide how much seismic risk they are willing to accept in different aspects of their lives. When assessing risk, it is helpful to consider whether it can be avoided, mitigated, transferred, or accepted. One way to reduce personal seismic risk is to live in a building with a low seismic risk rating. To support this, the Mexican Society of Structural Engineering created a guide for responsible homebuyers and landlords [20]. Another personal step is to transfer risk by purchasing insurance that covers injuries, damage to the house’s structure, and contents caused by earthquakes. In addition to personal actions, people can also influence the government to implement measures that reduce or transfer seismic risk in cities. In all these cases, understanding seismic risk is vital; therefore, clear communication is essential. The SSe app provides important earthquake information to help people make informed decisions to reduce seismic risk and encourages more participation in mitigation efforts.
1.5. Content
To outline the key features, applications, and challenges of SSe 2.1, this document is divided into the following sections: Introduction, Methods, Results, and Discussion. In the introduction, we explain the context in which SSe was created and describe the main app’s features. The Methods section includes a subsection for each of the six SSe modules. Module 1, Accelerometer Networks (AN), provides information about accelerometer networks worldwide and offers examples of important networks ranked by station count and by the availability of seismic records at their stations. It highlights networks within a single region of a country, networks covering an entire country, and regional projects involving multiple countries, such as the European Station Book Portal [21]. Additionally, for national networks, Module AN includes information and a link to the Japanese ground-motion database, which aggregates records from more than 10,000 seismic stations [14]. Similarly, this module references data from the International Federation of Digital Seismograph Networks (FDSN) website [22,23], where users can access primary data for accelerometer networks worldwide.
This document also outlines key parts of a study we developed using seismic records from Mexico obtained from the RAII-UNAM [24], one of the references for Module 1 of SSe. The primary purpose of this study was to demonstrate the types of research possible with SSe modules 1 and 2. Specifically, in this subsection, we describe the data (seismic records from the 19 September 1985 earthquake in Mexico City) and the study’s procedure.
Module 2 corresponds to Seismograms Analyzer-e, which processes seismic ground motions. With this module, for example, it is possible to analyze seismic records downloaded from some of the seismic networks mentioned in Module 1. Specifically, this module allows for computing velocities, displacements, response spectra of pseudo-accelerations, pseudo-velocities, and pseudo-displacements, as well as other parameters such as Arias intensity. This module is the most important because it offers a versatile tool for processing seismic records. In this section, we include the equations this module uses to calculate parameters, such as the standardized cumulative absolute velocity (). Additionally, we highlight aspects of the study conducted using seismic records from the 19 September 1985, Mexico City earthquake, as referenced in Module 1. We use Module 2 to compute response spectra of pseudo-accelerations and the .
Module 3, Seismic Design of Buildings, considers the fundamentals of seismic design for structures. Specifically, the module includes examples of seismic codes from various countries. For instance, it highlights the Mexico City seismic code, which is frequently updated; the most recent version is from 2023 [25].
Module 4, Earthquake Preparedness, emphasizes the importance of assessing seismic hazard and risk to guide decisions that decrease the seismic vulnerability and risk of buildings. This module provides a basic framework for performing a Probabilistic Seismic Hazard Assessment (PSHA), along with seismic hazard maps developed by other researchers and hazard maps for Mexico that we created for their inclusion.
Module 5, Earthquake Early Warning Systems & Tsunami Warning Systems, highlights and explains the technical details of the Earthquake Early Warning Systems (EEWS) and Tsunami Warning Systems (TWS). For example, this module describes Mexico’s successful EEWS. It also provides various examples, such as the sound played through speakers at public locations in Mexico City that warns of the imminent arrival of seismic waves from a distant earthquake. Additionally, it discusses earthquake reports, which were assessed to determine whether a warning was necessary and which cities received the alerts.
Module 6, Earthquake Emergency Response & Recovery, highlights critical services that organizations can utilize to speed up response times during emergencies. It also provides examples of satellite imagery that can be developed to identify, for example, earthquake-related damage in cities. This type of service is especially useful when an earthquake has damaged roads, blocking access to certain urban or rural areas.
In the results section, we highlight the vintages and challenges of the main modules of SSe. Additionally, we present the primary findings from the studies discussed in modules 1 and 2 related to the analysis and processing of seismic records. Finally, in the discussion section, we emphasize the key findings of the study and address several challenges, including: (a) the importance of conducting further research, such as the studies presented here, using existing valuable data to identify additional parameters related to the damage potential of ground motions across large areas of the world; (b) the need to generate new seismic data, improve public access to it, and apply it in future research; and (c) improvements and distribution of SSe.
2. Methods
In this section, we describe the main features of each of the six SSe modules for both intermediate–advanced and basic users. At the same time, for each module, we highlight an example of data that can be obtained using the references or tools for that module. Then, we process the data to obtain results, which are described in the results section for each module. Finally, a section discusses the results for each module. The uniqueness of this work is that we describe the software and also show its applications. For this reason, the paper includes comments on the software, as well as results and discussions of the application examples for the different modules of SSe. In the following sections, you will find the comments related to each module and its corresponding application example with the data, results, and discussion.
2.1. Development of Seismic Shake-e
We developed the Seismic Shake-e 2.0 app [26] (Figure 1) primarily to address the three needs discussed in Section 1.1, Section 1.2 and Section 1.3. SSe 2.1 is a recent tool for seismology and earthquake engineering. It can benefit students, civil engineers, researchers, and anyone interested in learning about earthquakes, especially topics like acquiring and processing seismic records. To boost the number of researchers accessing valuable seismic data, SSe emphasizes the public availability of seismic records on various web platforms. Additionally, SSe includes the versatile Seismograms Analyzer-e 2.0 tool for processing seismic records. The SSe app also covers other topics, including seismic hazard and risk. It features six modules focused on: (1) Accelerometer Networks (AN), (2) Seismograms Analyzer-e (SA-e), (3) Seismic Design of Buildings (SDB), (4) Earthquake Preparedness (EP), (5) Earthquake Early Warning Systems (EEWS) & Tsunami Warning Systems (TWS), and (6) Earthquake Emergency Response & Recovery. The SSe app runs on Windows.
Figure 1.
Main screen of the Seismic Shake-e app, where it shows two types of users: basic, and intermediate–advanced. The red lines represent the boundaries of the tectonic plates, and the green dots mark the epicenters of earthquakes that occurred over several decades.
One goal of SSe is to share vital earthquake data, including seismic hazard and risk information, with a wide audience. To do this effectively, SSe offers both basic-user and advanced modules for users with intermediate to high proficiency levels (Figure 1 and Figure 2).
Figure 2.
Main screen of the Seismic Shake-e app for intermediate–advanced users, showing the six available modules. On this screen, the Accelerometer Networks (Module 1) is identified with an image of a portion of Europe, where green triangles represent seismic stations in service and red triangles represent seismic stations out of service. To identify the Seismograms Analyzer-e (SA-e) (Module 2), there is an image of a seismogram that was generated in this module. The red circle highlights the PGA of this seismic record. To highlight Module 3, Seismic Design of Buildings, this screen shows a simple image of a building model. On this screen, we identified the Earthquake Preparedness Module 4, including a seismic hazard map of Mexico. Module 5 is represented on this screen by a simple sign of an acceleration pulse and an exclamation mark. Finally, in this scene, Module 6 of Earthquake Emergency; Response & Recovery is represented with a satellite image edited to highlight the levels of damage on the buildings in the picture.
In developing SSe, we considered that basic users are individuals interested in learning more about earthquakes, their effects, consequences, and examples of how we are working to reduce the risk of future quakes. Likewise, we defined intermediate users as those who understand the basic concepts of earthquakes, including their effects and consequences. At the same time, this group is interested in gaining deeper knowledge about earthquakes or using specialized research tools.
Advanced users are people who understand many aspects of earthquakes. However, they might find some of the SSe tools helpful for analyzing seismic data or explaining earthquake information to different audiences.
Due to the importance of this goal, we underline again that another key goal of the Seismic Shake-e program is to highlight the following points:
- If more people gain essential knowledge about earthquakes and their effects, they can help reduce seismic risk at various levels (personal, building occupants, city residents, etc.) [16]. Therefore, effectively communicating seismic risk is crucial [15].
- There is essential information that every citizen should know about earthquakes to make informed personal decisions that can directly improve their safety and well-being.
- With the right information, individuals are better able to make personal decisions that help reduce seismic risk in their environment.
- We need to determine the key actions the government must take to reduce seismic risk in cities and ensure these measures are implemented effectively.
In this document, we also include examples of the mathematical foundations for the most important calculations performed in SSe. Additionally, we developed application examples of SSe and included results and discussions for each example presented in the document.
2.2. Module 1—Accelerometer Networks
2.2.1. Accelerometer Networks for Intermediate to Advanced Users
Accelerometer Networks is the name of the initial module designed for intermediate to advanced users. This module provides an overview of the world’s major accelerometer networks. It also includes examples of accelerometer networks from which users can download specific seismic records. Additionally, users can consult the references in this module to verify the availability of seismic records at their site of interest.
Figure 3 shows the main screen of Module 1, which features examples of key Digital Seismograph Networks. This screen provides access to the FDSN (International Federation of Digital Seismograph Networks) [22,23], which contains vital information about most of the world’s seismic networks. Additionally, from this same screen, users can access valuable examples of regional seismic network projects, particularly the following European initiatives: (a) The European Station Book Portal [21], (b) the Rapid Raw Strong Motion (RRSM) [27], and (c) the Engineering Strong-Motion (ESM) [9,10]. These three European projects play a significant role in data collection and sharing. For example, the European Station Book Portal includes data on 30,106 seismic stations [21]. Meanwhile, the RRSM serves as an excellent resource for ground-motion data from earthquakes of magnitude 3.5 or higher in the European Mediterranean region, with information available within minutes of the earthquakes [27]. Similarly, the ESM provides access to ground-motion data, which are typically available several weeks after an event [9,10]. Additionally, ESM offers access to complementary data, including response spectra for pseudo-acceleration, pseudo-velocities, and pseudo-displacements.
Figure 3.
Main screen of Module 1—Accelerometer Networks in the Seismic Shake-e app for intermediate to advanced users.
On the other hand, Module 1 features examples of national networks such as the Italian Seismographs Network and the Turkish Seismograph Network. These examples, along with others, are shown in the table on the screen (Figure 3). The networks listed in the table are part of the European Integrated Data Archive (EIDA) [28,29], which is an initiative within ORFEUS (Observatories and Research Facilities for European Seismology) [30]. Additionally, ORFEUS is involved in another major project, the European Plate Observing System (EPOS) [13].
For each network example in the table on the screen of Figure 3, SSe includes three electronic addresses to access the respective network. Two sources are the International Federation of Digital Seismograph Networks (FDSN) [22,23] and the European Station Book portal. The third source is the original electronic address of the web page containing the primary data for the respective national or regional Seismograph Network. Module 1 also includes examples of networks with seismic stations in various regions of a country, such as the RAII-UNAM, a seismometer network operated by the Engineering Institute of the National Autonomous University of Mexico (UNAM, by its acronym in Spanish) [24]. The RAII-UNAM network has seismic stations across different parts of Mexico.
In the RAII-UNAM network, valuable seismic records are available for download. Each text file of a seismic record in this network includes: (a) information about the responsible institution, specifically the Engineering Institute of UNAM, (b) details about the file, (c) data of the seismic station, (d) data of the accelerograph, (e) earthquake information, (f) details of the seismic record, (g) the quality of the accelerogram, (h) comments, and (i) acceleration data.
For instance, Table 1 shows PGA values recorded at eight seismic stations of the RAII-UNAM [24] in Mexico City during the Mw = 8.1 earthquake on 19 September 1985. Each seismic station measures accelerations in three components; however, in Table 2, the PGA shown is the highest PGA among the three components.
Table 1.
PGA recorded at eight seismic stations of the RAII-UNAM [24] in Mexico City during the Mw = 8.1 earthquake on 19 September 1985.
Table 2.
PGA recorded at three seismic stations of the RAII-UNAM [24] in Mexico City during the Mw = 7.1 earthquake on 19 September 2017.
There are also networks of seismometers composed entirely of seismic stations within a city, like the Mexico City network [31]. Mexico City is probably one of the cities where ground conditions and the confirmed presence of significant site effects [32] easily justify the need for its own seismic station network. Additionally, we use the RAII-UNAM [24] to acquire seismic records of the Mw = 7.1 earthquake that occurred on 19 September 2017 [33,34,35]. We obtained three records, as listed in Table 2.
Using the data in Table 1, it is possible to estimate a soil Amplification factor with Equation (1).
where is the lower value recorded in rock in the study region during an earthquake. The seismic station where this condition occurs is considered the reference seismic station in rock.
is the PGA value at any seismic station caused by the same earthquake for which the PGA was recorded at the reference seismic station in rock.
To include more recent data, we generated Table 3, which presents PGA values for seismic records obtained during the 2 January 2026, earthquake. This data was provided upon request from the Mexico City Network [31] and pertains to seismic stations located in the “Lomas” zone [25]. Similarly, Table 4 includes PGA values of seismic records from the same seismic event recorded at stations in the lake seismic zone [25], and Table 5 shows PGA values for the same earthquake recorded at stations in the transition seismic zone [25].
Table 3.
PGA recorded at ten seismic stations in the hills seismic zone [25] of the Mexico City Network [31] during the M = 6.5 earthquake on 2 January 2026.
Table 4.
PGA recorded at fifty-four seismic stations in the lake seismic zone [25] of the Mexico City Network [31] during the M = 6.5 earthquake on 2 January 2026.
Table 5.
PGA recorded at thirteen seismic stations in the transition seismic zone [25] of the Mexico City Network [31] during the M = 6.5 earthquake on 2 January 2026.
2.2.2. Accelerometer Networks for Basic Users
For the initial users, Module 1 provides examples of answers to two questions: (a) do you know where earthquakes usually occur? and (b) do you know how we measure earthquake features? The screen in Figure 4 includes answers and links to web pages and tools for further learning about different aspects of earthquakes [9] and seismometer networks [21,22].
Figure 4.
Main screen of Module 1—Accelerometer Networks in the Seismic Shake-e app for basic users. On this screen, the blue boxes are buttons that open extra tools or information. The arrows indicate the stage at which each action can be performed.
This screen simultaneously highlights activities related to seismometer networks in three stages: (a) before the earthquake, (b) during the earthquake, and (c) afterward. Including these stages emphasizes the importance of fostering a prevention culture to reduce seismic risk. In other words, individuals can make decisions that help lower their risks, including seismic risks.
2.2.3. Highlights of Accelerometer Networks
- Advantages of the accelerometer networks module of SSe:
- It solely includes verified sources.
- It provides valuable examples of accelerometer networks that allow users to download seismic ground motions. In some cases, it is also possible to download derived products from seismic ground motions, such as velocities, displacements, response spectra of pseudo-accelerations, pseudo-velocities, and pseudo-displacements, as shown on the Web Platform of the Engineering Strong-Motion (ESM) [9].
- The seismic records available for download through this module can also be processed using Module 2 (SAe) of this app.
- Highlights of accelerometer networks
- Many regions across different countries lack seismic networks that monitor ground motions over representative surface areas. For instance, in Mexico, several key regions do not have seismic stations.
- Some networks do not publicly share their ground-motion data; others only provide it upon request via email, not through a web platform.
- Some websites of accelerometer networks that share data are very user-friendly and intuitive, while others are complex and make it hard to find and download seismic data.
2.3. Module 2—Seismograms Analyzer-e
2.3.1. Seismograms Analyzer-e for Intermediate to Advanced Users
Seismograms Analyzer-e (SAe) is the second module designed for intermediate to advanced users of SSe (Figure 5). This module is the most versatile tool within SSe because it enables users to perform various tasks, such as reading and graphing acceleration versus time for seismic ground motions and calculating different seismic parameters from the records. For example, these include velocity-versus-time, displacement-versus-time, and response spectra for pseudo-accelerations, pseudo-velocities, and pseudo-displacements.
Figure 5.
Partial main screen of Module 2—Seismograms Analyzer-e of the Seismic Shake-e app for intermediate to advanced users, with graphs generated for a selected seismic record.
SAe was originally a standalone app for processing seismic ground motions [36]. However, during SSe development, we decided to integrate SAe as an SSe module. According to the EOVALUE Call, this type of app was eligible for participation.
The SAe module is closely linked to Module 1, Seismometer Networks. This link exists because in Module 1, SSe highlights sites where users can download seismic ground motions, and in Module 2, there is a tool for analyzing and processing them.
For instance, using a seismic record from the RAII-UNAM network, it was possible to access the accelerations shown in Figure 6, which represent ground accelerations on the east–west component recorded at the SCT1 station in Mexico City during the damaging earthquake on 19 September 1985, with Mw = 8.1. At this location, the PGA on the east–west component reached 161.63 gals, illustrating the level of acceleration that caused significant damage to many buildings [37]. Figure 6 was generated with module 2 of SSe.
Figure 6.
Uncorrected ground accelerations of the East–West component recorded at the SCT1 station (Table 1) in Mexico City during the Mexico Mw = 8.1 earthquake on 19 September 1985. This figure was generated using module 2 of SSe.
In SAe, various calculations can be performed, such as Basic Analysis, which is done after selecting an internal seismic ground-motion record of accelerations versus time or reading an external record. In either case, executing a Basic Analysis results in SAe generating six graphs: (1) accelerogram without data corrections, (2) Fourier spectrum calculated from the uncorrected accelerations, (3) accelerogram with corrected data, (4) Fourier spectrum calculated from the corrected accelerations, (5) velocities, and (6) displacements.
To correct the acceleration, SAe performs two main procedures: baseline correction and signal filtering. The baseline procedure involves subtracting a constant value from the entire record. This constant represents the average acceleration over the entire record. The baseline correction is necessary to remove errors caused by the accelerometer.
To filter the signal, SAe uses a Butterworth high-pass filter that reduces low-frequency components while preserving high-frequency ones. Specifically, this filter allows signals above the threshold frequency to pass and attenuates those below it. The goal of the filtering process is to remove accelerations from the signal that could be caused by sources other than seismic waves, such as environmental noise.
Additionally, SAe can be used to compute various graphs and parameters, such as response spectra for acceleration, velocity, and displacement, Arias intensity, and cumulative velocity.
To determine the velocities on the ground, SAe performs a numerical integration of the corrected accelerations. Similarly, SAe calculates displacements by numerically integrating the velocities previously computed. SAe uses the trapezoidal method in both numerical integrations.
Arias intensity measures seismic ground motion energy [38], and SAe can calculate it using Equation (2).
where t is the time, a is the acceleration on the ground during the earthquake, is the total duration of the movement, and g is the gravitational acceleration [38].
The SAe module can calculate additional parameters, such as the Significant Duration , which is defined as the time interval during which a segment of the seismic record’s energy accumulates [39]. By default, SAe calculates within the range of 5% to 95% of , as this is a common interval [39].
SAe enables the calculation of the cumulative absolute velocity (CAV) and the . For the first, SAe uses Equation (3); for the second, Equation (4) [40].
where is the absolute value of acceleration at time t; is the total duration of the ground motion record.
where N is the number of non-overlapping one-second time intervals, PGA is the peak ground acceleration (g) in time interval i (inclusive of the first and last points), and is the Heaviside Step Function defined as H(x) = 0 for x < 0 and 1 otherwise.
As mentioned in Section 2.2.1, the value is a useful reference for assessing the potential damage from a ground motion [40]. For this purpose, the Electric Power Research Institute (EPRI) reports that ground motion can cause seismic damage when the reaches or exceeds 156.96 cm/s [41].
Figure 7 shows the EMS platform (one of the various platforms recommended in module 1), where users can download data, such as seismic ground motions from Turkey.
Figure 7.
Partial screen of the ESM Database showing in a table a list of the seismic records available for download from the Turkish earthquake of magnitude 7.8 on 6 February 2023 [9]. The star symbol indicates the epicenter position of this earthquake.
Seismograms Analyzer-e is available either as a standalone tool [36] or as part of Seismic Shake-e. Because of this, some papers refer to Seismograms Analyzer-e. For example, Martinez et al. recently published a paper in which SAe was used in their research [42].
To continue analyzing the seismic records in Table 1, we can refer to the data in Table 2, which provides additional information about those records. The main data in Table 2 were obtained directly from the seismic record files, except for the ID data, which we assigned to identify the different records in this document. For practical reasons, seismic network platforms usually show only the main PGA recorded at each station. Therefore, for analysis purposes, it is useful to utilize tables, like Table 2, which allow observation of the PGA of each component. The data in Table 1 enable, for example, the identification of significant differences between the two horizontal components in some cases. For example, at the SCT1 station, the PGA for the East–West component is 161.63 gals, while for the North–South component, it is 93.78 gals; the difference between them is 72%.
2.3.2. Seismograms Analyzer-e for Basic Users
What is a seismic ground motion record, and how can we process it?
We created a simplified version of Seismograms Analyzer-e (SAe) for basic users of SSe. This easier version allows users to analyze some seismic records within the SSe app (Figure 8). For example, they can see that during the deadly L’Aquila, Italy, earthquake on 6 April 2009, a seismometer recorded a PGA of 647.72 gals [43,44].
Figure 8.
Main screen of the Seismograms Analyzer-e (Module 2) in the Seismic Shake-e app for basic users. This screen displays four graphs related to the L’Aquila, Italy, earthquake, 6 April 2009 (Mw = 6.3). The top-left graph shows the East–West component acceleration recorded at the seismic station L’Aquila—V.Aterno—Centro Valle (uncorrected accelerations). Likewise, the top-right graph displays the corrected accelerations. The bottom-left graph shows the East–West component velocities calculated from the corrected accelerations. Finally, the bottom-right graph illustrates the East–West component displacements calculated with the velocities.
2.3.3. Highlights of the Seismograms Analyzer-e Module
- Advantages of the SAe Module
- The SAe module is a user-friendly tool designed for beginners that helps start seismic record analysis.
- Intermediate to advanced users can utilize the SAe module to conduct various research activities related to earthquake engineering and seismic records.
- The SAe module is a versatile tool capable of analyzing numerous seismic records from various seismometer networks worldwide.
- Highlights of the Seismograms Analyzer-e Module
- The SAe Module provides useful tools to automatically process many seismic records.
- The SAe Module for intermediate–advanced users has been successfully used with international students during multiple editions of the Research Summer Stay of the Dolphin Program [45,46].
2.4. Module 3—Seismic Design of Buildings
2.4.1. Seismic Design of Buildings for Intermediate–Advanced Users
In the Seismic Design of Buildings (SDB) module, the goal is to showcase examples of technical advancements in building design for intermediate to advanced users. This module includes examples of seismic codes because seismic standards are tangible examples that help illustrate improvements in the codes used to design buildings that must withstand earthquakes without collapsing or sustaining damage. The information is organized into two main categories: new buildings and existing buildings.
For the new buildings case, different levels of seismic codes are shown based on the administrative–geographical application level, such as cities, countries, and regions (Figure 9). For example, the module includes the seismic code for Mexico City, an international reference code published in 2023 [25]. Similarly, for the existing buildings option, a screen shows examples of existing building codes.
Figure 9.
Main screen of the Seismic Design of New Buildings in Module 3 for intermediate–advanced users.
For the Mexico City case, SSe emphasizes the development of the Seismic Codes for this city.
2.4.2. Seismic Design of Buildings for Basic Users
For basic users, Module 3 focuses on activities that answer the question: How do we prepare buildings to withstand earthquakes without sustaining damage? Therefore, the main goal of this module is to show that taking different actions can improve building performance during future earthquakes (Figure 10). In other words, it aims to prevent building collapse and damage. Additionally, one objective of this module is to emphasize that, as stakeholders, we can request verification to ensure that the buildings we use can withstand earthquakes.
Figure 10.
Main the screen of the Seismic Design of Buildings (Module 3) in the Seismic Shake-e app for basic users allows you to observe activities and the individuals responsible for carrying them out. There are activities that users can perform. On this screen, the blue boxes are buttons that open additional tools or information. The arrows indicate which stage each action can be performed in.
For example, a personal action before an earthquake is to inquire about the seismic resistance levels of the buildings we frequently use. Additionally, users of this module can review procedures for conducting a seismic visual inspection of a building before and after an earthquake [47,48].
2.4.3. Highlights of the Seismic Design of Buildings Module
- Advantages of the SDB Module
- For basic users, this module allows them to identify actions they can take individually to reduce or transfer seismic risk.
- For advanced users, this module provides valuable information on seismic code references that can be used according to legal requirements.
- Highlights of the Seismic Design of Buildings Module
- In certain cases, this module provides information about seismic codes and related software, especially when calculating seismic actions.
2.5. Module 4—Earthquake Preparedness
2.5.1. Earthquake Preparedness for Intermediate–Advanced Users
The purpose of the Earthquake Preparedness module for intermediate-to-advanced-level users (Figure 11) is to emphasize key concepts for reducing the risk of future major earthquakes: seismic hazard, seismic vulnerability, seismic risk, and seismic resilience.
Figure 11.
Main screen of the Earthquake Preparedness (Module 4) of the Seismic Shake-e app for intermediate–advanced users, where essential concepts of earthquake engineering, such as seismic vulnerability, seismic hazard, and seismic risk, can be observed.
Understanding a city’s seismic hazard involves knowing, for example, the PGA (Peak Ground Acceleration) with a 475-year return period (commonly used in building codes) [49], that could occur in that city. In other words, it involves understanding the key features of potential future seismic ground motions in that area.
In the Earthquake Preparedness module, you can view maps of seismic hazard, seismic vulnerability, and seismic risk. For example, one of the available global seismic hazard maps is the 1999 global map (Figure 12), created as part of the GSHAP (Global Seismic Hazard Map) project [50]. In this map, the seismic hazard is shown as accelerations () that are likely to be exceeded with a 10% probability over 50 years (return period of 475 years). Additionally, a dynamic version of this map is available at [51].
Figure 12.
Screen of the Earthquake Preparedness (Module 4) in the Seismic Shake-e app for intermediate–advanced users. This screen displays the global seismic hazard map published in 1999. The map uses a color scale to differentiate areas with low seismic hazard from those with moderate or high seismic hazard [50]. In this map, the orange lines represent the boundaries of the tectonic plates.
In this module, it is also possible to observe other global seismic hazard maps, determined in 2018 as part of the GEM project (Figure 13). Similar to the GSHAP Map project, a dynamic version of the seismic hazard map created by the GEM project is also available [52]. In both seismic hazard maps (Figure 12 and Figure 13), notable similarities in the PGA values are apparent. This shows that we understand which areas are more vulnerable to seismic ground motion and that we have a reasonable estimation of the PGA likely to occur in many parts of the world. In other words, it has been known for decades that significant seismic ground motions can happen in Haiti (Figure 13). Therefore, the earthquake in Haiti on January 10, 2010, was not unexpected as a seismic event [53]. However, it was a devastating event because it caused extensive fatalities and damage, mainly due to the collapse of many homes and buildings that were built without proper code considerations [53]. Sadly, in Haiti, the earthquake caught most of the population off guard, leaving them uncertain about how to respond [54]. This is mainly caused by widespread poverty in Haiti [54].
Figure 13.
Screen of the Earthquake Preparedness (Module 4) of the Seismic Shake-e app for intermediate–advanced users. This screen displays a global seismic hazard map based on PGA (g), with a 10% probability of being exceeded in 50 years (return period of 475 years). The seismic hazard map was published in 2018 as part of the GEM project [52].
One common method for evaluating seismic hazard can be summarized as Equation (5)
where A is a parameter indicative of the characteristics of the seismic motion (for example, peak ground acceleration or macroseismic intensity), and A* is a specific value of A; is the annual frequency with which A* is exceeded due to earthquakes from the considered seismic sources; is the annual exceedance rate of the earthquakes of interest in seismic source i, this rate corresponds to earthquakes of magnitude greater than or equal to the minimum magnitude chosen for source i(); () and are the probability density functions of the magnitude and distance of source i, in which magnitude and distance are considered to be independent; is the probability that an earthquake of magnitude M at a distance R from the site exceeds the value of A*, this probability is calculated using the seismic attenuation law as a function of the distance R and the magnitude M; is the maximum seismic magnitude considered in seismic source i, and N is the number of seismic sources [55].
Therefore, Equation (5) can be used to generate all the seismic hazard maps included in this module, from the global seismic hazard maps [51,52] to the seismic hazard maps of Mexico (Figure 14). For the Mexico case, we used the R-CRISIS software Ver. 18.4.2., which implements Equation (5). The details of the PSHA assessment for Mexico’s seismic hazard maps are available in Martinez et al. (2025) [56]. The Earthquake Preparedness module provides a link to download the validated R-CRISIS [57] software for computing seismic hazard, which is the updated version of CRISIS2015 [58].
Figure 14.
Screen part of the Earthquake Preparedness (Module 4) of the Seismic Shake-e app for basic users. The seismic hazard map of Mexico on the left shows a return period of 475 years, while the map on the right indicates a return period of 2475 years. We calculated both seismic hazard maps with R-CRISIS [56,57].
Assessing seismic risk involves estimating potential damage and costs associated with earthquakes. This module presents a seismic risk map showing the average annual loss in USD (Figure 15). Based on the seismic risk map in Figure 15, we can expect future earthquake-related damage in the highlighted areas. This estimate was based on the probabilities of earthquake occurrence and damage to existing buildings in each studied area. Therefore, to reduce seismic risk, we can improve building features to better withstand future earthquakes. Understanding seismic risk helps guide decision-making; for example, we can purchase insurance to cover damage to buildings in a city caused by seismic events.
Figure 15.
Screen from the Earthquake Preparedness (Module 4) of the Seismic Shake-e app for intermediate to advanced users. This module enables users to see the seismic risk for any region worldwide in terms of average annual loss (USD).
2.5.2. Earthquake Preparedness for Basic Users
For basic users, Module 4 answers two questions: How do we evaluate the characteristics of future earthquakes? How do we estimate the likelihood that a building could be damaged by future earthquakes?
To answer these questions in this module, key concepts are highlighted, including seismic hazard [59], seismic vulnerability [60], and seismic risk [59] (Figure 15).
To illustrate seismic maps for various return periods, Module 4 for both basic users and intermediate–advanced users of SSe (Figure 16) includes seismic hazard maps of Mexico, as shown in Figure 14. In this figure, the map on the left has a return period of 475 years, while the map on the right has a return period of 2475 years.
Figure 16.
Main screen of the Earthquake Preparedness (Module 4) in the Seismic Shake-e app for basic users. Seismic risk depends on both seismic vulnerability and hazard. For example, if buildings are completely earthquake-proof, their seismic vulnerability is zero. Consequently, even if earthquakes occur, the seismic risk remains zero (image 1). Conversely, if the site where a building is located experiences no seismic ground motion, then even if the buildings are not fully resistant to earthquakes, the seismic risk stays zero (image 2). However, in reality (image 3), no buildings are entirely earthquake-resistant, nor can we be sure there is a place on Earth where seismic waves will never reach. Thus, all buildings worldwide have some level of seismic risk. Recently, significant technological advances have allowed us to build structures with nearly 100% resistance to earthquakes. Still, the main challenge remains in obtaining the resources needed to improve the seismic performance of many existing buildings around the world.
Screen from the Earthquake Preparedness (Module 4) of the Seismic Shake-e app for basic users. The seismic hazard map of Mexico on the left shows a return period of 475 years, while the map on the right shows a return period of 2475 years. We calculated both hazard maps using R-CRISIS.
2.5.3. Highlights of Earthquake Preparedness Module
- Advantages of the EPM Module
- The Earthquake Preparedness Module helps communicate key concepts about earthquakes that can help reduce seismic risk in cities and, as a result, lower the risk to citizens.
- The EPM module helps distribute seismic hazard maps created by some of the authors of SSe, as well as maps developed by other research groups.
- Users can see that progress in earthquake engineering results from collaboration among different researchers. Regarding seismic hazard, users should recognize that this information is subject to some uncertainty. However, this level of uncertainty is usually not significant because, despite differences, the seismic hazard maps produced by various researchers often show similar patterns. Therefore, it’s important to continue working to identify, explain, and reduce the existing uncertainties in probabilistic seismic hazard assessments.
- Highlights of the EPM Module
- The Earthquake Preparedness Module helps communicate basic concepts about earthquakes that can contribute to reducing seismic risk in cities and, consequently, the risk to citizens.
2.6. Module 5—Earthquake Early Warning Systems (EEWS) and Tsunami Warning Systems (TWS)
2.6.1. Earthquake Early Warning Systems and Tsunami Warning Systems for Intermediate–Advanced Users
This module highlights successful Earthquake Early Warning System projects (Figure 17). For example, it offers information on the fairly successful deployment of an EEWS in certain Mexican cities, including Mexico City [61,62]. The EEWS of Mexico is called SASMEX, and it has 96 sensors distributed along the Pacific coast from Puerto Vallarta (Jalisco) to Salina Cruz (Oaxaca), as well as in the southern region of the Neovolcanic Axis in Guerrero and Puebla [61,62]. SASMEX can issue warnings to nine Mexican cities: Acapulco, Chilpancingo, Morelia, Oaxaca, Puebla, Toluca, Cuernavaca, Colima, and Mexico City. Additionally, SASMEX keeps a database of bulletins that summarize which earthquakes were considered for evaluation to determine whether a warning was necessary [63].
Figure 17.
Main screen of the Earthquake Early Warning Systems (Module 5) of the Seismic Shake-e app for intermediate–advanced users.
Regarding the Tsunami Warning Systems (TWS), the goal is to emphasize that in some regions, the risk of tsunamis after earthquakes can be significant and requires careful attention. Therefore, this module includes examples of effective Tsunami Warning Systems, such as the cases in the USA [64,65] and Japan [66,67].
2.6.2. Earthquake Early Warning Systems and Tsunami Warning Systems for Basic Users
For basic users, module 5 addresses the question: Do you know how some cities inform the people that they must evacuate their homes because an earthquake, and, in some cases, also a Tsunami are coming?
To answer this question, this module describes features of the EEWS (Figure 18) and also provides a link to the main screen of the Tsunami Warning System. On this screen, SSe includes a diagram showing examples of actions that different stakeholders can take regarding the EEWS. One goal of this diagram is to emphasize that, in general, personal participation is possible before, during, and after an earthquake. Additionally, this diagram highlights that overall seismic risk mitigation depends on many people and dependencies. However, there are always personal actions that can help reduce personal seismic risk [68,69,70].
Figure 18.
Main screen of the Earthquake Early Warning Systems (Module 5) of the Seismic Shake-e app for basic users, where it is possible to observe the actions related to the EEWS and the person or institution responsible for executing them during three key phases: before, during, and after a significant earthquake. The blue boxes on this screen are buttons that access additional tools or information. The arrows show the specific stage when each action can be taken.
This module also includes practical examples of Mexico’s Earthquake Early Warning System (EEWS). Specifically, it provides a link to listen to the audio during a seismic warning in Mexico City. This information is important because it could be the difference between evacuating a building in Mexico City during a visit and not evacuating it.
2.6.3. Highlights of Earthquake Early Warning Systems and Tsunami Warning Systems Module
- Advantages of Earthquake Early Warning Systems and Tsunami Warning Systems Module
- This module provides users with an overview of EEWS features and teaches them how to respond when a warning from these systems appears. Knowing how to react can help save lives.
- Highlights about Earthquake Early Warning Systems and Tsunami Warning Systems Module
- Understanding how EEWS and TWS work is important because it increases our confidence in them and helps us realize that they are not perfect and have some margin of error, which is okay.
2.7. Module 6—Earthquake Emergency – Response and Recovery
2.7.1. Earthquake Emergency – Response and Recovery for Intermediate–Advanced Users
The primary objective of Module 6 is to emphasize initiatives designed to assess the severity of an earthquake-triggered emergency and to assist the response and recovery stages after a damaging earthquake (Figure 19). Specifically, this module explains the Copernicus Emergency Management Service Mapping (C-EMS) [71]. The C-EMS aims to raise awareness about disasters like earthquakes and tsunamis. It uses satellite images and other geospatial data to generate free maps for governments that need help after damaging earthquakes, tsunamis, or other destructive events [71,72].
Figure 19.
Main screen of the Earthquake Emergency; Response & Recovery (Module 6) of the Seismic Shake-e app for intermediate–advanced users.
To improve the positive use of valuable services like the Copernicus Emergency Management Service, several similar initiatives have been implemented. One of these resulted in the creation of the Global Disaster Awareness and Coordination System (GDACS) [73]. This initiative is a result of collaboration among the United Nations, the European Commission, and disaster managers worldwide [73,74]. One goal of this initiative is to coordinate efforts across various programs to create a greater impact and expand the number of users benefiting from these vital services that support disaster response worldwide.
One of the goals of this initiative is to coordinate efforts across programs to make a significant impact and increase the number of users for these valuable services, which were created to support disaster response worldwide.
2.7.2. Earthquake Emergency – Response and Recovery for Basic Users
Do you know that satellites can be used to quickly identify whether an earthquake triggered damage in a city?
Figure 20 shows the main screen of the Earthquake Emergency—Response and Recovery module for basic users of SSe. This screen features a diagram illustrating activities at the stages of emergency response and recovery after an earthquake. The diagram highlights activities that can be performed before, during, and after an earthquake. Additionally, the activity descriptions include the primary stakeholder responsible for each activity.
Figure 20.
Main screen of the Earthquake Emergency—Response and Recovery (Module 6) of the Seismic Shake-e app for basic users. The blue boxes function as buttons that open extra tools or information, while the arrows show the stage at which each action can be performed.
2.7.3. Highlights of the Earthquake Emergency – Response and Recovery Module
- Advantages of the Earthquake Emergency; Response and Recovery Module
- Understanding relevant actions related to an earthquake emergency, including response and recovery phases, is essential to help ensure those activities are successful.
- The user can identify the different stages they can participate in after an earthquake.
Highlights of the Earthquake Emergency; Response and Recovery Module
- This module emphasizes the importance of being prepared to respond when a major earthquake occurs and causes damage in cities. In other words, it highlights the need to prepare for emergencies and restore cities to their original condition after an earthquake. Additionally, this module underscores that there are many procedures that can help increase the resilience of cities in the face of significant earthquakes.
3. Results
3.1. Seismic Shake-e
The SSe 2.1 App contains essential features to explain key earthquake concepts. This app offers valuable information and tools for analyzing earthquake phenomena comprehensively, considering different aspects of the issue. The SSe has been used by engineering students at the Universidad Veracruzana and students from other universities. SSe is useful for professionals, students, and the general public.
SSe aims to contribute to the study of seismic phenomena and their impacts. To do this, seismic records are a key element in some modules; in modules one and two, the focus is on their acquisition, processing, and analysis. In module three, the goal is to emphasize the importance of seismic design for buildings and the various decisions that can be made regarding it. In module four, the aim is to stress the significance of preparation, with a focus on assessing seismic vulnerability, seismic hazard, and seismic risk. In module five, the main goal is to highlight the valuable applications of earthquake and tsunami warning systems. Finally, module six emphasizes the importance of satellite imagery for managing emergencies and supporting recovery after a damaging earthquake.
The following sections present the main results of each module and their application examples.
3.2. Accelerometer Network Results
The accelerometer network module of SSe is a useful tool for both basic and intermediate to advanced users because it provides essential data about the seismometer network, including links to relevant seismometer network platforms such as the European, Japanese, and Mexican cases. Additionally, the accelerometer network module helps identify many accelerometer networks worldwide that offer free access to seismic records for download. This section presents the results of the application examples of the AN module described in Section 2.2.1, which were carried out solely for this work. In this work, we used a reference from the AN module to access an accelerometer network of seismic stations in Mexico City that recorded ground motion during the 1985 earthquake (Mw = 8.1). Particularly, Table 1 shows data of interest for our study from 8 seismic records of the 19 September 1985, Michoacan earthquake recorded in Mexico City and downloaded from RAII-UNAM [24]. All the data in Table 1 were obtained directly from the seismic records. We used the data in Table 1 and Equation (1) to determine the amplification factors in Table 6. Similarly, Table 7 includes the amplification factor computed for the seismic records of Table 2.
Table 6.
Amplification factors at 8 seismic stations [24] computed from seismic records obtained in Mexico City during the Mw = 8.1 earthquake on 19 September 1985 (see Table 1).
Table 7.
Amplification factors in three seismic stations [24] computed from seismic records obtained in Mexico City during the Mw = 7.1 earthquake on 19 September 2017.
Additionally, we collected data from ten stations in the hills seismic zone. Specifically, we used PGA data recorded during the 2026 earthquake (see Table 3). We also used the lowest PGA value among these stations as a reference to calculate the amplification factor for the other seismic stations (see Table 8). The lowest PGA value is from the seismic station CT64, with a value of 3.66 gals and an epicentral distance of 302.42 km. The station with the closest PGA is CE18, with an epicentral distance of 286.51 km and a PGA of 6.01 gals. There are no indicators suggesting that the value of 3.66 gals is an outlier or anomalous.
Table 8.
Amplification factors from 10 seismic stations of the Mexico City Network [31] in the hills seismic zone [25] computed from records obtained during the M = 6.5 earthquake on 2 January 2026.
Similarly, Table 9 displays the amplification factors for the Lake Seismic Zone also for the same earthquake (see Table 4), and Table 10 presents the amplification factors for the Transition Seismic Zone calculated from data for the same earthquake (see Table 5).
Table 9.
Amplification factors from fifty-four seismic stations within the lake seismic zone [25] of the Mexico City Network [31] were computed from records obtained during the M = 6.5 earthquake on 2 January 2026.
Table 10.
Amplification factors in 13 seismic stations of the Mexico City Network [31] in the transition seismic zone [25] computed from records obtained during the M = 6.5 earthquake on 2 January 2026.
3.3. Seismograms Analyzer-e—Results
The SAe module is the most powerful one within the SSe. It enables processing seismic records to generate various outputs, including corrected accelerations, response spectra, and other parameters like . This section presents the main results from the application examples of the SAe module, which are described in Section 2.3.1. These application examples were developed specifically for this work.
Figure 21 shows these six graphs computed from the East–West component of the seismic ground motions recorded at the UNAM station (rock) in Mexico City during the damaging earthquake on 19 September 2017 [33,34,35].
Figure 21.
Graphs related to a seismic record obtained from the seismic station UNAM in rock in Mexico City during the 19 September 2017, earthquake with Mw = 7.1. (a) East–West component accelerations (uncorrected accelerations); (b) Fourier spectrum computed from the uncorrected accelerations; (c) Accelerogram showing the corrected accelerations (PGA = 51.7 gals); (d) Fourier spectrum calculated from the corrected accelerations; (e) Velocigram; (f) A time history of displacements.
Figure 22a,b show an accelerogram and a response spectrum of pseudo-accelerations for the same seismic ground motion from Turkey. We use the SAe module to generate both graphs in Figure 22. The seismic record in Figure 22a corresponds to the North–South component recorded at station 4614 in Turkey during the 7.8 magnitude earthquake on 6 February 2023. In this component, the PGA reached 582 gals. The station was 39.9 km from the epicenter and was the closest available seismic station. We used SAe to determine that the significant duration was 47.16 s and that the was 3160 cm/s, a value twenty times higher than the threshold used to identify seismic ground motions with the potential to cause damage, as was mentioned in Section 2.2.1. This earthquake in Turkey was one of the deadliest in recent years, with more than 50,000 casualties [42].
Figure 22.
Corrected accelerations (a), and response spectra of pseudo-accelerations (b) generated by the SAe module of SSe. These graphs correspond to the North–South component of the ground motion recorded at Station 4614 in Turkey during the earthquake on 6 February 2023 (Mw = 7.8).
As mentioned in the section on seismometers, seismic records contain data that can be analyzed directly or processed with basic operations to acquire valuable information about ground motion. However, it is also common to use software to process the seismic record and obtain additional details about seismic ground motions, which can be more useful for earthquake engineering purposes. We use SAe to process the seismic records and to obtain the values of .
We also use SAe to process the seismic records downloaded with a reference from the AN module of SSe. To perform a preliminary assessment of the potential for ground-motion-induced damage, is it possible to evaluate parameters using seismic records. One such parameter is the . Table 11 shows the calculated from the 8 seismic records in Table 1, which were recorded during the 19 September 1985, Michoacan earthquake in Mexico City and obtained from RAII-UNAM [24]. In this case, we use only the seismic record for the component with the highest PGA at each seismic station.
Table 11.
Values of eight seismic records generated by the Mw = 8.1 earthquake on 19 September 1985, at the seismic stations listed in Table 1. The values were calculated using the SAe module of SSe.
Similarly, we use SAe to calculate the for each seismic record listed in Table 2, Table 3, Table 4 and Table 5. The computed values of obtained are included in Table 12, Table 13, Table 14, and Table 15, respectively.
Table 12.
Values of computed from 3 seismic records produced by the Mw = 7.1 earthquake on 19 September 2017. The computed corresponds to the seismic record with the highest PGA in the same seismic station. The values were computed using the module SAe de SSe.
Table 13.
Values of computed from the seismic records of the M = 6.5 earthquake on 2 January 2026 obtained in 10 seismic stations in the hills seismic zone [25] of the Mexico City Network [31]. The values were computed using the SAe module of SSe.
Table 14.
Values of computed from the seismic records of the M = 6.5 earthquake on 2 January 2026 obtained in 13 seismic stations in the transition seismic zone [25] of the Mexico City Network. The values were computed using the SAe module of SSe.
Table 15.
Values of computed from the seismic records of the M = 6.5 earthquake on 2 January 2026 obtained in 54 seismic stations in the lake seismic zone (IIIa, IIIb, IIIc, and IIId) [25] of the Mexico City Network. The values were computed using the SAe module of SSe.
The valuable data from the RAII-UNAM network enable the construction of graphs such as the one shown in Figure 23. These graphs represent a collection of response spectra of accelerations computed by SAe using the data from Table 1. In Figure 23, it is easy to see the spectra corresponding to the accelerations in Figure 6, because it is the graph with the yellow line reaching the highest spectral acceleration value near 950 gals for a structural period close to 2 s. This spectrum has been reproduced in many papers because it shows the highest spectral acceleration values calculated from a seismic record of the 19 September 1985, Michoacan earthquake [75,76]. The spectra in Figure 23 were computed by SAe considering 5% critical damping. Similarly, in Figure 24, response spectra for the seismic records of Mexico City are shown, computed by SAe with 8% critical damping.
Figure 23.
Response spectra of accelerations with 5% critical damping from the eight seismic records recorded at eight seismic stations in Mexico City, listed in Table 1 (three accelerograms per station corresponding to each of the three components: north–south, east–west, and vertical [see details in Table 1]). Figure generated with the SAe module of SSe.
Figure 24.
Response spectra of accelerations with 8% critical damping from the eight seismic records recorded at eight seismic stations in Mexico City, listed in Table 1 (three accelerograms per station corresponding to each of the three components: north–south, east–west, and vertical [see details in Table 1]). Figure generated with the SAe module of SSe.
In another case, Figure 8 shows the East–West component of the accelerations recorded at the seismic station L’Aquila—V.Aterno—Centro Valle in L’Aquila, Italy, during the deadly earthquake on 6 April 2009. The PGA recorded in this East–West component was 662.59 gals, and according to the results computed in SSe, the is 8.63 s, and a is equal to 1180 cm/s [43,44].
In the case of damaging earthquakes, it is important to note that SSe includes seismic records of events such as the L’Aquila earthquake in Italy on 6 April 2009 [43,44]. An example of seismic parameters for several earthquakes is shown in Table 16.
Table 16.
Significant duration and of three seismic records. Value computed using SSe.
3.4. Seismic Design of Buildings—Results
In this section, we highlight the results from the application examples of the SAe module described in Section 2.4.1. Application examples were created for the current work.
Based on the data highlighted in the SDB module on the evolution of seismic codes in Mexico City and additional analyses, this evolution has been significant. Table 17 includes the main Regulations of Constructions that have been published in Mexico City, and similarly Table 18 includes the main Complementary Technical Standards for Seismic Design of Buildings that have been published in Mexico City.
Table 17.
Year of publication of Regulations of Constructions for Mexico City.
Table 18.
Year of publication of Complementary Technical Standards for Seismic Design for Mexico City.
3.5. Earthquake Preparedness—Results
In this section, we highlight the results of the application examples of the Earthquake Preparedness module described in Section 2.5.
The SSe App displays relevant information about the global seismic hazard, focusing on two major hazard maps: the GSHAP and GEM projects. By combining data from both sources, we can create tables like Table 19. This table shows the seismic hazard for four cities—Puerto Escondido, Puerto Principe, Gaziantep, and Tokyo—in different parts of the world, based on the maps from GSHAP and GEM. One notable feature of these maps is that they do not provide a specific value for each site; instead, they give a range of values. For example, for the Turkish city of Gaziantep, the GSHAP map indicates a PGA of 300–400 gals, while the GEM map shows a PGA of 196.13–343.23 gals.
Table 19.
Seismic hazard in four cities in terms of PGA for a return period of 475 years according to the GSHAP [50,51] and the GEM [52] projects.
3.6. Earthquake Early Warning Systems & Tsunami Warning Systems—Results
In this section, we highlight the results of the application examples of the Earthquake Early Warning Systems & Tsunami Warning Systems module that were described in Section 2.6.1. These application examples were created for this work.
According to the Servicio Sismológico Nacional (SSN), in September 2017, there were 4010 earthquakes with magnitudes of 3.7 or higher. Meanwhile, SASMEX issued 113 earthquake bulletins, which were evaluated to determine if a warning was necessary. In September 2017, SASMEX issued only three public warnings (see Table 20) [62], one of which was related to the damaging earthquake on 19 September 2017 [33], that caused several buildings to collapse in Mexico City. The warning issued on 19 September 2017, was received in five cities: Mexico City (CDMX), Oaxaca, Acapulco, Chilpancingo, and Puebla (Table 20). In Table 20, you can see the estimated lead time for each city during each warning. This lead time is defined by SASMEX as the interval from the time the alert is activated until seismic waves of significant intensity are detected in the city.
Table 20.
Warnings of SASMEX in September of 2017 [63].
SASMEX has two types of warnings: public and preventive. The public warning is issued to the general public to evacuate buildings and other areas. The preventive warning is only sent to the authorities of the relevant city.
3.7. Earthquake Emergency; Response & Recovery—Results
This section presents the results of the application examples of the SAe module described in Section 2.7.1. Application examples developed for this work.
Figure 25 shows the total earthquakes reported to the Global Disaster Awareness and Coordination System (GDACS) that were classified with an orange or red alert level. For example, sixteen earthquakes from 2022 have an orange or red report in the GDACS database [73]. This means that at least some product was created to help direct proper attention to the emergency caused by these 16 earthquakes classified as orange or red. Each Global Disaster Awareness and Coordination System (GDACS) has an alert level (Green, Orange, or Red). The red level indicates a high alert. In 2022, among earthquakes with an orange or red alert level in GDACS, the smallest magnitude was 5.3 in Haiti, and the largest was 7.6 in Papua New Guinea. Of the 16 earthquakes, 12 were classified as orange events, and 4 as red events.
Figure 25.
Number of earthquakes by year reported by the GDACS [73] from 2022 to 2026.
Similarly, in 2023, 11 earthquakes were classified as red events and 24 as orange events. In 2024, 2 earthquakes were classified as red events and 11 as orange events. Finally, in 2025, 10 earthquakes were classified as red events and 26 as orange events (Figure 25).
Of the 11 earthquakes classified as red events in 2023, two are the 7.8 and 7.5 magnitude earthquakes in Turkey on February 6th.
4. Discussion
In this section, we discuss the application examples of SSe developed as part of this work, focusing on each of the six essential modules of SSe.
4.1. Accelerometer Networks—Discussion
Regarding the data and results in Table 1 and Table 6, it can be seen that the highest PGA recorded during this earthquake was 161.63 gals at the SCT1 seismic station. At the same time, it is possible to point out that the difference between the lower PGA in rock at Mexico City (CU01 station) and the highest PGA recorded in Mexico City (SCT1 station) during the 19 September 1985 earthquake was nearly five times. In this case, the difference in PGA values is mainly due to local site effects caused by the combination of specific seismic waves reaching a soft soil (clay), which is more noticeable at the seismic station SCT1 [32]. At the same time, according to the data in Table 6, it is possible to see that, for the clay stations, the amplification factor ranges from 1.28 to 4.97. According to the amplification factors in Table 6, we can consider amplifications at certain sites in the hills seismic zone. In this case, at the CUMV station in Rock, the amplification factor was 1.18.
Based on the amplification factors in Table 7, derived from seismic records of the September 19th, 2017 earthquake at the SCT2 seismic station situated in clay, the amplification factor was 1.56.
Therefore, comparing the amplification factor of 4.97 at the SCT1 seismic station due to the September 19th, 1985 earthquake (Table 6) with the amplification factor of 1.56 at SCT2 caused by the September 19th, 2017 earthquake (Table 7), we can conclude that the earthquake’s origin also influences the level of seismic wave amplification. For this reason, further research is needed in this area.
According to the results in (Table 8) for seismic stations in Mexico City’s hills seismic zone, the amplification factor ranges from 1.64 to 4.22, with common values between 3 and 4. These amplification factors were derived from seismic records of the January 2nd, 2026 earthquake. Similarly, in the transition seismic zone, 13 seismic stations show amplification factors ranging from 3.60 to 9.50 during the same earthquake. At the lake zone seismic stations, amplification factors range from 2.83 to 13.40. In this zone, 12 of the 54 lake seismic stations experienced amplification factors exceeding 10 during the earthquake, with 11 of these stations located in seismic zone IIIb and only one in zone IIIc. These findings reinforce the importance of properly accounting for local effects in Mexico City during seismic design of buildings.
Accelerometer networks can be conceived as a broad topic:
- Installing accelerometer networks requires significant resources. However, part of this investment does not provide substantial benefits if the ground-motion data collected are not shared publicly. Therefore, it is crucial for stakeholders and society at large to support contributions that help grow seismometer networks and ensure their records are publicly accessible.
- The EMS European platform is one of the leading platforms for data sharing. This regional platform operates in English and provides information from multiple countries without requiring registration. It offers basic data on seismic ground motions and shows the results of data processing, including corrected accelerations, velocities, displacements, and response spectra. It is also a user-friendly platform.
- Another important platform is the Japanese web platform; it serves as a good example of a strong national system that shares valuable data. Specifically, it is possible to download seismic ground records and additional results, such as pseudo-acceleration response spectra. Therefore, this platform demonstrates a representative national network because it has seismic stations spread across Japan. On this platform, users can download seismic records for any station and any registered earthquake.
- For the Mexico City Network, seismic records can be accessed upon request. However, since response times vary, it is recommended to add the data to the same webpage as the Mexico City Network. This would allow users to easily utilize this valuable resource and potentially increase the number of research projects.According to the information in Section 2.2 and the results in Section 3.2, we can highlight the following: the accelerometer network module of SSe could help increase the number of people participating in research, as the use of seismic records will be essential. Additionally, the accelerometer network module can help identify that some regions face significant seismic danger but have few seismic stations. This situation does not substantially improve our resilience to future earthquakes. Therefore, this information might encourage more people to ask the government to allocate more resources to build and maintain seismometer networks in high-risk areas.
4.2. Seismograms Analyzer-e—Discussion
Based on the information from Section 2.3.1 and the results in Section 3.3, we can highlight the following: Regarding the seismic records in Table 1 and the results computed with the SAe module are shown in Table 11, it is possible to observe that serves as a reasonable indicator of the damage potential of seismic ground motion. For example, the PGA at the CUMV station on rock is 38.28 gals, while at the SXVI station on clay, it is 41.63 gals (Table 1). These two values are similar. However, the values from each station differ significantly, measuring 20.6 cm/s and 145 cm/s, respectively (Table 11). Regarding , the Electric Power Research Institute (EPRI) reports that ground motion can cause seismic damage when the reaches or exceeds [41] 156.96 cm/s. This supports the idea that is a reasonable indicator of the damage potential of seismic events, especially considering that during the 19 September 1985, earthquake in Mexico, many buildings on clay soils suffered notable damage. In Mexico City, locations that repeatedly surpassed the threshold value (156.96 cm/s) experienced significant damage. Notably, the SCT1 site has values that exceed the threshold by more than 12 times.
Considering the threshold of 156.96 cm/s mentioned earlier, three out of the eight seismic records in Table 11 exceed this value. Therefore, in these three cases, ground motion could potentially cause structural damage. These cases involve the seismic stations CDAF, CDAO, and SCT1, which are located in clay. It is also noticeable that the record with the highest PGA coincides with the highest . However, based on the results from the eight records in Table 3, it is clear that a higher PGA does not necessarily mean a higher . For example, the CDAF clay station has a of 1060 cm/s, which is lower than the 1630 cm/s recorded at the CDAO station, even though the PGA at CDAF is 117.49 gals—higher than the 84.61 gals PGA at CDAO.
In Table 12, it is clear that the three seismic stations in Mexico City exceeded the EPRI threshold during the September 19th, 2017, earthquake. Specifically, at the rock station CUP5, the threshold was exceeded by 1.59 times; at the hard soil station TACY, by 1.44 times; and at the soft soil station SCT2, by 10.19 times. It is important to note that during this earthquake, some buildings collapsed [33]. However, during the January 2nd, 2026, earthquake, neither seismic station in the hills nor in the lake zones exceeded the EPRI threshold. Therefore, the magnitude 6.5 earthquake on January 2nd, 2026, did not pose a danger to buildings in Mexico City.
Conversely, the results in Table 16 verify that can be a reliable indicator of the damage potential of seismic events. For example, in L’Aquila, the was 1110 gals for the seismic record of the 6 April 2009 earthquake with a magnitude of 5.9, which is 7.07 times higher than the threshold of 156.96 cm/s. Similarly, at the SCT2 station, the seismic record from the 19 September 2017 event in Mexico City showed a of 1600, exceeding the threshold by 10.19 times.
It is important to note that in these two cases, the PGA values and the significant durations differ greatly. For example, in L’Aquila, the PGA was 612 gals, while in SCT2 in Mexico City, the PGA was 91.2 gals. Therefore, the PGA in L’Aquila was significantly higher compared to SCT2 in Mexico. However, there are also differences in the significant duration: L’Aquila had a duration of 7.62 seconds, whereas Mexico City had a duration of 45.03 seconds. These differences help explain why the for SCT2 is greater than the for L’Aquila, despite the fact that the PGA in L’Aquila is higher than that in SCT2.
4.3. Seismic Design of Buildings—Discussion
Based on the information in Section 2.4.1 and the results in Section 3.4, we can highlight the following: In 1942, Mexico City’s first seismic code was published [78]. Explicitly, Article 1 of Chapter 41.1 of this seismic code requires that buildings be designed to account for accidental actions, such as wind and earthquakes.
The development of seismic codes in Mexico City clearly shows how new knowledge is incorporated into the seismic design of buildings. However, this also suggests that, in general, buildings designed according to the latest building code tend to have better structural safety. As a result, stakeholders often request a structural assessment of their buildings in accordance with the new seismic code. Sometimes, the assessment finds that retrofitting is necessary to improve the building’s structural safety. Additionally, updates to seismic codes require structural engineers to update their training to properly implement the new standards.
In some cases, such as Mexico City, an emergency seismic code has been implemented after a damaging earthquake, based on analyses of building damage. This occurred after the 1957 earthquake [79] and the 1985 earthquake [83]. In other cases, a special seismic code is issued to establish criteria for the restoration of damaged buildings after a destructive earthquake. This happened in Mexico City following the 2017 earthquake [85].
To recognize that different considerations apply to existing buildings compared to new ones, the development of specific seismic codes for existing structures has been implemented. For Mexico City, a seismic code for existing buildings was recently issued. In particular, the Complementary Technical Standard for the evaluation and structural rehabilitation of existing buildings [87] was published.
4.4. Earthquake Preparedness—Discussion
A global comparison clearly shows significant similarities between the GSHM of 1999 and the GEM of 2018. There is a notable overlap across many regions with high seismic hazard. For example, examining South America in both the 1999 and 2018 maps reveals that areas with higher seismic hazard are primarily near the Pacific Ocean. Similarly, in Mexico and the USA, there are strong matches between the 1999 GHSM seismic hazard results and the 2018 GEM. This indicates that, overall, we agree on which areas pose the greatest seismic risk worldwide; therefore, the excuse that a lack of knowledge about specific site hazards prevented us from improving earthquake preparedness is not valid.
Along the coast of Guerrero, Mexico, there are no major differences in seismic hazard at a 475-year return period between the results of the GSHAP and GEM projects. Specifically, the PGA results from the two projects differed by 5%, which is not significant for a seismic hazard assessment.
4.5. Earthquake Early Warning Systems & Tsunami Warning Systems—Discussion
According to the information in Section 2.6.1 and the results in Section 3.6, we can highlight the following: Only 113 of the 4010 earthquakes registered by the SSN had a SASMEX bulletin generated. Only three earthquakes resulted in a public warning, and two prompted a preventive warning. Therefore, SASMEX needs to increase the number of sensors available in Mexico. The EEWS highlighted in SSe are valuable examples of effective seismic use.
4.6. Earthquake Emergency; Response & Recovery—Discussion
Based on the information from Section 2.7.1 and the results in Section 3.7, we can highlight the following: According to the Global Disaster Awareness and Coordination System (GDACS) analyzed in this work, the number of earthquakes requiring this type of support varies significantly from year to year (Figure 25). For example, the earthquakes that reached the red alert level in 2022 and 2024 were 4 and 2, respectively. In contrast, in 2023 and 2025, these earthquakes numbered 11 and 10, respectively. It is important to note that the annual count of earthquakes reaching the red alert level also depends on the seismic resilience of the affected cities. Therefore, making significant progress in preparedness could help reduce the number of earthquakes that reach the red alert level.
4.7. Seismic Shake-e—Discussion
In the present work, we highlight the Seismic Shake-e version 2.1. However, for future versions of the APP, some of the following aspects will be considered: (a) update SSe to be available on other operating systems, not just Windows, and (b) incorporate more tools in any module of SS-e, with emphasis on the Seismograms Analyzer-e module.
Author Contributions
Conceptualization, A.A.-M., J.D.l.P. and M.M.-V.; methodology, A.A.-M. and J.H.-C.; software, A.A.-M., J.D.l.P. and M.M.-V.; formal analysis, A.A.-M., J.H.-C., A.G.-E. and A.A.-C.; resources, A.A.-M.; writing—original draft preparation, A.A.-M., J.D.l.P., M.M.-V., J.H.-C., A.G.-E. and A.A.-C.; writing—review and editing, A.A.-M. and A.A.-C. All authors have read and agreed to the published version of the manuscript.
Funding
This research received partial funding of EOVALUE. Purchase Order: No. B.B651262.
Institutional Review Board Statement
Not applicable.
Informed Consent Statement
Not applicable.
Data Availability Statement
The original contributions presented in this study are included in the article. Further inquiries can be directed to the corresponding author.
Acknowledgments
The first author thanks the Universidad Veracruzana, Barcelona Supercomputing Center, and SECIHTI. A. García-Elías thanks the Universidad Veracruzana. The last author thanks the Universidad Veracruzana.
Conflicts of Interest
The authors declare no conflicts of interest.
Abbreviations
The following abbreviations are used in this manuscript:
| SSe | Seismic Shake-e |
| SAe | Seismograms Analyzer-e |
| FDSN | International Federation of Digital Seismograph Networks |
| RRSM | Rapid Raw Strong Motion |
| ESM | Engineering Strong-Motion |
| EIDA | European Integrated Data Archive |
| ORFEUS | Observatories and Research Facilities for European Seismology |
| SDB | Seismic Design of Buildings |
| PGA | Peak Ground Acceleration |
| GEM | Global Earthquake Model |
| EEWS | Earthquake Early Warning Systems |
| TWS | Tsunami Warning Systems |
| C-EMS | Copernicus Emergency Management Service Mapping |
| GDACS | Global Disaster Awareness and Coordination System |
References
- Guralp. Scream! 4.5 Released. 2010. Available online: https://www.guralp.com/sw/scream4.5/ (accessed on 1 February 2026).
- Kinemetrics. Rockhound. 2017. Available online: https://kinemetrics.com/wp-content/uploads/2017/04/datasheet-software-rockhound.pdf (accessed on 2 February 2026).
- Ordaz, M.; Martinelli, F.; Aguilar, A.; Arboleda, J.; Meletti, C.; D’Amico, V.; Faccioli, E.; Secanell, R.; Lindolhm, C.; Clement, C.; et al. CRISIS2015. Program for Computing Seismic Hazard. 2015. Available online: https://sites.google.com/site/codecrisis2015/home (accessed on 1 February 2026).
- PEER. OPENSEES. Framework for Developing Applications to Simulate the Performance of Structural and Geotechnical Systems Subjected to Earthquakes. 2025. Available online: https://opensees.berkeley.edu/ (accessed on 1 February 2026).
- Alguacil, G.; Vidal, F.; Navarro, M.; García-Jerez, A.; Pérez-Muelas, J. Characterization of earthquake shaking severity in the town of Lorca during the May 11, 2011 event. Bull. Earthq. Eng. 2014, 12, 1889–1908. [Google Scholar] [CrossRef] [Scilit]
- Seismosoft. Seismosignal. Commercial Software to Process Strong-Motion Data. 2026. Available online: https://seismosoft.com/product/seismosignal/ (accessed on 2 February 2026).
- Puglia, R.; Russo, E.; Luzi, L.; D’Amico, M.; Felicetta, C.; Pacor, F.; Lanzano, G. Strong-motion processing service: A tool to access and analyse earthquakes strong-motion waveforms. Bull. Earthq. Eng. 2018, 16, 2641–2651. [Google Scholar] [CrossRef] [Scilit]
- Strong-Motion Processing Service. ESM. 2026. Available online: https://esm-db.eu/processing/select (accessed on 2 February 2026).
- Engineering Strong Motion Database (ESM). 2025. Available online: https://esm-db.eu/#/event/search (accessed on 29 October 2025).
- Luzi, L.; Puglia, R.; Russo, E.; D’Amico, M.; Felicetta, C.; Pacor, F.; Lanzano, G.; Çeken, U.; Clinton, J.; Costa, G.; et al. The Engineering Strong-Motion Database: A Platform to Access Pan-European Accelerometric Data. Seismol. Res. Lett. 2016, 87, 987–997. [Google Scholar] [CrossRef] [Scilit]
- JRC. Joint Research Centre. European Commission. 2026. Available online: https://commission.europa.eu/about/departments-and-executive-agencies/joint-research-centre_en (accessed on 3 February 2026).
- Cocco, M.; Atakan, K.; Pedersen, H. The European Plate Observing System (EPOS) Services for Solid Earth Science. EGU General Assembly Conference Abstracts. 2016, p. EPSC2016-12931. Available online: https://ui.adsabs.harvard.edu/abs/2016EGUGA..1812931C/abstract (accessed on 3 February 2026).
- Atakan, K.; Cocco, M.; Orlecka-Sikora, B.; Pijnenburg, R.; Michalek, J.; Rønnevik, C.; Olszewska, D.; Górka-Kostrubiec, B.; Drury, M.R. National EPOS Initiatives and Participation to the EPOS Integration Plan. Ann. Geophys. 2022, 65, 1–17. [Google Scholar] [CrossRef] [Scilit]
- K-NET. Strong-Motion Seismograph Networks (K-NET, KiK-net)—Japan. 2026. Available online: https://www.kyoshin.bosai.go.jp/en/ (accessed on 2 February 2026).
- Musacchio, G.; Saraò, A.; Falsaperla, S.; Scolobig, A. A scoping review of seismic risk communication in Europe. Front. Earth Sci. 2023, 11, 1155576. [Google Scholar] [CrossRef] [Scilit]
- Stewart, I.; Ickert, J.; Lacassin, R. Communicating Seismic Risk: The Geoethical Challenges of a People-Centred, Participatory Approach. Ann. Geophys. 2017, 60. [Google Scholar] [CrossRef] [Scilit]
- Musacchio, G.; Solarino, S. Seismic risk communication: An opportunity for prevention. Boll. Di Geofis. Teor. Ed Appl. 2017, 60, 1–17. [Google Scholar]
- Ghasemi, A.; Mahsuli, M.; Mortazavi, S.M.S. Perception and communication of seismic risk: Design and implementation of a functional tool. Nat. Hazards Rev. 2018, 19, 0000274. [Google Scholar] [CrossRef] [Scilit]
- Savadori, L.; Ronzani, P.; Sillari, G.; Di Bucci, D.; Dolce, M. Communicating seismic risk information: The effect of risk comparisons on risk perception sensitivity. Front. Commun. 2022, 7, 743172. [Google Scholar] [CrossRef] [Scilit]
- Sociedad Mexicana de Ingeniería Estructural (SMIE). Guide for Responsible Home Buyers and Landlords (Guía del Comprador y Arrendador Responsable). 2025. Available online: https://smie.com.mx/sistemas/storage/pagina-web/informacion-tecnica/guias-vivienda/guia-comprador-arrendador-seguridad-estructural-inmueble-seguro-sismo-resistente-riesgo-derrumbe-smie.pdf (accessed on 19 November 2025).
- Orfeus Station Book. 2026. Available online: https://orfeus-eu.org/stationbook/ (accessed on 29 January 2026).
- International Federation of Digital Seismograph Networks. 2026. Available online: https://www.fdsn.org/networks/ (accessed on 29 January 2026).
- Suárez, G.; van Eck, T.; Giardini, D.; Ahern, T.; Butler, R.; Tsuboi, S. The international federation of digital seismograph networks (FDSN): An integrated system of seismological observatories. IEEE Syst. J. 2008, 2, 431–438. [Google Scholar] [CrossRef] [Scilit]
- Red Acelerográfica del Instituto de Ingeniería (RAII-UNAM). 2026. Available online: http://aplicaciones.iingen.unam.mx/AcelerogramasRSM/ (accessed on 2 February 2026).
- Norma Técnica Complementaria para el Diseño por Sismo, Gaceta Oficial de la Ciudad de México, Ciudad de México. 2023. Available online: https://www.smie.org.mx/uploads/2/2023-11/ntc_cdmx_2023.pdf (accessed on 29 October 2025).
- Aguilar-Meléndez, A.; De la Puente, J.; Monterrubio-Velasco, M.; Rojas, O.; Campos-Rios, A.; García-Elías, A.; Huerta-Chúa, J.; Montiel-Escobar, N.A. Seismic Shake-e 2.0 app: Data and tools to contribute to reducing seismic risk. In Proceedings of the 18th World Conference on Earthquake Engineering, Milan, Italy, 30 June–5 July 2024; pp. 1–12. Available online: https://proceedings-wcee.org/downloadFile/18WCEE/?file=LTMwMDMwNjA1Mg==&mode=download&category=18WCEE (accessed on 28 January 2026).
- Rapid Raw Strong Motion Database (RRSM). 2026. Available online: https://www.orfeus-eu.org/rrsm/ (accessed on 29 January 2026).
- Strollo, A.; Cambaz, D.; Clinton, J.; Danecek, P.; Evangelidis, C.P.; Marmureanu, A.; Ottemöller, L.; Pedersen, H.; Sleeman, R.; Stammler, K.; et al. EIDA: The European integrated data archive and service infrastructure within ORFEUS. Seismol. Soc. Am. 2021, 92, 1788–1795. [Google Scholar] [CrossRef] [Scilit]
- Danecek, P.; Pintore, S.; Mazza, S.; Mandiello, A.; Fares, M.; Carluccio, I.; Bina, E.D.; Franceschi, D.; Moretti, M.; Lauciani, V.; et al. The Italian node of the European integrated data archive. Seismol. Soc. Am. 2021, 92, 1726–1737. [Google Scholar] [CrossRef] [Scilit]
- Lanzano, G.; Luzi, L.; Cauzzi, C.; Bienkowski, J.; Bindi, D.; Clinton, J.; Cocco, M.; D’Amico, M.; Douglas, J.; Faenza, L.; et al. Accessing European strong-motion data: An update on ORFEUS coordinated services. Seismol. Soc. Am. 2021, 92, 1642–1658. [Google Scholar] [CrossRef] [Scilit]
- Red Acelerográfica Ciudad de México. 2026. Available online: http://www.cires.org.mx/registro_lista_es.php (accessed on 2 February 2026).
- Mayoral, J.M.; Asimaki, D.; Tepalcapa, S.; Wood, C.; Roman-de la Sancha, A.; Hutchinson, T.; Franke, K.; Montalva, G. Site effects in Mexico City basin: Past and present. Soil Dyn. Earthq. Eng. 2019, 121, 369–382. [Google Scholar] [CrossRef] [Scilit]
- Singh, S.K.; Reinoso, E.; Arroyo, D.; Ordaz, M.; Cruz-Atienza, V.; Pérez-Campos, X.; Iglesias, A.; Hjörleifsdóttir, V. Deadly intraslab Mexico earthquake of the 19th of September 2017 (M w 7.1): Ground motion and damage pattern in Mexico City. Seismol. Res. Lett. 2018, 89, 2193–2203. [Google Scholar] [CrossRef] [Scilit]
- Galvis, F.; Miranda, E.; Heresi, P.; Davalos, H.; Silos, J.R. Preliminary Statistics of Collapsed Buildings in Mexico City in the 19th of September, 2017 Puebla-Morelos Earthquake; Report; Stanford University: Stanford, CA, USA, 2017; Available online: https://www.researchgate.net/publication/320297374_Preliminary_Statistics_of_Collapsed_Buildings_in_Mexico_City_in_the_September_19_2017_Puebla-Morelos_Earthquake (accessed on 6 February 2026).
- Franke, K.W.; Candia, G.; Mayoral, J.M.; Wood, C.M.; Montgomery, J.; Hutchinson, T.; Morales-Velez, A.C. Observed building damage patterns and foundation performance in Mexico City following the 2017 M7. 1 Puebla-Mexico City earthquake. Soil Dyn. Earthq. Eng. 2019, 125, 105708. [Google Scholar] [CrossRef] [Scilit]
- Aguilar-Meléndez, A.; Pujades, L.; de la Puente, J. Seismograms Analyzer-e, un software para analizar registros sísmicos. In Proceedings of the Memorias del XXI Congreso Nacional de Ingeniería Sísmica, SMIS. Guadalajara, Mexico, 20–23 September 2017; pp. 1–9. Available online: https://www.researchgate.net/publication/320110109_SEISMOGRAMS_ANALYZER-E_UN_SOFTWARE_PARA_ANALIZAR_REGISTROS_SISMICOS (accessed on 4 February 2026).
- Miranda, E.; Bertero, V.V. The Mexico Earthquake of 19 September 1985—Performance of Low-Rise Buildings in Mexico City. Earthq. Spectra 1989, 5, 121–143. [Google Scholar] [CrossRef] [Scilit]
- Schmidt-Diaz, V. Correlaciones a partir de la Intensidad de Arias para datos acelerográficos de Costa Rica. Rev. Geológica De. Am. Cent. 2008, 38, 95–117. [Google Scholar] [CrossRef] [Scilit]
- Dobry, R.; Idriss, I.M.; Ng, E.C. Duration characteristics of horizontal components of strong-motion earthquake records. Bull. Seismol. Soc. Am. 1978, 68, 1487–1520. [Google Scholar]
- Campbell, K.W.; Bozorgnia, Y. Use of cumulative absolute velocity (CAV) in damage assessment. In Proceedings of the 15th World Conference on Earthquake Engineering, Lisbon, Portugal, 24–28 September, 2012; pp. 1–10. Available online: https://proceedings-wcee.org/view.html?id=15943&conference=15WCEE (accessed on 5 February 2026).
- Electric Power Research Institute (EPRI). Guidelines for Nuclear Power Plant Response to an Earthquake; Final Report; 2015; 90p. Available online: https://restservice.epri.com/publicdownload/000000003002005284/0/Product (accessed on 2 February 2026).
- Martínez García, Z.F.; Juárez Francisco, S.; Aguilar-Meléndez, A.; Shafie Panah, R.; Xicohtencatl-Gomez, A.I.; Pérez Orellan, J.A.; Vargas Colorado, A.; Carpio Santamaría, F.A.; Monterrubio-Velasco, M.; García Elías, A.; et al. Comparison of seismic records from the Turkey earthquakes of February 2023 with Mexican records. In Proceedings of the 18th World Conference on Earthquake Engineering, Milan, Italy, 30 June–5 July 2024; pp. 1–12. Available online: https://proceedings-wcee.org/downloadFile/18WCEE/?file=LTMwMDMwNjA3Ng==&mode=download&category=18WCEE (accessed on 7 February 2026).
- Akinci, A.; Malagnini, L.; Sabetta, F. Characteristics of the strong ground motions from the 6 April 2009 L’Aquila earthquake, Italy. Soil Dyn. Earthq. Eng. 2010, 30, 320–335. [Google Scholar] [CrossRef] [Scilit]
- D’Ayala, D.F.; Paganoni, S. Assessment and analysis of damage in L’Aquila historic city centre after 6th April 2009. Bull. Earthq. Eng. 2011, 9, 81–104. [Google Scholar] [CrossRef] [Scilit]
- Aguilar-Meléndez, A.; Hurtado, G.; García, A.; Sánchez, J.L.; Salgado, E.; Montiel, N.A. Veranos de Investigación Científica Virtuales y Software en la Enseñanza de las Estructuras en la Ingeniería Civil. In Proceedings of the XXIV Congreso Nacional de Ingeniería Sísmica, Guadalajara, Mexico, 1–4 November 2023; pp. 1–7. Available online: https://www.researchgate.net/publication/376645562_VERANOS_DE_INVESTIGACION_CIENTIFICA_VIRTUALES_Y_SOFTWARE_EN_LA_ENSENANZA_DE_LAS_ESTRUCTURAS_EN_LA_INGENIERIA_CIVIL (accessed on 4 February 2026).
- Summer of Scientific and Technological Research from the Pacific. 2026. Available online: https://programadelfin.org.mx/sitio/estudiantes-verano.php (accessed on 2 February 2026).
- Rapid Visual Screening of Buildings for Potential Seismic Hazards: A Handbook Third Edition; FEMA P-154 2015; ATC-FEMA: Redwood City, CA, USA, 2015; pp. 1–388. Available online: https://www.fema.gov/sites/default/files/2020-07/fema_earthquakes_rapid-visual-screening-of-buildings-for-potential-seismic-hazards-a-handbook-third-edition-fema-p-154.pdf (accessed on 8 February 2026).
- Anagnostopoulos, S.A.; Moretti, M.; Panoutsopoulou, M.; Panagiotopoulou, D.; Thoma, T. Post Earthquake Damage and Usability Assessment of Buildings: Further Development and Applications. Final report. pp. 1–166. Available online: https://civil-protection-humanitarian-aid.ec.europa.eu/system/files/2014-11/peadab.pdf (accessed on 8 February 2026).
- Douglas, J.; Crowley, H.; Silva, V.; Marzocchi, W.; Danciu, L.; Pinho, R. Methods for evaluating the significance and importance of differences amongst probabilistic seismic hazard results for engineering and risk analyses: A review and insights. Bull. Earthq. Eng. 2024, 22, 2769–2796. [Google Scholar] [CrossRef] [Scilit]
- Giardini, D.; Grünthal, G.; Shedlock, K.M.; Zhang, P. The GSHAP Global Seismic Hazard Map. In International Handbook of Earthquake and Engineering Seismology; International Geophysics Series 81 B; Academic Press: Amsterdam, The Netherlands, 2003; pp. 1233–1239. [Google Scholar]
- GSHAP Map. GSHAP Map Online. 2018. Available online: http://gmo.gfz-potsdam.de/pub/GSHAP_Map_Online/gshap_map_online_frame.html (accessed on 29 October 2025).
- Pagani, M.; Garcia-Pelaez, J.; Gee, R.; Johnson, K.; Poggi, V.; Styron, R.; Weatherill, G.; Simionato, M.; Viganò, D.; Danciu, L.; et al. Global Earthquake Model (GEM) Seismic Hazard Map (Version 2018.1)—December 2018. Available online: https://hazard.openquake.org/gem/images/home/gem_global_seismic_hazard_map_v2018.1.pdf (accessed on 9 February 2026).
- Hou, L.; Shi, P. Haiti 2010 earthquake—How to explain such huge losses? Int. J. Disaster Risk Sci. 2011, 2, 25–33. [Google Scholar] [CrossRef] [Scilit]
- DesRoches, R.; Comerio, M.; Eberhard, M.; Mooney, W.; Rix, G.J. Overview of the 2010 Haiti Earthquake. Earthq. Spectra 2011, 27, 1–21. [Google Scholar] [CrossRef] [Scilit]
- Aguilar Meléndez, A. Evaluación Probabilista del Riesgo síSmico de Edificios en Zonas Urbanas. Doctoral Dissertation, Universitat Politècnica de Catalunya, Barcelona, Spain, 2011. [Google Scholar] [CrossRef] [Scilit]
- Martínez García, Z.F. Estimación del Peligro síSmico de Ciudades en México y del Periodo de Retorno de los Principales Valores de PGA Registrados en Dichas Ciudades. Master’s Thesis, Universidad Veracruzana, Xalapa, Mexico, 2025. [Google Scholar]
- Aguilar-Meléndez, A.; Ordaz, M.G.; De la Puente, J.; Pujades, L.; Barbat, A.; Rodríguez-Lozoya, H.E.; Monterrubio-Velasco, M.; Martínez, J.E.E.; Campos-Rios, A. Sensitivity analysis of seismic parameters in the probabilistic seismic hazard assessment (PSHA) for barcelona applying the new R-CRISIS. Comput. Sist. 2018, 22, 1099–1122. Available online: https://www.scielo.org.mx/pdf/cys/v22n4/1405-5546-cys-22-04-1099.pdf (accessed on 5 February 2026). [CrossRef] [Scilit]
- Aguilar-Meléndez, A.; Ordaz Schroeder, M.G.; De la Puente, J.; González-Rocha, S.N.; Rodriguez-Lozoya, H.E.; Córdova-Ceballos, A.; García-Elías, A.; Calderón-Ramón, C.; Escalante-Martínez, J.E.; Laguna-Camacho, J.R.; et al. Development and validation of software CRISIS to perform probabilistic seismic hazard assessment with emphasis on the recent CRISIS2015. Comput. Sist. 2017, 21, 67–90. Available online: https://www.scielo.org.mx/pdf/cys/v21n1/1405-5546-cys-21-01-00067.pdf (accessed on 9 February 2026). [CrossRef] [Scilit]
- Wang, Z. Seismic Hazard Assessment: Issues and Alternatives. Pure Appl. Geophys. 2011, 168, 11–25. [Google Scholar] [CrossRef] [Scilit]
- Roy, N.S.; Choudhury, S. Seismic Vulnerability Assessment Methods: A Review. In Advances in Structural Mechanics and Applications. ASMA 2022. Structural Integrity, 1st ed.; Fonseca de Oliveira Correia, J.A., Choudhury, S., Dutta, S., Eds.; Springer: Cham, Switzerland, 2021; Volume 27, pp. 282–300. [Google Scholar]
- Suárez, G. The Seismic Early Warning System of Mexico (SASMEX): A Retrospective View and Future Challenges. Front. Earth Sci. 2022, 10, 827236. [Google Scholar] [CrossRef] [Scilit]
- Sistema de Alerta Sísmica Mexicano. Available online: http://www.cires.org.mx/index.php (accessed on 15 December 2025).
- Sistema de Alerta Sísmica Mexicano. Warnings Archive 2026. Available online: http://cires.mx/sasmex_historico_n.php (accessed on 2 February 2026).
- U.S. Tsunami Warning System. 2026. Available online: https://www.tsunami.gov/ (accessed on 15 January 2026).
- Williamson, A.; Allen, R.M. Improving Efficacy of Tsunami Warnings Along the West Coast of the United States. Pure Appl. Geophys. 2023, 180, 1661–1678. [Google Scholar] [CrossRef] [Scilit]
- Japan Tsunami Warning System. 2026. Available online: https://www.jma.go.jp/bosai/map.html#5/37.996/135/&elem=all&contents=warning (accessed on 15 December 2025).
- Hoshiba, M.; Ozaki, T. Earthquake Early Warning and Tsunami Warning of the Japan Meteorological Agency, and Their Performance in the 2011 off the Pacific Coast of Tohoku Earthquake (9.0). In Early Warning for Geological Disasters. Advanced Technologies in Earth Sciences; Wenzel, F., Zschau, J., Eds.; Springer: Berlin/Heidelberg, Germany, 2014. [Google Scholar]
- Egbelakin, T.; Wilkinson, S.; Potangaroa, R.; Ingham, J. Enhancing seismic risk mitigation decisions: A motivational approach. Constr. Manag. Econ. 2011, 29, 1003–1016. [Google Scholar] [CrossRef] [Scilit]
- Zhang, Y.; Fung, J.F.; Johnson, K.J.; Sattar, S. Review of Seismic Risk Mitigation Policies in Earthquake-Prone Countries: Lessons for Earthquake Resilience in the United States. J. Earthq. Eng. 2022, 26, 6208–6235. [Google Scholar] [CrossRef] [Scilit] [PubMed]
- Piangiamore, G.L.; Falsaperla, S.; Eva, E.; Musacchio, G. Seismic risk communication: Let’s students show their own way. Ann. Geophys. 2021, 64, SE326. [Google Scholar] [CrossRef] [Scilit]
- Copernicus Emergency Management Service—Mapping 2026. Available online: https://mapping.emergency.copernicus.eu/ (accessed on 15 January 2026).
- Casarotti, C.; Senaldi, I.E. Advancing earthquake disaster management with earth observation data: From Copernicus gaps and challenges to requirements for tailored national-scale applications. Int. J. Disaster Risk Reduct. 2025, 131, 105903. [Google Scholar] [CrossRef] [Scilit]
- Global Disaster Awareness and Coordination System. 2026. Available online: https://gdacs.org/ (accessed on 23 January 2026).
- Multi-Hazard Early Warning System Global Disaster Alert and Coordination System (GDACS): Methods for Anticipation and Rapid Impact Estimation User Manual (Version 2); Publications Office of the European Union: Luxembourg, 2026; pp. 1–37. Available online: https://data.europa.eu/doi/10.2760/1461943 (accessed on 9 February 2026).
- Rodriguez, M.E. Characteristics of the strong ground motions from the 6 April 2009 L’Aquila earthquake, Italy. Seism.-Resist. Des. Regul. Struct. Earthq. Exp. Results Lessons 2024, 6, 2717–5103. Available online: https://en.front-sci.com/index.php/jbt/article/view/2545/3399 (accessed on 2 February 2026).
- Gallegos, M.F.; Saragoni, G.R. Analysis of strong-motion accelerograph records of the 16 April 2016 Mw 7.8 Muisne, Ecuador earthquake. In Proceedings of the 16th World Conference on Earthquake Engineering, 16WCEE. , Santiago Chile, 9–13 January 2017; pp. 1–12. [Google Scholar]
- Government of Federal District of Mexico. Regulations of Constructions. 1921. Available online: https://www.smie.org.mx/uploads/2/2025-07/distrito_federal_reglamento_construccion_estatal_1921.pdf (accessed on 2 February 2026).
- Government of Federal District of Mexico. Regulations for Constructions and Urban Services in the Federal District. 1942. Available online: https://www.smie.org.mx/uploads/2/2025-07/distrito_federal_reglamento_construccion_estatal_1942.pdf (accessed on 2 February 2026).
- Government of Federal District of Mexico. Modifications to the Regulations of Constructions and Urban Services in the Federal District to Prevent the Effects of Earthquakes. 1957. Available online: https://www.smie.org.mx/uploads/2/2025-07/distrito_federal_normas_emergencia_sismo_1957.pdf (accessed on 2 February 2026).
- Government of Federal District of Mexico. New Regulations of Constructions for the Federal District. 1966. Available online: https://www.smie.org.mx/uploads/2/2025-07/distrito_federal_reglamento_construccion_estatal_1966.pdf (accessed on 2 February 2026).
- Government of Federal District of Mexico. Regulations of Constructions for the Federal District. 1976. Available online: https://www.smie.org.mx/uploads/2/2025-07/distrito_federal_reglamento_construccion_estatal_1976.pdf (accessed on 2 February 2026).
- Government of Federal District of Mexico. Regulations of Constructions for the Federal District. 1993. Available online: https://www.smie.org.mx/uploads/2/2025-07/distrito_federal_reglamento_construccion_estatal_1993.pdf (accessed on 2 February 2026).
- Government of Federal District of Mexico. Emergency Construction Regulations for the Federal District. 1985. Available online: https://www.smie.org.mx/uploads/2/2025-07/ciudad_de_mexico_normas_de_emergencia_1985.pdf (accessed on 2 February 2026).
- Government of Federal District of Mexico. Complementary Technical Standards for Seismic Design. 2004. Available online: https://www.smie.org.mx/uploads/2/2025-07/distrito_federal_reglamento_construccion_estatal_2004_ntc2.pdf (accessed on 2 February 2026).
- Government of Mexico City. Standards for the Seismic Rehabilitation of Concrete Buildings Damaged by the 19 September 2017 Earthquake. 2017. Available online: https://www.smie.org.mx/uploads/2/2025-07/ciudad_de_mexico_normas_rehabilitacion_sismica_edificios_danados_2017.pdf (accessed on 2 February 2026).
- Government of Mexico City. Complementary Technical Standards for Seismic Design with Comments. 2020. Available online: https://www.smie.org.mx/uploads/1/2022-11/normas_tecnicas_complementarias_diseno_sismo_2020.pdf (accessed on 2 February 2026).
- Government of Mexico City. Complementary Technical Standard for Evaluation and Structural Rehabilitation of Existing Buildings. Available online: https://data.consejeria.cdmx.gob.mx/portal_old/uploads/gacetas/b3c4f4ff37241d0a93cc6742a8b0bf2f.pdf (accessed on 2 February 2026).
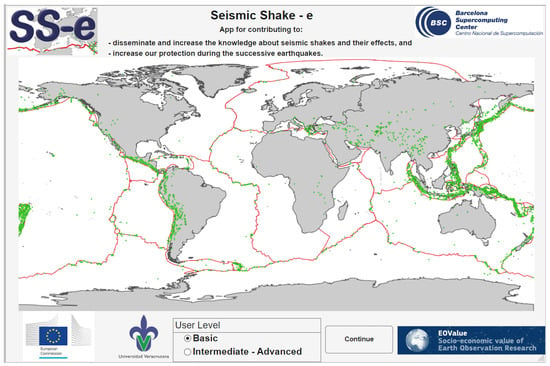
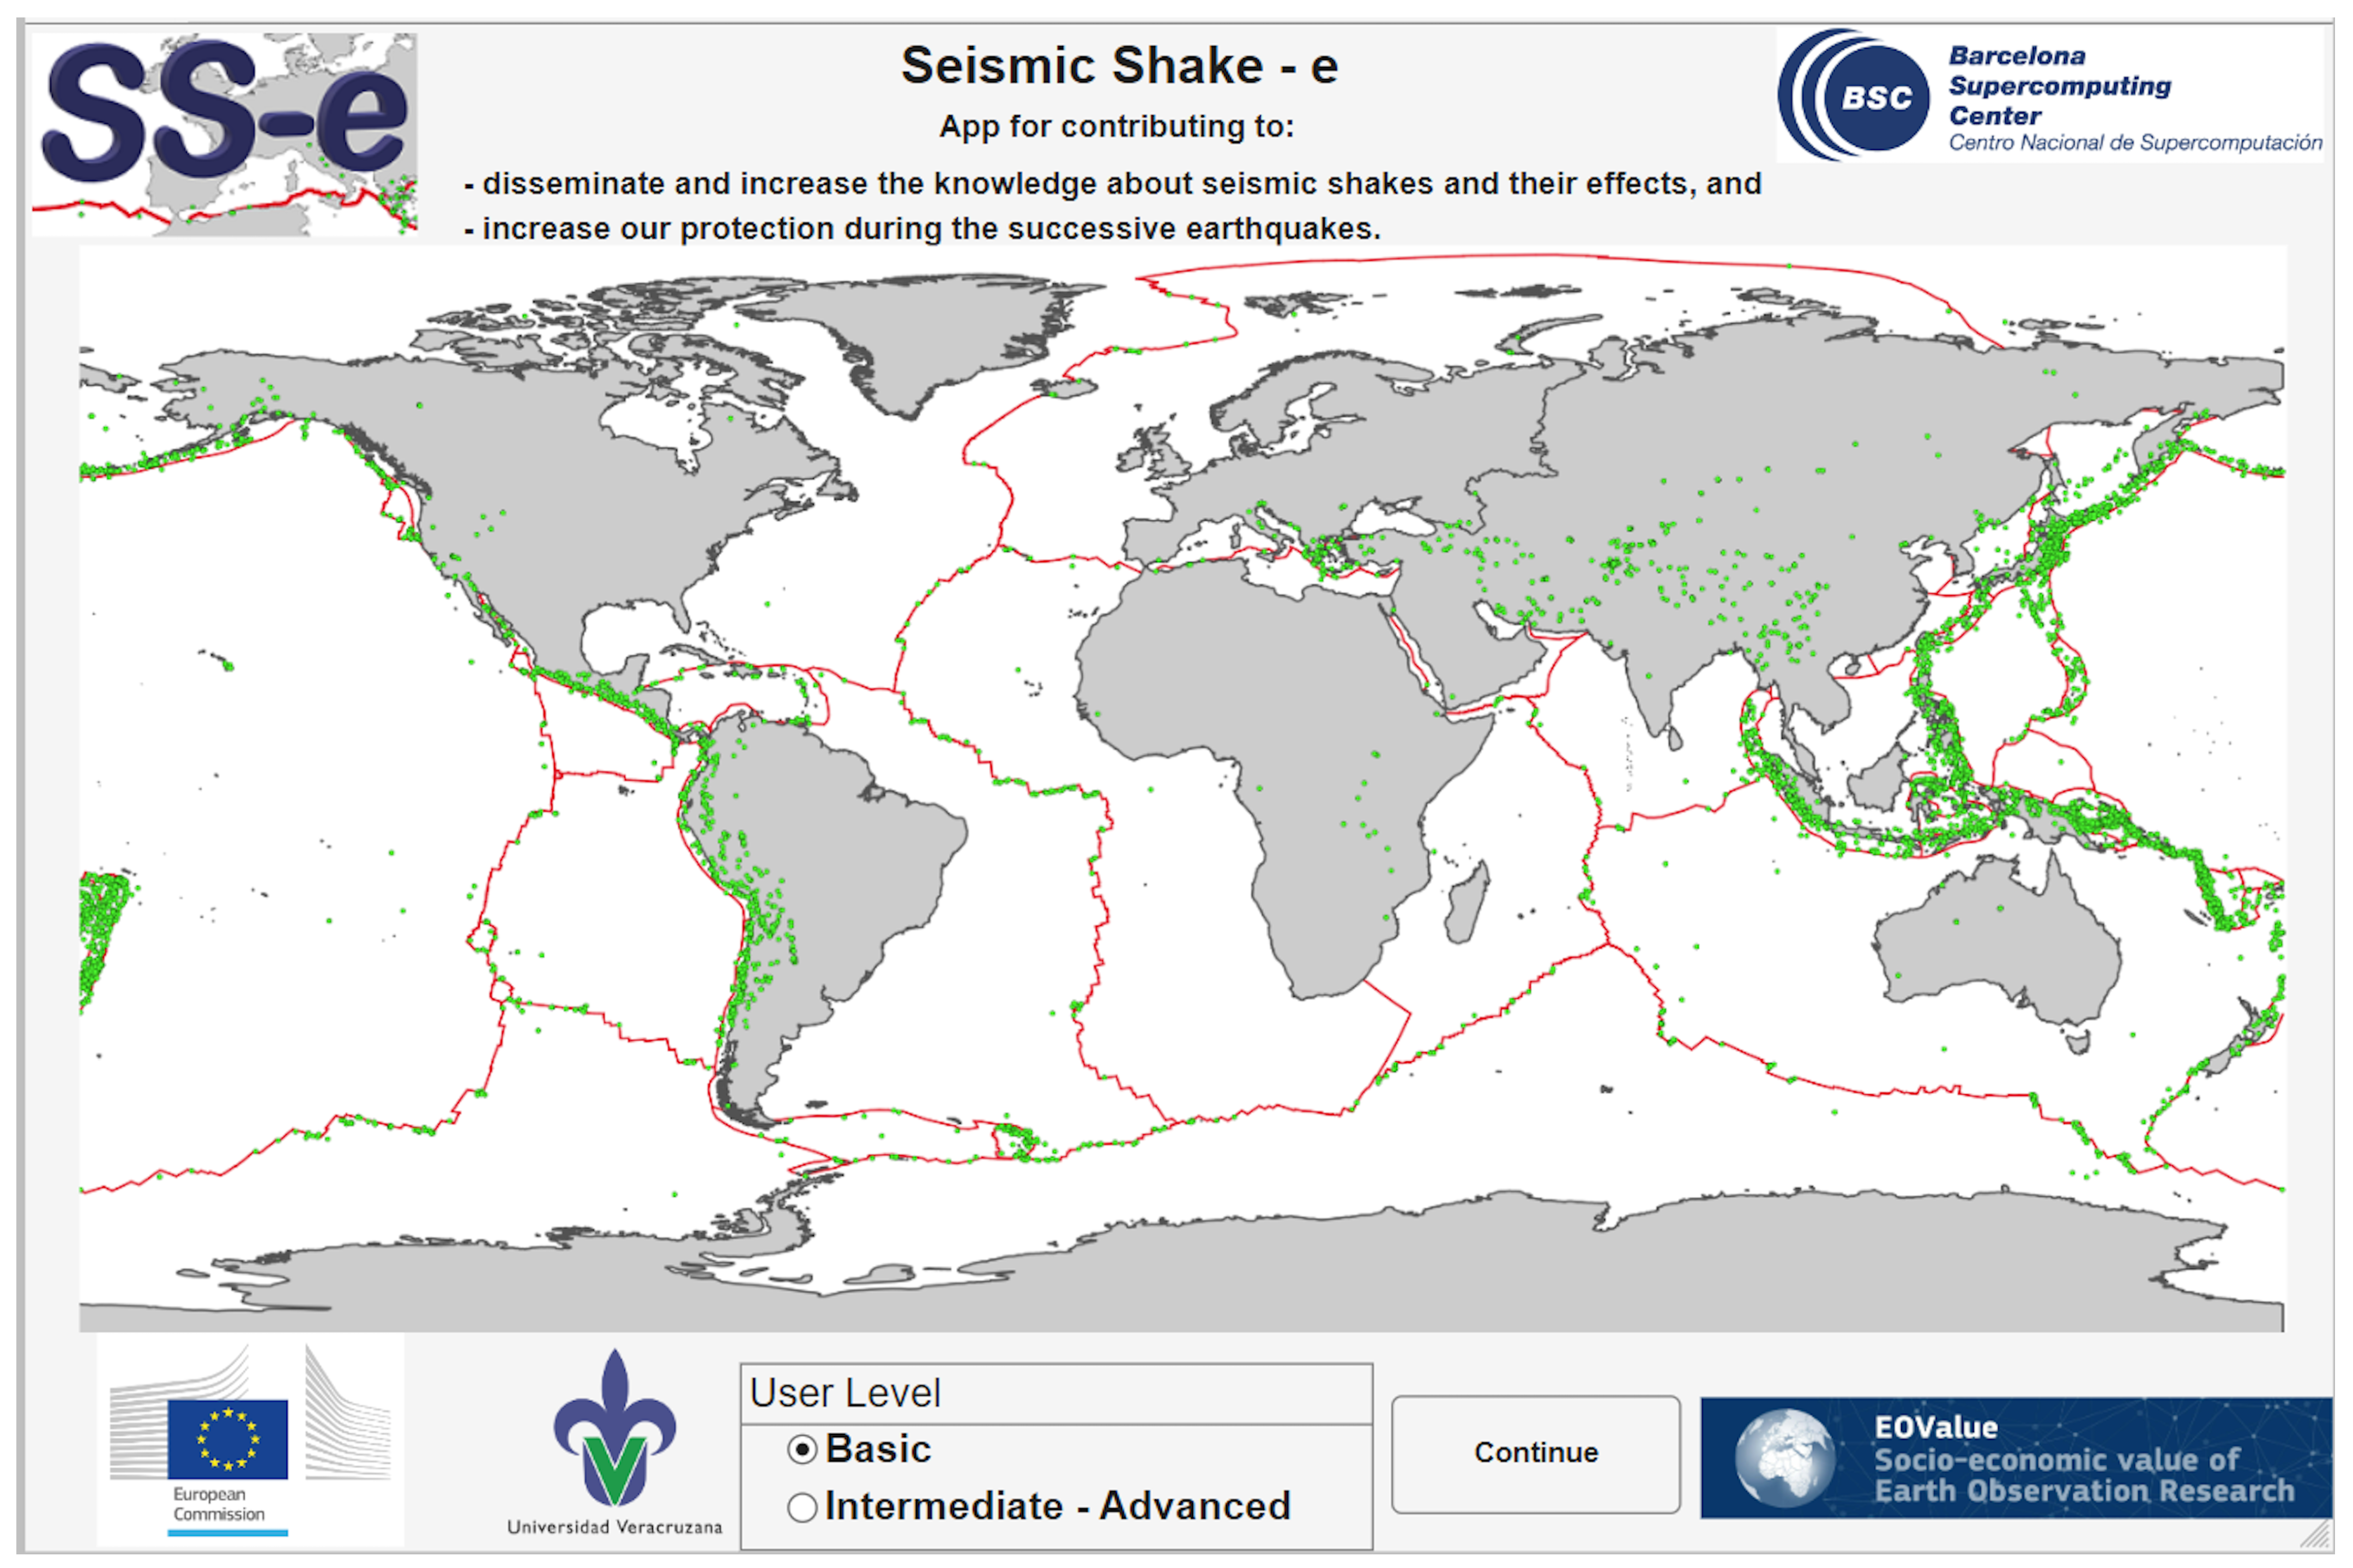
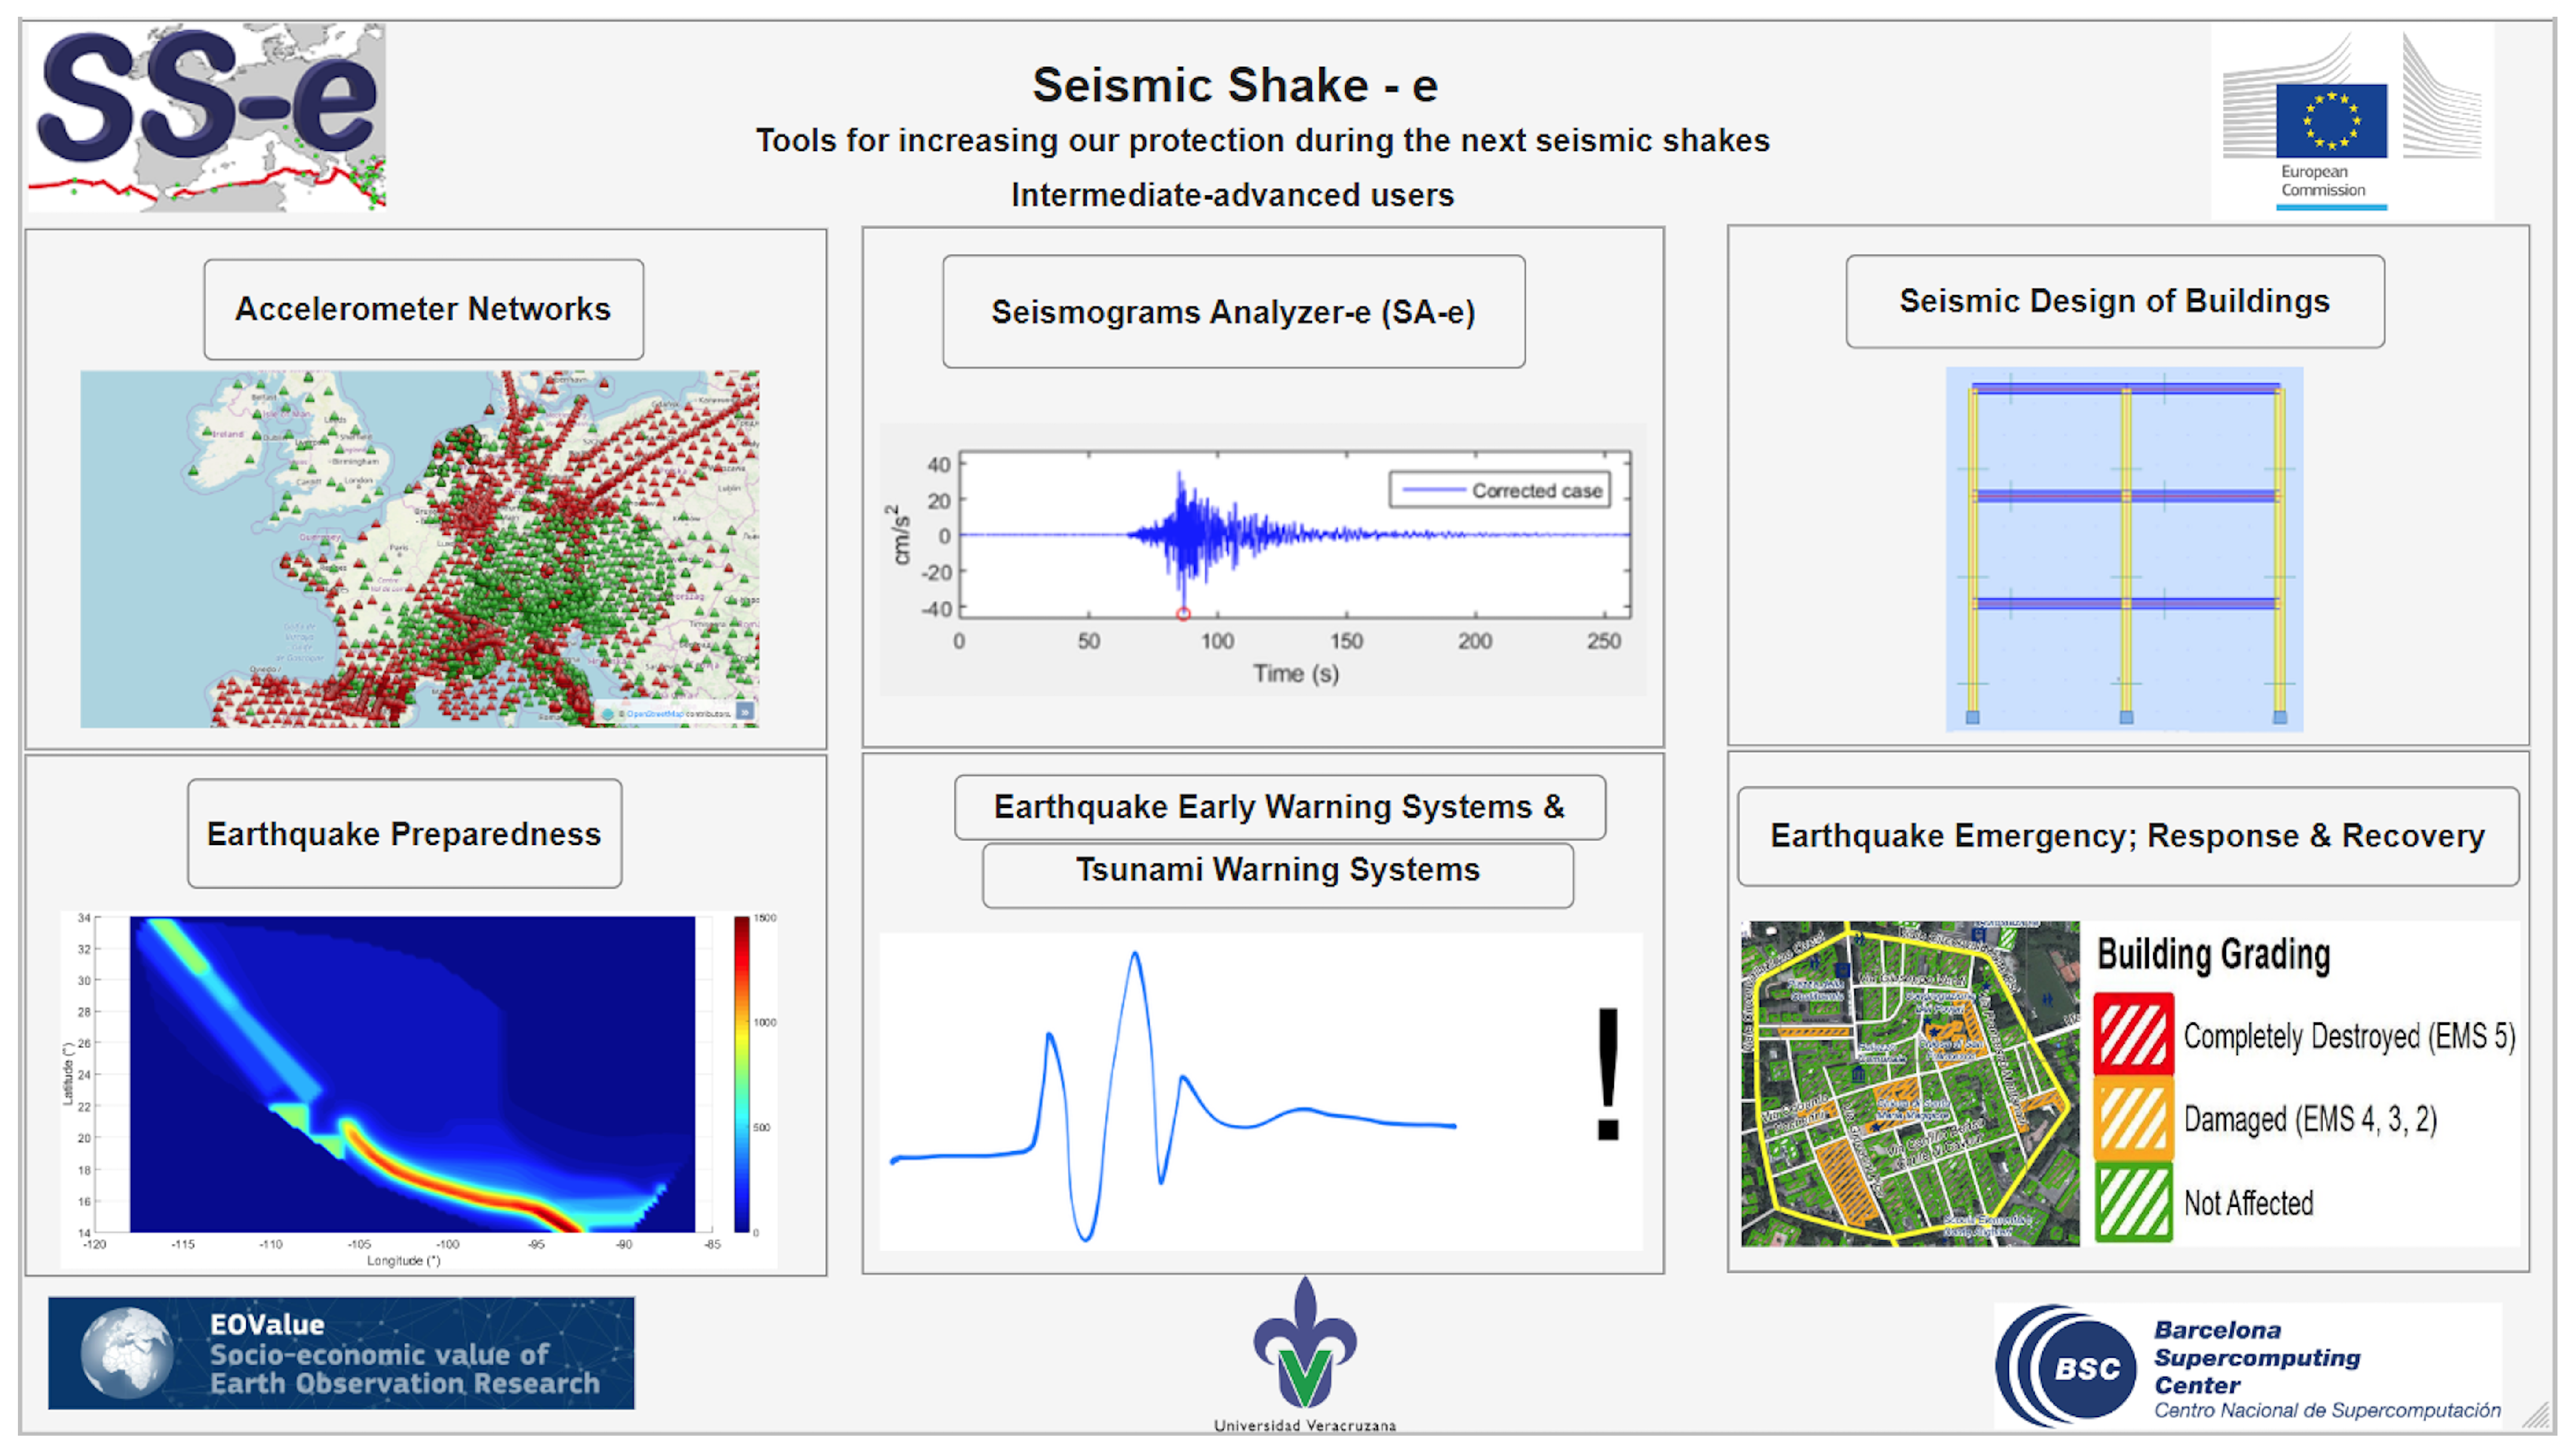
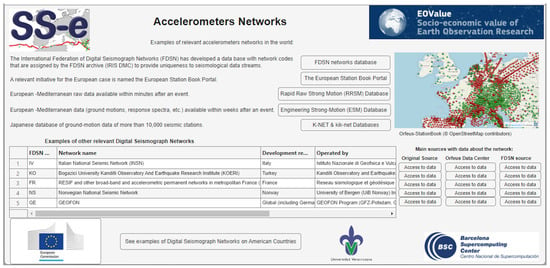
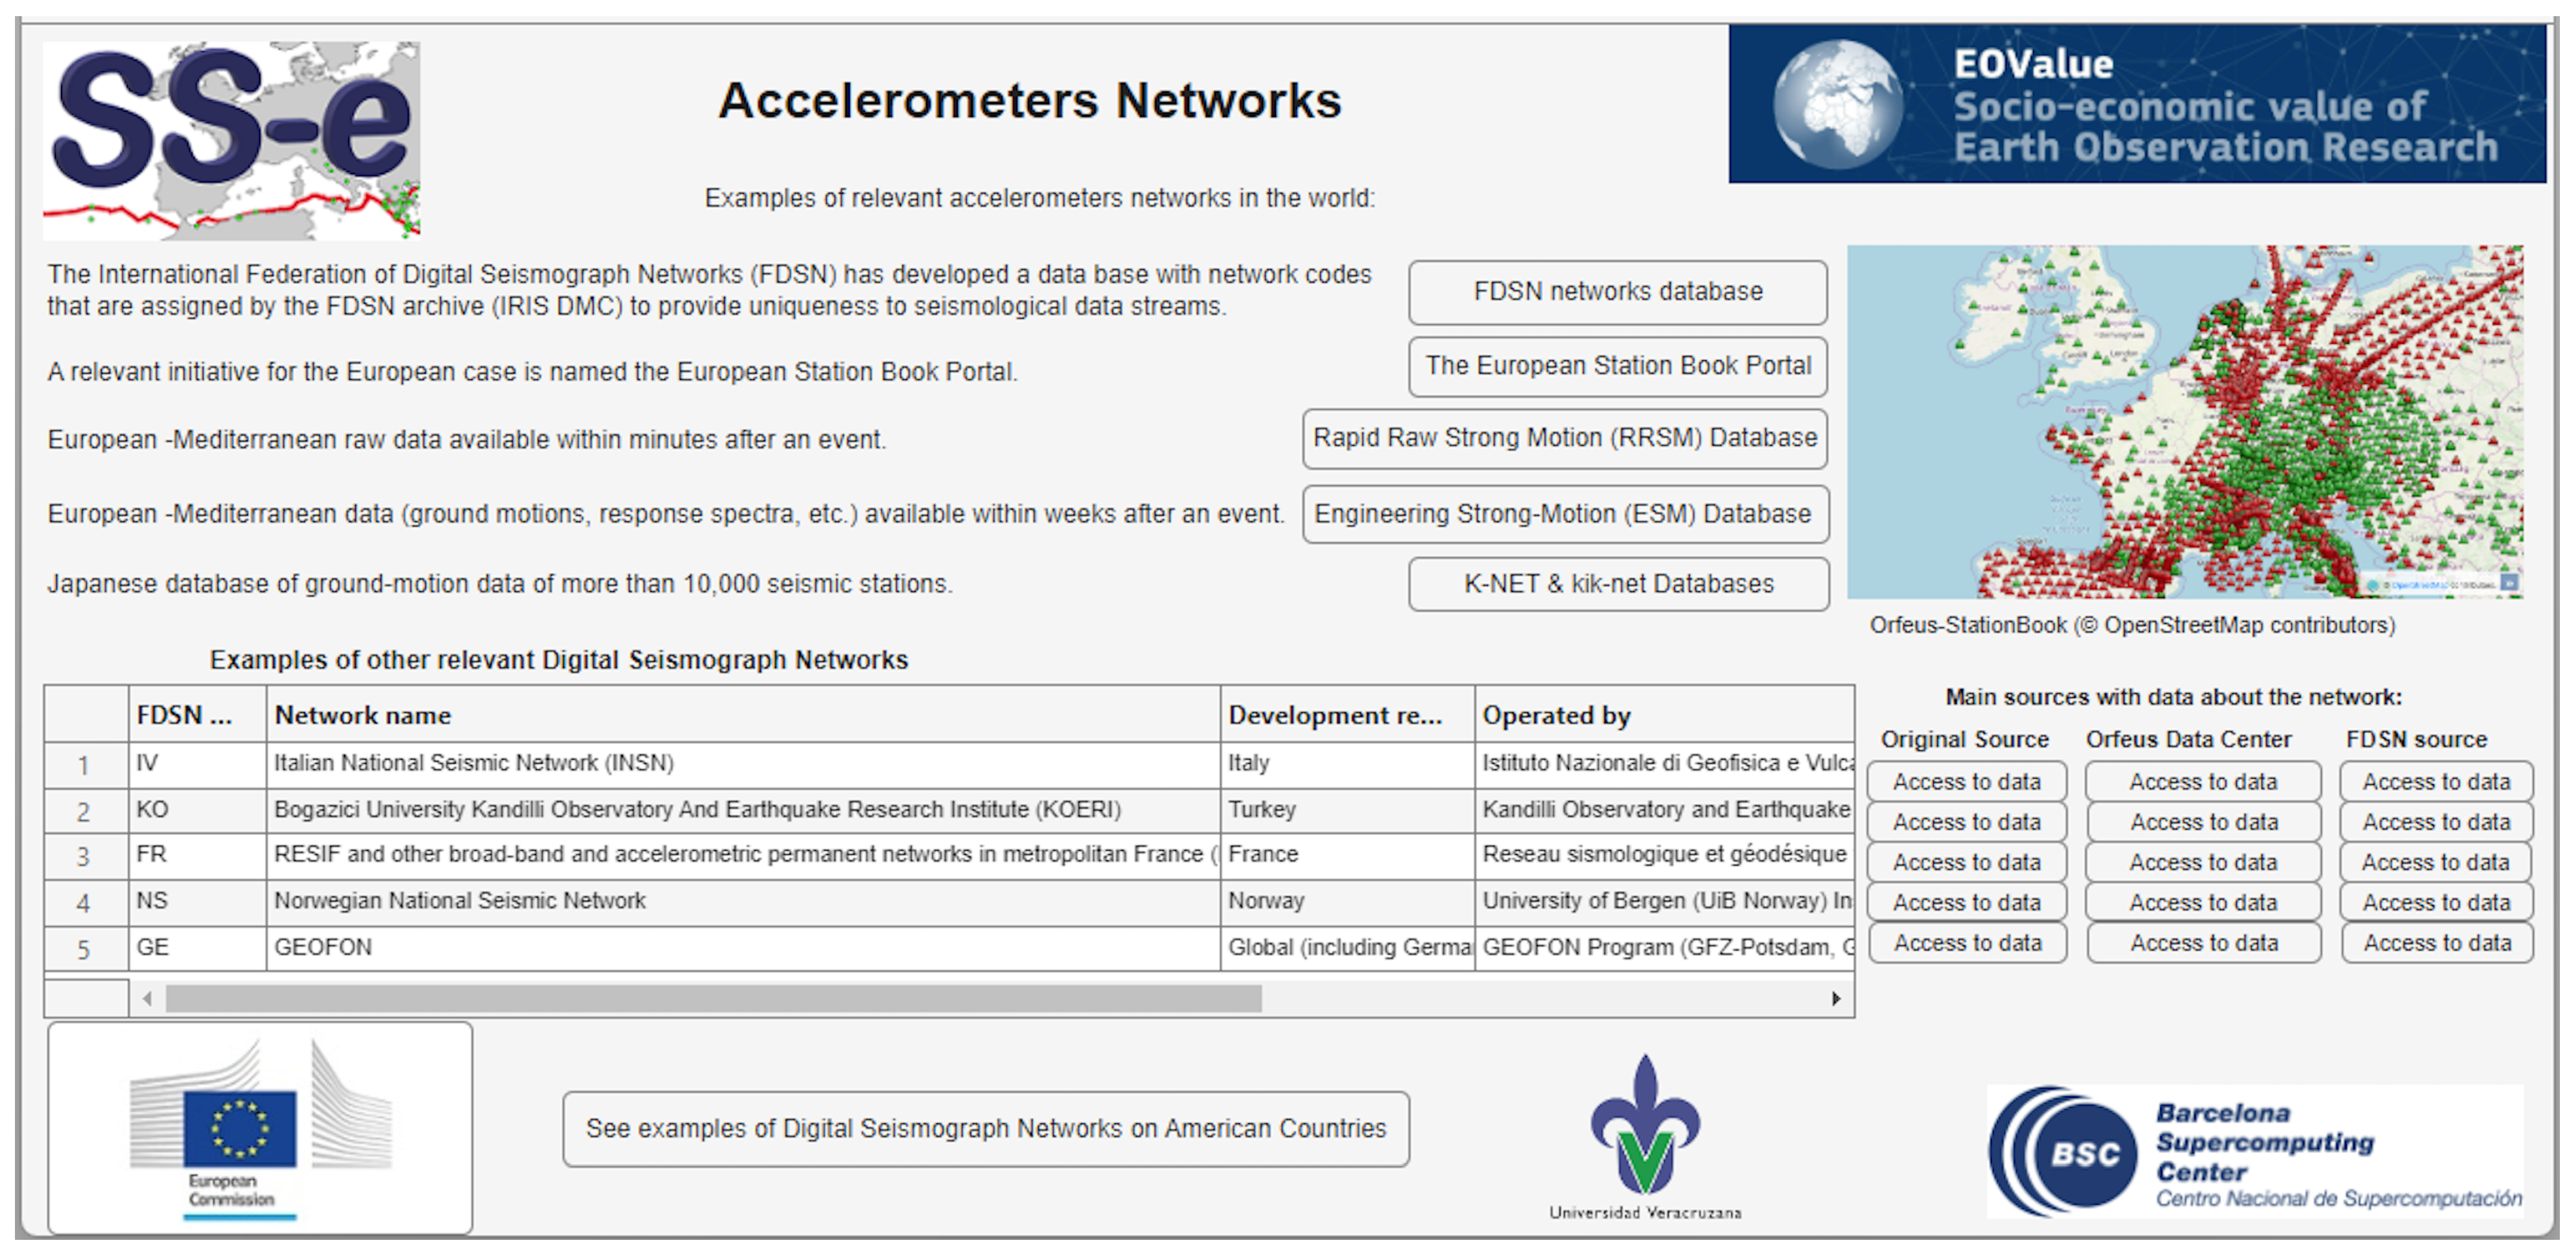
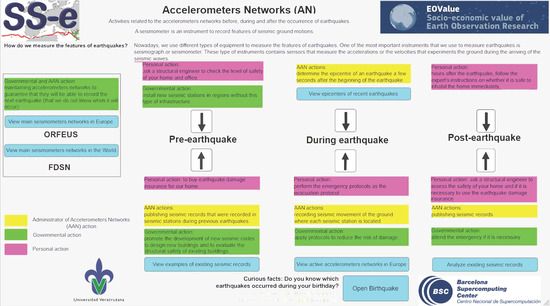
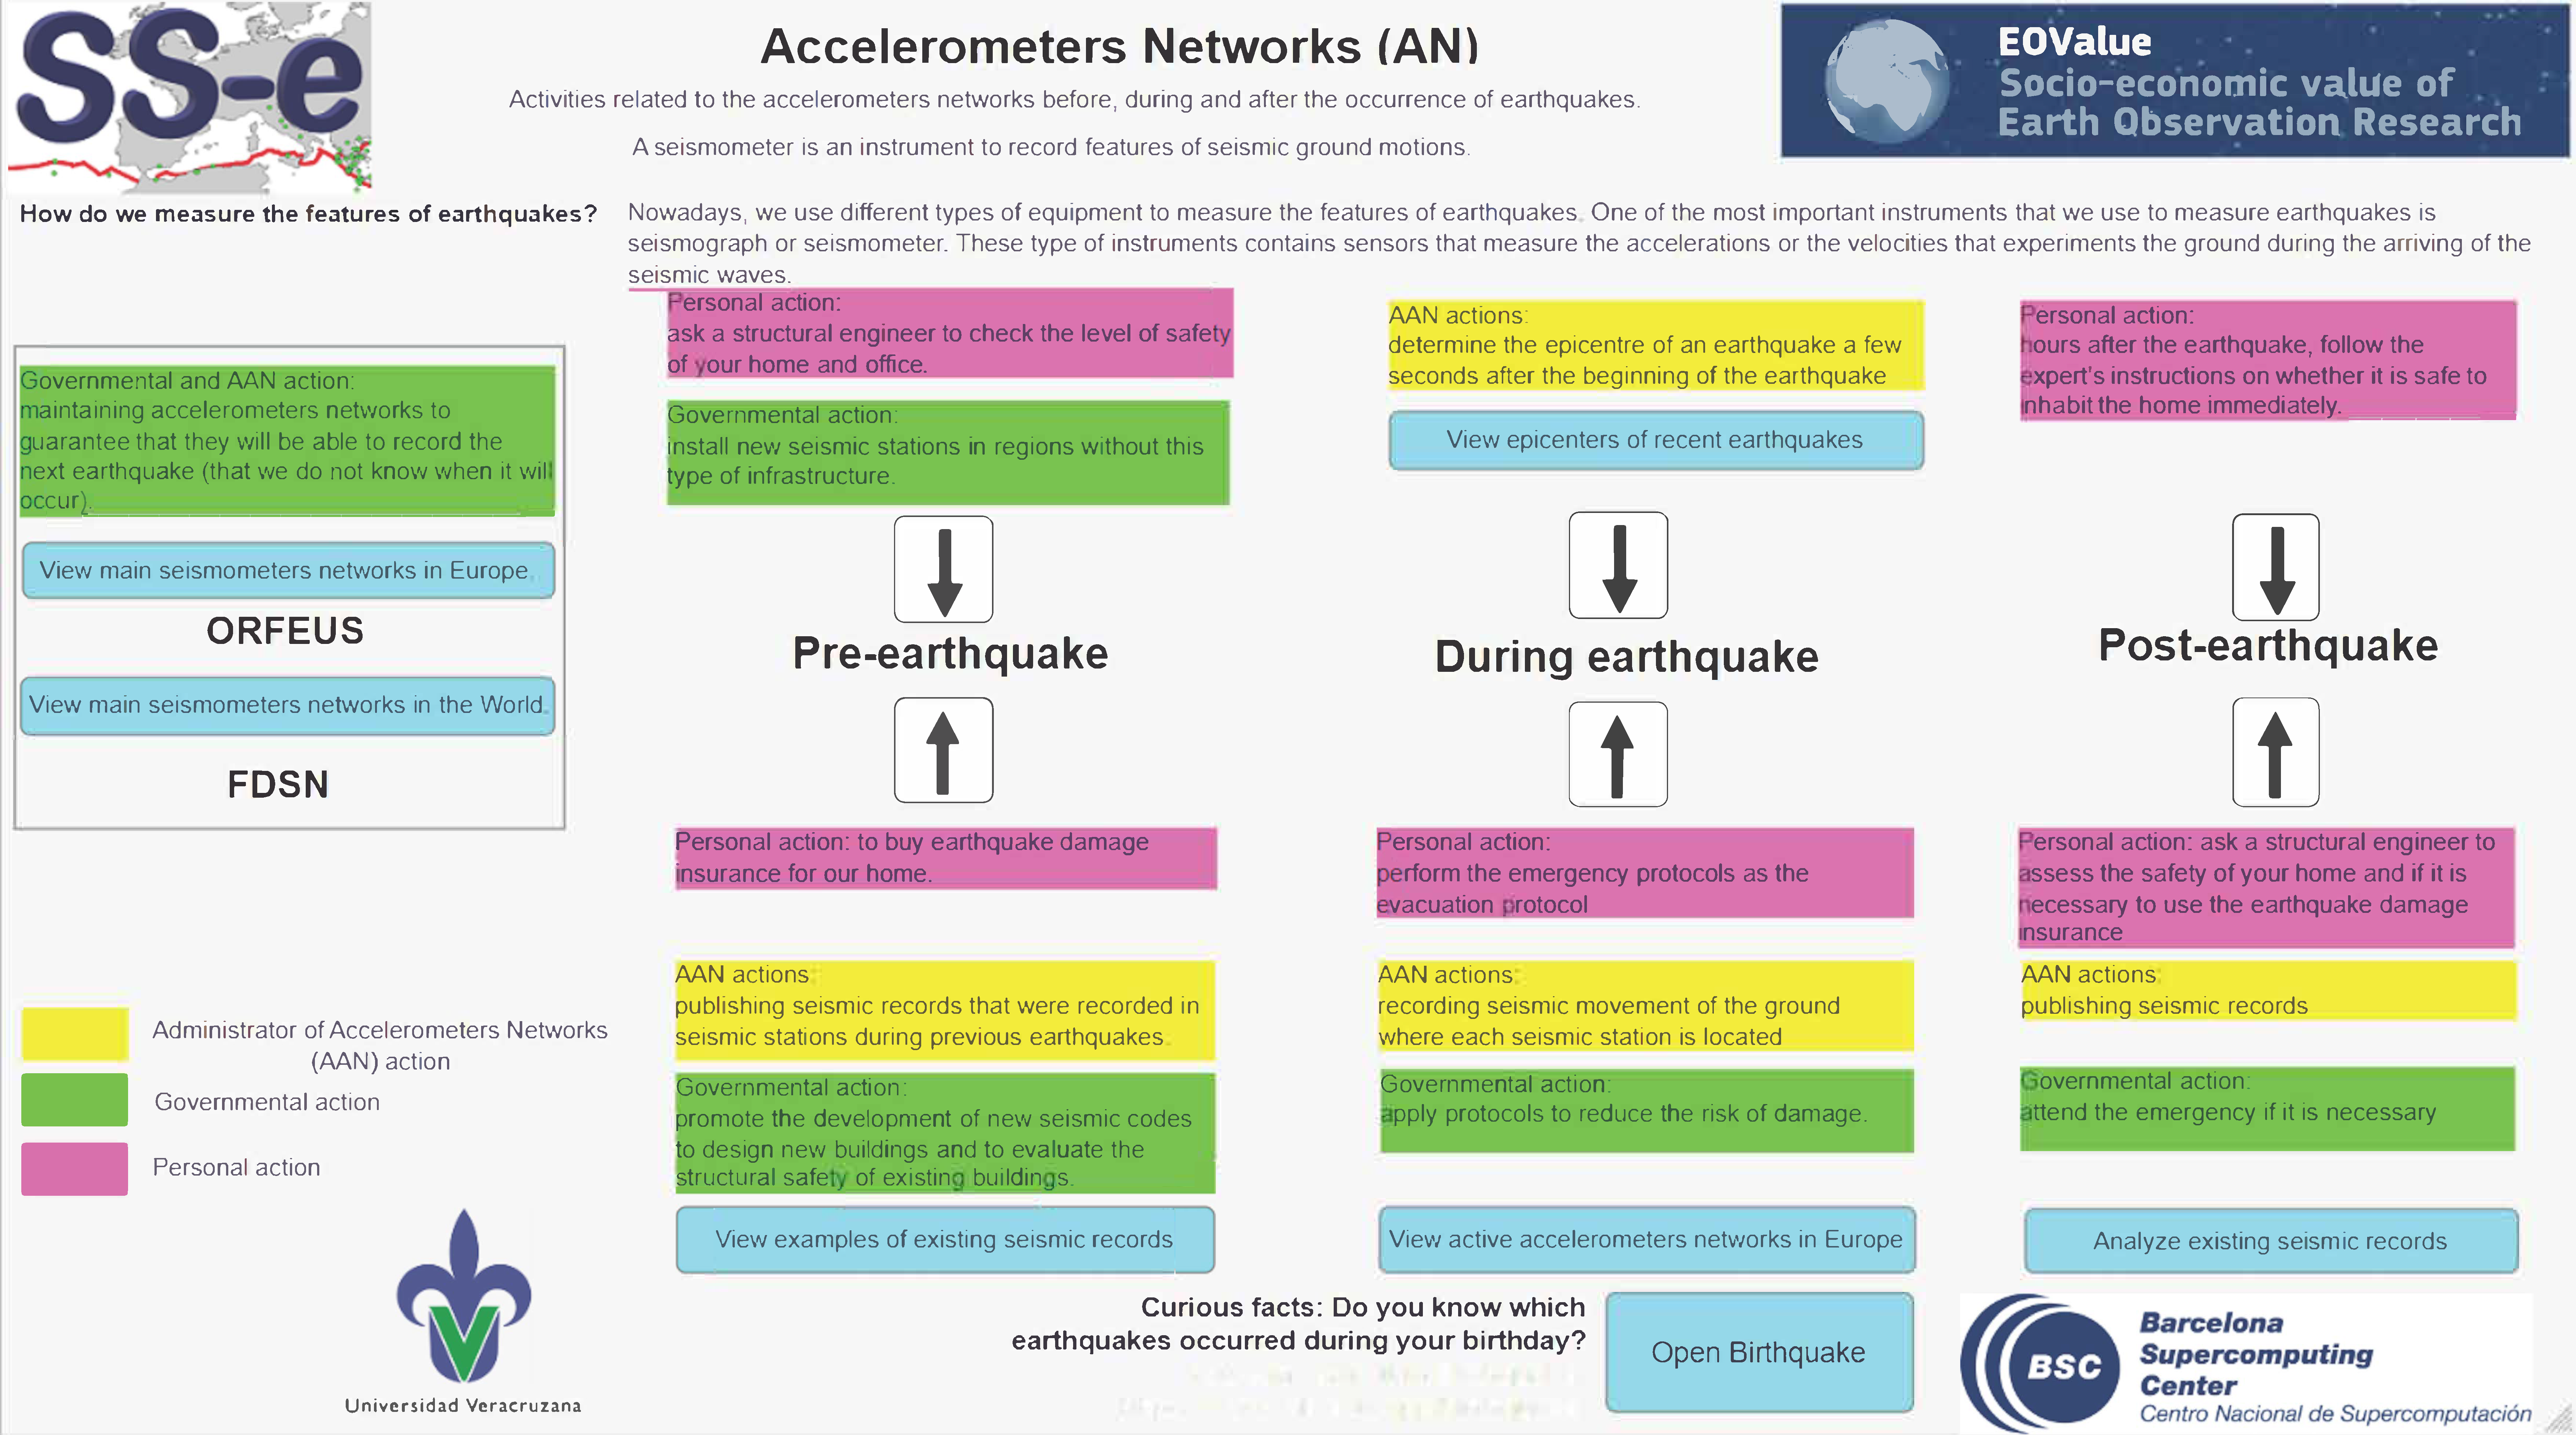


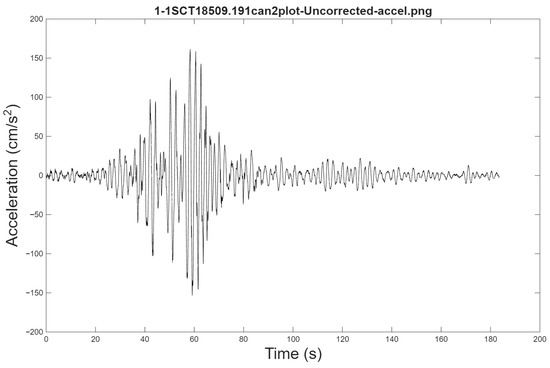
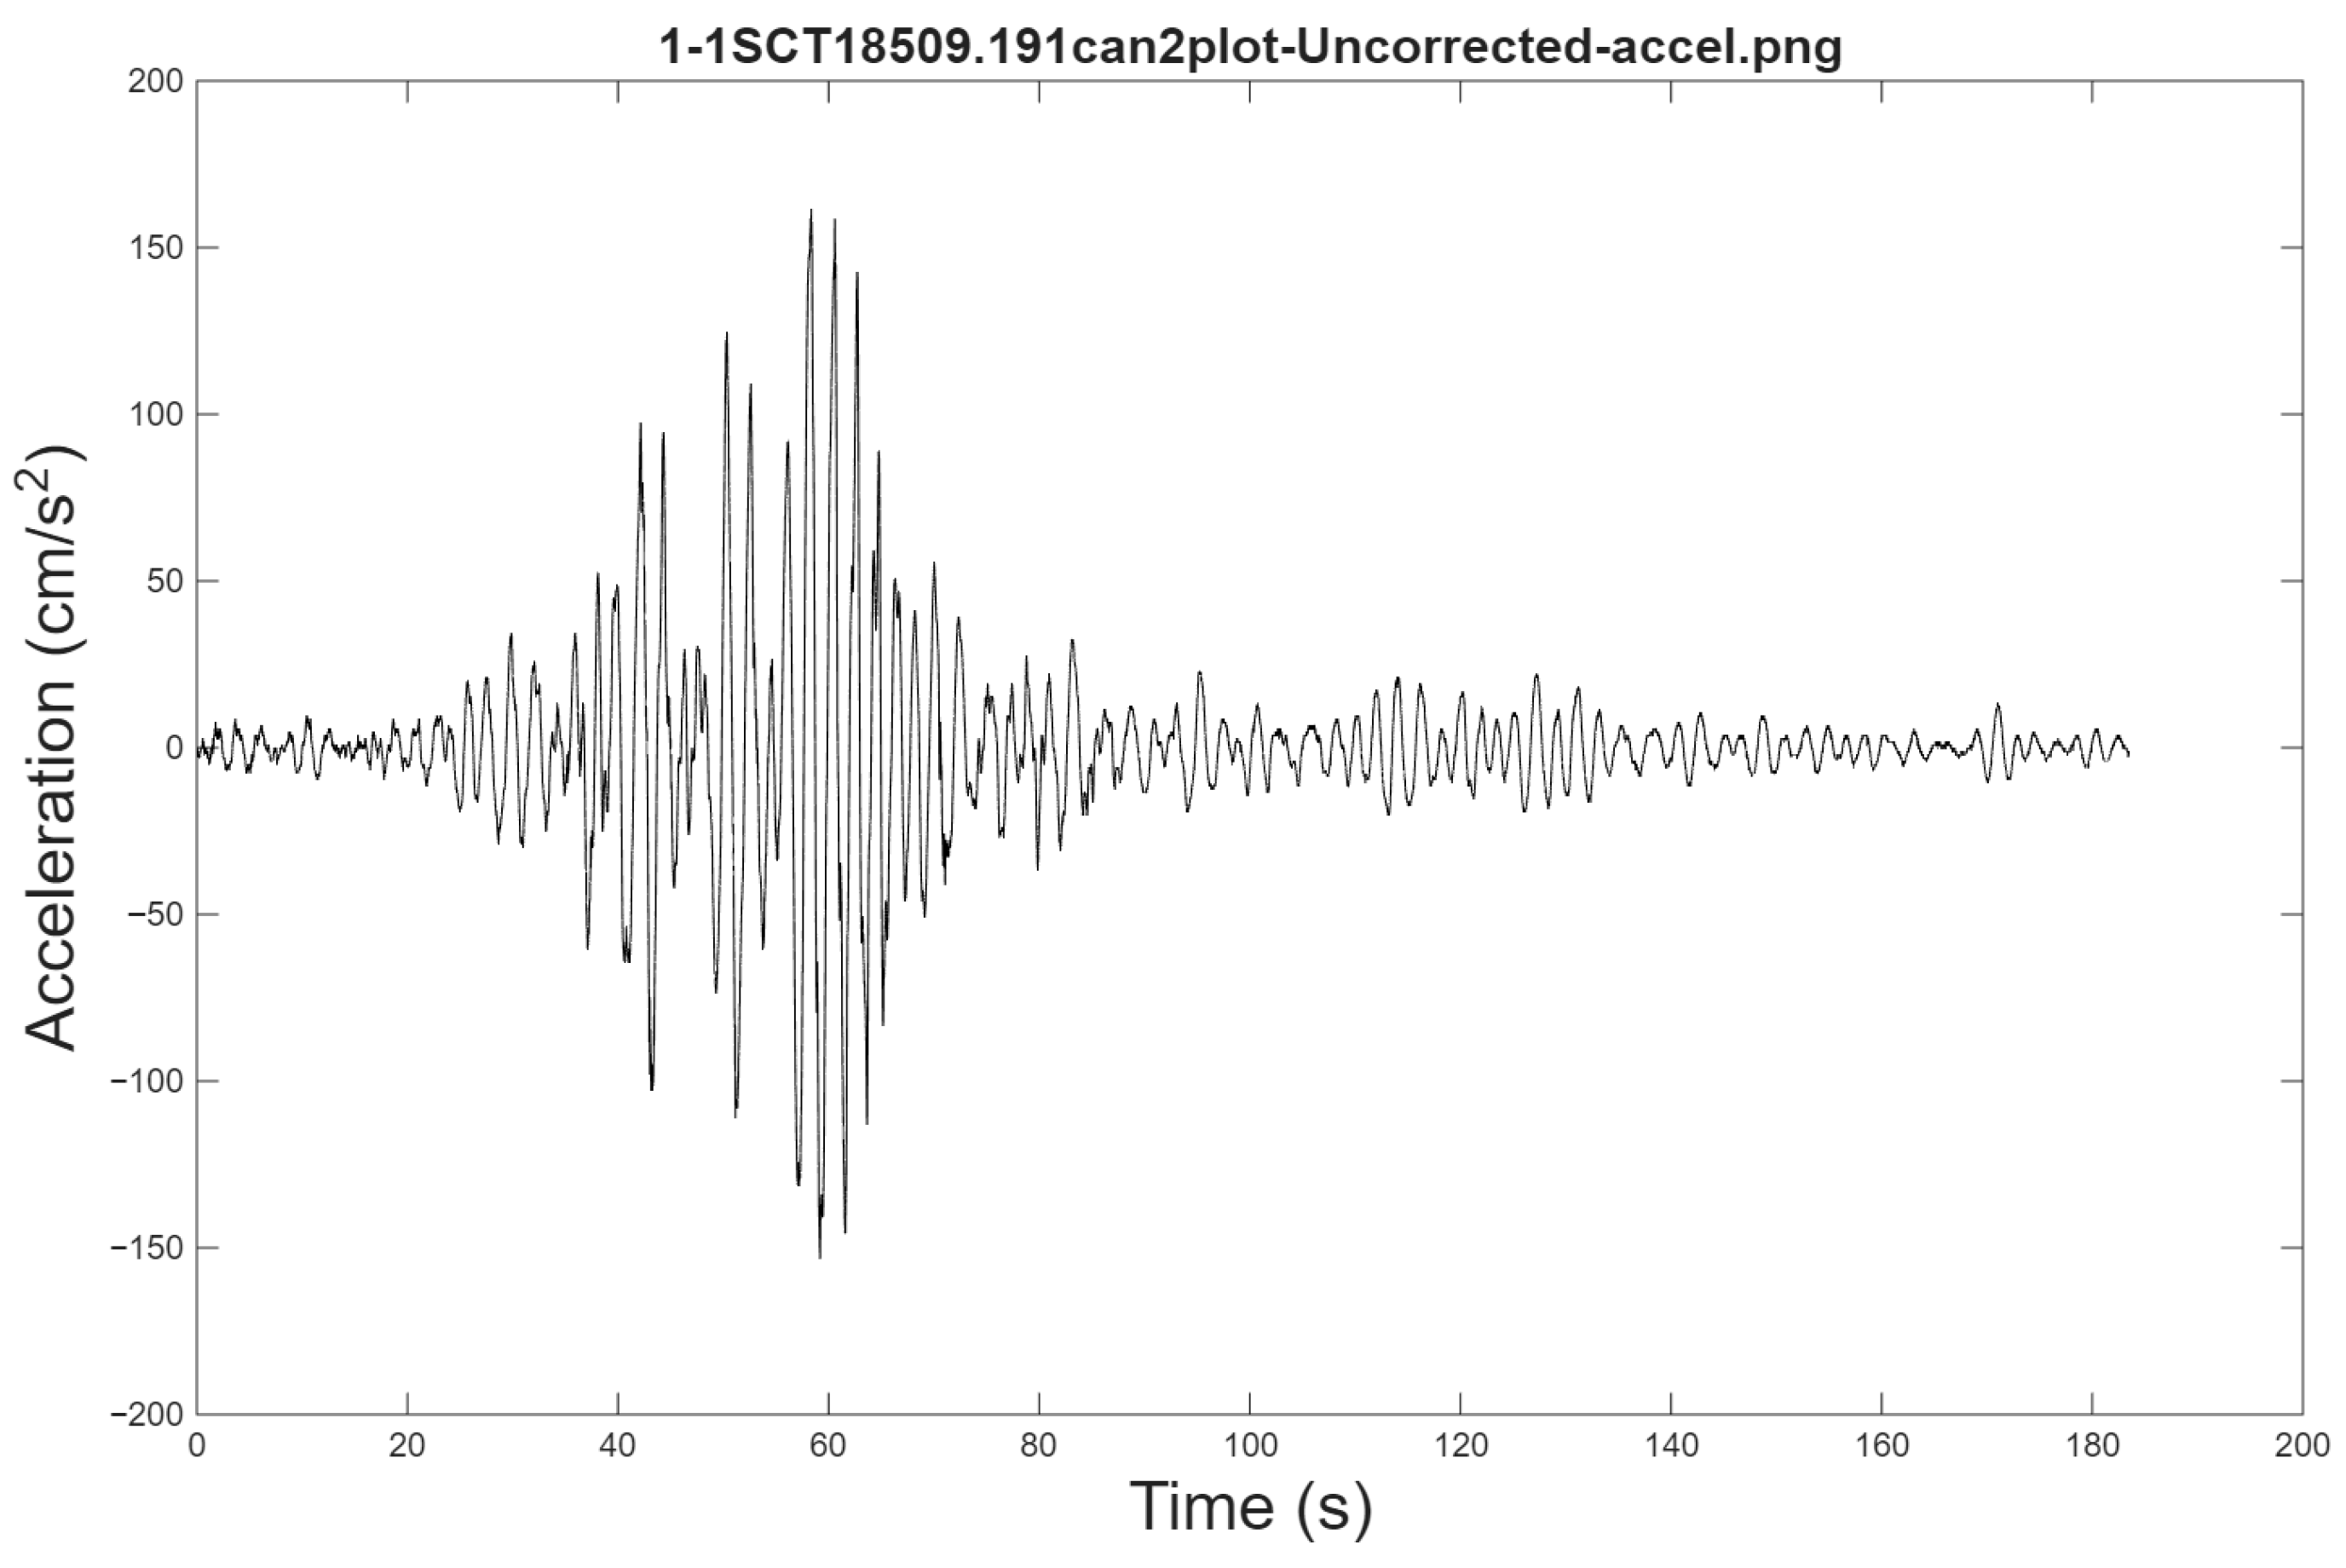
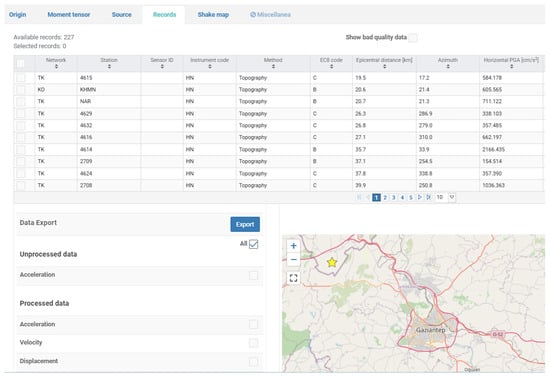
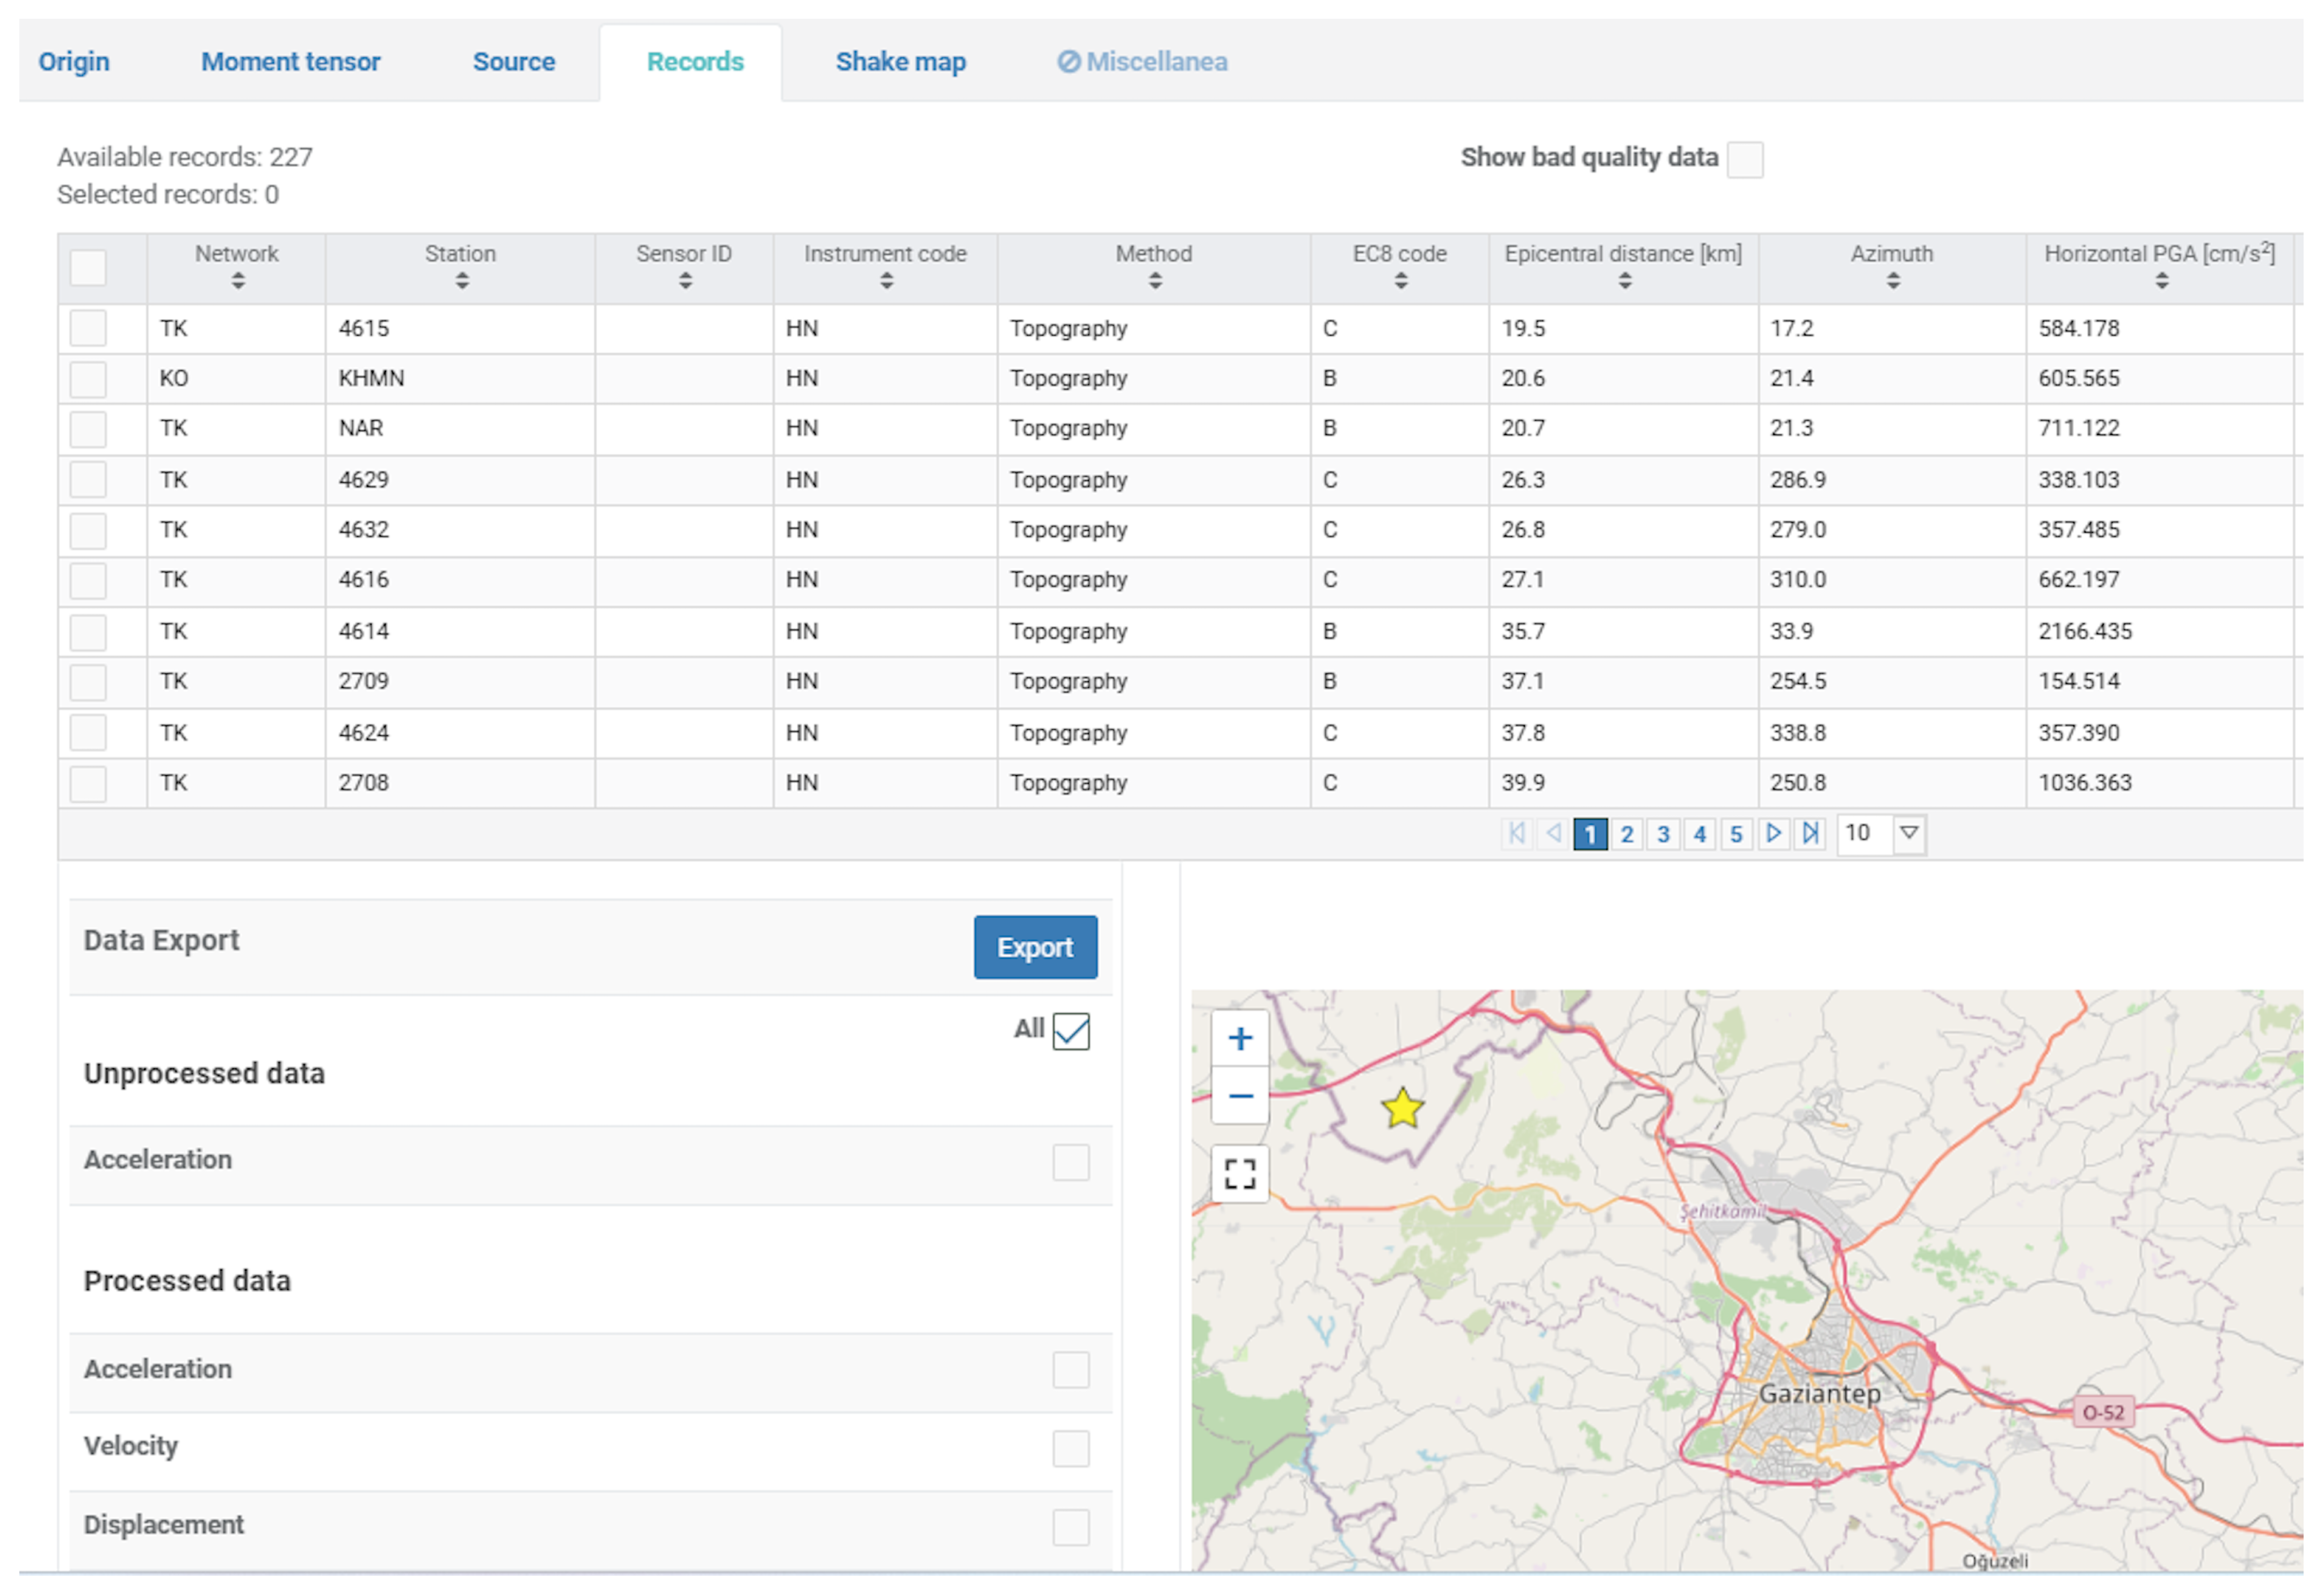
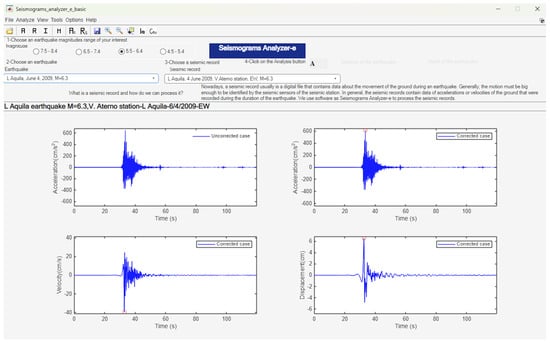
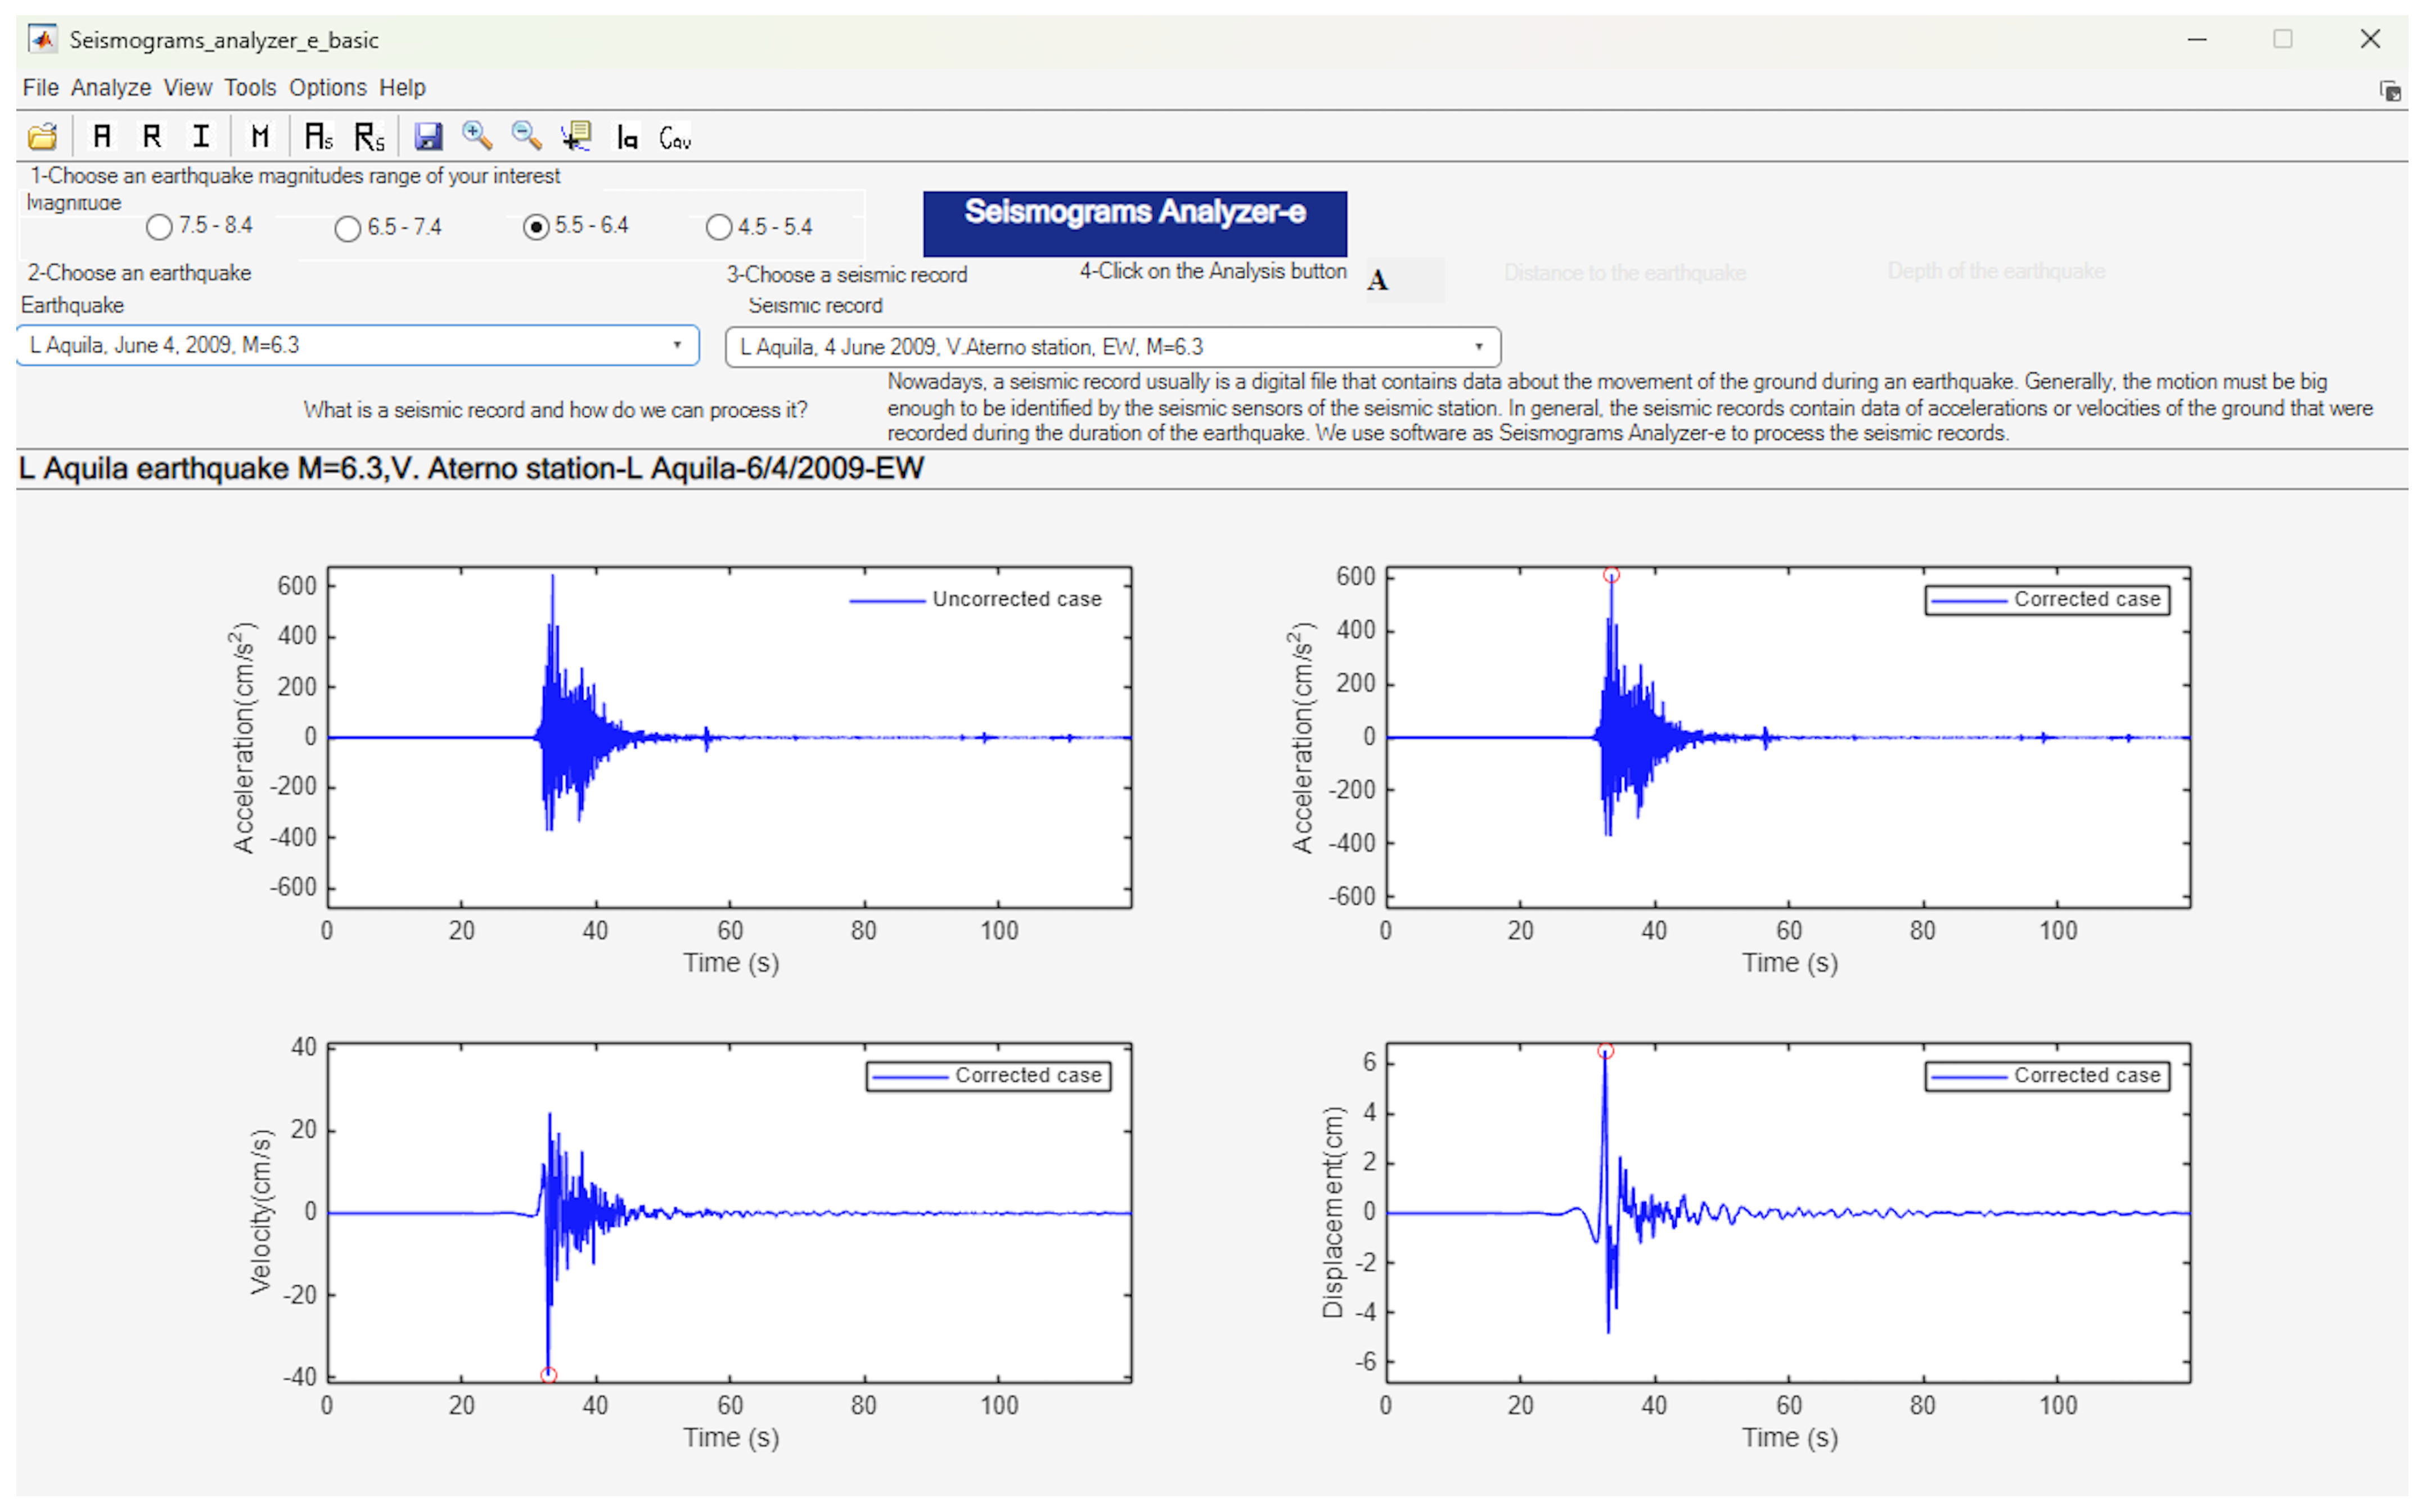
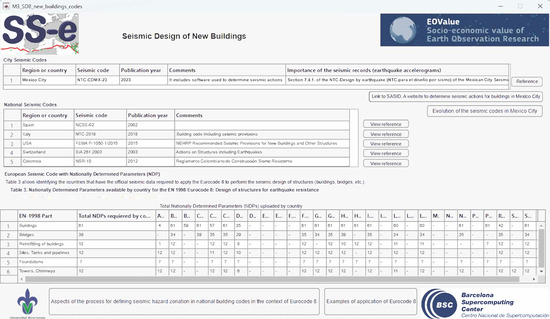
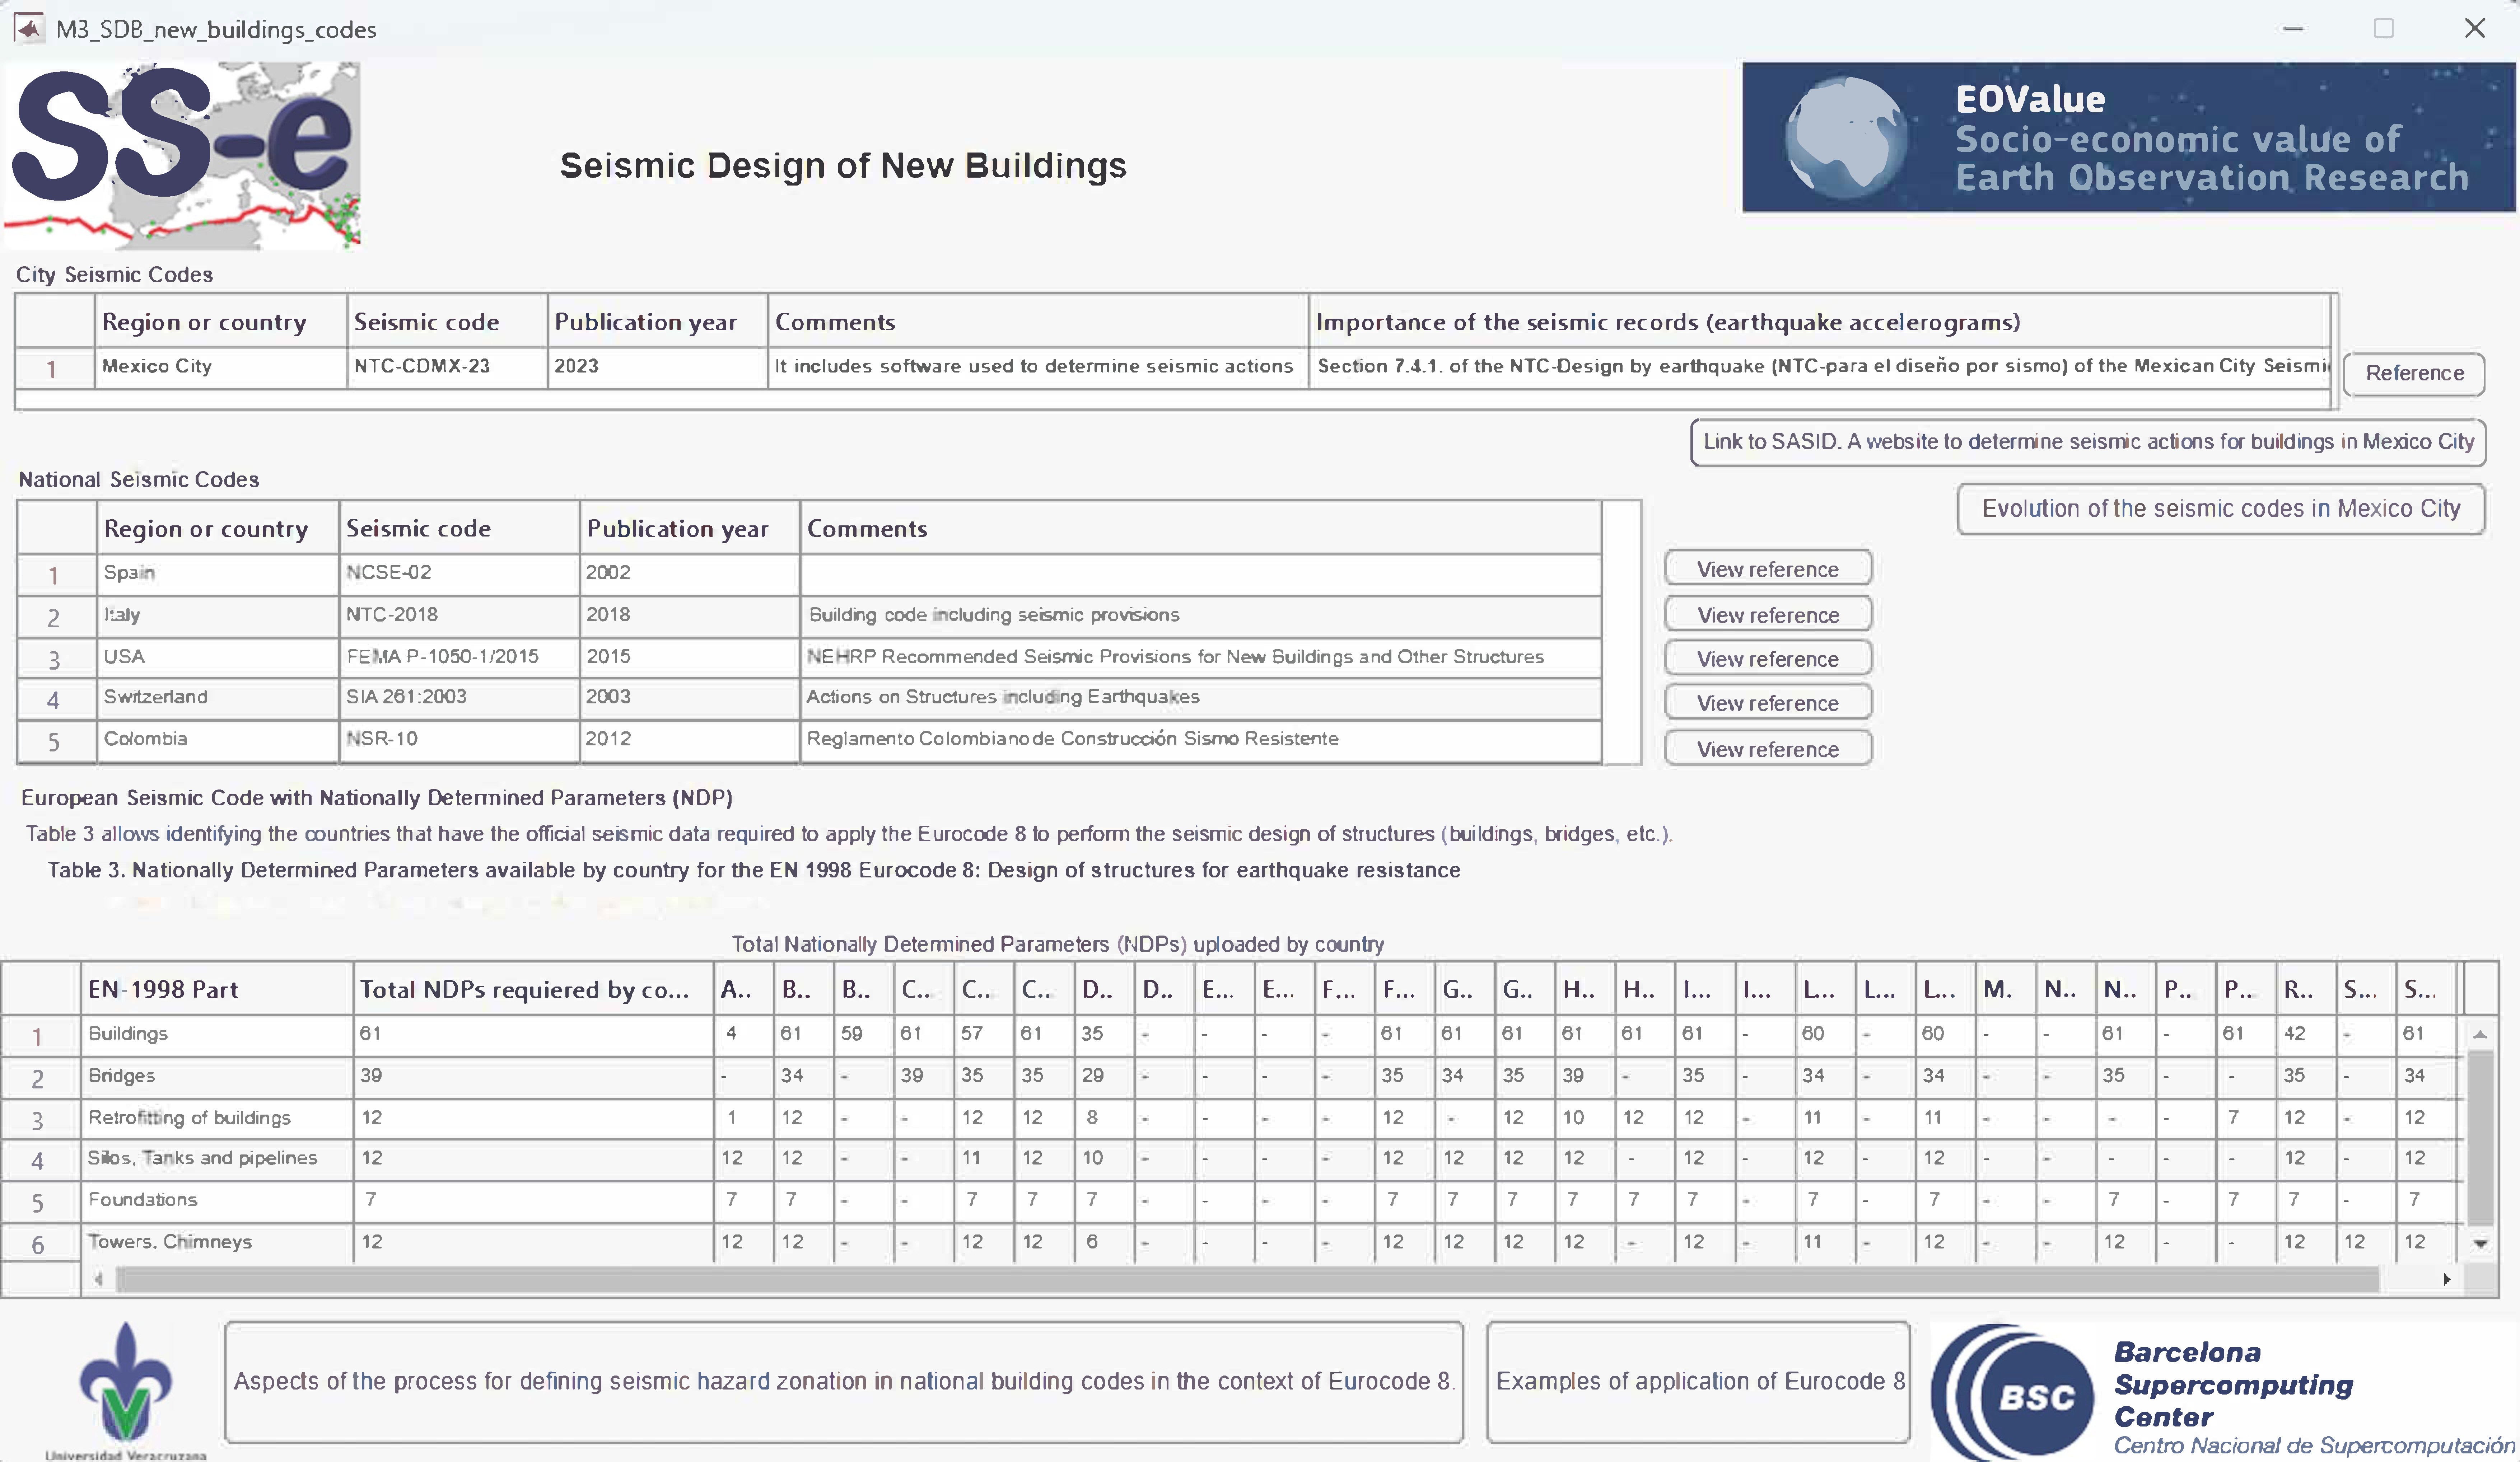
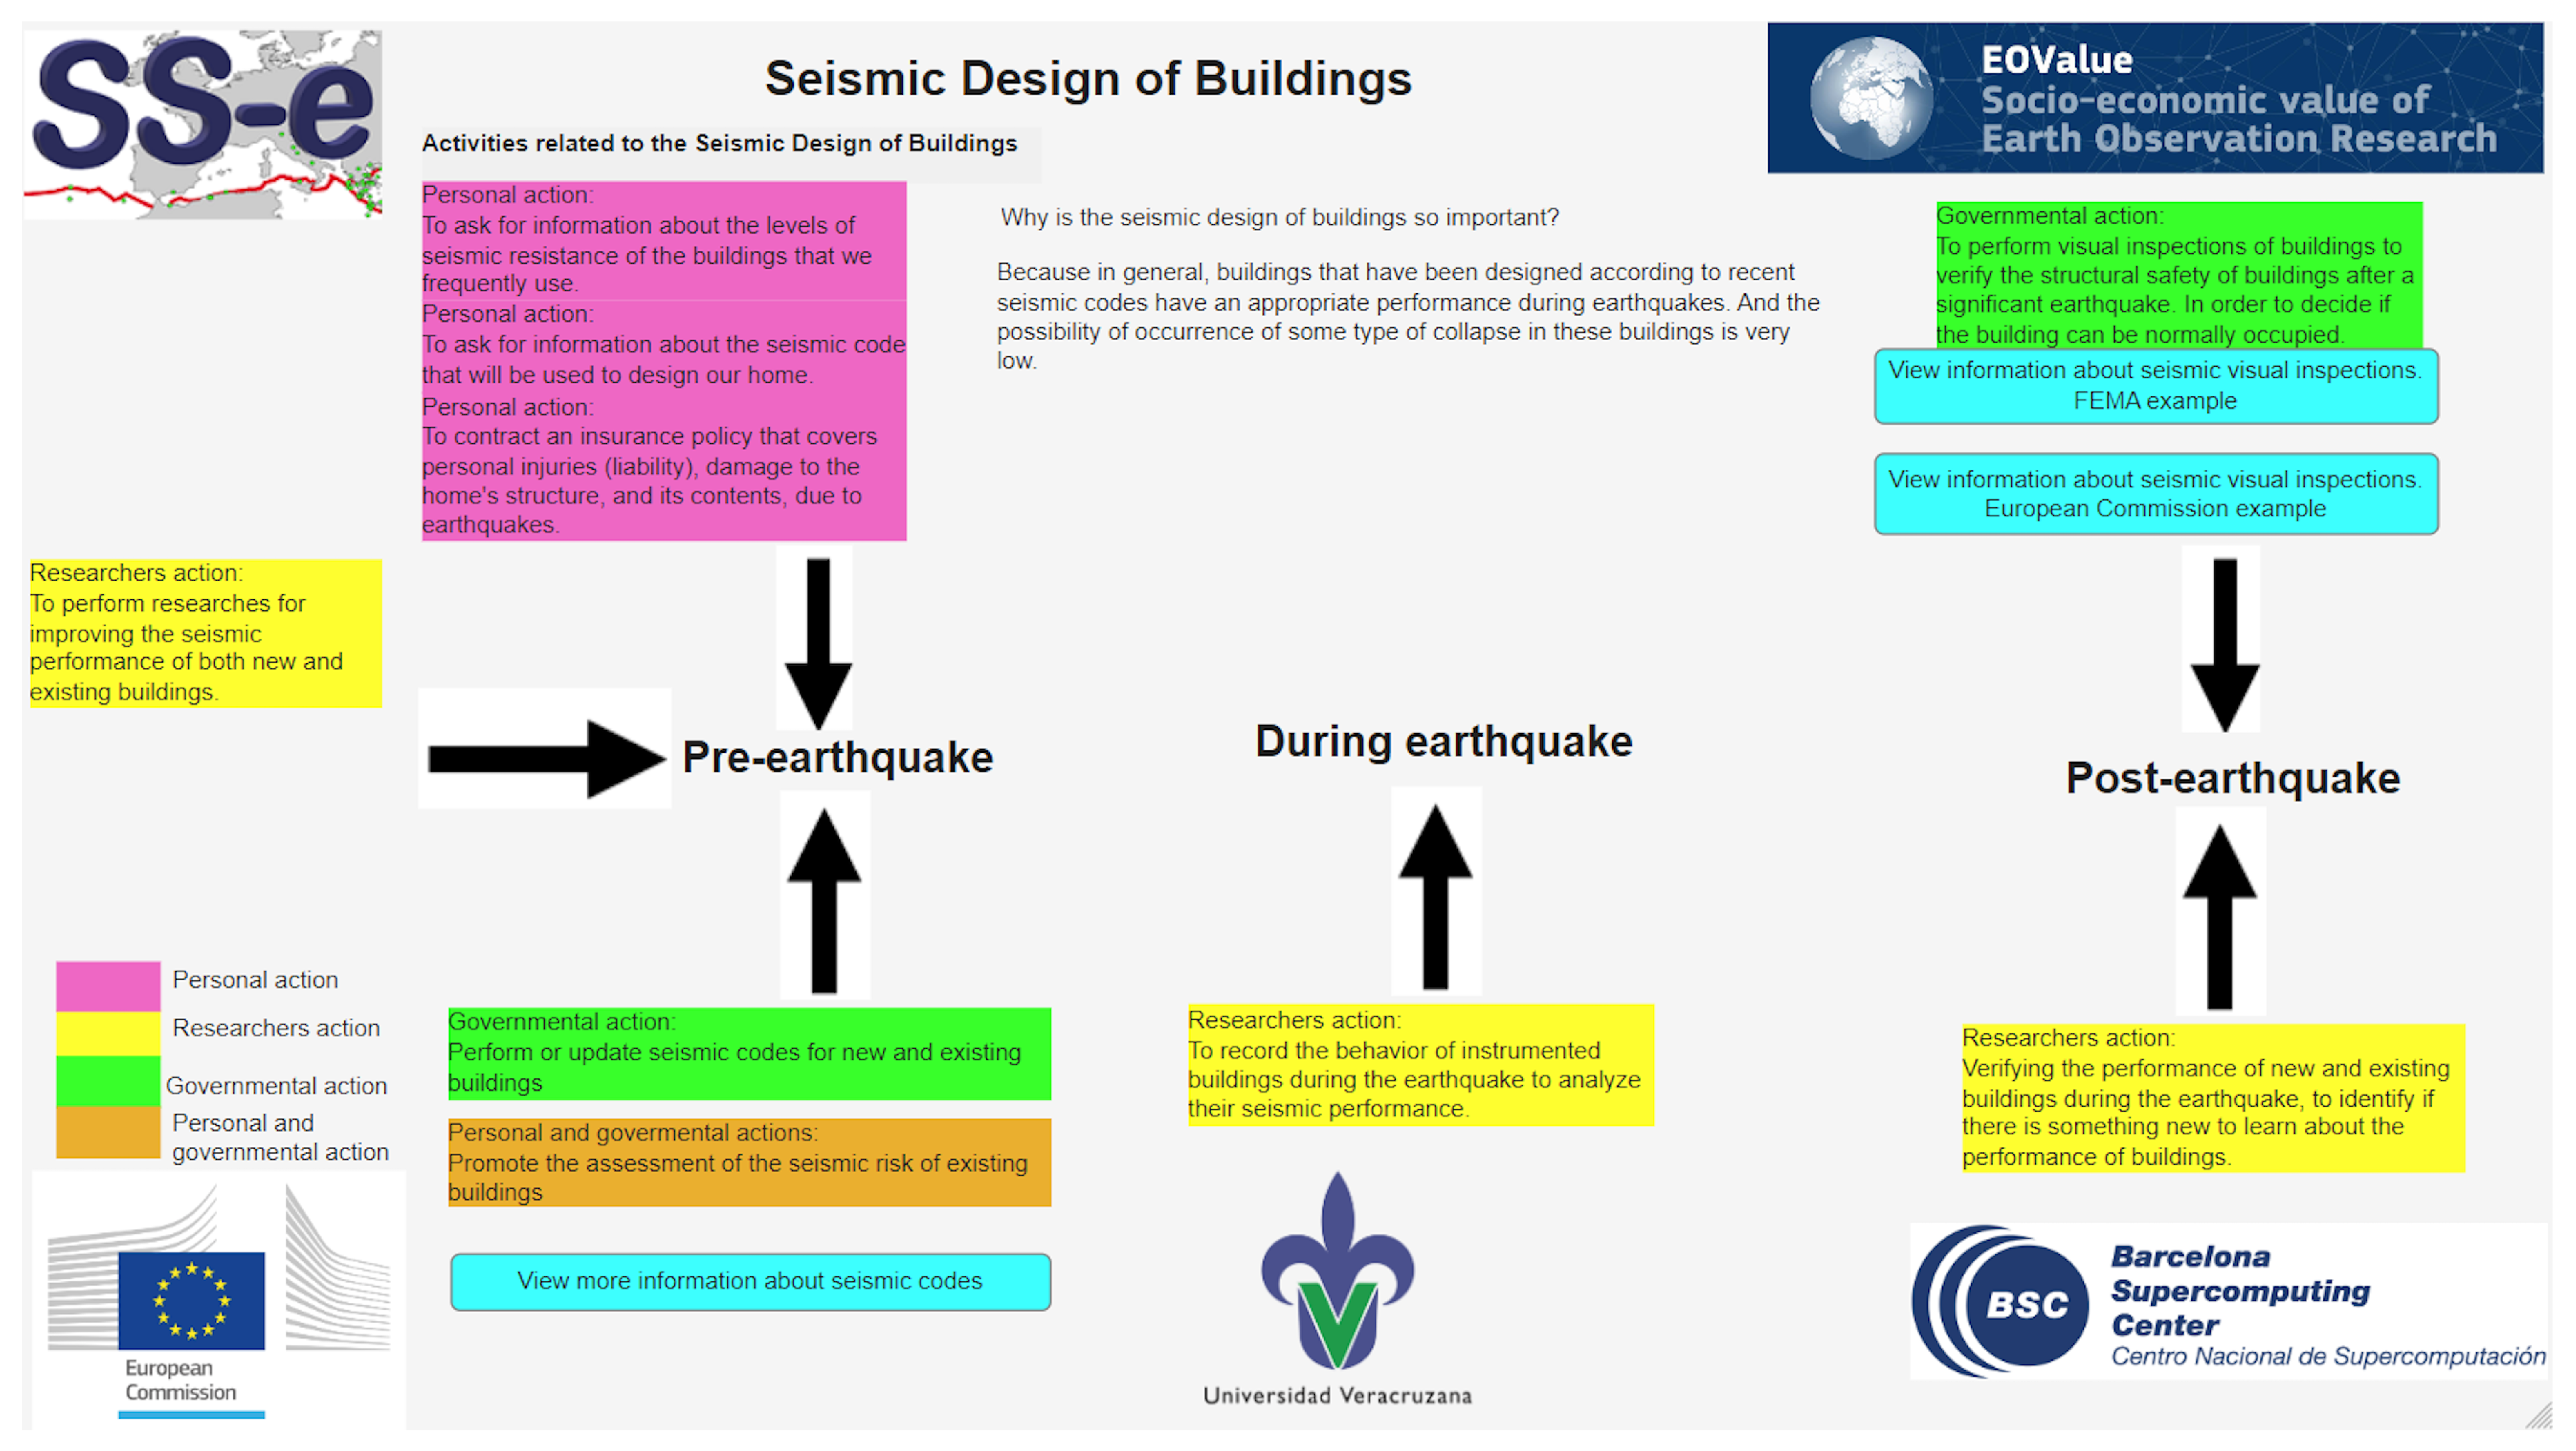
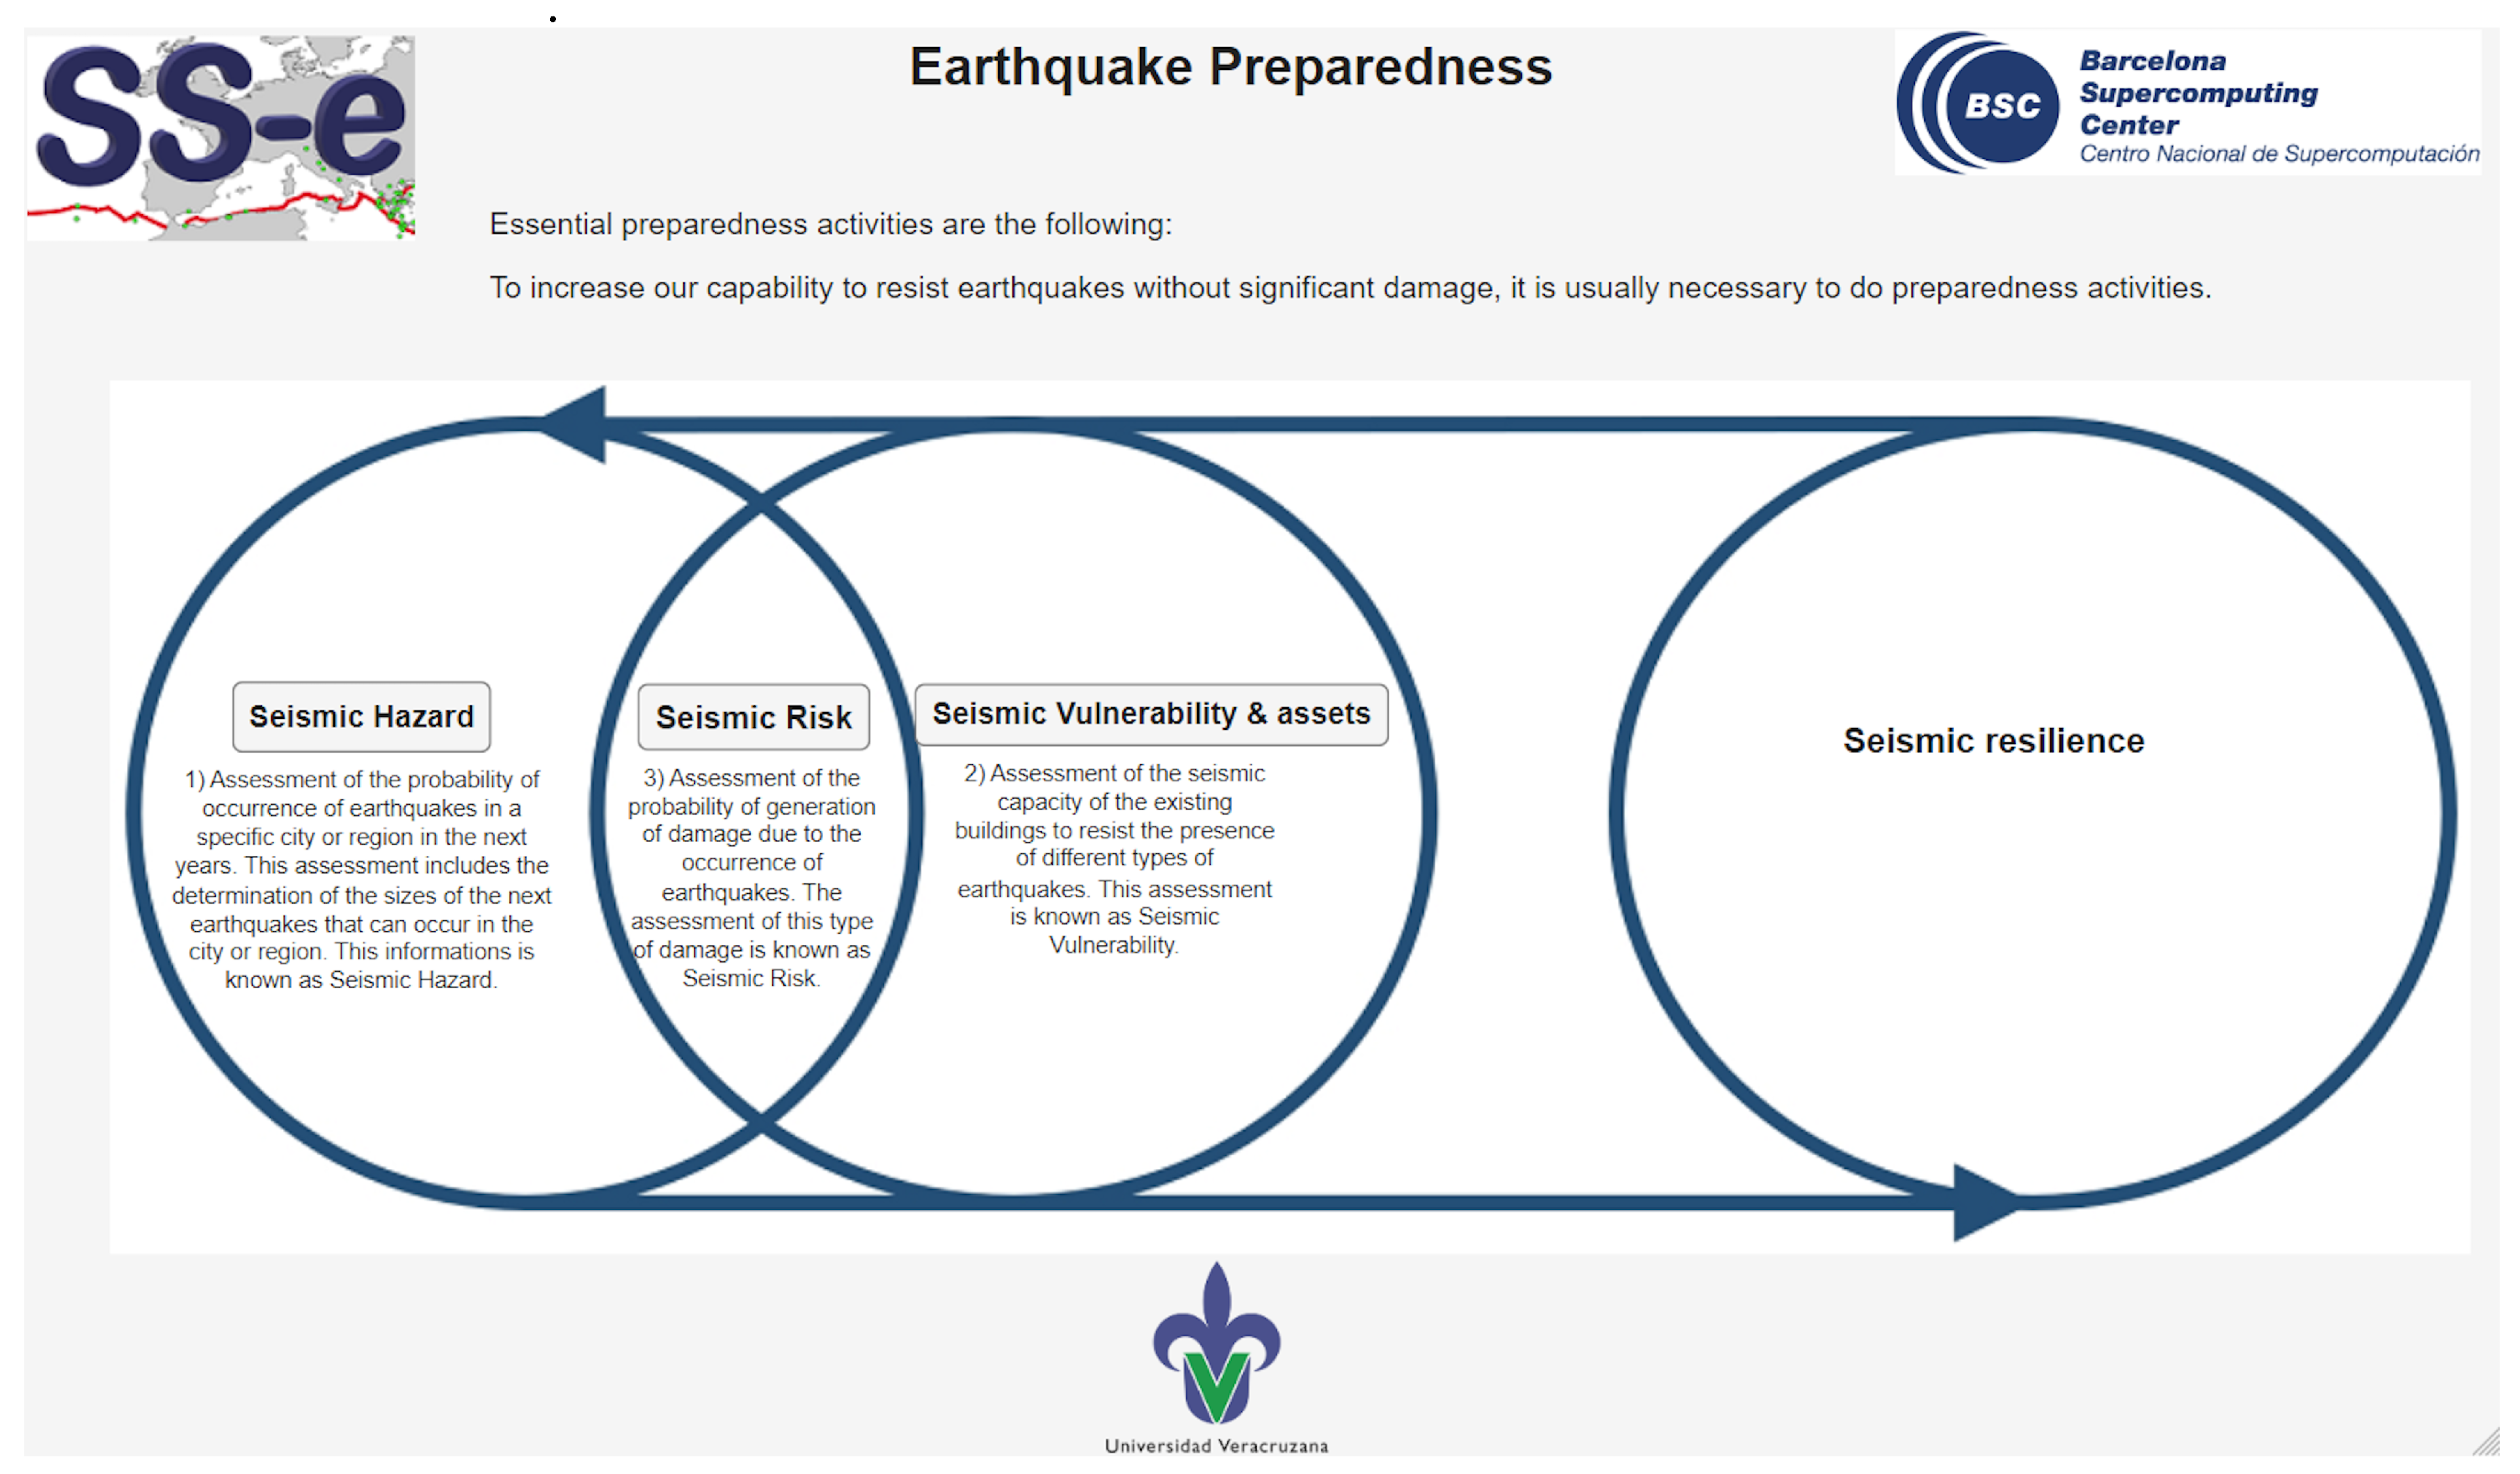
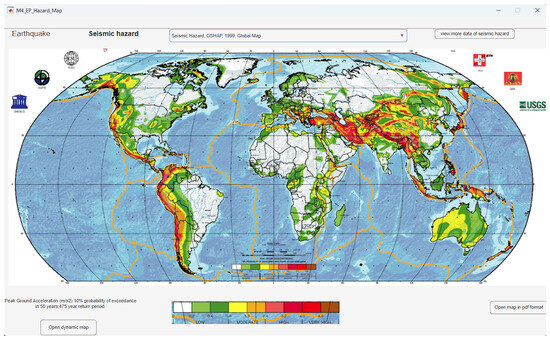
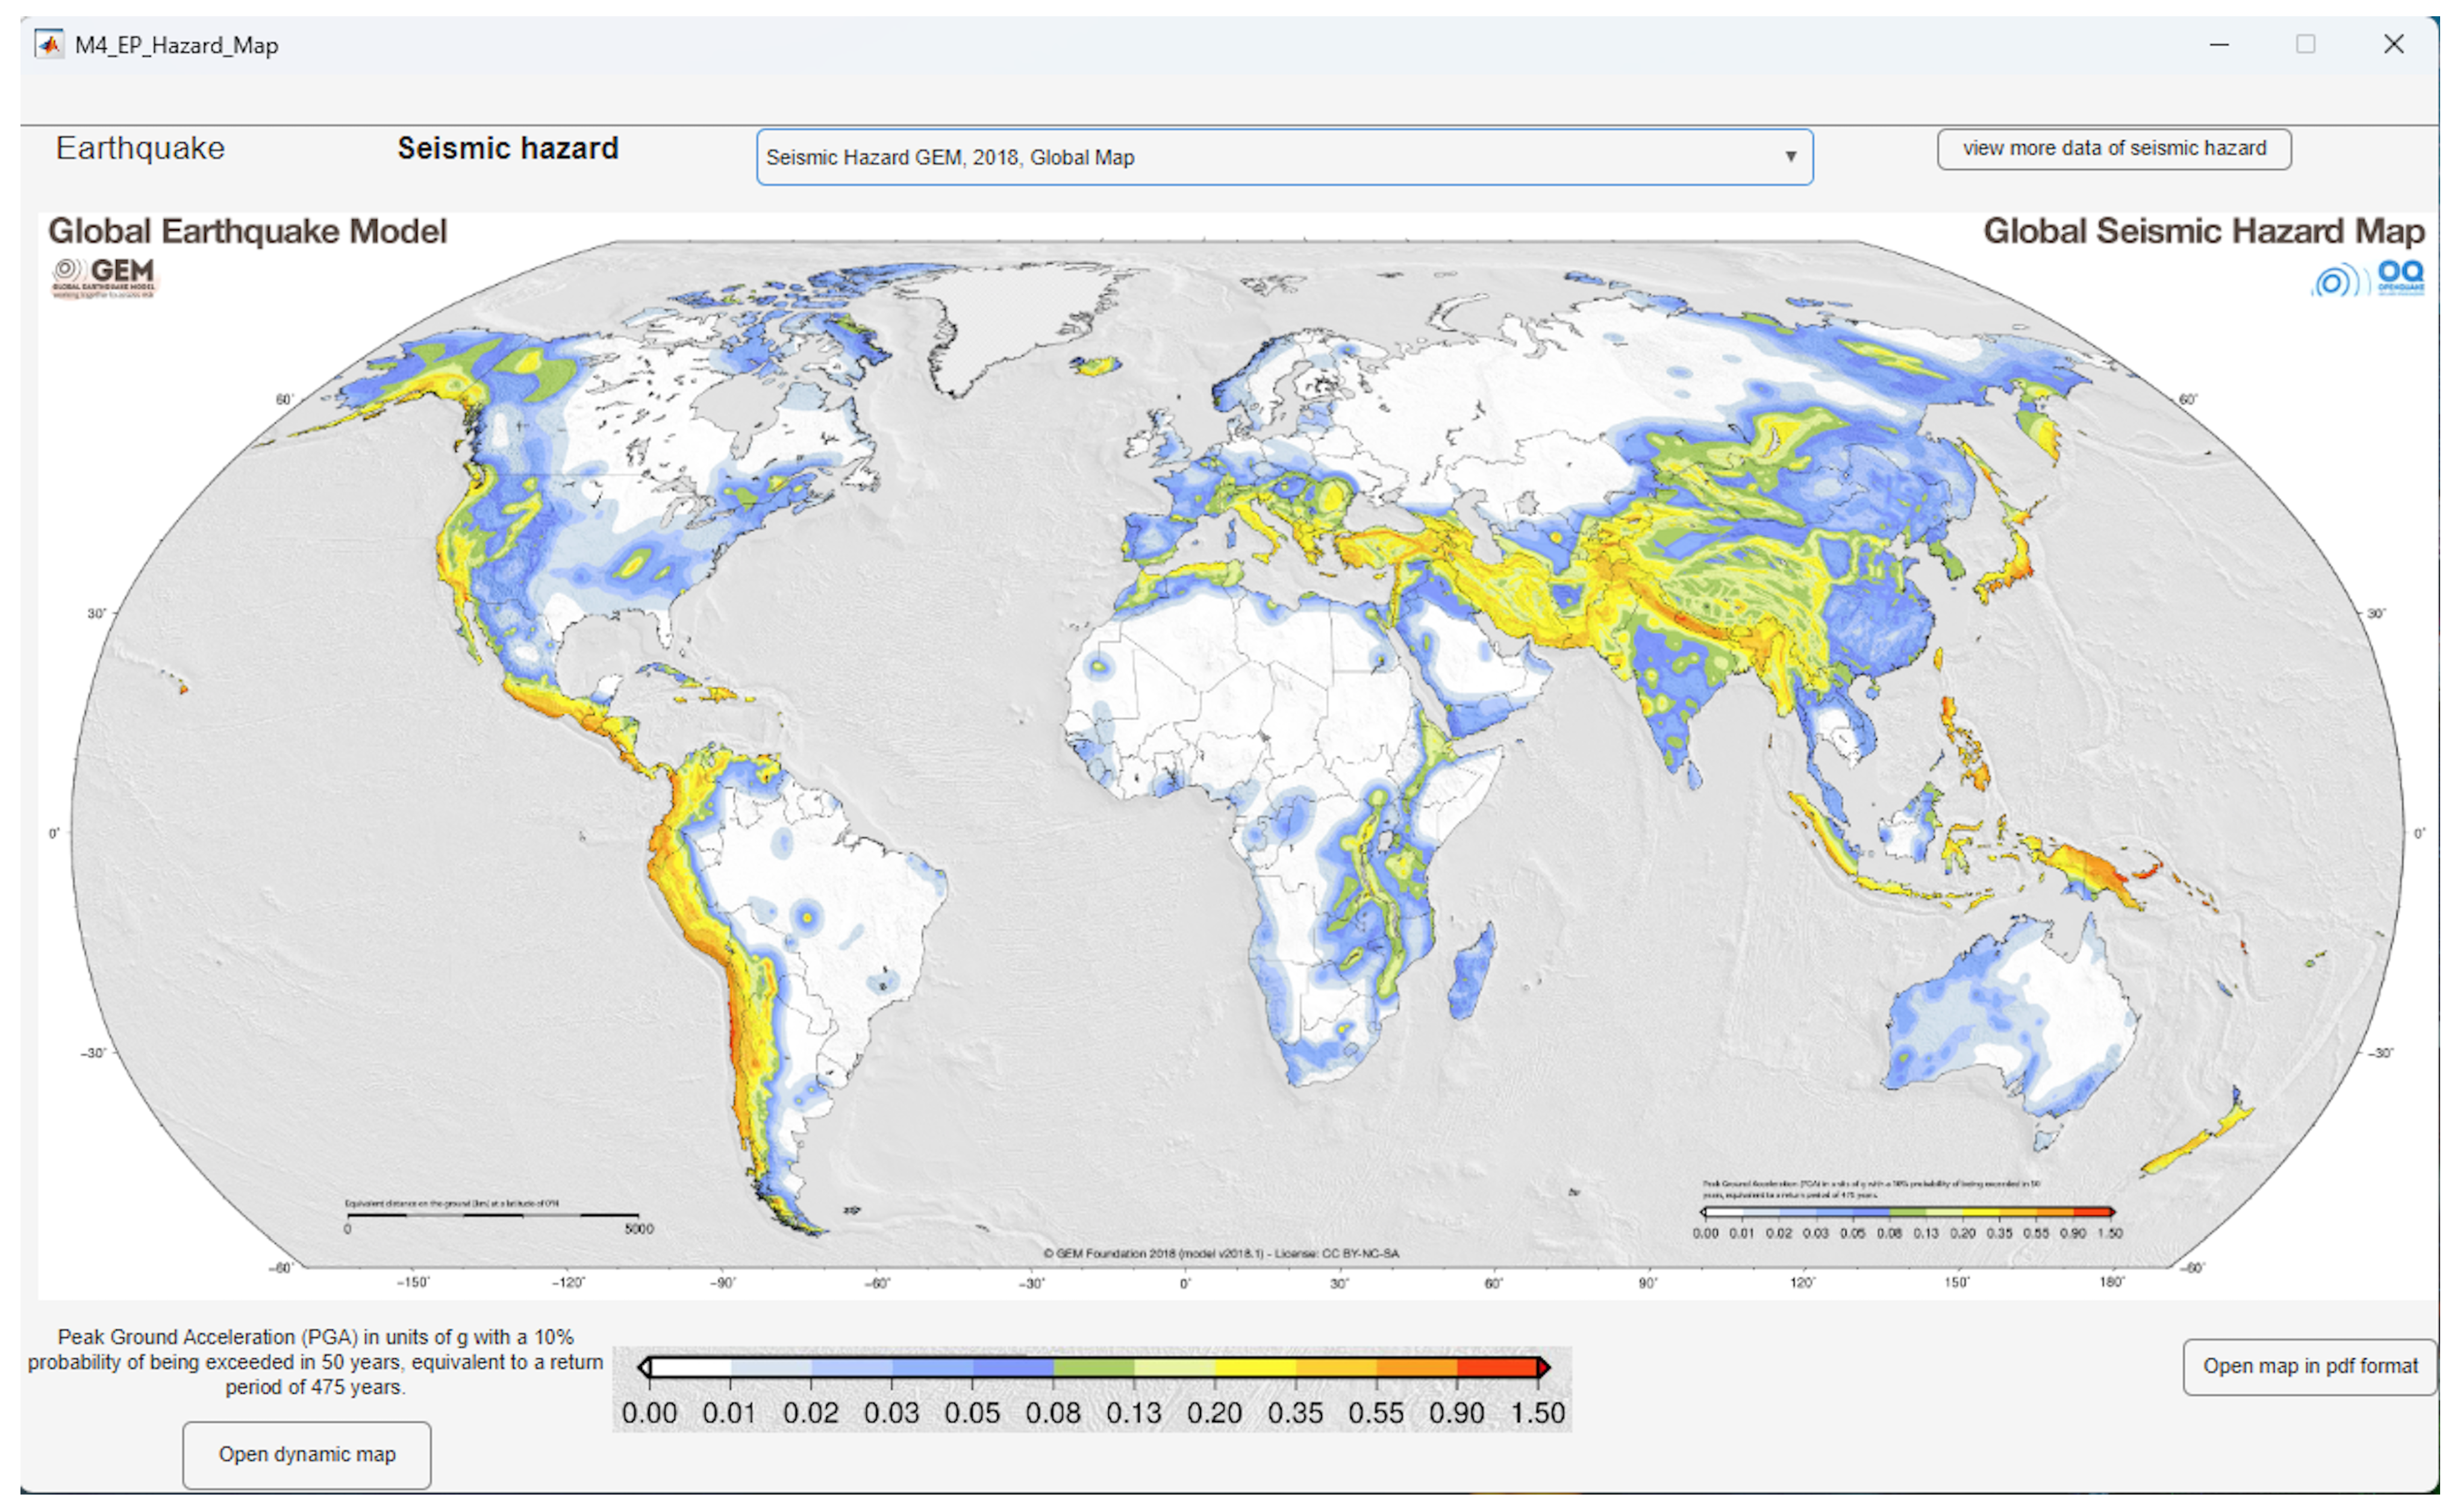
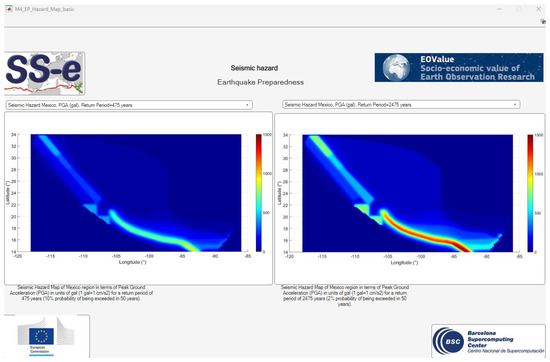
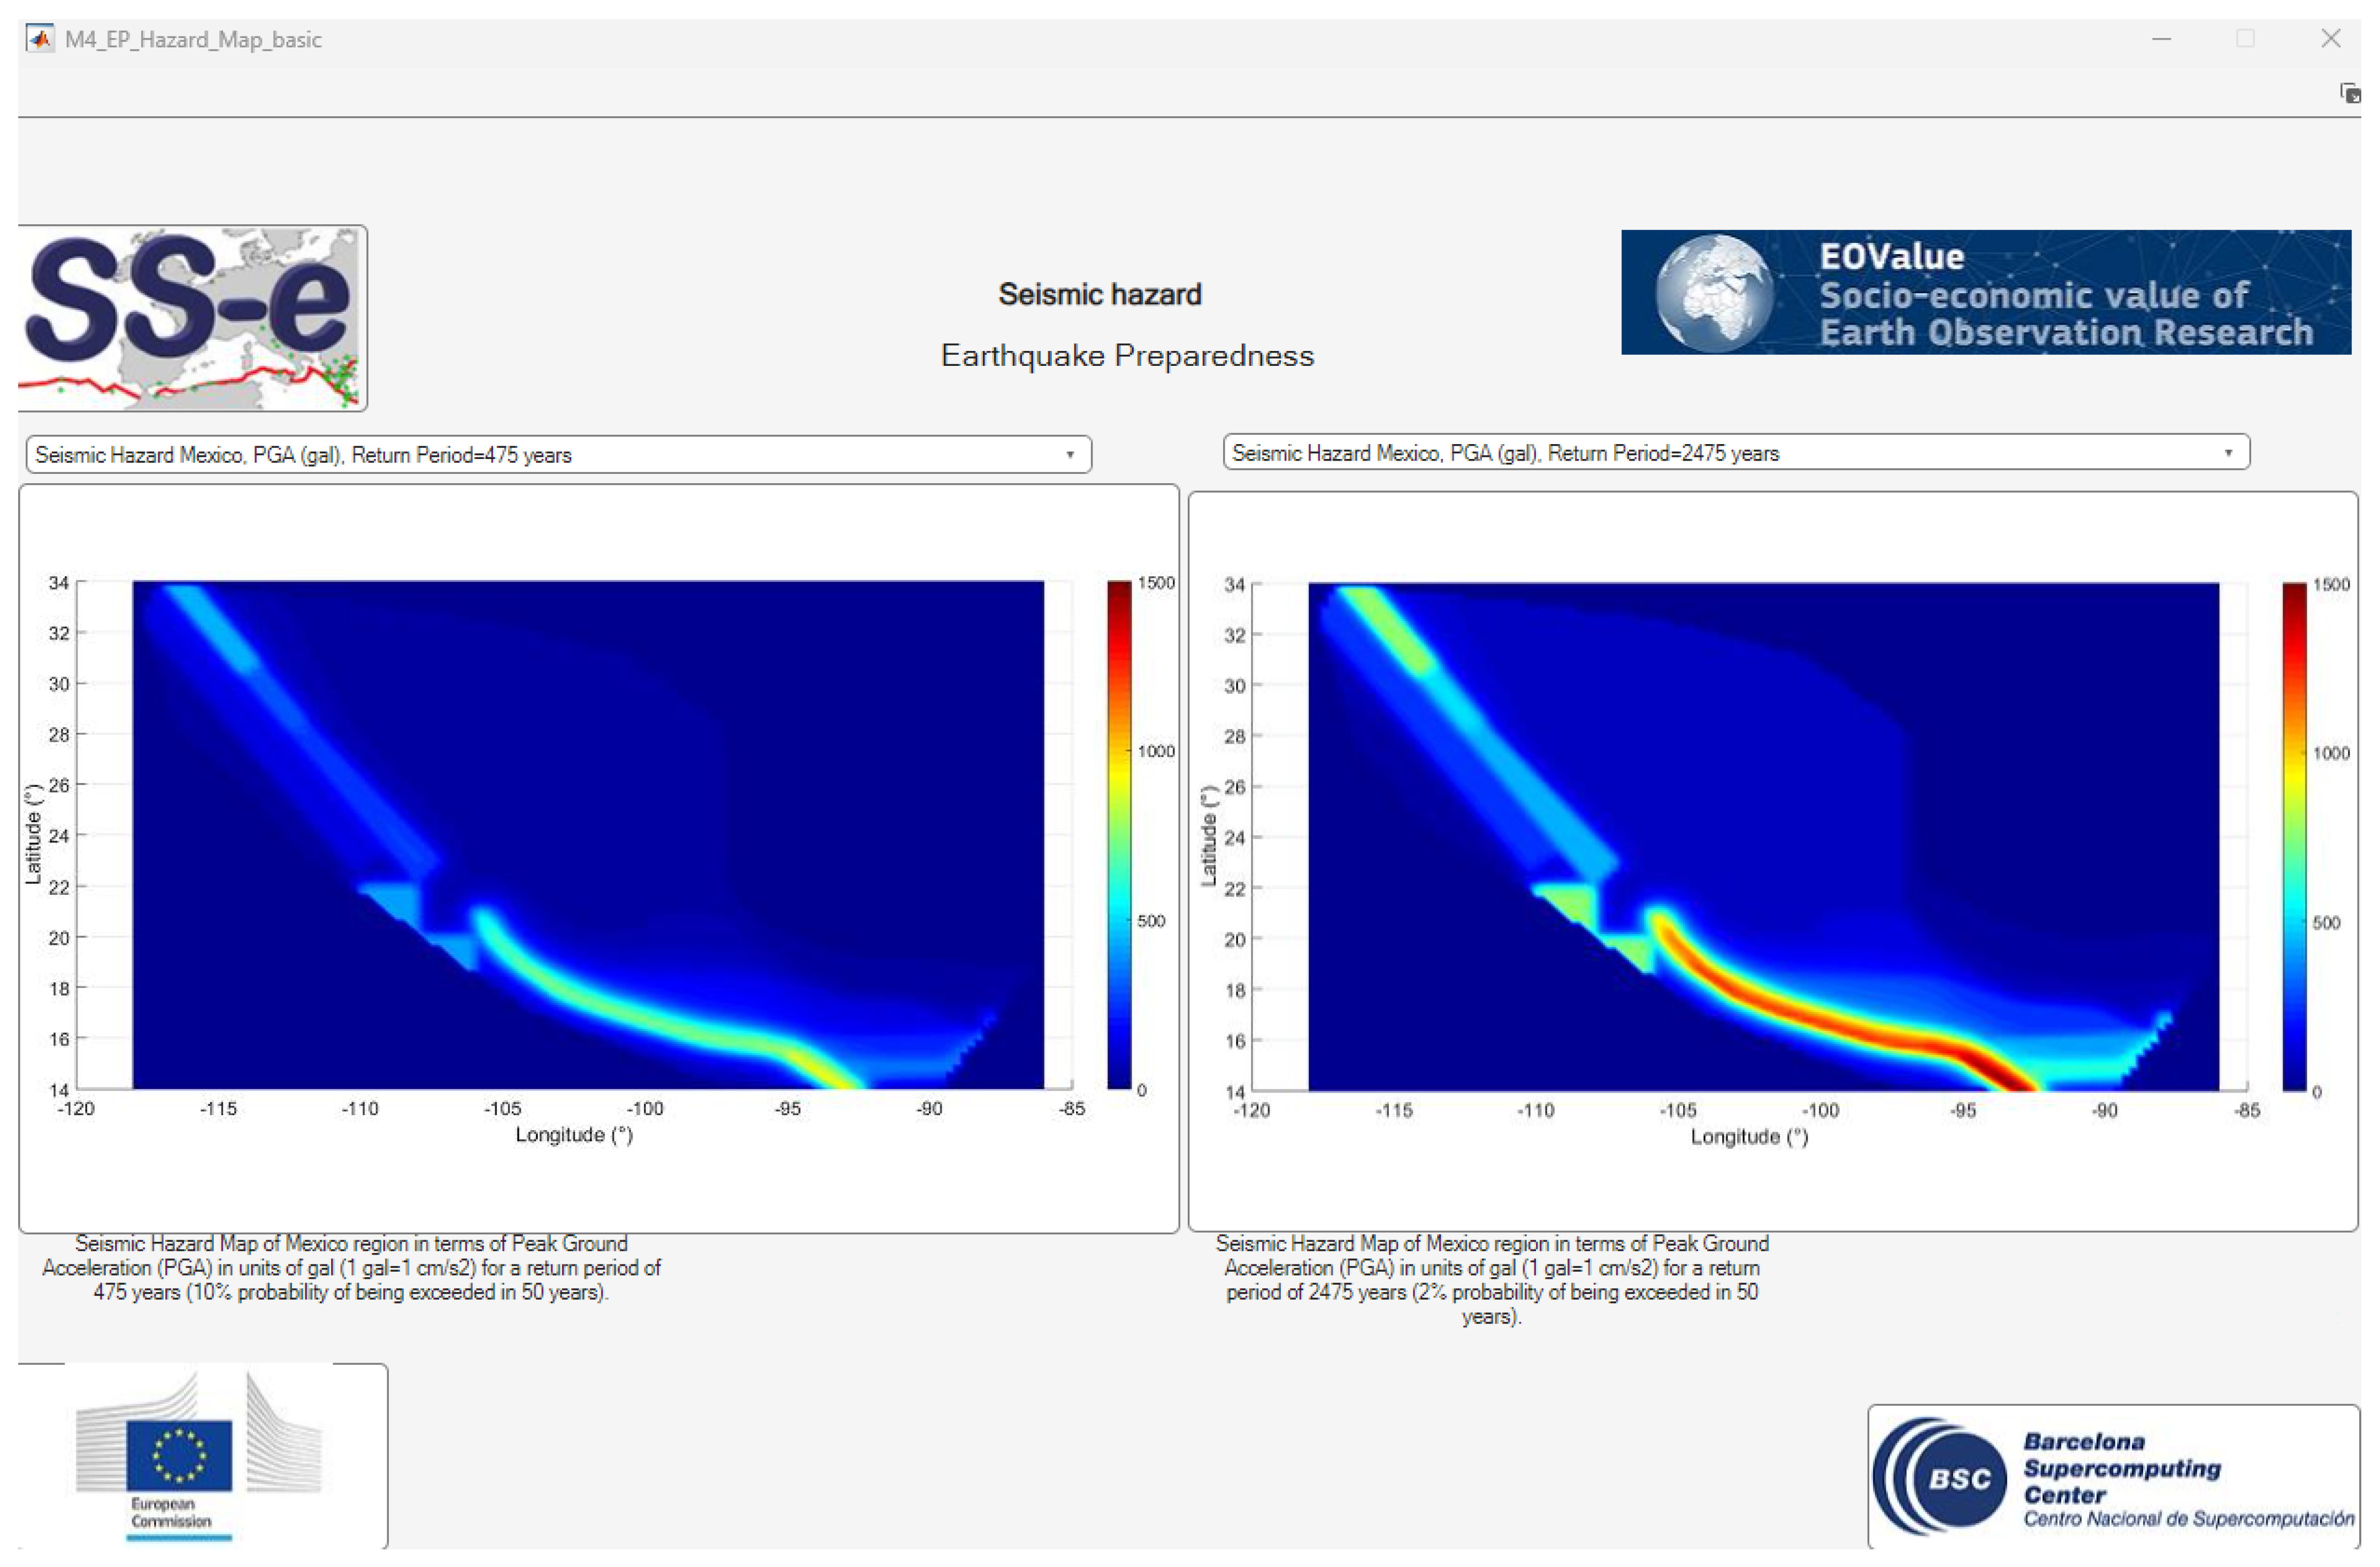
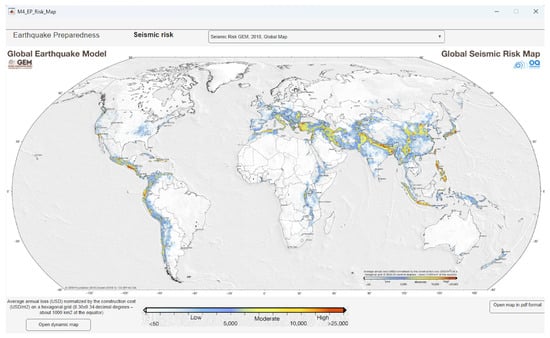
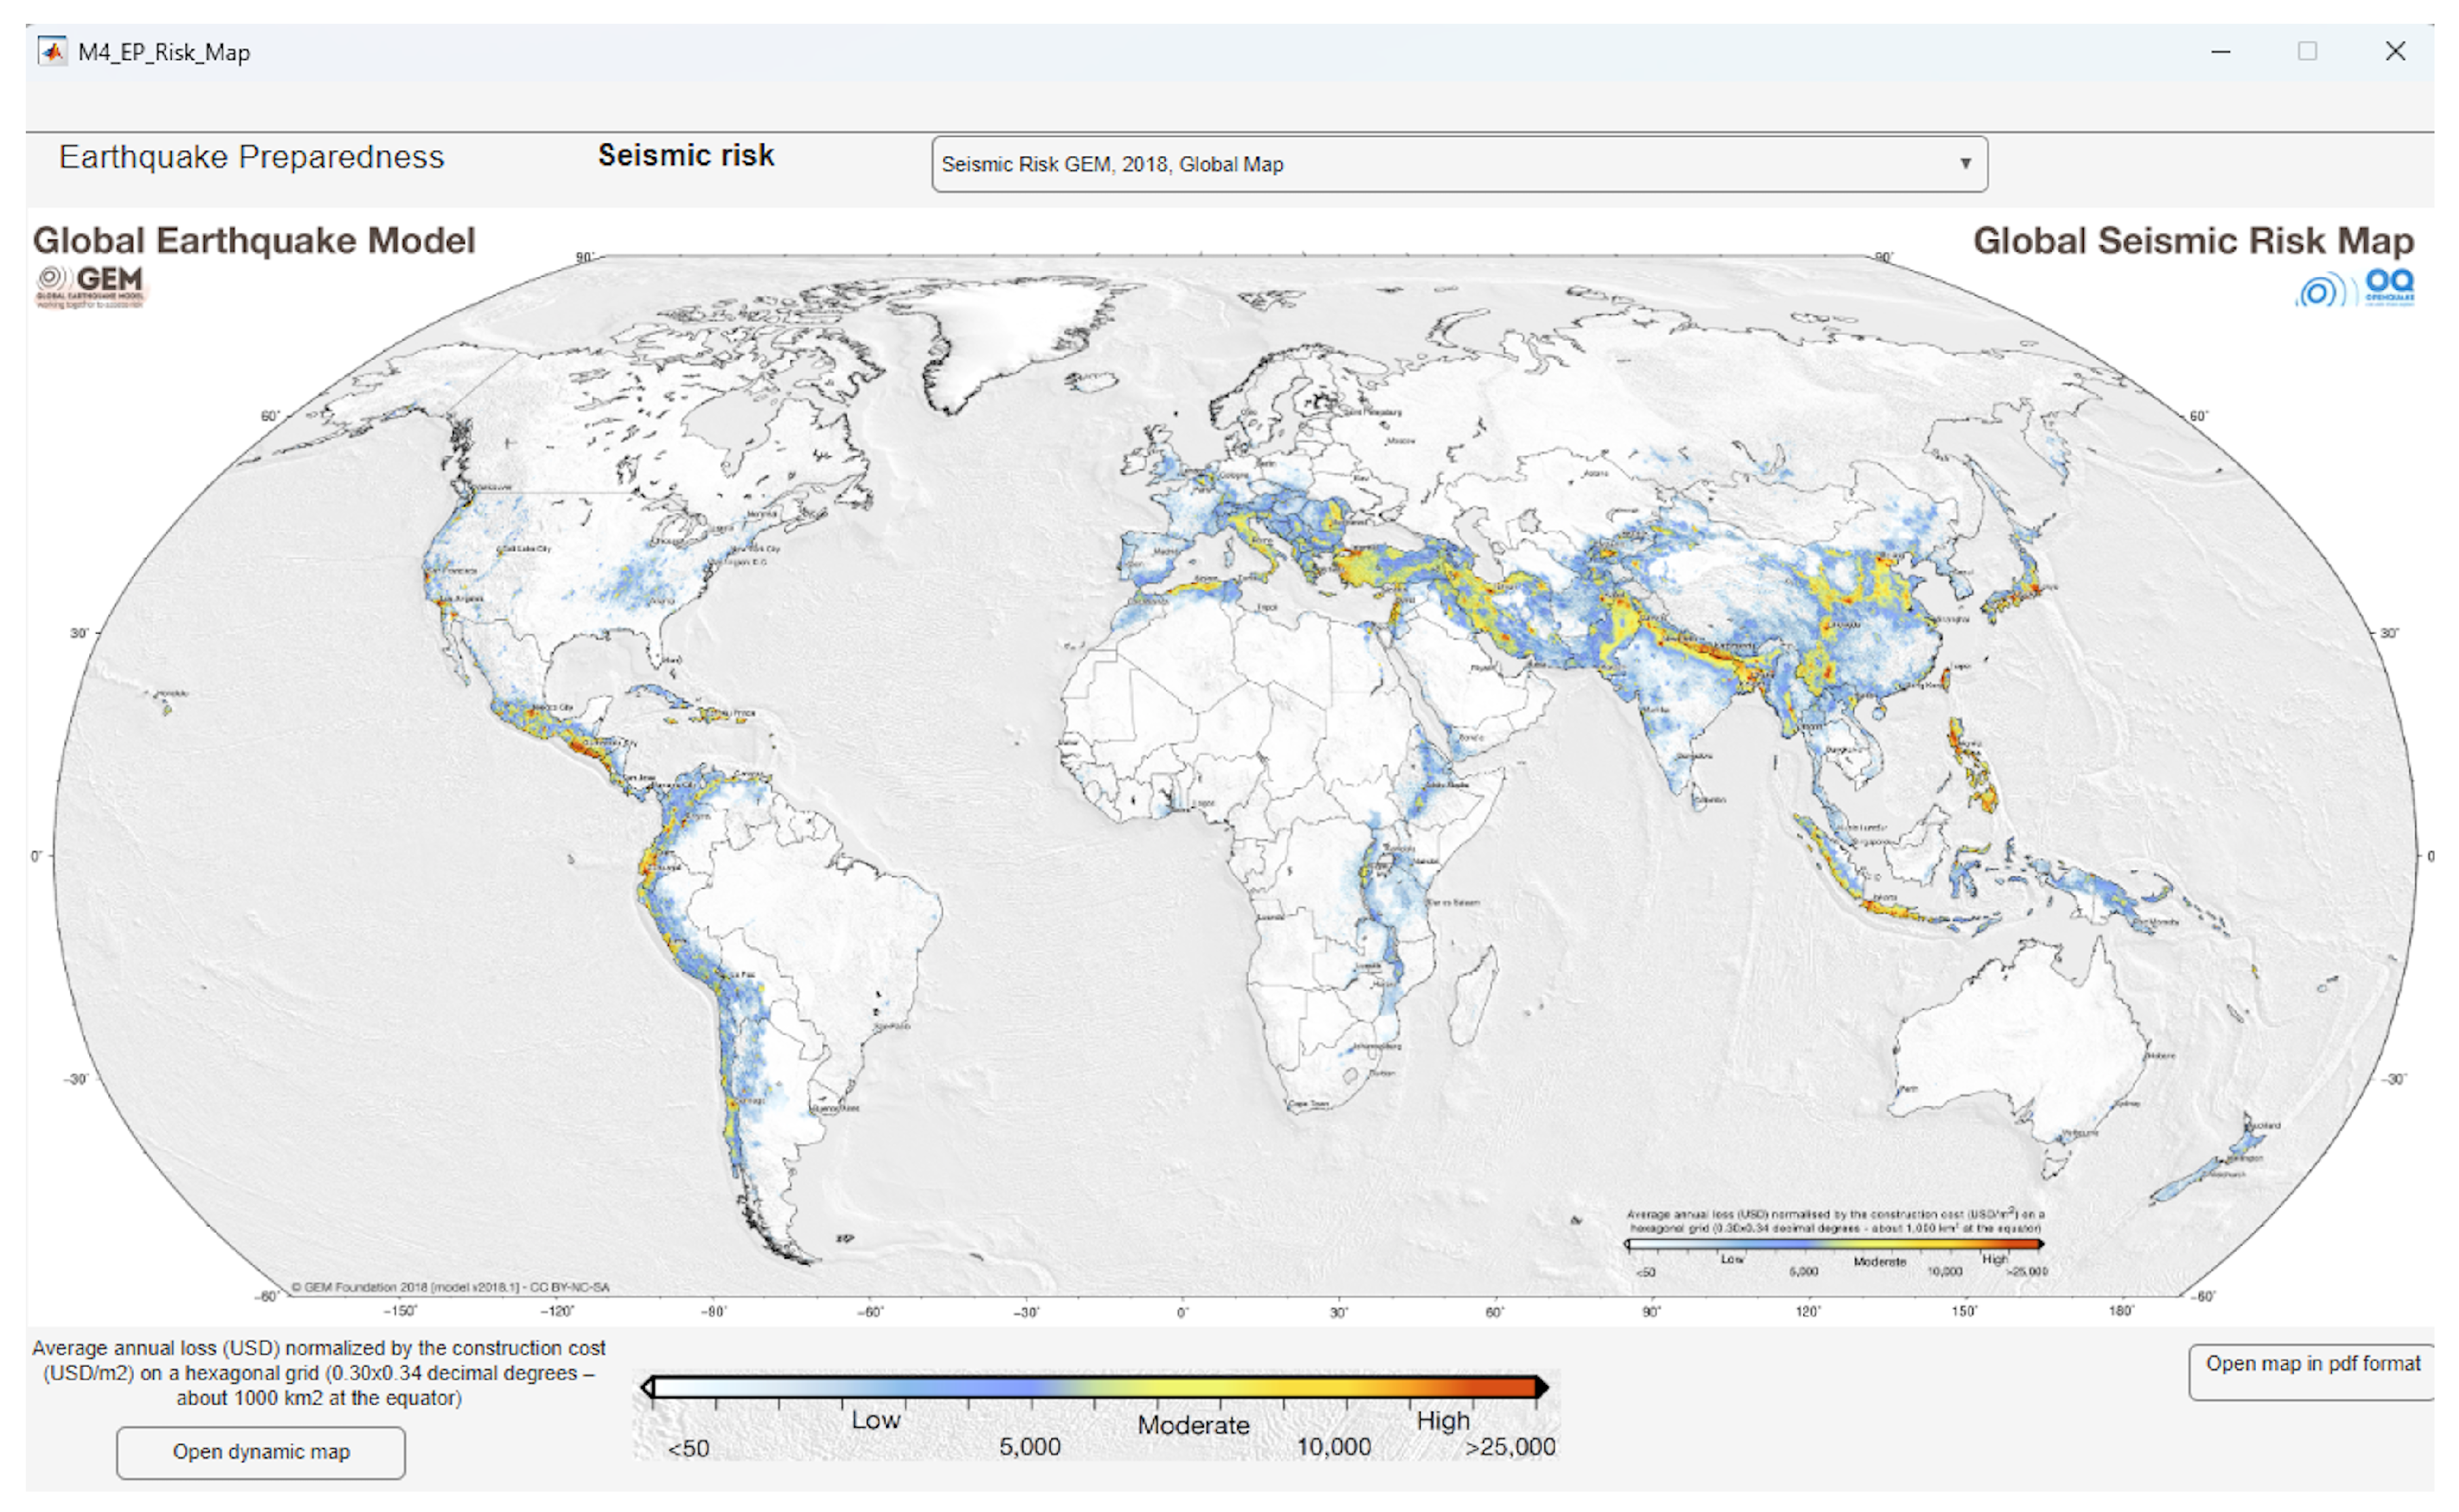
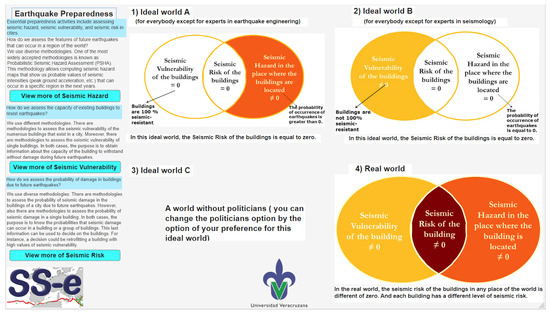
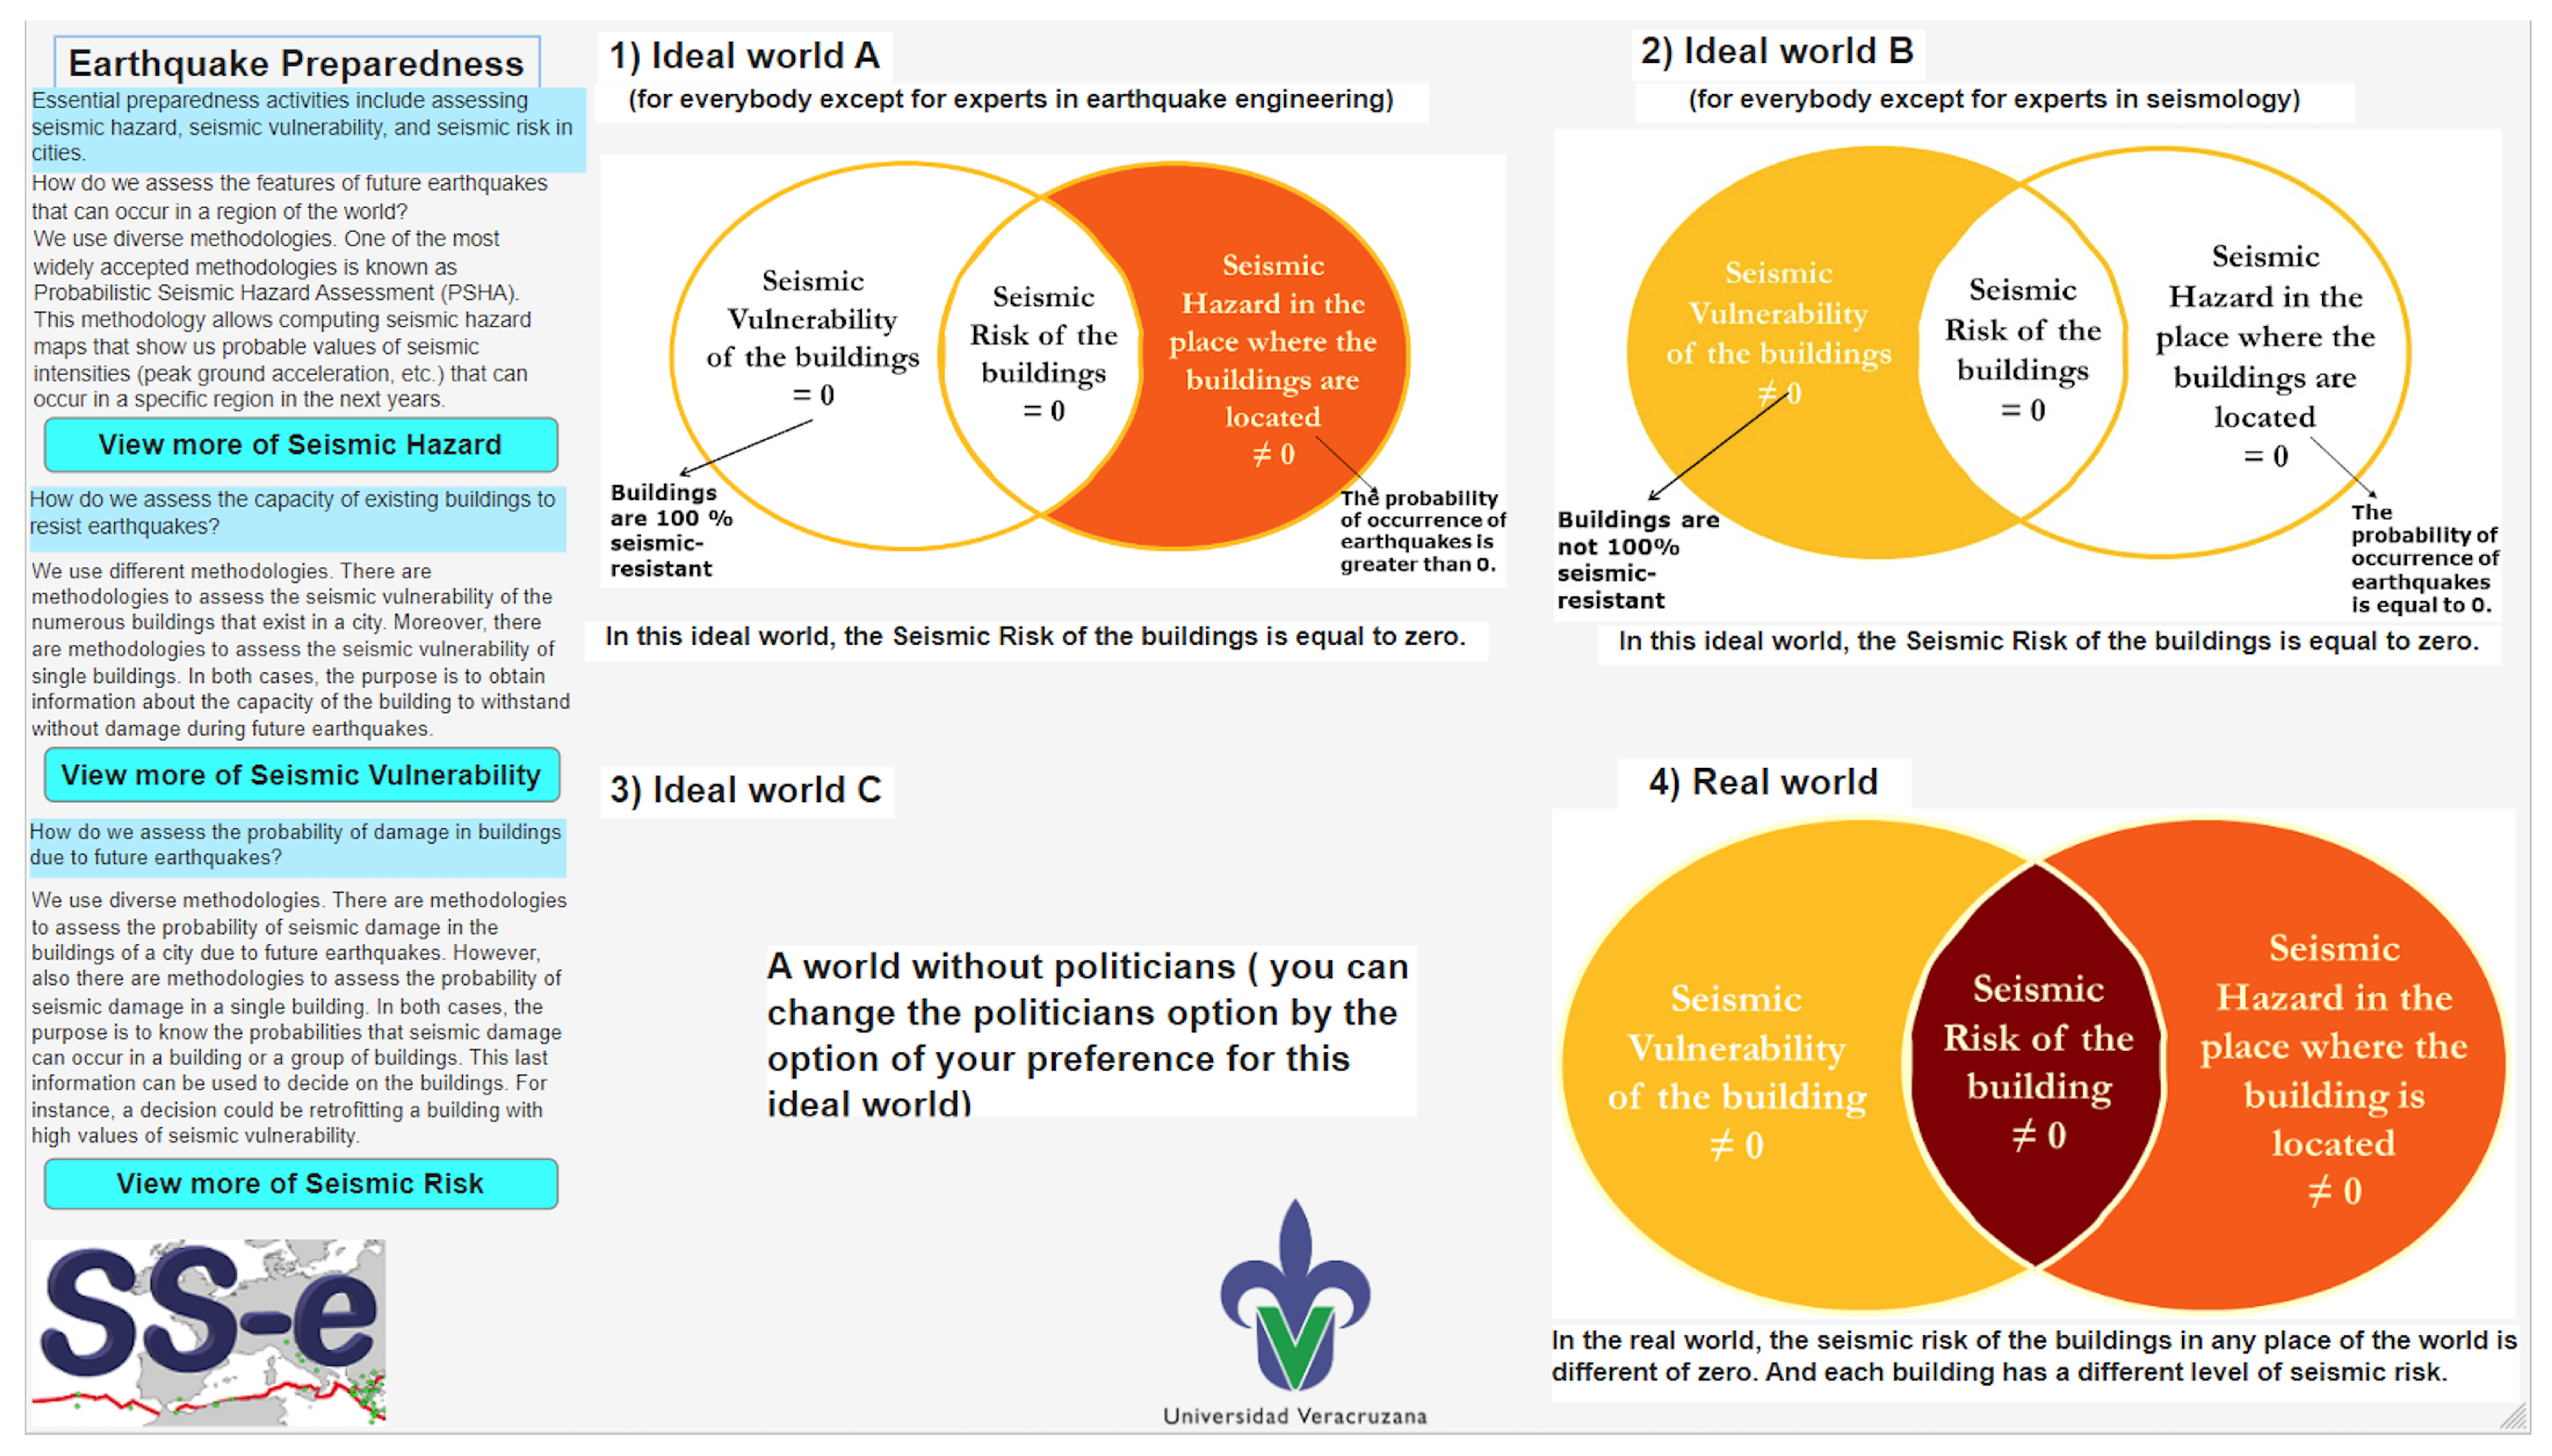
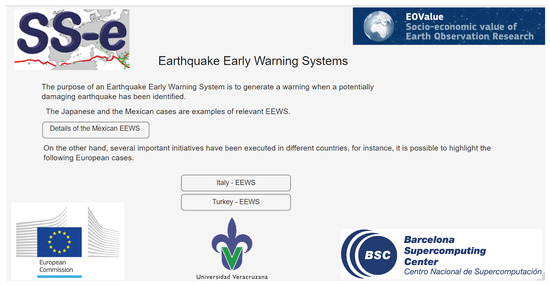
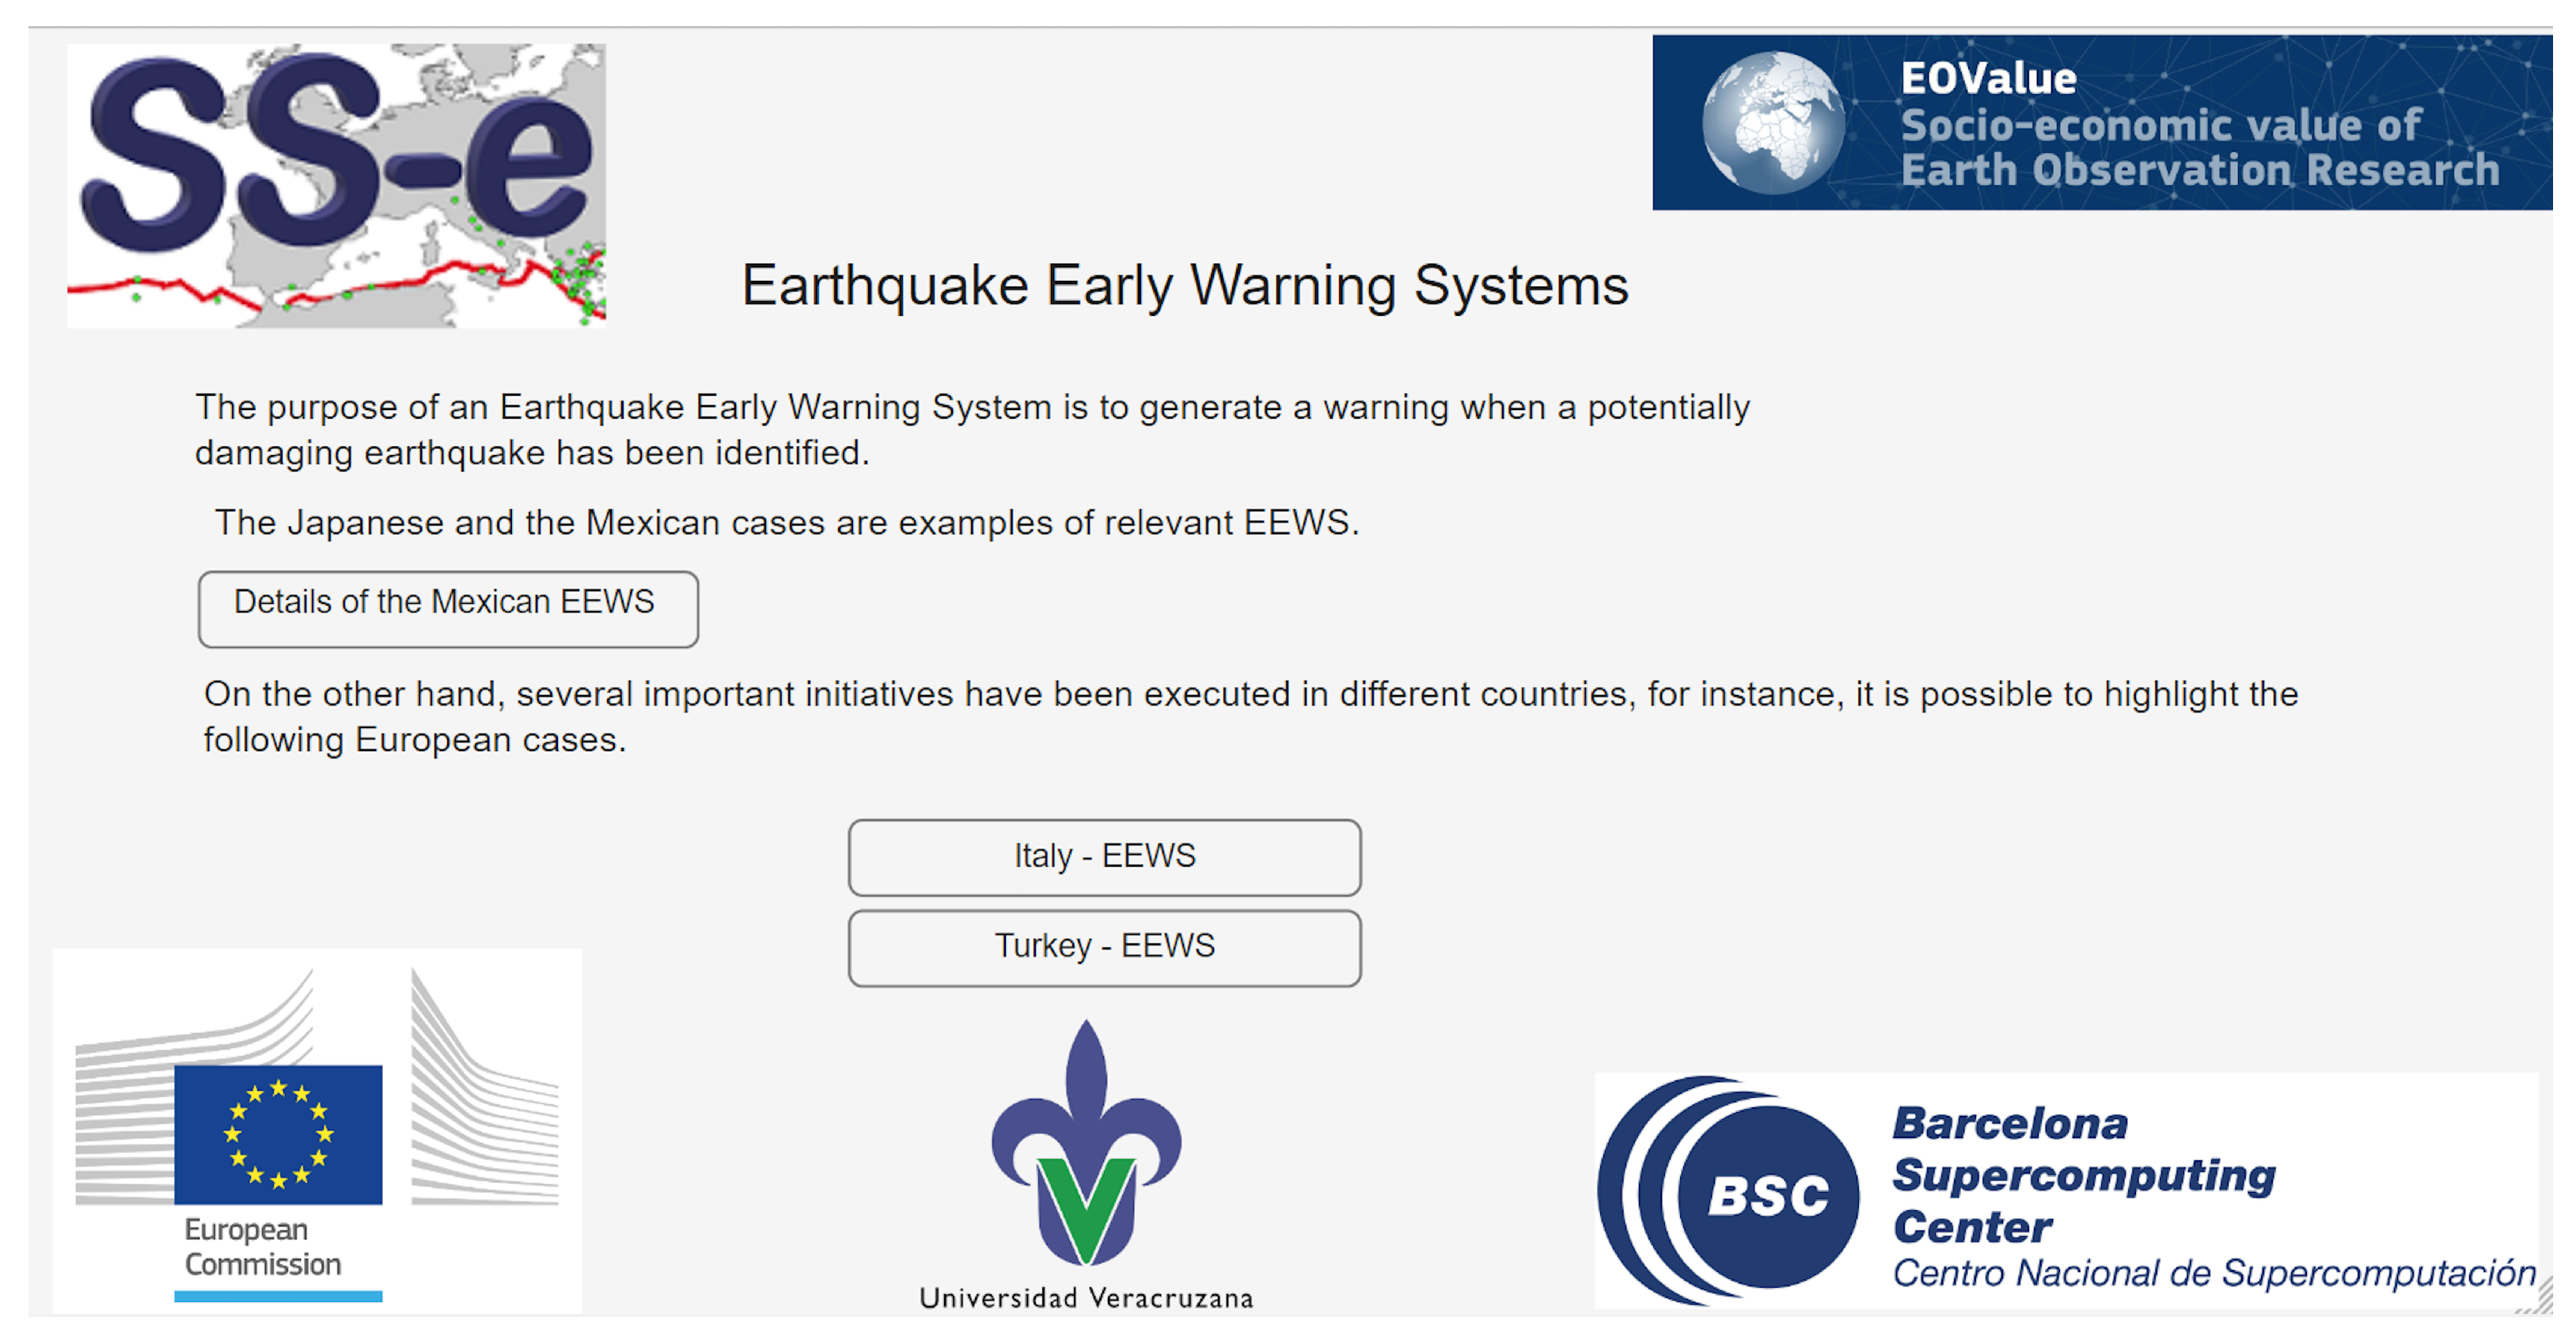
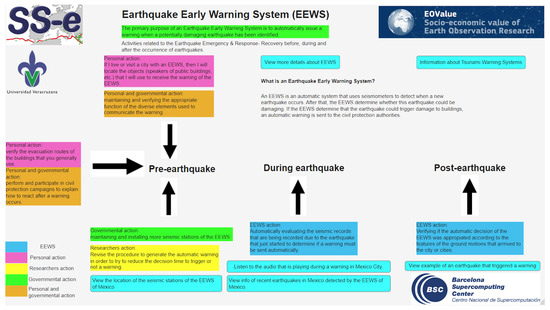
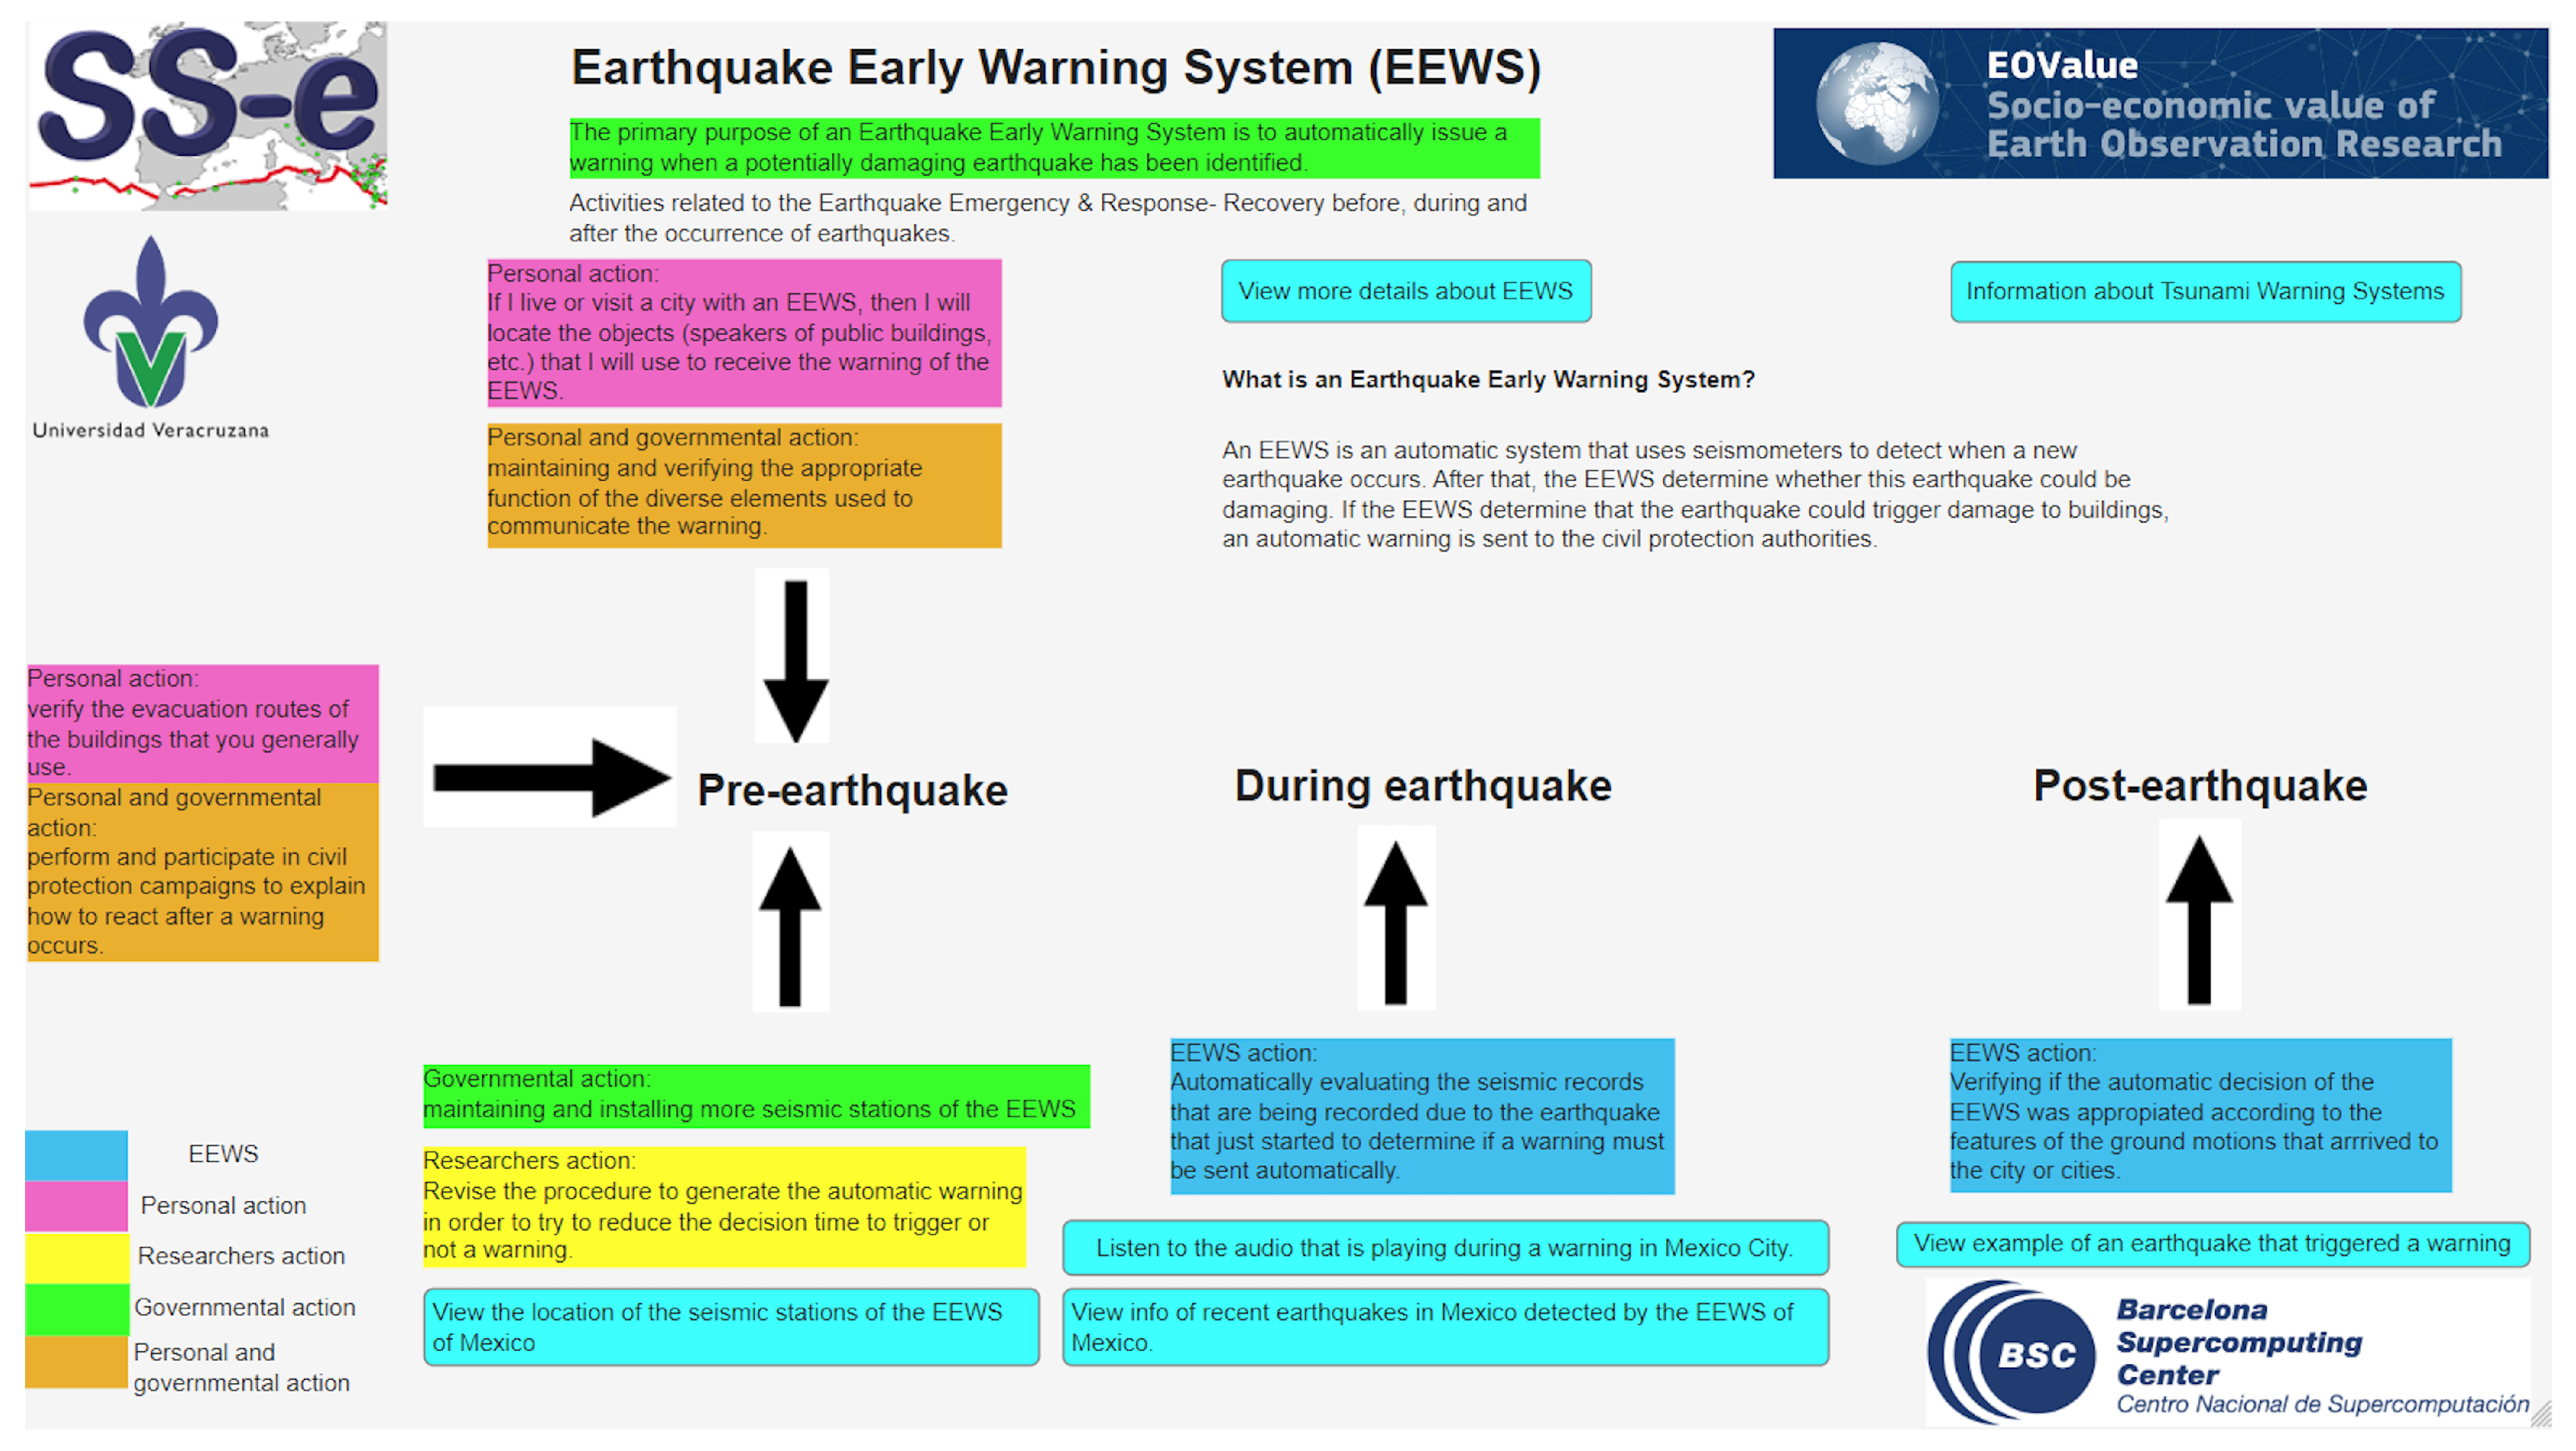
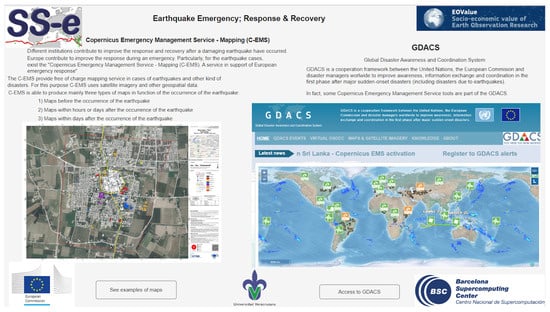
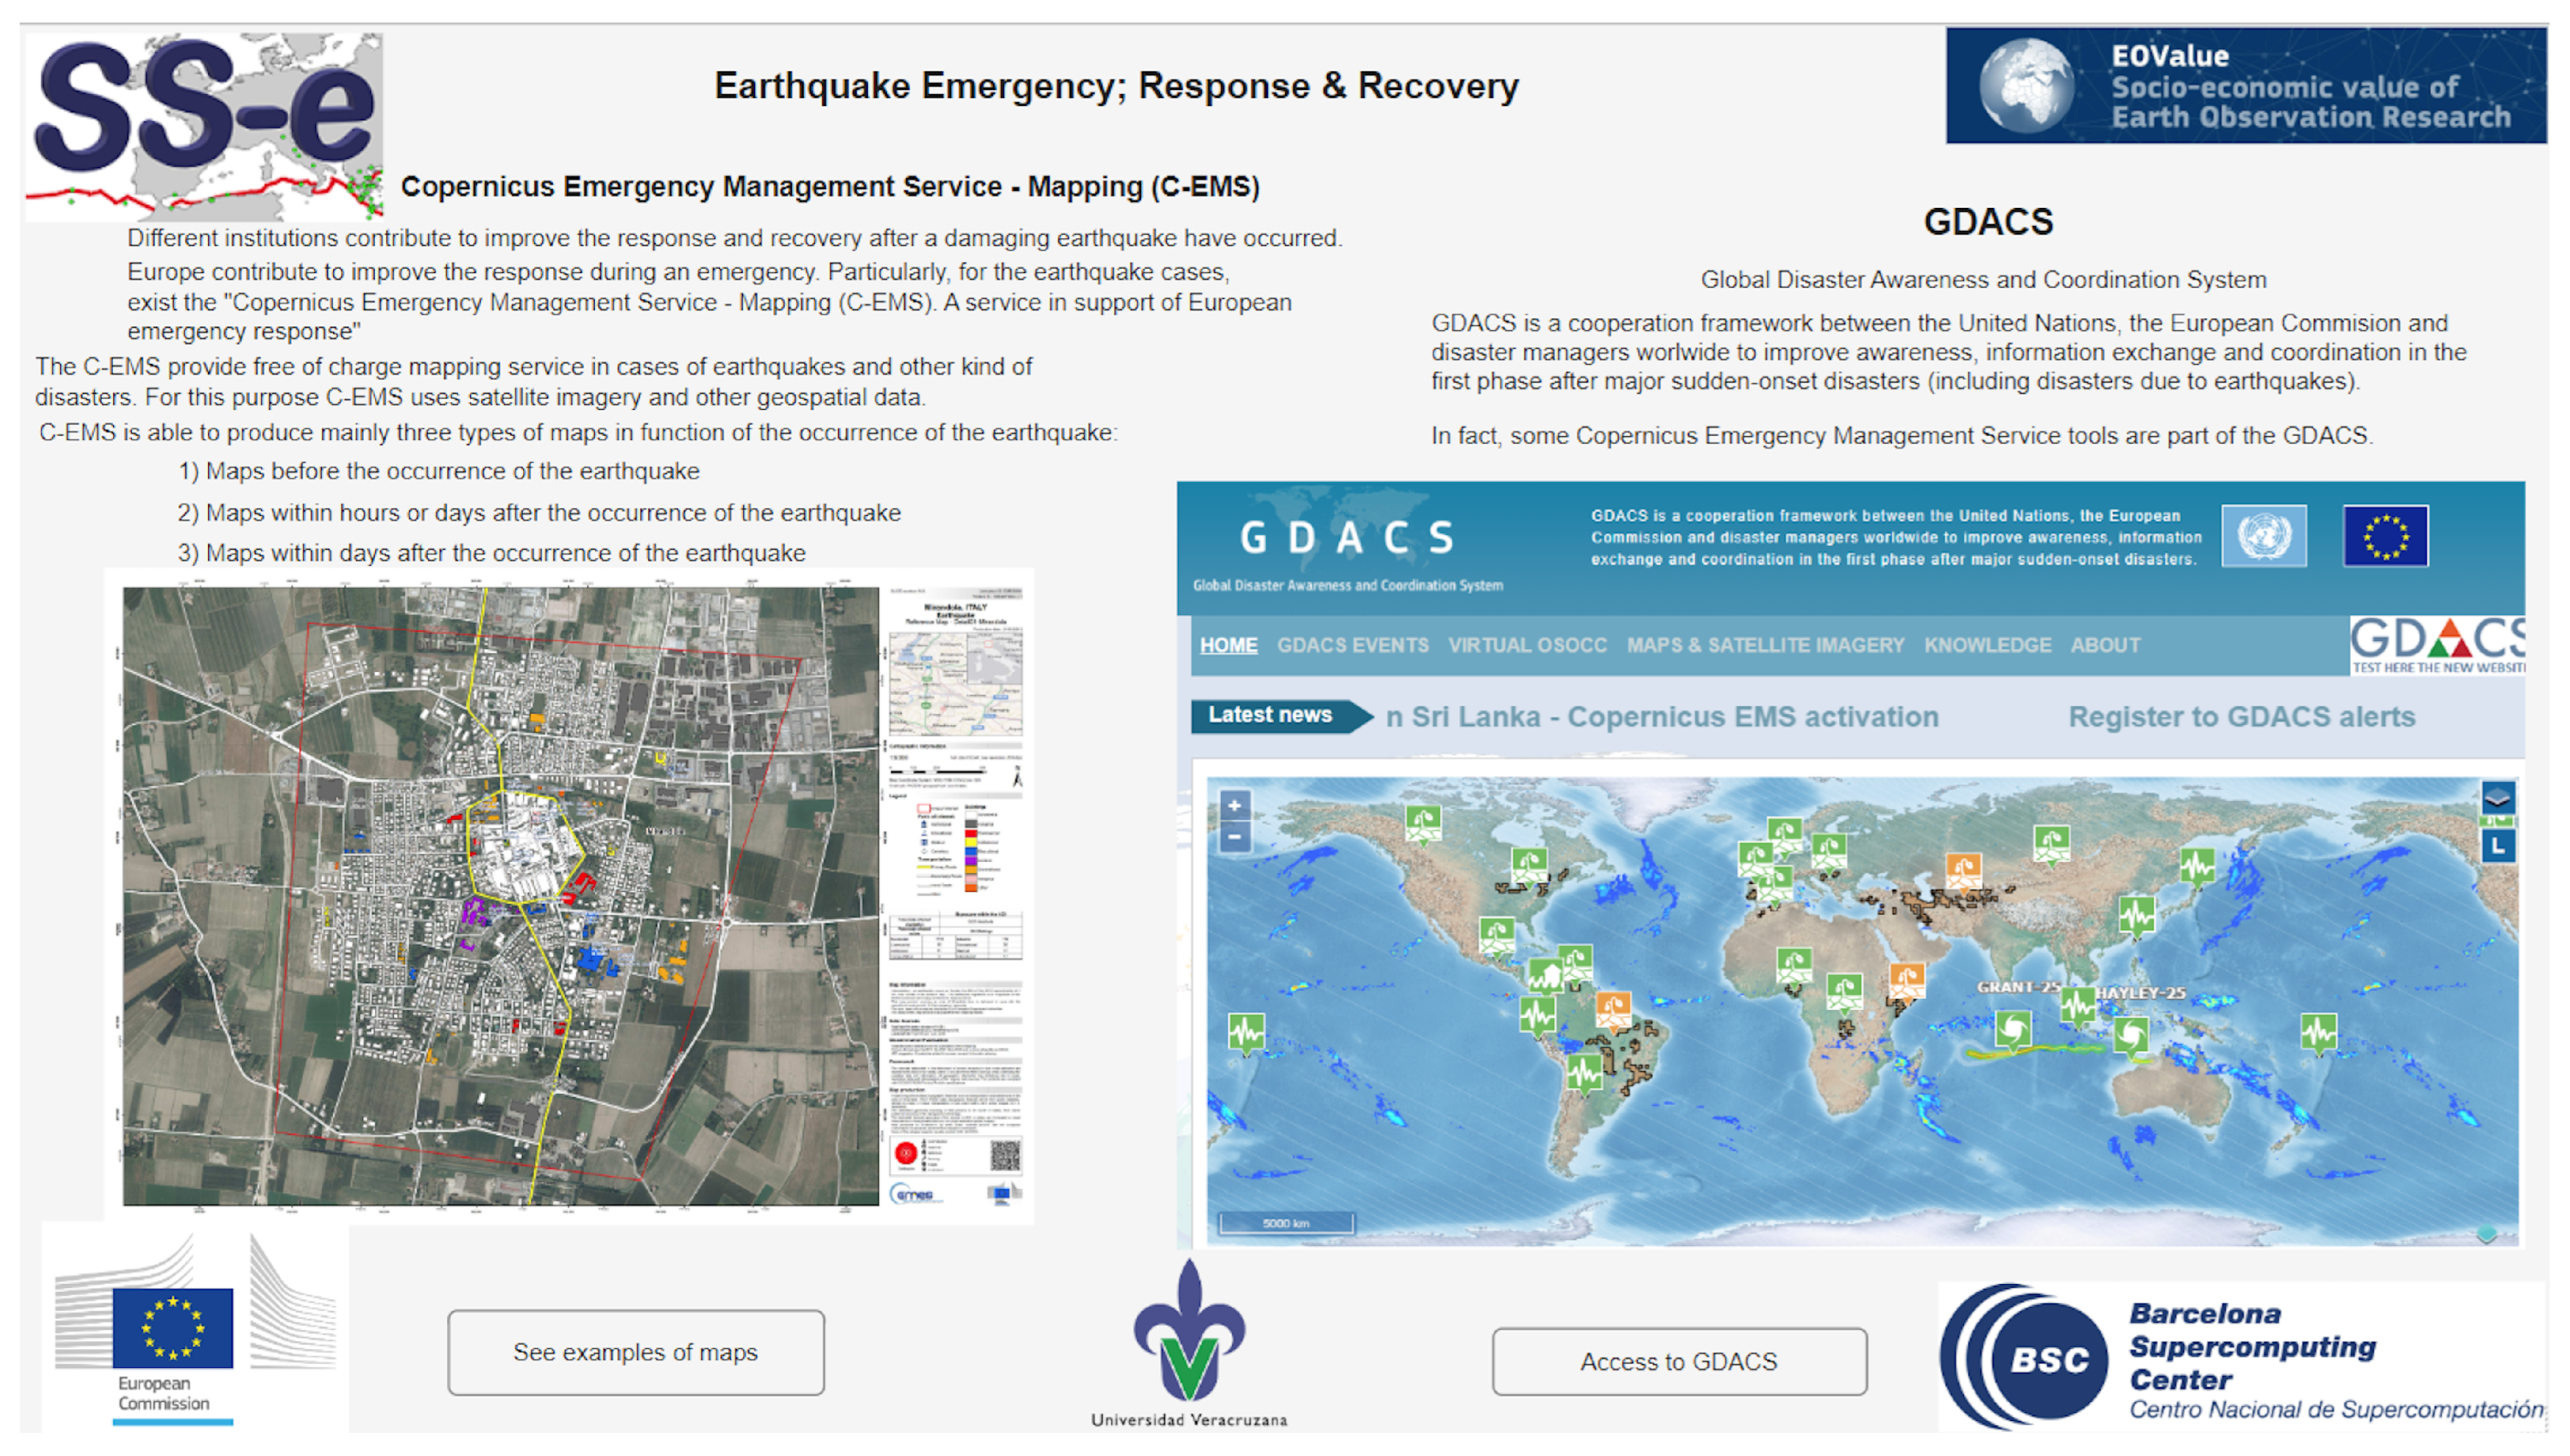
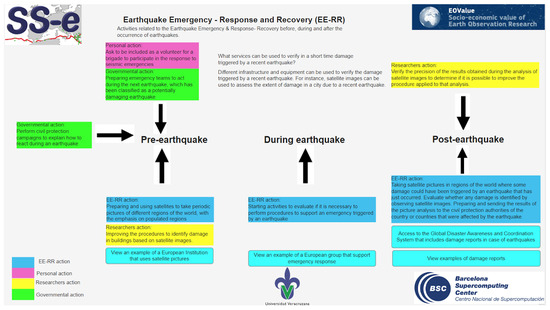
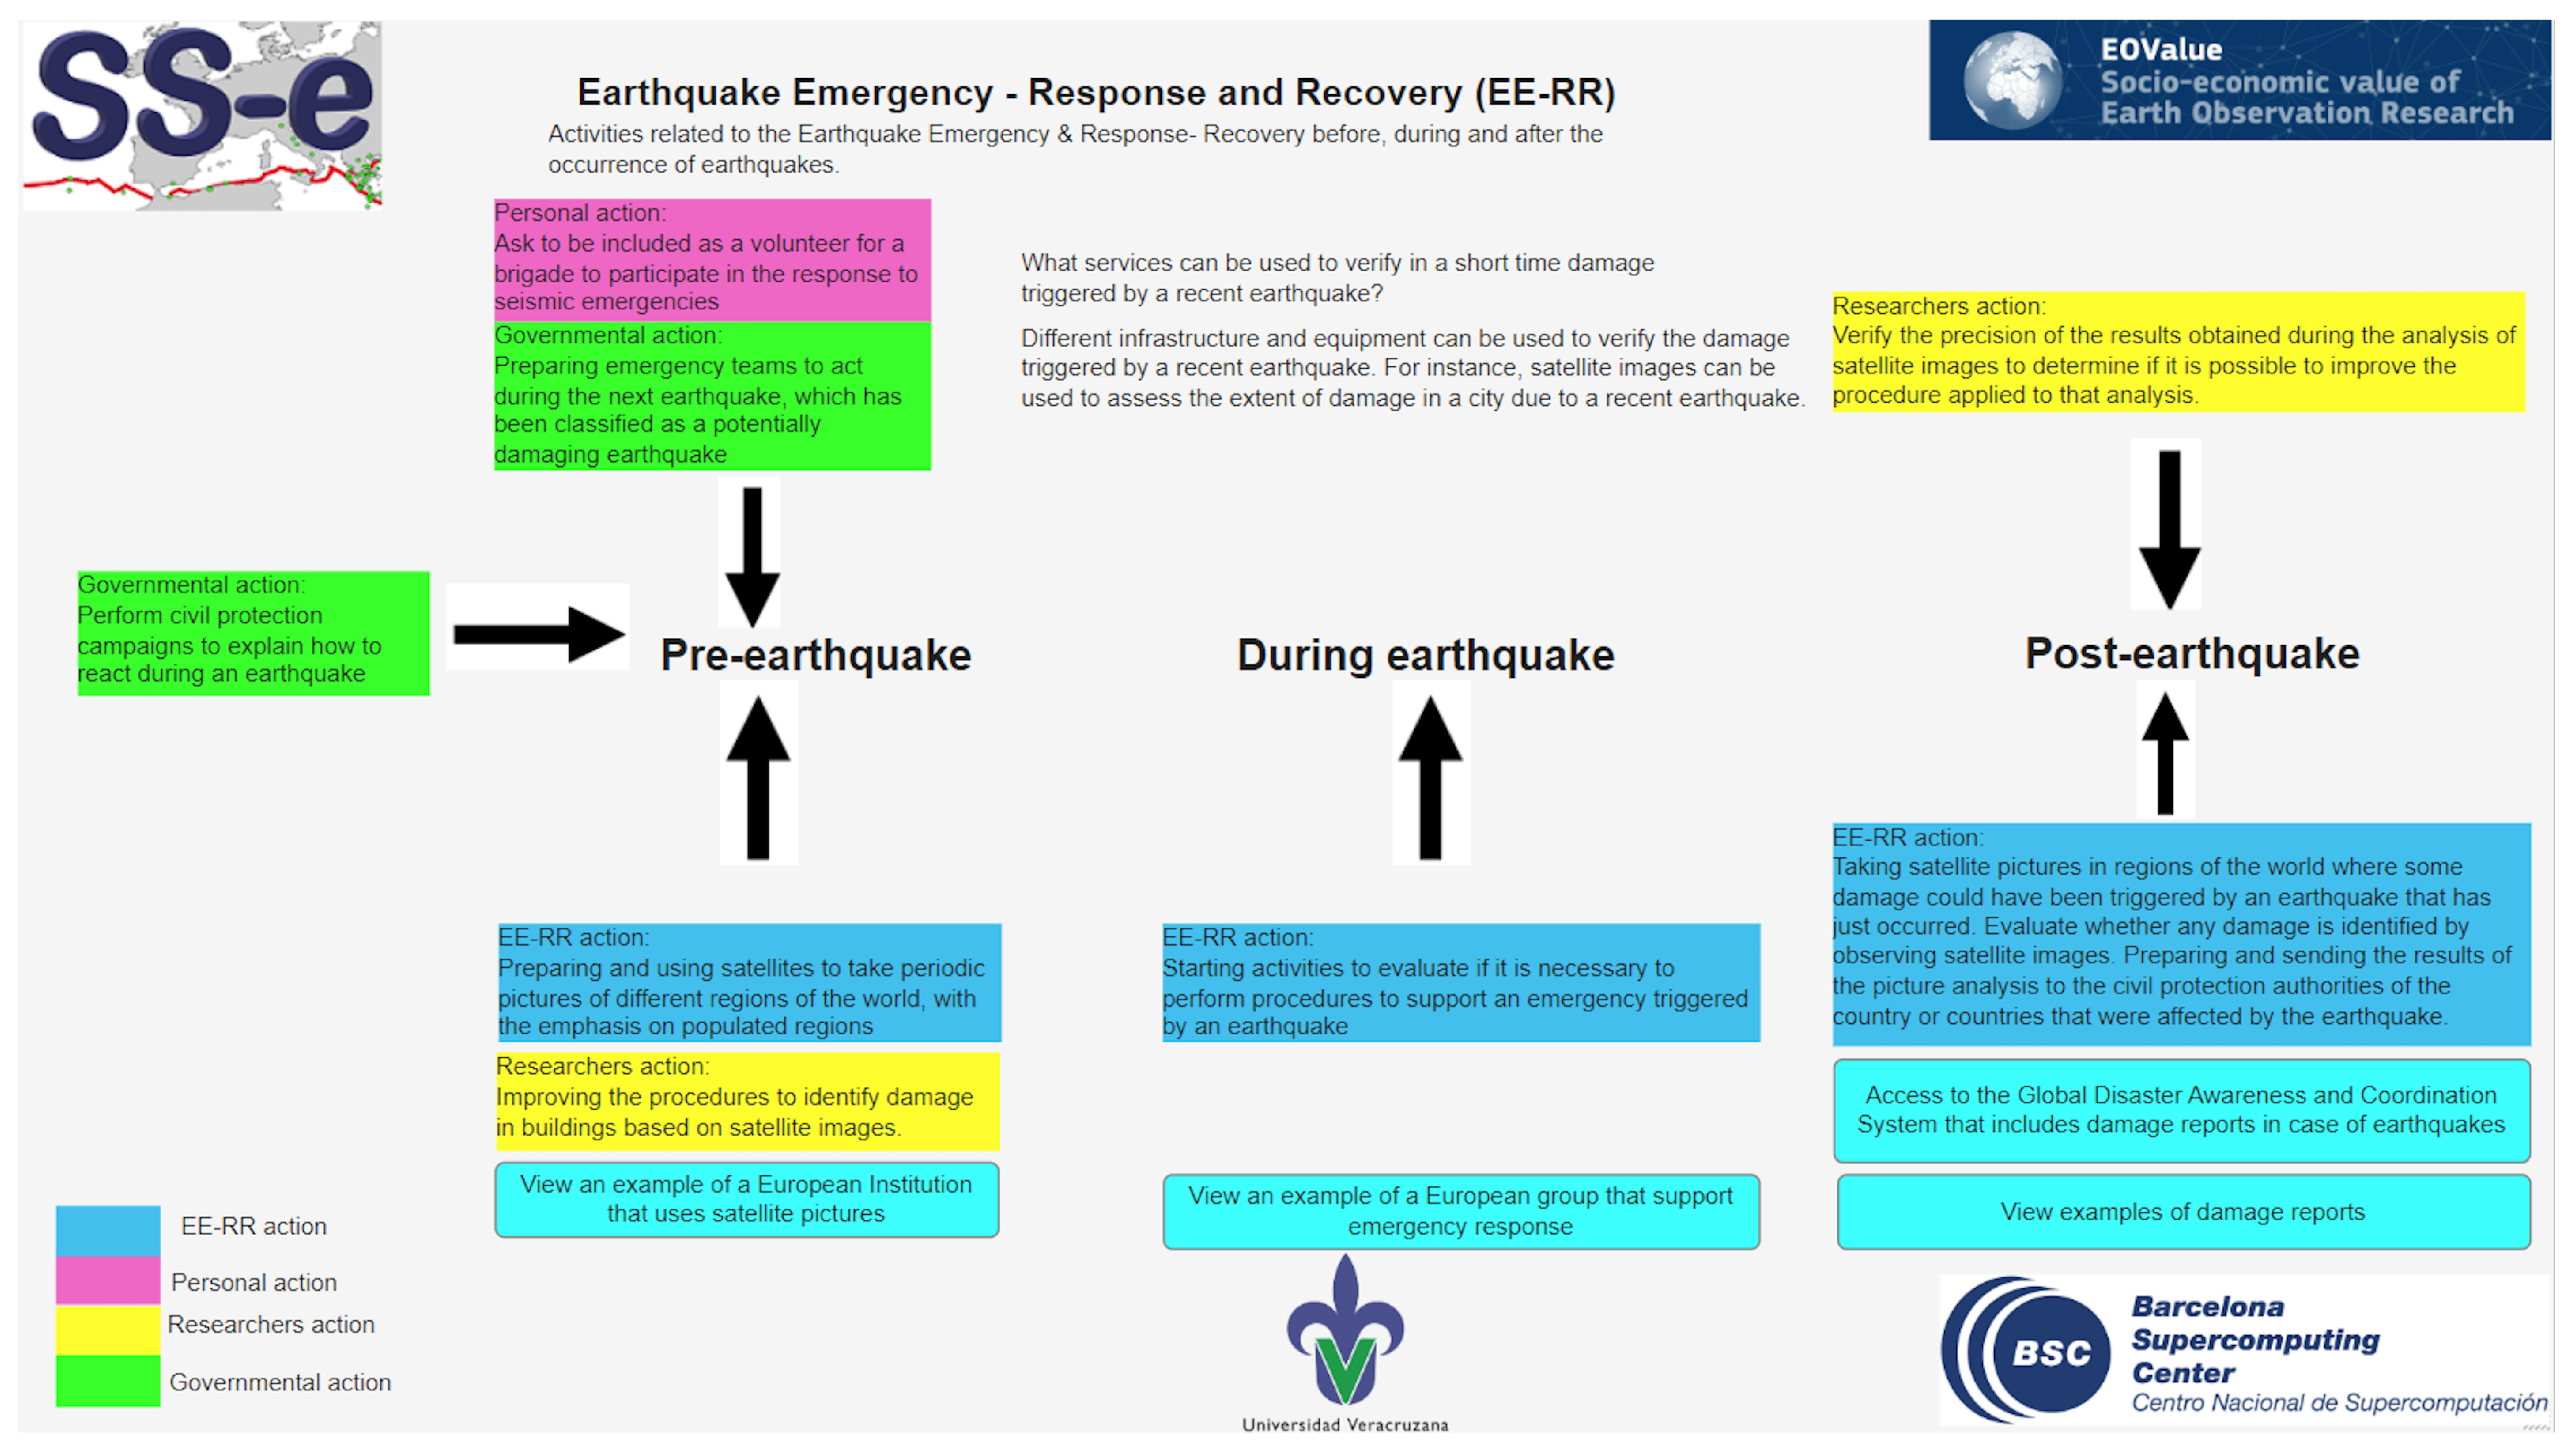
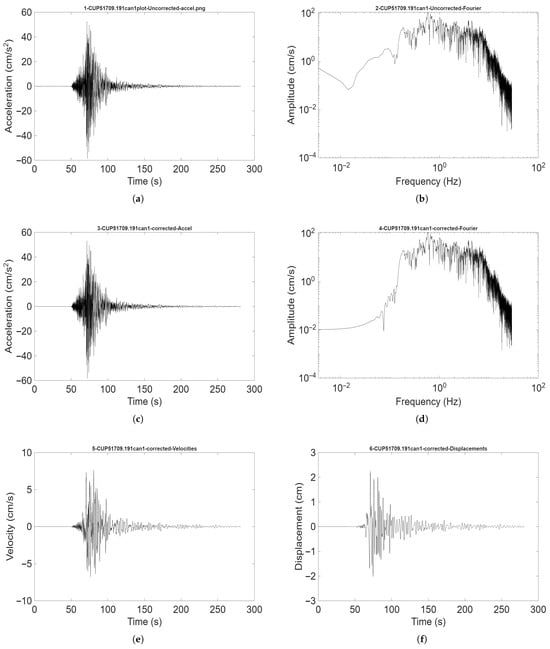
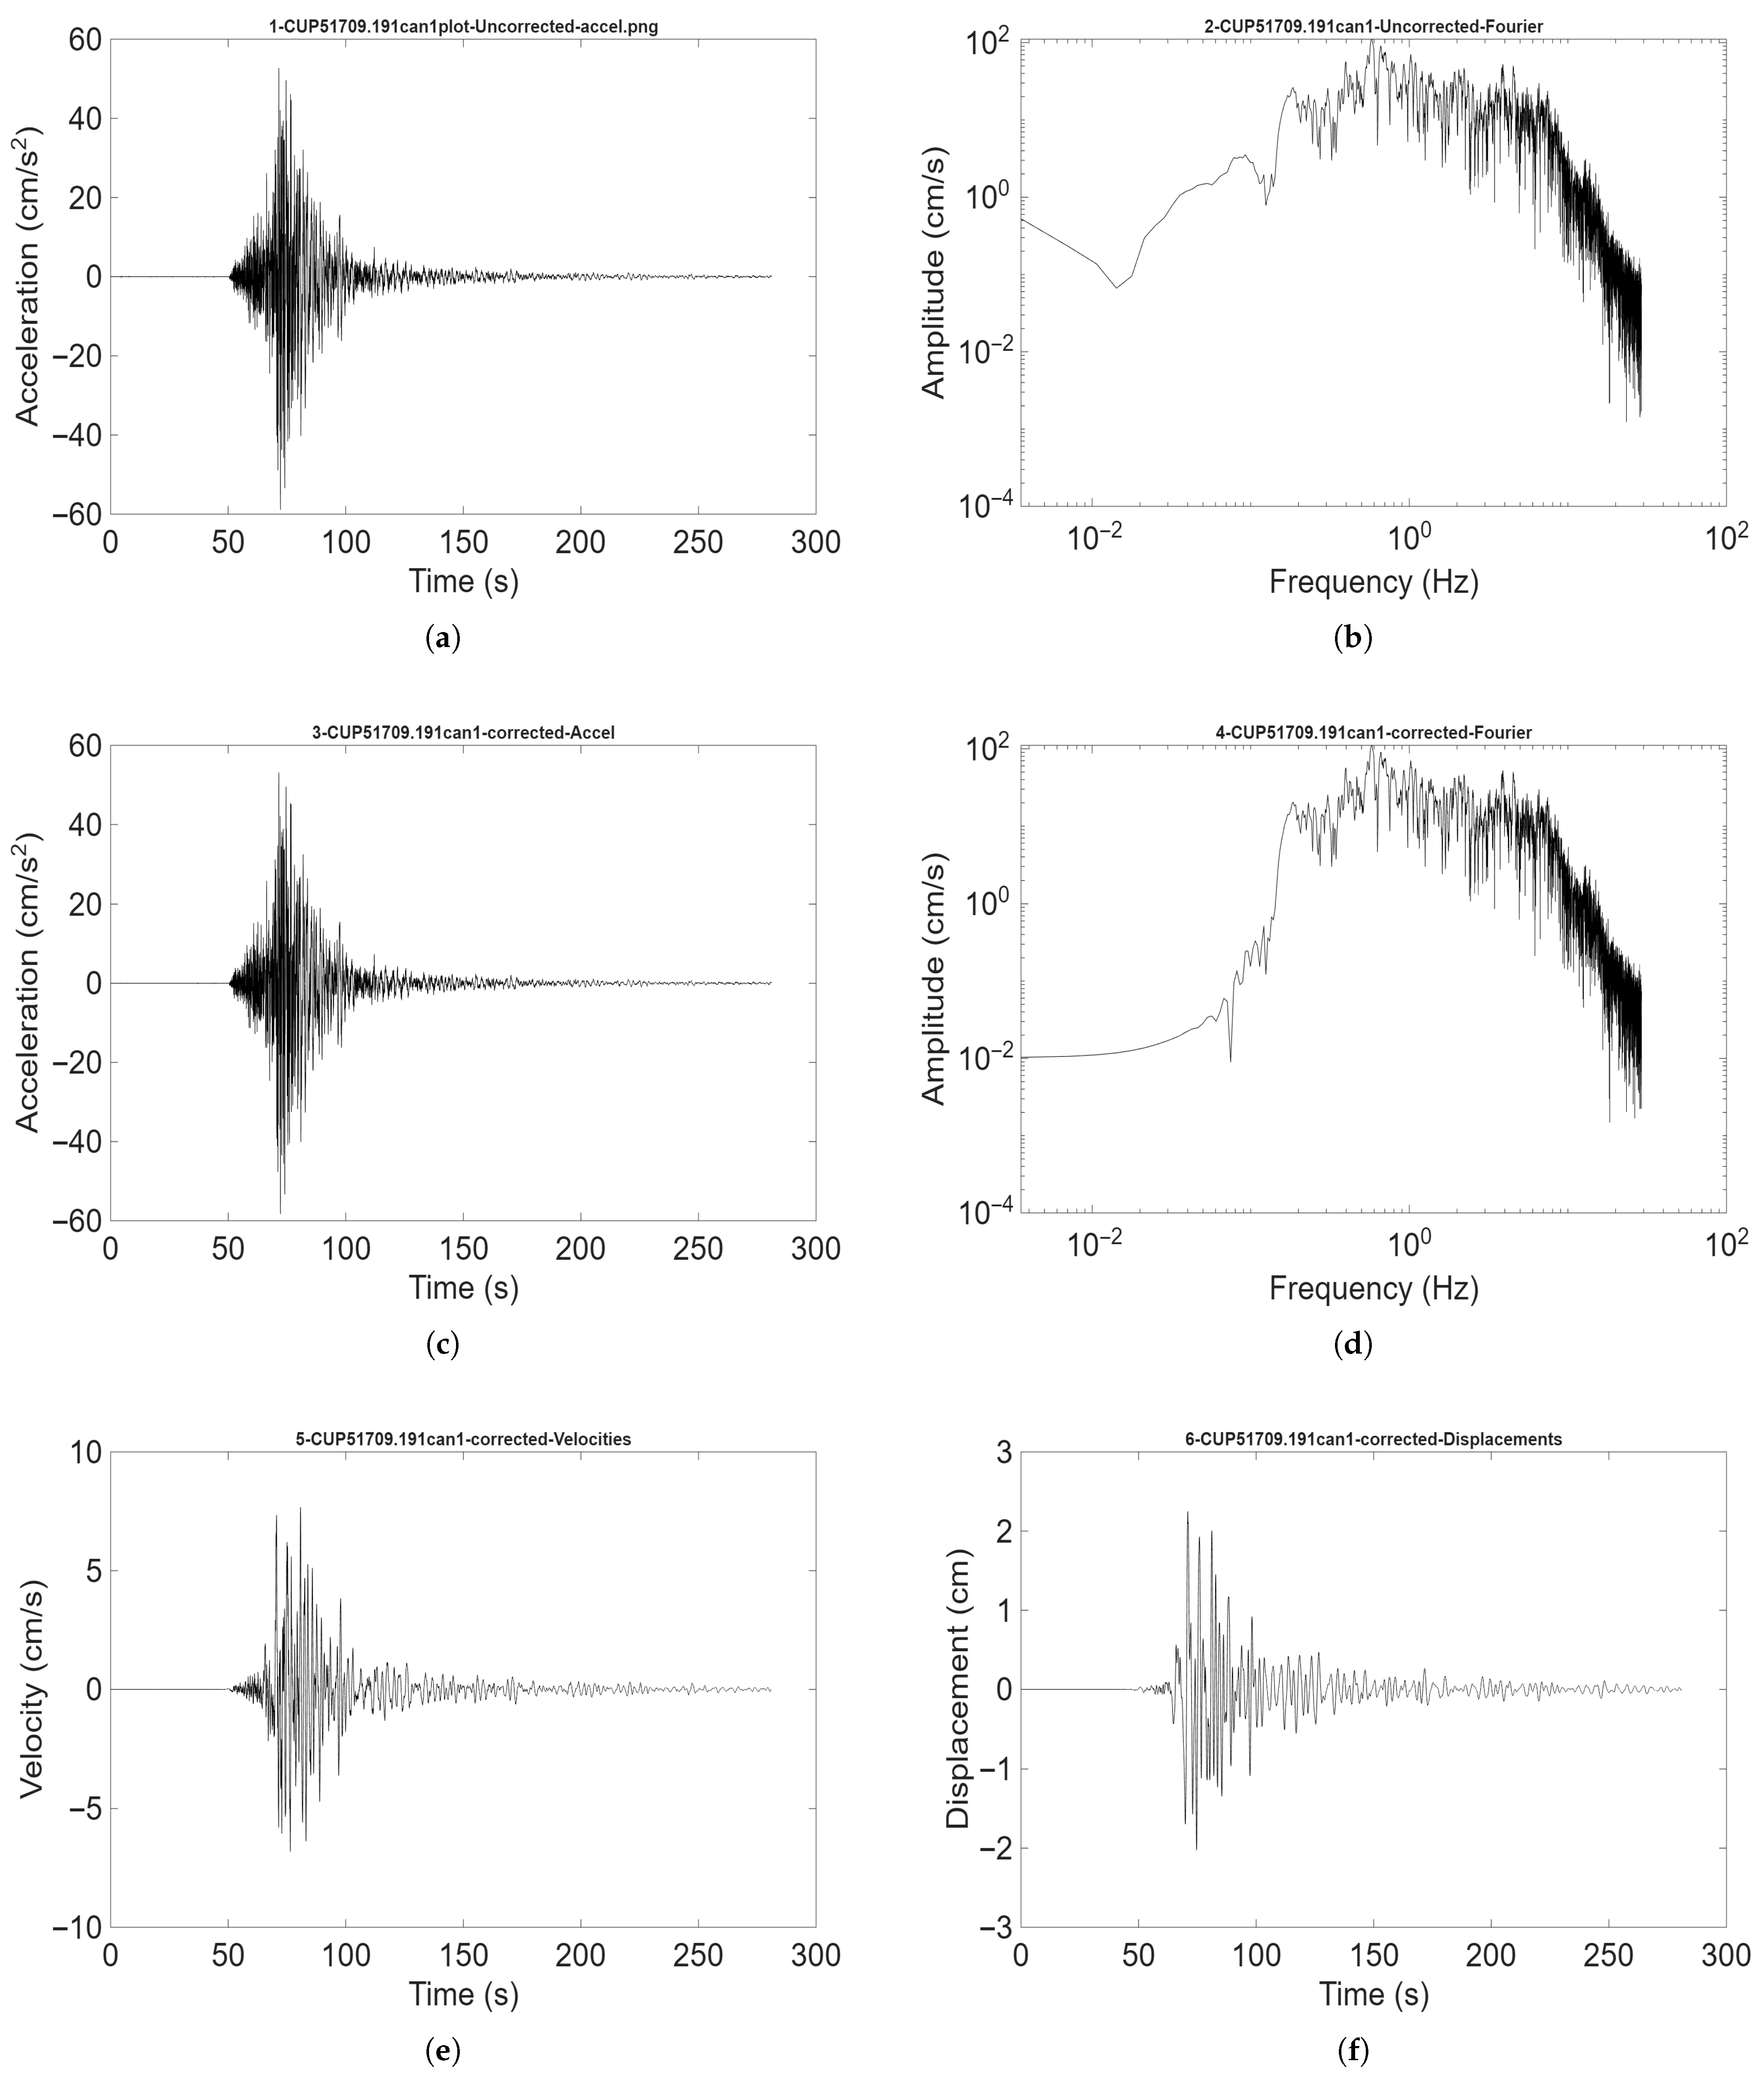
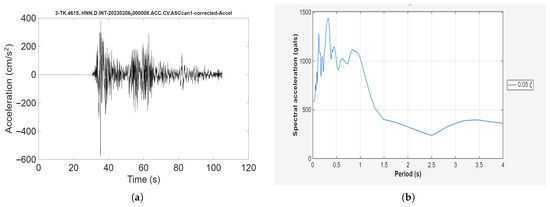
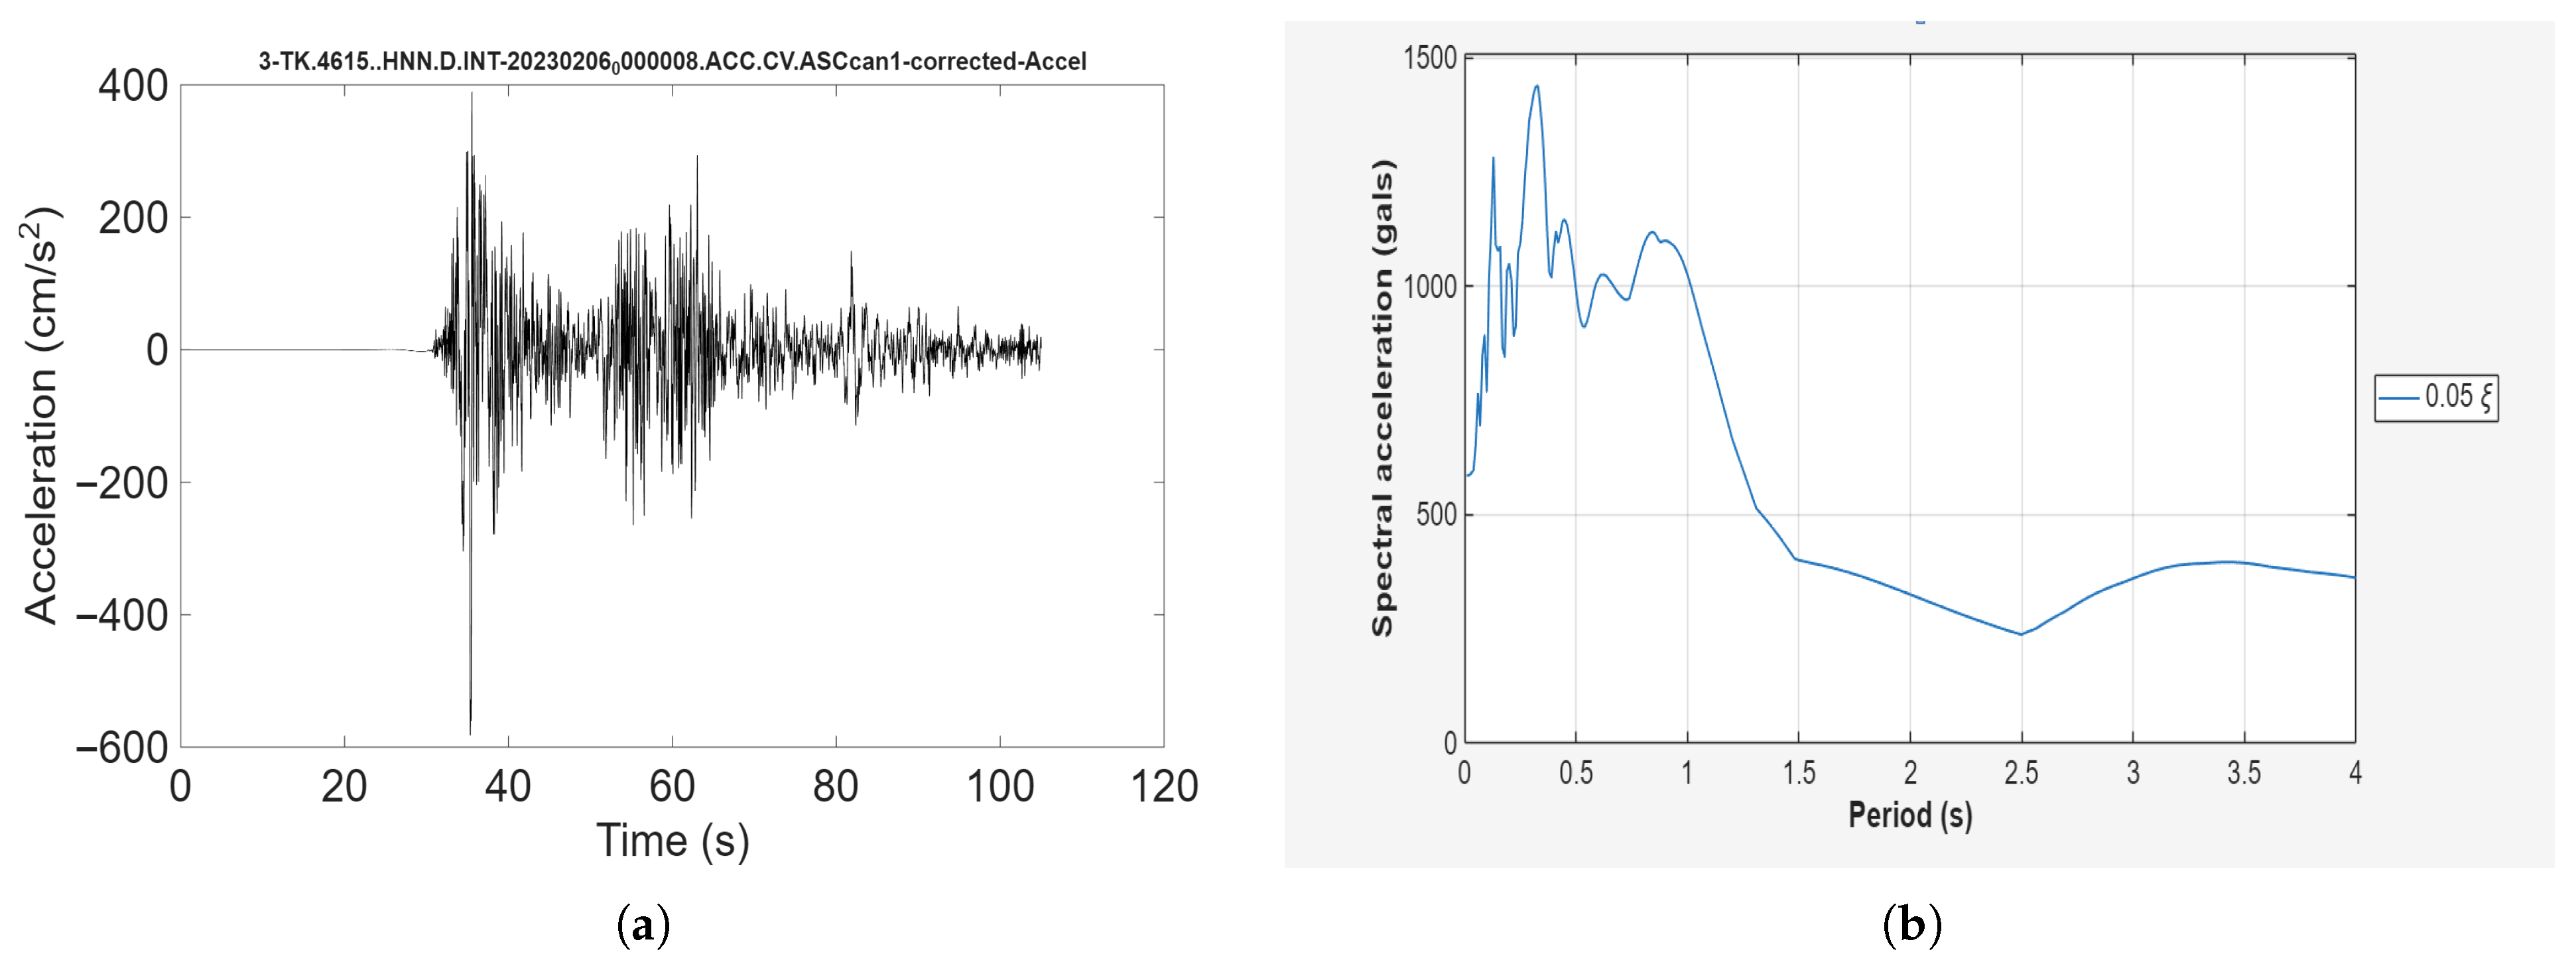
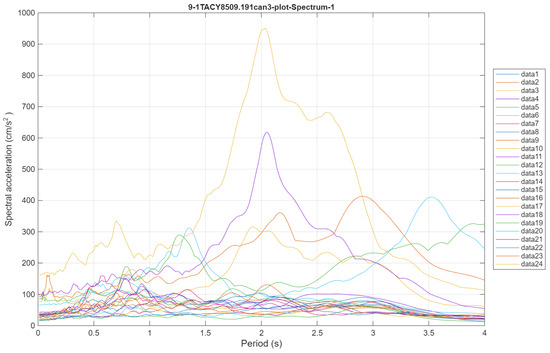
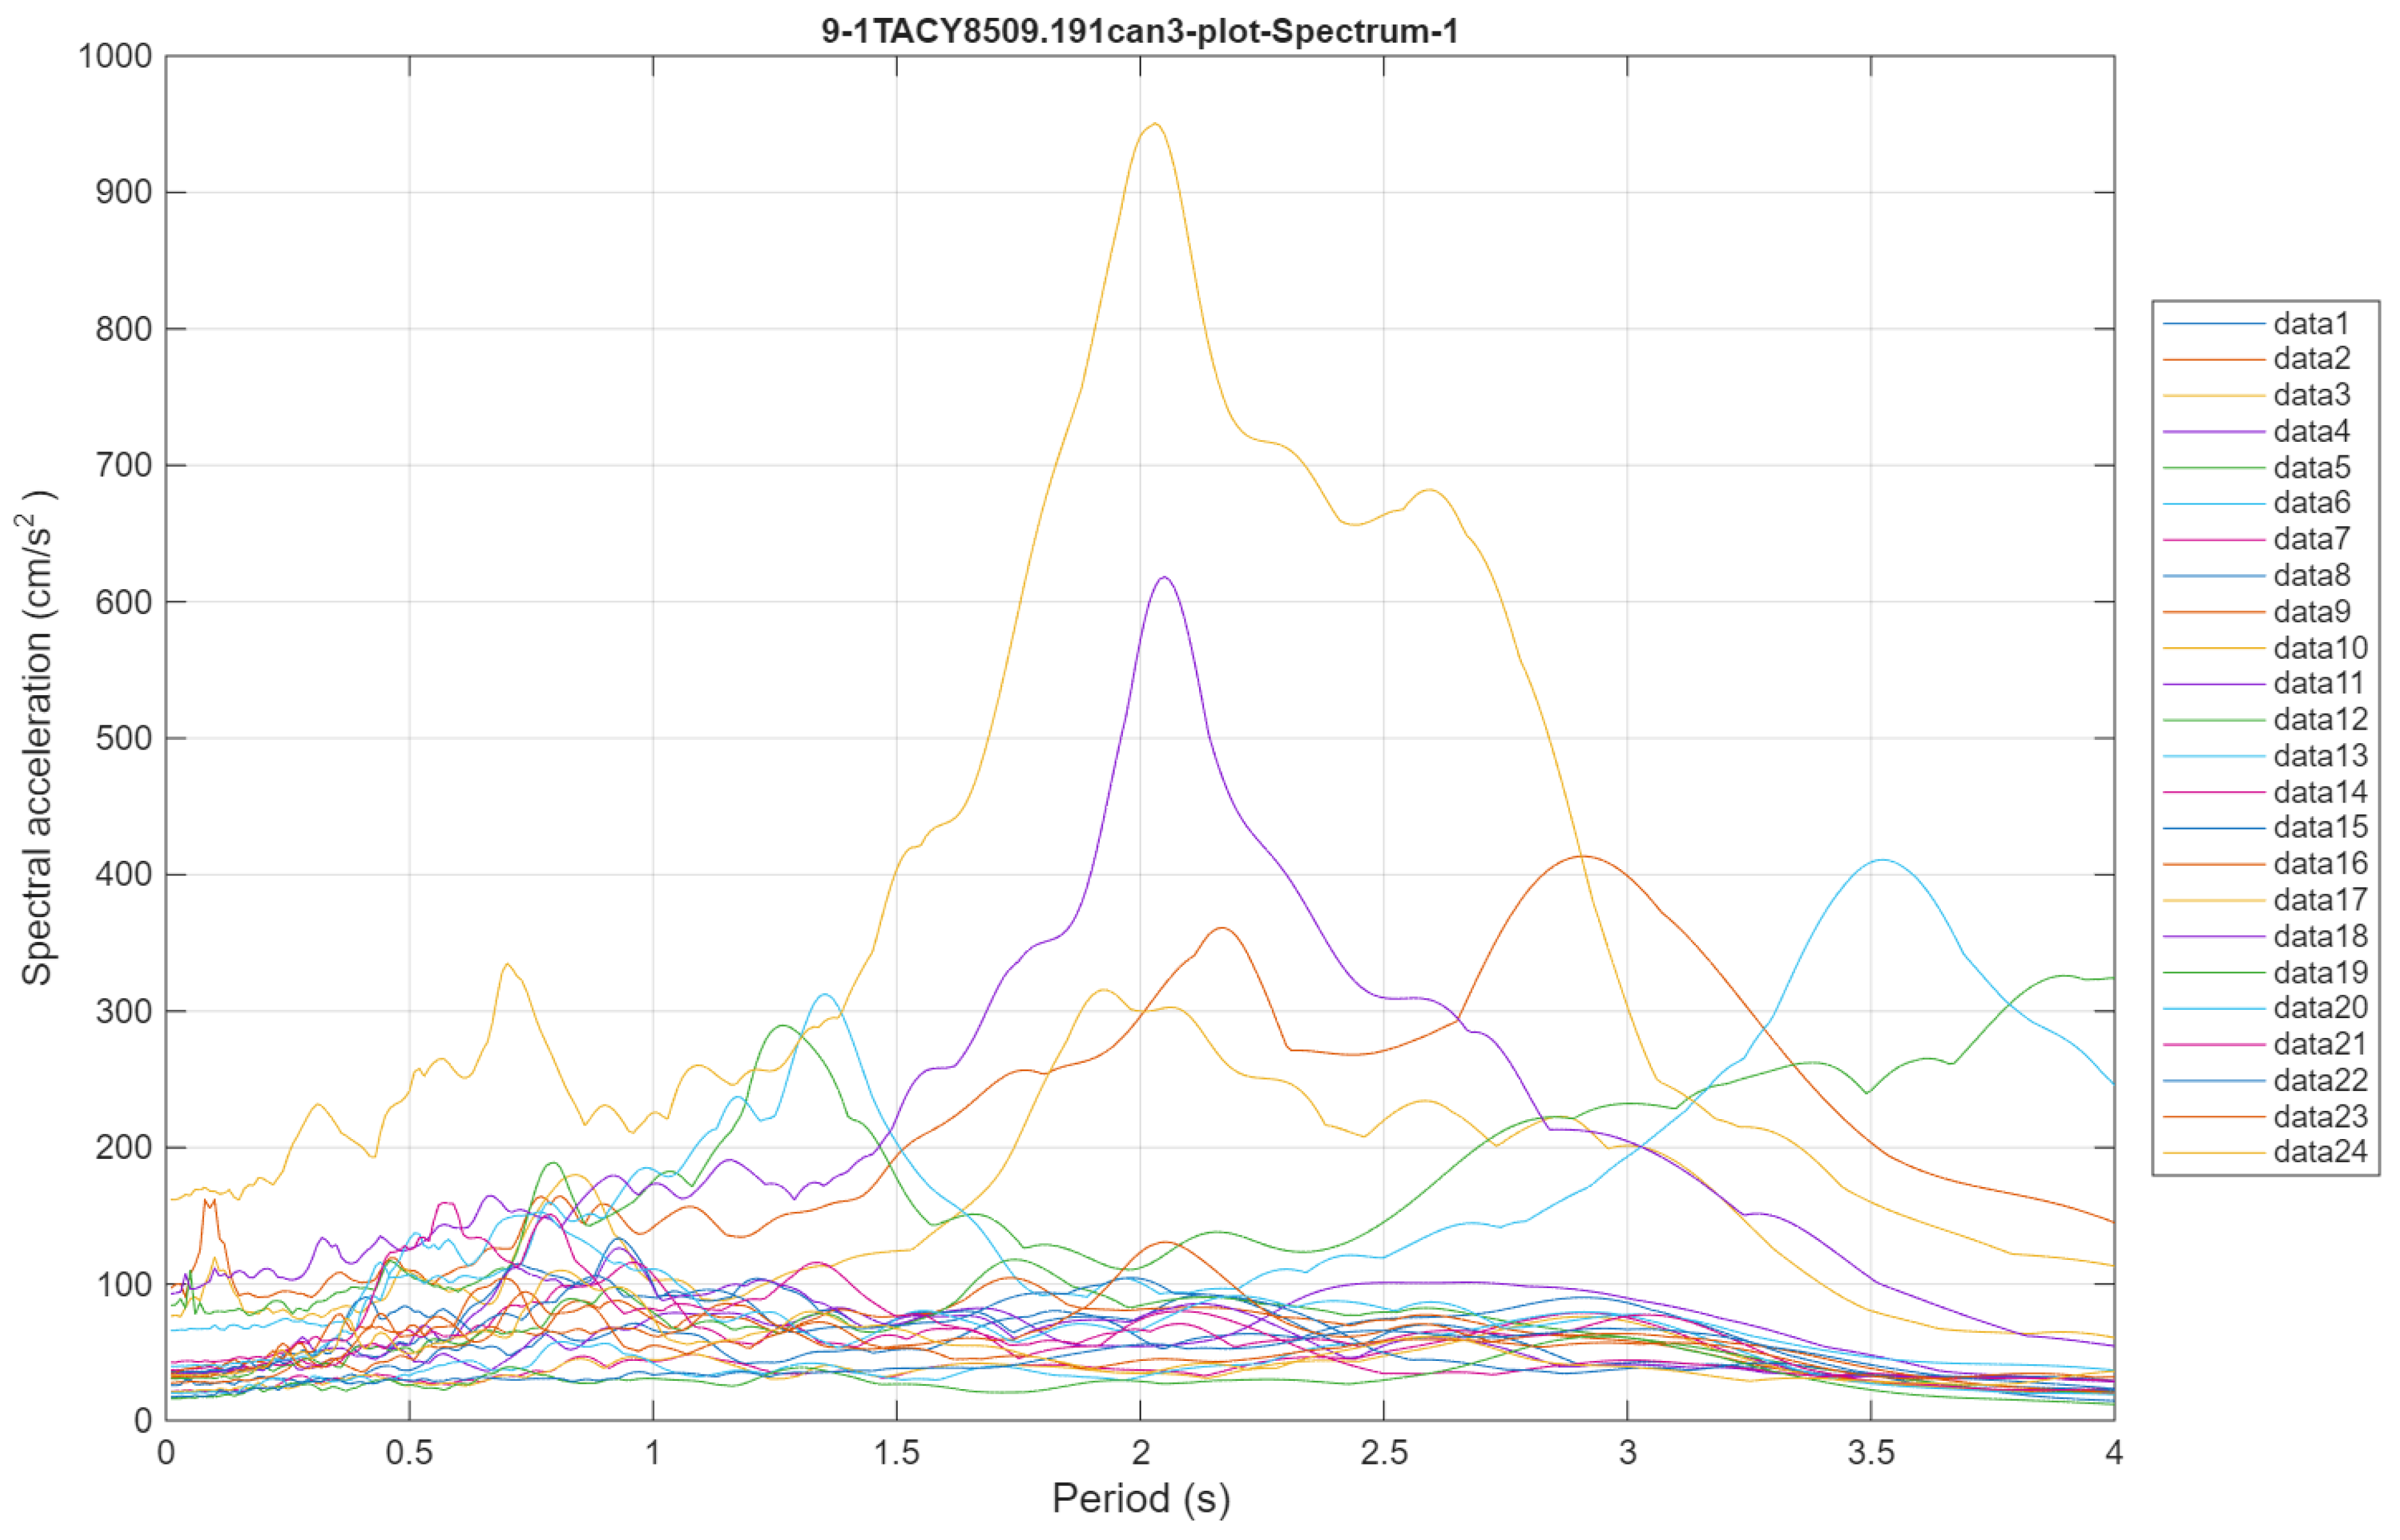
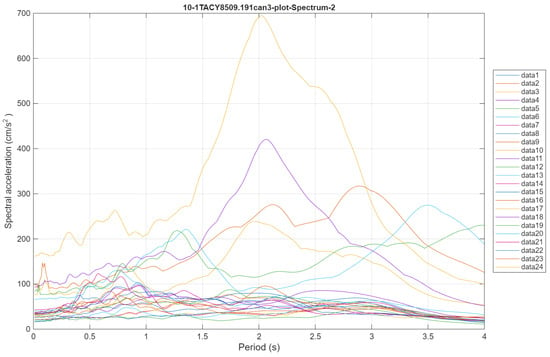
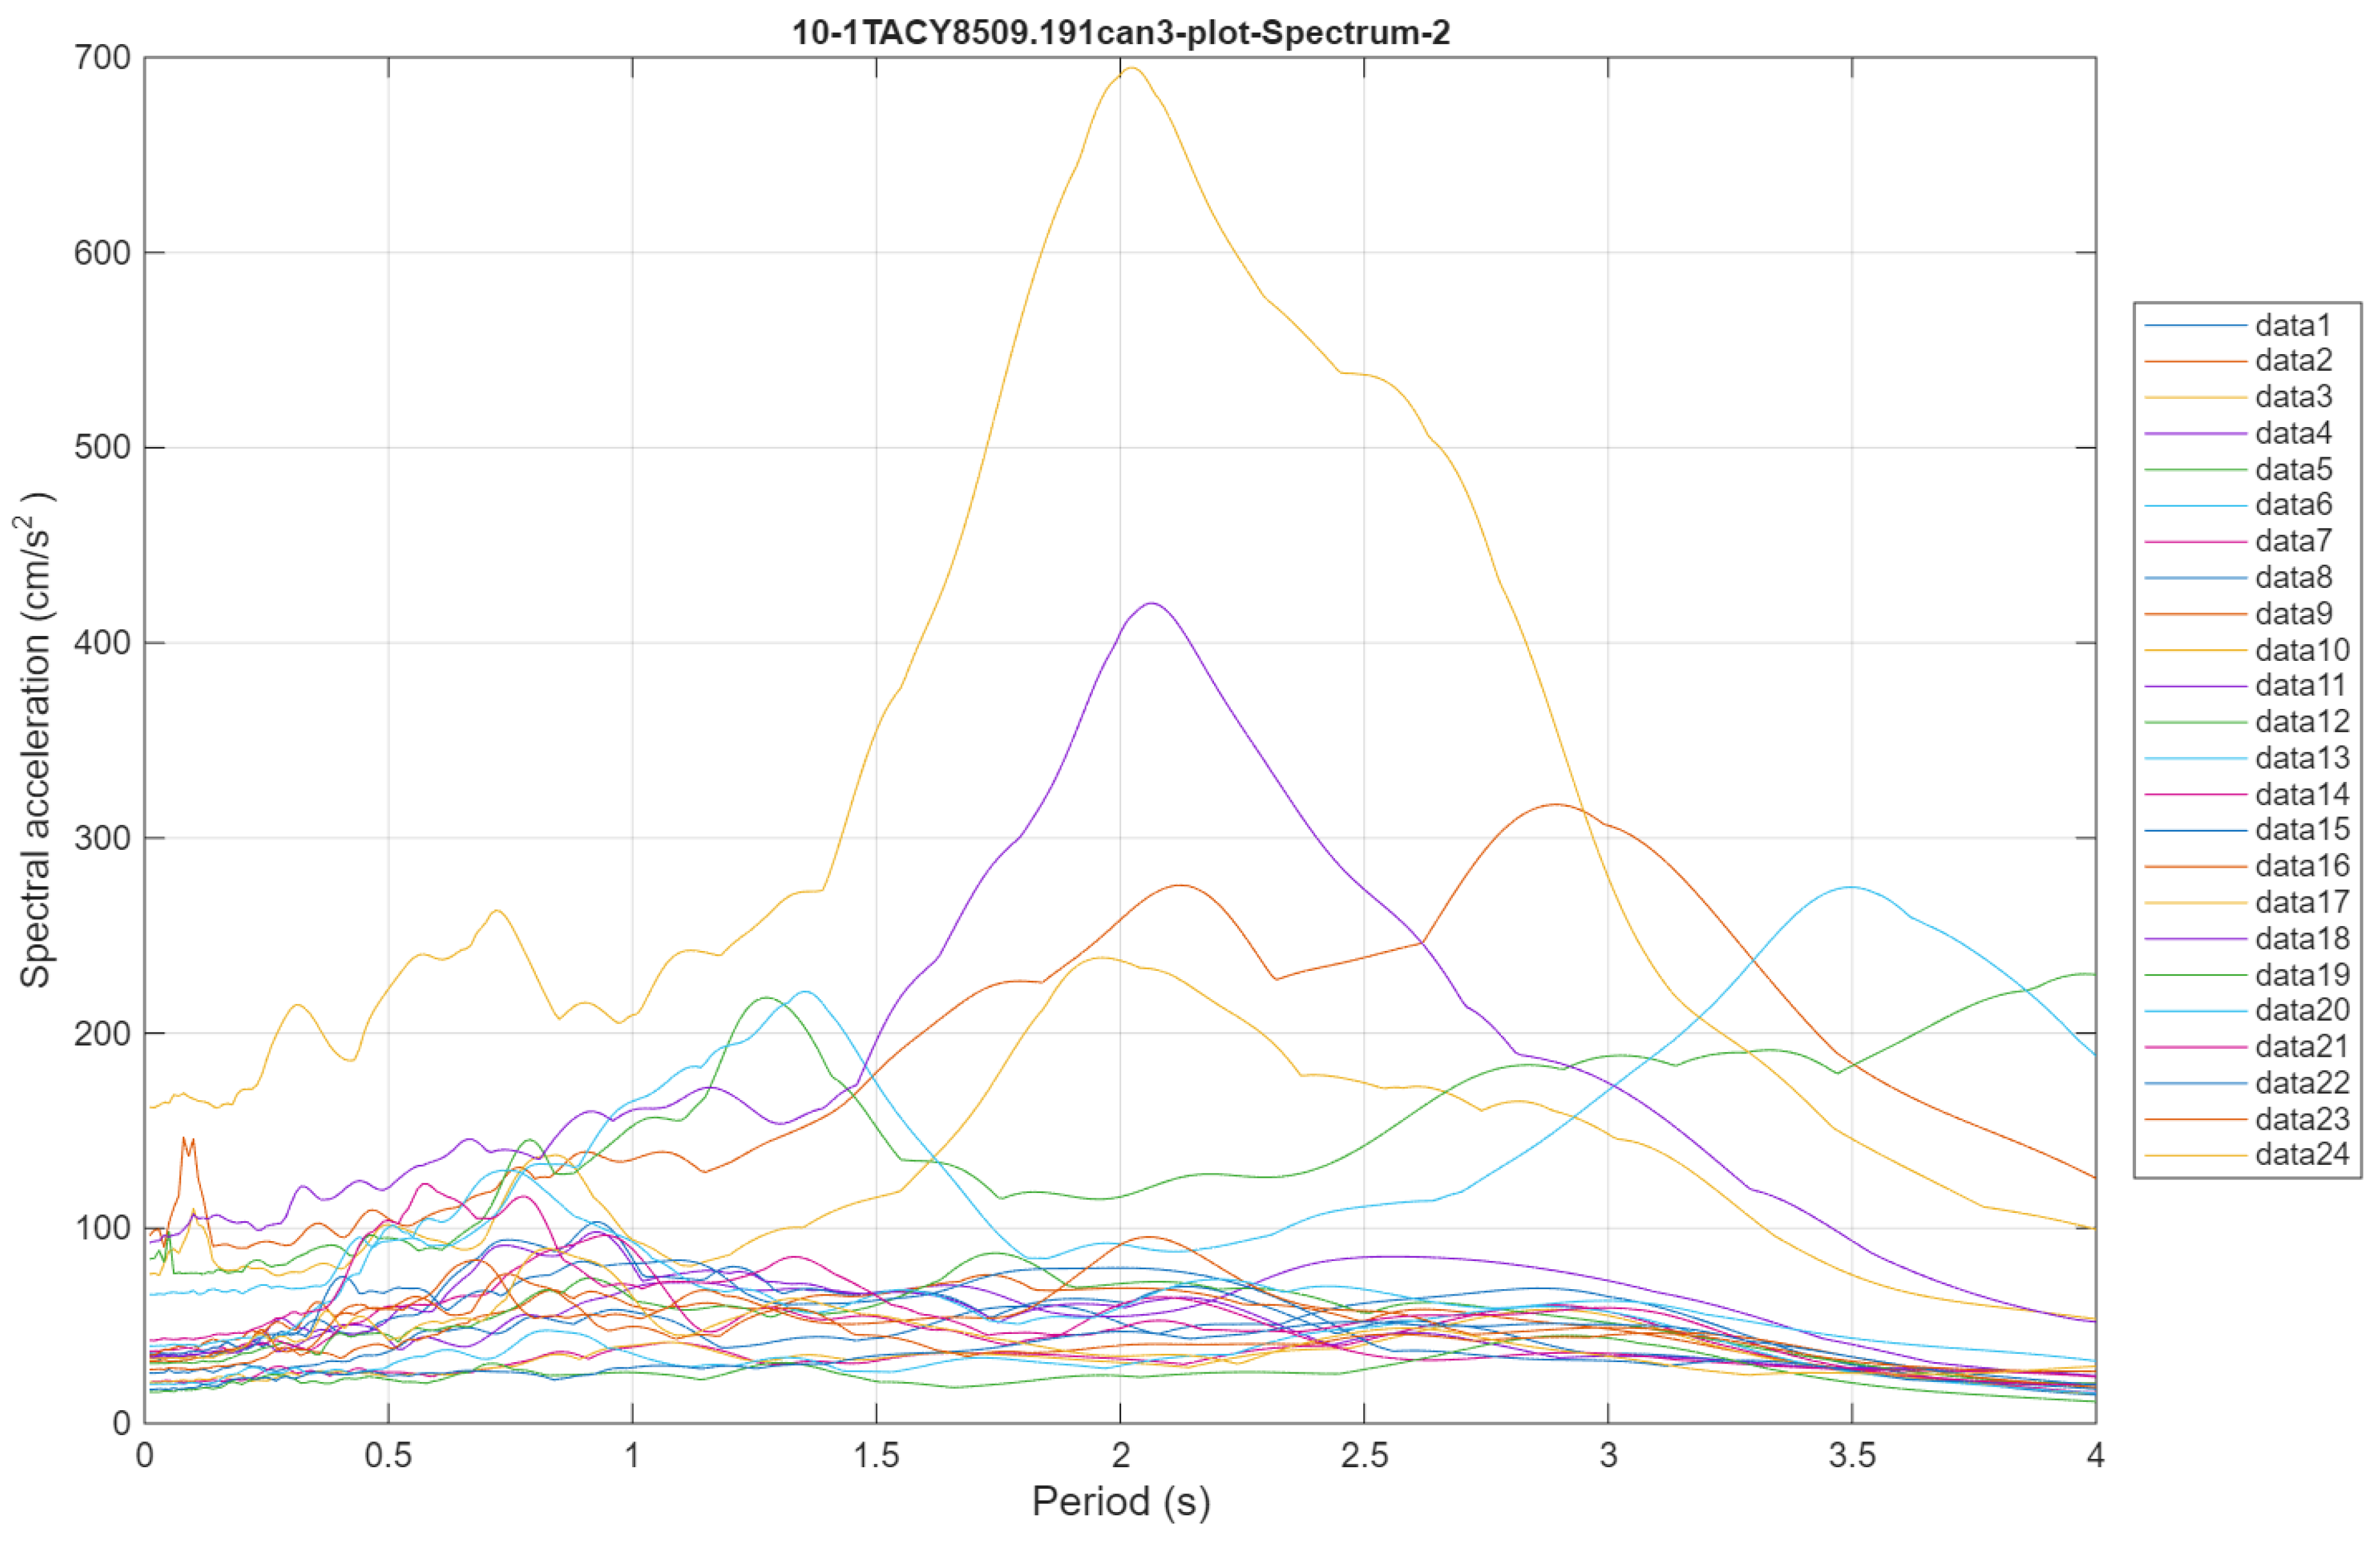
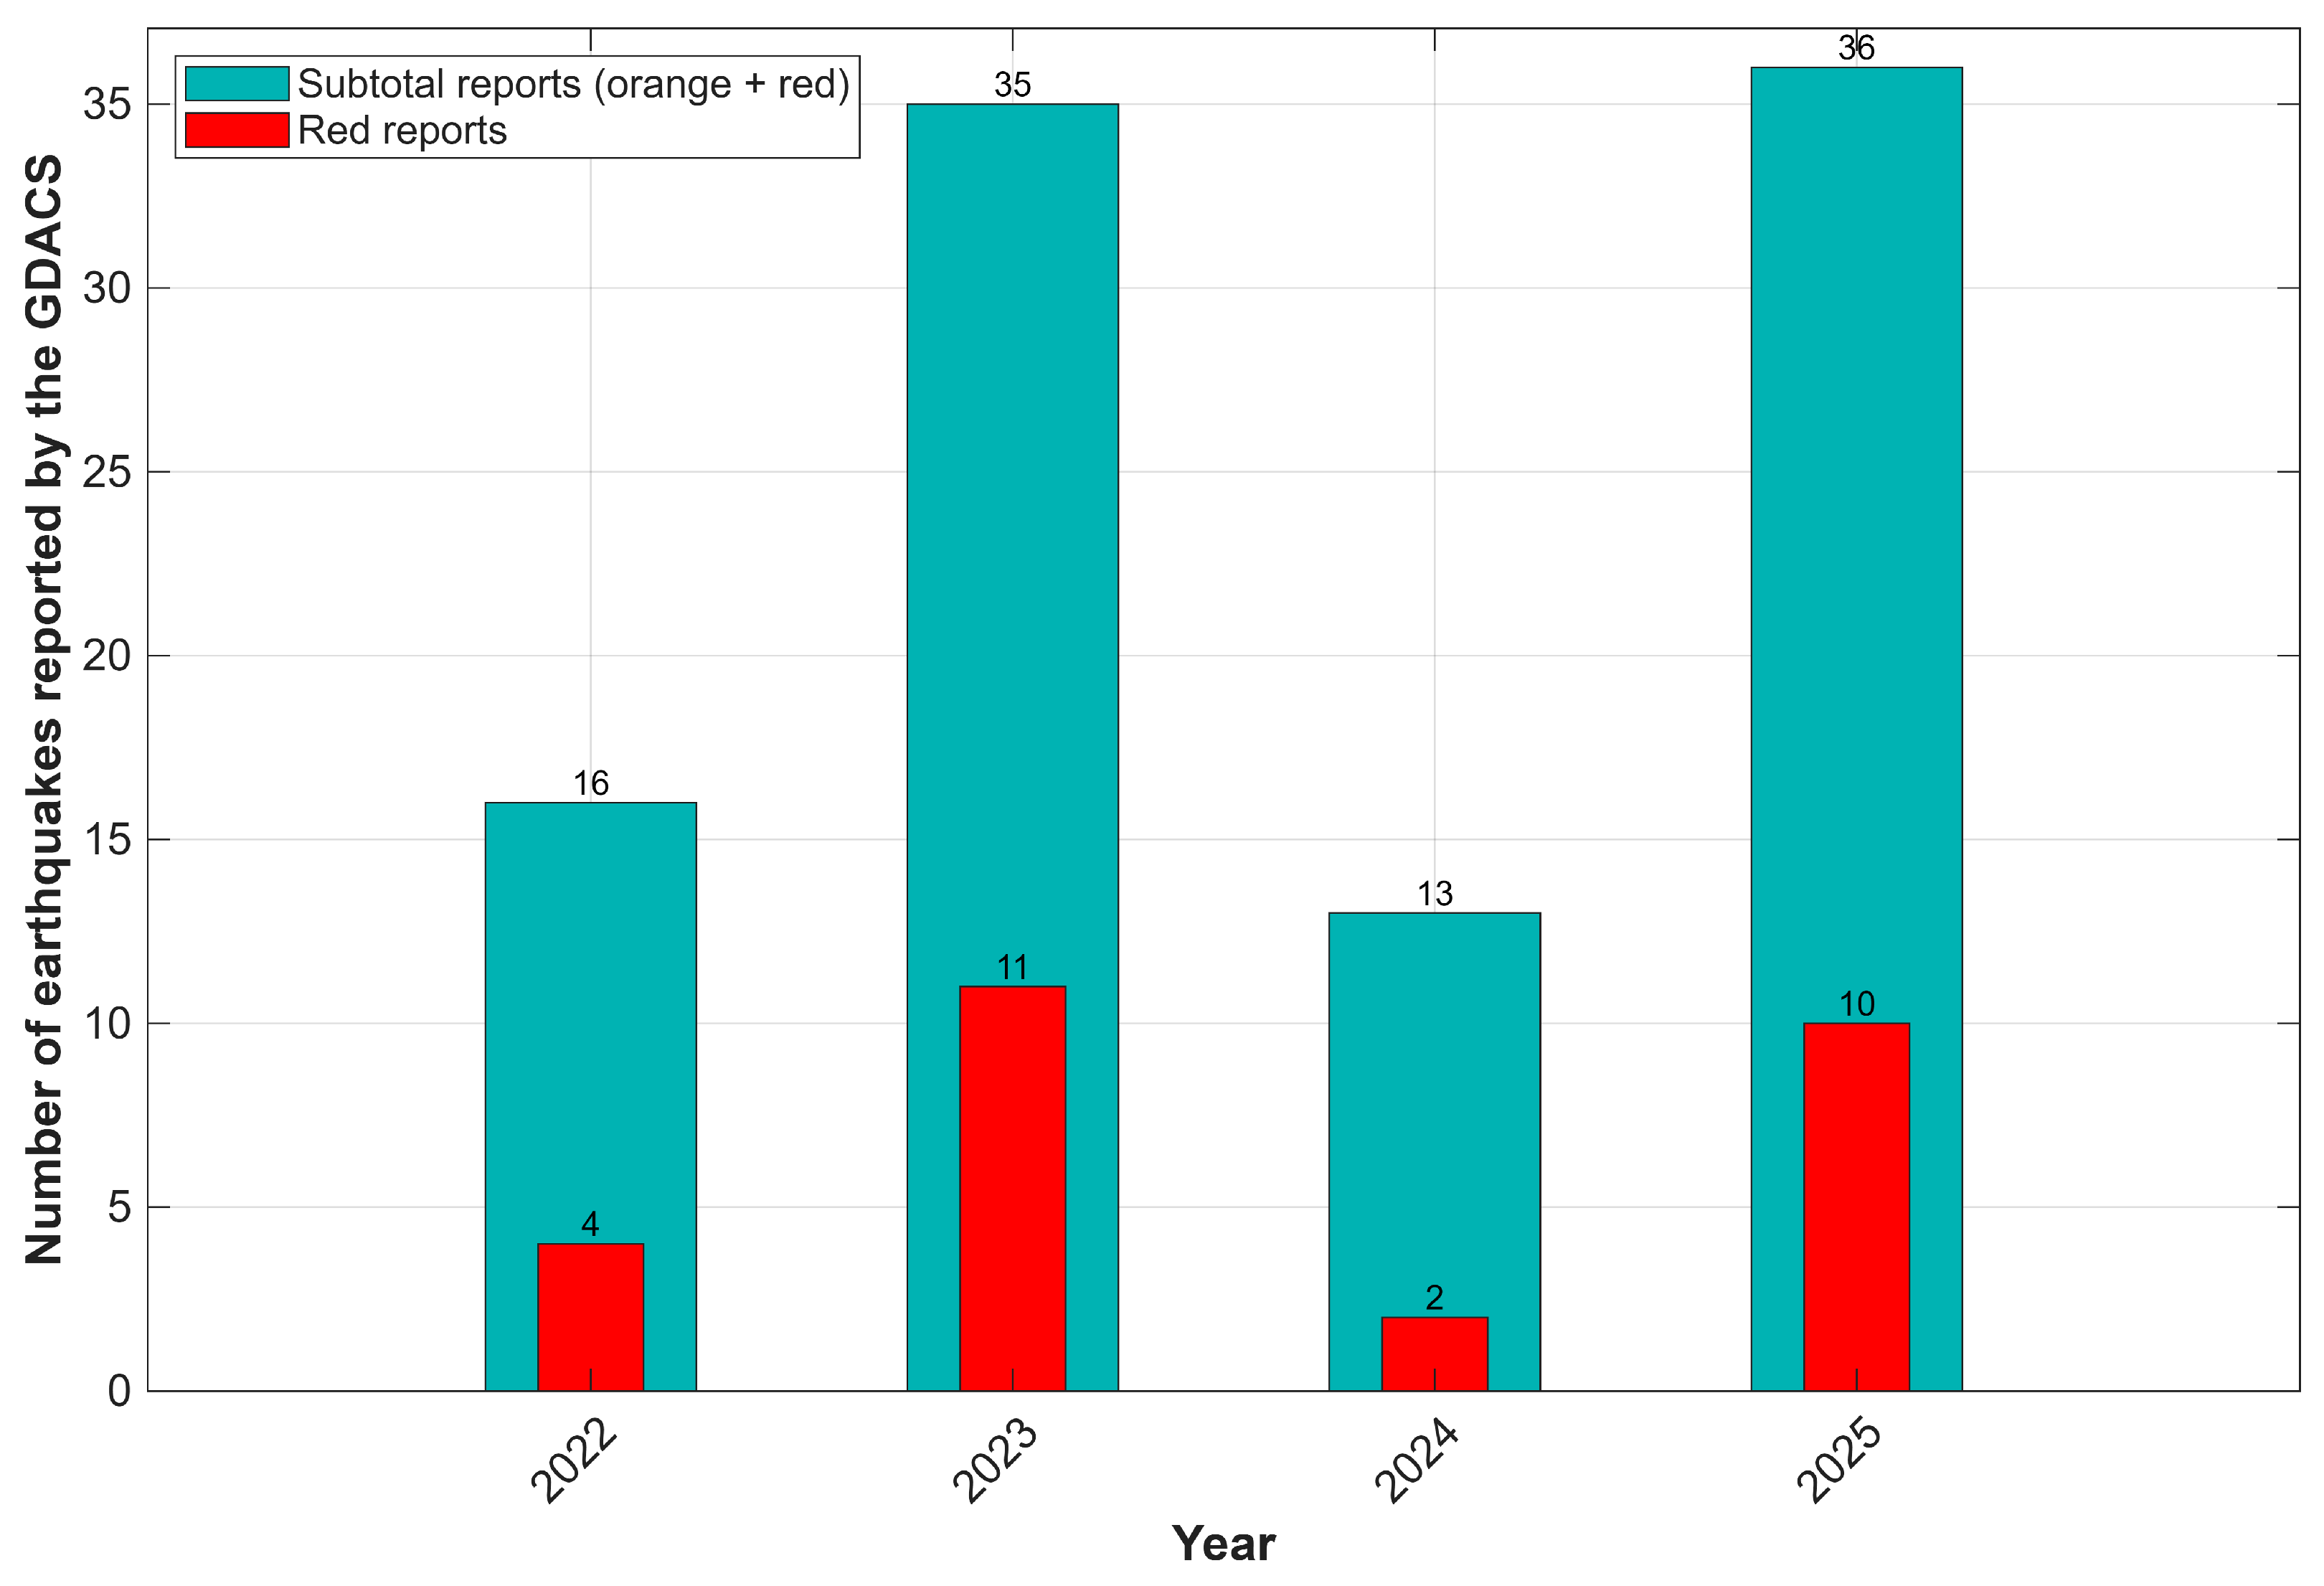

Disclaimer/Publisher’s Note: The statements, opinions and data contained in all publications are solely those of the individual author(s) and contributor(s) and not of MDPI and/or the editor(s). MDPI and/or the editor(s) disclaim responsibility for any injury to people or property resulting from any ideas, methods, instructions or products referred to in the content. |
© 2026 by the authors. Licensee MDPI, Basel, Switzerland. This article is an open access article distributed under the terms and conditions of the Creative Commons Attribution (CC BY) license.