


Abstract
Regional green development requires balancing anthropogenic carbon emissions (CEs) with vegetation carbon sequestration (VCS). Using the CASA model and plant photosynthesis equation, we estimated VCS from net primary productivity (NPP) and proposed a Carbon Balance Pressure Index (CBPI) to quantify the imbalance between carbon sources and sinks. Spatial analysis and a geographic detector were applied to examine influencing factors of CBPI across Sichuan–Chongqing from 2001 to 2017. Results show that CE increased by 178%, while VCS rose by 27%. Regional CBPI thus enhanced from 0.35 to 0.76, aligning with CE trends. The CBPI presented a clear west-low (0–0.2, except Panzhihua), center-high (peak 3.1 in Chengdu), moderate-east (0.1–0.8) pattern. Geographic detector reveals that economic development and urbanization accounted for 80% of CBPI heterogeneity, followed by transportation (65%). Energy-intensive industries dominated developed areas, while construction-land expansion prevailed in developing regions. This study underscores region-specific emission-sink pathways and provides an empirical basis for differentiated low-carbon strategies in similar rapidly urbanizing regions in China.
1. Introduction
Global industrialization, economic development, and humanity’s reliance on fossil fuels have accelerated carbon emissions, leading to increased global carbon dioxide (CO2) emissions [1]. Projections indicate global CO2 concentrations will reach 420 parts per million (ppm) by 2035 [2]. The Sixth Assessment Report (AR6) released by the Intergovernmental Panel on Climate Change (IPCC) further emphasizes that greenhouse gas emissions from human activities, particularly CO2, resulting from energy consumption and industrial production the primary drivers of global warming [3,4,5]. With the ongoing advancement of industrialization and urbanization, significant shifts in regional industrial structures and energy consumption patterns have occurred worldwide. Asia, in particular, has emerged as the largest contributor to carbon emissions linked to energy use [6,7]. As the world’s top carbon emitter, China has maintained the highest total carbon emission levels since 2008. In 2012, the country accounted for a quarter of global emissions; this proportion exceeded 25% by 2016 [8]. Through a series of measures, China has enhanced the ambition of its nationally determined contributions, advanced the low-carbon transformation of its energy sector, and achieved significant results [9].
To mitigate climate change at both regional and global scales and attain regional carbon neutrality, gaining insights into the dynamic processes of carbon sources and sinks is paramount [10]. A comprehensive consideration of their spatiotemporal differentiation, historical evolution trends, and driving factors constitutes an indispensable prerequisite for formulating regional low-carbon emission reduction policies and advancing green and low-carbon development, thereby bearing profound practical significance [11]. Vegetation carbon sequestration and carbon emissions represent the two core pathways for quantifying the dynamic balance of carbon budgets; an imbalance between these two processes will further amplify the impacts of climate change [12,13]. Existing carbon sequestration estimation methods mainly encompass plot survey approaches [14], remote sensing data inversion techniques [15], photosynthetically active radiation utilization models [16], and the Carnegie–Ames–Stanford Approach (CASA) model—with the latter leveraging multi-source remote sensing data to estimate vegetation net primary productivity (NPP) across large spatial scales and long time series at the global level [17]. Meanwhile, the carbon emission accounting and assessment system primarily includes urban green development efficiency [18], low-carbon economy evaluation indicators [19], low-carbon development capacity assessment metrics [20], carbon emissions [21], carbon emission intensity [22,23], carbon balance [24], carbon footprint [1,25,26], and carbon emission efficiency [27].
Previous studies have widely examined regional carbon dynamics using approaches such as decomposition analysis, net primary productivity (NPP)–based ecosystem models, and urban carbon footprint assessments. Decomposition and footprint methods mainly focus on emission-side processes, whereas NPP-based models emphasize vegetation carbon sequestration, often treating carbon sources and sinks separately. Many scholars have examined regional carbon emissions, vegetation dynamics, and urbanization processes, often focusing on individual components of the carbon cycle or specific drivers. Carbon accounting and remote sensing research have improved estimates of emissions and vegetation carbon sequestration, while parallel studies have explored the roles of urban expansion, energy use, and climate factors. However, these strands are frequently treated in isolation, with limited integration of carbon sources and sinks and insufficient attention to their combined spatial heterogeneity and associated uncertainties. This gap highlights the need for integrative, spatially explicit frameworks that jointly assess emission–sequestration imbalances in rapidly urbanizing regions. As the ratio of carbon emissions to vegetation carbon sequestration, the Carbon Balance Pressure Index (CBPI) directly reflects the pressure imposed by carbon imbalance on regional ecosystems and serves as a key indicator for analyzing regional carbon environmental stress [28].
Cities serve as the fundamental units for carbon emission management, development model optimization, and the implementation of sustainable development policies in China [29]. They consume 60% to 80% of global energy [30] and account for nearly 75% of carbon emissions [31]. Regional disparities in carbon emissions stem from multiple intrinsic drivers, including the characteristics of economic development and patterns of human activity [32]. This study focused on four major regions in the Sichuan–Chongqing area: Northeastern Sichuan, Southern Sichuan and Chongqing, Western Sichuan, and the Chengdu Plain. A CBPI assessment system was constructed to systematically analyze the spatiotemporal evolution patterns of vegetation carbon sequestration per unit area, carbon emissions per unit area, and CBPI across these regions from 2001 to 2017. Employing the geographic detector method, the study examined the spatial associations between CBPI and human activities and meteorological factors, assessed the ecological pressure levels induced by varying regional carbon emission growth, and subsequently explored tailored green and low-carbon development pathways. Ultimately, this research aimed to reveal the evolution mechanism of carbon environmental pressure in the Sichuan–Chongqing region, provided theoretical support for moving beyond the “one-size-fits-all” mitigation approaches, thereby contributing to a more nuanced understanding of low-carbon development pathways.
2. Materials and Methods
2.1. Overview of the Study Area
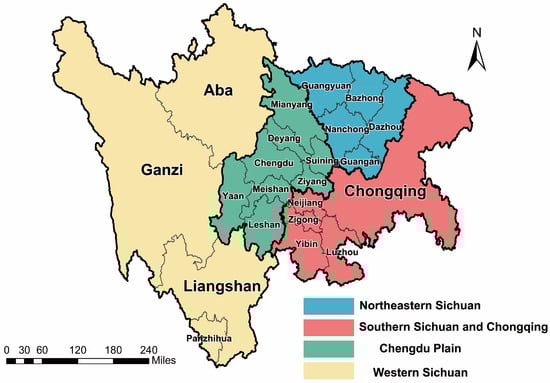
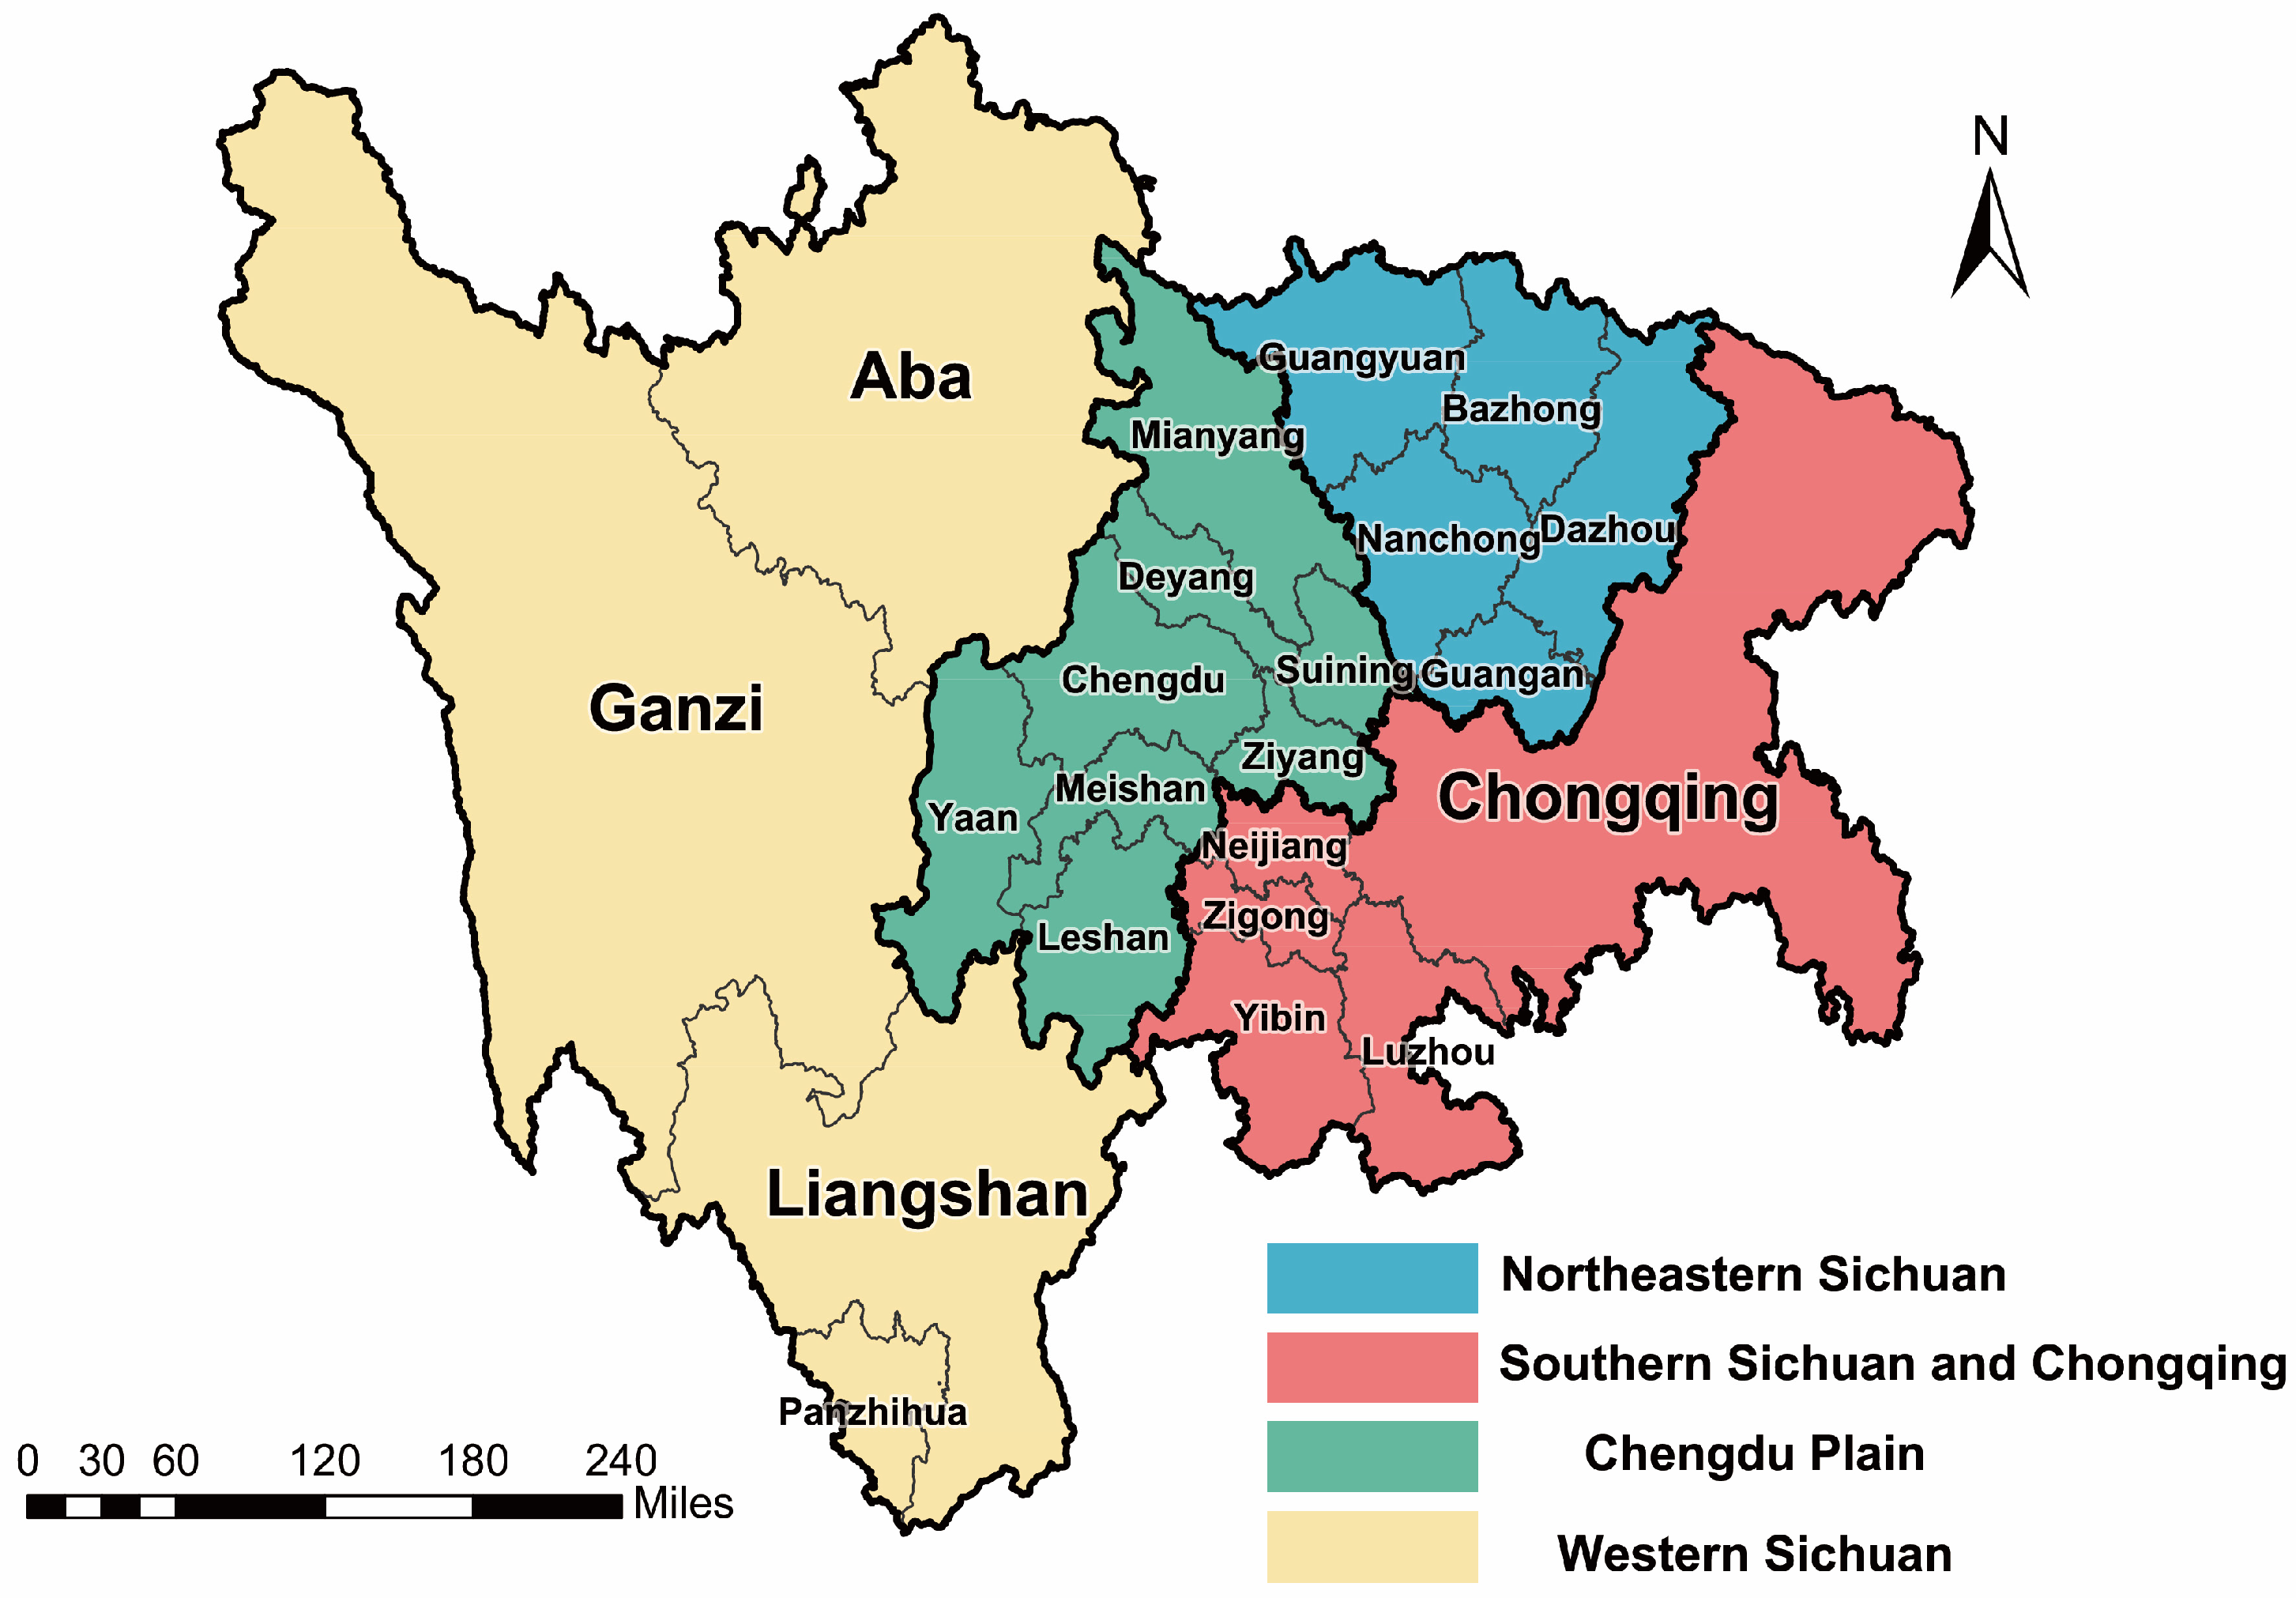
The Sichuan–Chongqing region, namely Sichuan Province and Chongqing Municipality, is located between 97°21′ E and 110°11′ E longitude, and 26°03′ N and 34°19′ N latitude in Southwest China. This region lies in the transition zone between China’s first and second topographic steps, featuring a prominent terrain that slopes sharply from west to east. Bounded by the Longmen Mountains, Daxiangling Mountains, and Daliang Mountains, the eastern part of the Sichuan–Chongqing region is dominated by basins and hills, with a warm and humid climate (warm winters and hot summers) typical of a subtropical monsoon climate. In contrast, the western part is mainly composed of plateaus and mountains, characterized by cold winters and cool summers with distinct vertical variations in plateau climate. The complex terrain and the influence of different monsoon circulation patterns result in a highly complex and diverse climate in the Sichuan–Chongqing region with significant spatial differences. For this study, the Sichuan–Chongqing region was divided into four sub-regions: Northeastern Sichuan (Guangyuan, Nanchong, Bazhong, Guang’an, Dazhou), Southern Sichuan and Chongqing (Chongqing, Neijiang, Zigong, Yibin, Luzhou), Western Sichuan (Panzhihua, Aba Tibetan and Qiang Autonomous Prefecture, Ganzi Tibetan Autonomous Prefecture, Liangshan Yi Autonomous Prefecture), and the Chengdu Plain (Chengdu, Deyang, Meishan, Ya’an, Mianyang, Leshan, Ziyang, Suining) in Figure 1. Taking cities in each sub-region as research units, this study explored the regionally differentiated distribution of the Carbon Balance Pressure Index (CBPI) in the Sichuan–Chongqing region.
Figure 1.
Schematic diagram of the study area and urban distribution.
2.2. Data
2.2.1. Carbon Emission Data
The carbon emission dataset was sourced from Carbon Emission Accounts and Datasets (CEADs, https://www.ceads.net.cn/data/ (accessed on 25 December 2023)) [33]. The CEADs study employed a Particle Swarm Optimization-Backpropagation (PSO-BP) algorithm to standardize the scale of DMSP/OLS and NPP/VIIRS imagery. Based on nighttime illumination data, the PSO-BP algorithm was applied to downscale provincial-level energy carbon emissions, calculating county-level carbon emissions. Based on the county-level carbon emission data studied, this research compiled and statistically summarized the carbon emission data for each city/prefecture in the Sichuan–Chongqing region from 2001 to 2017, calculating the annual carbon emissions per unit area for each region.
2.2.2. Vegetation Carbon Sequestration Data
Based on the CASA model, the net primary productivity (NPP) dataset was estimated by integrating vegetation absorption of photosynthetically active radiation () and its photosynthetic efficiency () [34,35], utilizing land use, NDVI, and meteorological data [36]. Land use data was sourced from the MODIS (Moderate Resolution Imaging Spectroradiometer) (https://modis.gsfc.nasa.gov/ (accessed on 29 October 2023)) Earth observation product MCD12Q1, featuring a spatial resolution of 500 m and providing annual global land cover classification information. The NDVI (Normalized Difference Vegetation Index) dataset was derived from MODIS’s MOD13A3 product with a spatial resolution of 1 km. This product effectively characterizes global vegetation status and processes, serving as a crucial indicator for monitoring ground vegetation changes.
Carbon elements in organic matter exhibit a 2.2-fold relationship per unit mass [37]. Based on the chemical equation for plant photosynthesis, the ratio of generated organic matter to fixed carbon dioxide is 1:1.63. Utilizing this relationship, NPP data were converted to vegetation carbon sequestration (VCS) data (mass of carbon dioxide fixed per unit area), yielding vegetation carbon sequestration raster data. Further details regarding the calculation can be found in the study by Feng [36].
ArcGIS 10.8 was employed to perform regional statistics on the VCS raster data, yielding the vegetation carbon sequestration per unit area for each city in the Sichuan–Chongqing region.
2.2.3. Statistical Data
The statistical data included five types: population density, per capita regional GDP, urbanization rate, highway passenger turnover, and highway freight turnover. Data sources are the National Bureau of Statistics (http://www.stats.gov.cn/ (accessed on 9 March 2024)) and the statistical yearbooks of respective provinces (municipalities) for the corresponding years. Population density, defined as the ratio of registered population at year-end to administrative area, indicates that shifts in residents’ lifestyles and consumption patterns will alter carbon emission intensity [38]. Per capita regional GDP, reflecting regional economic growth, alters residents’ production and consumption patterns, positively contributing to regional carbon emission levels [39,40,41]. The urbanization rate, defined as the proportion of permanent urban residents to the total population, indicates a region’s urbanization level [42]. Rapid urbanization increases carbon dioxide emissions in both the short and long term. Road passenger turnover, defined as the sum of the product of transported passengers multiplied by distance (km), and road freight turnover, defined as the sum of the product of transported goods (tons) multiplied by distance (km), indicate that a transportation structure dominated by road transport promotes carbon emissions [43], with China being a major source of transport CO2 emissions [44]. Therefore, these five factors were selected as anthropogenic factors to examine their influence on the spatial heterogeneity of CBPI in the Sichuan–Chongqing region.
2.2.4. Meteorological Data
Temperature and precipitation datasets were sourced from the National Tibetan Plateau Data Center (https://data.tpdc.ac.cn/home (accessed on 7 March 2024)) [45]. The China 1 km resolution monthly precipitation dataset and China 1 km resolution monthly mean temperature dataset span the period from 1901 to 2022. These datasets were downscaled for China using the Delta spatial downscaling scheme, based on the global 0.5° climate dataset released by CRU and the global high-resolution climate dataset released by WorldClim. Validation using data from 496 independent meteorological observation stations yielded reliable results. Temperature and precipitation influence regional vegetation carbon sequestration capacity changes [46,47]. Therefore, annual mean temperature and annual cumulative precipitation were selected as meteorological factors to examine their impact on the spatial heterogeneity of the CBPI in the Sichuan–Chongqing region.
The sunshine duration data were obtained from the China Meteorological Data Network (https://data.cma.cn (accessed on 20 October 2023)) daily observation records, covering the period from 1 January 2001 to 31 December 2020. After quality control processing, the monthly radiation data were calculated from the daily sunshine duration, and the monthly radiation data of the Sichuan–Chongqing region were obtained through interpolation.
2.3. Research Method
2.3.1. Carbon Balance Pressure Index
Energy consumption and carbon emissions are two of the key factors in climate change, while vegetation plays a vital role in maintaining the Earth’s ecological balance [48]. Vegetation’s net primary productivity (NPP) is considered a crucial indicator of large-scale carbon sinks, aiding in understanding vegetation’s contribution to the carbon cycle [49]. Therefore, introducing the Carbon Balance Pressure Index (CBPI) to comprehensively consider the dynamic changes of carbon sources and sinks enables a more holistic assessment of ecosystem responses and impacts on carbon emissions. This better characterizes how carbon emissions at a specific time and location influence ecosystem pressure changes, thereby providing stronger guidance for formulating and implementing relevant policies and measures [1]. It is particularly suitable for regions with stark ecological and socioeconomic contrasts, such as the Sichuan–Chongqing area. Carbon pressure is jointly driven by intense human activities in urban cores and significant carbon sink capacity in peripheral mountainous areas, whereas indicators focusing solely on emissions or carbon intensity may mask ecosystems’ compensatory role. A comparative overview of indicators was provided in Table S1 in the Supplementary Materials.
CE represents carbon emissions within a specific timeframe and region, VCS denotes vegetation carbon sequestration within the same timeframe and region, and CBPI is the ratio of local carbon emissions to vegetation carbon sequestration.
2.3.2. Geodetector
Geodetector is a statistical method designed to reveal the intrinsic drivers of spatial heterogeneity. Its statistic q quantifies spatial heterogeneity and serves as a tool to explain both single-factor impacts and multi-factor interactions [50]. Unlike regression-based or machine learning approaches, Geodetector does not assume linear relationships and provides directly interpretable measures of factor explanatory power. While machine learning models are effective for prediction, it is limited by explanatory power. This study employed Geodetector to comprehensively analyze the effects of human and meteorological factors on the Carbon Balance Pressure Index (CBPI) in the Sichuan–Chongqing region. By comparing q-values derived from single factors and combined factors, we can identify the presence of inter-factor interactions and determine whether changes in the dependent variable (CBPI) are collectively influenced by multiple factors. Types of interaction between two factors are shown in Table 1. Detecting such interactions enhances our comprehensive understanding of how influencing factors shape the spatial differentiation of carbon sources and carbon sinks. The study selected influencing factors from both human activities and meteorological elements. The anthropogenic factors included population density (X1), per capita regional GDP (X2), highway passenger turnover (X3), highway freight turnover (X4), and urbanization rate (X5). The meteorological factors comprised annual mean temperature (X6) and annual cumulative precipitation (X7). A comparative overview of analysis methods was provided in Table S2 in the Supplementary Materials.
where = 1, …, represents the stratification of variable Y (CBPI) or factor X (influencing factors), i.e., classification or partitioning; and denote the number of units in stratum and the entire study area, respectively; and are the variances of Y values in stratum h and the entire area, respectively; is the sum of within-stratum variances, and is the total variance across all strata. The statistic ranges from 0 to 1, with higher values indicating stronger explanatory power of the factor for the spatial distribution of CBPI.
Table 1.
Types of interaction between two factors.
2.3.3. Generalized Additive Models
Generalized additive models (GAMs) are one of the main modeling tools for data analysis. GAMs can efficiently combine different types of fixed, random, and smooth terms in the linear predictor of a regression model to account for different types of effects. The principal advantage of GAMs lies in its ability to represent complex, nonlinear effects via smooth functions, providing a flexible yet interpretable framework for capturing unknown functional forms. This flexibility enables improved predictive performance compared with fully parametric models, particularly in settings characterized by heterogeneous or weakly specified covariate effects. However, such benefits rely on the appropriate representation of smooth components and the careful selection of smoothing parameters, which together govern the trade-off between model fidelity and overfitting. In this study, we used GAMs to quantitatively analyze the relationship between the main explanatory factors and CBPI.
3. Results
3.1. Spatiotemporal Variation Characteristics of the Carbon Source and Carbon Sink in the Sichuan–Chongqing Region
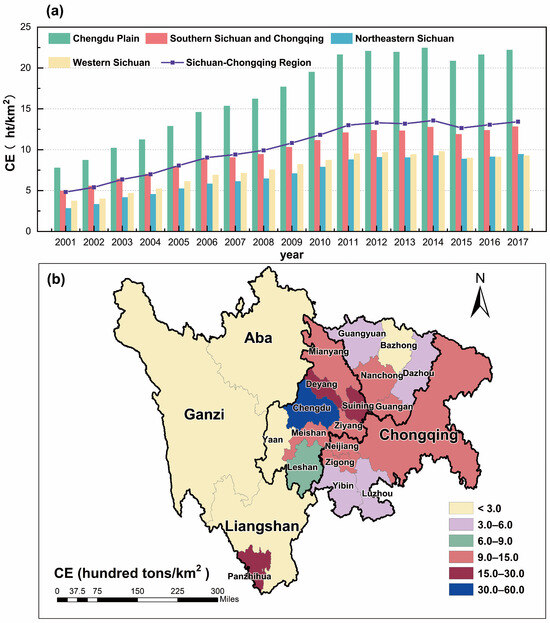
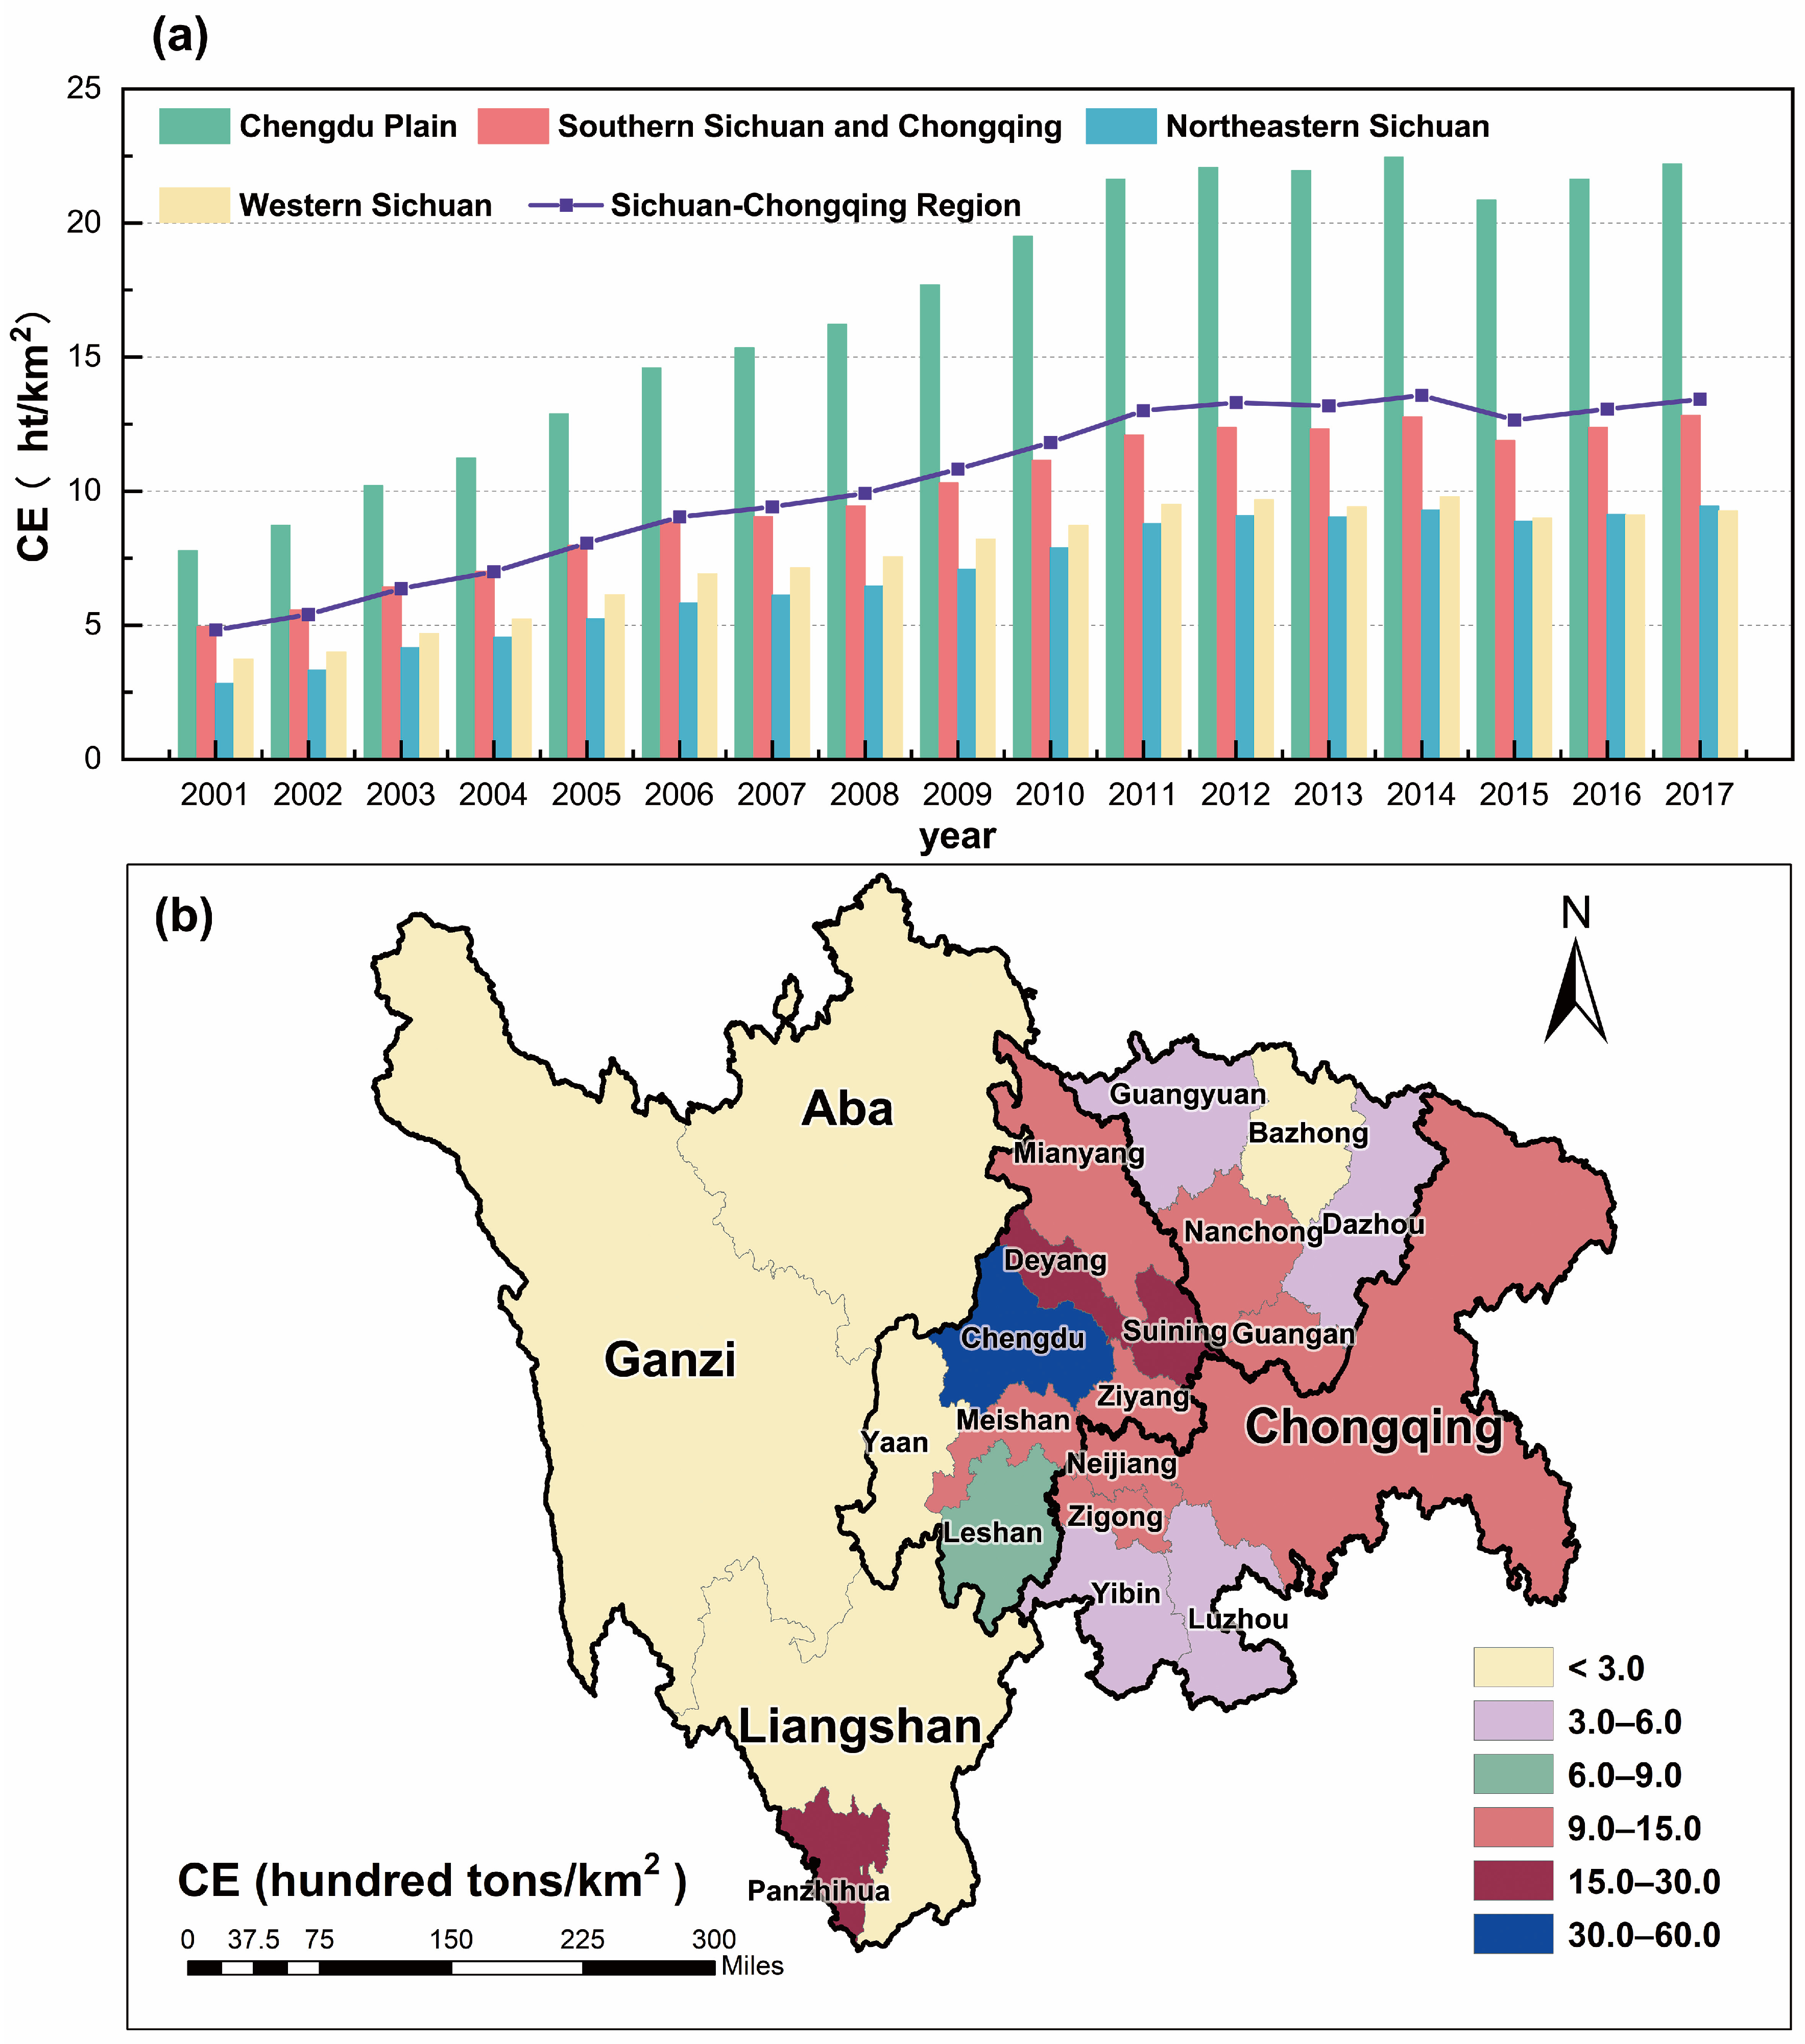
In Figure 2, carbon emission (CE) across the Sichuan–Chongqing region and its subregions exhibited sustained rapid growth during the study period (2001–2017) with a 178.34% increasing. Notably, the Chengdu Plain and the northeastern Sichuan demonstrated both higher growth rates and larger total emissions relative to other subregions: Between 2001 and 2017, the regional average CE surged from 7.78 ht/km2 to 22.20 ht/km2, marking a 185.37% increase in the Chengdu Plain. This trend was highly correlated with the region’s developmental trajectory: After 2000, core cities (e.g., Chengdu and Chongqing) entered accelerated phases of industrialization and urbanization. The expansion of industrial production capacity and the rapid construction of urban infrastructure directly drove substantial growth in total energy consumption. Spatially, CE exhibited a highly uneven distribution, characterized by a pattern of “core concentration and peripheral decline”. Eastern subregions showed higher carbon intensity than western counterparts, with the Chengdu Plain’s CE nearly doubling that of other zones. Cities in the southern Sichuan and Chongqing (e.g., Chongqing, Yibin) and northeastern Sichuan (e.g., Nanchong, Dazhou) fell within the 9.0–15.0 ht/km2 range. This spatial divergence reflected the functional and industrial heterogeneity of the region: As the economic and population core of Sichuan–Chongqing, the Chengdu Plain hosted highly concentrated clusters of energy-intensive industries and urban populations, which amplified energy demand. By contrast, western Sichuan (Ganzi, Aba) prioritized ecological conservation and tourism, resulting in a weak industrial base and low energy consumption. Parts of northeastern and southern Sichuan relied on agriculture and light industry, leading to relatively low CE. Notably, Chengdu led in average CE (47.18 ht/km2) in 2001–2017, significantly outpacing other cities, and its spillover effects also increased CE in surrounding cities.
Figure 2.
The spatiotemporal distribution characteristics of carbon emissions (CE) per unit area. (a) Temporal variation of CE in Sichuan–Chongqing subregions from 2001 to 2017. (b) Spatial distribution of average CE in Sichuan–Chongqing from 2001 to 2017.
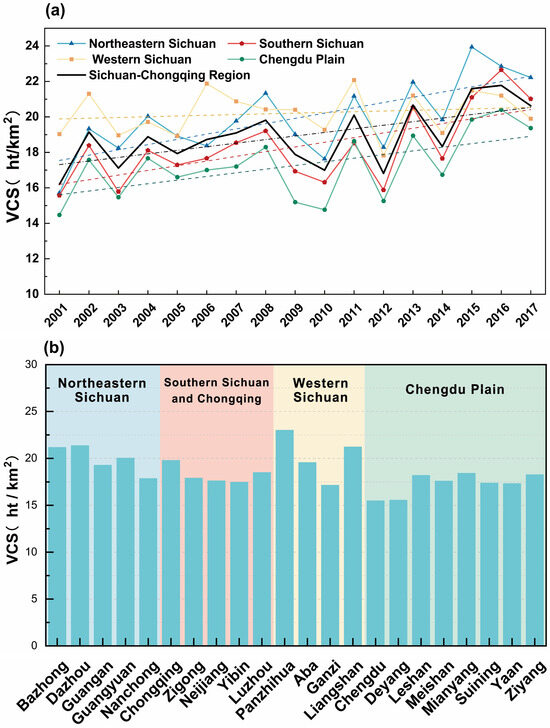
In Figure 3, the vegetation carbon sequestration capacity of the Sichuan–Chongqing region exhibited a fluctuating upward trend, with the total regional vegetation carbon sequestration (VCS) increasing by 27.34%. The positive impacts of ecological restoration policies gradually emerged, though interannual variability remained pronounced—driven primarily by fluctuations in climatic conditions and natural vegetation growth cycles. At the subregional scale, northeastern Sichuan registered the highest growth rate in carbon sequestration (41.42%), followed by Southern Sichuan and Chongqing (34.92%). Notably, western Sichuan—despite its inherently favorable vegetation base—exhibited the slowest growth rate (4.56%). This paradoxical pattern may be attributed to vegetation loss induced by regional development expansion. Even so, western Sichuan’s autonomous prefectures functioned as the primary carbon sink contributors across the entire Sichuan–Chongqing region in terms of total VCS. Panzhihua City displayed a dual high-carbon-emission, high-carbon-sink profile: while its carbon emission intensity was relatively elevated, its vegetation carbon sequestration capacity exceeded 22 ht/km2, which was supported by extensive natural vegetation with high coverage rates. In contrast, urban agglomerations demonstrated relatively lower VCS levels: the expansion of built-up land and vegetation degradation associated with urban development reduced natural vegetation coverage, thereby weakening local carbon sink capacity.
Figure 3.
The spatiotemporal distribution characteristics of vegetation carbon sequestration (VCS) per unit area. (a) Temporal variation of VCS in Sichuan–Chongqing subregions from 2001 to 2017. (b) Distribution of average VCS in Sichuan–Chongqing from 2001 to 2017.
3.2. Temporal Variation Characteristics of the Carbon Balance Pressure Index (CBPI) in the Sichuan–Chongqing Region
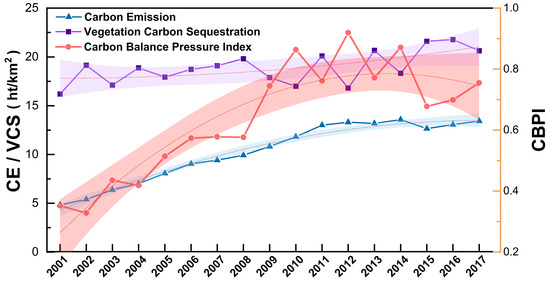
As shown in Figure 4, the Carbon Balance Pressure Index (CBPI) for the Sichuan–Chongqing region exhibited an overall trend of “rapid growth followed by high-level fluctuations” between 2001 and 2017. The index rose from 0.35 in 2001 to 0.76 in 2017, peaking at 0.92 in 2012. Under the combined influence of climate change and a shift in vegetation coverage, the carbon sequestration capacity per unit area exhibited overall minor fluctuations with limited amplitude. The trend of CBPI was closely aligned with the evolution of carbon emissions per unit area, indicating that regional ecological and environmental pressures primarily stemmed from carbon emissions, while the mitigating effect of vegetation carbon sequestration remained relatively limited.
Figure 4.
The temporal trends of carbon emissions per unit area, vegetation carbon sequestration per unit area, and carbon balance pressure index in Sichuan and Chongqing from 2001 to 2017.
During the period from 2001 to 2010, the CBPI in the Sichuan–Chongqing region showed a rapid upward trend, with an average annual growth rate of 10.50%, particularly marked between 2008 and 2010. At this stage, the overall industrial structure in the region remained relatively backward, with relatively slow industrialization and urbanization processes. Economic development still relied primarily on an extensive model, where traditional industries accounted for a significant share, leading to prominent resource consumption and environmental pressures. During the 11th Five-Year Plan period, the region focused on optimizing its economic structure and enhancing development quality. It promoted internal adjustments within high-energy-consuming industries, guided industrial restructuring and upgrading with green and low-carbon principles, and gradually shifted from an extensive to a resource-efficient industrial model. This involved phasing out traditional processes characterized by high energy consumption and pollution. Simultaneously, the region actively developed energy bases, promoted clean energy development, accelerated the green and low-carbon transition, orderly developed hydropower, actively advanced nuclear power, and promoted the utilization of renewable energy sources such as wind, solar, and biomass energy to foster a circular economy. Advances in energy technology improved energy utilization efficiency, effectively reduced regional carbon emissions, and contributed to building a resource-conserving and environmentally friendly society [51].
From 2011 to 2017, the growth rate of the Carbon Balance Pressure Index (CBPI) in the Sichuan–Chongqing region slowed, fluctuating between 0.68 and 0.92 with significant volatility. This was primarily attributable to the advancement of diversified and clean energy development during the 12th Five-Year Plan period, particularly the focused construction of large hydropower stations in Southwest China, which enhanced the region’s clean energy supply capacity. By reducing the consumption share of fossil fuels like coal and oil while increasing the proportion of clean energy sources such as electricity and wind power, carbon emissions from fossil fuels were effectively curtailed [51,52]. Furthermore, the southward shift in economic centers during this period spurred regional economic development, which also alleviated the pressure of carbon emissions on ecosystems to some extent [39,53].
3.3. Spatial Variation Characteristics of the Carbon Balance Pressure Index (CBPI) in the Sichuan–Chongqing Region
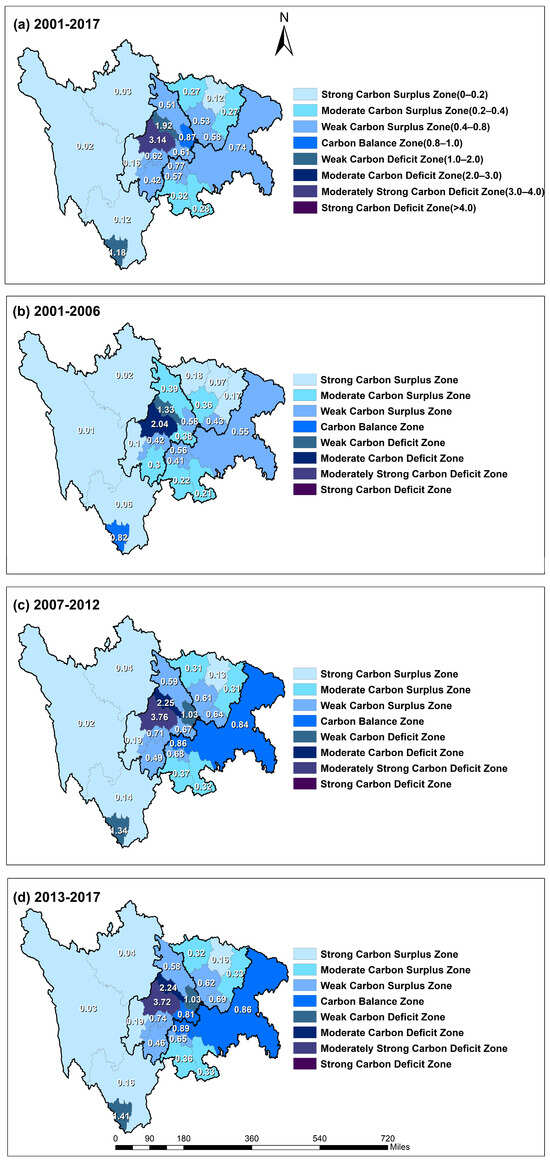
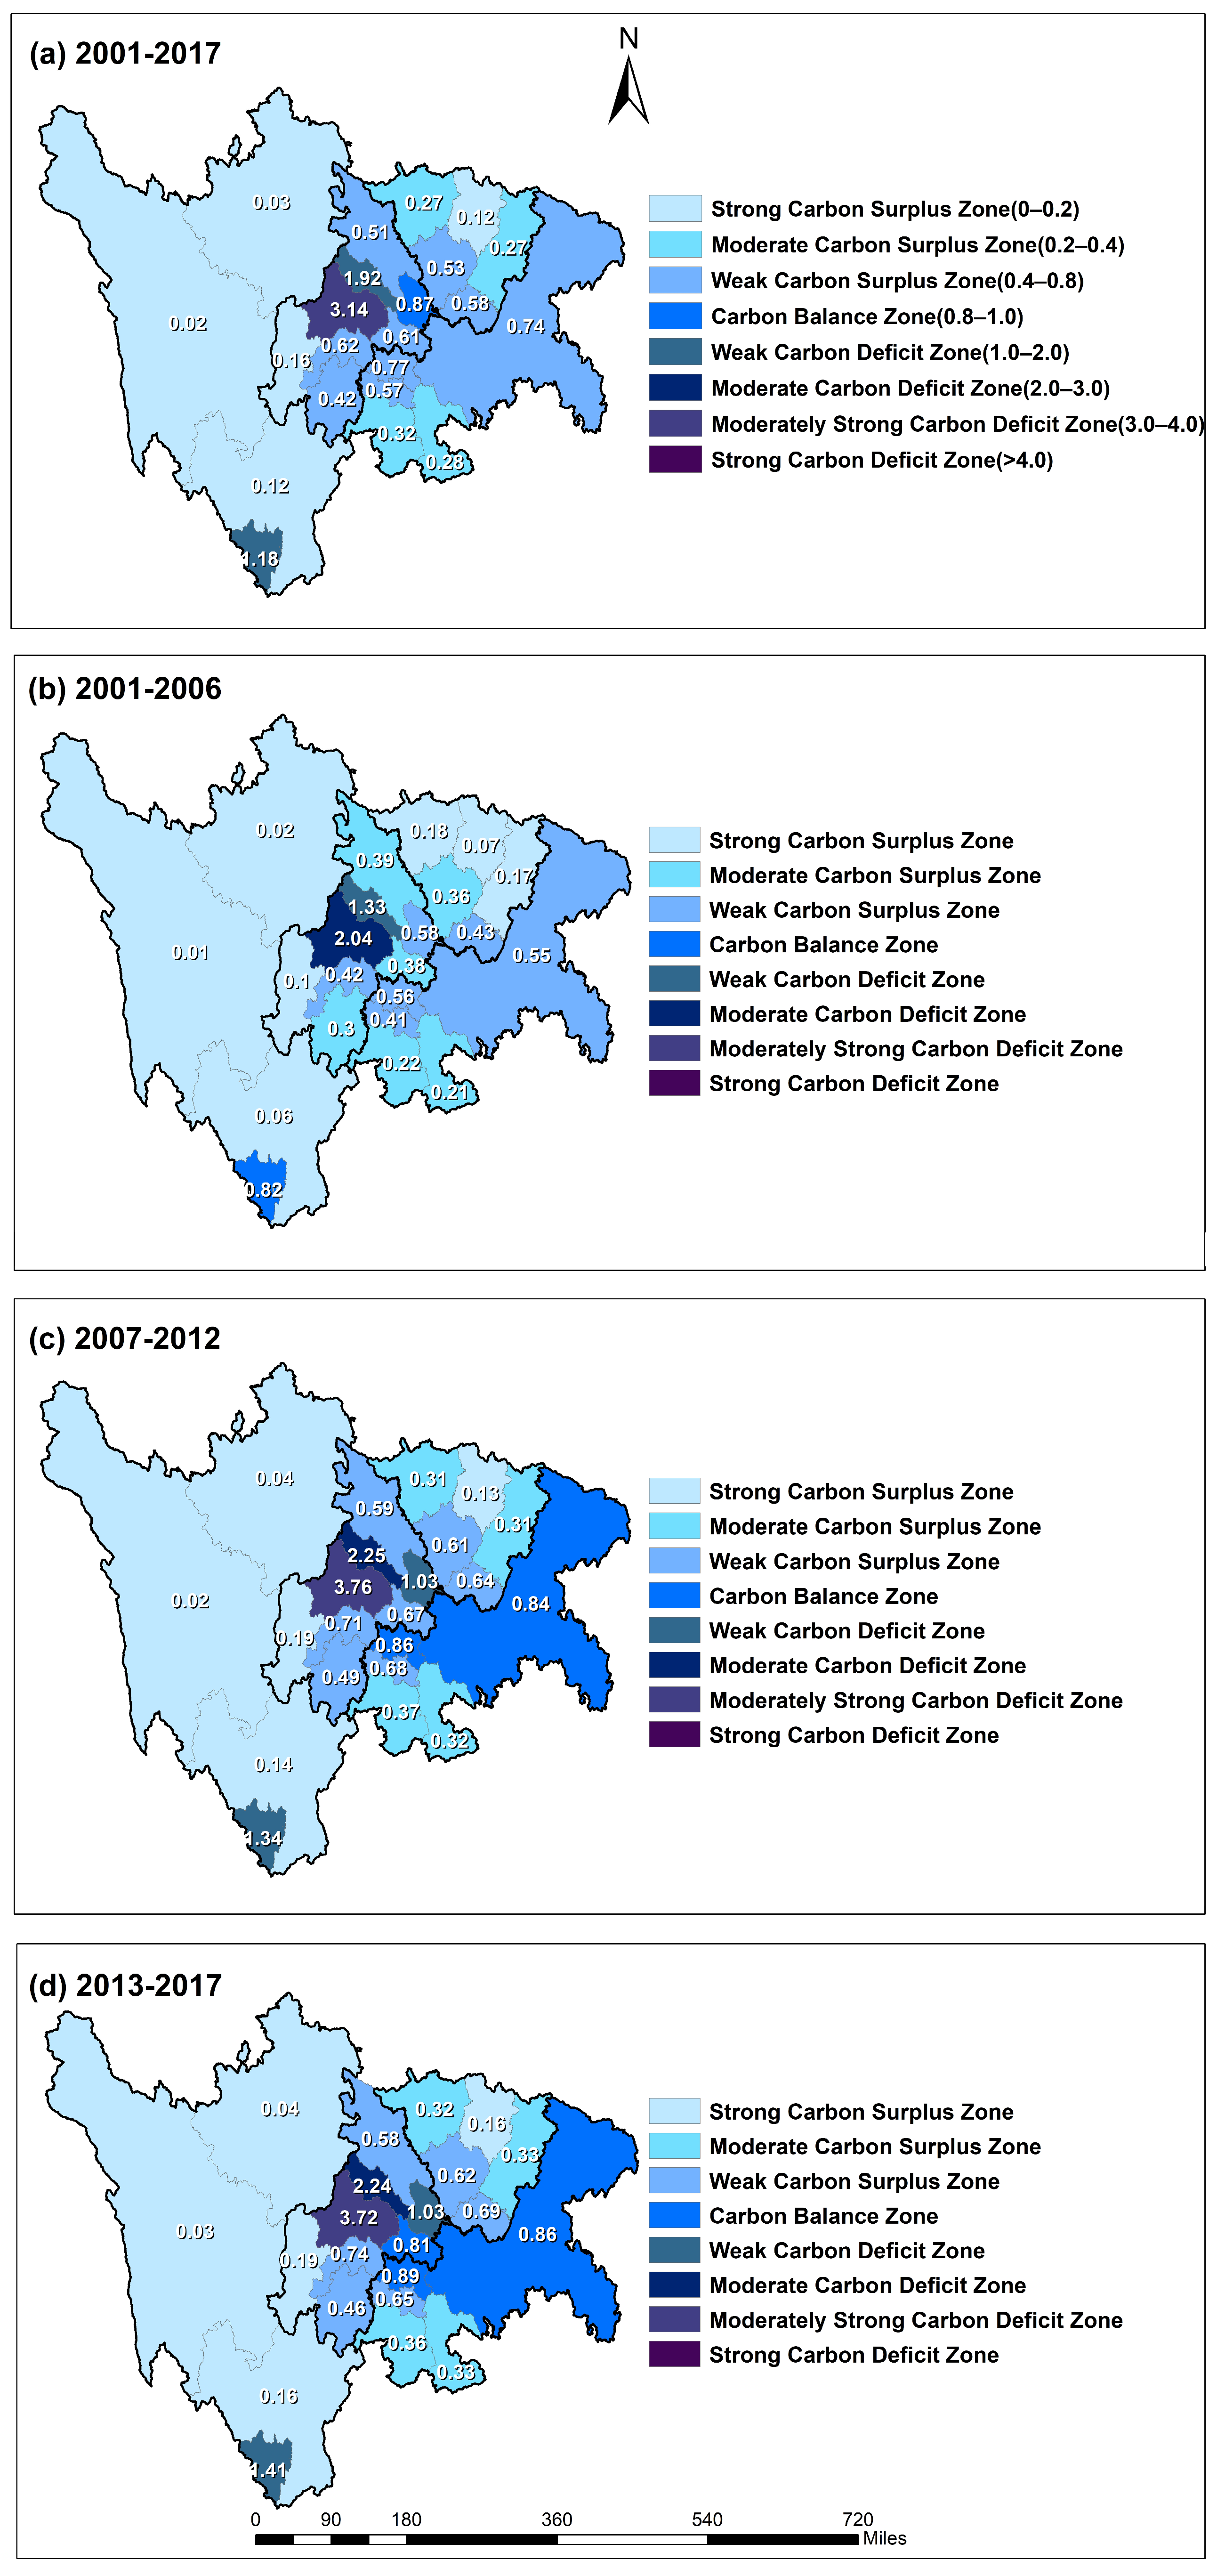
As shown in Figure 5a, the CBPI in the Sichuan–Chongqing region exhibited a “light-west, heavy-center, moderate-east” distribution pattern, with the Chengdu Plain as the high-value zone and Chengdu City as the pressure core (CBPI as high as 3.14), demonstrating a distinct spatial radiation effect. Chengdu, as the densely populated hub of Sichuan–Chongqing, experienced a “blockage effect” from population concentration. This led to urban sprawl, increased energy consumption, industrial growth, and transportation congestion, driving carbon emissions upward. Economic expansion and urban sprawl further stimulate expansive land use changes [54], altering vegetation coverage and weakening ecological carrying capacity and carbon sequestration capabilities [30]. Consequently, Chengdu exhibited the highest CBPI value in the region. Forest resources are unevenly distributed across Sichuan–Chongqing, with the western Sichuan highlands and plateaus being the richest areas. Natural forests possess stronger carbon sequestration capabilities than planted forests, and natural forests are primarily distributed in western Sichuan [55]. Consequently, the region’s carbon emission increases were offset by the carbon sequestration effect of vegetation. Consequently, western Sichuan predominantly exhibited carbon surplus zones with relatively low emission reduction pressure. However, Panzhihua City in western Sichuan faced significant carbon pressure, primarily due to its abundant coal and iron resources. The city prioritizes steel industry development, with a high proportion of industrial land use. Its urban economic growth relies heavily on energy resources, and its regional GDP ranks first in the Sichuan–Chongqing region.
Figure 5.
Spatial distribution of average carbon balance pressure index in Sichuan and Chongqing.
As shown in Figure 5b, from 2001 to 2006, Chengdu and Deyang were classified as moderate carbon deficit zones and weak carbon deficit zones, with CBPI values of 2.04 and 1.33, respectively. The Chengdu Plain region exhibited a more severe carbon imbalance than other areas due to its large carbon emission baseline. At this stage, ecological engineering projects were in their early phases, and the carbon sequestration effect of young vegetation was not yet significant [56]. The expansion scale of urban land in mainland China was 0.8 million km2, at an annual expansion rate of 5.47% from 2000 to 2005, which was the period of rapid development [57]. The post-2000 period marked a new historical phase for China’s urban planning and industrialization processes, wherein the accelerated pace of urban and township development was fueled by the nation’s high-speed economic expansion. Consequently, the annual increasing rate of CBPI was 8.65%. The northeastern Sichuan region exhibited a highly significant upward trend in vegetation carbon sequestration, predominantly functioning as carbon surplus zones. However, its carbon emissions per unit area showed an annual growth rate of 12.74%, and its carbon pressure exhibited the fastest annual growth rate (9.74%). Pollution reduction and carbon emission managements in economically developed regions had effectively curbed carbon pressure growth in controlled areas, while accelerated urbanization in economically developing regions had exacerbated carbon imbalance.
From 2007 to 2012, the number of regions experiencing carbon imbalance increased from two to four in Figure 5c. Chengdu and Deyang faced increasingly severe carbon pressures, while Panzhihua and Suining shifted from carbon surpluses to deficits. Carbon sequestration weakened across all regions, with emissions trending upward. Regional economic growth and industrial development inevitably intensified ecological pressures through increased carbon emissions. The average annual growth rate of the CBPI slowed during this period compared to other timeframes. Western Sichuan exhibited relatively stable CBPI changes. While regional carbon emissions increased somewhat due to rising economic levels and transportation industry development, the area maintained a carbon surplus status. This was largely attributable to its high vegetation coverage and strong carbon sequestration capacity. Although regional economic development inevitably imposes ecological and environmental carbon pressures, green transformation can be promoted through industrial restructuring and technological advancement to offset the incremental emissions generated by economic growth.
From 2013 to 2017, the overall carbon imbalance within the Sichuan–Chongqing region intensified, with significant regional disparities in Figure 5d. The Chengdu Plain, as a high-carbon-pressure zone, exhibited a CBPI significantly higher than other areas. Chengdu, serving as the core of regional economic development and a new first-tier city, demonstrated a markedly larger population size and industrial concentration compared to surrounding cities. Consequently, it emerged as a strong carbon deficit zone with a CBPI as high as 3.72. Driven by the Chengdu-Chongqing Economic Circle, the intensity of industrial development and economic activities in the region continued to rise, keeping the overall carbon pressure on terrestrial ecosystems at a relatively high level.
However, the green development strategy implemented during the 12th Five-Year Plan period positively influenced carbon pressure evolution. With the continuous advancement of ecological projects and the increasing duration of vegetation restoration, vegetation carbon sequestration per unit area showed an upward trend across most of Sichuan and Chongqing—except for western Sichuan—while vegetation biomass continued to accumulate. Against this backdrop, carbon emissions across regions exhibited negative growth, and the overall CBPI entered a downward trajectory. This indicated that regional green development pathways played a positive role in alleviating ecological and environmental carbon pressure.
3.4. Detection of Influencing Factors on the Spatial Stratified Heterogeneity of the Carbon Balance Pressure Index (CBPI)
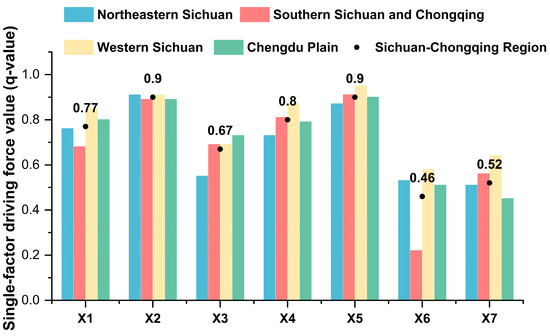
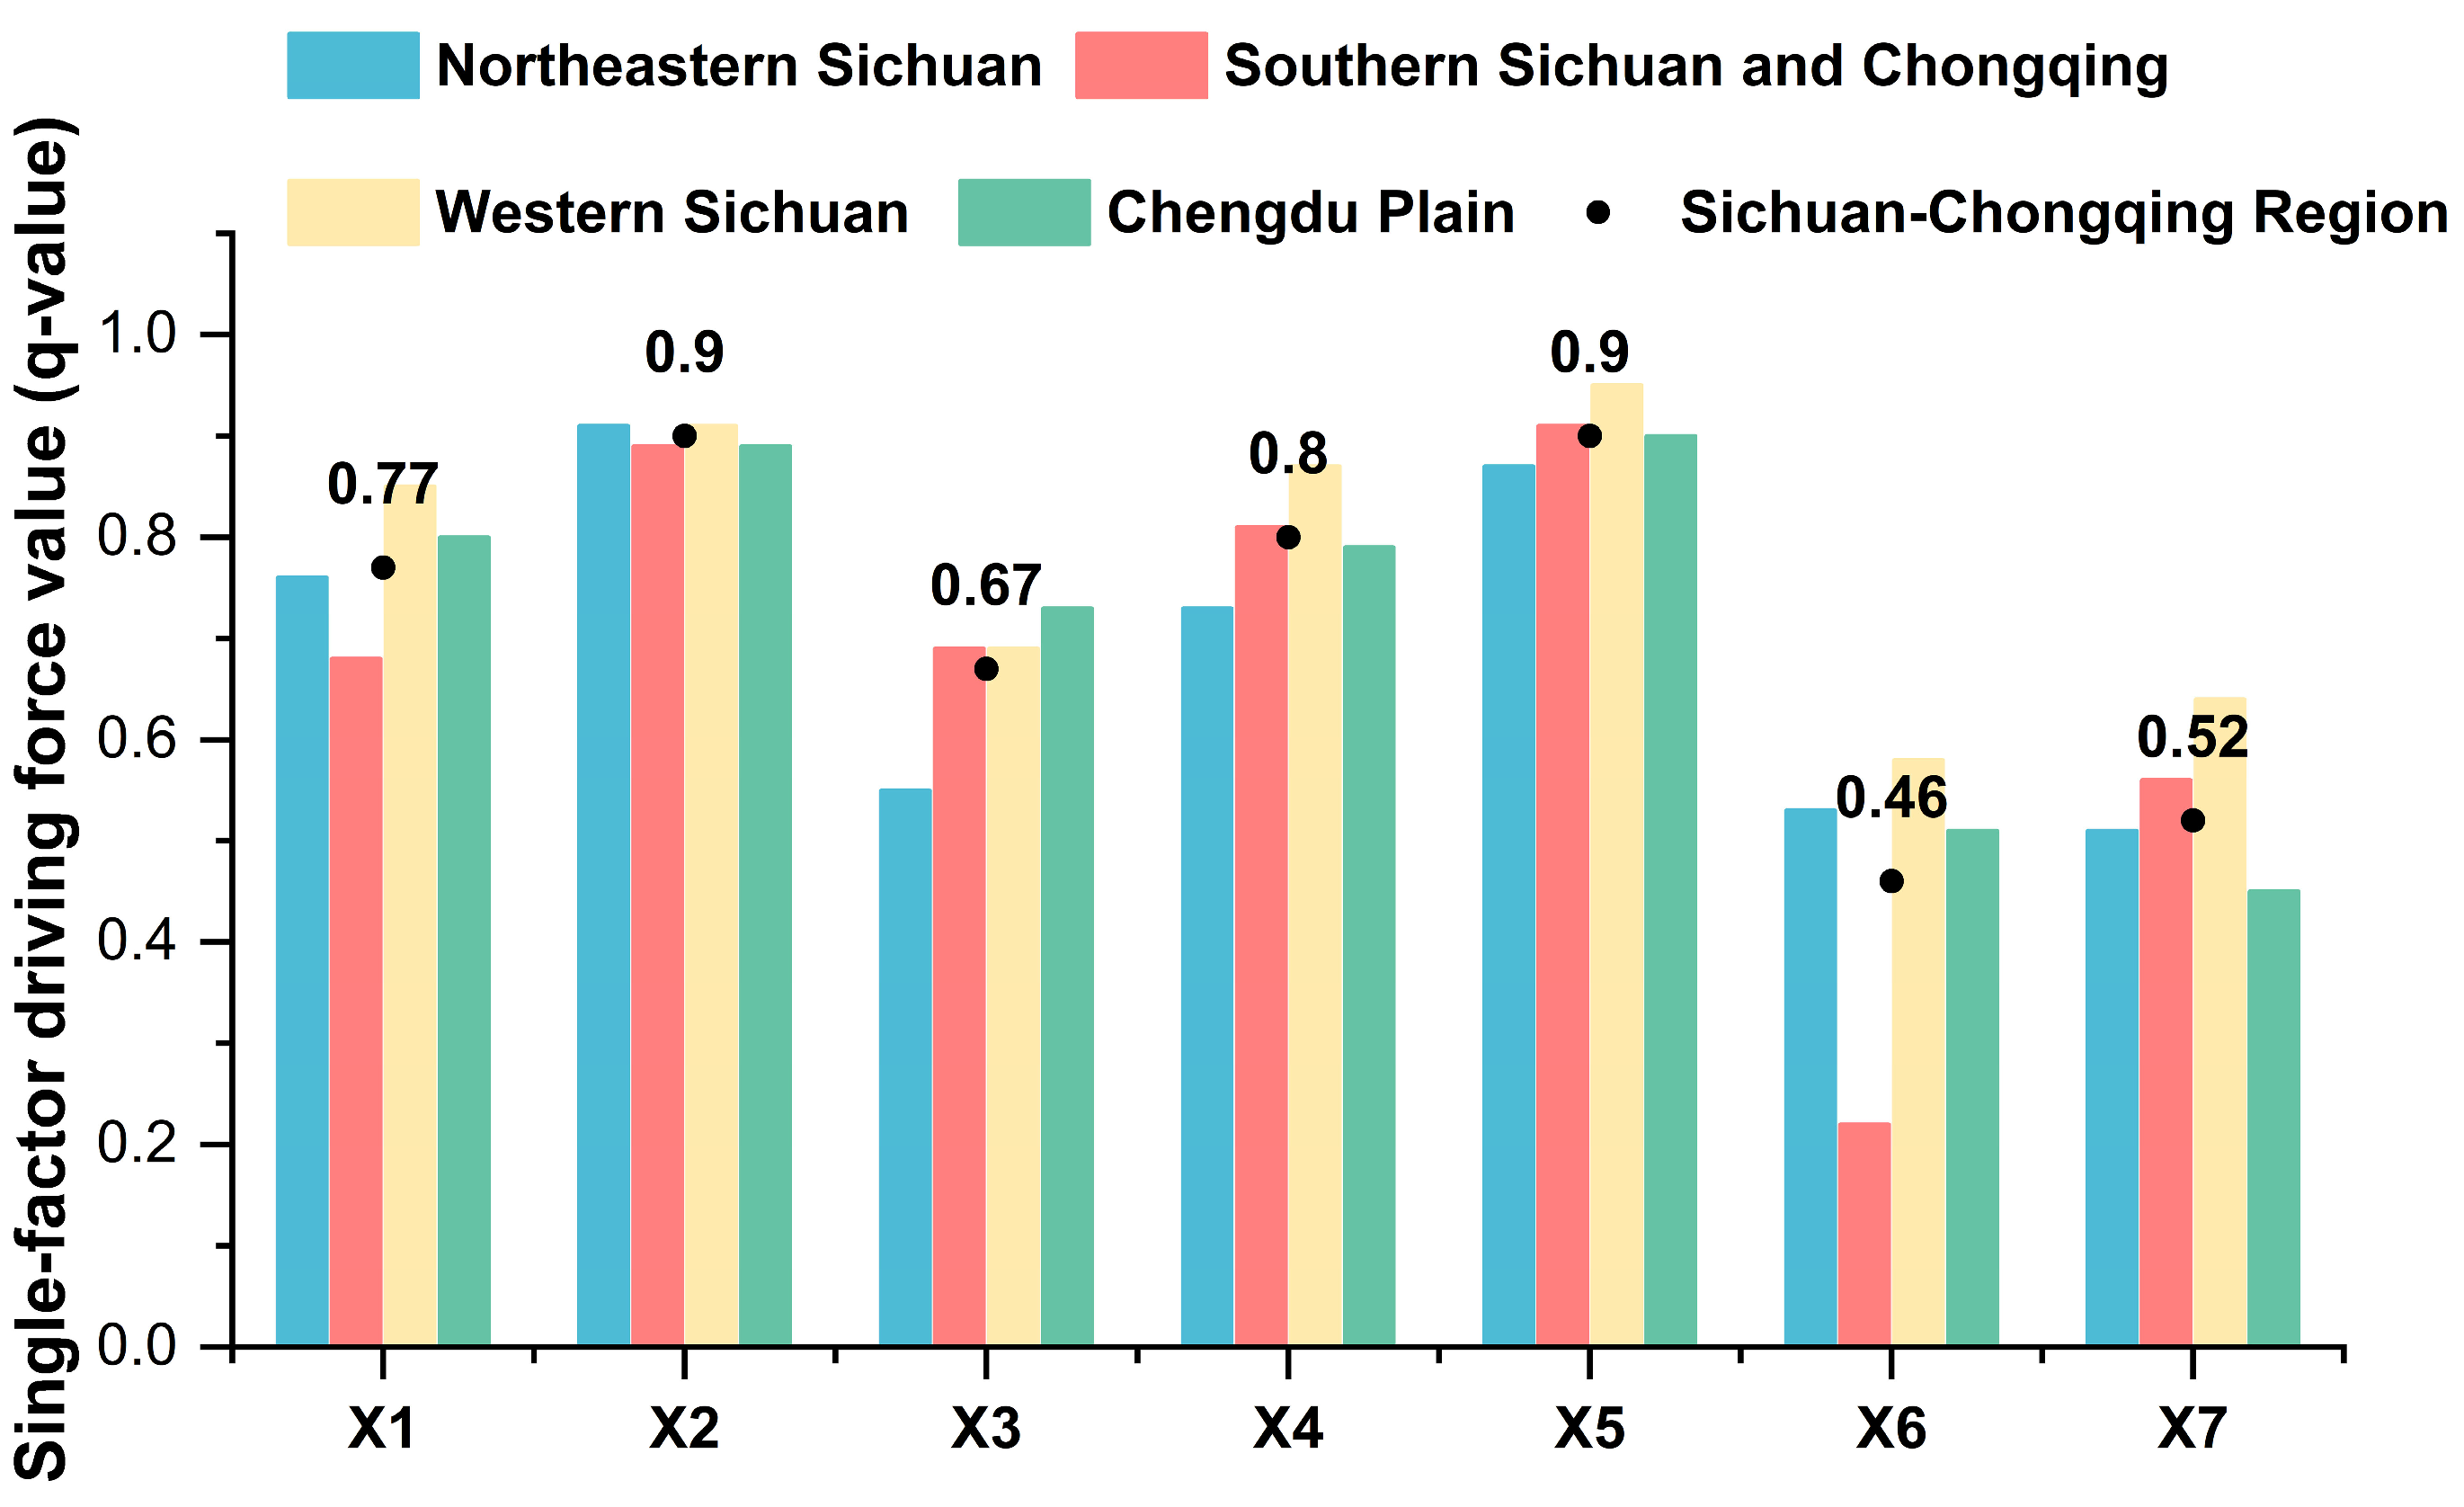
In Figure 6, the q-values for per capita GDP, highway freight turnover, and urbanization rate in the Sichuan–Chongqing region all exceeded 0.8, indicating that these factors are the primary explanatory factors of spatial differentiation in the CBPI within the region. The q-values for meteorological factors (annual mean temperature and annual cumulative precipitation) are below 0.65, suggesting that meteorological factors exerted a relatively weaker influence compared to human factors.
Figure 6.
Single factor q-values based on the Geodetector in Sichuan and Chongqing from 2001 to 2017.
Significant differences existed in the explanatory power of human factors versus meteorological factors across different regions. In northeastern Sichuan, per capita GDP and urbanization rates exerted the primary influence, with exhibiting q-values of 0.91 for per capita GDP and 0.87 for urbanization rate. This indicated that urban economic development was the main factor in increasing environmental pressure in these areas. This primarily reflected an economic development model dominated by the secondary industry, particularly high-energy-consuming industries. Their energy consumption structure, reliant on fossil fuels, was the key factor in elevated carbon emissions. Meteorological factors also exerted considerable influence in western Sichuan, with q-values exceeding 0.6, which mainly influenced vegetation sinks. In southern Sichuan, Chongqing and western Sichuan, also constrained by transportation turnover, environmental pressures stemming from transportation cannot be overlooked. In the Chengdu Plain region, the q-values for per capita GDP, highway passenger transport volume, highway freight transport volume, and urbanization rate all exceeded 0.7. This indicated that economic development, urbanization levels, and transportation development in the Chengdu Plain were the primary causes of its ecological changes.
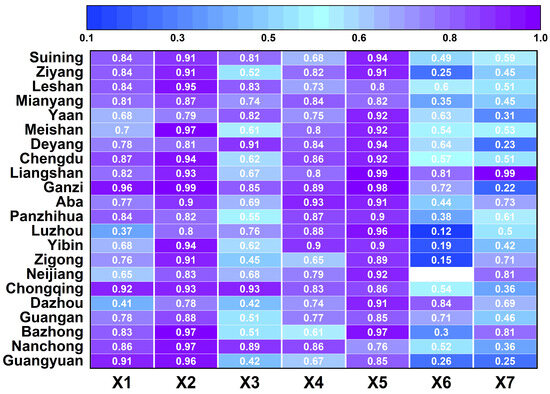
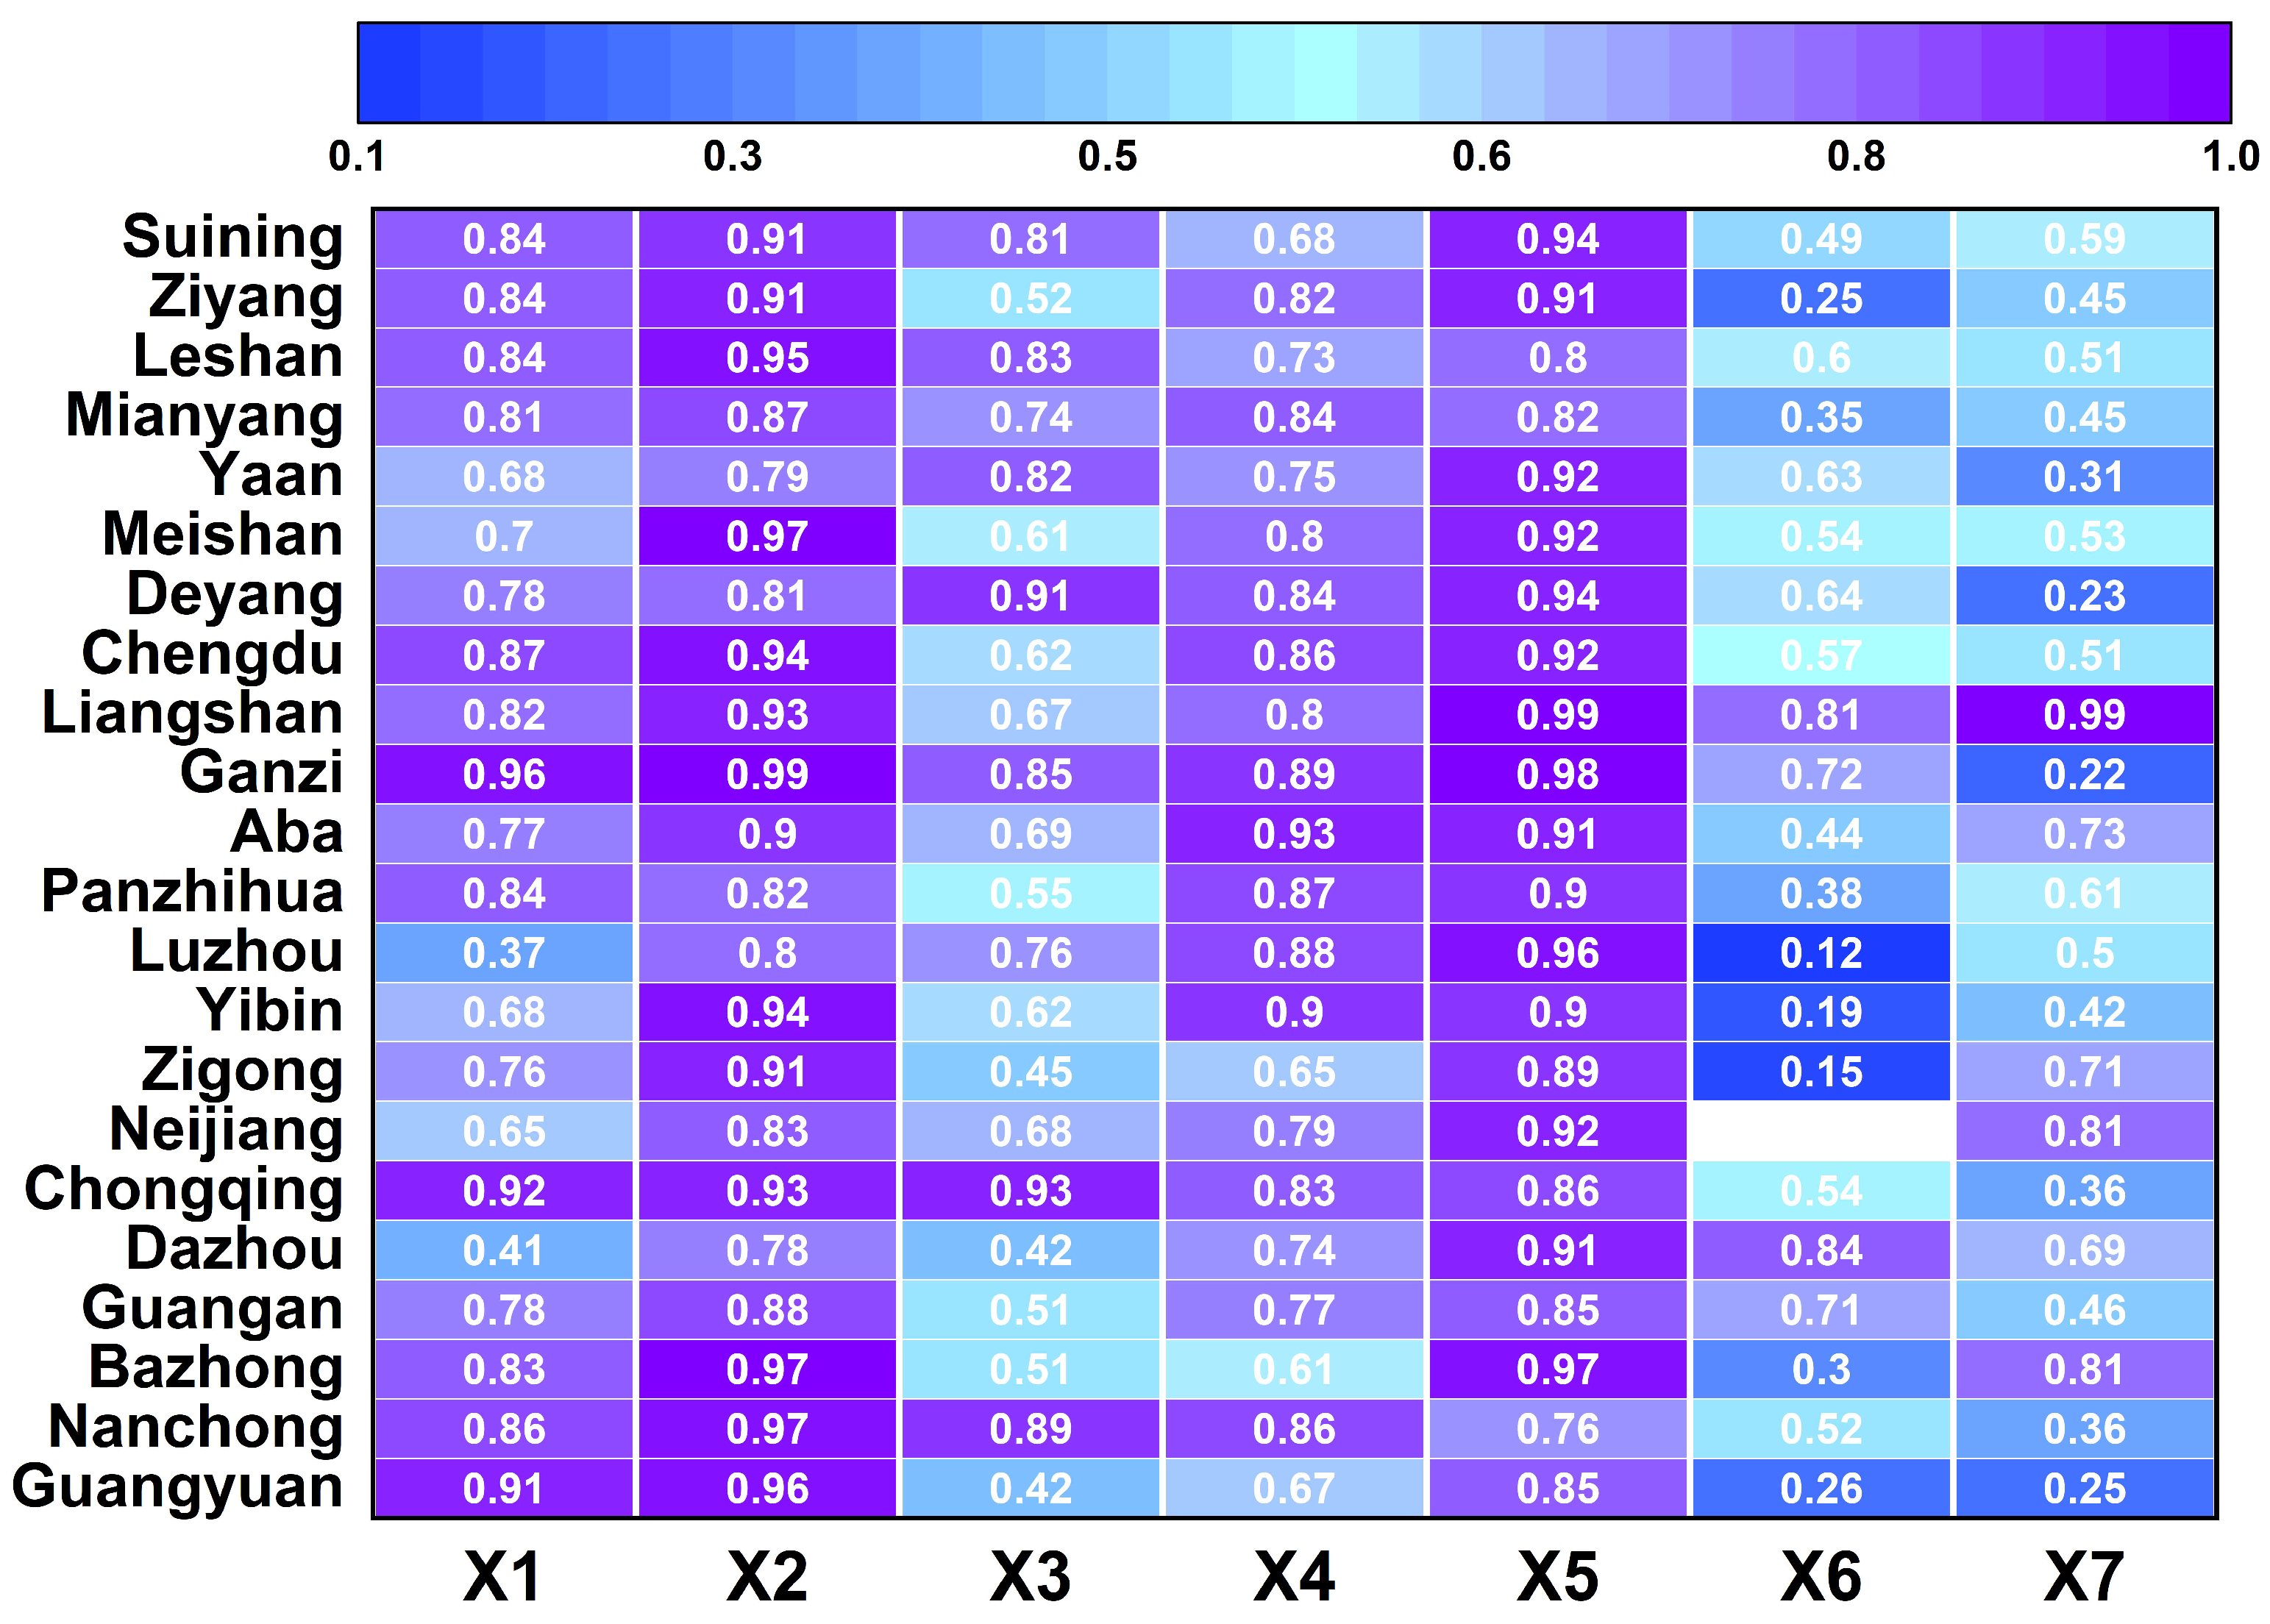
Geodetector results indicated that human factors and meteorological factors exhibited significant spatial variations in their influence on ecological carbon pressure across different urban units. Per capita GDP and urbanization rate exhibited the strongest explanatory power for CBPI spatial heterogeneity. The q-values of almost all cities were above 0.8 in Figure 7. This indicated that an energy consumption structure dominated by industrial energy use and the occupation of construction land accompanying urban expansion served as key intermediate mechanisms through which the macro-processes of economic development and urbanization influenced regional carbon balance. The remaining factors (population density, highway passenger turnover, highway freight turnover, annual mean temperature, and annual cumulative precipitation) exhibited pronounced geographical variations across cities. Climate factors exerted a greater influence on the CBPI in Liangshan Yi Autonomous Prefecture, Dazhou City, and Guang’an City, but a weaker impact on other regions, with Liangshan Yi Autonomous Prefecture achieving a q value of 0.99 for precipitation and 0.81 for temperature.
Figure 7.
Single factor q-values based on Geodetector in various cities in Sichuan and Chongqing.
The dual-factor interaction detection results indicated that the dual-factor interaction effect in the Sichuan–Chongqing region was greater than the single-factor impact. In the two-factor interaction detection, the interaction between temperature and precipitation exhibited a nonlinear enhancement effect, while all other dual-factor combinations showed enhancement effects (Supplementary Materials Table S3). Changes in any single factor may be amplified by the interaction with other factors. For instance, high temperature may exacerbate carbon emission pressures stemming from economic activities (such as air conditioning energy consumption), forming a “heat-economy” compound effect that poses a “1 + 1 > 2” impact risk to regional carbon balance. A 1% additional rise in per capita GDP was linked to an 8.2% growth in passenger vehicles, while this correlation strengthened [58]. The combination of economic factors and transportation aggravated regional carbon pressure. In summary, the influence of various factors on the CBPI in the Sichuan–Chongqing region exhibited regional variations, and the spatial distribution of the CBPI in this region was jointly driven by multiple factors.
3.5. Suggestions for Alleviating Ecological Carbon Pressure in the City Unit Based on Geodetector’s Explanatory Factors
In Figure 7, based on the multi-year average Carbon Balance Pressure Index (CBPI) during the study period, carbon surplus areas were predominantly distributed in the peripheral regions centered around Chengdu. Taking Liangshan Yi Autonomous Prefecture and Nanchong City as examples, Liangshan exhibited strong correlations between its CBPI and key factors: per capita GDP (q = 0.93), urbanization rate (q = 0.99), annual mean temperature (q = 0.81), and annual precipitation (q = 0.99). This suggested that regional economic development, urbanization level, and climatic conditions, among which urbanization and precipitation appeared to be the dominant explanatory factors in shaping local carbon pressure.
Favorable hydrothermal conditions in the region supported robust vegetation growth, playing a critical role in enhancing carbon sink capacity and buffering emission pressure. Although recent economic growth and urbanization have driven a shift from rural to urban-dominated types, leading to an increase in environmental pressure. Nevertheless, thanks to a sound ecological foundation and strong self-regulating capacity of its ecosystems, Liangshan had maintained a relatively low CBPI. The region’s core advantage lies in its strong ecological carbon sink capacity, underpinned by superior climatic conditions (mean annual temperature q = 0.81; precipitation q = 0.99). Results from the generalized additive model (GAMs, adjusted R2 = 0.75) further provide quantitative support for this mechanism. The partial effect of temperature on CBPI follows a hump-shaped pattern, suggesting enhanced vegetation carbon sequestration under moderate thermal conditions. Moreover, a 100-unit increase in annual cumulative precipitation is associated with a 0.01 decrease in CBPI. These findings underscore the dominant role of climatic conditions in regulating carbon pressure through the sink pathway. Therefore, the development pathway should prioritize conservation over the traditional “pollute first, clean up later” approach. Immediate priorities should include strictly delineating ecological protection boundaries, curbing disorderly expansion of construction land (urbanization rate q = 0.99), and exploring mechanisms to realize the value of ecological products. In India, the land sector removed approximately 181 Mt. CO2-eq [59]. Tasmania achieved negative emissions, with a mitigation benefit of 22 Mt. CO2-eq per year from reduced native forest logging (2011/12–2018/19) [60]. Specifically, promoting cross-regional carbon compensation between high-carbon areas like Chengdu and surplus regions to gain economic benefits through market-based approaches, thereby providing a low-cost and efficient pathway toward achieving carbon neutrality across the Sichuan–Chongqing region. Prioritizing ecological and environmental protection helps avoid trading the environment for short-term economic gains and achieve an organic balance between economic growth and green transition. Leveraging abundant hydropower and solar resources, Liangshan can also support regional decarbonization by supplying green electricity to high-pressure areas, contributing to the Sichuan–Chongqing region’s role as a green power hub.
Nanchong City was categorized as a weak carbon surplus zone, with q-values for anthropogenic factors all exceeding 0.7 and the q-value for temperature reaching 0.52. The strong explanatory power of annual mean temperature indicated favorable climatic conditions for vegetation growth. In pursuing development, priority should be given to low-energy and low-emission green industries, while avoiding high-heat and energy-intensive industrial projects to prevent exacerbating the urban heat island effect and compromising the natural advantage in vegetation carbon sequestration. Supporting evidence from Pakistan showed that a 1% increase in green industrial transformation can reduce carbon intensity by 0.25% [61], suggesting that industrial upgrading represents an effective pathway for moderating carbon pressure in similar contexts.
In carbon deficit zones, exemplified by Leshan and Chengdu, Leshan was identified as a weak carbon deficit zone, where highway passenger turnover (q = 0.83) and highway freight turnover (q = 0.73) were the dominant explanatory factors of spatial heterogeneity in CBPI. This quantitatively indicated that transportation activities are the primary emission-side pathway influencing local carbon pressure. Beyond direct carbon emissions, road transportation also exerts indirect ecological impacts. Road transport predominantly relied on fossil fuels such as diesel and gasoline. The combustion of transportation fuels not only releases significant CO2, the primary contributor to carbon imbalance, but also emits sulfur dioxide (SO2), which harms plant growth. SO2 damages cell membranes, disrupts water and nutrient flow, and interferes with photosynthesis by degrading chlorophyll, ultimately weakening vegetation’s ability to sequester carbon. This dual effect—simultaneously increasing carbon sources and suppressing carbon sinks—further amplifies CBPI in transportation-dominated regions. Results from the generalized additive model (GAMs, adjusted R2 = 0.95) provide quantitative support for these mechanisms. A 100-unit increase in highway passenger turnover leads to a 0.14 increase in the CBPI; similarly, a 100-unit increase in highway freight turnover results in a 0.42 increase in the CBPI. The substantially larger marginal effect of freight transport highlights the disproportionate contribution of heavy-duty logistics activities to regional carbon pressure.
Therefore, mitigation strategies should focus on optimizing logistics structures, developing multimodal transport systems, and promoting clean energy alternatives for heavy-duty trucks. Improving transport efficiency and energy utilization efficiency are essential measures for regulating the regional carbon balance. Enhancing transport efficiency requires restructuring the transportation system through coordinated planning and seamless integration across all links to ensure operational fluidity and speed. This approach maximizes regional economic benefits while maintaining high transport performance. Given the substantial road transport demand, dedicated inter-city and inter-regional rail freight lines should be planned and constructed, with logistics parks encouraged to adopt electric heavy-duty trucks. Improving energy utilization efficiency should prioritize technological innovation to drive productivity and sustainable economic growth. A 50% reduction in private vehicle displacements and distances, coupled with a 50% decrease in bus trips, could reduce the city’s passenger transport carbon emissions by up to 64.28% in Ibagué [62]. In the case of Thailand, the combined effect of electric vehicle expansion and enhanced internal combustion engine efficiency has the potential to deliver a 41.96% reduction in emissions, which is equivalent to 18,378.04 gigagrams of carbon dioxide equivalent (GgCO2eq) [63]. However, the current transportation electrification may only reduce 0.6% of the total emissions [58]. The sustainable decarbonization measures may focus on the optimization of the transportation structure, transport efficiency, and energy utilization efficiency, which are expected to deliver more robust reductions in regional carbon pressure. Chengdu was a moderate carbon deficit zone and served as the primary focus of emission reduction and carbon mitigation efforts in the Sichuan–Chongqing region. The imbalance between its carbon emissions and vegetation carbon sequestration was primarily associated with human factors such as population density (q = 0.87), per capita GDP (9 = 0.94), transportation (0.89), and urbanization levels (0.92). Quantitative results from the generalized additive model (GAMs, adjusted R2 = 0.97) provide clear evidence of these relationships. Specifically, a 1-unit increase in the urbanization rate leads to a 0.42 increase in CBPI, while a 10-unit increase in highway freight turnover corresponds to a 0.54 increase in CBPI. In contrast, a 1-unit increase in temperature leads to a −0.11 decrease in the CBPI, indicating a modest buffering effect through enhanced vegetation carbon sequestration. These results demonstrate that emission-side pressures dominate CBPI dynamics in Chengdu, while climatic factors play a secondary mitigating role.
Its population size, economic development level, and urbanization rate all ranked among the highest in the Sichuan–Chongqing region. Its substantial economic output was underpinned by high energy consumption demands. Despite a developed tertiary sector, enhancing energy efficiency in traditional industries like steel and building materials—as a comprehensive industrial base—remains central to emissions reduction. Population concentration and transportation factors were compounded by the “lock-in effect” from increased commuting distances and surging motor vehicle ownership. Chengdu should proactively assume regional emission reduction responsibilities, accelerate technological innovation, develop energy-saving and emission-reduction technologies, and vigorously introduce talent, equipment, and other resources to foster a green, low-carbon economy. Environment-relevant green technology innovation significantly improved carbon emission efficiency, based on a sample of 32 developed countries [64]. Simultaneously, it should leverage its leading role to facilitate green assistance across regions, drive the transformation and upgrading of other areas, jointly alleviate ecological and environmental pressures in the Sichuan–Chongqing region, and co-create regional green development. Chengdu’s economic development relied heavily on energy resources. Optimizing the energy structure and improving energy efficiency can alleviate the Carbon Balance Pressure Index (CBPI). This involves phasing out outdated production capacity, developing clean coal technologies, and replacing fossil fuel consumption with green energy sources such as wind, hydro, and solar power. Chengdu’s large population size created agglomeration effects that mitigate carbon emissions [65], yet rapid population growth exacerbated urban congestion and environmental degradation. Therefore, Chengdu must formulate tailored population control strategies based on local conditions [66].
Overall, the results revealed pronounced spatial heterogeneity in carbon pressure in the Sichuan–Chongqing region, influenced by the joint effects of human activities and climatic conditions. Carbon pressure is concentrated in highly urbanized and economically developed areas, while peripheral regions exhibit lower pressure due to stronger vegetation carbon sequestration. These findings underscore the necessity of differentiated carbon governance strategies that account for both emission sources and ecological sink capacities.
4. Discussion
Although the quantitative analysis in this study is based on data from 2001 to 2017, the identified patterns and mechanisms remain highly relevant for understanding China’s current “dual carbon” transition. Importantly, the study period encompasses the most intensive phase of China’s industrialization and urbanization. Previous research has shown that the weighted speed and intensity of urban expansion nationwide peaked between 2000 and 2005, a period characterized by rapid economic growth and extensive land-use transformation [67]. The zone-specific development patterns established during this stage generated a form of structural inertia that continues to shape regional carbon pressure. Establishing this structural baseline is therefore critical for evaluating both the feasibility and constraints of achieving the 2030 carbon peaking target.
Beyond documenting historical trends, this study’s core contribution is elucidating the mechanisms linking human activities, climatic conditions, and regional carbon pressure via a source–sink framework. the spatial concentration of emission-intensive activities in metropolitan cores and the complementary role of peripheral regions as carbon sinks and energy suppliers are found in this study. Although absolute emissions have shifted since 2017, the identified core mechanisms reflect persistent structural relationships rather than short-term fluctuations. The mechanisms in this study remain applicable under changing policy and technological contexts. Recent developments after 2017 further reinforce these mechanisms. The accelerated integration of the Chengdu–Chongqing economic circle has strengthened regional functional differentiation, with core cities such as Chengdu continuing to concentrate population, transportation demand, and economic activities, while surrounding regions increasingly assume ecological buffering and renewable energy supply functions. At the same time, the implementation of China’s 14th Five-Year Plan has significantly accelerated renewable energy deployment and improvements in energy efficiency, particularly in hydropower-, wind-, and solar-rich areas of southwestern China. Under the 14th Five-Year Plan energy scenario, optimizing wind-solar farm siting, ultra-high-voltage transmission, and energy storage can raise their technical potential from 9 to 15 PWh/year while cutting abatement costs significantly [68]. Chongqing has raised its forest coverage rate via inter-county ecological compensation to meet the 14th Five-Year Plan targets [69]. These changes are expected to reduce emission intensity and improve carbon sink, but they do not fundamentally alter the dominant emission-side pressures associated with urbanization, transportation, and economic agglomeration.
To address the temporal gap, the spatial–sectoral pathways identified by 2017 were qualitatively compared with national statistical trends from 2017 to 2023. China’s forest area increased significantly from 2000 to 2015, with its growth rate slowing by 50% between 2015 and 2022 [70]. China’s installed renewable energy capacity has steadily risen, reaching ~1.02 billion kW by 2021 and accounting for 29.8% of the nation’s total electricity consumption [71]. Continued growth in urbanization (increasing rate: 13.88%) and transportation demand (48.72%), alongside expanding renewable energy capacity and ecosystem restoration, are broadly consistent with the emission-side and sink-side pathways identified in this study. These patterns provide qualitative validation of the continued relevance of our findings under the dual carbon agenda.
Against this dynamic background, the differentiated strategies proposed in this study retain strong policy relevance but require adaptive implementation. In core cities such as Chengdu, emission reduction efforts should increasingly emphasize transportation demand management, low-carbon urban form, and technological innovation, complementing ongoing energy structure optimization. In contrast, peripheral and ecological surplus regions should prioritize ecosystem conservation, enhancement of vegetation carbon sinks, and the development of renewable energy bases to support regional decarbonization. Strengthening cross-regional coordination mechanisms, including green power transmission and carbon compensation, will be essential to translating these differentiated pathways into coherent progress toward China’s dual carbon goals.
Vegetation carbon sequestration (VCS) in this study is calculated by MODIS products at 500 m and 1 km resolutions, which may underestimate fine-scale and fragmented vegetation, particularly small urban green spaces in densely built-up areas. This scale effect could lead to relatively higher CBPI estimates in urban cores. However, MODIS data provide consistent spatial coverage and temporal continuity that are appropriate for regional and inter-city comparative analysis. Future studies could incorporate higher-resolution datasets to further refine CBPI estimates in highly heterogeneous urban environments.
Because of the integration between anthropogenic carbon emissions and vegetation carbon sequestration capacities, the study method of CBPI can be used in different regions to flexibly analyze the spatial heterogeneity of carbon pressure between carbon sources and carbon sinks. While the relative importance of specific factors—such as transportation, urbanization, or climatic factors—depends on local socioeconomic and environmental contexts, the analytical logic underlying CBPI and the identification of spatial–sectoral pathways can inform low-carbon governance in other developing or rapidly urbanizing regions in China and beyond.
5. Conclusions
This study investigated carbon balance pressure across four regions in the Sichuan–Chongqing area: Northeastern Sichuan, Southern Sichuan and Chongqing, Western Sichuan, and the Chengdu Plain by constructing a carbon balance pressure index based on the balance between anthropogenic carbon emissions and vegetation carbon sequestration. Using spatial analysis, Geodetector, and generalized additive models, we comprehensively examined the spatiotemporal evolution of vegetation carbon sequestration per unit area, carbon emissions per unit area, and the carbon balance pressure index across these regions from 2001 to 2017, and investigated the spatial associations with human activities and meteorological conditions. The study analyzed the degree of ecological pressure caused by carbon emission growth in different areas and explored targeted green and low-carbon development pathways for cities with distinct development characteristics. The main conclusions were as follows:
- (1)
- Carbon Emission (CE) increased by 178%, while Vegetation Carbon Storage (VCS) rose by 27%. The Chengdu Plain, a high-carbon-emission core, saw its CE surge by 185% and VCS grow by 35%.
- (2)
- The Carbon Balance Pressure Index (CBPI) in the Sichuan–Chongqing region generally exhibited an annual trend of rapid growth and high-level fluctuation during 2001–2017. The CBPI increased from 0.35 in 2001 to 0.76 in 2017, reaching a peak value of 0.92 in 2012. CBPI evolution reflected an intensifying imbalance between carbon emissions and vegetation carbon sequestration.
- (3)
- Between 2001 and 2017, the Sichuan–Chongqing CBPI showed a “light-west, heavy-center, moderate-east” belt, with the Chengdu Plain as the persistent high-value zone and Chengdu City at the core of carbon pressure accumulation (CBPI = 3.14), indicating the long-term accumulation of carbon pressure in highly urbanized and industrialized areas. In contrast, underdeveloped regions experienced worsening carbon imbalances due to rapid urbanization, expanded construction land, and energy demand. Developed districts should accelerate green, low-carbon industrial transformation, while less-developed ones must avoid high-carbon path dependence and pursue intensive, eco-friendly urban growth.
- (4)
- The carbon pressure in the Sichuan–Chongqing region was shaped by three pathways during the study period: industrial structure, land-use change associated with urban expansion, and fossil-fuel-based energy consumption, particularly in the transportation sector. Their effects are often reinforced through interactions with other factors. Low-CBPI cities should balance growth with green transformation; high-CBPI cities must adjust structures and upgrade technology, supported by inter-regional green cooperation. The relative importance of these pathways varied across regions, reinforcing the necessity of differentiated approaches to carbon governance that align with local development characteristics and ecological conditions.
This study demonstrated the analytical value of integrating carbon sources and carbon sinks through the CBPI framework to diagnose the regional carbon pressure. While the magnitude and explanatory factors of carbon pressure are inherently context-specific, the source–sink perspective and analytical logic developed in this study are transferable to other developing or rapidly urbanizing regions characterized by strong ecological gradients and uneven development. This study established a systematic quantitative baseline of carbon balance pressure in the Sichuan–Chongqing region, providing a reference for interpreting subsequent low-carbon development. Future work may refine CBPI estimates by incorporating higher-resolution remote sensing data, reconstructing post-2017 energy balances, and explicitly accounting for emerging policy instruments and climate extremes, thereby extending the framework toward dynamic assessment of carbon governance effectiveness.
Supplementary Materials
The following supporting information can be downloaded at: https://www.mdpi.com/article/10.3390/earth7010009/s1, Table S1: Comparison of carbon-related indicators; Table S2: Comparison of analysis methods; Table S3: Interaction between two factors in Sichuan–Chongqing region.
Author Contributions
Conceptualization, J.J., P.K., H.F. and Y.W.; methodology, J.J., P.K. and Y.W.; investigation, J.J.; data curation, H.F., J.L., L.L. and Y.S.; writing—original draft preparation, J.J.; writing—review and editing, P.K., H.F. and Y.W.; software, J.J.; funding acquisition, P.K. and Y.W. All authors have read and agreed to the published version of the manuscript.
Funding
This research was funded by the Natural Science Foundation of Sichuan Province (No. 2025NSFSC2047); the Science and Technology Project of Gansu Province (Outstanding Youth Fund, No. 24JRRA386); the Science and Technology Program of Sichuan Province (No. 2025HJRC0052), and the Sichuan Provincial Central Leading Local Science and Technology Development Special Project (No. 2025ZYD0179).
Data Availability Statement
The data supporting the findings of this study were obtained from multiple public sources. The carbon emission data came from Carbon Emission Accounts and Datasets (https://www.ceads.net.cn/data/ (accessed on 25 December 2023)). The land use data came from the MODIS (Moderate Resolution Imaging Spectroradiometer) Earth observation product MCD12Q1 (https://modis.gsfc.nasa.gov/ (accessed on 29 October 2023)). The NDVI data came from MODIS’s MOD13A3 product. The Sunshine duration data came from the China Meteorological Data Network (https://data.cma.cn) daily observation records. The statistical data came from the National Bureau of Statistics (http://www.stats.gov.cn/ (accessed on 9 March 2024)) and the statistical yearbooks of respective provinces (municipalities) for the corresponding years. The temperature and precipitation data came from the National Tibetan Plateau Data Center (https://data.tpdc.ac.cn/home (accessed on 7 March 2024)).
Acknowledgments
We confirm that all individuals referenced in the acknowledgements have consented to their inclusion. We also wish to express our gratitude to the anonymous reviewers for their valuable suggestions and comments, which have significantly enhanced the quality of this manuscript. This work is supported in part by Lanzhou University Supercomputing Center.
Conflicts of Interest
No potential conflicts of interest are declared by the authors.
Abbreviations
The following abbreviations are used in this manuscript:
| MODIS | Moderate Resolution Imaging Spectroradiometer |
| NDVI | Normalized difference vegetation index |
| NPP | Net primary productivity |
| CE | Carbon emission |
| VCS | Vegetation carbon sequestration |
| CBPI | Carbon balance pressure index |
| CEADs | Carbon Emission Accounts and Datasets |
| IPCC | Intergovernmental Panel on Climate Change |
| CASA | Carnegie–Ames–Stanford Approach |
| APAR | Absorption of photosynthetically active radiation |
| GDP | Gross Domestic Product |
| GAMs | Generalized additive models |
References
- Chen, J.; Fan, W.; Li, D.; Liu, X.; Song, M. Driving factors of global carbon footprint pressure: Based on vegetation carbon sequestration. Appl. Energy 2020, 267, 114914. [Google Scholar] [CrossRef] [Scilit]
- Zheng, X.; Lu, Y.; Yuan, J. Drivers of change in China’s energy-related CO2 emissions. Proc. Natl. Acad. Sci. USA 2019, 117, 29–36. [Google Scholar] [CrossRef] [Scilit] [PubMed]
- Yin, J.; Zheng, M.; Chen, J. The effects of environmental regulation and technical progress on CO2 Kuznets curve: An evidence from China. Energy Policy 2015, 77, 97–108. [Google Scholar] [CrossRef] [Scilit]
- Muryshev, K.E.; Eliseev, A.V.; Mokhov, I.I.; Timazhev, A.V. Lead-lag relationships between global mean temperature and the atmospheric CO2 content in dependence of the type and time scale of the forcing. Glob. Planet. Change 2017, 148, 29–41. [Google Scholar] [CrossRef] [Scilit]
- Li, M.; Wu, J.; Deng, X. Land use change and soil carbon sequestration in China: Where does it pay to conserve? Reg. Environ. Change 2016, 16, 2429–2441. [Google Scholar] [CrossRef] [Scilit]
- Bai, Y.; Deng, X.; Gibson, J.; Zhao, Z.; Xu, H. How does urbanization affect residential CO2 emissions? An analysis on urban agglomerations of China. J. Clean. Prod. 2019, 209, 876–885. [Google Scholar] [CrossRef] [Scilit]
- Liu, Q.; Zhang, W.; Yao, M.; Yuan, J. Carbon emissions performance regulation for China’s top generation groups by 2020: Too challenging to realize? Resour. Conserv. Recycl. 2017, 122, 326–334. [Google Scholar] [CrossRef] [Scilit]
- Lian, L.; Lin, J.; Yao, R.; Tian, W. The CO2 emission changes in China’s transportation sector during 1992–2015: A structural decomposition analysis. Environ. Sci. Pollut. Res. 2020, 27, 9085–9098. [Google Scholar] [CrossRef] [Scilit]
- Liu, Z.; Guan, D.; Wei, W.; Davis, S.J.; Ciais, P.; Bai, J.; Peng, S.; Zhang, Q.; Hubacek, K.; Marland, G.; et al. Reduced carbon emission estimates from fossil fuel combustion and cement production in China. Nature 2015, 524, 335–338. [Google Scholar] [CrossRef] [Scilit]
- Fang, J.; Yu, G.; Liu, L.; Hu, S.; Chapin, F.S., III. Climate change, human impacts, and carbon sequestration in China. Proc. Natl. Acad. Sci. USA 2018, 115, 4015–4020. [Google Scholar] [CrossRef] [Scilit]
- Yang, W.; Pan, J. The role of vegetation carbon sequestration in offsetting energy carbon emissions in the Yangtze River Basin, China. Environ. Dev. Sustain. 2024, 26, 22689–22714. [Google Scholar] [CrossRef] [Scilit]
- Liu, X.; Pei, F.; Wen, Y.; Li, X.; Wang, S.; Wu, C.; Cai, Y.; Wu, J.; Chen, J.; Feng, K.; et al. Global urban expansion offsets climate-driven increases in terrestrial net primary productivity. Nat. Commun. 2019, 10, 5558. [Google Scholar] [CrossRef] [Scilit] [PubMed]
- Piao, S.; Fang, J.; Ciais, P.; Peylin, P.; Huang, Y.; Sitch, S.; Wang, T. The carbon balance of terrestrial ecosystems in China. Nature 2009, 458, 1009–1013. [Google Scholar] [CrossRef] [Scilit] [PubMed]
- Tang, X.; Zhao, X.; Bai, Y.; Tang, Z.; Wang, W.; Zhao, Y.; Wan, H.; Xie, Z.; Shi, X.; Wu, B.; et al. Carbon pools in China’s terrestrial ecosystems: New estimates based on an intensive field survey. Proc. Natl. Acad. Sci. USA 2018, 115, 4021–4026. [Google Scholar] [CrossRef] [Scilit]
- Dossa, K.F.; Miassi, Y.E. Remote sensing methods and GIS approaches for carbon sequestration measurement: A general review. Int. J. Environ. Clim. Change 2024, 14, 222–233. [Google Scholar] [CrossRef] [Scilit]
- Dong, L.; Wang, Y.; Ai, L.; Cheng, X.; Luo, Y. A review of research methods for accounting urban green space carbon sinks and exploration of new approaches. Front. Environ. Sci. 2024, 12, 1350185. [Google Scholar] [CrossRef] [Scilit]
- Zhu, W.; Pan, Y.; He, H.; Yu, D.; Hu, H. Simulation of maximum light use efficiency for some typical vegetation types in China. Chin. Sci. Bull. 2006, 51, 457–463. [Google Scholar] [CrossRef] [Scilit]
- Wang, J.; Du, G. Spatial differentiation and driving factors of urban green development efficiency in China. Res. Econ. Manag. (Jingji Yu Guanli Yanjiu) 2020, 41, 11–27. (In Chinese) [Google Scholar]
- Hu, D.; Ding, S. Research on evaluation index system of low-carbon economy. Sci. Technol. Prog. Policy (Kejin Jinbu Yu Duice) 2010, 27, 160–164. (In Chinese) [Google Scholar]
- Feng, Z. Construction of evaluation index system for regional low-carbon development capacity. Stat. Decis. (Tongji Yu Juece) 2012, 28, 63–65. (In Chinese) [Google Scholar]
- Churchill, S.A.; Inekwe, J.; Ivanovski, K. Conditional convergence in per capita carbon emissions since 1900. Appl. Energy 2018, 228, 916–927. [Google Scholar] [CrossRef] [Scilit]
- Zhang, F.; Deng, X.; Phillips, F.; Fang, C.; Wang, C. Impacts of industrial structure and technical progress on carbon emission intensity: Evidence from 281 cities in China. Technol. Forecast. Soc. Change 2020, 154, 119949. [Google Scholar] [CrossRef] [Scilit]
- Zhao, Y.; Chen, R.; Zang, P.; Huang, L.; Ma, S.; Wang, S. Spatiotemporal patterns of global carbon intensities and their driving forces. Sci. Total Environ. 2022, 818, 151690. [Google Scholar] [CrossRef] [Scilit] [PubMed]
- Feng, Y.; Zhai, L.; Sang, H.; Cheng, S. Carbon budget accounting and change classification method based on fine. J. Geoinf. Sci. (Diqiu Xinxi Kexue Xuebao) 2023, 25, 468–478. (In Chinese) [Google Scholar]
- Liang, D.; Lu, H.; Guan, Y.; Feng, L.; He, L.; Qiu, L.; Lu, J. Population density regulation may mitigate the imbalance between anthropogenic carbon emissions and vegetation carbon sequestration. Sustain. Cities Soc. 2023, 92, 104502. [Google Scholar] [CrossRef] [Scilit]
- Zhao, R.; Huang, X.; Liu, Y.; Zhong, T.; Ding, M.; Chuai, X. Urban carbon footprint and carbon cycle pressure: The case study of Nanjing. J. Geogr. Sci. 2014, 24, 159–176. [Google Scholar] [CrossRef] [Scilit]
- Guo, P.; Liang, D. Has the low-carbon pilot policy improved urban carbon emission efficiency? A quasi-natural experiment based on low-carbon pilot cities. J. Nat. Resour. (Ziran Ziyuan Xuebao) 2022, 37, 1876–1892. (In Chinese) [Google Scholar]
- Chen, J.; Li, Z.; Song, M.; Dong, Y. Decomposing the global carbon balance pressure index: Evidence from 77 countries. Environ. Sci. Pollut. Res. 2021, 28, 7016–7031. [Google Scholar] [CrossRef] [Scilit]
- Liu, Q.; Wu, S.; Lei, Y.; Li, S.; Li, L. Exploring spatial characteristics of city-level CO2 emissions in China and their influencing factors from global and local perspectives. Sci. Total Environ. 2021, 754, 142206. [Google Scholar] [CrossRef] [Scilit]
- Sodiq, A.; Baloch, A.A.B.; Khan, S.A.; Sezer, N.; Mahmoud, S.; Jama, M.; Abdelaal, A. Towards modern sustainable cities: Review of sustainability principles and trends. J. Clean. Prod. 2019, 227, 972–1001. [Google Scholar] [CrossRef] [Scilit]
- United Nations. Cities and Climate Change. 2020. Available online: https://www.unep.org/explore-topics/resource-efficiency/what-we-do/cities-and-climate-change (accessed on 15 March 2024).
- Song, C.; Zhao, T.; Wang, J. Spatial-temporal analysis of China’s regional carbon intensity based on ST-IDA from 2000 to 2015. J. Clean. Prod. 2019, 238, 117874. [Google Scholar] [CrossRef] [Scilit]
- Chen, J.; Gao, M.; Cheng, S.; Hou, W.; Song, M.; Liu, X.; Liu, Y.; Shan, Y. County-level CO2 emissions and sequestration in China during 1997–2017. Sci. Data 2020, 7, 391. [Google Scholar] [CrossRef] [Scilit]
- Potter, C.S.; Randerson, J.T.; Field, C.B.; Matson, P.A.; Vitousek, P.M.; Mooney, H.A.; Klooster, S.A. Terrestrial ecosystem production: A process model based on global satellite and surface data. Glob. Biogeochem. Cycles 1993, 7, 811–841. [Google Scholar] [CrossRef] [Scilit]
- Wang, X.; Tan, K.; Chen, B.; Du, P. Assessing the spatiotemporal variation and impact factors of net primary productivity in China. Sci. Rep. 2017, 7, 44415. [Google Scholar] [CrossRef] [Scilit] [PubMed]
- Feng, H.; Kang, P.; Deng, Z.; Zhao, W.; Hua, M.; Zhu, X.; Wang, Z. The impact of climate change and human activities to vegetation carbon sequestration variation in Sichuan and Chongqing. Environ. Res. 2023, 238, 117138. [Google Scholar] [CrossRef] [Scilit]
- Wang, Y.; Yang, M.; Pan, Y.; Zhu, W.; Long, Z.; Liu, X.; Gu, X. Remote sensing estimation of the value of organic matter produced by terrestrial vegetation ecosystems in China. Ecol. Environ. 2005, 14, 5. (In Chinese) [Google Scholar] [CrossRef]
- Wang, S.; Huang, Y. Spatial spillover effect and driving forces of carbon emission intensity at city level in China. Acta Geogr. Sin. (Dili Xuebao) 2019, 74, 1131–1148. Available online: https://www.geog.com.cn/CN/10.11821/dlxb201906005 (accessed on 15 March 2024). (In Chinese)
- Li, Y.; Zhang, S. Spatiotemporal evolution of carbon emission intensity and spatiotemporal heterogeneity of influencing factors in Chinese cities. China Environ. Sci. 2023, 43, 3244–3254. (In Chinese) [Google Scholar] [CrossRef]
- Azam, M.; Uddin, I.; Khan, S.; Tariq, M. Are globalization, urbanization, and energy consumption cause carbon emissions in SAARC region? New evidence from CS-ARDL approach. Environ. Sci. Pollut. Res. 2022, 29, 87746–87763. [Google Scholar] [CrossRef] [Scilit]
- Yu, Y.H.; Zheng, X.Y.; Zhang, L. Carbon dioxide emission and economic development: A panel data analysis. Econ. Theory Bus. Manag. (Jingji Lilun Yu Shangye Guanli) 2011, 6, 72–81. [Google Scholar]
- Sheng, P.; Guo, X. The Long-run and Short-run Impacts of Urbanization on Carbon Dioxide Emissions. Econ. Model. 2016, 53, 208–215. [Google Scholar] [CrossRef] [Scilit]
- Yu, J.; Da, Y.; Yang, O. Analysis of carbon emission changes in China’s transportation industry based on LMDI decomposition method. China J. Highw. Transp. (Zhongguo Gonglu Xuebao) 2015, 28, 112–119. (In Chinese) [Google Scholar]
- Solaymani, S. CO2 emissions patterns in 7 top carbon emitter economies: The case of transport sector. Energy 2019, 168, 989–1001. [Google Scholar] [CrossRef] [Scilit]
- Peng, S. 1-km Monthly Mean Temperature Dataset for China (1901–2022); National Tibetan Plateau/Third Pole Environment Data Center: Beijing, China, 2019. [Google Scholar] [CrossRef]
- Zhou, R.; Zhang, Y.; Peng, M.; Jin, Y.; Song, Q. Effects of climate change on the carbon sequestration potential of forest vegetation in Yunnan Province, Southwest China. Forests 2022, 13, 306. [Google Scholar] [CrossRef] [Scilit]
- Li, H.; Zhang, H.; Feng, Z.; Zhao, J.; Chen, H.; Guo, X.; Wang, T.; Liu, Y. Climate change influences on vegetation photosynthesis in the Northern Hemisphere. J. Environ. Manag. 2025, 380, 124976. [Google Scholar] [CrossRef] [Scilit]
- Wu, Y.Y.; Wang, P.; Liu, X.; Chen, J.D.; Song, M.L. Analysis of regional carbon allocation and carbon trading based on net primary productivity in China. China Econ. Rev. 2020, 60, 101401. [Google Scholar] [CrossRef] [Scilit]
- Law, B.E.; Waring, R.H.; Anthoni, P.M.; Aber, J.D. Measurements of gross and net ecosystem productivity and water vapour exchange of a Pinus ponderosa ecosystem, and an evaluation of two generalized models. Glob. Change Biol. 2000, 6, 155–168. [Google Scholar] [CrossRef] [Scilit]
- Wang, J.F.; Zhang, T.L.; Fu, B.J. A measure of spatial stratified heterogeneity. Ecol. Indic. 2016, 67, 250–256. [Google Scholar] [CrossRef] [Scilit]
- Hu, Y.; Ma, G.; Wang, J.; Ye, Y.; Zhang, J. Contribution analysis of the 12th Five-Year Plan energy conservation target to carbon emission intensity in Sichuan Province. Water Resour. Power (Shuidian Nengyuan Kexue) 2012, 30, 205–207, 216. (In Chinese) [Google Scholar]
- Jiang, F.; Huang, W.; Ma, G. Decomposition study on influencing factors of carbon emissions from energy consumption in Sichuan Province. China Popul. Resour. Environ. (Zhongguo Renkou Ziyuan Yu Huanjing) 2016, 26, 45–48. (In Chinese) [Google Scholar]
- Zhang, Z.; Zhang, T.; Feng, D. Regional differences, dynamic evolution and convergence of carbon emission intensity in China. J. Quant. Tech. Econ. (Shuliang Jingji Jishu Jingji Yanjiu) 2022, 39, 67–87. (In Chinese) [Google Scholar]
- Mahbub, R.B.; Ahmed, N.; Rahman, S.; Hossain, M.M.; Sujauddin, M. Human appropriation of net primary production in Bangladesh, 1700–2100. Land Use Policy 2019, 87, 104067. [Google Scholar] [CrossRef] [Scilit]
- Hu, J.; Huang, F.; Tie, L.; Liu, X.; Wei, S.; Huang, C. Economic value dynamics of carbon sequestration in forest vegetation of Sichuan Province. Acta Ecol. Sin. (Shengtai Xuebao) 2019, 39, 158–163. (In Chinese) [Google Scholar]
- Zhu, J.; Song, L. A review of ecological mechanisms for management practices of protective forests. J. For. Res. 2021, 32, 435–448. [Google Scholar] [CrossRef] [Scilit]
- Cheng, C.; Yang, X.; Cai, H. Analysis of Spatial and Temporal Changes and Expansion Patterns in Mainland Chinese Urban Land between 1995 and 2015. Remote Sens. 2021, 13, 2090. [Google Scholar] [CrossRef] [Scilit]
- Lu, Q.; Duan, H.; Shi, H.; Peng, B.; Liu, Y.; Wu, T.; Du, H.; Wang, S. Decarbonization scenarios and carbon reduction potential for China’s road transportation by 2060. Npj Urban Sustain. 2022, 2, 34. [Google Scholar] [CrossRef] [Scilit]
- Jaiswal, D.; Siddique, K.; Jayalekshmi, T.; Sajitha, A.; Kushwaha, A.; Surendran, S. Land-based climate mitigation strategies for achieving net zero emissions in India. Front. Clim. 2025. [Google Scholar] [CrossRef] [Scilit]
- Mackey, B.; Moomaw, W.; Lindenmayer, D.; Keith, H. Net carbon accounting and reporting are a barrier to understanding the mitigation value of forest protection in developed countries. Environ. Res. Lett. 2022, 17, 054028. [Google Scholar] [CrossRef] [Scilit]
- Mehmood, S.; Zaman, K.; Khan, S.; Ali, Z.; Khan, H.U.R. The role of green industrial transformation in mitigating carbon emissions: Exploring the channels of technological innovation and environmental regulation. Energy Built Environ. 2024, 5, 464–479. [Google Scholar] [CrossRef] [Scilit]
- Montoya-Torres, J.; Akizu-Gardoki, O.; Iturrondobeitia, A.M. Towards sustainable passenger transport: Carbon emission reduction scenarios for a medium-sized city. J. Clean. Prod. 2023, 418, 138149.1–138149.12. [Google Scholar] [CrossRef] [Scilit]
- Thanatrakolsri, P.; Sirithian, D. Toward Low-Carbon Mobility: Greenhouse Gas Emissions and Reduction Opportunities in Thailand’s Road Transport Sector. Clean Technol. 2025, 7, 60. [Google Scholar] [CrossRef] [Scilit]
- Dong, F.; Zhu, J.; Li, Y.; Chen, Y.; Gao, Y.; Hu, M.; Qin, C.; Sun, J. How green technology innovation affects carbon emission efficiency: Evidence from developed countries proposing carbon neutrality targets. Environ. Sci. Pollut. Res. 2022, 29, 35780–35799. [Google Scholar] [CrossRef] [Scilit] [PubMed]
- O’Mahony, T. Decomposition of Ireland’s carbon emissions from 1990 to 2010: An extended Kaya identity. Energy Policy 2013, 59, 573–581. [Google Scholar] [CrossRef] [Scilit]
- Asensio, O.I.; Apablaza, C.Z.; Lawson, M.C.; Chen, E.W.; Horner, S.J. Impacts of micromobility on car displacement with evidence from a natural experiment and geofencing policy. Nat. Energy 2022, 7, 1100–1108. [Google Scholar] [CrossRef] [Scilit]
- Li, T.; Chen, H.; Ma, C. China’s urbanization evolution and metropolitan area expansion, based on the Prolonged Artificial Nighttime-light Dataset (PANDA, 1984–2020). Int. J. Digit. Earth 2024, 17, 2347448. [Google Scholar] [CrossRef] [Scilit]
- Wang, Y.; Wang, R.; Tanaka, K.; Ciais, P.; Peñuelas, J.; Balkanski, Y.; Sardans, J.; Hauglustaine, D.; Liu, W.; Xing, X.; et al. Accelerating the energy transition towards photovoltaic and wind in China. Nature 2023, 619, 761–767. [Google Scholar] [CrossRef] [Scilit]
- Zhang, S.; Liu, J.; Ran, L.; Zhang, X.; Shao, J. Cross-county horizontal ecological compensation and supply-demand docking to increase forest coverage: A case study of Chongqing. Acta Ecol. Sin. 2023, 43, 4651–4663. [Google Scholar] [CrossRef] [Scilit]
- Wei, X.; Liu, R.; Liu, Y.; He, J.; Chen, J.; Qi, L.; Zhou, Y.; Qin, Y.; Wu, C.; Dong, J.; et al. Forest Areas in China Are Recovering Since the 21st Century. Geophys. Res. Lett. 2024, 51, e2024GL110312. [Google Scholar] [CrossRef] [Scilit]
- Li, C. China’s strategies and initiatives to foster high-quality leaping development of renewable energy. iEnergy 2022, 1, 149–150. [Google Scholar] [CrossRef] [Scilit]

Disclaimer/Publisher’s Note: The statements, opinions and data contained in all publications are solely those of the individual author(s) and contributor(s) and not of MDPI and/or the editor(s). MDPI and/or the editor(s) disclaim responsibility for any injury to people or property resulting from any ideas, methods, instructions or products referred to in the content. |
© 2026 by the authors. Licensee MDPI, Basel, Switzerland. This article is an open access article distributed under the terms and conditions of the Creative Commons Attribution (CC BY) license.