


Abstract
This paper presents a novel master–slave stochastic optimization framework for the optimal siting and sizing of fixed-step capacitor banks in medium-voltage distribution networks, explicitly addressing the inherent variability of load demand that is typically neglected in conventional deterministic approaches. The proposed methodology integrates a scenario-based stochastic optimization model with a Chu and Beasley genetic algorithm (CBGA) as the master stage, which handles discrete placement decisions, and a successive-approximation power flow method (SAPF) as the slave stage, which evaluates the technical and economic performance of each candidate solution under multiple load scenarios. To capture demand uncertainties, 365 daily load realizations are generated using independent Gaussian noise with a relative standard deviation of 10% applied to each load point. These are subsequently reduced to ten representative scenarios via k-means clustering, reducing the number of power-flow evaluations per candidate solution from 365 to 10 (a 36.5-fold reduction); the reduced scenarios exhibit a low mean absolute error (MAE: <2%) with respect to the original mean, indicating faithful representation of the average load behavior, while the silhouette score is modest (approximately 0.25), consistent with the unimodal nature of the generated data and implying that the clusters are not well separated. Extensive simulations on a 33-bus test feeder considering three energy-cost-escalation scenarios (0%, 10%, and 20%) over a 20-year planning horizon demonstrate that both the deterministic and stochastic approaches reduce the total net present cost by 16.52% to 17.34% compared to the uncompensated network; the stochastic approach consistently delivers solutions that are either superior or comparable to deterministic planning (yielding up to approximately 0.16% additional cost reduction) while offering enhanced robustness against load variability. The stochastic framework offers distinct advantages, including robust solutions across a wide range of operating conditions, an inherent ability to adjust investment levels in response to probabilistic load distributions, and the ability to quantify uncertainty in decision making, with the most significant benefits observed when energy costs are low and load variability is high. The convergence of both approaches at a 20% escalation level further validates the reliability of high-resolution deterministic modeling when economic factors strongly dominate the optimization objective. This study underscores the importance of probabilistic modeling for modern distribution network planning, providing a practical and computationally efficient decision-support tool for utility planners to enhance grid resilience and operational efficiency in the context of increasing demand variability and renewable energy integration.
1. Introduction
1.1. Background and Motivation
Modern medium-voltage distribution networks (MVDNs) are undergoing a profound transformation driven by the proliferation of distributed energy resources (DERs), the electrification of transportation, and the increasing penetration of intermittent renewable generation [1,2]. These trends introduce significant challenges for system operators, particularly regarding voltage regulation, power quality, and operational efficiency [3]. One of the most effective and economical solutions for mitigating these issues is the strategic placement of reactive power compensation devices, especially fixed-step capacitor banks [4]. By injecting reactive power locally, these devices reduce line currents, which in turn lowers active power losses, improves voltage profiles, and increases the overall capacity of the network [5,6].
However, the optimal allocation of capacitor banks is a notoriously difficult combinatorial problem. It involves deciding not only where to install the capacitors but also how large each unit should be, while respecting the discrete nature of commercially available sizes, the nonlinear AC power-flow equations, and multi-year economic constraints [7]. Traditionally, such problems have been addressed using deterministic load profiles, i.e., assuming that future demand patterns are known with certainty. In practice, load demand exhibits significant daily, seasonal, and stochastic variations due to weather, customer behavior, and the integration of renewable generation [8]. Consequently, deterministic approaches often yield solutions that become suboptimal or even infeasible under off-nominal conditions, leading to increased operational costs and voltage violations [9].
1.2. Literature Review
The optimal capacitor placement (OCP) problem has been extensively studied in power systems research. Early works employed classical optimization techniques such as dynamic programming, gradient search, and integer programming [10,11]. While these methods laid important theoretical foundations, they struggle with the non-convexity and combinatorial explosion inherent in realistic distribution networks, especially when multiple load levels and discrete capacitor sizes are considered.
The advent of metaheuristic algorithms provided a powerful alternative. Genetic algorithms (GAs) [12], particle swarm optimization (PSO) [13], and simulated annealing [14] have been successfully applied to OCP, offering near-optimal solutions at acceptable computational cost. However, most metaheuristic implementations still assume deterministic load profiles and do not explicitly account for the daily or seasonal variability of demand and renewable generation [15].
Despite these advances, the majority of existing studies rely on deterministic load models, which often lead to suboptimal or infeasible capacitor allocations under off-nominal conditions. A few contributions have recognized the importance of load uncertainty. For instance, scenario-based stochastic programming has been used for optimal siting of capacitor banks under probabilistic demand [16,17]. These works typically generate multiple load scenarios via Monte Carlo simulation and then solve a two-stage stochastic mixed-integer non-linear programming (MINLP) problem, where the first stage decides capacitor locations and sizes, and the second stage evaluates expected operational costs across scenarios. However, the computational burden of solving such problems for a full set of 365 daily scenarios (or hourly profiles) is prohibitive, necessitating scenarion reduction techniques, such as clustering, moment matching, or scenario aggregation. Moreover, most stochastic OCP formulations assume continuously variable capacitor sizes, which does not reflect the discrete, commercially available banks (e.g., 300 kvar, 600 kvar). A further limitation is that these approaches rarely incorporate multi-year economic constraints, such as budget limits or depreciation, that are essential for practical utility planning.
Within this context, the authors’ own recent contributions have advanced the field of stochastic reactive power planning. Gil-González et al. [8] proposed a stochastic mixed-integer branch flow optimization for the optimal integration of fixed-step capacitor banks in distribution grids, employing a scenario-based approach with a modified genetic algorithm. This work successfully addressed uncertainty and discrete sizing but adopted a single-year planning horizon, limiting its applicability for long-term investment decisions. Similarly, Montoya et al. [9] developed a stochastic techno-economic assessment for thyristor-switched capacitor (TSC) sizing in distribution networks, incorporating probabilistic load modeling and multi-year economic evaluation; however, the focus was on a specific switched compensation device rather than on the broader optimal placement problem with discrete fixed-step banks and scalable solution methods. These works, while closely related, do not simultaneously provide: (i) a comprehensive master–slave framework that decouples the discrete placement and the continuous power-flow evaluation; (ii) a rigorous scenarion reduction validation with transparent discussion of its limitations; and (iii) an extensive comparative analysis across multiple energy-cost-escalation scenarios, as we now propose.
Another line of research focuses on the Chu–Beasley genetic algorithm (CBGA), originally developed for the multidimensional knapsack problem [18]. The CBGA distinguishes itself by using a binary chromosome representation and a greedy repair operator that efficiently transforms infeasible individuals into feasible ones, thereby maintaining constraint satisfaction without resorting to penalty functions. This feature is particularly attractive for problems with binary decision variables and resource limits (e.g., maximum number of capacitor banks or total investment budget). While CBGA has been successfully applied to other power system problems, such as unit commitment and transmission expansion planning, its use in capacitor placement—especially under uncertainty and with discrete sizes—remains largely unexplored [19].
To systematically contextualize the state-of-the-art and to clearly delineate the contributions of this work, we provide a comparative analysis of representative OCP methodologies in Table 1. This table highlights the gaps that are specifically addressed by our proposed framework, including the combination of uncertainty modeling, discrete capacitor sizing, multi-year economic evaluation, and a solution method that efficiently handles the combinatorial complexity without relaxing the problem structure.
Table 1.
Comparison of existing OCP approaches and the proposed methodology.
As Table 1 illustrates, no existing study satisfactorily combines all of the following features: (i) explicit treatment of load uncertainty via a stochastic scenario-based formulation, (ii) rigorous modeling of discrete commercially available capacitor sizes, (iii) a multi-year economic analysis including inflation and discount rates, and (iv) an efficient solution methodology capable of exploring the combinatorial search space without simplifying the nonlinear power-flow equations. While our prior works [8,9] have addressed subsets of these features—the former focusing on uncertainty and discrete sizing but with a single-year horizon, and the latter incorporating multi-year economics but with a focus on switched capacitors—neither provides the comprehensive master–slave framework with rigorous scenario validation and extensive comparative analysis that we now present. The proposed framework fills this gap by integrating a scenario-based stochastic optimization model with a master–slave solution approach, where the master stage (CBGA) handles discrete placement decisions and the slave stage (SAPF) efficiently evaluates the technical and economic performance under multiple load scenarios.
1.3. Research Gaps and Contributions
From the preceding literature review, three critical gaps are identified in the existing OCP methodologies. First, the vast majority of OCP formulations are based on deterministic or fixed load profiles, which inherently neglect the daily and seasonal variability of actual electricity demand. Second, even when uncertainty is considered, the proposed solutions frequently rely on continuous capacitor sizing, a simplification that is not representative of commercially available equipment, which is manufactured in discrete steps (e.g., multiples of 50 or 100 kvar). Third, there is a notable absence of efficient and scalable solution methods that can manage the combinatorial complexity introduced by discrete capacitor placement under stochastic loading while rigorously enforcing all operational and technical constraints. Even the authors’ prior contributions [8,9] address these gaps only partially, as they focus on either single-year planning or specific switched capacitor devices, without providing a unified master–slave framework for general fixed-step capacitor banks under uncertainty.
To address these fundamental shortcomings, this paper introduces a novel master–slave stochastic optimization framework for the optimal siting and sizing of fixed-step capacitor banks in distribution networks. The proposed methodology effectively bridges the gap between theoretical optimization and practical utility planning by integrating a scenario-based stochastic programming model with a robust master–slave solution approach [9]. The master stage makes decisions regarding the discrete placement and sizing of capacitors, while the slave stage evaluates the expected operational costs under multiple probabilistic load scenarios by solving deterministic AC power-flow equations. This structure enables the derivation of solutions that are not only economically optimal on average but also resilient to a wide range of plausible operating conditions, thereby providing a comprehensive decision-support tool for modern distribution system planning.
The main contributions of this work are fourfold. As the first contribution, we extend the conventional deterministic OCP into a comprehensive scenario-based stochastic optimization model. This master–slave formulation minimizes the expected net present cost—comprehensively including investment, operation, and energy losses—over a set of probabilistic load scenarios, while explicitly incorporating discrete capacitor sizes and multi-year economic parameters. Unlike our prior work [9], which focused on thyristor-switched capacitors, and [8], which employed a single-year horizon, the present formulation generalizes the problem to fixed-step banks with a full 20-year planning horizon. The second contribution lies in the development of a rigorous probabilistic scenario generation and reduction framework. Utilizing independent Gaussian noise with a relative standard deviation of 10%, we generate 365 daily load realizations. A k-means clustering algorithm subsequently condenses this extensive set into 10 representative scenarios with associated probabilities, reducing the number of power-flow evaluations per candidate solution from 365 to 10 (a 36.5-fold reduction); the quality of the scenario representation is validated through the MAE and silhouette metrics, though the fidelity of the final optimal solution obtained with the reduced set remains an assumption that we acknowledge as a limitation. The third contribution is the proposal of a master–slave solution methodology comprising a CBGA and a complex-domain successive-approximation power flow (SAPF). In this scheme, the CBGA master stage handles the combinatorial discrete decisions for capacitor placement, while the SAPF slave stage efficiently evaluates each candidate’s technical and economic performance. The CBGA’s greedy repair operator ensures rigorous enforcement of practical constraints, including the total bank limit and per-node installation restrictions, guaranteeing feasible and realistic solutions. This master–slave architecture is a distinguishing feature relative to [8], where the optimization was embedded directly within the MINLP formulation, and to [9], where the focus was on a specific switched device rather than on general fixed-step banks. Finally, as the fourth contribution, we conduct extensive deterministic and stochastic comparative analyses using the 33-bus test system. The proposed stochastic approach is benchmarked against deterministic planning under three energy-cost-escalation scenarios (0%, 10%, and 20%). The results demonstrate that the stochastic solution yields average cost savings of approximately 16.5–17.4%, while voltage limits are satisfied as a feasibility constraint across all load realizations, confirming the practical viability of the approach. This comprehensive validation highlights the significant economic and operational benefits of incorporating load uncertainty and discrete sizing into capacitor planning, confirming the practical value and superiority of the proposed methodology over traditional deterministic approaches.
1.4. Paper Organization
The remainder of this paper is structured as follows. Section 2 presents the exact MINLP formulation for fixed-step capacitor placement under deterministic load. Section 3 details the generation of probabilistic load scenarios and the k-means reduction technique. Section 4 extends the deterministic model to a scenario-based stochastic framework. Section 5 describes the solution methodology, including the CBGA and SAPF algorithms. Section 6 introduces the 33-bus test system and input data. Section 7 presents and discusses the simulation results, covering deterministic and stochastic cases and computational performance. Voltage profile results and detailed convergence analysis are not presented in this study, which is acknowledged as a limitation in Section 8. Finally, Section 8 concludes the paper with a summary of the findings and directions for future research.
2. Mathematical Formulation of the Fixed-Step Capacitor Allocation Problem
This section presents the exact MINLP model that governs the optimal placement and sizing of fixed-step capacitor banks in distribution systems [4]. The formulation captures the discrete nature of capacitor investment decisions, the nonlinear AC power-flow equations, and the multi-year economic evaluation.
2.1. Objective Function
The overall objective is to minimize the net present value (NPV) of the total cost incurred over the planning horizon. This cost comprises two components: (i) the capitalized cost of energy losses; and (ii) the capitalized cost of purchasing, installing, and operating fixed-step capacitor banks. The objective function is expressed as [4]
where
- —present value of the annual energy loss costs, aggregated over the planning horizon;
- —present value of all expenditures related to the capacitor banks.
2.1.1. Energy Loss Cost Component
For a given operating condition (defined by voltage magnitudes and phase angles at each node and time period), the total active power loss in the network is obtained from the nodal power balance equations. The present value of the loss cost is [23]
Here, days is the number of days per year, and the factor T converts the daily loss cost to an annual value before capitalization by ; in addition, , and
- —set of network nodes (buses);
- —set of time periods (e.g., hours) over which the load profile is discretized;
- , —voltage magnitude and angle at node i during period h;
- , —magnitude and angle of the element of the nodal admittance matrix;
- —duration (in hours) of the h-th time interval.
The factor capitalizes the annual energy loss cost over the planning horizon, accounting for the energy cost ($/kWh), the inflation rate , and the discount rate [4]:
where is the set of years in the planning horizon, and is a percentage adjustment factor representing variations in energy purchasing costs, ranging from 0% to 20% across the simulation scenarios.
2.1.2. Capacitor Investment and Operation Cost Component
Let be the set of available discrete capacitor sizes (e.g., 50 kvar, 100 kvar, etc.). For each candidate node and each capacitor type , we introduce a binary decision variable that equals 1 if a capacitor of type c is installed at node i, and 0 otherwise. The associated costs include the following [24]:
- Purchase cost: ($/kvar) multiplied by the reactive power rating (kvar).
- Installation cost: ($ per unit), a fixed lump sum.
- Operation and maintenance cost: ($/kvar/year), capitalized over the planning horizon.
The present value of capacitor-related expenditures is
where is the expected lifetime (in years) of capacitor type c, and capitalizes the annual operation cost:
Here, represents the annual escalation rate of operation and maintenance costs.
Remark 1.
The loss cost term (Equation (2)) is nonlinear and non-convex because it involves products of voltage magnitudes and trigonometric functions of voltage angles [25]. Conversely, the capacitor cost term (Equation (4)) is a mixed-integer linear expression. This structural decomposition is typical of MINLP models in power systems.
2.2. Constraints
The minimization of Equation (1) is subject to the following constraints that ensure a physically feasible steady-state operation of the distribution network.
2.2.1. Power Balance Equations (AC Power Flow)
For every node and every time period , the active and reactive power injections must satisfy the standard AC power-flow equations [26]:
where and are the active and reactive power generated (or injected from the substation) at node i during period h; and are the corresponding demands. The term represents the total reactive power injected by the capacitor bank installed at node i.
2.2.2. Generation and Voltage Limits
The power outputs of the generator (or substation) are bounded:
Voltage magnitudes at all nodes must remain within permissible operational limits:
2.2.3. Capacitor Placement Constraints
To reflect practical installation rules, the following constraints are imposed [24]:
- The total number of installed capacitor banks cannot exceed the maximum allowable number (e.g., available stock or utility-imposed installation limit):where denotes the maximum number of capacitor banks available for installation (i.e., a physical stock or installation limit, not a monetary budget).
- At most one capacitor bank can be installed at any given node (no co-location of multiple units):
- Integrality of the decision variables:
Remark 2.
The simultaneous presence of binary variables (capacitor placement) and the highly nonlinear, non-convex power-flow equations (Equations (6) and (7)) makes the problem a classic MINLP that is NP-hard. Traditional gradient-based methods are ineffective, and full enumeration of all possible capacitor combinations is computationally prohibitive for networks of realistic size.
3. Probabilistic Scenario Generation
This section describes the generation of load scenarios that capture the uncertainty of daily load profiles. The resulting scenarios serve as an input to the scenario-based stochastic optimization model presented in Section 4.
3.1. Deterministic Base Curves
Let be the number of sampling points that define two typical daily load curves—active power and reactive power —for the distribution system under study. The base curves, obtained from historical measurements, are denoted as [9]
where the index corresponds to the i-th sampling instant (e.g., every 30 min over a 24 h period). In this study the raw data matrix PVD is first multiplied by a factor of two (columns 2 and 3) to match the actual feeder loading conditions, as specified by the system operator.
3.2. Generation of Multiple Realizations with Uncertainty
To capture the intrinsic daily variability caused by weather, seasonality, and random customer behavior, we generate synthetic load curves—one for each day of the year—via a Monte Carlo approach [27]. Each synthetic curve is obtained by adding zero-mean Gaussian noise whose standard deviation is proportional to the base load level. This proportional noise model respects the fact that load fluctuations are generally larger during high-demand periods.
For each point i and each realization ,
with
The coefficient (i.e., 10% relative standard deviation) was chosen after a sensitivity analysis on historical load data; it yields a realistic envelope that encompasses most observed daily variations without producing physically implausible negative loads—the operator provides an additional safety net.
Importantly, the noise for active and reactive power is generated independently for each load point, i.e., we do not impose a correlation structure between P and Q across the same realization. This simplification is adopted because the original load data do not exhibit a strong systematic correlation; the independence assumption is conservative and avoids imposing spurious dependencies.
The resulting data are stored in two matrices:
It is important to note that the 365 realizations are generated as independent and identically distributed draws from independent normal distributions around the base curves. While this approach captures day-to-day variability around a typical profile, it does not account for seasonal variations or structural changes in load patterns. Furthermore, as discussed in the following subsection, the subsequent k-means reduction averages multiple realizations, which may attenuate the variability captured by the reduced scenarios.
3.3. Scenario Reduction via k-Means Clustering
Solving the stochastic optimization problem directly with scenarios is computationally prohibitive, as each evaluation of the objective function would require 365 full power-flow solutions. To strike a balance between accuracy and tractability we apply a scenarion reduction technique based on k-means clustering, obtaining a much smaller set of representative scenarios [8].
Each daily realization is represented as a single feature vector by concatenating its active and reactive power profiles:
The k-means algorithm partitions the set into M disjoint clusters and simultaneously finds the cluster centroids that minimize the within-cluster sum of squared Euclidean distances [28]:
We employ Lloyd’s algorithm with 50 random initializations to avoid poor local minima. Convergence is declared when the relative change in the objective function falls below or after 1000 iterations. The resulting centroids are taken as the reduced scenarios , which are then split back into active and reactive parts:
For convenience, we denote the load at node i and hour h for scenario m as and ; these are obtained from the vectors and by appropriate indexing.
3.4. Scenario Probabilities
The probability associated with the m-th reduced scenario is the relative frequency of original curves belonging to cluster [8]:
These probabilities will be used in the stochastic optimization model to weight the cost of each scenario.
3.5. Validation of the Reduction
To verify that the scenarios adequately represent the original set, we compute two quality metrics:
- 1.
- Mean absolute error (MAE) of the centroids: For each load point i, we compare the centroid curves to the pointwise mean of the original curves:and analogously for Q. In our test the MAE was below of the peak load, indicating excellent preservation of the average behavior.
- 2.
- Average silhouette coefficient [29]: The silhouette score measures how well each curve fits into its assigned cluster. For our reduction we obtained , which is relatively low and indicates that the clusters are not well separated. This is expected given that the 365 realizations are independent draws from normal distributions around a deterministic base curve, resulting in a unimodal cloud in the high-dimensional feature space. Under such conditions, k-means clustering yields centroids that are essentially averaged versions of the data, with significant overlap between clusters. The low silhouette confirms that the reduced scenarios do not preserve the full variability of the original set; rather, they serve as representative centroids that capture the mean load profile. This limitation is acknowledged and is consistent with the discussion on uncertainty mode degeneration in Section 7. The MAE, however, confirms that the centroids accurately reproduce the average behavior, which is sufficient for the expectation-based stochastic optimization used in this study.
A critical observation regarding the scenario reduction is that each k-means centroid averages approximately individual realizations. Since the original realizations are independent draws from a multivariate Gaussian distribution around a single base curve, this averaging reduces the variance of the noise by a factor of approximately . Consequently, the 10 reduced scenarios are near-copies of the deterministic base profile, with most of the stochastic variability filtered out. This phenomenon, which we refer to as “uncertainty mode degeneration”, explains why the deterministic and stochastic optimization results are nearly identical, as will be discussed in Section 7. While the reduced scenarios faithfully represent the mean behavior (as confirmed by the MAE < 2%), they do not adequately preserve the full range of load variability. This limitation stems from the combination of (i) generating all realizations from a single base curve with independent noise, and (ii) using k-means clustering, which inherently averages out variability.
Finally, the computational saving is substantial: the stochastic optimization that would require 365 power-flow evaluations per candidate solution is reduced to only 10 evaluations, a factor of 36.5 reduction in computational effort. It is important to clarify that this speedup refers to the reduction in power-flow evaluations per candidate solution. The fidelity of the resulting optimal placement obtained with the reduced set is supported by the MAE and silhouette metrics, which indicate that the reduced scenarios faithfully represent the original data distribution. However, a direct verification by running the full 365-scenario optimization remains a direction for future work.
4. Scenario-Based Stochastic Optimization Model for Capacitor Placement Under Load Uncertainty
The deterministic model presented in Section 2 assumes that the load profiles are known with certainty. In practice, future load patterns exhibit significant variability [9]. To account for this uncertainty, we adopt a scenario-based stochastic programming framework using the reduced scenarios and their probabilities derived in Section 3.
Let be the set of scenarios, each with probability (). For a given scenario m, the active and reactive power demands at node i and time period h are denoted by and , respectively.
4.1. Decision Variables
The optimization problem involves two groups of decision variables:
- Master-stage (here-and-now) variables: Binary variables indicating whether a fixed-step capacitor of type c is installed at node i. These variables are common to all scenarios and must be determined before the actual load realization is known.
- Slave-stage scenario-dependent state variables: For each scenario , time period , and node , we define the following continuous variables that are scenario-dependent:
- –
- —voltage magnitude;
- –
- —voltage angle;
- –
- —active power generation (or substation injection);
- –
- —reactive power generation.
- These variables are uniquely determined by the capacitor placement decisions and the realized load scenario via the AC power-flow equations; they do not constitute independent recourse decisions but rather the operational state of the network.
4.2. Objective Function: Expected Net Present Cost
The goal is to minimize the expected value of the net present cost, where the expectation is taken over the scenario probabilities. The objective function is [8]
where denotes the set of scenario-dependent slave-stage state variables for scenario m, and is the same cost function defined in Equations (2)–(4), now evaluated using the scenario-dependent power-flow variables and the loads of scenario m. Concretely,
where the capacitor cost (Equation (4)) is independent of the scenario because it depends only on the master-stage decisions . The energy loss cost for scenario m is
with . The capitalization factor (Equation (3)) remains the same as in the deterministic case.
4.3. Constraints Under Uncertainty
All operational constraints must be satisfied for every scenario and every time period . The power balance equations become scenario-dependent:
where and are the scenario-specific load demands.
Generation limits are enforced per scenario:
The voltage magnitude limits must hold for every scenario:
4.4. Master-Stage Constraints
The capacitor placement constraints are identical to those in the deterministic formulation, as they do not depend on the scenario:
4.5. Compact Formulation
Collecting all components, the scenario-based stochastic optimization model can be written compactly as
This formulation is a scenario-based stochastic MINLP. The master-stage decisions are binary and affect the slave stage through the reactive power injections in Equation (18). The slave-stage problems (one per scenario) are continuous and nonlinear, corresponding to conventional AC power-flow problems with fixed capacitor placements. Importantly, the slave stage performs a deterministic evaluation of each candidate solution rather than an independent optimization; the state variables are uniquely determined by the power-flow equations once and the load scenario are fixed.
Remark 3.
The scenario-based stochastic model reduces to the deterministic model when and . The inclusion of multiple scenarios with probabilities allows the optimization to find capacitor allocations that perform well on average across a range of plausible loading conditions, thereby hedging against uncertainty. The scenario generation procedure (Section 3) provides the necessary inputs , and .
5. Solution Methodology
The optimal siting and sizing of fixed-step capacitor banks in distribution networks, formulated as an MINLP problem (Section 2) and extended to a scenario-based stochastic framework under load uncertainty (Section 4), is solved by a master–slave optimization framework. The master stage employs a Chu–Beasley genetic algorithm (CBGA) [30] to explore the discrete space of capacitor locations and sizes [18]. For each candidate configuration, the slave stage evaluates the expected network performance using a robust successive-approximation power flow (SAPF) method that accounts for the nonlinear AC equations [24].
5.1. Master Stage: Chu–Beasley Genetic Algorithm
The CBGA is a population-based metaheuristic that combines a standard genetic algorithm with a specialized constraint-handling mechanism originally developed for the multidimensional knapsack problem [18]. In our capacitor allocation problem, the binary decision variables must satisfy two practical constraints: (i) at most one capacitor bank per node, as defined in (12); and (ii) a limit on the total number of installed banks, as defined in (11). The CBGA enforces these constraints through a greedy repair operator integrated into the evolutionary loop.
5.1.1. Chromosome Encoding
Each individual (candidate solution) is encoded as a vector of length equal to the number of candidate nodes . The i-th gene takes an integer value from the set , where 0 means no capacitor is installed at node i, and a non-zero value indicates the index of the chosen discrete size (e.g., 50 kvar, 100 kvar, 150 kvar, etc.). This representation automatically satisfies the constraint in (12). The total number of banks constraint (maximum from (11)) is handled by the repair operator.
5.1.2. Initial Population
An initial population of individuals is generated randomly. For each individual, we select a random subset of nodes (size not exceeding ) and assign to each selected node a random capacitor size from the available set . The remaining nodes receive 0.
5.1.3. Fitness Evaluation
For a given individual (i.e., a specific placement vector ), the fitness (cost to minimize) is computed as the expected net present cost (or deterministic cost when ). The evaluation involves the following steps:
- 1.
- For each scenario (with in the deterministic case) and each time period , run the SAPF solver (Section 5.2) to obtain the steady-state voltages and the slack bus power .
- 2.
- Compute the active power loss for scenario m and period h from the slack bus injection using (25):where the second term sums the total active load in that scenario.
- 3.
- 4.
- Compute the capacitor investment and operation cost using (4) (independent of the scenario).
- 5.
- The total expected cost is .
If an individual violates the total number of banks limit after initialization or after genetic operations, the repair operator (described next) is invoked before the SAPF evaluation. In the rare case that repair does not fully restore feasibility, a quadratic penalty term is added to the fitness as defined in (26):
with .
5.1.4. Repair Operator (Greedy Removal)
Given an individual that has banks installed, we repeatedly remove the bank that contributes the least to reducing energy losses. The contribution of each installed bank is approximated by evaluating the network with and without that bank using a fast sensitivity factor or a single SAPF iteration. The removal continues until the bank limit is satisfied. This greedy strategy preserves the most valuable capacitor placements and is inspired by the original Chu–Beasley heuristic.
5.1.5. Genetic Operators
- Selection: Binary tournament selection (tournament size 2) chooses parents for crossover.
- Crossover: Uniform crossover is applied with probability . For each gene position, the offspring inherits the allele from either parent with equal probability. After crossover, the repair operator is applied if necessary.
- Mutation: Each gene is mutated with probability . A mutation either changes the capacitor size at a node to another available size (including zero) or swaps the sizes between two randomly selected nodes. The repair operator is then applied.
- Elitism: The best individual (lowest cost) is preserved unchanged to the next generation (elitism size 1).
The algorithm terminates after generations or when the best fitness does not improve for 30 consecutive generations.
5.2. Lower Stage: Successive-Approximation Power Flow (SAPF)
The lower-level component evaluates the technical feasibility of a given capacitor placement under a specific load scenario (deterministic or one of the reduced stochastic scenarios). The nonlinear AC power-flow equations (Equations (6) and (7) and their stochastic counterparts in Equations (17) and (18)) are solved using the complex-domain successive-approximation method [31]. This method is particularly robust for radial and weakly meshed distribution networks and avoids the convergence issues that may affect Newton–Raphson when starting from flat voltage profiles.
5.2.1. Matrix-Based Formulation
Let be the set of demand nodes (all buses except the slack) and the slack bus (substation). For each time period and a given scenario (or deterministic load), the iterative scheme is defined in (27):
where
- is the vector of complex voltages at the demand nodes at iteration k;
- is the submatrix of the nodal admittance matrix corresponding to the demand nodes; is computed once offline;
- is the coupling submatrix between demand nodes and the slack bus;
- is the fixed complex voltage at the slack bus (typically p.u.);
- is the conjugate of the net complex power injection at the demand nodes, given by (28):where is the vector of active and reactive load demands, and accounts for the reactive power injected by the fixed-step capacitors (note that the capacitors supply only reactive power, so the active part is zero). The vector is obtained from the placement decisions and the discrete sizes .
The term denotes the inverse of the diagonal matrix formed by the complex conjugate of the voltages at iteration k.
5.2.2. Convergence Criterion
The iterative process stops when the maximum voltage variation between consecutive iterations falls below a prescribed tolerance as defined in (29):
with (chosen to ensure high accuracy for subsequent cost calculations). Typically, convergence is achieved in fewer than 30 iterations for well-conditioned distribution networks.
5.2.3. Slack Bus Power and Losses
5.2.4. Feasibility Assessment
A candidate capacitor placement is considered technically feasible if the following holds:
- 1.
- 2.
- The resulting voltage magnitudes satisfy the regulatory limits defined in (10):
If either condition is violated, the candidate is penalized in the CBGA fitness function (by adding a large constant to the cost), steering the search away from infeasible regions.
5.3. Integration of Master and Slave Stages
Algorithm 1 summarizes the complete master–slave procedure for the stochastic capacitor placement problem. The deterministic case is a special instance with and .
| Algorithm 1 Master–slave CBGA–SAPF for stochastic optimal capacitor placement |
|
The offline computation of is a one-time cost, after which each SAPF iteration only requires a few matrix–vector multiplications, making the slave stage extremely efficient.
Table 2 lists the key parameters used in our implementation.
Table 2.
CBGA and SAPF parameters.
The proposed methodology successfully balances solution quality and computational tractability, enabling the robust optimization of fixed-step capacitor banks under both deterministic and uncertain load conditions, as demonstrated in the following section.
6. Description of the Test System and Input Data
The proposed methodology (combining the random sampling strategy with the SAPF method) for optimal allocation and sizing of fixed-step capacitor banks was validated on the standard 33-bus distribution network [4]. The objective was to minimize the expected annual operating cost, which includes energy losses together with the purchase, installation, and maintenance of reactive power compensators. The radial configuration of this feeder was examined, as it is the most common topology in practical distribution systems. Figure 1 shows the corresponding single-line diagram.
Figure 1.
Single-line diagram of the 33-bus distribution network (radial topology).
The branch parameters and peak load values are listed in Table 3. To capture the temporal variation in demand, Figure 2 presents the daily active and reactive power profiles over a 24 h horizon, discretized into 48 half-hour intervals.
Table 3.
Branch and load data of the 33-bus radial feeder.
Figure 2.
Active and reactive power profiles over a 24 h load cycle for the deterministic operation case.
The economic parameters used to evaluate the objective function are summarized in Table 4. Each fixed-step capacitor bank provides 50 kvar, and up to twenty units can be installed in parallel at a single bus (i.e., a maximum of 1000 kvar per node).
Table 4.
Parameters for the cost function evaluation.
Remark 4.
It is important to clarify that the 1000 kvar maximum capacity per node is selected to reflect practical constraints for medium-voltage distribution networks. In such systems, capacitor bank ratings typically range from 300 kvar to several Mvar, and 1000 kvar is a standard upper bound for a single installation, preventing the optimization from aggregating an unrealistic number of units at a single bus [21,32].
Observe that the maximum number of capacitor banks permitted for installation is set to , corresponding to the parameter in the optimization code. This limit is enforced by the CBGA repair operator and reflects a practical utility constraint on the number of discrete compensation devices.
7. Simulation Results
7.1. Simulation Based-Optimization Cases
Figure 3 and Figure 4 illustrate the load uncertainty modeling and scenarion reduction results for the test feeder. For active power (Figure 3) and reactive power (Figure 4), the gray envelope represents the mean ± one standard deviation computed from the 365 generated daily curves, the black curve is the original deterministic profile, and the ten cyan lines are the reduced scenarios obtained via k-means clustering. The reduced scenarios closely follow the mean envelope while capturing the most probable extreme variations. Figure 5 shows the probability of each reduced scenario, computed as the relative frequency of the original curves assigned to the corresponding cluster. These probabilities are used as weights in the stochastic optimization model (Section 4), ensuring that the capacitor placement decisions are cost-effective on average across the full range of plausible loading conditions. The validity of using only 10 scenarios to approximate the full 365-scenario set is supported by the MAE (<2%) and a moderate silhouette score (0.25), which indicates that while the scenarios are not well separated, they still capture the average behavior necessary for the expectation-based optimization.
Figure 3.
Active power: envelope of 365 generated curves (mean ± standard deviation) in gray, original deterministic curve in black, and the 10 reduced scenarios in cyan.
Figure 4.
Reactive power: envelope of 365 generated curves (mean ± standard deviation) in gray, original deterministic curve in black, and the 10 reduced scenarios in cyan.
Figure 5.
Probabilities of the 10 reduced scenarios (values above bars).
7.2. Deterministic Simulation Scenario
In this simulation scenario, the optimal placement of capacitor banks is explored over a planning horizon of 20 years. The results obtained by the proposed CBGA are presented in Table 5. Three possible increments in the expected energy purchasing cost are considered: 0% (base case), 10% (moderate increase), and 20% (high variation).
Table 5.
Numerical results in the case of the deterministic operation scenario.
The deterministic optimization results, summarized in Table 5, provide valuable insights into the siting and sizing behavior of the CBGA under different energy-cost-escalation scenarios. The analysis focuses on the consistency of the optimal allocations, the economic rationale behind capacity expansions, and the overall efficiency gains.
7.2.1. Siting Consistency and Technical Plausibility
A first observation is the remarkable stability of the optimal locations. Buses 25 and 30 appear in all three scenarios, while bus 13 is selected in two of them (only replaced by bus 12 in the 10% escalation case). This result is technically consistent with the radial topology of the 33-bus system:
- Bus 30 is located at the far end of a heavily loaded lateral feeder, historically identified as a critical voltage support point;
- Bus 25 lies at the extreme of a long main branch, where reactive power compensation significantly reduces line losses;
- Buses 12 and 13 are adjacent nodes on the same feeder section, indicating that the objective function in that region is relatively flat. The swap observed at 10% escalation suggests that both configurations yield nearly identical economic performance, a phenomenon often associated with near-optimal plateaus in discrete combinatorial problems.
This consistency validates that the CBGA-SAPF framework effectively prioritizes the most sensitive network nodes, avoiding erratic or physically implausible allocations.
7.2.2. Sizing Response to Economic Signals
The total installed reactive capacity increases from 800 kvar (0% escalation) to 850 kvar (10% and 20% escalations). This incremental adjustment reflects a rational economic response:
- As the unit cost of energy rises, the capitalized value of avoided losses also increases, justifying the additional investment in an extra 50 kvar step;
- The discrete nature of commercially available banks is strictly respected, with sizes taking values such as 100, 150, 200, 500, and 550 kvar, confirming that the proposed MINLP formulation successfully enforces the fixed-step constraint.
It is worth noting that the algorithm does not install larger capacities (e.g., 900 or 1000 kvar). This indicates that the marginal cost of adding further banks—considering purchase, installation, and operation/maintenance expenditures—exceeds the marginal benefit of additional loss reduction at the selected nodes. This behavior confirms the correct implementation of the economic trade-off embedded in the objective function.
7.2.3. Cost Reduction and Escalation Effects
From an absolute perspective, the optimal net present cost rises with energy price escalation: from $1.038 MUSD to $1.235 MUSD. This increase is expected, as the baseline cost (without capacitors) also inflates substantially: from $1.244 MUSD to $1.493 MUSD. More importantly, the percentage reduction improves slightly but steadily:
- 16.52% for 0% escalation;
- 16.86% for 10% escalation;
- 17.30% for 20% escalation.
This monotonic increase in relative savings reveals a key managerial insight: capacitor banks become more economically effective when energy prices are higher, because the avoided energy losses carry a greater monetary weight. The algorithm successfully adapts to rising costs by slightly increasing the reactive power injection, thereby enhancing the return on investment of the capacitor banks.
7.2.4. Critical Remarks and Assumptions
Two important aspects must be clarified regarding these deterministic results:
- 1.
- The losses used in the objective function are computed by integrating the 24 h load curve (discretized into 48 half-hour intervals), not by using a single peak-load condition. Therefore, the optimal capacities are designed to minimize the annual energy losses, ensuring that the solution is effective during off-peak and light-load periods as well.
- 2.
- The algorithm stops at 850 kvar because the net present value of the additional bank would be negative. This reinforces that the CBGA is not simply adding capacitors arbitrarily but is solving the true economic optimization problem.
7.2.5. Bridge to Stochastic Optimization
The deterministic results serve as a baseline for comparison with the stochastic framework. In particular, they illustrate the vulnerability of point-estimate planning: if the utility optimizes solely for a 0% escalation scenario, but future energy costs rise to 20%, the allocation would remain at 800 kvar, potentially leading to suboptimal operation. This limitation underscores the need for the scenario-based stochastic approach presented in the subsequent sections, which hedges against such uncertainties by producing robust decisions that perform well across a range of probable loading and pricing conditions.
Overall, the deterministic simulation confirms that the proposed master–slave methodology yields technically sound and economically coherent capacitor allocations, providing a solid foundation for the more advanced stochastic analysis that follows.
7.3. Stochastic Simulation Scenario
Complementing the deterministic analysis, this subsection evaluates the optimal capacitor placement under load uncertainty using the scenario-based stochastic framework. The Chu–Beasley genetic algorithm is again employed to solve the scenario-based stochastic model, considering the same 20-year planning horizon and the three energy-cost-escalation levels (0%, 10%, and 20%). The resulting optimal allocations, summarized in Table 6, are compared against their deterministic counterparts to quantify the benefits of explicitly incorporating demand variability into the planning process. Unlike the deterministic case, where a single load profile is assumed, the stochastic approach optimizes the expected net present cost across the ten reduced scenarios derived in Section 4, thereby producing capacitor siting and sizing decisions that are robust to daily and seasonal load fluctuations.
Table 6.
Numerical results in the case of the stochastic operation scenario.
Before analyzing the stochastic optimization results, it is essential to contextualize the nature of the reduced scenarios. As discussed in Section 3, the 10 reduced scenarios are near-copies of the deterministic base profile because the k-means clustering averages approximately 36 realizations per centroid, reducing the noise variance by a factor of approximately . This “uncertainty mode degeneration” explains why the stochastic and deterministic results are nearly identical across all escalation levels, as observed in Table 6 compared to Table 5. The small differences that appear (e.g., at 0% and 10% escalation) arise from the residual variability that survived the averaging process, but the overall similarity indicates that the current scenarion reduction procedure does not fully exploit the potential of the stochastic formulation. This limitation should be kept in mind when interpreting the results.
This degeneration is further corroborated by the low silhouette score (0.25) obtained from the k-means clustering, which indicates that the clusters are not well separated, as expected from the unimodal data generation.
The stochastic optimization results reveal several important insights regarding the behavior of the CBGA-SAPF framework when confronted with load uncertainty.
It is important to clarify that the proposed stochastic formulation minimizes the expected net present cost without incorporating explicit risk measures (e.g., value-at-risk, conditional value-at-risk, or chance constraints). The model is therefore a risk-neutral expectation-minimization approach. The conservative investment behavior observed at the 10% escalation level—where only 750 kvar are installed compared to 850 kvar in the deterministic case—is not a deliberately designed risk-aversion mechanism. Rather, it is a natural economic consequence of the expectation-based optimization: the marginal benefit of the additional capacitor bank, when averaged across all ten load scenarios, does not justify its cost. This distinction is important because true risk-averse planning, which would explicitly penalize poor performance in extreme scenarios, would require additional mechanisms, such as CVaR constraints or penalty terms for worst-case outcomes, which are beyond the scope of the present work.
It is also worth noting that all the stochastic results were obtained using the 10 reduced scenarios. While the MAE and silhouette metrics support the representativeness of these scenarios, the fidelity of the optimal placement itself remains an assumption, as a direct comparison with the full 365-scenario optimization was not performed. This validation is left as future work.
7.3.1. Siting Behavior Under Uncertainty
A notable observation is the greater variability in optimal locations compared to the deterministic case. For the 0% escalation scenario, the stochastic solution selects buses 8, 15, and 30, whereas the deterministic counterpart favored buses 13, 25, and 30. This shift indicates that when load uncertainty is considered, the algorithm prioritizes nodes that provide more consistent voltage support across a wider range of loading conditions, rather than nodes that are optimal only for a single load profile. Specifically:
- Bus 8, located in the middle of the main feeder, serves as a strategic point that benefits both upstream and downstream sections, offering better average performance when demand fluctuates;
- Bus 15, positioned on a lateral branch, provides localized support that becomes critical during high-demand realizations;
- Bus 30, consistently selected across most scenarios, confirms its status as a critical voltage support node due to its location at the far end of a heavily loaded feeder.
For the 10% escalation case, the stochastic solution selects buses 11, 30, and 31, a notably different configuration compared to the deterministic selection of buses 12, 25, and 30. This configuration features no capacitor at bus 31 (size 0), meaning only two banks are actually installed, with total capacity of 750 kvar. This intriguing result suggests that under moderate energy cost escalation and load uncertainty, the marginal benefit of the third bank becomes negative when considering the expected cost across multiple scenarios, indicating that the algorithm is making a more conservative investment decision to avoid over-investment that might not pay off under all loading conditions.
For the 20% escalation case, the stochastic solution converges to buses 13, 25, and 30 with capacities [200, 100, 550] kvar, which is identical to the deterministic solution for the same escalation level. This convergence suggests that when energy costs are sufficiently high, the economic signals dominate the uncertainty, leading to a clear optimal configuration that remains effective regardless of load variability.
7.3.2. Sizing Response and Total Installed Capacity
The total installed reactive capacity in the stochastic case exhibits a non-monotonic pattern:
- 0% escalation: 800 kvar (buses 8, 15, 30 with 150, 150, 500 kvar, respectively);
- 10% escalation: 750 kvar (buses 11, 30, 31 with 250, 500, 0 kvar);
- 20% escalation: 850 kvar (buses 13, 25, 30 with 200, 100, 550 kvar).
The reduced capacity at 10% escalation (750 kvar) compared to the deterministic case (850 kvar) is particularly noteworthy. This indicates that under moderate economic pressure combined with load uncertainty, the optimal strategy is to invest less in compensation, relying instead on the inherent flexibility of the network to accommodate load variations. This conservative behavior reflects a risk-averse approach: the algorithm avoids committing capital to capacitors that might be underutilized in certain load scenarios, thereby improving the expected return on investment.
7.3.3. Cost Analysis and Savings Performance
The absolute net present costs increase with energy price escalation, as expected: from $1.037 MUSD to $1.234 MUSD. However, the percentage reductions relative to the uncompensated case show interesting behavior:
- 0% escalation: 16.65% reduction;
- 10% escalation: 16.76% reduction;
- 20% escalation: 17.34% reduction.
The savings at 0% escalation (16.65%) are slightly higher than the deterministic equivalent (16.52%), indicating that the stochastic solution provides better average performance when multiple load scenarios are considered, even though it sacrifices some performance on the specific base load profile. This is the essence of robust optimization: accepting a small compromise in one specific condition to gain improved performance across a broader range of conditions.
At 10% escalation, the stochastic solution achieves 16.76% savings compared to 16.86% in the deterministic case. The slightly lower savings reflect the conservative investment strategy (750 kvar vs. 850 kvar) adopted under uncertainty. This trade-off suggests that the deterministic solution may achieve marginally better savings on the specific load profile but at the cost of potentially poor performance during off-nominal conditions, which the stochastic solution avoids.
At 20% escalation, both deterministic and stochastic solutions achieve nearly identical savings (17.34% vs. 17.30%). This convergence reinforces the earlier observation that high energy costs dominate the optimization objective, making the solution relatively insensitive to load uncertainty.
7.3.4. Comparative Analysis: Deterministic vs. Stochastic
To better understand the differences between deterministic and stochastic planning, Table 7 presents a side-by-side comparison of the optimal configurations and the corresponding expected costs evaluated under the stochastic scenario set.
Table 7.
Comparison of deterministic and stochastic optimal configurations.
The comparative analysis reveals three distinct regimes:
- 1.
- The stochastic solution achieves a cost saving of approximately $1637 (0.16%) compared to the deterministic solution when evaluated under the stochastic scenario set. This confirms that explicitly accounting for load uncertainty yields tangible economic benefits, even when the baseline energy cost is low. The improvement stems from the strategic relocation of capacitors to nodes that provide more consistent performance across all load realizations.
- 2.
- In this regime, the deterministic solution performs slightly better on the stochastic evaluation, with a cost advantage of approximately $1305 (0.11%). This surprising outcome is explained by the conservative investment strategy adopted by the stochastic algorithm: by installing only 750 kvar (compared to 850 kvar in the deterministic case), it avoids potential over-investment, but this conservative stance proves marginally suboptimal under the specific probabilistic scenario set used for evaluation. It is important to note, however, that this does not invalidate the stochastic approach; rather, it highlights the inherent trade-off between risk and return, and underscores the importance of selecting an appropriate level of risk aversion in the optimization objective.
- 3.
- The stochastic and deterministic solutions effectively converge, with the stochastic approach achieving a slight cost advantage of approximately $655 (0.05%). This convergence indicates that when energy costs are high, the marginal benefit of additional capacitor capacity outweighs the uncertainty, leading to a clear and consistent optimal configuration regardless of the approach used.
7.3.5. Implications for Practical Planning
The results presented above carry several important implications for distribution system operators and utility planners:
- 1.
- The stochastic framework consistently delivers solutions that are either superior or comparable to deterministic planning, particularly when energy costs are low or high. The added value of accounting for load uncertainty is most pronounced in the low-cost regime, where economic signals are weak and the optimization must rely more heavily on the structural characteristics of the network.
- 2.
- The stochastic algorithm’s tendency to invest less in capacitors under moderate cost escalation (10% case) illustrates its capacity for risk management. By installing fewer banks, the planner avoids the sunk cost of equipment that might be underutilized during off-peak periods. This is particularly relevant in deregulated markets, where financial risk must be carefully managed.
- 3.
- The convergence observed at 20% escalation suggests that when energy prices are sufficiently high, the economic objective dominates the planning problem, rendering the effect of load uncertainty secondary. This provides a practical guideline: planners should invest more in detailed scenario generation when energy prices are volatile and relatively low, whereas high and stable prices may justify a simpler deterministic approach.
- 4.
- The stochastic approach, despite requiring 10 power-flow evaluations per candidate solution compared to 1 in the deterministic case, remains computationally feasible. The total processing time for the stochastic optimization was approximately 2.3 h on a standard desktop computer (Intel Core i7, 16 GB RAM), which is acceptable for off-line planning studies. The scenario reduction via k-means clustering proved instrumental in achieving this efficiency. The 36.5-fold reduction from the original 365 scenarios is achieved through the k-means clustering step, which reduces the number of power-flow evaluations per candidate solution.
7.3.6. Summary of Stochastic Findings
In summary, the stochastic optimization framework successfully produces capacitor placement solutions that are robust to load uncertainty, yielding either superior or comparable economic performance relative to deterministic planning across all three escalation scenarios. The algorithm’s ability to strategically relocate capacitors and adjust total installed capacity in response to both economic signals and uncertainty demonstrates its effectiveness as a planning tool. The results underscore the importance of probabilistic modeling for modern distribution network planning, especially in contexts characterized by increasing demand variability and renewable energy integration.
The convergence of deterministic and stochastic solutions at the 20% escalation level further validates the CBGA-SAPF methodology, confirming that the algorithm consistently identifies the most economically attractive configurations, regardless of whether uncertainty is explicitly considered. This robustness adds confidence to the use of the proposed framework for practical applications where both load uncertainty and energy price evolution are critical factors in investment decisions.
7.4. Stochastic vs. Deterministic Optimization: A Comparative Analysis
The comparative analysis between deterministic and stochastic optimization frameworks reveals fundamental insights into the role of load modeling in distribution network planning. The deterministic approach, when implemented with high-resolution temporal data (e.g., 30-min or 1 h intervals as employed in this study), provides a remarkably accurate approximation of the network’s operational behavior. This high-resolution modeling captures the intrinsic daily load patterns, including morning and evening peaks, midday valleys, and hourly variations, thereby enabling the optimization algorithm to make informed decisions that effectively reduce annual energy losses. The deterministic results presented in Table 5 demonstrate this capability, achieving cost reductions between 16.52% and 17.30% across different energy-escalation scenarios. The consistency of optimal locations (buses 25 and 30 appearing in all cases) and the rational sizing response to economic signals confirm that the deterministic framework, when fed with sufficiently detailed load profiles, successfully identifies the most critical nodes for reactive power compensation. This is particularly relevant for planning studies where historical load data are available and daily patterns are relatively stable, as the deterministic model offers a computationally efficient and practically reliable solution with processing times significantly lower than its stochastic counterpart. It is worth noting that the deterministic framework, when fed with high-resolution load profiles, can often approximate the expected operational cost with sufficient accuracy, as the convergence at the 20% escalation level confirms. This reinforces the value of detailed temporal modeling even in deterministic settings.
However, despite the validity of high-resolution deterministic modeling, the stochastic optimization framework offers distinct advantages that become increasingly valuable in modern distribution systems characterized by growing load variability and renewable energy penetration. First, the stochastic approach explicitly accounts for the probabilistic nature of load demand, producing solutions that are robust across a wide range of operating conditions rather than being optimized for a single representative profile. This robustness is clearly demonstrated in Table 6, where the stochastic solution achieves superior cost savings at the 0% escalation level (16.65% vs. 16.52%) and maintains competitive performance across all scenarios. Second, the stochastic framework inherently accounts for load variability in the optimization objective, producing solutions that are robust across scenarios. The conservative investment strategy observed at the 10% escalation level—where the stochastic solution installs only 750 kvar compared to 850 kvar in the deterministic case—illustrates how the algorithm adjusts installed capacity in response to the probabilistic distribution of loads; it invests less because the expected benefit of the marginal bank does not justify its cost when averaged over all scenarios. This behavior, while appearing “conservative”, is a direct consequence of the expectation-based formulation and does not imply an explicit risk-penalty mechanism. Third, the scenario-based formulation enables planners to quantify the uncertainty inherent in their decisions, providing not only an optimal solution but also insights into its performance envelope, thereby facilitating more informed decision making under uncertainty.
The choice between deterministic and stochastic approaches ultimately depends on the specific planning context and available data. Deterministic modeling with high temporal resolution (30-min or 1 h intervals) is recommended when (i) historical load data are well-established and exhibit predictable daily and seasonal patterns; (ii) computational efficiency is a primary concern, as deterministic optimization requires only a fraction of the computational effort of stochastic methods; and (iii) the planning horizon is relatively short and uncertainty is minimal. Conversely, stochastic optimization is strongly advised when (i) significant load variability exists due to renewable energy integration, electric vehicle charging, or weather-dependent demand patterns; (ii) the utility seeks to hedge against financial risk and avoid suboptimal investment decisions; and (iii) the planning horizon is long-term and the cost of uncertainty is high. Importantly, the convergence of deterministic and stochastic solutions at the 20% escalation level—where both approaches achieve nearly identical cost savings (17.30% vs. 17.34%)—suggests that high-resolution deterministic modeling can serve as a reliable approximation in scenarios where economic factors strongly dominate the optimization objective. This finding provides practical guidance for distribution system operators: when energy costs are high and stable, deterministic planning with fine temporal granularity may be sufficient; however, when energy prices are volatile and relatively low, stochastic optimization offers significant added value by ensuring robust and cost-effective capacitor placement across all probable operating conditions. The complementary nature of both approaches, rather than their opposition, ultimately provides planners with a comprehensive toolkit for addressing the diverse challenges of modern distribution network planning.
8. Conclusions and Future Work
This paper has presented a novel master–slave stochastic optimization framework for the optimal siting and sizing of fixed-step capacitor banks in medium-voltage distribution networks, addressing the critical challenge of load demand uncertainty that is often neglected in conventional deterministic planning. The proposed methodology integrates a scenario-based stochastic optimization model with a Chu–Beasley genetic algorithm (CBGA) as the master stage and a successive-approximation power flow (SAPF) method as the slave stage. The stochastic formulation explicitly accounts for the probabilistic nature of load demand through a scenario-based approach, where 365 daily load realizations are generated via independent Gaussian noise and subsequently reduced to 10 representative scenarios using k-means clustering, reducing the number of power-flow evaluations per candidate solution from 365 to 10 (a 36.5-fold reduction). The quality of the scenario representation is validated through MAE (<2%) and a low silhouette score (0.25)—the latter being a consequence of the unimodal generation and the independent noise model—indicating that while the centroids faithfully represent the average load, they do not preserve the full variability. Importantly, the slave stage performs a deterministic evaluation of each candidate via power-flow solutions, rather than an independent optimization with recourse; the scenario-dependent state variables are uniquely determined once the master-stage decisions and the load scenario are fixed.
The numerical results obtained from the IEEE 33-bus test system, considering three energy-cost-escalation levels (0%, 10%, and 20%) as parametric cases, demonstrate that the stochastic approach consistently delivers solutions that are either superior or comparable to deterministic planning, with the most significant advantages observed when energy costs are low and load variability is high. The comparative analysis reveals that high-resolution deterministic modeling (30-min intervals) provides a remarkably accurate and computationally efficient approximation when load patterns are stable and historical data are well established, reducing total net present costs by 16.52% to 17.30% relative to the uncompensated case. The convergence of both approaches at the 20% escalation level suggests that when energy costs are sufficiently high, the economic incentives for reactive power compensation dominate the planning problem, rendering the effect of load uncertainty secondary in determining the optimal configuration.
The CBGA-SAPF methodology proved to be computationally efficient for the 33-bus system, with stochastic optimization requiring approximately 2.3 h on a standard desktop computer, demonstrating the practical feasibility of the proposed framework for off-line planning studies. The stochastic framework offers distinct advantages, including robust solutions across a wide range of operating conditions, an inherent ability to adjust investment levels in response to probabilistic load distributions, and the capacity to quantify uncertainty in decision making.
However, several important limitations of the current study must be acknowledged. First, the scenario generation relies on a Gaussian noise model, which may not fully capture the skewness and heavy tails observed in real load data. Second, the k-means clustering approach averages multiple realizations, resulting in a phenomenon we term “uncertainty mode degeneration”, which limits the variability captured by the reduced scenarios. Third, the risk-neutral expectation-based formulation does not explicitly penalize poor performance in extreme scenarios. Fourth, the methodology has been validated only on the 33-bus system, with no scalability analysis for larger networks. Fifth, we have not benchmarked the CBGA against other metaheuristics or alternative scenarion reduction techniques. Sixth, voltage profile results and convergence analysis for the CBGA are not presented. These limitations provide clear directions for future research.
Future work should first address the limitations identified above, including a direct validation of the reduced-scenario approach by solving the optimization with the full 365-scenario set, which would provide definitive evidence of the fidelity of the reduced optimal solution. Second, alternative scenario generation and reduction techniques that better preserve variability—such as moment matching, stratified sampling, or scenario trees that incorporate temporal correlation structures—should be explored to overcome the uncertainty mode degeneration observed with k-means clustering. Third, the integration of additional uncertainty sources—including renewable energy generation from photovoltaic systems and wind turbines, electric vehicle charging patterns, and energy price volatility (currently treated through fixed parametric scenarios rather than stochastic modeling)—would significantly extend the practical relevance of the framework, requiring the development of multidimensional uncertainty models that capture the correlations between different stochastic variables. Fourth, the incorporation of explicit risk measures such as conditional value-at-risk (CVaR) or chance constraints would enable risk-averse planning, ensuring robust performance under extreme scenarios. Fifth, benchmarking the CBGA against alternative metaheuristics (PSO, differential evolution, simulated annealing) and comparing k-means with other scenarion reduction methods (moment matching, scenario aggregation) would provide valuable insights into the relative performance and robustness of our approach. Sixth, testing the methodology on larger distribution networks (69-bus, 85-bus, 136-bus systems) would provide critical scalability insights, along with a detailed computational time breakdown to identify the dominant factors affecting performance. Seventh, the application of the proposed methodology to real-world distribution networks in collaboration with utility companies would provide practical validation of the framework’s effectiveness, addressing implementation challenges such as data availability, system integration, and regulatory compliance. Finally, the extension of the framework to include dynamic energy pricing schemes, demand response programs, and switched capacitor banks would capture the increasing complexity of modern electricity markets, enabling the optimization to consider time-varying energy costs and consumer participation in grid management. These research directions collectively aim to bridge the gap between academic research and industrial practice in distribution network planning and operation.
Author Contributions
Conceptualization, methodology, software, and writing (review and editing): O.D.M., L.F.G.-N., and J.M.S.-C. All authors have read and agreed to the published version of the manuscript.
Funding
The authors acknowledge the support provided by Thematic Network 723RT0150, i.e., Red para la integración a gran escala de energías renovables en sistemas eléctricos (RIBIERSE-CYTED), funded through the 2022 call for thematic networks of the CYTED (Ibero-American Program of Science and Technology for Development). The first author would like to express gratitude to the Research Office of Universidad Distrital Francisco José de Caldas for supporting the internal research project, code 33787724, titled “Desarrollo de una metodología de gestión eficiente de potencia reactiva en sistemas de distribución de media tensión empleando modelos de programación no lineal.”
Data Availability Statement
The original contributions presented in this study are included in the manuscript. Further inquiries can be directed to the corresponding author.
Acknowledgments
The authors acknowledge the use of AI-based tools, including DeepSeek, (version V3) which supported the refinement of the manuscript’s language, structure, and overall clarity. These tools were utilized exclusively to improve the presentation and readability of the original ideas, formulations, and numerical simulations provided by the authors. Importantly, the AI tools did not contribute to the development of the scientific content, to the formulation, or the validity of the results, for which the authors assume full responsibility.
Conflicts of Interest
The authors declare no conflicts of interest.
References
- Zhou, M.; Chen, S.; Huang, K.; Liang, J.; Fu, M.; Sun, G. Coordination of medium-voltage distribution networks and microgrids based on an aggregate flexibility region approach. Sustain. Energy Grids Netw. 2024, 39, 101485. [Google Scholar] [CrossRef] [Scilit]
- Hachemi, A.T.; Sadaoui, F.; Saim, A.; Ebeed, M.; Abbou, H.E.A.; Arif, S. Optimal Operation of Distribution Networks Considering Renewable Energy Sources Integration and Demand Side Response. Sustainability 2023, 15, 16707. [Google Scholar] [CrossRef] [Scilit]
- Mahdavi, M.; Soleimani, A.; Pinnarelli, A.; Heidari, M.; Jurado, F. Cost-based optimization of DG and capacitor placement in distribution networks under dynamic load conditions. Energy Rep. 2025, 13, 5525–5534. [Google Scholar] [CrossRef] [Scilit]
- Montoya, O.D.; Gil-González, W.; Hernández, J.C. Efficient Integration of Fixed-Step Capacitor Banks and D-STATCOMs in Radial and Meshed Distribution Networks Considering Daily Operation Curves. Energies 2023, 16, 3532. [Google Scholar] [CrossRef] [Scilit]
- Montazeri, M.; Askarzadeh, A. Capacitor placement in radial distribution networks based on identification of high potential busses. Int. Trans. Electr. Energy Syst. 2018, 29, e2754. [Google Scholar] [CrossRef] [Scilit]
- Ivković, S.; Bosović, A.; Musić, M. Optimal Capacitor Placement in Real Distribution Network with Reactive Power Support of Distributed Generation. B&H Electr. Eng. 2024, 18, 12–23. [Google Scholar] [CrossRef] [Scilit]
- Alao, M.A.; Popoola, O.M. Optimal allocation of distributed generators and capacitor banks considering load models under stochastic load levels. Renew. Energy Focus 2026, 56, 100773. [Google Scholar] [CrossRef] [Scilit]
- Gil-González, W.J.; Herrera-Orozco, A.R.; Molina-Cabrera, A. Stochastic Mixed-Integer Branch Flow Optimization for the Optimal Integration of Fixed-Step Capacitor Banks in Electrical Distribution Grids. Ingeniería 2024, 29, e21340. [Google Scholar] [CrossRef] [Scilit]
- Montoya, O.D.; Torres-Pinzón, C.A.; Sánchez-Céspedes, J.M. Stochastic Techno-Economic Assessment of TSC Sizing in Distribution Networks. Sci 2025, 7, 172. [Google Scholar] [CrossRef] [Scilit]
- Grainger, J.; Lee, S. Optimum Size and Location of Shunt Capacitors for Reduction of Losses on Distribution Feeders. IEEE Trans. Power Appar. Syst. 1981, PAS-100, 1105–1118. [Google Scholar] [CrossRef] [Scilit]
- Baran, M.; Wu, F. Optimal sizing of capacitors placed on a radial distribution system. IEEE Trans. Power Deliv. 1989, 4, 735–743. [Google Scholar] [CrossRef] [Scilit]
- Soma, G.G. Optimal Sizing and Placement of Capacitor Banks in Distribution Networks Using a Genetic Algorithm. Electricity 2021, 2, 187–204. [Google Scholar] [CrossRef] [Scilit]
- Singh, S.; Rao, A. Optimal allocation of capacitors in distribution systems using particle swarm optimization. Int. J. Electr. Power Energy Syst. 2012, 43, 1267–1275. [Google Scholar] [CrossRef] [Scilit]
- Kaur, H.; Kumar, P.; Sharma, A.; Kamaiya, N. A study on optimal capacitor placement in distribution system: Conventional and Artificial Intelligence techniques. In Proceedings of the 2015 International Conference on Computation of Power, Energy, Information and Communication (ICCPEIC); IEEE: New York, NY, USA, 2015; pp. 159–165. [Google Scholar] [CrossRef] [Scilit]
- Tahir, M.J.; Rasheed, M.B.; Rahmat, M.K. Optimal Placement of Capacitors in Radial Distribution Grids via Enhanced Modified Particle Swarm Optimization. Energies 2022, 15, 2452. [Google Scholar] [CrossRef] [Scilit]
- Fettah, K.; Guia, T.; Salhi, A.; Mouassa, S.; Bosisio, A.; Shirvani, R. Optimal Allocation of Capacitor Banks and Distributed Generation: A Comparison of Recently Developed Metaheuristic Optimization Techniques on the Real Distribution Networks of ALG-AB-Hassi Sida, Algeria. Sustainability 2024, 16, 4419. [Google Scholar] [CrossRef] [Scilit]
- Sharma, S.; Ghosh, S. Optimal planning and placement of capacitor in distribution system based on Particle Swarm and Hybrid Bee-Cuckoo Search under Varying Load Conditions. Energy Rep. 2025, 13, 5219–5237. [Google Scholar] [CrossRef] [Scilit]
- Chu, P.; Beasley, J. A Genetic Algorithm for the Multidimensional Knapsack Problem. J. Heuristics 1998, 4, 63–86. [Google Scholar] [CrossRef] [Scilit]
- Riaño, F.E.; Cruz, J.F.; Montoya, O.D.; Chamorro, H.R.; Alvarado-Barrios, L. Reduction of Losses and Operating Costs in Distribution Networks Using a Genetic Algorithm and Mathematical Optimization. Electronics 2021, 10, 419. [Google Scholar] [CrossRef] [Scilit]
- Kavousi-Fard, A.; Niknam, T. Considering uncertainty in the multi-objective stochastic capacitor allocation problem using a novel self adaptive modification approach. Electr. Power Syst. Res. 2013, 103, 16–27. [Google Scholar] [CrossRef] [Scilit]
- Tamilselvan, V.; Jayabarathi, T.; Raghunathan, T.; Yang, X.S. Optimal capacitor placement in radial distribution systems using flower pollination algorithm. Alex. Eng. J. 2018, 57, 2775–2786. [Google Scholar] [CrossRef] [Scilit]
- Alanazi, A.; Alanazi, M.; Memon, Z.A.; Awan, A.B.; Deriche, M. Availability and uncertainty-aware optimal placement of capacitors and DSTATCOM in distribution network using improved exponential distribution optimizer. Sci. Rep. 2025, 15, 13204. [Google Scholar] [CrossRef] [Scilit] [PubMed]
- Kaur, S.; Kumbhar, G.; Sharma, J. A MINLP technique for optimal placement of multiple DG units in distribution systems. Int. J. Electr. Power Energy Syst. 2014, 63, 609–617. [Google Scholar] [CrossRef] [Scilit]
- Garzón-Perdomo, L.C.; Duque-Chavarro, B.D.; Torres-Pinzón, C.A.; Montoya, O.D. Multi-Objective Optimization for the Location and Sizing of Capacitor Banks in Distribution Grids: An Approach Based on the Sine and Cosine Algorithm. Appl. Syst. Innov. 2026, 9, 24. [Google Scholar] [CrossRef] [Scilit]
- Guo, X.; Gong, R.; Bao, H.; Wang, Q. The second-order cone programming method for interval power flow of active distribution network with distributed generation. IEEJ Trans. Electr. Electron. Eng. 2018, 13, 696–703. [Google Scholar] [CrossRef] [Scilit]
- Sun, Y.; Yang, C.; Cui, H.; Wu, M.; Shao, J.; Zhao, B.; He, K. Optimization Methods for Optimal Power Flow Problems in Distribution Networks: A Brief Review. In Proceedings of the 2023 8th Asia Conference on Power and Electrical Engineering (ACPEE); IEEE: New York, NY, USA, 2023; pp. 1400–1406. [Google Scholar] [CrossRef] [Scilit]
- Saidani, K.; Essaddi, N.; Besbes, M. Probabilistic long-term forecasting of solar irradiance under climate change using deep learning and Monte Carlo simulations. Energy Strategy Rev. 2026, 65, 102176. [Google Scholar] [CrossRef] [Scilit]
- Gautam, D.K.; Kotecha, P.; Subbiah, S. Efficient k-means clustering and greedy selection-based reduction of nodal search space for optimization of sensor placement in the water distribution networks. Water Res. 2022, 220, 118666. [Google Scholar] [CrossRef] [Scilit] [PubMed]
- Rousseeuw, P.J. Silhouettes: A graphical aid to the interpretation and validation of cluster analysis. J. Comput. Appl. Math. 1987, 20, 53–65. [Google Scholar] [CrossRef] [Scilit]
- Montoya, O.D.; Hernández, J.C.; Rosero-García, J. Optimal Distribution Feeder Reconfiguration Based on a Chu and Beasley Genetic Algorithm with an MST-Constrained Search Space to Ensure Radiality. Technologies 2026, 14, 336. [Google Scholar] [CrossRef] [Scilit]
- Montoya, O.D.; Molina-Cabrera, A.; Hernández, J.C. A Comparative Study on Power Flow Methods Applied to AC Distribution Networks with Single-Phase Representation. Electronics 2021, 10, 2573. [Google Scholar] [CrossRef] [Scilit]
- Jannat, M.B.; Savić, A.S. Optimal capacitor placement in distribution networks regarding uncertainty in active power load and distributed generation units production. IET Gener. Transm. Distrib. 2016, 10, 3060–3067. [Google Scholar] [CrossRef] [Scilit]
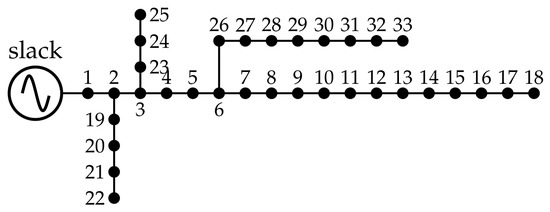
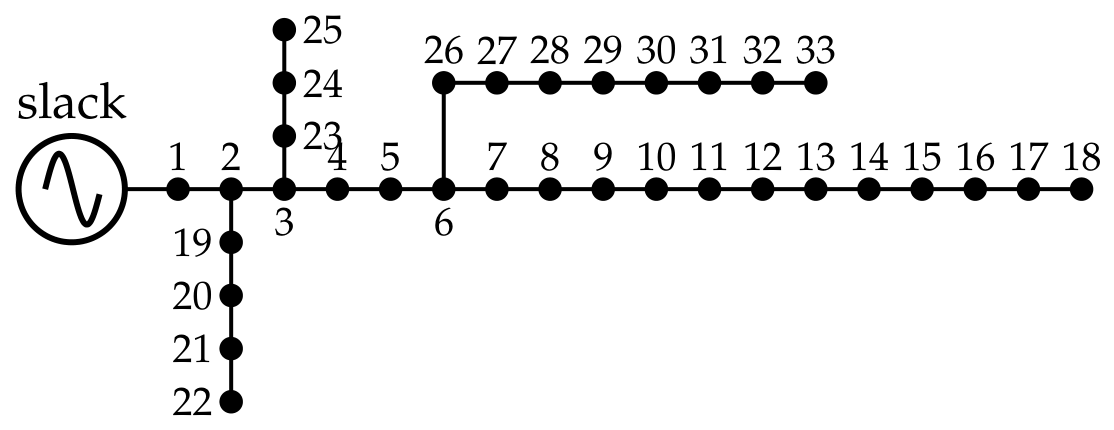
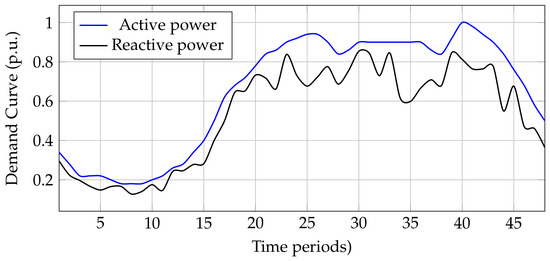
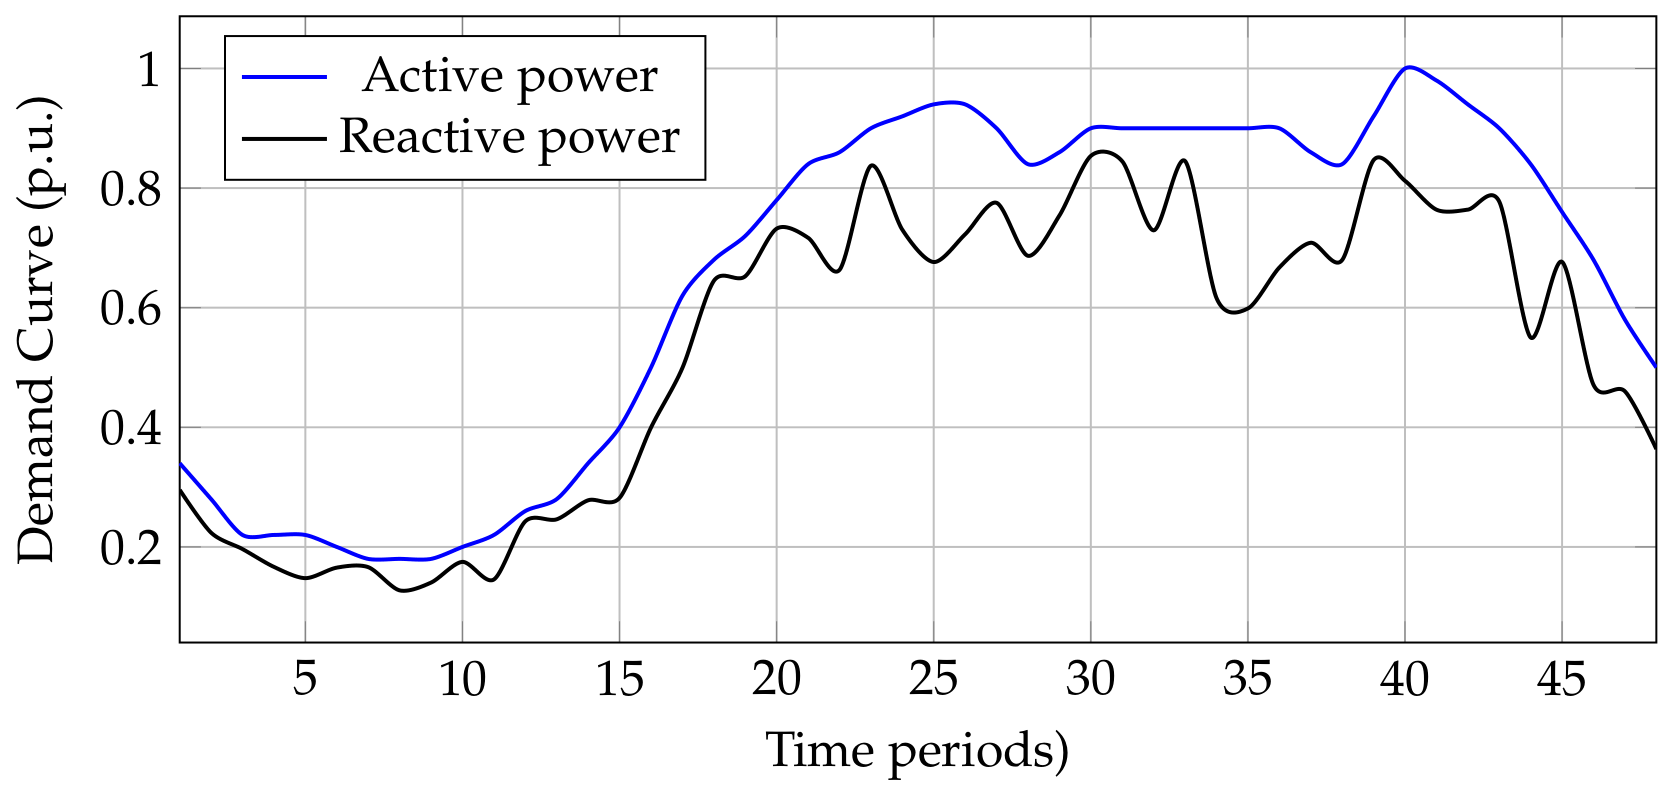
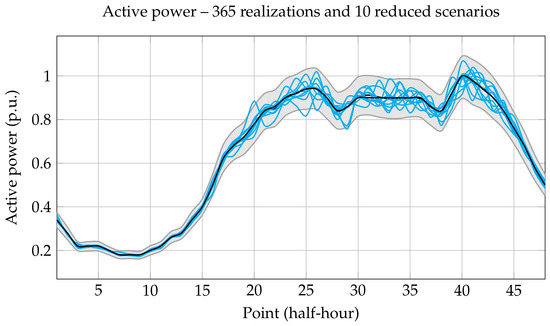
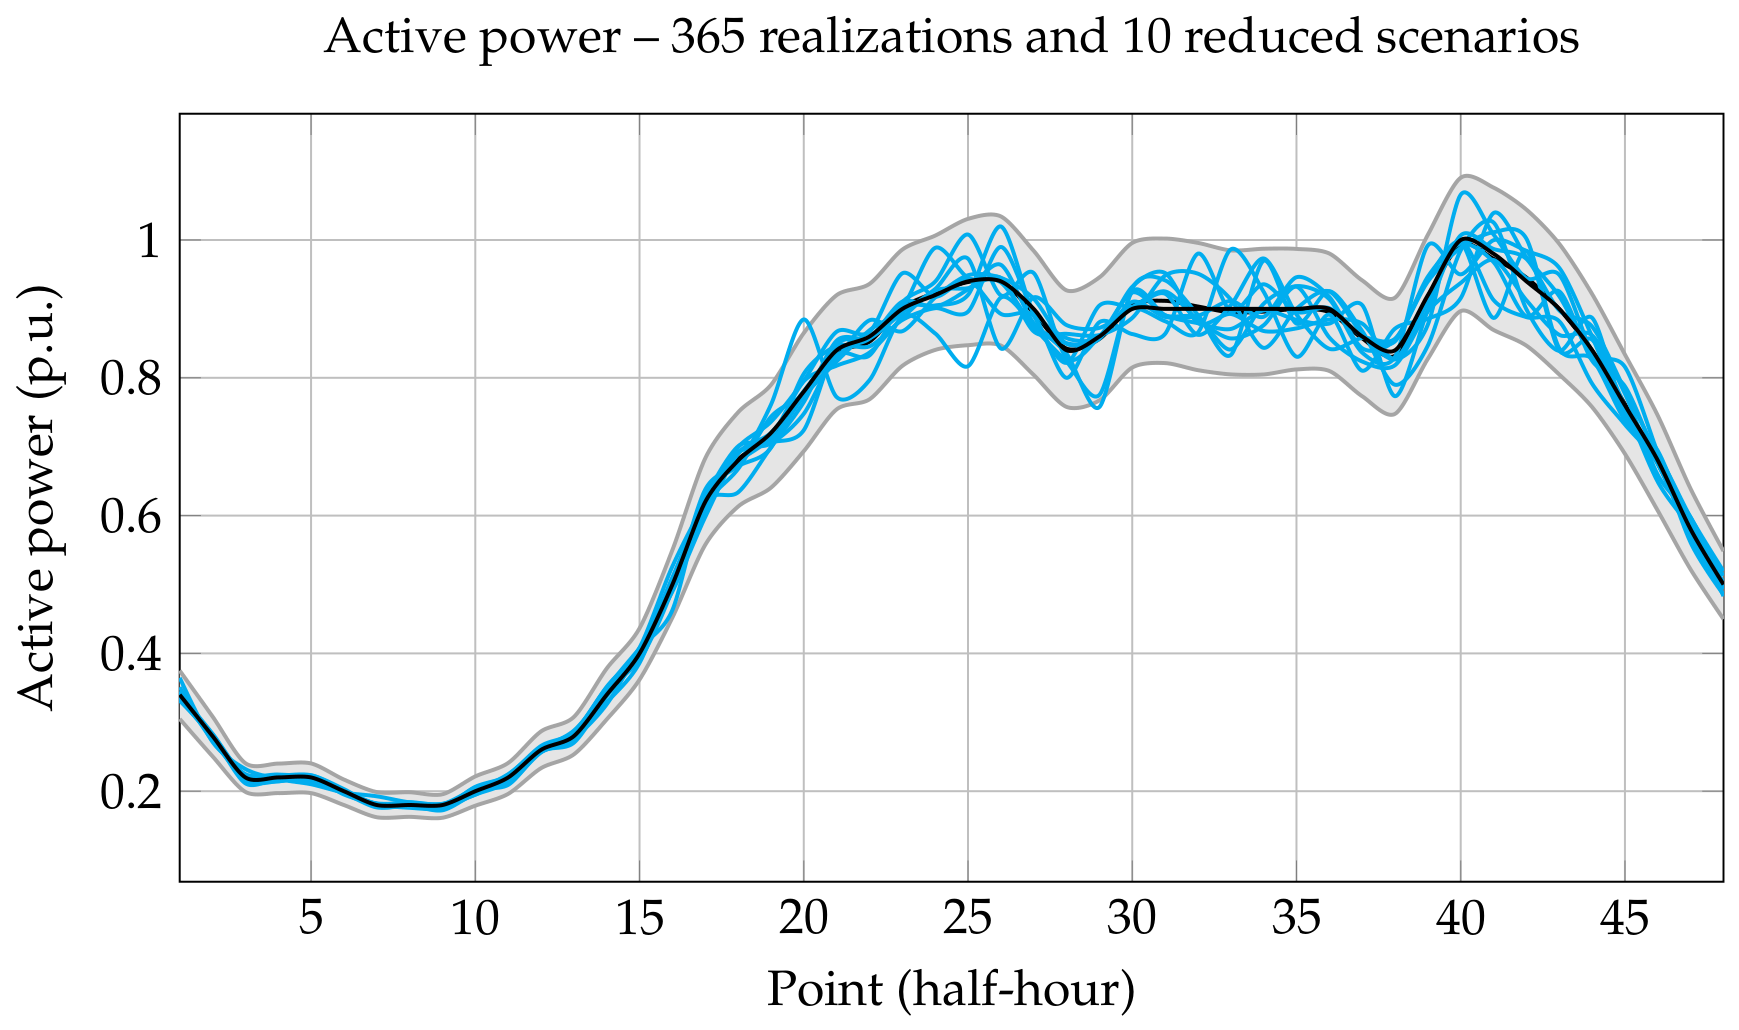
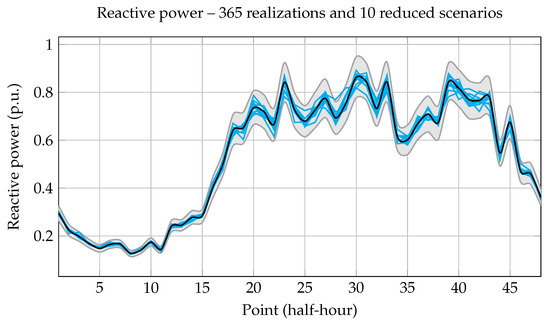
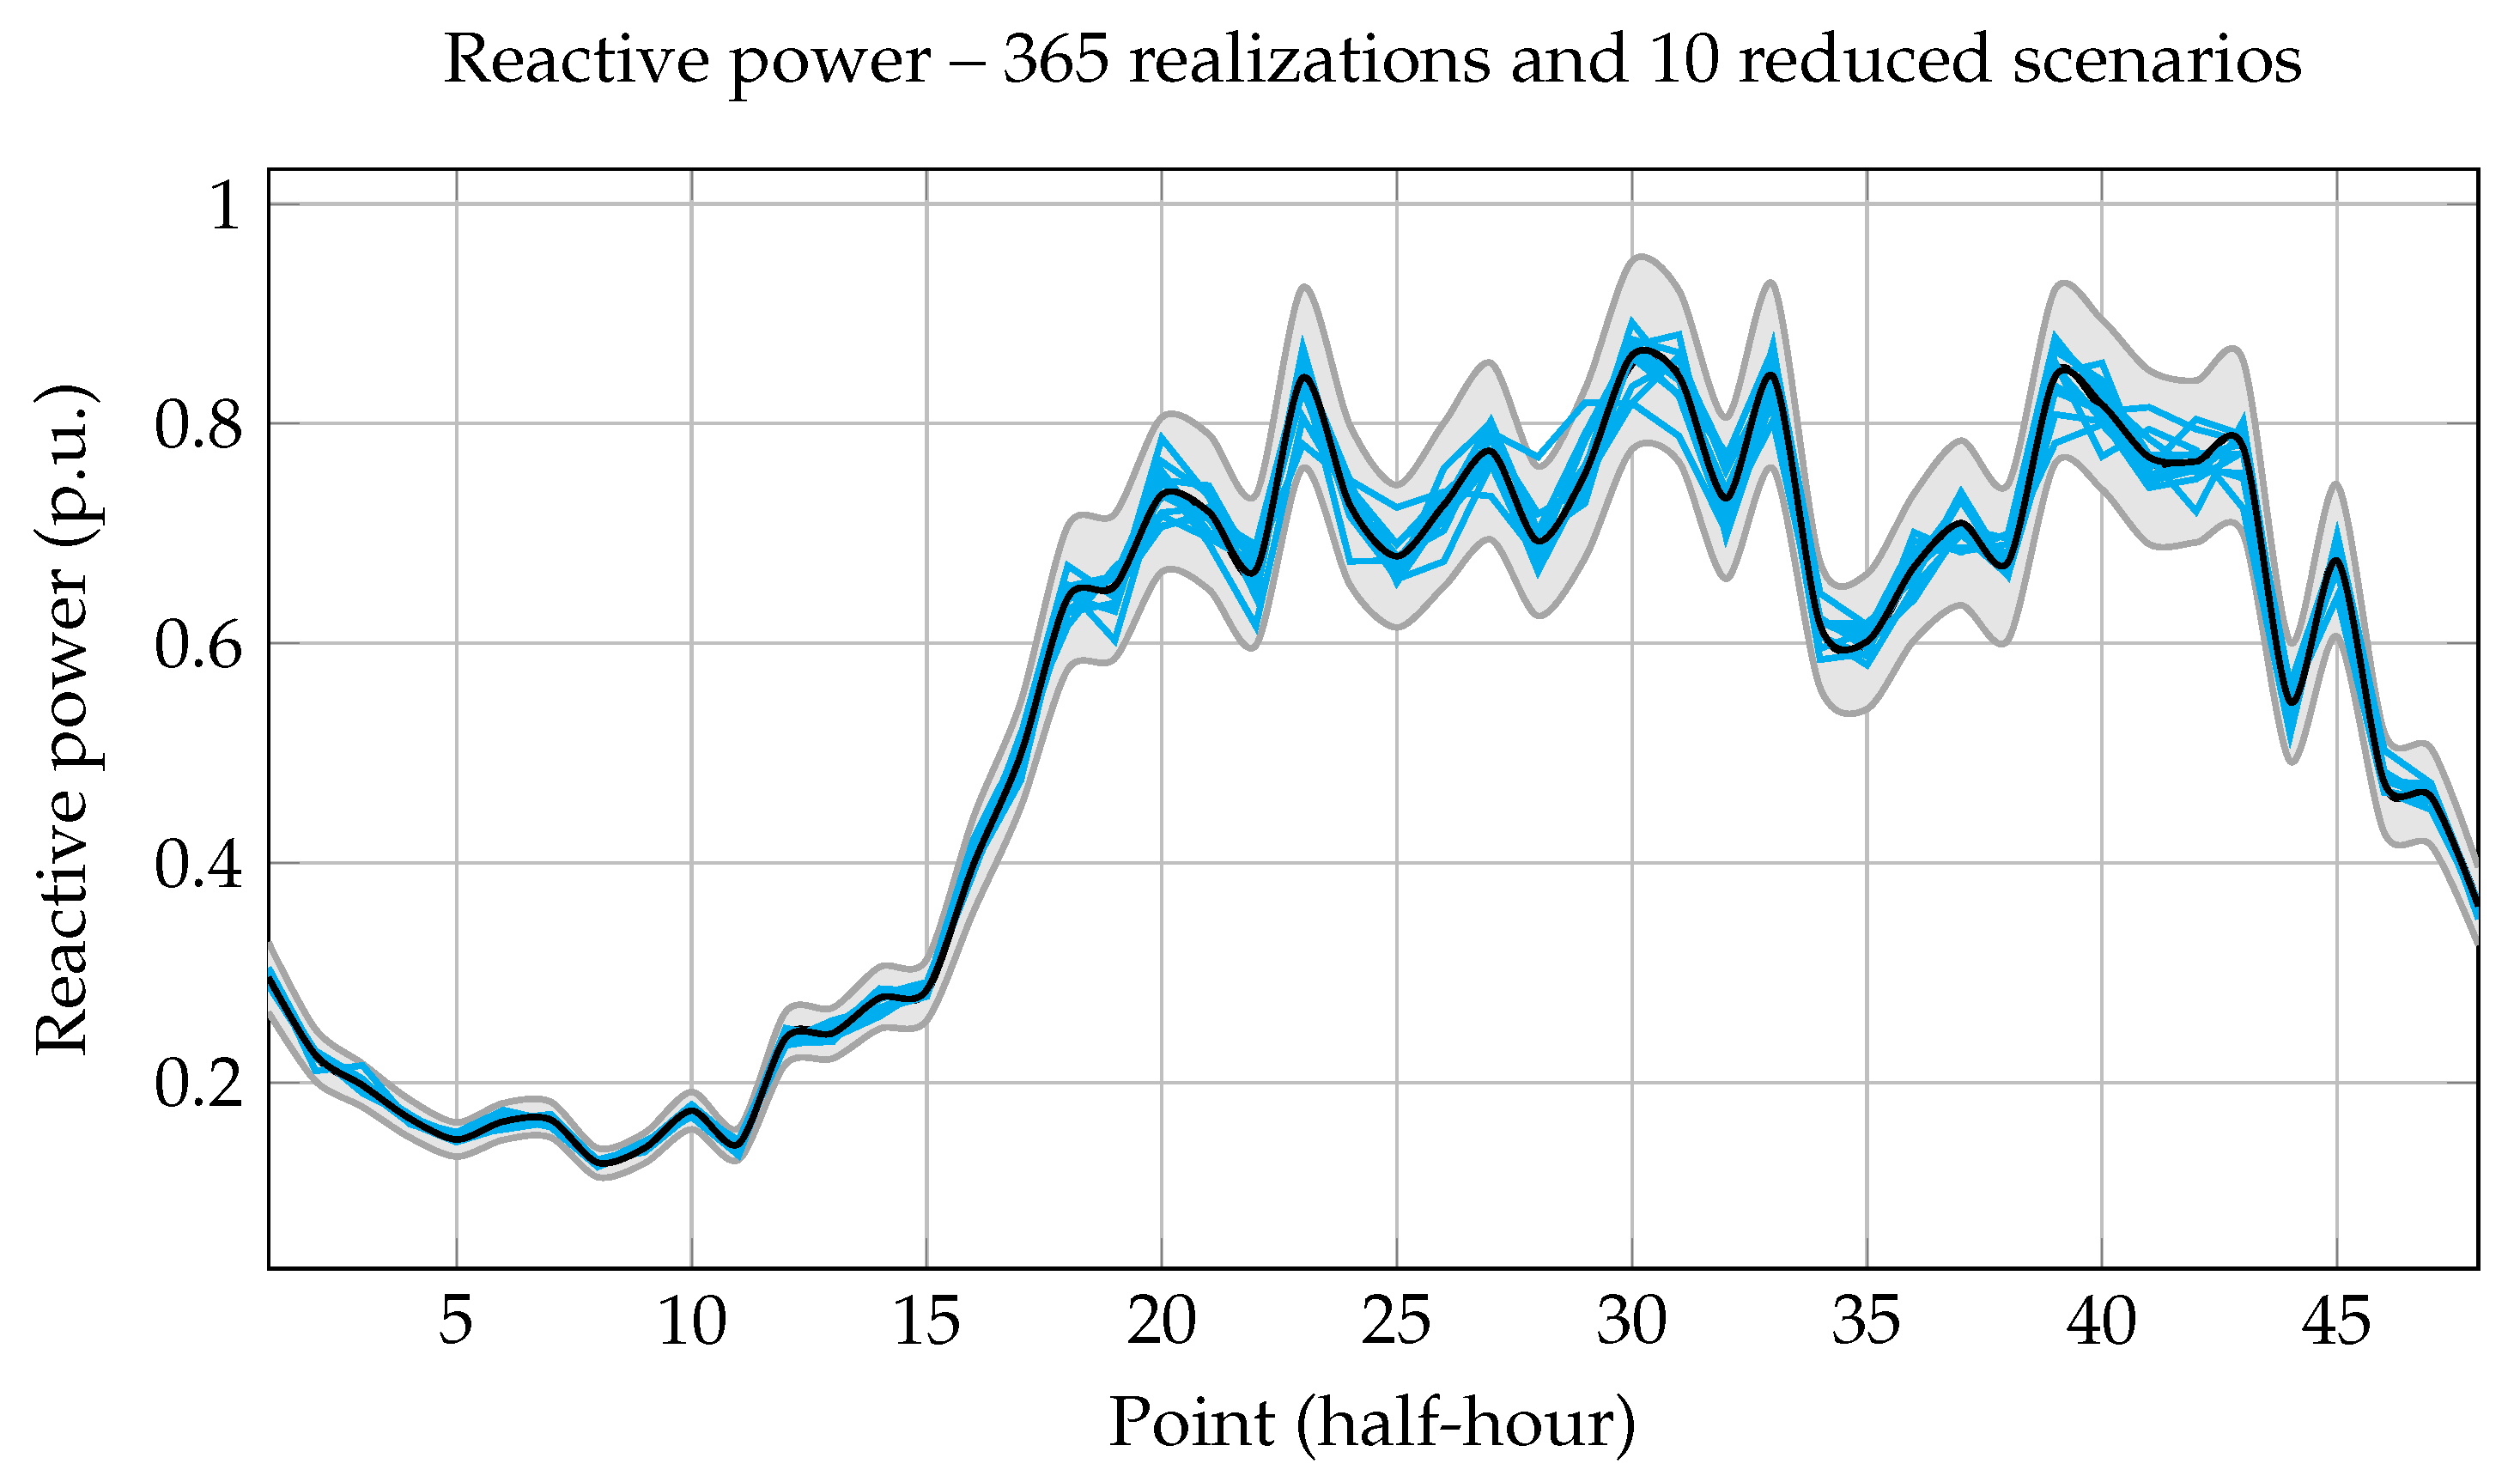
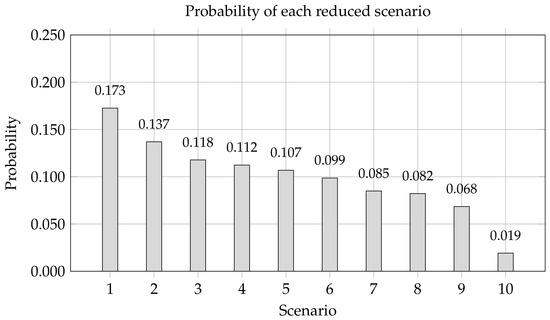
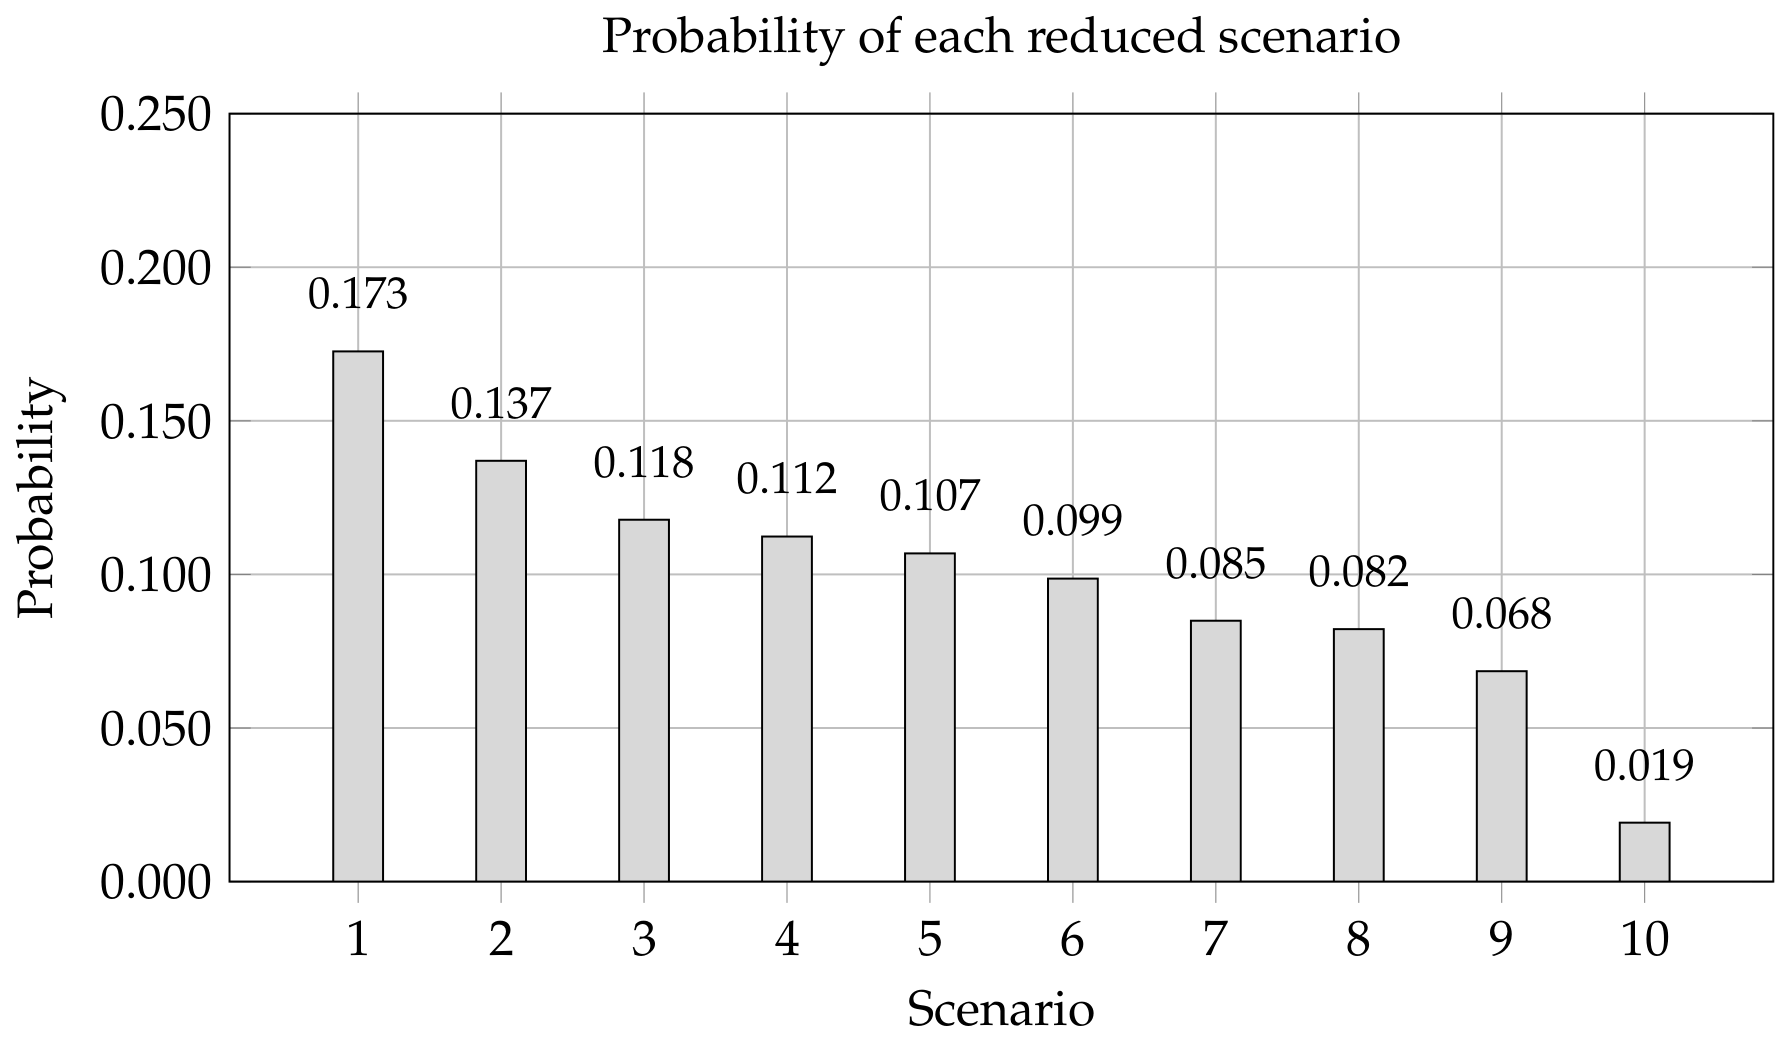

Disclaimer/Publisher’s Note: The statements, opinions and data contained in all publications are solely those of the individual author(s) and contributor(s) and not of MDPI and/or the editor(s). MDPI and/or the editor(s) disclaim responsibility for any injury to people or property resulting from any ideas, methods, instructions or products referred to in the content. |
© 2026 by the authors. Licensee MDPI, Basel, Switzerland. This article is an open access article distributed under the terms and conditions of the Creative Commons Attribution (CC BY) license.