


Abstract
Active distribution networks (ADNs) require battery energy storage system (BESS) scheduling strategies that reduce operating costs while preserving electrical feasibility and battery lifetime. This paper proposes a parallel adapted JAYA-based methodology for the day-ahead coordinated active and reactive power dispatch of BESS units in this type of grid. The novelty of this research lies in four key contributions: (i) the coordinated optimization of active and reactive power from BESS converters, exploiting their full capabilities for both energy management and voltage support; (ii) the integration of battery degradation costs within the optimization framework, preventing short-term economic strategies that accelerate aging; (iii) the implementation of a parallel adapted JAYA algorithm (AJAYA) with stagnation control and population reactivation mechanisms to enhance solution quality and convergence; and (iv) a comprehensive assessment under both deterministic and uncertainty-based operating conditions, providing a realistic validation of the proposed approach. Our model minimizes conventional generation, DER operation and maintenance, and BESS degradation costs while subject to power balance, distributed energy resource limits, voltage and current constraints, converter capacity, and state of charge (SoC) requirements. Each solution is encoded as BESS active/reactive power setpoints and evaluated through a multi-period AC power flow based on the successive approximations method, including SoC verification and a penalized fitness function. The methodology was validated in modified 33- and 69-node ADNs under deterministic and uncertainty scenarios (based on the conditions observed in Colombia), and it was benchmarked against the population-based genetic algorithm (PGA), the multiverse optimizer (MVO), the salp swarm algorithm (SALPS), the grey wolf optimizer (GWO), and the vortex search algorithm (VSA). According to the results, AJAYA outperformed the comparison methods, providing the best economic performance and exhibiting a robust behavior, with standard deviations below 0.06% and processing times below 0.05 h within a 24-h scheduling horizon. These findings demonstrate that the proposed framework constitutes an AC-feasible and degradation-aware academic contribution and a practical decision-support tool for operators and BESS owners, enabling a cost-effective and reliable BESS scheduling that preserves battery lifetime while improving network operation. Therefore, this research addresses the critical need for advanced energy management strategies that balance short-term economic benefits, technical feasibility, and long-term asset sustainability in modern distribution networks.
1. Introduction
1.1. General Context
Over the last decade, electrical distribution systems have experienced a significant transformation. Historically designed as passive networks with a unidirectional power flow from centralized generation to end-users, these systems are progressively evolving into active distribution networks (ADNs) that integrate a wide variety of distributed energy resources (DERs). Among these, photovoltaic (PV) generators, battery energy storage systems (BESSs), and reactive power compensation devices have become key components [1]. This paradigm shift, once considered a futuristic vision, has now become an operational reality, introducing new technical and economic challenges for distribution system operators (DSOs) worldwide.
Within this new operational context, renewable energy sources are typically operated under maximum power point tracking (MPPT) conditions in order to maximize the utilization of the available energy resources [2]. Consequently, the responsibility for ancillary services such as voltage regulation and line congestion management is progressively shifting toward BESSs, which offer a fast response and operational flexibility [3,4]. Providing these services through renewable generators would require active power curtailment, leading to renewable energy spillage, direct economic losses for both network operators and distributed generators, and ultimately higher electricity costs due to an increased dependence on conventional thermal generation.
Beyond stationary energy storage and demand-side flexibility, the ongoing electrification of transportation has introduced a new layer of interdependence between electrical distribution networks and transportation systems, giving rise to coupled electricity transportation networks (ETNs). In this emerging paradigm, electric buses (e-buses) and electric vehicles (EVs) act as mobile energy storage units, offering a unique spatio-temporal flexibility that is not constrained to fixed grid locations. Unlike stationary BESSs, these mobile assets can be dynamically repositioned to areas with urgent power deficits, making them exceptionally valuable for post-disaster restoration, peak-load relief, and emergency load support [5]. Simultaneously, the thermal inertia of building heating, ventilation, and air conditioning (HVAC) systems provides a passive energy storage capacity that can be leveraged to shift electrical demand without compromising occupant comfort, further enhancing grid resilience. These mobile and thermal flexibility sources complement physical stationary BESSs and open new avenues for coordinated multi-energy management in modern active distribution systems.
1.2. Motivation
In this scenario, BESSs have become strategic assets for managing the energy resources available within ADNs [6]. Their operation must simultaneously ensure compliance with technical constraints—including power balance, voltage regulation, and current limits in lines and transformers—while satisfying economic objectives such as energy losses reduction, voltage profile improvement, and operating costs minimization. Among these, the latter has emerged as one of the most relevant research topic and constitutes the primary focus of this work [7].
From an economic perspective, BESSs perform distributed charging and discharging actions according to the temporal dynamics of electricity demand, renewable generation, and energy prices. In general, batteries store energy during periods of low demand or low energy prices and inject it during peak-demand and high-price intervals, thereby reducing the overall operating costs of the network. Recent research has also highlighted the importance of integrating advanced energy management and monitoring strategies into PV-storage systems. In particular, intelligent supervision frameworks combining demand forecasting, real-time monitoring, and coordinated BESS operation have demonstrated significant improvements in terms of voltage regulation, power quality, and operational flexibility [8]. These developments show that BESSs are evolving beyond conventional energy arbitrage towards multifunctional operation in modern ADNs.
Beyond traditional physical batteries, the load regulation capacity of flexible demand-side resources, particularly in data centers equipped with virtual storage systems (VSSs), has emerged as a crucial complement for distribution network flexibility [9]. These virtual resources exploit the inherent temporal flexibility of data center workloads—such as batch processing job scheduling and cooling system thermal inertia—to provide grid services without compromising their primary computing functions. Moreover, their spatial flexibility enables coordinated operation across geographically distributed data centers, facilitating spatio-temporal arbitrage and alleviating line congestion in ADNs. However, effectively managing these heterogeneous resources under significant load and renewable generation uncertainties poses substantial challenges. To address this, recent studies have adopted two-stage distributionally robust optimization (DRO) frameworks to coordinate VSSs with physical storage assets, ensuring robust performance against worst-case uncertainties while fully capturing spatio-temporal operational dynamics [9,10]. Although these virtual flexibility options show great promise, the distinct physical characteristics, cycle-life degradation behavior, and millisecond-level response capabilities of electrochemical BESSs remain indispensable for primary voltage regulation and frequency support in ADNs. Consequently, while this paper concentrates on the detailed scheduling of physical BESSs, the broader context of hybrid physical–virtual storage coordination is acknowledged as a promising and timely direction for future research.
Equally important is the growing recognition that mobile storage resources—particularly e-buses—offer spatio-temporal flexibility that fundamentally differs from stationary BESSs. Recent studies on resilience-oriented restoration have demonstrated that coordinating e-buses with building thermal dynamics can significantly enhance post-disaster recovery by leveraging the mobility of storage assets to reach affected areas while utilizing building’s high-voltage AC systems as deferrable loads to reduce peak restoration demand [5]. Critically, the parallel and distributed nature of the AJAYA-based optimization engine proposed herein aligns naturally with advanced asynchronous decentralized algorithms developed for ETN coordination. These algorithms allow multiple agents—such as individual BESS units, e-bus fleets, and building energy management systems—to solve subproblems independently while communicating only limited information, thereby preserving the privacy of participating entities and enhancing the overall computational efficiency [5,11]. This connection underscores a compelling future research direction: extending our parallel adaptive JAYA (AJAYA) framework to handle the asynchronous communication, privacy preservation requirements, and coupled physical constraints inherent in multi-agent ETN restoration and co-optimization problems.
However, despite these advances, several critical gaps remain unaddressed in the existing literature. First, most BESS scheduling strategies focus exclusively on active power management, neglecting the potential of BESS converters to provide reactive power support. Second, the integration of battery degradation costs into the optimization framework is still largely unexplored, despite its direct impact on replacement planning and long-term economic viability. Third, the evaluation of BESS schedules under uncertainty conditions using detailed AC power flow models is still limited. Finally, the need for computationally efficient solution methodologies that can handle the high-dimensional and non-convex nature of the problem while providing robust and repeatable results remains an open challenge.
1.3. Literature Review
The optimal operation of BESSs in ADNs has been extensively studied in recent years. This section provides a critical review of the existing literature, organized according to the main methodological approaches, and it identifies the gaps that motivate our work.
1.3.1. Early Energy Management System Approaches
Early research efforts on BESS scheduling primarily focused on active power management through energy management systems (EMSs). The authors of [12] developed a model-predictive control (MPC) framework for coordinating battery operation with renewable generation, aiming to minimize operating costs while satisfying battery constraints. Similarly, the work by [13] proposed an optimization-based EMS for BESS scheduling that incorporated demand response and time-of-use tariffs.
Limitations: These early approaches demonstrated the economic benefits of BESS scheduling but relied on simplified network representations. They did not explicitly verify AC power flow constraints such as voltage profiles or feeder loading limits, which are essential for ensuring the technical feasibility of the obtained schedules. Moreover, the lack of reactive power management limited the capability of BESSs to support network operation beyond energy arbitrage.
1.3.2. Network-Constrained Models with AC Power Flow
Subsequently, more detailed network models were incorporated into the optimization process. The study by [14] investigated the coordinated operation of BESSs and distributed generation using AC power flow formulations to reduce energy losses and improve voltage profiles. The work by [15] developed a similar framework for optimal DER operation, explicitly considering line loading constraints and voltage limits.
Advantages: These studies represented a significant step forward by ensuring that the obtained BESS schedules were technically feasible for the distribution network. The explicit inclusion of voltage and current constraints provided more realistic solutions compared to simplified DC power flow or lossless network models.
Limitations: Despite these advances, the studies were primarily oriented towards planning applications or employed simplified operational models. They did not consider the uncertainty associated with renewable generation and load demand, which is critical for realistic day-ahead scheduling. Furthermore, the battery degradation costs were completely neglected, limiting the evaluation of long-term economic viability.
1.3.3. Metaheuristic Optimization with AC Power Flow
More recently, metaheuristic optimization techniques coupled with AC power flow formulations have been proposed to address the nonlinear and non-convex nature of the BESS scheduling problem. In this context, the authors of [16] developed a methodology based on genetic algorithms (GAs), particle swarm optimization (PSO), and the multiverse optimizer (MVO), combined with a successive approximations power flow method, to determine the optimal active power dispatch of BESS units in AC grids. Their approach explicitly considered voltage and loading constraints, as well as the operating and maintenance costs of DERs.
Advantages: The use of metaheuristic techniques provides significant flexibility in handling nonlinear constraints and discrete decision variables without requiring problem convexification or linearization. These methods can naturally accommodate the high-dimensional search space associated with BESS scheduling and have demonstrated good performance in terms of solution quality and convergence.
Limitations: Despite providing a more realistic representation of network operation, uncertainty modeling was not included in this work. The analysis was performed under deterministic conditions, which does not reflect the inherent variability of renewable generation and load demand in real ADNs. Additionally, battery aging assessments were not incorporated, limiting the economic evaluation to short-term operating costs.
1.3.4. Coordinated Active and Reactive Power Dispatch
In parallel, recent grid regulations have allowed DERs to actively participate in reactive power support. As demonstrated in [17], the coordinated dispatch of active and reactive power from BESS units can significantly improve network performance, thus reducing energy losses, improving voltage profiles, and alleviating branch loading conditions while providing substantially greater economic benefits than active-power-only strategies. Consequently, coordinated active and reactive power management has become an increasingly relevant research direction for ADN operation [18,19].
Advantages: These approaches exploit the full capability of BESS converters, which typically have an excess capacity that can be used for reactive power support without affecting the active power dispatch. This provides additional flexibility for voltage regulation and congestion management, reducing the need for conventional voltage control devices.
Limitations: Current developments have incorporated the uncertainties associated with renewable generation and load demand, detailed AC network constraints, and the operating and maintenance costs of DERs. However, the integration of battery degradation costs into the optimization process remains largely unexplored. This gap is particularly relevant because dispatch strategies that reduce short-term operating costs may accelerate battery aging, increasing replacement requirements and compromising the overall economic viability of BESS deployment.
1.3.5. Gap Analysis and Positioning of This Work
Table 1 provides a comparative summary of the reviewed literature, highlighting the main features considered by each study.
Table 1.
Comparative summary of BESS scheduling studies in active distribution networks.
As evidenced in Table 1, the integration of battery degradation costs into the optimization process is a largely unexplored issue, despite its direct impact on replacement planning and long-term economic viability. As previously mentioned, this gap is particularly relevant because dispatch strategies that reduce short-term operating costs may accelerate battery aging, increasing replacement requirements and compromising the overall economic viability of BESS deployment.
Purpose and advantages of the proposed technique against available techniques:
Our methodology addresses the limitations identified in the literature through the following key aspects:
- Comprehensive economic assessment. Unlike previous studies that focus solely on short-term operating costs, the proposed framework simultaneously minimizes conventional generation costs, DER operating and maintenance costs, and BESS degradation costs. This provides a more realistic economic evaluation that balances short-term savings with long-term battery lifetime preservation.
- Coordinated active and reactive power dispatch. While some recent works have explored coordinated P/Q dispatch, the proposed methodology integrates this capability with degradation modeling and uncertainty analysis, providing a more comprehensive solution.
- Full AC-feasible operation. The integration of a multi-period AC power flow evaluator based on the matrix successive approximations method (MSA) ensures that all candidate solutions satisfy voltage, current, and power balance constraints, preventing the use of infeasible dispatch strategies that could compromise network security.
- Parallel metaheuristic optimization. The proposed AJAYA incorporates adaptive mechanisms, stagnation control, and population reactivation, which improve solution quality, convergence speed, and robustness compared to conventional metaheuristics. The parallel implementation significantly reduces computation times, making the methodology suitable for practical day-ahead scheduling.
- Uncertainty modeling. Our methodology explicitly considers variability in demand and PV generation through 100 representative scenarios, providing robust dispatch strategies that perform well under realistic operating conditions.
- Comprehensive benchmarking. Unlike most studies that compare only a few methods, this work provides a thorough comparison against five state-of-the-art algorithms, i.e., the population-based genetic algorithm (PGA), the MVO, the salp swarm algorithm (SALPS), the grey wolf optimizer (GWO), and the vortex search algorithm (VSA) demonstrating the superiority of the proposed approach in terms of solution quality, repeatability, and computational efficiency. The inclusion of SALPS, GWO, and VSA for comparison expands the benchmark beyond the conventional PGA and MVO methods, providing a more rigorous validation of the proposed AJAYA.
Therefore, our framework provides significant advancement over existing approaches by integrating all critical aspects—coordinated P/Q dispatch, degradation costs, AC feasibility, uncertainty, and efficient optimization—within a unified methodology that is both academically rigorous and practically applicable.
1.4. Contributions, Scope, and Limitations
This paper proposes a parallel adapted AJAYA-based methodology for the day-ahead coordinated active and reactive power dispatch of BESSs in ADNs. The main contributions are presented below:
- Coordinated P/Q dispatch: a scheduling framework that exploits the full capability of BESS converters for both energy management and reactive power support.
- AC-feasible operation: the integration of a multi-period AC power flow evaluator (MSA method) that ensures compliance with power balance, voltage, current, and BESS constraints.
- Degradation-aware economics: the inclusion of battery degradation costs in the objective function to prevent short-term strategies that accelerate aging.
- Parallel AJAYA optimization: an adapted JAYA algorithm with adaptive coefficients, stagnation control, and population reactivation for enhanced convergence and robustness.
- Uncertainty assessment: evaluation under 100 demand and PV generation scenarios, providing realistic validation.
- Comprehensive benchmarking: a statistical comparison against PGA, MVO, SALPS, GWO, and VSA.
Our methodology can be to three-phase balanced distribution networks under steady-state conditions, with PV units operating in MPPT mode and BESS converters providing controllable reactive power. Validations were performed on 33- and 69-node benchmark systems over a 24-h horizon.
The main limitations are as follows:
- The analysis is restricted to balanced three-phase networks; validation in unbalanced feeders is required before claiming broader practical applicability.
- Only lithium-ion battery technology is considered.
- The considered uncertainty is limited to demand and PV variability, excluding electricity price volatility.
- Day-ahead scheduling is performed without real-time adjustments.
- Validation is performed on benchmark systems rather than on real distribution networks.
Figure 1 illustrates the complete workflow. Here, the input data define the operating scenario, the parallel AJAYA optimizer generates and updates candidate BESS schedules, each candidate is evaluated through a multi-period AC-MSA power flow, and the objective function selects the best schedule. The main contribution of this work lies in its integrated framework that combines coordinated P/Q dispatch, degradation-aware economics, AC-feasible operation under uncertainty, and a parallel metaheuristic solver—which is not provided by AJAYA alone.
Figure 1.
Graphical abstract of the proposed parallel AJAYA-based framework for cost-oriented and AC-feasible BESS scheduling in ADNs.
1.5. Document Structuring
The remainder of this document is organized as follows. Section 2 presents the mathematical formulation of the BESS scheduling problem, including the objective function, the DER operating constraints, and the network constraints. Section 3 describes the proposed AJAYA-based solution methodology and the AC power flow evaluation strategy. Section 4 presents the characteristics of the test systems and the data used for validation. Section 5 reports and discusses the simulation results obtained for both the 33- and 69-node ADNs under deterministic and uncertainty conditions, including statistical analyses and comparisons against benchmark methods. Finally, Section 6 presents the conclusions of this paper and outlines directions for future research.
2. Mathematical Formulation
The proposed optimization model determines the optimal day-ahead operation of an ADN composed of conventional generators (CGs), PVs, and BESSs. Following the operational practices commonly adopted in Colombia, PV units operate in power generation tracking mode and inject only active power according to the available solar resource. Therefore, in this work, the BESS converters are the only controllable DERs responsible for the coordinated management of active and reactive power within the ADN. For clarity, the mathematical formulation is divided into three groups: (i) objective function, (ii) DER operational constraints, and (iii) network constraints.
2.1. Objective Function
The optimization problem minimizes the total operating cost of the ADN over the scheduling horizon:
where , , and represent the CG cost, the DER operating and maintenance costs, and the BESS degradation cost, respectively. The operating cost associated with CG is calculated as follows:
where represents the energy production cost coefficient of the CG installed at node i during period h, enabling the representation of technology-dependent and time-varying generation costs. Moreover, denotes the active power generated by the conventional unit connected at node i during time interval h. In this work, , , , and denote the sets of network nodes, scheduling periods, PVs, and BESSs, respectively, while corresponds to the duration of each time interval.
The operating and maintenance costs associated with the DERs are computed as shown in (3). In this expression, denotes the active power generated by PV p during period h, whereas represents the active power exchanged by BESSs b, considering both charging (-) and discharging (+) operating modes.
The degradation cost of the BESS fleet is represented by Equation (4), where denotes the total daily degradation cost, is the set of batteries, is the daily degradation factor of battery b, and is its replacement cost. The latter is calculated as follows:
where is the battery investment cost per unit of energy and is the nominal energy capacity. The daily degradation factor accounts for both cycling and calendar aging effects and is determined as follows:
where and denote the cycling and calendar degradation components, respectively.
The battery state-of-charge (SoC) profile employed for degradation assessment is defined in (7) and calculated using Equations (22) and (23), which are introduced in the section dedicated to the DER operating constraints. This profile describes the charging and discharging behavior of battery b over the scheduling horizon and serves as the input to the degradation model.
The degradation model adopted in this work follows the formulation reported in [20,21]. The cycling degradation component is evaluated using the rainflow counting algorithm, which identifies charge-discharge cycles from the SoC profile defined in (7). For each cycle k, the algorithm determines its depth of discharge and number of occurrences . Cycles with negligible amplitudes are discarded to avoid the contribution of non-representative micro-cycles. The degradation stress factors associated with cycle depth, average SoC, and temperature are then computed as follows:
where is the depth of discharge of cycle k obtained from the rainflow analysis. The variable denotes the average SoC used for degradation assessment and is calculated using the complete SoC profile of battery b over the scheduling horizon. Likewise, is the battery operating temperature, assumed to be constant and equal to the nominal cell temperature . The parameters and represent reference operating conditions, while , , , , and are degradation model coefficients obtained from battery aging characterization data. The parameter values adopted in this work are summarized in Table 2.
Table 2.
Lithium-ion battery degradation model parameters.
Table 2 summarizes the coefficients and operating conditions used in the battery degradation model. The model is not based solely on energy throughput. Cycling degradation explicitly depends on the depth of discharge (DoD), the number of cycle occurrences identified by the rainflow counting algorithm, the average SoC, and the battery temperature. Consequently, deep and shallow cycles produce different degradation contributions. Calendar degradation is evaluated separately as a function of the average SoC, temperature, and the daily evaluation period, s. The battery temperature is assumed to be constant at 298.15 K, while the SoC is restricted to the range of 0.10–0.90 p.u. The C-rate is not included as an independent aging factor. However, the effective charging and discharging rate is indirectly bounded by the maximum BESS power, the nominal energy capacity, the SoC dynamics, and the converter apparent-power capacity.
The battery degradation model adopted herein corresponds to the experimentally validated lithium-ion aging formulations reported in [20,21]. Consequently, the degradation parameters listed in Table 1 and Table 2 are treated as fixed input data representing typical lithium-ion battery technology and are uniformly applied to all optimization methods. The objective of this work is not to develop or calibrate a battery degradation model, but to incorporate its economic impact into the BESS scheduling process.
The cycling degradation accumulated by battery b over the scheduling horizon is computed using Equation (11), where is the total number of rainflow cycles retained after filtering negligible micro-cycles and is the occurrence count of cycle k. Thus, the degradation contribution of each cycle is determined by the product of the DoD, SoC, and temperature stress factors weighted by the number of occurrences.
In addition to cycling degradation, batteries experience calendar aging even in the absence of charge-discharge cycles. This effect is modeled by Equation (12), where is the scheduling horizon expressed in seconds and is the calendar aging coefficient. The corresponding average SoC and temperature stress factors are computed as follows:
where and are the average SoC and the temperature of battery b over the scheduling horizon. The average SoC is obtained directly from the SoC profile defined in (7), whereas the average temperature is assumed to be constant and equal to the nominal cell temperature, i.e., . Consequently, the calendar degradation depends on storage time, average SoC, and operating temperature, and it is combined with the cycling degradation through (6) to determine the total daily degradation factor.
Remark 1.
In this work, the battery operating temperature is assumed to be constant and fixed at 298.15 K (25 °C). While it is well known that temperature variations during high-power charge–discharge cycles can significantly influence lithium-ion battery aging, this simplifying assumption is justified for the following reasons [22,23]: (i) the degradation model employed is experimentally validated under controlled temperature conditions, providing a reliable baseline for economic evaluations; (ii) this work primarily focuses on the optimization framework and the coordinated dispatch strategy rather than on thermo-electrical battery modeling; (iii) incorporating a full thermal model would require detailed cell-specific parameters and real-time thermal monitoring, which are outside the scope of this paper; and (iv) the assumed constant temperature of 25 °C aligns with typical laboratory and standard operating conditions reported in the degradation literature used for parameter calibration. Nevertheless, this simplification represents a recognized limitation of the current study, and future work will extend the proposed framework to account for temperature-dependent aging effects under realistic operating profiles.
In this study, the distribution system operator is assumed to own and operate the BESS units. Therefore, the objective function is formulated from a unified system-level perspective, wherein the costs of energy purchasing, DER operation and maintenance, and battery degradation are borne by the same entity. Under this ownership structure, minimizing the total operating cost is directly aligned with the economic interest of the BESS owner, and no additional payment or degradation-compensation mechanism between independent parties is required.
2.2. DER Operational Constraints
The operating limits of the DER units are modeled through a set of technical constraints. The active and reactive power outputs of conventional generators are bounded by their minimum and maximum operating capabilities:
where and are the active and reactive power outputs of conventional generator i during period h, while , , , and define their operating limits.
The active power generated by PVs depends on the available solar resource and is modeled as follows:
where is the active power produced by PV unit p, is its rated capacity, and is the normalized solar generation profile in period h. Since the PV inverters operate in MPPT mode, reactive power support is neglected:
The active power exchanged by each BESS is limited by its charging and discharging capabilities:
where is the active power exchanged by battery b, with negative and positive values representing charging and discharging modes, respectively. In addition, the parameters and correspond to the maximum charging and discharging power ratings.
The reactive power capability of the BESS converter is constrained by
where is the reactive power supplied or absorbed by the converter, and and define its operating range.
The apparent power rating of the converters is enforced through
where is the nominal apparent power capacity of the BESS converter.
The battery SoC dynamics are modeled as follows:
where is the SoC of the battery b in period h, is the scheduling time step, represents the self-discharge effect, and converts exchanged power into stored energy variation. The effective charging-discharging efficiency is defined below:
where and are the charging and discharging efficiencies, respectively.
The conversion factor is given by
where is the nominal energy capacity of battery b.
The battery operating limits are imposed by
where and define the allowable operating range of the battery. The initial and final SoC conditions are established as follows:
where and are the initial and final SoC levels used to ensure the feasible and cyclic daily operation of the BESS units.
2.3. Network Constraints
The AC power flow equations are used to guarantee the active and reactive power balance for every network node and time period. The active power balance is expressed as follows:
where , , and represent the active power supplied by CGs, PVs, and BESS connected to node i in period h, respectively, while denotes the active power demand. The right-hand side corresponds to the active power losses, where and are the voltage magnitude and angle at node i, and and are the magnitude and angle of the admittance matrix element between nodes i and j.
Similarly, the reactive power balance is given by
where and correspond to the reactive power outputs of CGs and BESS units, respectively, and is the reactive power demand at node i at time period h.
The nodal voltage magnitudes must remain within the admissible operating range:
where and define the minimum and maximum allowable voltage magnitudes at node i.
Finally, the thermal limits of the distribution lines are enforced through
where is the current flowing through branch in period h, and is its maximum admissible current rating.
3. Proposed Methodology
To solve the optimal day-ahead operation problem of BESSs in ADNs, this work proposes a parallel adapted JAYA-based optimization methodology [24]. The proposed framework combines the search capabilities of AJAYA with a multi-period AC power flow solved through the matrix successive approximations method (AC-MSA) [25]. Thus, each candidate solution is evaluated while considering the technical behavior of the network, the operating limits of the BESS units, and the objective function associated with the day-ahead dispatch problem.
Figure 2 presents the high-level workflow of the complete optimization framework. First, the PV generation, load profiles, grid data, and BESS parameters are introduced. AJAYA then generates candidate active and reactive power schedules, represented by . Each candidate is evaluated using the AC-MSA power flow method to calculate the electrical operating conditions of the network. Based on these results, the total operating cost is determined, and compliance with the power balance, BESS, network, and operational constraints is verified. AJAYA iteratively updates the candidate solutions until the convergence criterion is reached. Finally, the best feasible solution is selected as the optimal BESS charging, discharging, and reactive power schedule.
Figure 2.
Flowchart of the proposed AJAYA/AC-MSA optimization framework for optimal day-ahead BESS dispatch.
The complete step-by-step procedure of AJAYA, including its adaptive coefficient update, feasibility correction, and stagnation control mechanisms, is summarized in Algorithm 1. This pseudocode provides a detailed description of the inner workings of the optimizer, complementing the high-level flowchart shown in Figure 2.
A description of each step presented in Algorithm 1 is detailed below.
| Algorithm 1 Parallel AJAYA algorithm for optimal BESS scheduling |
|
Step 1: input data definition: The process starts with the definition of the input data, including load demand, PV generation profiles, network parameters, electricity prices, BESS technical characteristics, and the limits associated with voltages, currents, the SoC, and the converter capacity.
Step 2: individual encoding: Each individual of the population represents a complete day-ahead active and reactive power dispatch schedule of all BESS units. Therefore, the ith individual is encoded as follows:
where and denote the active and reactive power of BESSs during period for individual i. The dimension of each individual is .
Step 3: initial population generation: The initial population is randomly generated within the feasible operating limits of the BESS units:
where is the population size, is the number of decision variables, and are the lower and upper limits of the j-th decision variable, and is a random number uniformly distributed in the range.
Step 4: evaluation through AC-MSA: Each candidate solution is evaluated by running the multi-period AC power flow via the AC-MSA method. This step provides the voltage magnitudes, phase angles, branch currents, power losses, and network operating conditions required to compute the objective function and verify the technical constraints of the ADN.
Step 5: fitness evaluation and identification of the best and worst individuals: Each AJAYA individual defines the active and reactive power schedules of the BESS units for the complete scheduling horizon. These schedules are incorporated into the nodal complex power demand matrix together with the hourly load demand and PV generation profiles. Thus, the net complex power at node i during period h is computed as follows:
where is the complex load demand, is the PV active power, and and are the active and reactive power exchanged by the BESS units.
The net power values of all demand nodes and all periods are grouped in the following matrix:
where each column contains the net complex powers of the demand nodes in period h. Therefore, the AC-MSA method evaluates the complete scheduling horizon in a compact matrix form. The voltage matrix of the demand nodes is iteratively updated as follows:
where and are the submatrices of the nodal admittance matrix, is the slack bus voltage matrix replicated for all scheduling periods, ∘ denotes the Hadamard product, and the reciprocal operation is performed in an element-wise manner. The matrices and contain the voltages and net complex power injections of all demand nodes throughout the scheduling horizon. Consequently, , and the AC-MSA formulation updates all hourly operating points simultaneously within the same iterative process, avoiding the need to solve an independent power flow for each period. The power flow convergence is achieved when
where is the prescribed tolerance.
After convergence is reached, the network operating conditions over the complete scheduling horizon are obtained. These results are used to evaluate the objective function in (1) and verify the DER and network constraints defined in (15)–(31), thereby determining the adaptation function value associated with each candidate solution. Constraint violations are incorporated through the following penalty term:
where is the maximum voltage deviation among all nodes, is the admissible voltage deviation limit, and and are penalty coefficients associated with current and voltage violations. Consequently, any candidate solution violating the network operating limits receives an additional cost that is proportional to the magnitude of the violation:
where corresponds to the objective function defined in (1) and represents the aggregated penalty associated with infeasible operating conditions. Therefore, provides a single performance indicator that simultaneously accounts for economic performance and technical feasibility. Feasible solutions are ranked according to their operating cost, whereas infeasible solutions receive large penalty values and are naturally discarded.
Once all individuals have been evaluated, the solution with the lowest value of is selected as the best individual, while that with the highest value is selected as the worst individual. These two individuals guide the AJAYA population update process.
Step 6: adaptive AJAYA movement: At each iteration k, every decision variable is updated by moving the candidate solution towards the best individual and away from the worst one, according to
where is the j-th decision variable of individual i at iteration k, and are the corresponding decision variables of the best and worst individuals, and and are random numbers uniformly distributed in the range. The coefficients and adaptively regulate the attraction towards the best solution and the repulsion from the worst solution, respectively.
Step 7: adaptive coefficient update: The adaptive coefficients are updated throughout the iterative process:
where and are the initial and final values of the first adaptive coefficient, is the initial value of the second adaptive coefficient, and is the maximum number of iterations.
Step 8: feasibility correction: The updated individuals are projected onto the feasible region by enforcing the charging and discharging limits, the SoC limits, the final SoC condition, and the apparent power capability of each BESS converter. Then, the corrected solutions are evaluated once more through the AC-MSA power flow.
Step 9: stagnation control and population reactivatio{n}:
To prevent premature convergence, the evolution of the best adaptation value is monitored throughout the optimization process. When the improvement of the best solution remains below a predefined tolerance during several consecutive iterations, the search is considered stagnant. In this situation, the individuals with the highest adaptation values are selected and replaced by perturbed versions of the current best individual. The perturbation magnitude decreases along the iterative process, according to
where k is the current iteration and is the maximum number of iterations. Larger perturbations are applied during the early stages of the search, while smaller perturbations are introduced when approaching convergence.
Reactivated individuals are generated around the current best solution:
where is the best individual at iteration k and is a vector of normally distributed random perturbations. The active power variables are subsequently corrected to satisfy the charging, discharging, and SoC constraints defined in (19)–(27).
Reactivated individuals are evaluated using the adaptation function defined in Equation (39). A replacement is accepted only if the new solution improves the adaptation value of the corresponding worst individual:
Therefore, the reactivation mechanism introduces additional diversity into the population while preserving the best solution found so far, allowing the search process to escape from local optima and continue exploring promising regions of the solution space.
Step 10: stopping criterion and final solution: The iterative process continues until the maximum number of iterations is reached. The best solution obtained by AJAYA defines the optimal coordinated active and reactive power dispatch schedules of the BESS units for the day-ahead operation of the ADN.
As benchmark methodologies, this paper considers two optimization approaches that are widely used in the literature for solving operational problems dealing with DERs in ADNs. The first one is the parallel PGA, a parallel version of the classical genetic algorithm. PGA evolves a population of candidate solutions by generating offspring through selection, recombination, and mutation operators. The second benchmark is MVO, a population-based metaheuristic inspired by multiverse theory. This method explores the solution space through the interaction of white holes, black holes, and wormholes, which are used to exchange information between candidate solutions and improve the search process. In this work, the MVO implementation also takes advantage of parallel processing to reduce the computational burden associated with the evaluation of candidate solutions.
The selection of PGA and MVO as comparison methodologies was motivated by their recent validation in the intelligent operation of BESSs and DERs in AC distribution networks [26]. Therefore, they provide a suitable benchmark to evaluate the proposed AJAYA-based methodology, which, to the best of the authors’ knowledge, has not been previously validated for the coordinated active and reactive power operation of BESSs in ADNs under modeling framework such as the one proposed herein.
To ensure a fair comparison, all parameters were tuned using PSO [25]. In this case, PSO operates as an external tuning strategy that identifies the parameter configuration that provides the best performance for each method. Under this approach, no fixed computation times are imposed on the algorithms. Instead, the required processing time is treated as a consequence of the search dynamics, parameter configuration, and convergence behavior of each methodology.
The tuned parameters employed by the optimization methodologies are summarized in Table 3. For all methods, the number of decision variables is defined by the coordinated active and reactive power dispatch of the BESS units over the 24-h scheduling horizon. Therefore, considering three batteries, the dimension of each candidate solution is (), where () is the number of BESS units and () is the number of time periods.
Table 3.
Tuned parameters for the analyzed optimization methodologies (AJAYA, PGA, and MVO).
4. Test Systems Data
Two modified ADNs comprising 33 and 69 buses were employed to validate the proposed methodology. In both cases, photovoltaic distributed generators (PV-DGs) operated under MPPT conditions, while the BESS units were responsible for providing the active and reactive power flexibility required to satisfy the networks’ operational constraints. The 33-bus system was first evaluated under a deterministic framework while using average daily demand and solar generation profiles as well as time-varying energy prices from the city of Medellín, Colombia. Subsequently, the impact of uncertainty was assessed by considering 100 representative demand and PV generation scenarios. Finally, the 69-bus system was analyzed to evaluate the scalability of the proposed approach under the same uncertainty framework, using demand and renewable generation profiles representative of a Colombian region.
All simulations were carried out in MATLAB R2024a, on a workstation equipped with an Intel Core i9-14900HX processor (24 cores and 32 threads, up to 5.8 GHz), 32 GB of DDR5-5600 RAM, and an NVIDIA GeForce RTX 4090 GPU with 16 GB of GDDR6 memory, running a 64-bit version of Windows 11. The parallel implementation of the optimization algorithms exploits the multi-core architecture of the processor to simultaneously evaluate candidate solutions, significantly reducing the computational burden associated with the multi-period AC power flow analysis and the large number of uncertainty scenarios considered.
4.1. 33-Node ADN
The first test system is a modified 33-node ADN with 32 distribution lines, three PV-DGs, and three BESSs. The system operates at 12.66 kV and draws a base power of 1 MVA [16]. Its single-line diagram is shown in Figure 3.
Figure 3.
Electrical diagram of the 33-node ADN.
The PV-DGs are placed at nodes 13, 25, and 30, with rated powers of 1125 kW, 1320 kW, and 999 kW, respectively. These units are assumed to operate in MPPT mode. Therefore, the available PV power is injected into the network without using the PV-DGs for voltage control. Under these conditions, the operational flexibility of the ADN is provided by the BESS installed at nodes 6, 14, and 31. These storage units have a combined energy capacity of 4500 kWh and a total inverter capacity of 1025 kVA, which allows the optimization model to manage active and reactive power injections within the technical limits of the network while preserving the energy balance of the batteries.
Table 4 reports the data used for this test system. The network parameters define the electrical base, voltage limits, and convergence settings adopted in the AC power flow solution. The PV-DG and BESS parameters describe the location, size, and operating limits of the distributed resources. The economic parameters include the base energy cost, the operating and maintenance costs of the PV-DGs and the BESS, and the replacement cost associated with battery usage. Finally, the scenario data indicate the number of demand and PV generation curves used to represent the uncertain operation of the system.
Table 4.
Main parameters of the modified 33-node ADN.
The electrical parameters of the lines and their thermal current limits were taken from the reference data of the 33-bus feeder reported in [27]. The voltage limits were set between 0.90 and 1.10 p.u., which is consistent with the operating range that is usually accepted in Colombian distribution networks [25]. The AC power flow problem was solved via the MSA method, using a convergence tolerance of .
The parameters in Table 5 were used to estimate the degradation of the BESS units due to cycling and calendar aging. The coefficients , , and define the effect of the DoD on battery aging, while and represent the influence of the average SoC and cell temperature, respectively. The parameter is associated with calendar degradation over the daily operating horizon. In addition, and are used to represent the effect of the solid-electrolyte interphase layer on the aging process. The reference values and define the nominal operating conditions, whereas and establish the assumed cell temperature and the duration of the daily evaluation.
Table 5.
Battery degradation model parameters.
For this ADN, two operating scenarios were analyzed. The first corresponds to a deterministic case, in which a single average daily profile is considered for demand, PV generation, and variable operating cost. This is shown in Figure 4.
Figure 4.
Daily operation profiles used in the deterministic analysis: (a) demand, (b) PV generation, and (c) variable energy cost.
To characterize the inherent variability of the demand and PV generation, a set of 100 representative daily scenarios was generated from an initial dataset of 365 historical daily curves. Specifically, the —means clustering algorithm was applied to group the 365 profiles according to their daily patterns and seasonal characteristics. The centroids of the resulting clusters were then selected as the 100 most representative operating scenarios, effectively capturing the annual variability while maintaining a computationally tractable set for the day-ahead scheduling analysis. This clustering approach ensures that both typical and extreme operating conditions are adequately represented in the uncertainty evaluation.
The second scenario incorporated energy uncertainty through 100 demand profiles and 100 PV generation profiles. In this case, the reported variable operating cost was kept fixed, allowing the analysis to isolate the effect of demand and PV variability on the economic dispatch, network feasibility, and robustness of the proposed BESS scheduling model. The corresponding input data are shown in Figure 5.
Figure 5.
Input data used in the uncertainty analysis: demand scenarios (up) and PV generation scenarios (down).
Remark 2.
It should be clarified that all 100 representative scenarios generated by the —means clustering procedure were considered to be equally weighted in the uncertainty analysis. This assumption is justified by the fact that the clustering algorithm inherently preserves the frequency distribution of the original 365 daily profiles, as each cluster centroid represents a group of original days with similar patterns. The equal-weighting approach ensures that no particular scenario is over- or underrepresented, thereby providing a balanced and unbiased representation of the annual variability while maintaining computational efficiency.
4.2. 69-Node ADN
To demonstrate the robustness and scalability of the proposed methodology under more demanding operating conditions, the 69-bus ADN illustrated in Figure 6, a larger benchmark test system, was adopted.
Figure 6.
Electrical diagram of the 69-node ADN.
The second test system corresponds to a modified 69-node ADN, which was adopted to validate the scalability and robustness of the proposed methodology in a larger distribution network. This system operates at 12.66 kV and uses a base power of 100 kVA. The PV-DGs are installed at nodes 16, 61, and 64, with rated powers of 1320 kW, 1125 kW, and 999 kW, respectively. As in the 33-node case, the PV units operate under MPPT conditions, injecting the available active power without providing voltage support.
The operational flexibility of the 69-node ADN is provided by three BESS units installed at nodes 17, 62 and 63. These batteries have energy capacities of 2000 kW, 1000 kW, and 1500 kWh, respectively, with charging-discharging times of five, four, and four hours, respectively. Therefore, the total installed BESS capacity is 4500 kWh, while the corresponding converter ratings are 400 kVA, 250 kVA, and 375 kVA, respectively. The SoC limits, initial and final SoC values, efficiency parameters, economic coefficients, uncertainty scenarios, and battery degradation parameters were kept equal to those used in the 33-node ADN. This allowed the comparison to focus on the impact of network size and topology on the performance of the proposed BESS scheduling methodology.
Using the same k-means clustering procedure described for the 33-node system, 100 representative scenarios were generated for the 69-node ADN. The resulting uncertainty scenarios are depicted in Figure 7:
Figure 7.
Input data used in the uncertainty analysis of the 69-node ADN: active power demand scenarios (a), reactive power demand scenarios (b), and PV generation scenarios (c).
5. Simulation Results
This section evaluates the performance of the proposed AJAYA-based methodology for reducing the operating costs of ADNs while satisfying all technical and operational constraints. The analysis begins with the modified 33-node ADN, wherein both deterministic and uncertainty-based operating conditions are assessed through the best solution, the average solution, the standard deviation, and the average processing time obtained by each optimization method. Subsequently, the scalability and robustness of the proposed framework are validated using the modified 69-bus ADN under uncertainty scenarios associated with demand and PV generation variability, allowing for the evaluation of its effectiveness in larger and more complex distribution networks.
5.1. Results for the 33-Node ADN
Table 6 presents the statistical results obtained by the AJAYA, PGA, and MVO methodologies for the deterministic operation of the 33-bus ADN. The table reports the daily operating cost, the average solution, the standard deviation, the difference between the best and average solutions, and the average processing time. This allows comparing the solution quality, robustness, and computational performance of the evaluated optimization methods.
Table 6.
Statistical comparison of the optimization methods for the 33-bus ADN under deterministic conditions.
From the perspective of the best solution, AJAYA reduced the daily operating cost by 2.08% with respect to the base case, achieving an operating cost of $6853.5/day. Additionally, AJAYA outperformed PGA and MVO by 0.16% and 0.02%, respectively. Regarding the average solution obtained over the independent runs, AJAYA achieved a cost reduction of 2.04% compared to the base case and improvements of 0.14% and 0.02% over PGA and MVO, respectively. These results confirm that AJAYA consistently provides the best economic performance among the evaluated methodologies.
Table 6 shows that all the evaluated methodologies provide highly stable and repeatable results. The maximum standard deviation observed was only 0.0285%, which corresponds to approximately 1.95 USD/day with respect to an average operating cost close to 6850 USD/day. Similarly, the largest difference between the best and average solutions was only 0.0433%, equivalent to approximately 2.97 USD/day. These variations are negligible when compared to the total daily operating costs of the network, indicating that all methods consistently converge to solutions of similar quality. Regarding computational performance, the average processing times range between 42.11 s and 153.57 s. Although AJAYA requires a longer execution time, all methods complete the optimization process in less than 0.05 h, which is very small in comparison with the 24-h operating horizon analyzed. Therefore, the obtained times are fully suitable for day-ahead operation studies involving ADNs.
After evaluating the deterministic operation of the 33-bus ADN, the impact of demand and PV generation uncertainty was analyzed. To this effect, 100 demand scenarios and 100 PV generation scenarios were considered, enabling the assessment of the robustness and performance of the optimization methodologies under variable operating conditions. The corresponding results are summarized in Table 7. Under these conditions, the network exhibited an average operating cost of 6592 USD/day without BESS operation. This value was used as the reference case to quantify the economic benefits achieved by the evaluated optimization methodologies.
Table 7.
Statistical analysis of the results obtained for the 33-bus ADN under uncertainty conditions.
The results confirm the effectiveness of the proposed AJAYA methodology when considering variability in demand and PV generation. AJAYA achieved the highest average operating costs reduction, reaching 151.72 USD/day (2.25%). It outperformed PGA and MVO by 7.60 USD/day (5%) and 1.29 USD/day (0.85%), respectively. These results demonstrate its ability to identify more cost-effective operating strategies under uncertain operating conditions.
Additionally, AJAYA maintained a very low standard deviation (only 0.0400%), confirming a high degree of repeatability and robustness despite the increased complexity introduced by uncertainty. Although PGA and MVO obtained slightly lower dispersion values, the differences are marginal; all methods exhibited excellent stability, with standard deviations below 0.04%.
Regarding computational performance, AJAYA required an average processing time of 116.00 s, equivalent to approximately 0.032 h. Considering that the optimization was performed for a 24-h operating horizon, this computational effort is negligible and fully acceptable for day-ahead operational planning studies. Therefore, the obtained results demonstrate that the proposed AJAYA methodology provides the best economic performance while maintaining robust and consistent results under uncertainty conditions.
Technical Constraint Validation
To verify the technical feasibility of the obtained solutions, the behavior of the main operational constraints associated with the BESS units and the ADN was analyzed. Figure 8, Figure 9, Figure 10, Figure 11, Figure 12 and Figure 13 summarize the results in relation to SoC limits, voltage regulation, and line loading constraints.
Figure 8.
SoC profiles of the BESS units for the 33-node ADN.
Figure 9.
Maximum voltage variation over the scheduling horizon for the 33-node ADN.
Figure 10.
Maximum line chargeability over the scheduling horizon for the 33-node ADN.
Figure 11.
SoC profiles of the BESS units for the 69-node ADN.
Figure 12.
Maximum voltage variation during the scheduling horizon for the 69-node ADN.
Figure 13.
Maximum line chargeability over the scheduling horizon for the 69-node ADN.
Figure 8 shows the SOC trajectories of the three BESS units. Note that all solutions satisfy the prescribed operating limits, namely p.u. and p.u., while also fulfilling the initial and final conditions ( p.u.). This confirms the proper enforcement of the storage energy balance over the scheduling horizon.
Figure 9 presents the maximum voltage variation observed throughout the scheduling horizon. The red dashed line represents the maximum admissible voltage deviation of 0.1 p.u. (10%), corresponding to the regulatory limit that is commonly adopted for Colombian distribution networks. As observed, all operating points remain below this threshold, ensuring full compliance with voltage regulation requirements.
Finally, Figure 10 depicts the maximum line chargeability throughout the scheduling horizon. The red dashed line indicates the thermal loading limit of 100%. The results demonstrate that all line loading levels remain within the admissible operating range, thereby preventing line overloading and guaranteeing a secure network operation.
Overall, the obtained solutions satisfy all the technical constraints considered, including battery operating limits, voltage regulation requirements, and line thermal limits. The proposed optimization model and solution methodology provide technically feasible solutions while ensuring compliance with the operational requirements of ADNs.
5.2. Results for the 69-Node ADN
Table 8 presents the statistics obtained for the 69-node ADN under uncertainty conditions. In the base case, the average operating cost was 4104.48 USD/day. When the coordinated operation of the BESS units was included, all optimization methods reduced the operating cost, with average savings between 110.20 USD/day and 118.72 USD/day.
Table 8.
Statistical comparison of the analyzed optimization methods when applied to the 69-node ADN under uncertainty conditions.
Among the evaluated methods, AJAYA exhibited the best economic performance, reaching an average operating cost of 3985.76 USD/day. This represents a reduction of 118.72 USD/day, equivalent to 2.89% with respect to the base case. Compared to PGA, AJAYA increased the daily savings by 8.52 USD/day, which corresponds to an additional improvement of 7.73%. In comparison with MVO, it obtained 1.87 USD/day of additional savings, equivalent to a 1.60% improvement. These results show that AJAYA provides the most competitive dispatch strategy in terms of operating cost reduction.
The robustness of AJAYA was also confirmed by its standard deviation. AJAYA reported the lowest dispersion value (0.0580%). This value is 15.57% lower than that obtained with PGA and 20.87% lower than that obtained with MVO. In addition, when compared with the average standard deviation of PGA and MVO, which is 0.0710%, AJAYA reduces the variability of the solutions by 18.31%. Therefore, AJAYA not only achieves the lowest average operating cost; it also provides the most consistent performance under uncertainty conditions for the 69-node ADN.
Regarding computation times, AJAYA required 139.45 s, equivalent to 0.0387 h. Although this value is higher than the times required by PGA and MVO, it represents only 0.161% of the 24-h operating horizon. Even when compared to the average processing time of PGA and MVO, the additional computational effort of AJAYA is only 89.46 s, or 0.0249 h, which corresponds to 0.104% of one day of operation. Therefore, this increase in processing times can be considered negligible for day-ahead BESS scheduling.
Technical Constraints Validation
As with the 33-node ADN, this section verifies the fulfillment of the technical constraints associated with BESS operation, voltage regulation, and branch current limits for the 69-node system. Figure 11 shows the SoC profiles obtained for the BESS units during the optimization process.
Although these profiles follow a similar behavior to those obtained for the 33-node ADN, the solutions are different because the 69-node system differs in terms of topology, load distribution, PV location, and BESS placement. In all cases, the lithium-ion batteries respect their operating limits, remaining within the admissible SoC range during charging and discharging periods. Additionally, the final SoC condition is satisfied, which ensures a feasible daily operation of the storage units. Therefore, the obtained results confirm that the AJAYA-based search process provides technically feasible BESS schedules for the 69-node ADN.
Regarding voltage and current limits, Figure 12 and Figure 13 demonstrate the fulfillment of the operational constraints for the 69-node ADN. These figures report the worst voltage and current conditions identified during the system analysis. As observed, the maximum voltage variation remains below the admissible limit of 0.10 p.u., while the maximum line chargeability remains below the 100% thermal limit. Therefore, since the most critical operating conditions satisfy the technical limits, all evaluated solutions are feasible from a voltage and current constraints perspective.
5.3. Additional Benchmark Comparison
To extend the comparison of the effectiveness of the proposed methodology, it was validated against the SALPS [28], the GWO [29], and the VSA [30]. These methodologies have been employed for the optimal operation of batteries in ADNs, exhibiting good performance. Their selection was based on the results reported by their authors in recent years, following criteria similar to those used for the selection of MVO and PGA in the previous sections (see Table 9). In this work, all methodologies were adapted and parallelized using the same load-flow evaluation strategy proposed for AJAYA, in order to ensure a fair comparison. As test systems, the 33-node ADN (under deterministic energy conditions) and the 69-node ADN (under uncertainty conditions) were also employed.
Table 9.
Statistical analysis of the results obtained for the 33-node ADN under deterministic operating conditions.
Taking the base operating cost of 6999 USD/day as the reference for the 33-node ADN and under a deterministic operation, all optimization methods achieved a reduction in the daily operating cost. AJAYA obtained the largest improvement, reducing the operating cost by 145.50 USD/day (2.08%) as the best solution and 142.60 USD/day (2.04%) on average. SALPS ranked second, with reductions of 127.50 USD/day (1.82%) and 125.20 USD/day (1.79%), respectively. GWO achieved reductions of 106.00 USD/day (1.51%) as the best solution and 103.20 USD/day (1.47%) on average, whereas VSA reduced the operating cost by 111.20 USD/day (1.59%) as the best solution and 101.90 USD/day (1.46%) on average. These results confirm that AJAYA consistently provides the greatest economic benefit with respect to the base operating scenario while maintaining the best average performance among all the compared algorithms.
Figure 14 quantifies the additional economic benefit achieved by AJAYA with respect to the high-performance benchmark methods. Compared to SALPS, GW, and VSA, AJAYA improved the best solution by 12.40%, 27.16%, and 23.58%, respectively, while the average solution was improved by 11.93%, 25.12%, and 21.54%. These results confirm the consistent superiority of the proposed methodology in terms of economic performance.
Figure 14.
Economic improvements achieved by AJAYA with respect to the high-performance comparison methodologies under the deterministic operation of the 33-node ADN.
Regarding solution robustness, AJAYA achieved the lowest standard deviation (0.0285%), outperforming SALPS (0.0467%), GWO (0.0564%), and VSA (0.1357%). This indicates that the proposed methodology exhibits the highest repeatability among all evaluated algorithms, consistently converging to high-quality solutions despite the stochastic nature of the optimization process. Furthermore, the small difference between the best and average solutions (0.0433%) confirms that AJAYA maintains a stable convergence behavior over independent executions.
In terms of computational performance, VSA required the shortest average processing time (31.81 s), followed by SALPS (107 s), AJAYA (153.57 s), and GWO (291 s). Although AJAYA is not the fastest algorithm, its computational effort remains below three minutes for the complete 24-h scheduling problem. Considering that day-ahead BESS scheduling is executed offline once every day of operation, this processing time is entirely acceptable for practical applications. More importantly, the additional computational effort is compensated by the largest operating costs reduction, the lowest solution dispersion, and the highest repeatability among the evaluated methodologies.
Considering both the additional benchmark results and the comparison with PGA and MVO, AJAYA achieved average improvements of 14.37% and 13.16% for the best and mean solutions, respectively, in the 33-node ADN under deterministic demand and generation conditions. It also exhibited the lowest standard deviation while maintaining processing times negligible for day-ahead scheduling. Once more, AJAYA demonstrated the best overall performance for the analyzed network.
To evaluate a more demanding test system and assess the behavior of the optimization methods under energy uncertainty, SALPS, GW, and VSA were applied to the 69-node test system described in Section 4.2. The results obtained through these methods and AJAYA are summarized in the following table.
Taking the average base-case operating cost of 4104.48 USD/day as the reference, all optimization methods achieved significant economic savings under energy uncertainty. AJAYA obtained the largest reduction, decreasing the operating cost by 118.95 USD/day (2.90%), whereas SALPS, GW, and VSA reduced the operating cost by 91.74 USD/day (2.24%), 84.70 USD/day (2.06%), and 94.26 USD/day (2.30%), respectively. In addition to providing the highest economic benefit, AJAYA exhibited the lowest solution dispersion (0.0580%), indicating the highest robustness among the evaluated methods. Although SALPS required the shortest processing time, the execution time of AJAYA remained below 140 s, which is entirely acceptable for day-ahead BESS scheduling. Therefore, the proposed methodology achieved the best overall performance in terms of economic savings and solution robustness for the 69-node ADN under energy uncertainty (see Table 10).
Table 10.
Statistical analysis of the results obtained for the 69-node ADN under energy uncertainty conditions.
Figure 15 illustrates the percent improvements achieved by AJAYA with respect to the high-performance benchmark methods. Compared to SALPS, GW, and VSA, the proposed methodology improved the average operating costs reduction by 22.73%, 28.66%, and 20.61%, respectively. These results confirm that AJAYA consistently preserves its superior economic performance under energy uncertainty, even in a larger and more complex ADN.
Figure 15.
Percent improvements achieved by AJAYA with respect to the high-performance benchmark methods for the 69-node ADN under energy uncertainty.
Considering all the benchmark methods included in the study, AJAYA achieved an average additional costs reduction of 19.18 USD/day, corresponding to an average improvement of 16.15% over PGA, MVO, SALPS, GW, and VSA. In addition to this superior economic performance, AJAYA maintained the highest repeatability, as evidenced by its low standard deviation, while requiring processing times that remain fully acceptable for day-ahead BESS scheduling. These results confirm that the proposed methodology provides the best overall performance for the battery operation problem analyzed herein.
5.4. Operating Cost Component Analysis
All simulations were performed over a 24-h day-ahead scheduling horizon divided into 24 one-hour periods, with h. Therefore, the costs reported in Table 6 and Table 7 correspond to one full day of operation and are expressed in USD/day. According to the objective function defined in (1), the total operating cost is obtained as the sum of the CG cost, ; the DER operating and maintenance costs, ; and the BESS degradation cost, . The CG cost is calculated using (2) by multiplying the active power supplied by the conventional source during each period by the corresponding energy price and the duration of the interval. Similarly, according to (3), the PV maintenance cost is proportional to the energy generated by the PV units, while the BESS maintenance cost is proportional to the absolute charging and discharging energy processed by the batteries. These daily costs are obtained by multiplying the corresponding power by h and the respective maintenance cost coefficient, and then summing the contributions over the 24 periods. The absolute value of the BESS power is considered because maintenance costs are incurred during both charging and discharging operation.
Table 11 presents the cost components obtained with AJAYA, which achieved the best overall economic performance among the evaluated methods. For the deterministic 33-bus system, the energy, PV maintenance, BESS maintenance, and degradation costs represent 99.18%, 0.42%, 0.19%, and 0.21% of the total daily cost, respectively. Under uncertainty, these components represent 99.18%, 0.41%, 0.20%, and 0.21% for the 33-bus system. For the 69-bus system, they account for 97.90%, 1.35%, 0.34%, and 0.41%, respectively. Thus, the energy purchased from the CG remains the dominant cost component, while the relative contribution of PV maintenance, BESS maintenance, and degradation increases in the larger network.
Table 11.
Operating cost components, average duration, and computational performance for the evaluated test systems.
The average BESS operating durations were 12.25, 12.48, and 11.25 h for the deterministic 33-bus, the uncertain 33-bus, and the uncertain 69-bus cases, respectively. Finally, AJAYA required average execution times of 153.57, 116.00, and 139.45 s, equivalent to only 0.178%, 0.134%, and 0.161% of the 24-h horizon. As was previously noted, the computational effort is negligible when compared to the analyzed scheduling period and is suitable for day-ahead operation.
5.5. Computational Scalability Analysis
It should be noted that a direct comparison of computational times between networks of different sizes is not straightforward because each system has a different topology, loading level, number and location of DERs, convergence behavior, and energy requirements. Indeed, the results obtained for the 33- and 69-bus systems do not show a directly proportional relationship between the number of buses and the execution time. Nevertheless, increasing the network size generally increases the computational burden because evaluating each candidate solution requires solving a higher-dimensional AC power flow problem [31].
To isolate the effect of the number of storage units, an additional scalability analysis was performed using the same deterministic 33-bus system with one, two, three, and four BESS units. The BESS units were progressively incorporated at nodes 6, 14, 31, and 25. For batteries and scheduling periods, the coordinated active and reactive power dispatch problem contains decision variables. Therefore, under the 24-period resolution adopted in this study, each additional BESS introduces 48 decision variables.
As shown in Table 12, the daily operating cost decreased from 6999.0 USD/day without BESS to 6939.1, 6915.3, 6853.5, and 6847.8 USD/day with one, two, three, and four BESS units, respectively. These results correspond to cost reductions of 0.86%, 1.20%, 2.08%, and 2.16%. Although the fourth BESS further reduced the operating cost, its marginal benefit was smaller, indicating diminishing economic returns under the analyzed operating conditions.
Table 12.
Effect of the number of BESS units on the economic and computational performance of AJAYA in the deterministic 33-bus system.
To isolate the effect of the number of BESS units, all parameters regarding the network, AJAYA, the population, the iterations, and the scheduling horizon were kept unchanged throughout the analysis. For the 24-h horizon with a 1-h resolution, each additional BESS introduced 48 decision variables, corresponding to 24 active and 24 reactive power values. Therefore, the solution space dimension increased linearly from 48 variables with one BESS to 96, 144, and 192 variables with two, three, and four BESS units, respectively. The average processing times were 0.0417, 0.0425, 0.0427, and 0.0528 h. Compared to the previous configuration, the processing time increased by 2.02% when moving from one to two BESS units, by 0.32% from two to three, and by 23.83% from three to four. Overall, increasing the system from one to four BESS units produced a 26.74% increase in processing times. Although the solution space grows linearly with the number of batteries, the execution time does not follow the same proportional trend because it also depends on feasibility correction, convergence behavior, and the number of AC power-flow evaluations. The relationship between solution space dimension, processing times, and number of BESS units indicates that larger applications may require improved algorithm tuning, more robust optimization strategies, and higher-performance computing resources. Nevertheless, even with four BESS units, the proposed methodology solved the complete 24-h scheduling problem in only 0.0528 h, demonstrating excellent computational performance for day-ahead operation. Finally, selecting the number and location of BESS units remains a planning problem; once these decisions have been established, their coordinated operation can be efficiently determined using the proposed methodology.
Regarding the temporal resolution, reducing the time interval would also expand the solution space. For example, with three BESS units, changing from 1-h intervals to 30- or 15-min intervals would increase the number of scheduling periods from 24 to 48 or 96 and the number of decision variables from 144 to 288 or 576. Therefore, an increase in processing times is expected since more BESS decisions and AC power flow evaluations would be required.
6. Conclusions and Future Work
This paper proposed a parallel adapted AJAYA-based methodology for the day-ahead coordinated active and reactive power dispatch of BESS units in ADNs. The optimization model minimizes conventional generation costs, DER operating and maintenance costs, and battery degradation costs while ensuring AC-feasible operation through a multi-period power flow evaluation. The proposed framework was validated in 33-node and 69-node ADNs under deterministic and uncertainty conditions, and it was benchmarked against PGA, MVO, SALPS, GWO, and VSA.
The deterministic analysis indicated that AJAYA achieves the lowest operating cost and best average performance among all evaluated methods, demonstrating its ability to identify high-quality dispatch profiles while preserving network feasibility. The uncertainty analysis further confirmed the robustness of the proposed approach, as AJAYA consistently provided the greatest economic savings and lowest solution dispersion in both test systems.
Our cost-component analysis showed that energy procurement remains the dominant cost (97.90–99.18%), while degradation and maintenance costs provide a more comprehensive economic assessment. Computational times remained below 154 s for all evaluated cases, confirming our proposal’s suitability for day-ahead operational planning.
It should be noted that, although AJAYA provides the best economic performance, it is not always the fastest method among those evaluated. The primary advantage of the proposed methodology lies in its superior solution quality and robustness, with computation times remaining fully acceptable for day-ahead scheduling applications. This trade-off between solution quality and execution time is considered reasonable for operational planning problems, where the economic benefits outweigh the modest increase in processing time.
The main contributions of this work are (i) an AC-feasible and degradation-aware optimization framework for BESS scheduling; (ii) the integration of coordinated active/reactive power dispatch, technical constraints, and uncertainty scenarios; and (iii) a parallel AJAYA-based solution methodology with adaptive mechanisms and stagnation control.
Future work will extend the methodology to three-phase unbalanced networks, include additional DER technologies, develop multi-objective formulations, and investigate BESS ownership structures with independent entities.
Author Contributions
All authors contributed equally to the conceptualization, methodology, software development, validation, formal analysis, investigation, resource provision, data curation, visualization, supervision, project administration, funding acquisition, and the writing, review, and editing of the manuscript. All authors have read and agreed to the published version of the manuscript.
Funding
The authors acknowledge the support provided by Thematic Network 723RT0150, Red para la integración a gran escala de energías renovables en sistemas eléctricos (RIBIERSE-CYTED). This study was funded by the 2022 Call for Thematic Networks by the Ibero-American Program of Science and Technology for Development (CYTED in Spanish).
Data Availability Statement
Data available under request.
Conflicts of Interest
The authors declare no conflicts of interest.
References
- Qiao, J.; Mi, Y.; Shen, J.; Lu, C.; Cai, P.; Ma, S.; Wang, P. Optimization schedule strategy of active distribution network based on microgrid group and shared energy storage. Appl. Energy 2025, 377, 124681. [Google Scholar] [CrossRef] [Scilit]
- Hossain, M.R.; Mali, P.; Paudyal, S. Dynamic Equivalent of PV-Integrated Active Distribution System Using Neural Networks. IEEE Trans. Ind. Inform. 2025, 21, 9778–9789. [Google Scholar] [CrossRef] [Scilit]
- Seyednouri, S.; Safari, A.; Ravadanegh, S.N.; Quteishat, A.; Taghizadegan, N. Distributed and adaptive robust energy management of an active distribution network with multi-microgrid considering transactive energy. Electr. Power Syst. Res. 2025, 248, 111969. [Google Scholar] [CrossRef] [Scilit]
- Song, N.; Chen, Y.; Mo, J. Active Power Curtailment Control Method for Distribution Networks with Distributed Photovoltaic Systems. In Proceedings of the 2025 6th International Conference on Advanced Electrical and Energy Systems (AEES); IEEE: Piscataway, NJ, USA, 2025; pp. 858–864. [Google Scholar] [CrossRef] [Scilit]
- Li, Z.; Sun, H.; Xue, Y.; Li, Z.; Jin, X.; Wang, P. Resilience-Oriented Asynchronous Decentralized Restoration Considering Building and E-Bus Coresponse in Electricity-Transportation Networks. IEEE Trans. Transp. Electrif. 2025, 11, 11701–11713. [Google Scholar] [CrossRef] [Scilit]
- Kumar, A.; Maulik, A.; Chinmaya, K. Energy management strategies for active distribution networks and Microgrids—A comprehensive survey. IETE Tech. Rev. 2025, 42, 502–541. [Google Scholar] [CrossRef] [Scilit]
- Amako, E.A.; Arzani, A.; Mahajan, S.M. Heuristic-Based Scheduling of BESS for Multi-Community Large-Scale Active Distribution Network. Electricity 2025, 6, 36. [Google Scholar] [CrossRef] [Scilit]
- Benavides, D.; Arévalo, P.; Criollo, A.; Tostado-Véliz, M.; Jurado, F. Multi-mode monitoring and energy management for photovoltaic-storage systems. Renew. Energy 2024, 230, 120820. [Google Scholar] [CrossRef] [Scilit]
- Qin, X.; Li, Z.; Li, Z.; Xue, Y.; Chang, X.; Su, J.; Jin, X.; Wang, P.; Sun, H. Spatio-Temporal Coordinated Operation Strategy of Data Centers Considering Virtual Storage System via Two-Stage Distributionally Robust Optimization. IEEE Trans. Netw. Sci. Eng. 2026, 13, 7343–7357. [Google Scholar] [CrossRef] [Scilit]
- Zhao, X.; Xu, Q.; Yang, Y.; Zhou, G. Distributed distributionally robust optimization of distribution network incorporating novel battery charging and swapping station. Int. J. Electr. Power Energy Syst. 2024, 155, 109643. [Google Scholar] [CrossRef] [Scilit]
- Kilthau, M.; Henkel, V.; Wagner, L.P.; Gehlhoff, F.; Fay, A. A decentralized optimization approach for scalable agent-based energy dispatch and congestion management. Appl. Energy 2025, 377, 124606. [Google Scholar] [CrossRef] [Scilit]
- Nguyen, T.T.; Nguyen, T.T.; Nguyen, H.P. Optimal operation of battery energy storage system in microgrid to minimize electricity cost based on model predictive control using coyote algorithm. J. Energy Storage 2025, 114, 115904. [Google Scholar] [CrossRef] [Scilit]
- Polanco Vásquez, L.O.; López Redondo, J.; Álvarez Hervás, J.D.; Ramírez, V.M.; Torres Moreno, J.L. Balancing CO2 emissions and economic cost in a microgrid through an energy management system using MPC and multi-objective optimization. Appl. Energy 2023, 347, 120998. [Google Scholar] [CrossRef] [Scilit]
- Barukčić, M.; Kurtović, G.; Benšić, T.; Jerković Štil, V. Optimal Allocation and Energy Management of Units in Distribution Networks with Multiple Renewable Energy Sources and Battery Storage Based on Computational Intelligence. Energies 2023, 16, 7567. [Google Scholar] [CrossRef] [Scilit]
- Aksbi, A.; Elkafazi, I.; Bannari, R.; Bannari, A.; Merzouk, S.; Bossoufi, B.; Mohammed, S.A.; Ahmad, N.; Elbarbary, Z.M.S.; Yessef, M. Optimum energy management of distribution networks with integrated decentralized PV-BES systems using SPEA2-based optimization approach. Sci. Rep. 2025, 15, 40482. [Google Scholar] [CrossRef] [Scilit] [PubMed]
- Sanin-Villa, D.; Figueroa-Saavedra, H.A.; Grisales-Noreña, L.F. Efficient BESS Scheduling in AC Microgrids via Multiverse Optimizer: A Grid-Dependent and Self-Powered Strategy to Minimize Power Losses and CO2 Footprint. Appl. Syst. Innov. 2025, 8, 85. [Google Scholar] [CrossRef] [Scilit]
- Garrido-Arévalo, V.M.; Montoya, O.D.; Gil-González, W.; Grisales-Noreña, L.F.; Hernández, J.C. An SDP relaxation in the complex domain for the efficient coordination of BESS and DGs in single-phase distribution grids while considering reactive power capabilities. J. Energy Storage 2024, 90, 111913. [Google Scholar] [CrossRef] [Scilit]
- Polat, S.; Biyik, E.; Öztura, H.Ş. Optimal active and reactive power scheduling for inverter-integrated PV and BESS under inverter current constraints. Electr. Power Syst. Res. 2025, 245, 111629. [Google Scholar] [CrossRef] [Scilit]
- Vega Peña, M.C.; Montoya Giraldo, O.D.; Gil-González, W. Applying an Optimization Algorithm Based on the Cauchy Distribution for Active and Reactive Power Management with Batteries in Energy Distribution Systems. Ingeniería 2025, 30, e22852. [Google Scholar] [CrossRef] [Scilit]
- Akpinar, K.N.; Gundogdu, B.; Ozgonenel, O. A novel cycle counting perspective for energy management of grid integrated battery energy storage systems. Energy Rep. 2023, 9, 123–131. [Google Scholar] [CrossRef] [Scilit]
- Moreno, C.A.M.; Leyton-Valencia, K.A.; Grisales-Noreña, L.F.; Bolaños, R.I.; Hernández, J.C. Electric Vehicle Charging Stations in Colombian Active Distribution Networks: Models, Impacts, and Research Challenges. Sci 2026, 8, 119. [Google Scholar] [CrossRef] [Scilit]
- Ceraolo, M.; Fioriti, D.; Lutzemberger, G.; Giuseppe Quilici, F.; Scarpelli, C.; Bianchi, F. Electro-Thermal Modeling and Aging Evaluation of Lithium Battery Packs for Electric Vehicles. IEEE Access 2024, 12, 128151–128165. [Google Scholar] [CrossRef] [Scilit]
- Bloom, I.; Thomas, E.V.; Christophersen, J.P.; Robertson, D.C.; Walker, L.K.; Ho, C.; Battaglia, V. Non-Isothermal Aging of Lithium-Ion Cells. ECS Meet. Abstr. 2016, MA2016-02, 888. [Google Scholar] [CrossRef] [Scilit]
- Cubillo-Leyton, P.I.; Montoya, O.D.; Grisales-Norena, L.F. Optimized integration of photovoltaic systems and distribution static compensators in distribution networks using a novel discrete-continuous version of the adaptive JAYA algorithm (AJAYA). Results Eng. 2025, 26, 104726. [Google Scholar] [CrossRef] [Scilit]
- Grisales-Noreña, L.F.; Rosales-Muñoz, A.A.; Cortés-Caicedo, B.; Montoya, O.D.; Andrade, F. Optimal operation of PV sources in DC grids for improving technical, economical, and environmental conditions by using vortex search algorithm and a matrix hourly power flow. Mathematics 2022, 11, 93. [Google Scholar] [CrossRef] [Scilit]
- Figueroa-Saavedra, H.A.; Sanin-Villa, D.; Grisales-Noreña, L.F. A Tuned Parallel Population-Based Genetic Algorithm for BESS Operation in AC Microgrids: Minimizing Operational Costs, Power Losses, and Carbon Footprint in Grid-Connected and Islanded Topologies. Electricity 2025, 6, 45. [Google Scholar] [CrossRef] [Scilit]
- Sanin-Villa, D.; Grisales-Noreña, L.F.; Montoya, O.D. Operational Cost Minimization in AC Microgrids via Active and Reactive Power Control of BESS: A Case Study from Colombia. Appl. Syst. Innov. 2025, 8, 180. [Google Scholar] [CrossRef] [Scilit]
- Saraswat, R.; Suhag, S. Memetic salp swarm algorithm optimized control for operational resilience in grid-tied microgrid. Sustain. Comput. Inform. Syst. 2025, 48, 101195. [Google Scholar] [CrossRef] [Scilit]
- Lobos-Cornejo, S.; Grisales-Noreña, L.F.; Andrade, F.; Montoya, O.D.; Sanin-Villa, D. Smart Energy Strategy for AC Microgrids to Enhance Economic Performance in Grid-Connected and Standalone Operations: A Gray Wolf Optimizer Approach. Sci 2025, 7, 73. [Google Scholar] [CrossRef] [Scilit]
- Vanlalchhuanawmi, C.; Deb, S.; Islam, M.M.; Ustun, T.S. Forecast-integrated hierarchical energy management of PV–BESS in residential distribution networks using COA–VSA metaheuristics. AIP Adv. 2026, 16, 035212. [Google Scholar] [CrossRef] [Scilit]
- Grisales-Noreña, L.; Montoya, O.D.; Gil-Gonzalez, W. Integration of energy storage systems in AC distribution networks: Optimal location, selecting, and operation approach based on genetic algorithms. J. Energy Storage 2019, 25, 100891. [Google Scholar] [CrossRef] [Scilit]
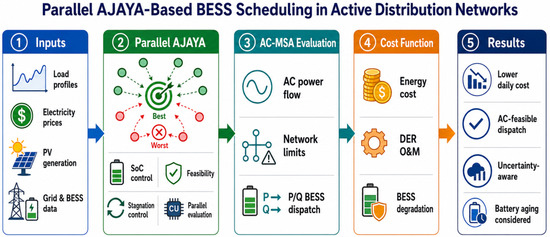
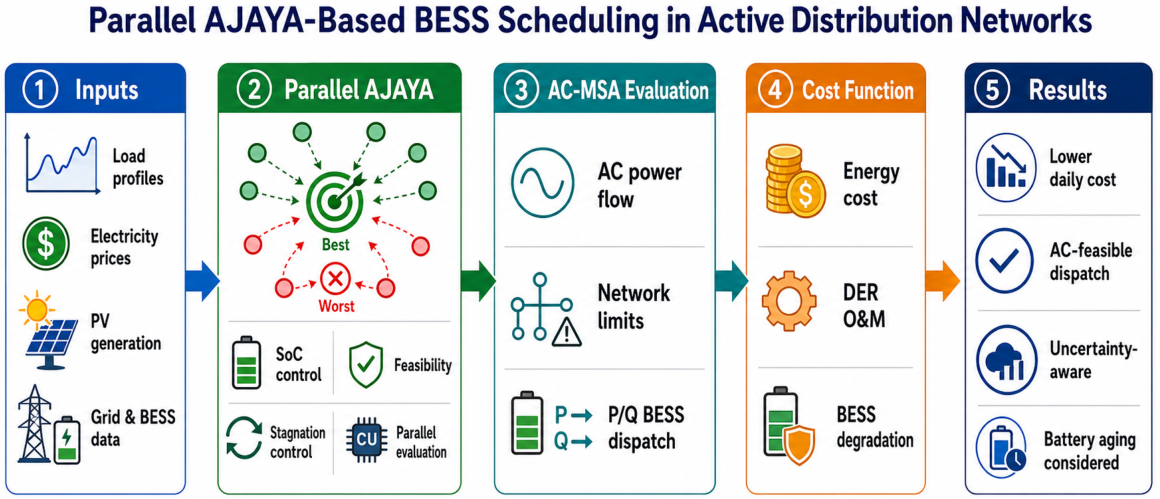
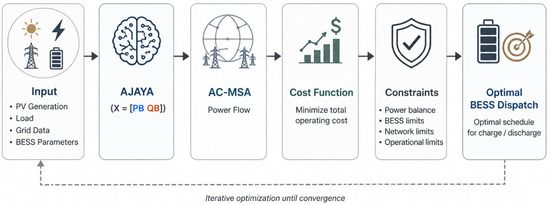
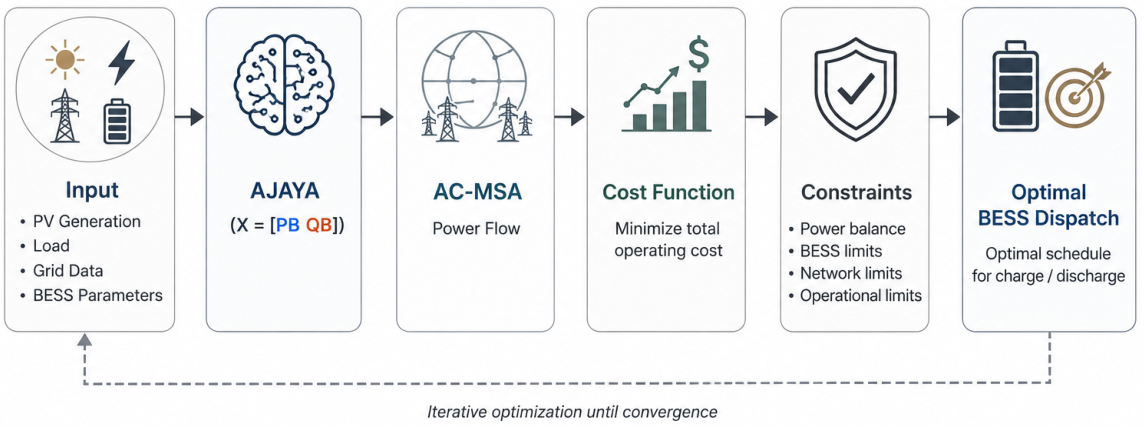
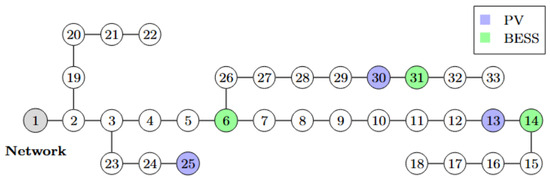
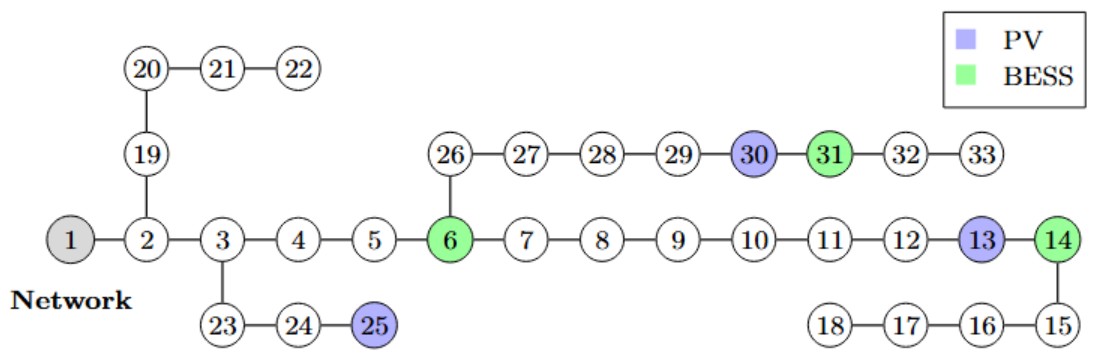
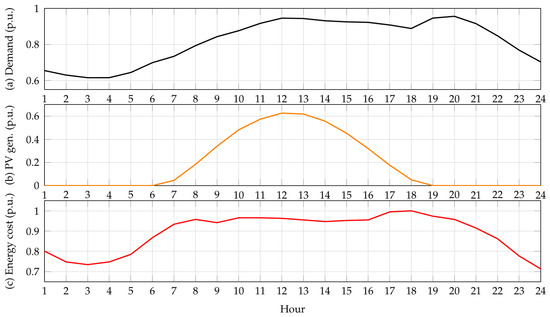
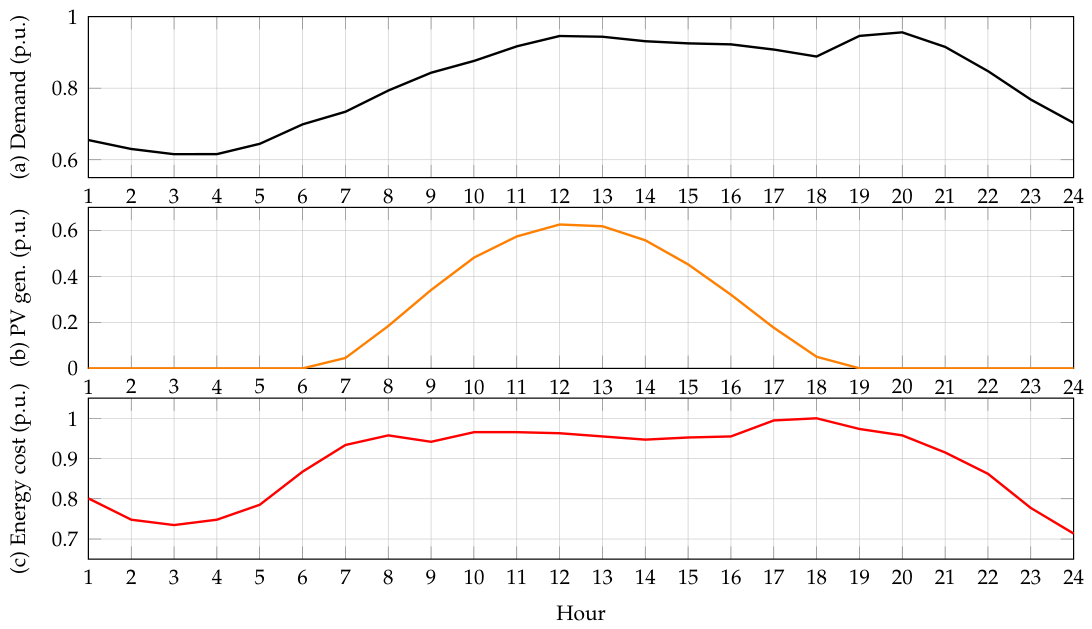
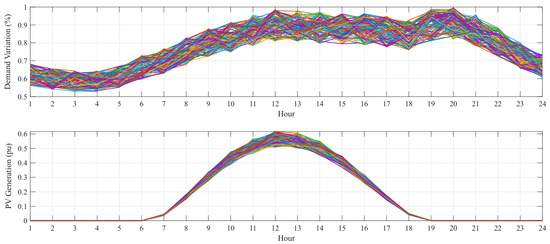
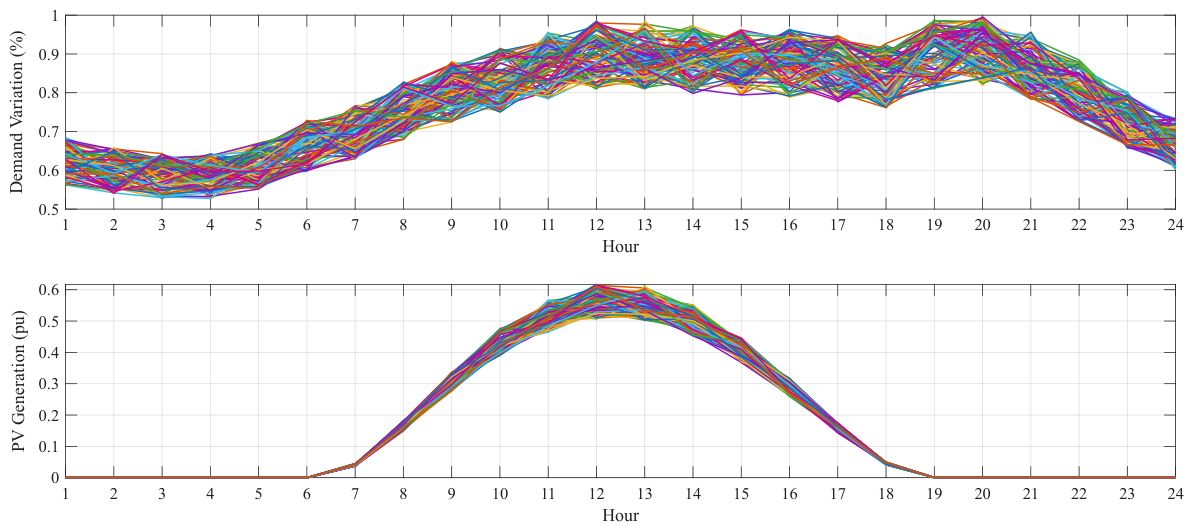
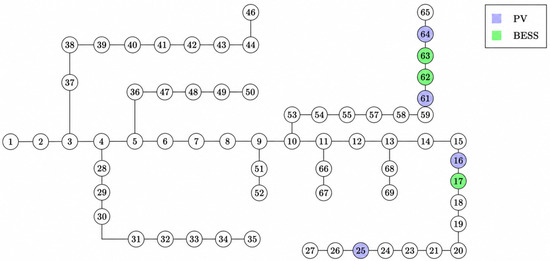
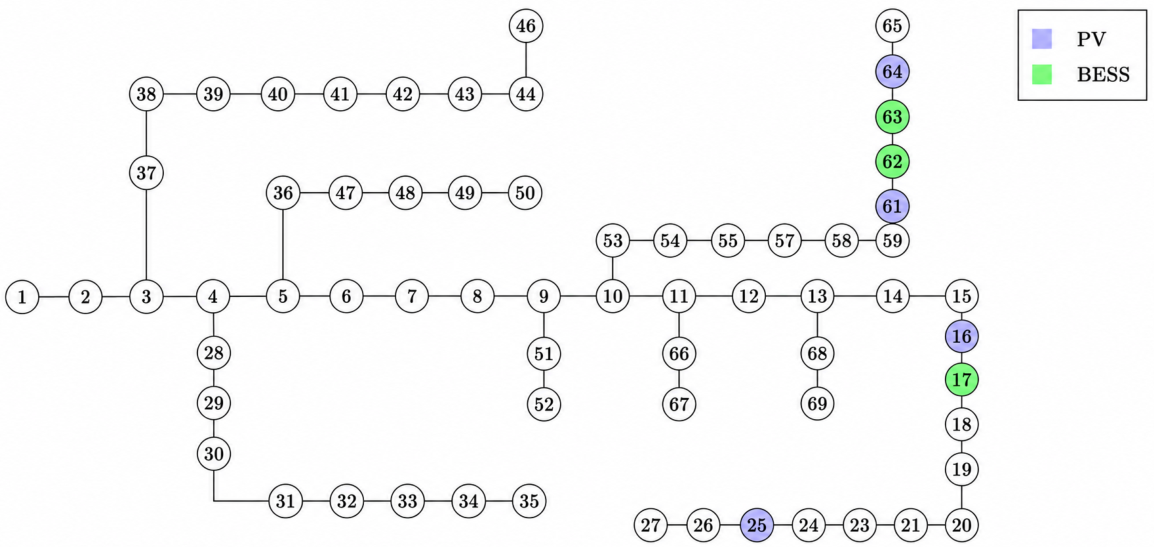
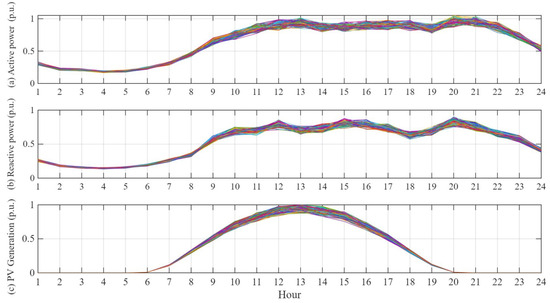
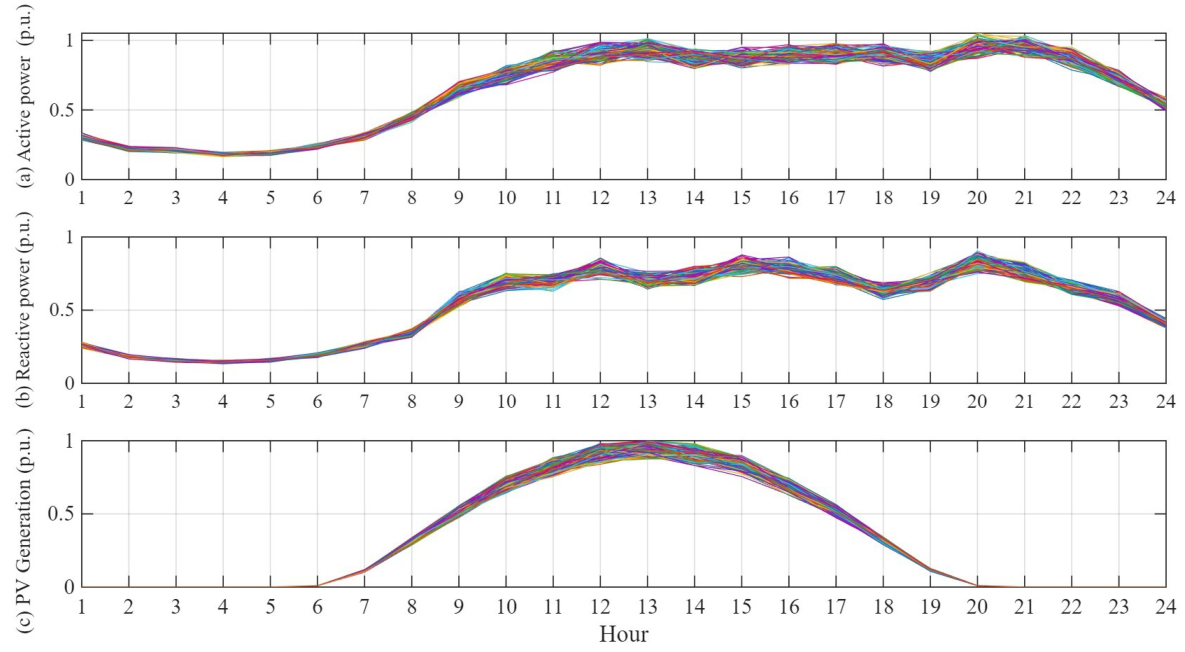
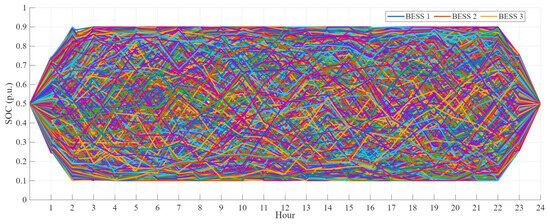
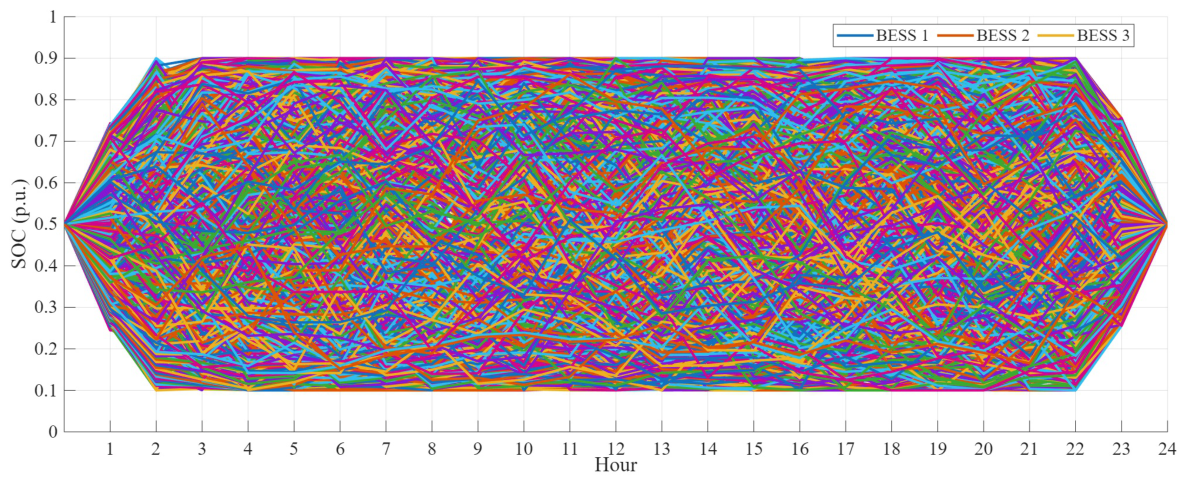
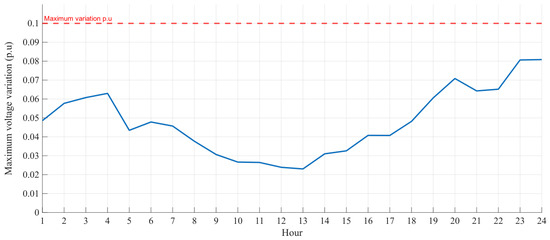
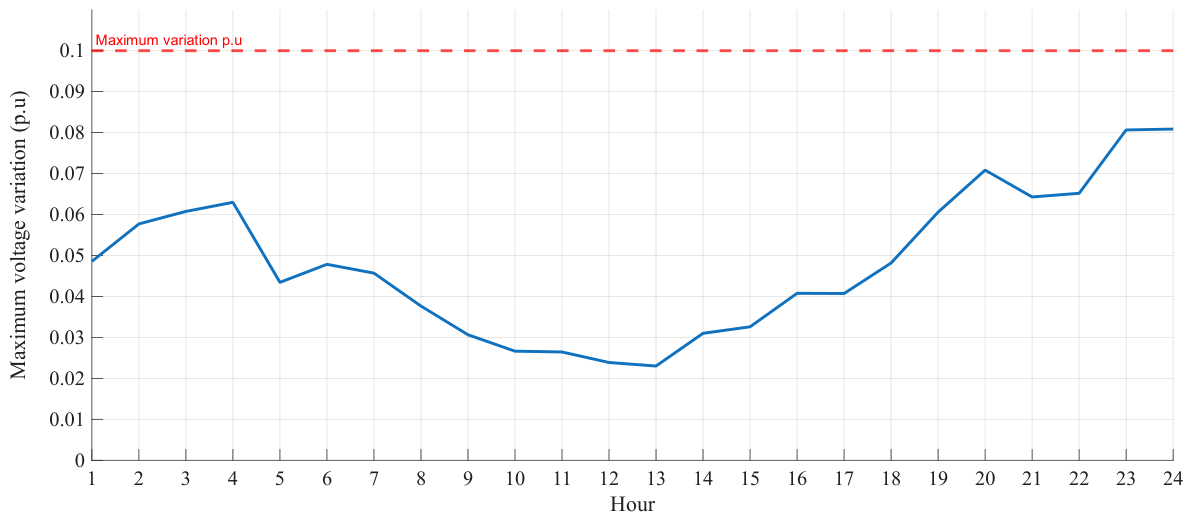
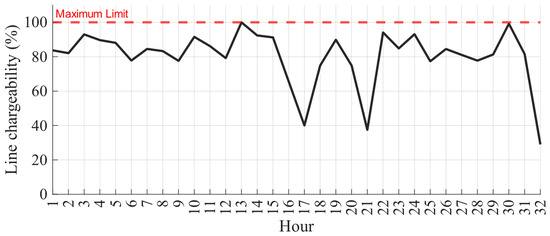
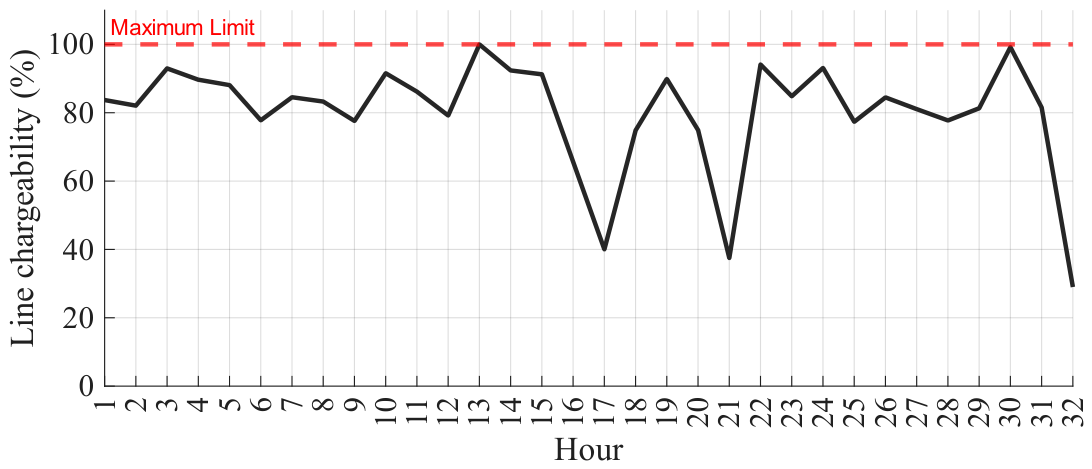
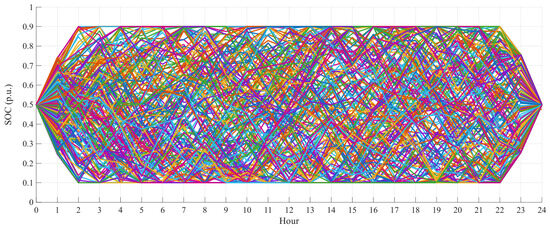
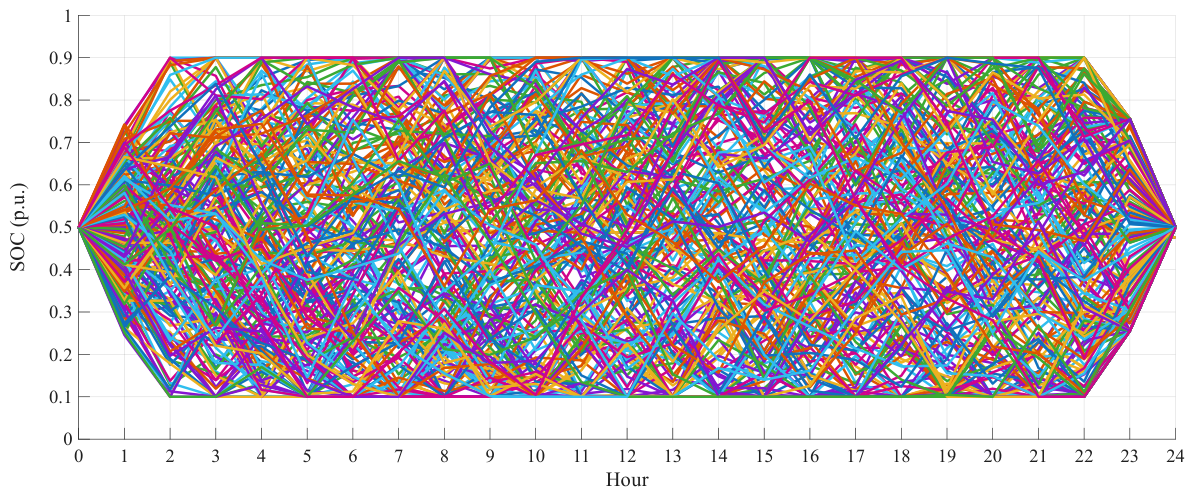
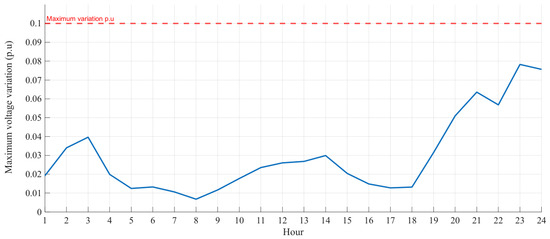
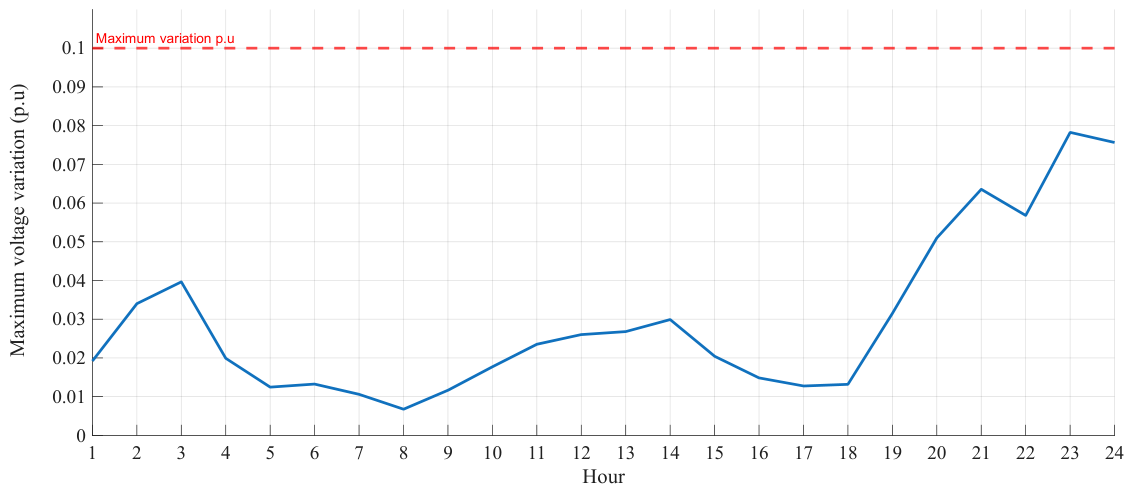
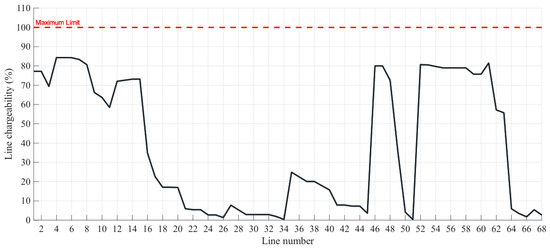
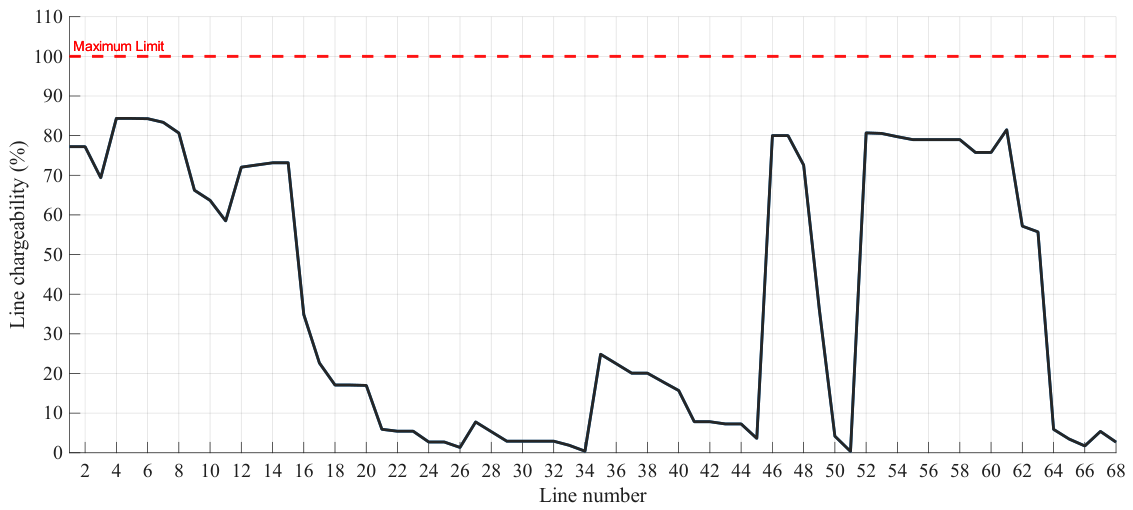
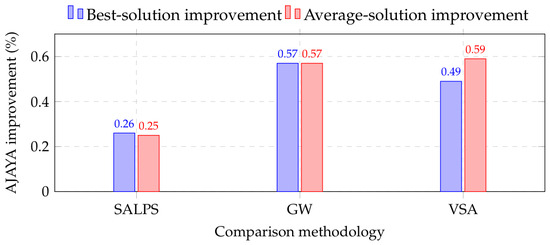
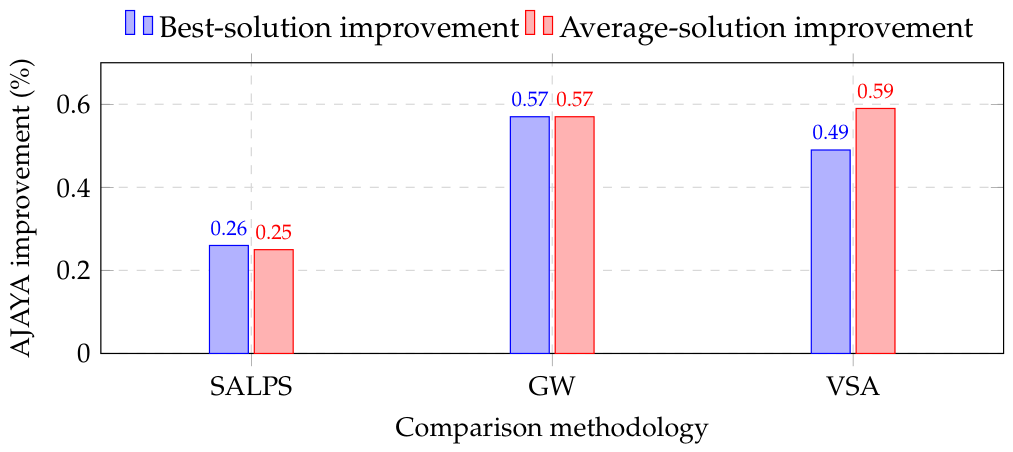
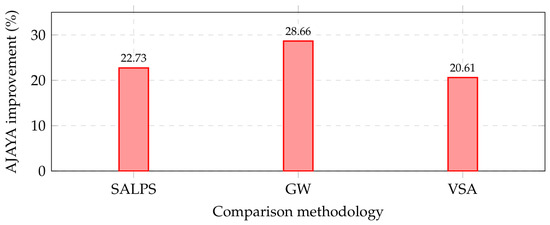
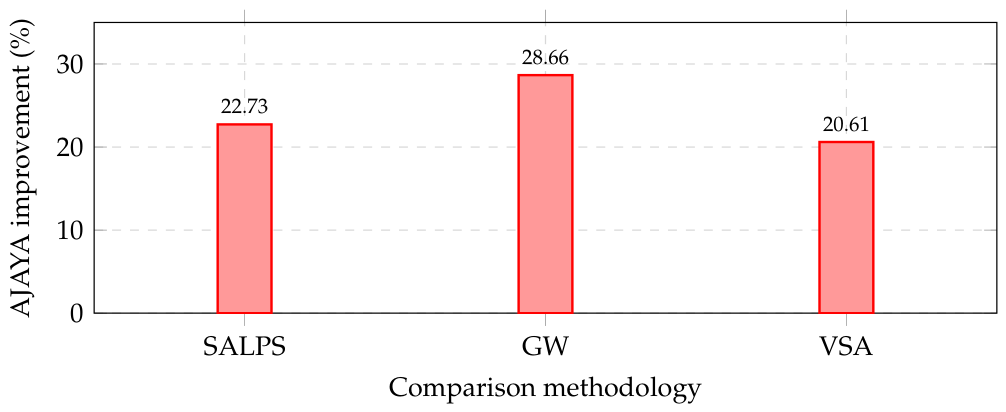

Disclaimer/Publisher’s Note: The statements, opinions and data contained in all publications are solely those of the individual author(s) and contributor(s) and not of MDPI and/or the editor(s). MDPI and/or the editor(s) disclaim responsibility for any injury to people or property resulting from any ideas, methods, instructions or products referred to in the content. |
© 2026 by the authors. Licensee MDPI, Basel, Switzerland. This article is an open access article distributed under the terms and conditions of the Creative Commons Attribution (CC BY) license.