


Abstract
The increasing penetration of distributed generation (DG) in distribution systems poses significant operational challenges, including increased power losses, voltage profile deviations, and variations in short-circuit currents. These issues may compromise network safety, reliability, and the selectivity of protection schemes under different operating scenarios. This paper proposes a hybrid optimization methodology for the optimal placement and sizing of DG, aiming to minimize active power losses while ensuring voltage regulation and keeping short-circuit currents within permissible limits. An integrated approach is proposed that combines a mesh-to-radial network reconfiguration strategy with a modified Ant Lion Optimization algorithm, known as ALO-DG, enabling the simultaneous optimization of network topology and the allocation of distributed generators at candidate buses. The problem is formulated taking into account power balance constraints, voltage limits, distribution network capacity limits, and short-circuit current limits. The proposed methodology achieved substantial reductions in active power losses in the IEEE 33-bus and 69-bus test systems, reaching 84.42% and 91.56%, respectively. These improvements were accompanied by enhanced voltage profiles while preserving the radial operating structure of the distribution networks. Furthermore, the proposed hybrid methodology serves as a tool for the planning and operation of distribution systems with high DG penetration, particularly in scenarios where grid security and protection coordination are critical considerations.
1. Introduction
Distributed energy resources (DERs) encompass a wide range of decentralized energy technologies, including distributed generation (DG), demand response programs, and energy storage systems. These resources are characterized by their ability to operate close to load centers, their decentralized nature, and their potential to actively participate in system operation, providing flexibility and grid support services [1,2]. In this context, DG refers specifically to small-scale electricity generation units connected directly to distribution networks.
In the last decade, government incentives, net-metering schemes, and the growing awareness of sustainability have accelerated the adoption of DERs worldwide [3,4]. Furthermore, the need for improved energy resilience and reliability has fostered the integration of DG within microgrids and active distribution networks [5,6]. As a result, distribution systems are evolving from passive networks with unidirectional power flows to active systems characterized by bidirectional flows and dynamic operating conditions. The increasing penetration of DG can significantly enhance voltage profiles and reduce active power losses. However, inadequate placement and sizing of DG units may result in adverse effects such as reverse power flows, voltage instability, and elevated short-circuit currents, potentially compromising protection selectivity and coordination [7,8]. In addition, high penetration of DG may introduce issues related to harmonic distortion, island detection, and operational uncertainty due to the intermittent nature of renewable sources. Consequently, determining the optimal location and capacity of DG units has become a topic of considerable interest in the optimization of planning and operation of electric power distribution systems [9]. To address this problem, numerous optimization approaches have been employed by researchers in the scientific literature.
Particle Swarm Optimization (PSO) is a metaheuristic technique inspired by the social behavior of flocks of birds and schools of fish. In PSO, a population of candidate solutions—called particles—moves through the search space by updating their positions and velocities based on both their own best-known position and the best-known position found by the swarm. PSO has been widely applied to the optimal placement and sizing of DG units in distribution systems, aiming to minimize power losses, improve voltage profiles, and enhance overall network performance [10,11]. Hybrid optimization strategies that combine PSO with other metaheuristic algorithms, such as the Dragonfly Algorithm, have demonstrated improved exploration–exploitation balance and enhanced solution quality, as reported in [12]. In islanded and microgrid configurations, PSO-based methods have also been employed to simultaneously minimize frequency deviation, voltage deviation, and active power losses [13]. A hybrid PSO approach combined with an analytical method is proposed in [14] for the optimal siting and sizing of DG units in distribution networks, aiming to enhance computational efficiency and solution accuracy. Similarly, the authors in [15] present a hybrid Crow Search Algorithm integrated with PSO to address the optimal allocation and sizing of renewable DG, demonstrating improved convergence performance and solution robustness.
Genetic algorithms (GAs) are based on the principles of natural selection and genetics, mimicking the process of biological evolution. In GAs, a population of candidate solutions—encoded as chromosomes—evolves over successive generations through operators such as selection, crossover, and mutation. GAs have also been widely applied to the optimal location and sizing of DG units in distribution systems. In [16], the authors implement a GA for the optimal sizing and placement of DG considering reactive power allocation. In [17], PSO and GAs are applied to minimize annual energy losses and voltage deviation index in distribution systems. Several authors have explored hybrid approaches that combine GAs with deterministic optimization methods, such as the Nelder–Mead technique. Such combination have proven effective in improving solution quality, particularly by increasing the number of buses operating within acceptable voltage limits in distribution systems with DG [18].
Advanced metaheuristic techniques, such as Elephant Herding Optimization [19], the Fruit Fly Algorithm [20], and inertia-weighted variants of PSO [21], have been employed to further explore the limits of DG penetration and assess its impact on power losses and voltage profiles. These approaches enhance the balance between exploration and exploitation, improving convergence behavior and solution robustness in complex distribution system optimization problems. Moreover, several studies have extended optimization frameworks to fault-related analyses. For instance, nonlinear programming techniques have been applied for fault identification in IEEE test systems [22], while knowledge-based fuzzy controllers have been proposed for the optimal placement and sizing of DG units [23]. In addition, multi-objective optimization strategies [24] have been introduced to simultaneously address technical, economic, and reliability criteria, reflecting the increasingly comprehensive nature of DG planning methodologies.
Furthermore, the integration of voltage stability indices with metaheuristic algorithms such as the Firefly Algorithm, Flower Pollination Algorithm, and Dragonfly Algorithm has demonstrated that the simultaneous allocation of multiple distributed energy resources can outperform single-resource placement strategies [25]. This highlights the importance of coordinated planning in active distribution networks with high penetration of distributed resources. The literature on the optimal allocation and sizing of DG in distribution systems is extensive. Comprehensive review papers, such as those presented in [26,27,28], provide detailed surveys of methodologies, objective functions, constraints, and solution techniques for DG placement and sizing in distribution networks, offering valuable insights into current trends and research gaps in the field.
Distribution network reconfiguration (DNR) is carried out by altering the states of sectionalizing and tie switches—sectionalizing switches: normally closed; tie switches: normally open. It consists of determining a new system topology aimed at minimizing power losses, improving the voltage profile, and enhancing overall network reliability [29].
From a mathematical optimization perspective, DNR is often formulated as a mixed-integer nonlinear (MINL) problem, whose solution is challenging due to the vast number of possible network topologies. The problem must satisfy multiple constraints, including limits on electrical variables as well as topological requirements. Given this complexity, numerous metaheuristic optimization techniques have been employed to address the DNR problem effectively. In [30], the authors propose a nondominated sorting genetic algorithm (NSGA) to address the DNR problem using a multi-objective approach that simultaneously minimizes real power losses while improving the voltage profile and load balancing index, all with a reduced number of switching operations. In [31], the authors introduce a graph-based genetic algorithm in which spanning trees are used to represent network configurations, with each spanning tree linked to a specific subpopulation within the GA. The main advantage of this approach is that it inherently avoids generating infeasible solutions during the reconfiguration process.
An approach to find the optimal reconfiguration of distribution systems is proposed in [32] using the PSO technique. The method seeks to simultaneously reduce active and reactive power losses, minimize voltage deviations, and enhance system reliability through the formulation of a multi-objective function. In [33], PSO is also employed to solve the DNR problem. The approach focuses on identifying the best switching scheme by modifying tie and sectionalizing switches while preserving the radial structure of the system. The objective is to enhance operational performance by improving the voltage profile and reducing system losses, subject to the equality and inequality constraints inherent to the distribution network. The literature on optimal distribution network reconfiguration is extensive and encompasses a wide range of solution techniques, including Simulated Annealing (SA) [34], Tabu Search (TS) [35], Differential Evolution (DE) [36], Ant Colony Optimization (ACO) [37], and linear mathematical models [38]. A comprehensive review of the optimal reconfiguration problem can be found in [39].
Different studies have addressed the distribution network optimization problem from different initial conditions. Some works start from a meshed configuration and convert it to a radial topology without considering distributed generation placement [38,39]. Others begin with a radial system and minimize losses exclusively through distributed generation allocation [40,41]. A third group optimizes distributed generation alongside the optimal placement of fault current limiters to mitigate short-circuit levels [42,43].
However, when short-circuit current constraints are imposed, additional devices such as fault current limiters are generally required, which increases the overall cost of the network. In contrast, this research simultaneously optimizes the placement and sizing of distributed generators, maintains voltage profiles within permissible limits, controls short-circuit current contributions, ensures adequate power factor operation of generation plants, and preserves network radiality. This combination of constraints has not been widely explored in the technical literature, and this work contributes to broadening the discussion in this regard.
Despite these advances, most existing studies primarily focus on loss minimization and voltage regulation, often assuming fixed radial topologies and neglecting the impact of DG integration on short-circuit current levels, as well as on protection selectivity and coordination. Moreover, network reconfiguration and DG allocation are commonly treated as sequential problems, which may lead to suboptimal solutions under high DG penetration scenarios. These limitations highlight the need for integrated methodologies capable of simultaneously addressing network topology, DG placement and sizing, and electrical safety constraints. In this context, the main contributions of this paper are as follows:
- An integrated optimization methodology that simultaneously combines mesh-to-radial network reconfiguration with a modified Ant Lion Optimization (ALO) algorithm, enabling the coordinated determination of optimal feeder topology and DG placement and sizing in distribution systems.
- The explicit incorporation of short-circuit current constraints within the optimization framework, in addition to conventional power balance and voltage magnitude limits, thereby ensuring that protection coordination and electrical safety requirements are preserved under different operating conditions.
- A unified formulation that treats reconfiguration and DG allocation as a single optimization problem, avoiding the suboptimality associated with sequential approaches and improving overall technical performance under high DG penetration scenarios.
The remainder of this paper is organized as follows. Section 2 presents the mathematical formulation of the problem, including the objective function and the associated constraints. Section 3 describes in detail the proposed methodology, outlining the solution approach and its main components. Section 4 presents the results obtained from tests conducted on two benchmark distribution systems, highlighting the performance and effectiveness of the proposed method. Section 5 analyzes the findings and contrasts them with existing literature. Finally, Section 6 summarizes the main conclusions and outlines directions for future research.
2. Problem Formulation
The optimal placement of DG units can be formulated as a nonlinear optimization problem with constraints, involving both discrete and continuous decision variables that interact with the electrical behavior of the power distribution network. Improper placement of DGs can increase power losses, degrade voltage profiles, and compromise system reliability and safety. In this work, the problem is formulated to minimize total active power losses in the distribution network. The decision variables include the locations of distributed generators at candidate buses and their active power capacities, while voltages and power flows are determined through the power flow equations. This formulation ensures a mathematically and physically consistent framework that links the optimization process to the system’s electrical characteristics, enabling the assessment of candidate solutions under realistic operating conditions and the incorporation of technical constraints such as voltage limits, generation capacities, and short-circuit current restrictions.
2.1. Objective Function
The objective function aims to minimize the active power losses in the network branches. In this case, the optimization is formulated as a penalized single-objective function, where each violation of the technical constraints adds a penalty term weighted by a factor . Mathematically, the objective function is expressed as indicated in Equation (1).
where x is a given candidate solution, represents the total active power losses associated to such candidate solution; and are the penalty factors for deviations in voltage magnitudes, short circuit currents, DG capacity, radiality constraint and power factor, respectively; while , , , and ) represent their corresponding total deviations or constraint violations. The mathematical expression of the power losses in a branch is indicated in Equation (2).
where and are the current and resistance of branch , respectively. Alternatively, considering the complex power in branch given by , and the voltage magnitude at bus i, labeled as , the total active power losses can be reformulated as indicated in Equation (3).
2.2. Constraints
The optimal placement and sizing of DG units is formulated as a constrained optimization problem to ensure safe operation and physical consistency with the distribution system. The constraints represent both the electrical behavior of the grid and the operational limits of its components, as described below.
2.2.1. Active and Reactive Power Balance
For each bus , the active and reactive power balance must be satisfied according to Equations (4) and (5). These constraints ensure equilibrium between the generated power, the demanded power, and the flows through the branches connected to the bus.
In this case, where represents the set of buses adjacent to bus i and and correspond to the active and reactive power flows in branch , respectively.
Whenever a DG unit is installed at bus i, the optimization process determines both the binary decision of whether to install a DG unit at that candidate bus and the corresponding nominal active power assigned to it, within the established technical limits.
Additionally, in order to preserve operational stability and avoid overinjection conditions that may degrade network performance, the total power generated by distributed resources is kept below the total system demand. However, reverse power flows of moderate magnitude may occur locally in some sections of the network as a consequence of the spatial distribution of DG units, which is admissible as long as the overall system operation remains within the established technical limits.
2.2.2. Upper and Lower Voltage Limits
To ensure proper network operation and compliance with service quality standards, the voltage magnitude at each bus must be maintained within a permissible range. This condition is expressed in Equation (7), where and
2.2.3. DG Capacity Limits
The active power installed for each distributed generator is limited by technical and operational considerations. These constraints are formulated in Equation (8).
where is a binary variable indicating the presence () or absence () of distributed generation at node i. In this study, a minimum installed capacity of and a maximum capacity of per distributed generation unit are considered.
2.2.4. Short-Circuit Current Limits
To preserve the coordination and interrupting capacity of protection devices, the integration of DG units must not cause short-circuit current levels to exceed permissible ranges. This constraint is imposed on a set of critical buses , and is expressed in Equation (9) for each critical bus: .
where corresponds to the short-circuit current calculated at node k for a candidate solution x, considering both the network topological configuration and the location and capacity of the installed distributed generators. The parameters and represent the lower and upper acceptable short-circuit current limits, defined according to the interrupting capability of circuit breakers and existing protection schemes.
This constraint ensures that the integration of DG does not compromise the system’s electrical safety or the proper operation of protection devices, an aspect that is often overlooked in conventional optimization approaches.
2.2.5. Power Factor Constraints
To ensure efficient utilization of DG units and prevent excessive reactive power exchange with the grid, each distributed generator must operate within a minimum power factor limit. This constraint is expressed as
where is the minimum permissible power factor for each DG unit.
2.2.6. Radial Topology Constraint
To maintain the radial nature of the distribution network, the number of closed branches must satisfy
where is the number of closed branches and is the total number of buses. Additionally, the network must remain fully connected, i.e., all buses must be reachable from the slack bus.
2.3. Computation of Constraint Violations
The penalty terms representing the constraint violations in Equation (1) are introduced to steer the optimization process toward feasible regions of the search space. Each term measures the magnitude of the violation of a specific constraint, as detailed below.
2.3.1. Aggregate Voltage Constraint Violation
To ensure that bus voltages remain within their permissible operating limits, the aggregate voltage constraint violation, denoted by and defined in Equation (12), is incorporated into the objective function. This term is computed as the sum of the squared voltage violations over all buses in the system.
In this case, denotes the total number of buses in the system, represents the voltage magnitude at bus j (in per unit), and and correspond to the minimum and maximum allowable voltage limits for bus j, respectively.
2.3.2. Aggregate Short-Circuit Constraint Violation
To ensure that the three-phase short-circuit current at any bus does not exceed the maximum interrupting capacity of the protective devices, the aggregate short-circuit constraint violation, denoted by and defined in Equation (13), is incorporated into the objective function. This term is computed as the sum of the normalized squared violations over all buses in the system.
In this case, denotes the total number of buses in the system, represents the three-phase short-circuit current calculated at bus j (in kA), and corresponds to the maximum allowable short-circuit current.
2.3.3. Aggregate DG Capacity Violation
To ensure that the active power output of each distributed generator remains within its permissible operating limits, the aggregate DG capacity violation, denoted by and defined in Equation (14), is incorporated into the objective function. This term is computed as the sum of the squared violations over all DG units deployed throughout the network.
Here, refers to the total number of DG units considered in the evaluation of , where multiple units may be allocated across different buses of the system. denotes the active power assigned to the k-th DG unit (in MW), while and define the lower and upper power output bounds applicable to each individual unit.
2.3.4. Aggregate Radial Topology Violation
Distribution networks must operate under a radial topology, which requires that the network be fully connected, with all buses reachable from the slack bus, and contain exactly closed branches, thereby guaranteeing the absence of cycles. The aggregate radial topology violation, denoted by and defined in Equation (15), is incorporated into the objective function as a hard constraint through a large constant M.
In this case, denotes the total number of buses in the system, and M corresponds to a sufficiently large constant that effectively excludes any non-radial or disconnected topology from the feasible solution space.
2.3.5. Aggregate Power Factor Violation
To ensure that each distributed generator operates with an appropriate power factor, the aggregate power factor violation, denoted by and defined in Equation (16), is incorporated into the objective function. This term penalizes any DG unit whose power factor falls below the minimum acceptable value, and is computed as the sum of the squared violations over all units deployed in the network.
In this case, denotes the power factor of the k-th DG unit, and represent the active and reactive power outputs of the k-th DG unit, respectively, and corresponds to the minimum acceptable power factor, applicable to both lagging and leading operation.
3. Methodology
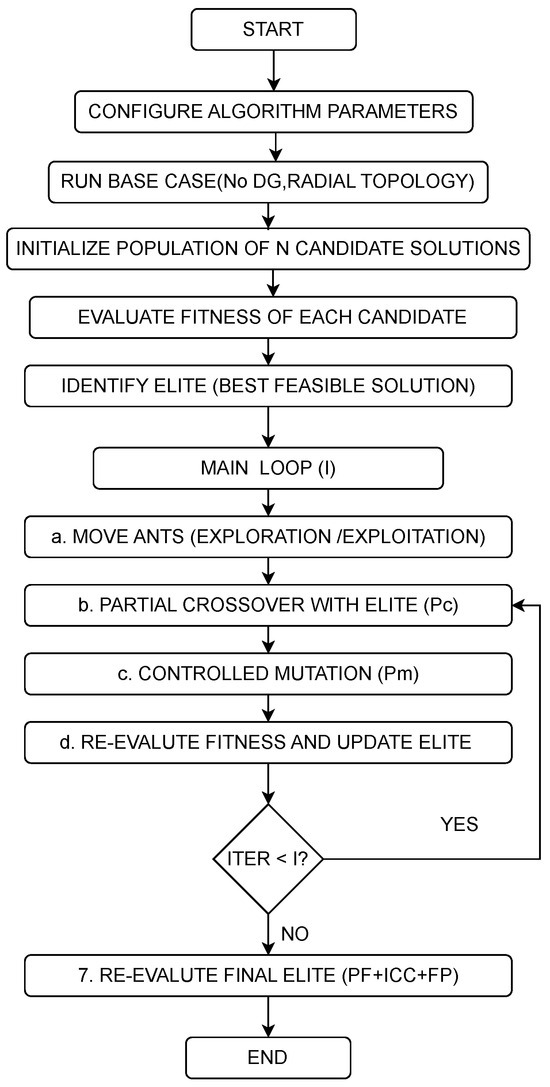
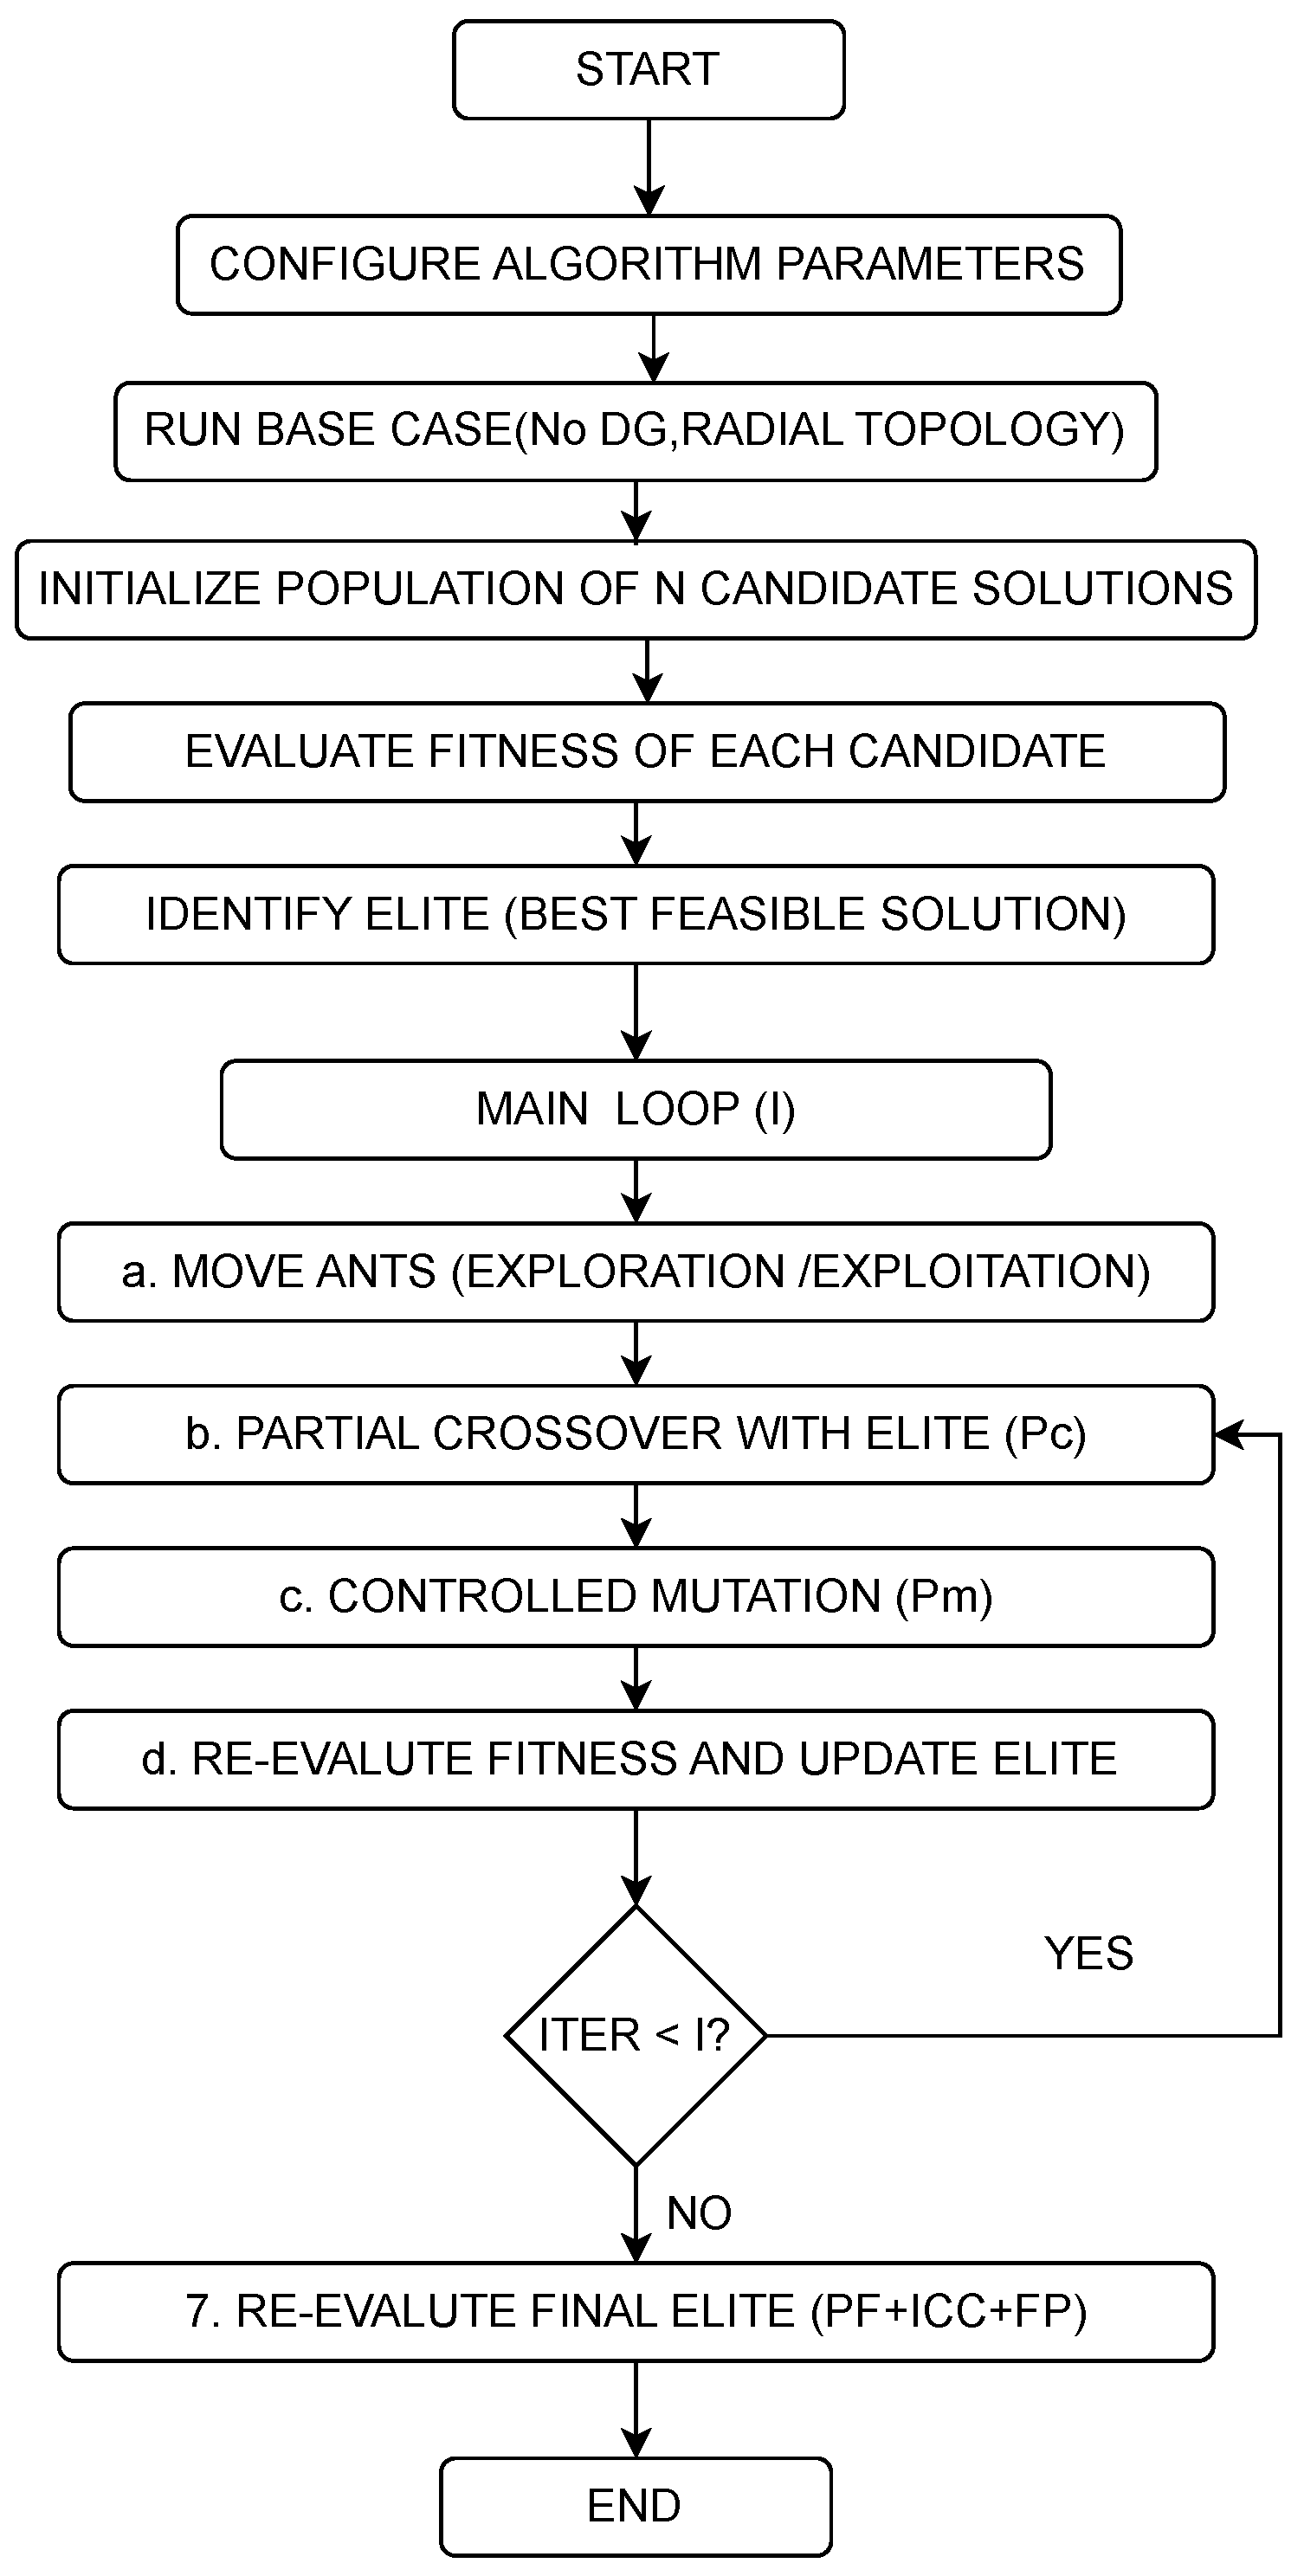
The proposed ALO-DG algorithm integrates three key components: (i) optimal DG placement and sizing, (ii) network reconfiguration, and (iii) short-circuit constraints. Figure 1 presents the complete flowchart of the methodology. In this case, AC power flows are run using MATPOWER 8.1 [44].
Figure 1.
Flowchart of the proposed ALO-DG methodology.
3.1. Solution Encoding and Decoding
Each candidate solution is encoded as a continuous vector with dimension , where is the number of buses, is the maximum number of DG units (6 in this study), and is the number of branches. The vector is partitioned into three blocks as indicated in Table 1.
Table 1.
Partition of the candidate solution vector.
For DG location decoding, the first values are sorted in descending order. The slack bus and non-candidate buses are excluded by assigning . The top buses are selected for DG installation from the candidate set defined in Section 3.2.
3.1.1. DG Sizing Decoding
The proposed ALO-DG algorithm operates with continuous decision variables in the normalized space . However, in real-world distribution systems, DG units have discrete power ratings (integer multiples of 0.01 MW). Therefore, a decoding function is required to map the continuous optimization variable to a feasible discrete power value.
Let MW and MW be the minimum and maximum allowable power outputs per DG unit, respectively. The continuous variable is first linearly interpolated to the desired power range:
This linear mapping ensures that corresponds to and corresponds to . However, is a continuous value that may not be an integer multiple of the desired discretization step MW. To obtain a physically realizable DG size, the value is rounded to the nearest multiple of :
Substituting from Equation (17) and MW yields the complete decoding expression
For example, if , then MW. Dividing by 0.01 gives 55, which rounds to 55, and multiplying by 0.01 yields MW, which is a valid discrete value.
3.1.2. Network Topology Decoding
The remaining values determine which branches are proposed as open. The number of open branches required for a radial configuration is
The branches with the smallest values in are proposed as open. A repair procedure (repair_radial_topology) then constructs a connected radial topology using a spanning tree algorithm starting from the slack bus. The final topology is validated by checking that all buses are reachable and that the number of closed branches equals .
3.2. Candidate Bus Selection
To ensure reproducibility, candidate buses for DG installation are determined by explicit rules implemented in the MATLAB R2026a function get_candidate_buses.m:
- -
- All load buses are identified as those with active power demand or reactive power demand .
- -
- The slack bus is excluded from the candidate set.
- -
- If specified in params.excluded_candidate_buses, additional buses are removed.
- -
- If no load buses remain after exclusions, all non-slack buses are considered as candidates (fallback).
3.3. Short-Circuit Calculation via Zbus Method
For each feasible candidate solution that successfully converges in the power flow analysis, the three-phase balanced short-circuit current is computed using the Zbus method. This approach provides a planning-oriented approximation that is well-suited for evaluating and comparing candidate solutions within the optimization process.
The nodal admittance matrix is built using MATPOWER’s makeYbus function based on the candidate’s topology and DG allocation. A Thévenin equivalent source is added at the slack bus to represent the upstream transmission network contribution, and its impedance is calibrated using a reference short-circuit current , expressed in per unit as
where is the reference short-circuit current at the slack bus (in kA), is the base current at the slack bus (in kA), is the pre-fault voltage at the slack bus (in per unit), and is the resulting Thévenin source impedance (in per unit). For each bus k, the Thévenin impedance is then obtained by solving the nodal admittance system column-by-column. DG units are modeled as inverter-limited current sources, appropriate for planning studies where detailed transient models are unavailable, and their fault current contributions are distributed to other buses using a Zbus-based transfer factor. The total short-circuit current at bus k is obtained as the sum of the grid and DG contributions:
where is the short-circuit current contribution from the grid at bus k (in kA), is the set of buses with installed DG units, and is the fault current contribution from the DG unit at bus i to bus k (in kA).
3.4. Fitness Evaluation Flow
For each candidate solution, the evaluation follows a strict sequential process. First, the candidate vector is decoded to obtain DG locations, DG sizes, and open branches. Then, the modified MATPOWER case is built with the candidate topology and DG allocation, and the AC power flow is executed. Once the power flow converges, the active power losses are computed using the branch flow method as , and voltage limits are verified for all buses j. Short-circuit currents are subsequently calculated using the Zbus method (Section 3.3). The aggregate constraint violations are then evaluated for voltage, short-circuit, DG capacity, radial topology, and power factor. Finally, the total fitness value and feasibility status are assigned to the candidate solution.
3.5. ALO-DG Algorithm Structure and Pseudocode
For each candidate solution, the evaluation follows a strict sequential process:
- -
- Decode the candidate vector to obtain DG locations, DG sizes, and open branches.
- -
- Build the modified MATPOWER case with the candidate topology and DG allocation.
- -
- Run AC power flow.
- -
- Compute active power losses using the branch flow method: .
- -
- Verify voltage limits: p.u. for all buses j.
- -
- Calculate short-circuit currents using the Zbus method (Section 3.3).
- -
- Compute penalties for voltage, short-circuit, DG penetration, radiality, and power factor violations.
- -
- Assign total fitness and feasibility status.
3.6. Algorithm Parameters and Sensitivity Analysis
The values of and were determined through a systematic sensitivity analysis conducted on both the IEEE 33-bus system with 5 DG units and the IEEE 69-bus system with 6 DG units, while the remaining parameters were fixed based on physical and operational constraints of the network. Six configurations were evaluated: (10/20), (20/40), (30/60), (50/80), (75/100), and (100/120) agents/iterations, and the most relevant results are presented in Table 2.
Table 2.
Comparison of configurations (most relevant results).
The analysis reveals three key findings. First, the configuration with 50 agents and 80 iterations achieves the lowest active power losses in both systems, with 0.0316 MW for the IEEE 33-bus system with 5 DG units and 0.0190 MW for the IEEE 69-bus system with 6 DG units, demonstrating robustness across different network topologies. Second, in the IEEE 33-bus system, this configuration preserves the base radial topology, where reconfiguration provides no additional benefit. Third, increasing parameters beyond 50/80 degrades performance in both systems while computational time multiplies by factors of 6 to 22. Therefore, the configuration and was selected as the optimal trade-off between solution quality and computational efficiency.
Table 3 summarizes the complete set of parameters of the ALO-DG algorithm, including the values of and established through the sensitivity analysis described above.
Table 3.
ALO-DG algorithm parameters.
4. Tests and Results
The proposed methodology is validated through simulations on the IEEE 33-bus and 69-bus test systems. The analysis is carried out in three phases: (i) base case analysis (mesh and radial configurations), (ii) network reconfiguration using ALO-DG without DG, and (iii) simultaneous reconfiguration and optimal DG allocation using the proposed ALO-DG with short-circuit constraints.
All simulations were performed using the optimal parameter configuration identified through sensitivity analysis: agents and iterations.
4.1. Results for the IEEE 33-Bus Test System
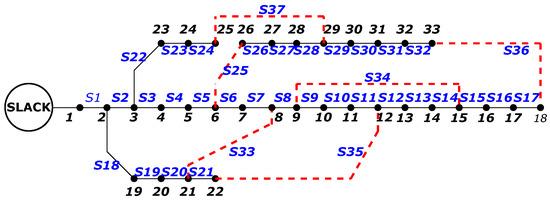
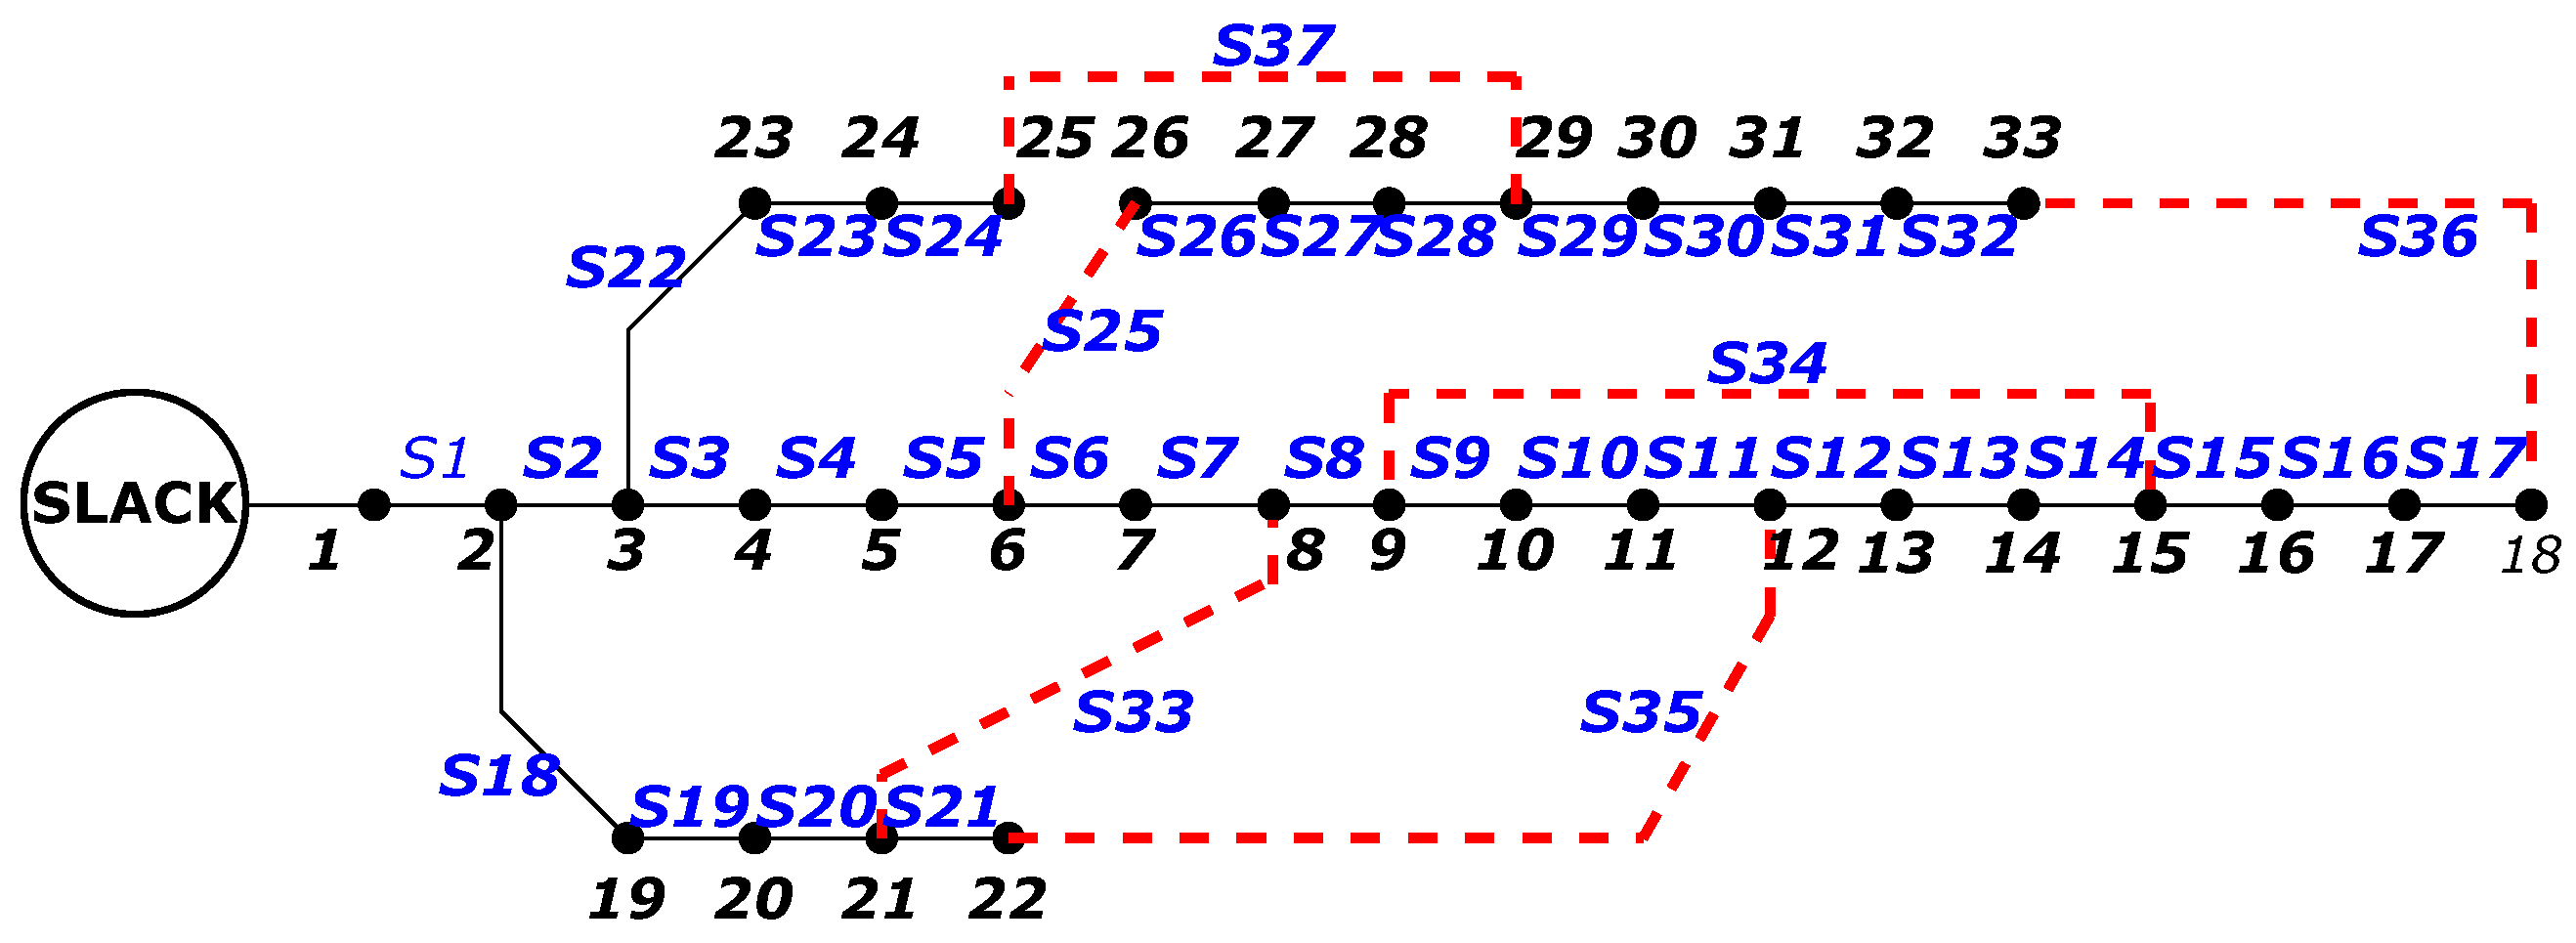
The IEEE 33-bus test system consists of 37 branches, a total load of 3.715 MW, and operates at a nominal voltage of 12.66 kV. Figure 2 shows the system in its original meshed configuration, where all tie switches are closed, creating multiple power flow paths.
Figure 2.
IEEE 33-bus test system in initial meshed configuration.
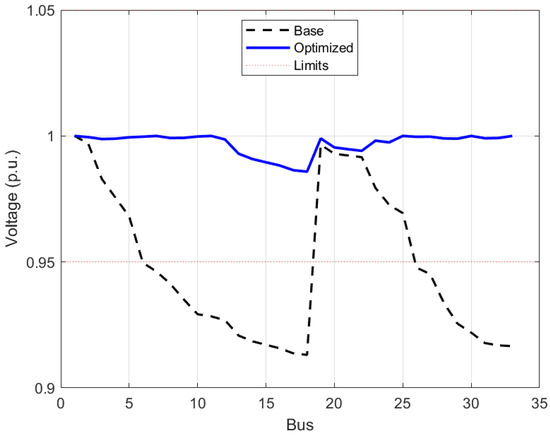
The IEEE 33-bus system presents a mesh configuration with total active power losses of 0.123 MW and a minimum voltage of 0.953 p.u. When the initial radial configuration is enforced by opening switches 33 through 37, losses increase to 0.203 MW and the minimum voltage drops to 0.913 p.u.
4.1.1. Network Reconfiguration Without DG (IEEE 33-Bus Test System)
The proposed ALO-DG algorithm was applied to determine an optimal radial configuration without DG integration. The algorithm identified a new topology opening switches 7, 10, 14, 27, and 36, achieving active losses of 0.146 MW (27.7% reduction compared to the initial radial configuration) and a minimum voltage of 0.936 p.u.
4.1.2. Simultaneous Reconfiguration and DG Allocation (IEEE 33-Bus Test System)
The results for the IEEE 33-bus system with optimal DG allocation using the proposed ALO-DG methodology (50 agents, 80 iterations) are presented in Table 4. The best result is achieved with 5 DG units, reaching 0.0316 MW (84.42% reduction). Notably, for the optimal configuration with 5 DG units, the algorithm preserves the base radial topology (switches 33–37 open).
Table 4.
Results for IEEE 33-bus test system with optimal DG allocation (50 agents, 80 iterations).
4.1.3. Voltage Profile Analysis (IEEE 33-Bus Test System)
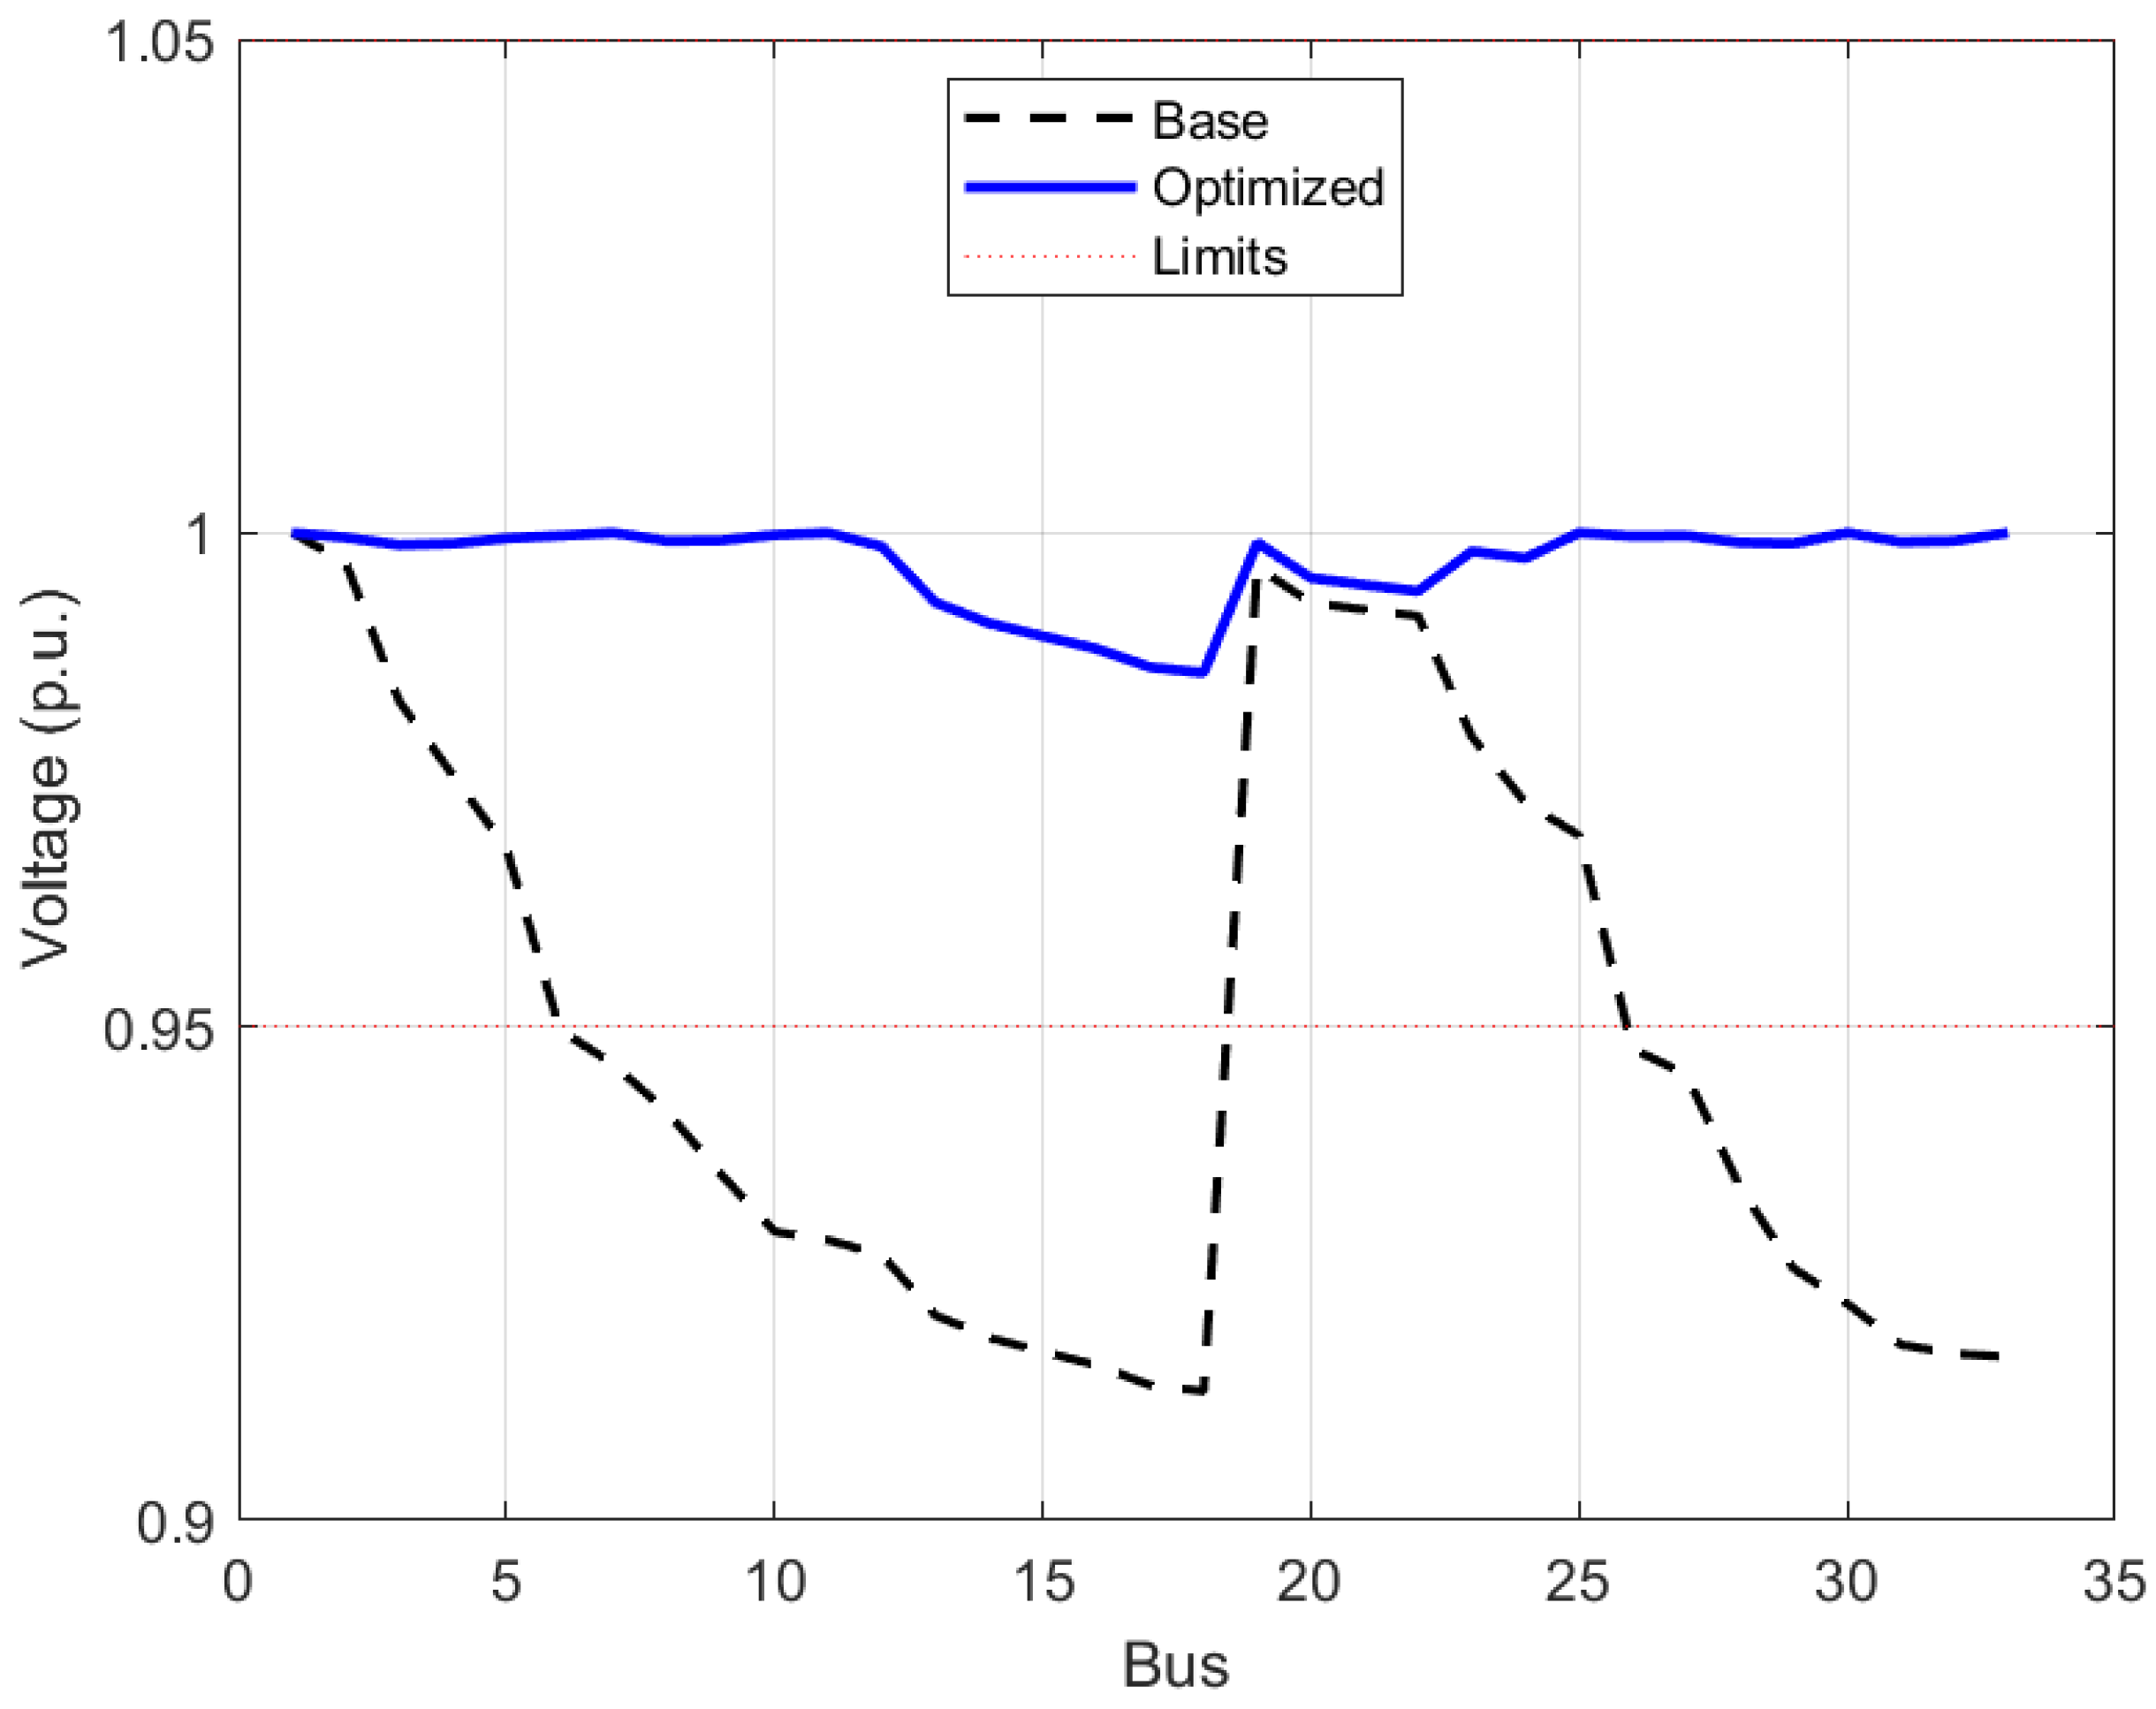
Figure 3 compares the voltage profiles for the base case and the optimal configuration with 6 DG units. The proposed methodology significantly improves the voltage profile, raising the minimum voltage from 0.913 p.u. (initial radial) to 0.984 p.u., ensuring all buses operate within the permissible limits [0.95, 1.05] p.u.
Figure 3.
Voltage profile comparison for IEEE 33-bus system at nominal load (base case vs. optimal with 5 DG units).
4.1.4. Short-Circuit Profile Analysis (IEEE 33-Bus Test System)
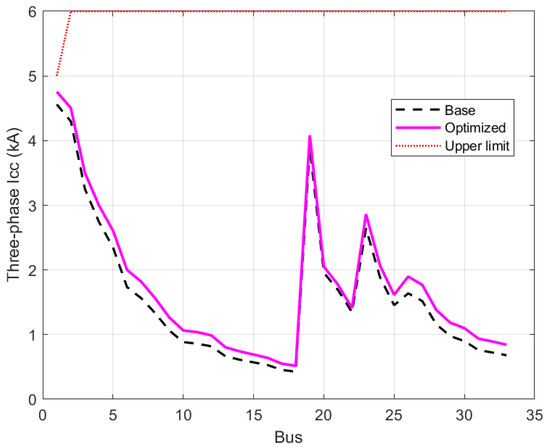
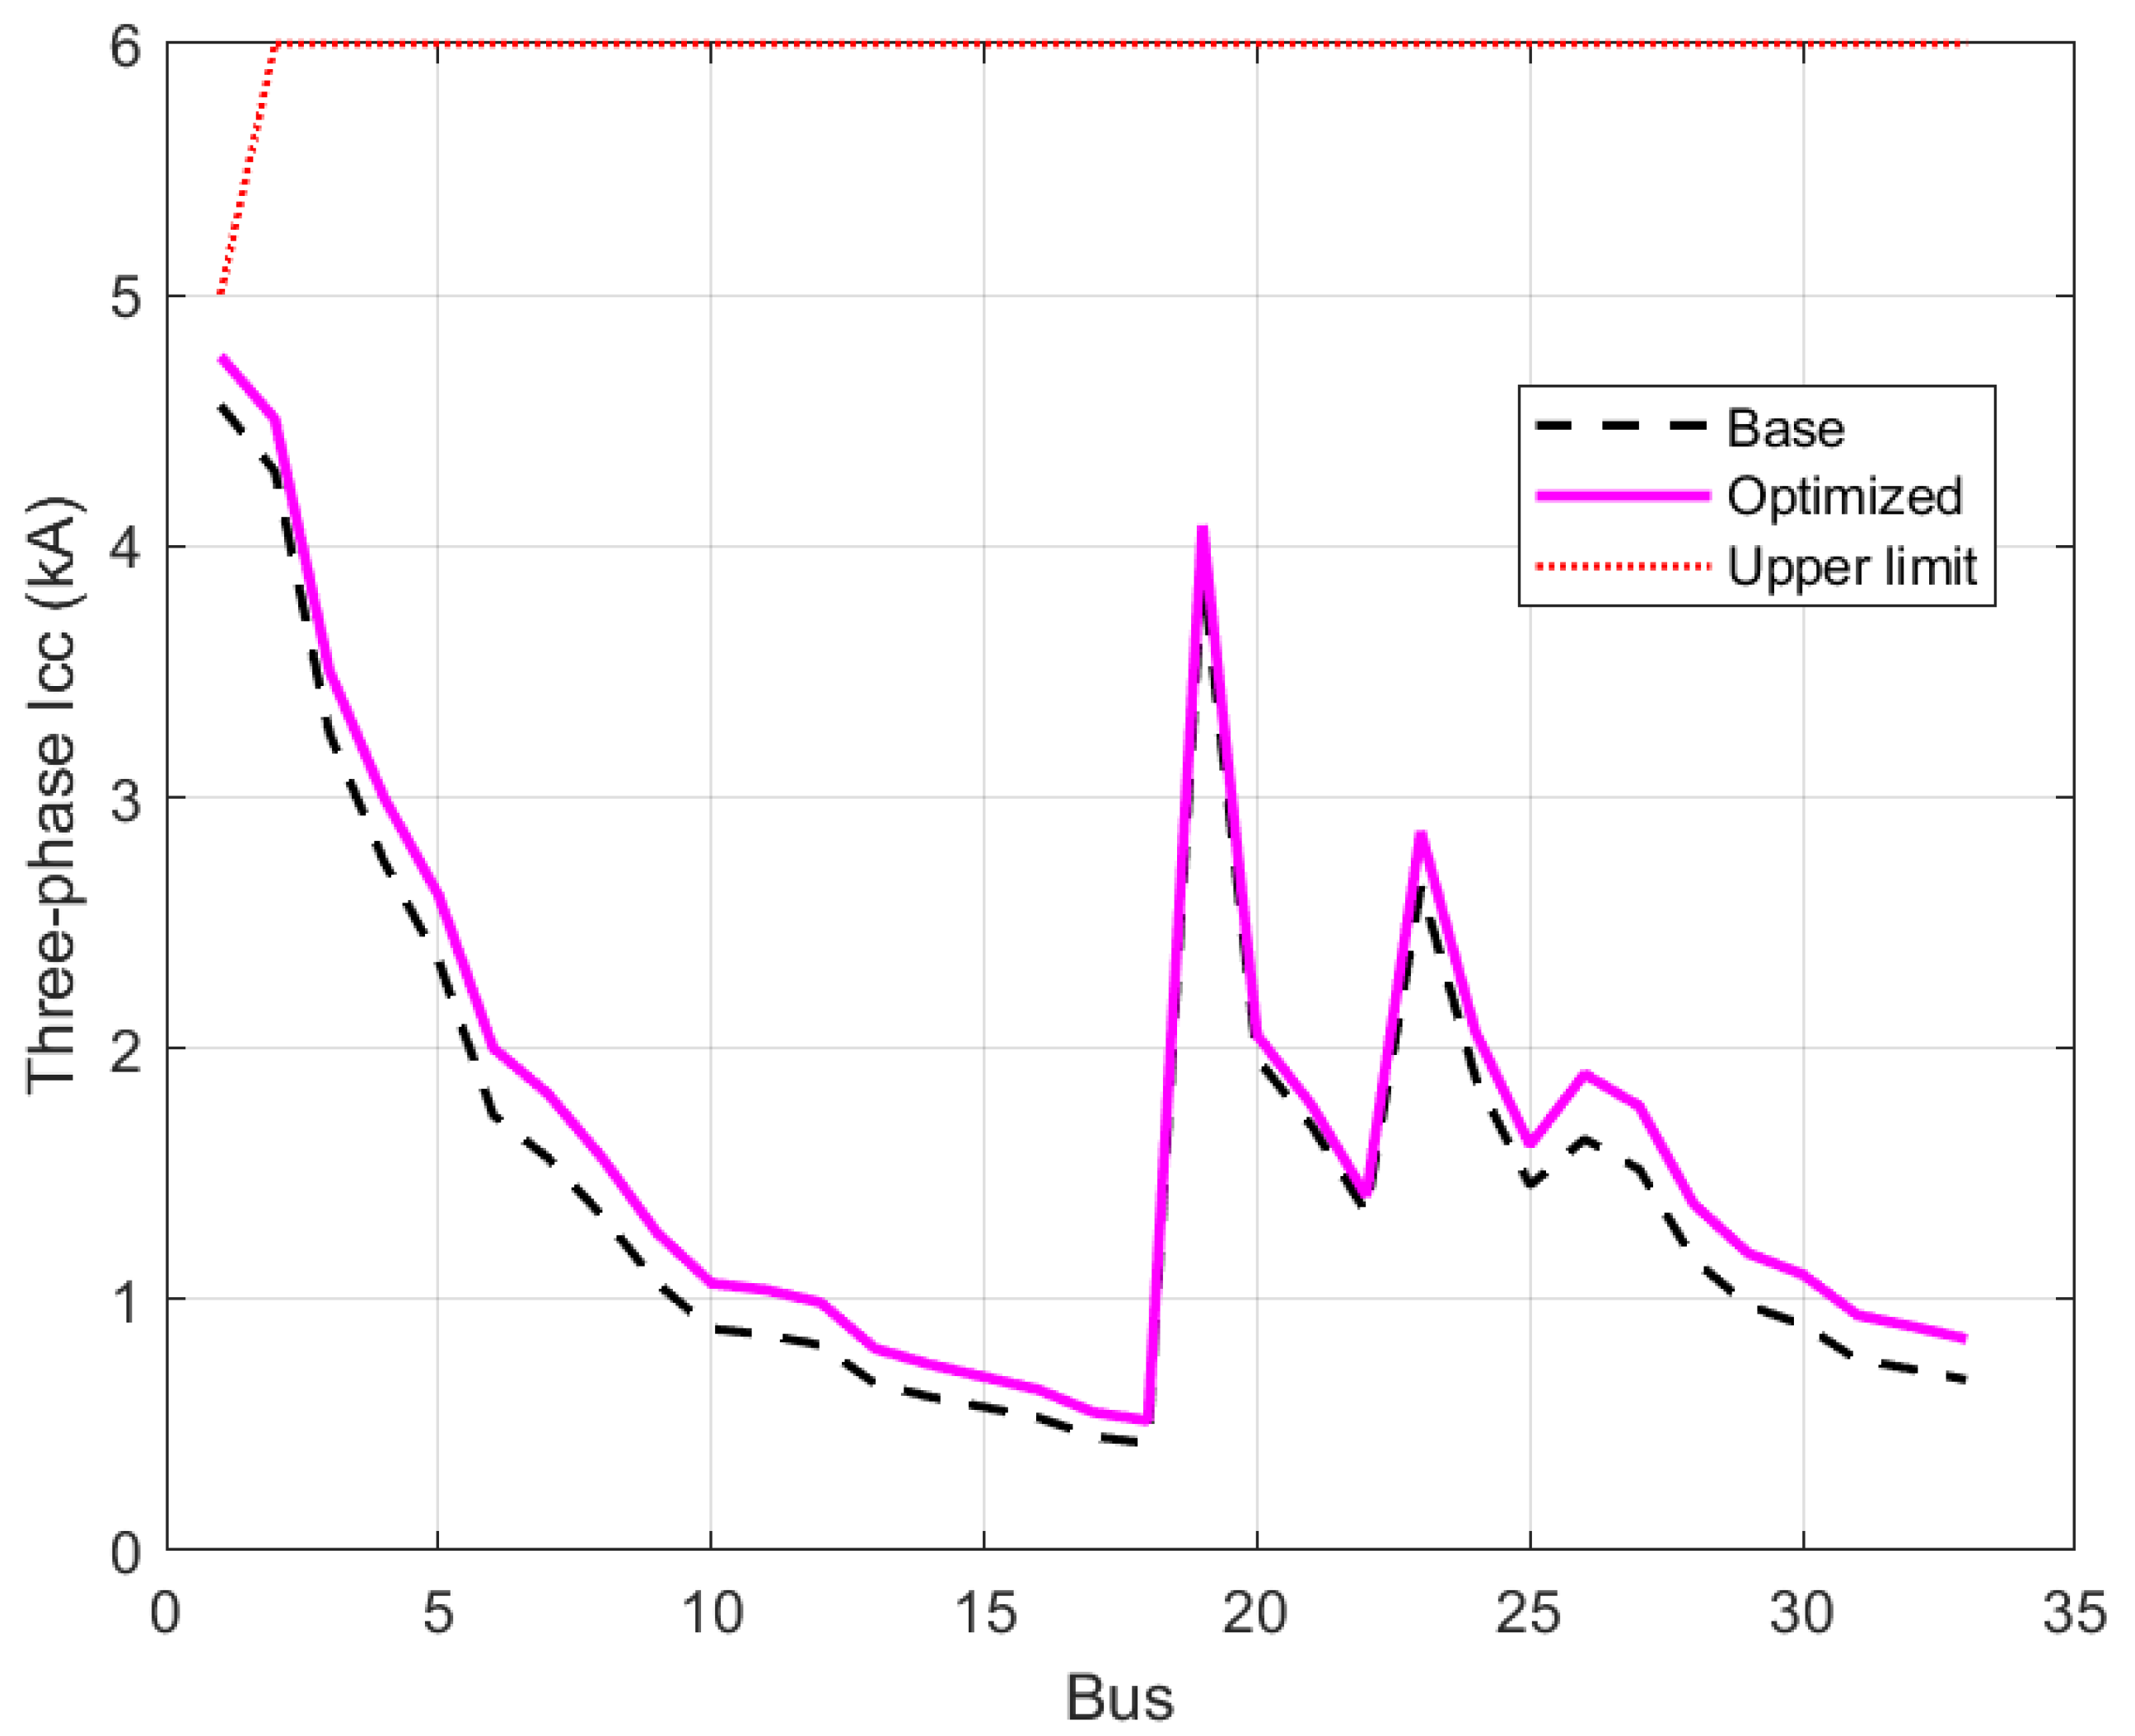
Figure 4 presents the short-circuit current profile for the IEEE 33-bus system with 6 DG units. The maximum short-circuit current occurs at the slack bus (Bus 1), increasing from 4.560 kA to 4.621 kA, which remains well below the established limit of 6 kA. Across all buses, the incorporation of DG units produces a uniform and moderate increase in fault currents, with the highest relative change observed at the end of the feeder.
Figure 4.
Short-circuit current profile for the IEEE 33-bus system (base case vs. optimal with 5 DG units).
Table 5 presents the short-circuit current levels at selected buses for the IEEE 33-bus test system, comparing the base scenario with the optimal solution incorporating six DG units. The results indicate that all short-circuit current values remain below the established threshold, demonstrating that the integration of DG units does not adversely affect the interruption capabilities of the protection devices.
Table 5.
Short-circuit current comparison at selected buses of the IEEE 33-bus system.
4.2. Results for the IEEE 69-Bus Test System
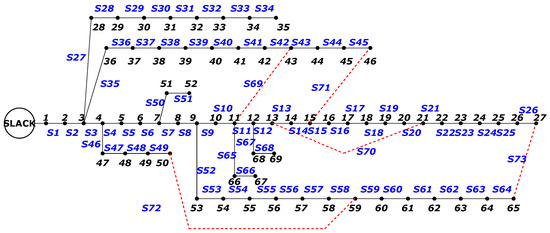
The IEEE 69-bus test system consists of 73 branches, a total load of 3.79189 MW, and operates at a nominal voltage of 12.66 kV. Figure 5 shows the system in its original meshed configuration.
Figure 5.
IEEE 69-bus test system in initial meshed configuration.
The IEEE 69-bus system presents a mesh configuration with total active power losses of 0.086 MW and a minimum voltage of 0.962 p.u. When the initial radial configuration is enforced by opening switches 69 through 73, losses increase to 0.225 MW and the minimum voltage drops to 0.909 p.u.
4.2.1. Network Reconfiguration Without DG (IEEE 69-Bus Test System)
The proposed ALO-DG algorithm was applied to determine an optimal radial configuration without DG integration. The resulting topology opens branches 17, 25, 55, 69, and 71, achieving active losses of 0.135 MW (40.0% reduction compared to the initial radial configuration) and a minimum voltage of 0.924 p.u.
4.2.2. Simultaneous Reconfiguration and DG Allocation (IEEE 69-Bus Test System)
As indicated in Table 6, the best result is achieved with 6 DG units, reaching 0.0190 MW (91.56% reduction compared to the initial radial configuration).
Table 6.
Results for IEEE 69-bus test system with optimal DG allocation (50 agents, 80 iterations).
4.2.3. Voltage Profile Analysis (IEEE 69-Bus Test System)
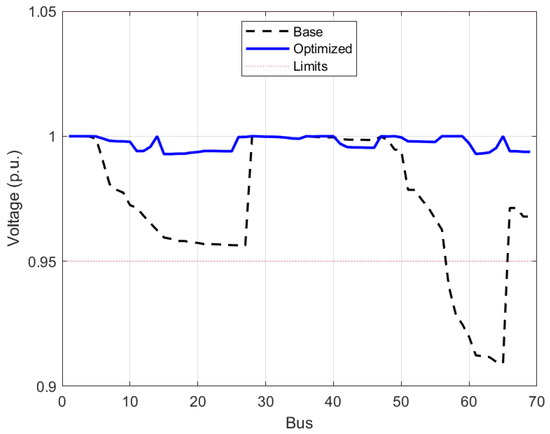
Figure 6 compares the voltage profiles for the base case and the optimal configuration with 6 DG units. The proposed methodology significantly improves the voltage profile, raising the minimum voltage from 0.909 p.u. (initial radial) to 0.993 p.u.
Figure 6.
Voltage profile comparison for IEEE 69-bus system at nominal load (base case vs. optimal with 6 DG units).
4.2.4. Short-Circuit Profile Analysis (IEEE 69-Bus Test System)
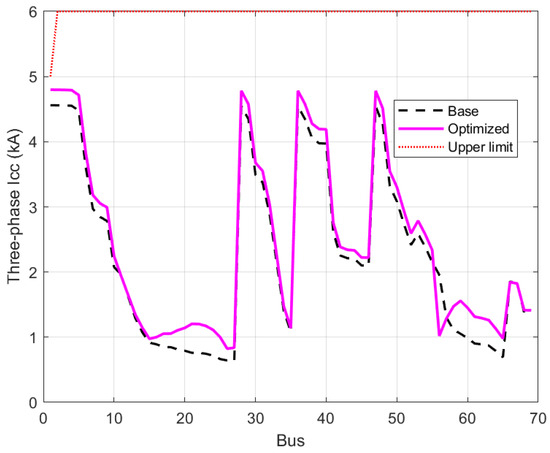
Figure 7 presents the short-circuit current profile for the IEEE 69-bus system with 6 DG units. The maximum short-circuit current occurs at the slack bus (Bus 1), increasing from 4.560 kA to 4.624 kA, which remains well below the established limit of 6 kA. Across all buses, the incorporation of DG units produces a uniform and moderate increase in fault currents, with the most notable relative increment observed at the end of the feeder.
Figure 7.
Short-circuit current profile for IEEE 69-bus system (base case vs. optimal with 6 DG units).
Table 7 details the short-circuit current values at selected buses, comparing the base case against the optimal configuration with 6 DG units for the IEEE 69-bus test system. For every case analyzed, the short-circuit current magnitudes stay within the permissible range, demonstrating that the incorporation of DG resources preserves the operational limits of the protective devices.
Table 7.
Short-circuit current comparison at selected buses of the IEEE 69-bus system.
4.3. Summary of Optimal Results
Table 8 consolidates the best results achieved by the proposed ALO-DG methodology for both test systems. The IEEE 33-bus system reaches a loss reduction of 84.42% with 5 DG units, while the IEEE 69-bus system achieves a reduction of 91.56% with 6 DG units, both maintaining voltage profiles within permissible limits and short-circuit currents well below the established threshold.
Table 8.
Summary of optimal results for both test systems.
5. Discussion
The results obtained from the IEEE 33-bus and 69-bus test systems provide valuable insights into the performance of the proposed ALO-DG methodology. This section critically analyzes the findings, compares them with existing literature, discusses the implications of the parameter sensitivity analysis, examines the short-circuit constraint behavior, and identifies the limitations of the current study.
5.1. Parameter Selection and Computational Efficiency
One of the recurring concerns in metaheuristic optimization is the arbitrary selection of algorithmic parameters such as the number of agents and iterations. In this study, a systematic sensitivity analysis was performed to determine a reliable starting point for the algorithm configuration, rather than relying on empirical or arbitrary choices. As shown in Table 2, the analysis revealed that the configuration with 50 agents and 80 iterations consistently achieved stable and competitive results in both test systems, with 0.0316 MW (84.42% reduction) for IEEE 33-bus and 0.0190 MW (91.56% reduction) for IEEE 69-bus. This configuration was therefore adopted as the reference parameter setting for all subsequent experiments, providing a reproducible and justified basis for the evaluation of the proposed methodology.
A key observation is that increasing the parameters beyond 50/80 did not improve the solution quality. In fact, the 75/100 and 100/120 configurations resulted in higher losses (0.0481 MW and 0.0516 MW for IEEE 33, respectively) while increasing computational time by factors of 6 to 22. This saturation behavior is important because it demonstrates that the algorithm converges within 80 iterations, and additional computational resources do not translate into better solutions. This finding has practical implications for real-world applications, where computational time is often a limiting factor.
Notably, for the IEEE 33-bus system with 5 DG units, the optimal configuration (50/80) preserved the base radial topology (switches 33–37 open). This is a strong indicator of optimality: the algorithm found that reconfiguration provides no additional benefit beyond the optimal DG placement. This behavior was not observed in the IEEE 69-bus system, where reconfiguration was necessary to achieve the best results, highlighting the structural differences between the two test systems.
5.2. Short-Circuit Constraint Analysis
A distinctive contribution of this work is the explicit incorporation of short-circuit current constraints within the optimization loop. Figure 4 and Figure 7 show that the integration of up to six DG units increased short-circuit currents by only 1.34% to 4.48% in IEEE 33-bus and 1.40% to 4.50% in IEEE 69-bus. These increases are modest and remain well below the established limit of 6 kA (or the more typical 25 kA for distribution breakers).
Table 5 and Table 7 provide detailed short-circuit values at selected buses. The results confirm that the proposed methodology effectively prevents excessive short-circuit current levels while pursuing loss minimization. This is particularly relevant for distribution system operators who must ensure that protection devices remain within their interrupting ratings as DG penetration increases. Without this constraint, an optimization algorithm might place large DG units at electrically close locations, potentially raising fault currents to dangerous levels.
It is worth noting that the percentage increase in fault currents is more pronounced at nodes farther from the substation (Bus 33 with 4.48% change, Bus 69 with 4.50% change) compared to nodes near the slack bus (Bus 1 with 1.34–1.40% change). This is because the pre-fault voltages at these distant nodes experience greater improvement due to DG injection, which in turn increases the short-circuit contribution.
5.3. Comparison with Existing Methods
Table 9 and Table 10 compare the proposed ALO-DG with several state-of-the-art methods. For the IEEE 33-bus system with three DG units, ALO-DG achieved losses of 70.10 kW, representing a reduction of 34% with respect to CPSO (81.89 kW) and 24% with respect to COA (71.54 kW). For the IEEE 69-bus system with three DG units, ALO-DG obtained 61.80 kW, with reductions of approximately 15% compared to WCA (72.93 kW) and COA (71.00 kW). However, direct comparisons are not entirely equivalent, since the studies reviewed were conducted under different computational environments, hardware platforms, software implementations, and modeling assumptions. Furthermore, some works impose constraints on the DG capacity as a percentage of the total system demand, which introduces methodological differences that limit the strict equivalence of the comparison and should be taken into account when interpreting the results. For these reasons, Table 9 and Table 10 focus exclusively on the case of three DG units and report only the two most commonly used performance indicators in the literature, namely active power losses and minimum bus voltage, offering a fairer and more transparent assessment of the competitiveness of the proposed approach relative to previously published results, avoiding misleading conclusions that could arise from differences in problem formulation or evaluation criteria.
Table 9.
Comparison with existing methods for IEEE 33-bus (3 DG units).
Table 10.
Comparison with existing methods for IEEE 69-bus (3 DG units).
5.4. Power Factor Considerations
The inclusion of a power factor constraint () reflects a conservative and physically coherent operating condition for distributed generation units. In practice, modern DG plants are designed to operate as close to unity power factor as possible, maximizing active power injection and minimizing reactive power exchange with the network. By enforcing a minimum power factor of 0.95, the optimization ensures that candidate solutions correspond to realistic and technically valid operating points, where DG units prioritize active power generation over reactive compensation.
5.5. Saturation Point of DG Penetration
A particularly relevant finding is the identification of a saturation point in loss reduction for the IEEE 33-bus system. Losses decrease progressively from 82.4 kW with 1 DG unit to a minimum of 31.6 kW with 5 DG units (84.42% reduction). However, increasing to 6 DG units raises losses back to 55.7 kW (72.53% reduction), confirming that beyond 5 units, the benefit of additional DG reverses due to reverse power flows and internal circulation in the network. In contrast, the IEEE 69-bus system does not exhibit this behavior within the evaluated range, as losses decrease consistently from 67.0 kW (1 DG) to 19.0 kW (6 DGs), achieving the best result with the maximum number of units evaluated. These results confirm that the benefit of DG in terms of loss reduction does not increase monotonically with penetration in all network configurations, and that an optimal penetration level exists beyond which additional units may degrade system performance.
6. Conclusions
This paper presented a hybrid methodology that integrates mesh-to-radial topological transformation with a modified Ant Lion Optimization algorithm (ALO-DG) to simultaneously address network reconfiguration and optimal placement and sizing of distributed generation in distribution systems. The proposed ALO-DG algorithm achieved loss reductions of 84.42% (0.0316 MW) for the IEEE 33-bus system and 91.56% (0.0190 MW) for the IEEE 69-bus system, demonstrating the effectiveness of jointly optimizing network reconfiguration and DG allocation. A relevant methodological feature of the proposed algorithm is that each candidate solution generates an independent optimal radial configuration, rather than taking a fixed topology as a starting point. This means that for each evaluated scenario, the algorithm simultaneously determines the number, location, and sizing of DG units alongside the network topology, ensuring that each configuration is optimized from scratch without inheriting decisions from previous cases. Furthermore, the explicit incorporation of short-circuit current limits within the optimization loop confirmed that fault levels remained within the interrupting capacity of protection devices, demonstrating that electrical safety and loss minimization are not mutually exclusive objectives.
Future research will extend the proposed methodology in several directions: (i) multi-seed statistical validation to assess robustness; (ii) inclusion of time-varying loads and renewable generation profiles; (iii) multi-objective optimization incorporating economic criteria; (iv) validation with detailed protection coordination software (ETAP, DIgSILENT); (v) application to real distribution networks; and (vi) incorporation of advanced DG models including grid-forming inverters and fault-ride-through capabilities.
Author Contributions
Conceptualization, A.F.T.-V., E.E.T.-R. and J.M.L.-L.; methodology, A.F.T.-V., E.E.T.-R. and J.M.L.-L.; software, A.F.T.-V. and E.E.T.-R.; validation, A.F.T.-V. and E.E.T.-R.; formal analysis, A.F.T.-V., E.E.T.-R. and J.M.L.-L.; investigation, A.F.T.-V., E.E.T.-R. and J.M.L.-L.; resources, A.F.T.-V. and E.E.T.-R.; data curation, A.F.T.-V. and E.E.T.-R.; writing—original draft preparation, A.F.T.-V. and E.E.T.-R.; writing—review and editing, A.F.T.-V., E.E.T.-R. and J.M.L.-L.; visualization, A.F.T.-V., E.E.T.-R. and J.M.L.-L.; supervision, E.E.T.-R. and J.M.L.-L.; project administration, A.F.T.-V., E.E.T.-R. and J.M.L.-L.; funding acquisition, A.F.T.-V., E.E.T.-R. and J.M.L.-L. All authors have read and agreed to the published version of the manuscript.
Funding
This research received no external funding.
Institutional Review Board Statement
Not applicable.
Informed Consent Statement
Not applicable.
Data Availability Statement
The original contributions presented in this study are included in the article. Further inquiries can be directed to the corresponding author.
Acknowledgments
The authors would like to acknowledge Universidad Pedagógica y Tecnológica de Colombia (UPTC) and Universidad de Antioquia (UdeA) for their support in the development of this work.
Conflicts of Interest
The authors declare no conflicts of interest.
References
- Mathieu, J.L.; Verbic, G.; Morstyn, T.; Almassalkhi, M.R.; Baker, K.; Braslavsky, J.; Bruninx, K.; Dvorkin, Y.; Ledva, G.S.; Mahdavi, N. A New Definition and Research Agenda for Demand Response in the Distributed Energy Resource Era. IEEE Trans. Energy Mark. Policy Regul. 2025, 3, 324–339. [Google Scholar] [CrossRef] [Scilit]
- Chen, Z.C.; Lu, C.N. An Approach for Scheduling and Unlocking Heterogeneous Distributed Energy Resources as Operating Reserve Assets. IEEE Trans. Energy Mark. Policy Regul. 2025, 3, 274–286. [Google Scholar] [CrossRef] [Scilit]
- Tiismus, H.; Maask, V.; Astapov, V.; Korotko, T.; Rosin, A. State-of-the-Art Review of Emerging Trends in Renewable Energy Generation Technologies. IEEE Access 2025, 13, 10820–10843. [Google Scholar] [CrossRef] [Scilit]
- León, L.F.; Martinez, M.; Ontiveros, L.J.; Mercado, P.E. Devices and Control Strategies for Voltage Regulation Under Influence of Photovoltaic Distributed Generation: A Review. IEEE Lat. Am. Trans. 2022, 20, 731–745. [Google Scholar] [CrossRef] [Scilit]
- Siano, P. Assessing the Impact of Incentive Regulation for Innovation on RES Integration. IEEE Trans. Power Syst. 2014, 29, 2499–2508. [Google Scholar] [CrossRef] [Scilit]
- Villada-Duque, F.; Lopez-Lezama, J.M.; Muñoz-Galeano, N. Effects of Incentives for Renewable Energy in Colombia. Ing. Univ. 2017, 21, 257–272. [Google Scholar] [CrossRef] [Scilit]
- Singh, P.; Kumar, U.; Choudhary, N.K.; Singh, N. Advancements in Protection Coordination of Microgrids: A Comprehensive Review of Protection Challenges and Mitigation Schemes for Grid Stability. Prot. Control Mod. Power Syst. 2024, 9, 156–183. [Google Scholar] [CrossRef] [Scilit]
- Arteaga, G.; Candelo-Becerra, J.E.; Montano, J.; Revelo-Fuelagán, J.; Hoyos, F.E. Edge Computing Architecture for Optimal Settings of Inverse Time Overcurrent Relays in Mesh Microgrids. Electricity 2026, 7, 14. [Google Scholar] [CrossRef] [Scilit]
- Blanco-Solano, J.; Chacón Molina, D.J.; Chaustre Cárdenas, D.L. Enhanced Optimization-Based PV Hosting Capacity Method for Improved Planning of Real Distribution Networks. Electricity 2026, 7, 12. [Google Scholar] [CrossRef] [Scilit]
- Kharra, A.; Tiwari, R.; Garg, A. Improve System Voltage Stability and Reduction in Losses with Optimal Placement of DG. In Proceedings of the IEEE International Conference on Green Industrial Electronics and Sustainable Technologies (GIEST), Imphal, India, 25–26 October 2024; pp. 1–5. [Google Scholar] [CrossRef] [Scilit]
- Kumar, B.; Choudhary, N.K.; Singh, N.; Singh, R.K. Optimal Location and Size of Distributed Generators for Voltage Stability Improvement in Active Distribution Networks. In Proceedings of the IEEE Students Conference on Engineering and Systems (SCES), Prayagraj, India, 21–23 June 2024; pp. 1–6. [Google Scholar] [CrossRef] [Scilit]
- Vempalle, R.; Dhal, P. Optimal Placement of Distributed Generators in Optimized Reconfigure Radial Distribution Network Using PSO-DA Optimization Algorithm. In Proceedings of the International Conference on Advances in Computing, Communication Materials (ICACCM), Dehradun, India, 21–22 August 2020; pp. 239–246. [Google Scholar] [CrossRef] [Scilit]
- Sorif, S.M.; Das, S.K.; Sarkar, S. Optimal Allocation and Droop Setting of Droop-Controlled Distributed Generations for Effective Operation of Islanded Microgrid. In Proceedings of the International Conference on Power, Control and Computing Technologies (ICPC2T), Raipur, India, 20–22 January 2025; pp. 68–73. [Google Scholar] [CrossRef] [Scilit]
- Arif, S.M.; Hussain, A.; Lie, T.T.; Ahsan, S.M.; Khan, H.A. Analytical Hybrid Particle Swarm Optimization Algorithm for Optimal Siting and Sizing of Distributed Generation in Smart Grid. J. Mod. Power Syst. Clean Energy 2020, 8, 1221–1230. [Google Scholar] [CrossRef] [Scilit]
- Farh, H.M.H.; Al-Shaalan, A.M.; Eltamaly, A.M.; Al-Shamma’A, A.A. A Novel Crow Search Algorithm Auto-Drive PSO for Optimal Allocation and Sizing of Renewable Distributed Generation. IEEE Access 2020, 8, 27807–27820. [Google Scholar] [CrossRef] [Scilit]
- Pereira, B.R.; da Costa, G.R.M.; Contreras, J.; Mantovani, J.R.S. Optimal Distributed Generation and Reactive Power Allocation in Electrical Distribution Systems. IEEE Trans. Sustain. Energy 2016, 7, 975–984. [Google Scholar] [CrossRef] [Scilit]
- Purlu, M.; Turkay, B.E. Optimal Allocation of Renewable Distributed Generations Using Heuristic Methods to Minimize Annual Energy Losses and Voltage Deviation Index. IEEE Access 2022, 10, 21455–21474. [Google Scholar] [CrossRef] [Scilit]
- Cararo, J.A.G.; Silva, A.H.F.; Neto, J.C.; Reis, M.R.C.; Calixto, W.P. Methodology for Voltage Adequacy Using Photovoltaic Distributed Generation. In Proceedings of the IEEE International Conference on Environment and Electrical Engineering, Genova, Italy, 11–14 June 2019; pp. 1–6. [Google Scholar] [CrossRef] [Scilit]
- Mahajan, S.; Verma, Y.P. Optimizing DG Parameters for Voltage Profile and Real Power Loss Improvement Using Elephant Herd Optimization. In Proceedings of the International Conference on Computing, Communication and Networking Technologies (ICCCNT), Kharagpur, India, 1–3 July 2020; pp. 1–6. [Google Scholar] [CrossRef] [Scilit]
- Pujar, P.; Lavanya, M. Power Factor Improvement in IEEE-33 Radial Distribution Systems Using Fruit Fly Algorithm Compared with Bat Algorithm. In Proceedings of the International Conference on Automation, Computing and Renewable Systems (ICACRS), Pudukkottai, India, 4–6 December 2024; pp. 349–353. [Google Scholar] [CrossRef] [Scilit]
- Musa, I.; Lawal, S.M.; Muhammad, I. Loss Reduction and Voltage Support with Distributed Generation Considering Different Power Factors. In Proceedings of the IEEE PES/IAS PowerAfrica, Abuja, Nigeria, 20–23 August 2019; pp. 140–145. [Google Scholar] [CrossRef] [Scilit]
- Kahnamouei, A.S.; Lotfifard, S. Optimized Fault Location Identification in Power Distribution Systems with Inverter-Interfaced Distributed Generations. IEEE Trans. Power Deliv. 2023, 38, 3429–3440. [Google Scholar] [CrossRef] [Scilit]
- Magadum, R.B.; Kulkarni, V.A.; Janaj, A.D.; Hirekodi, S.D.; Datar, V.P. Fuzzy Knowledge Based Controller for Multiple Distributed Generators Placement. In Proceedings of the International Conference on Integrated Circuits and Communication Systems (ICICACS), Raichur, India, 23–24 February 2024; pp. 1–4. [Google Scholar] [CrossRef] [Scilit]
- Khalid Hamad, Y.; Nasser Hussain, A.; Lafta, Y.N.; Al-Naji, A.; Chahl, J. Multi-Objective Optimization of Renewable Distributed Generation Placement and Sizing. IEEE Access 2024, 12, 164226–164247. [Google Scholar] [CrossRef] [Scilit]
- Gupta, B.; Sudabattula, S.K.; Mishra, S.; Dharavat, N. Techno Assessment of Distribution System with Integration of Different Types of Distributed Generators. In Proceedings of the International Conference on Sustainable Power Energy (ICSPE), Raigarh, India, 28–29 November 2024; pp. 1–6. [Google Scholar] [CrossRef] [Scilit]
- Banhidarah, A.K.; Al-Sumaiti, A.S. Heuristic Search Algorithms for Optimal Locations and Sizing of Distributed Generators in the Grid. In Proceedings of the Advances in Science and Engineering Technology International Conferences (ASET), Dubai, United Arab Emirates, 6 February–5 April 2018; pp. 1–5. [Google Scholar] [CrossRef] [Scilit]
- Abdel-Salam, M.; El-Mohandes, M.T.; Yousef, A.M.; Ramadan, R. Optimal Sizing and Locations of DG Sources in Distribution Systems: A Review of Different Techniques. In Proceedings of the International Middle East Power Systems Conference (MEPCON), Cairo, Egypt, 17–19 December 2019; pp. 383–391. [Google Scholar] [CrossRef] [Scilit]
- Adetunji, K.E.; Hofsajer, I.W.; Abu-Mahfouz, A.M.; Cheng, L. A Review of Metaheuristic Techniques for Optimal Integration of Electrical Units in Distribution Networks. IEEE Access 2021, 9, 5046–5068. [Google Scholar] [CrossRef] [Scilit]
- Bautista Ríos, J.P.; Ñaupari Huatuco, D.Z.; Simeon Pucuhuayla, F.J.; Rodriguez, Y.P.M. A Hybrid Simulated Annealing–Tabu Search Framework for Distribution Network Reconfiguration: Evidence from a Peruvian Case. Electricity 2026, 7, 25. [Google Scholar] [CrossRef] [Scilit]
- Eldurssi, A.M.; O’Connell, R.M. A Fast Nondominated Sorting Guided Genetic Algorithm for Multi-Objective Power Distribution System Reconfiguration Problem. IEEE Trans. Power Syst. 2015, 30, 593–601. [Google Scholar] [CrossRef] [Scilit]
- Zhang, J.; Yuan, X.; Yuan, Y. A novel genetic algorithm based on all spanning trees of undirected graph for distribution network reconfiguration. J. Mod. Power Syst. Clean Energy 2014, 2, 143–149. [Google Scholar] [CrossRef] [Scilit]
- Kumar, B.; Saw, B.K.; Bohre, A.K. Optimal Distribution Network Reconfiguration to Improve the System Performances using PSO with Multiple-Objectives. In Proceedings of the 2020 International Conference on Computational Intelligence for Smart Power System and Sustainable Energy (CISPSSE), Keonjhar, India, 29–31 July 2020; pp. 1–6. [Google Scholar] [CrossRef] [Scilit]
- Shetty, V.J.; Ankaliki, S.G. Electrical Distribution System Power Loss Reduction and Voltage Profile Enhancement by Network Reconfiguration Using PSO. In Proceedings of the 2019 Fifth International Conference on Electrical Energy Systems (ICEES), Chennai, India, 21–22 February 2019; pp. 1–4. [Google Scholar] [CrossRef] [Scilit]
- Jeon, Y.J.; Kim, J.C.; Kim, J.O.; Shin, J.R.; Lee, K. An efficient simulated annealing algorithm for network reconfiguration in large-scale distribution systems. IEEE Trans. Power Deliv. 2002, 17, 1070–1078. [Google Scholar] [CrossRef] [Scilit]
- Abdelaziz, A.; Mohamed, F.; Mekhamer, S.; Badr, M. Distribution system reconfiguration using a modified Tabu Search algorithm. Electr. Power Syst. Res. 2010, 80, 943–953. [Google Scholar] [CrossRef] [Scilit]
- Su, C.T.; Lee, C.S. Network Reconfiguration of Distribution Systems Using Improved Mixed-Integer Hybrid Differential Evolution. IEEE Trans. Power Deliv. 2003, 18, 1022–1027. [Google Scholar] [CrossRef] [Scilit]
- Carpaneto, E.; Chicco, G. Distribution system minimum loss reconfiguration in the Hyper-Cube Ant Colony Optimization framework. Electr. Power Syst. Res. 2008, 78, 2037–2045. [Google Scholar] [CrossRef] [Scilit]
- Gallego Pareja, L.A.; López-Lezama, J.M.; Gómez Carmona, O. Optimal Feeder Reconfiguration and Placement of Voltage Regulators in Electrical Distribution Networks Using a Linear Mathematical Model. Sustainability 2023, 15, 854. [Google Scholar] [CrossRef] [Scilit]
- Mahdavi, M.; Alhelou, H.H.; Bagheri, A.; Djokic, S.Z.; Ramos, R.A.V. A Comprehensive Review of Metaheuristic Methods for the Reconfiguration of Electric Power Distribution Systems and Comparison with a Novel Approach Based on Efficient Genetic Algorithm. IEEE Access 2021, 9, 122872–122906. [Google Scholar] [CrossRef] [Scilit]
- Kumari, N.; Kumari, R.; Naick, B.k. Optimal Emplacement and Allocation of Distributed Generators by Using Ant Lion Optimization. In Proceedings of the 2022 2nd International Conference on Emerging Frontiers in Electrical and Electronic Technologies (ICEFEET), Patna, India, 24–25 June 2022; pp. 1–6. [Google Scholar] [CrossRef] [Scilit]
- Gil-González, W.; Montoya, O.D.; Grisales-Noreña, L.F.; Ramírez Vanegas, C.A.; Molina Cabrera, A. Hybrid Optimization Strategy for Optimal Location and Sizing of DG in Distribution Networks. Tecnura 2020, 24, 47–61. [Google Scholar] [CrossRef] [Scilit]
- Das, S.K.; Sarkar, S. Short-Circuit based Optimal Location, Sizing and Power Factor Determination of Multi Distributed Generations in Radial Distribution Networks. In Proceedings of the 2019 IEEE Region 10 Symposium (TENSYMP), Kolkata, India, 7–9 June 2019; pp. 266–271. [Google Scholar] [CrossRef] [Scilit]
- El-Ela, A.A.A.; El-Sehiemy, R.A.; Shaheen, A.M.; Ellien, A.R. Optimal Allocation of Distributed Generation Units Correlated with Fault Current Limiter Sites in Distribution Systems. IEEE Syst. J. 2021, 15, 2148–2155. [Google Scholar] [CrossRef] [Scilit]
- Zimmerman, R.D.; Murillo-Sánchez, C.E.; Thomas, R.J. MATPOWER: Steady-State Operations, Planning and Analysis Tools for Power Systems Research and Education. IEEE Trans. Power Syst. 2011, 26, 12–19. [Google Scholar] [CrossRef] [Scilit]

Disclaimer/Publisher’s Note: The statements, opinions and data contained in all publications are solely those of the individual author(s) and contributor(s) and not of MDPI and/or the editor(s). MDPI and/or the editor(s) disclaim responsibility for any injury to people or property resulting from any ideas, methods, instructions or products referred to in the content. |
© 2026 by the authors. Licensee MDPI, Basel, Switzerland. This article is an open access article distributed under the terms and conditions of the Creative Commons Attribution (CC BY) license.