


Abstract
This article highlights the intrinsic limitations of existing standards, such as EN 50160 and its associated measurement techniques, when applied to the assessment of power quality in high-speed railway traction power supply networks. These networks, characterized by intermittent and non-linear loads, generate disturbances (harmonics, voltage unbalance) that are not always detected or correctly quantified by standardized aggregation methods, leading to an underestimation of the actual impacts and calling into question the credibility of compliance assessments. The study proposes a new evaluation methodology based on synchronizing measurements with train traffic and grouping data by events rather than by fixed aggregation periods. This approach enables a more accurate characterization of negative-sequence voltage unbalance, providing a reliable estimation of both the magnitude and duration of disturbances. Experimental observations from multiple journeys and aggregation scenarios provide quantitative evidence supporting the relevance of the proposed improvements, which will contribute to updating and implementing standards better adapted to the specific characteristics of intermittent networks such as railway traffic, thereby ensuring a reliable, credible, and reproducible power quality assessment.
1. Introduction
Railway infrastructure plays a crucial role in Morocco’s national economy and constitutes a fundamental component of transport systems in many regions worldwide [1]. With the expansion of electric railways, particularly high-speed trains, rail transport has become an increasingly attractive option, offering speed, comfort, and environmental sustainability [2]. However, electric locomotives, due to their single-phase, non-linear nature and high power requirements—especially through high-power AC/DC and DC/AC converters [3]—generate various disturbances such as reactive power consumption, harmonic generation [4,5,6,7,8], resonances, and negative-sequence currents and voltages [9,10]. These disturbances, injected into railway traction power supply systems, can propagate through the transmission network and into the public grid, thereby significantly affecting the performance of traction systems and other connected equipment [8,11,12]. It is widely recognized that railway power supply systems constitute disturbing loads for electrical networks, giving rise to significant power quality issues [2,11,13]. These power quality problems in the railway context have attracted increasing attention due to their impact on equipment, railway communications, and grid stability [9,11,14].
However, measuring, monitoring, and characterizing these phenomena remains a major challenge due to their intermittent and non-stationary nature and the fast dynamics of traction loads [11,12,15,16,17]. In this context, intermittency refers to the occurrence of disturbances during specific operational events such as train acceleration, braking, and power transitions, resulting in irregular temporal distributions of electrical disturbances. Non-stationarity refers to the time-varying statistical properties of power quality parameters caused by these dynamic operating conditions. Furthermore, power quality management in the railway sector requires a holistic approach that considers all aspects of the traction system [10,13]. To date, no standardized methods specifically dedicated to assessing power quality in railway applications exist, although efforts are being made by research and standardization bodies to establish such procedures [11,13,15,16,18]. These initiatives may lead to the development of new standards or the adaptation of existing ones to better account for the specific characteristics of the railway sector, particularly long-duration negative-sequence voltages caused by high and sustained loading [19].
In the meantime, railway operators must rely on existing standards for power quality assessment in traction networks, as well as on current best practices in monitoring and managing power quality in their traction systems to ensure optimal and safe operation [15,18]. However, the applicability of generic standards such as EN 50160 [20] to railway networks remains an open scientific question, particularly due to the intermittent and time-varying nature of high-speed train loads [21]. Fixed aggregation periods, which are appropriate for conventional electrical networks with relatively stable loads, may not fully capture disturbances associated with rapidly varying traction loads.
In the absence, to date, of normative frameworks specifically designed to account for the dynamic and intermittent characteristics of high-speed railway traction loads, railway operators remain constrained to rely on existing power quality standards and current best practices in electricity monitoring and management to ensure reliable, efficient, and secure operation of their traction systems. Several studies have shown that certain structural solutions, such as the choice of railway supply transformer connections, can contribute to the partial mitigation of voltage unbalance, without fully addressing the issues related to the temporal variability of traction loads [22].
Based on these observations, this study is founded on the hypothesis that fixed aggregation windows, as defined in EN 50160, may introduce systematic bias in the assessment of voltage unbalance in railway power systems due to temporal misalignment between aggregation intervals and disturbance events. This hypothesis is investigated through both theoretical analysis and experimental measurements performed under real operating conditions.
To address this scientific problem, the present study aims to answer the following research questions:
- How does the temporal alignment between aggregation windows and railway operational events affect the accuracy of voltage unbalance assessment?
- To what extent do fixed aggregation methods accurately represent intermittent disturbances generated by high-speed railway loads?
- Can synchronized aggregation, based on actual train operation periods, improve the reliability, representativeness, and reproducibility of power quality assessment?
In this context, the first contribution of this paper is to critically analyze the suitability of current normative frameworks when applied to high-speed train (HST) power supply networks. The second part of the paper presents in detail the architecture of the electrical system supplying railway traction substations, highlighting its structural and functional specificities, particularly in terms of non-linearity, intrinsic unbalance, and rapid power variations. This section then introduces the EN 50160 standard [20], along with its measurement, aggregation, and evaluation principles, which are conventionally used for power quality analysis in public networks, and discusses their applicability to railway systems.
The third part investigates the limitations of power quality assessment based on the EN 50160 standard, which relies on measurement techniques defined in international standards such as IEC 61000-4-30 [23] and IEC 61000-4-7 [24]. Although advanced simulation tools have been successfully used to model and analyze distribution networks supplying alternating-current traction systems [25], these approaches generally rely on quasi-stationary assumptions and fixed observation windows, which may not fully reflect the dynamic behavior of railway loads.
To address this limitation, this study proposes and evaluates a synchronized aggregation approach based on variable synchronization instants and event-based data grouping, using measurement equipment developed in [26,27] and a variable aggregation-period algorithm described in [28]. This approach enables improved temporal alignment between measurements and actual train operation periods. The results provide experimental and analytical evidence supporting the relevance of synchronized aggregation for improving the accuracy, reliability, and physical representativeness of power quality assessment in railway traction systems.
2. Materials and Methods
To ensure a clear understanding of the methodology and its logical progression, the overall research framework adopted in this study is presented in Figure 1. This framework illustrates the sequential process used to evaluate power quality in railway traction power supply systems affected by intermittent and dynamic loads. The methodology begins with synchronized acquisition of electrical measurements, including voltage, current, and harmonic components, using power quality analyzers installed at the traction substation. These measurements are recorded under real operating conditions and provide high-resolution temporal data necessary for accurate analysis.
Figure 1.
Research framework illustrating the synchronized aggregation methodology for power quality assessment in railway traction power supply systems.
In the first stage, the collected data are processed using the conventional aggregation method defined by the EN 50160 standard, which relies on fixed time intervals, typically 10 min aggregation windows. This approach is widely used for power quality assessment in public distribution networks and provides standardized criteria for compliance evaluation. However, due to the intermittent nature of railway loads, particularly high-speed train operations characterized by rapid acceleration, cruising, and braking phases, this method may fail to capture short-duration disturbances accurately.
In the second stage, the limitations of the conventional aggregation method are identified and analyzed. These limitations include the smoothing of transient disturbances, loss of critical information related to intermittent load behavior, and reduced accuracy and reproducibility of power quality evaluation. The fixed aggregation windows may not align with actual train operation periods, leading to potential underestimation or misrepresentation of voltage unbalance and harmonic disturbances.
To overcome these limitations, a synchronized event-based aggregation methodology is proposed. This approach consists of grouping measurement data based on actual train operation events rather than fixed time intervals. Temporal synchronization is achieved using precise time-stamping techniques, enabling alignment of measurement intervals with periods of significant load variation. This method ensures that disturbances associated with railway traction loads are accurately captured and properly evaluated.
Finally, a comparative analysis is conducted between the conventional EN 50160 aggregation method and the proposed synchronized aggregation approach. This comparison evaluates the effectiveness of the proposed methodology in improving the accuracy, representativeness, and reliability of power quality assessment. The results demonstrate that the event-based aggregation approach provides a more realistic and physically representative evaluation of railway power quality, particularly in systems characterized by highly intermittent and dynamic operating conditions (Detailed measurement method and measurement algorithms can be found in the Supplementary Materials).
2.1. Principles of the 2 × 25 kV System
The 2 × 25 kV AC railway power supply system, illustrated in Figure 2, is based on traction substations connected on the primary side to a two-phase transmission network with a line-to-line voltage UBC = 225 kV. The traction transformer delivers a secondary voltage of 50 kV, corresponding to a symmetrical configuration of ±25 kV with respect to ground, which is suitable for the high power levels required by high-speed railway traction systems.
Figure 2.
Principle of a two-phase 2 × 25 kV AC railway power supply fed from a 225 kV transmission network.
Energy is transmitted to the train via the catenary, which is supplied by one end of the secondary winding, while the other end is connected to a negative feeder. The midpoint of the secondary winding is grounded and connected to the rail, thereby establishing an opposing potential between the catenary and the feeder. This architecture provides a voltage of 50 kV between the two conductors while limiting the voltage to 25 kV with respect to ground, which reduces insulation constraints and electrical losses.
In Morocco, this scheme is used to supply HST, with substations fed by two phases of the transmission network, generally phases B and C, while phase A remains inactive in order to limit the impact on high-voltage network balance. Autotransformers distributed along the line ensure potential balancing, reduction in return currents in the rails, and improvement of voltage regulation over long distances.
Despite its advantages, two-phase supply can lead to power quality degradation, including the generation of harmonic currents [28], voltage and current unbalance [29], transient over voltages, and flicker [11,14]. An experimental study on the impact of harmonics and distortion power on a 25 kV AC network was reported in [17]. In addition, measurements of harmonic interactions, from the 1st to the 50th order, between the 225 kV network and 2 × 25 kV AC substations supplying HSTs operating at 320 km/h were presented in [28].
In this context, assessing power quality in 2 × 25 kV AC railway traction networks requires a critical analysis of the capabilities and limitations of power quality meters compliant with EN 50160 [20], as well as an adaptation of evaluation methods to the specific characteristics of these networks.
2.2. Applicable Standards
The assessment of electrical power quality in railway networks is based on the application of technical standards, the choice of which depends on the geographical context, network topology, and the specific characteristics of the power supply system. Although railway traction networks exhibit particular features (highly variable loads, non-linearities, unbalance), several international reference standards are commonly used to frame power quality analysis and monitoring.
Among the most widely recognized standards in this field are:
- EN 50160: This European standard defines the characteristics of the voltage supplied by public low-voltage distribution networks, particularly in terms of voltage variations, frequency, unbalance, and harmonic distortion. Although originally intended for distribution networks, it is frequently used as an indicative reference for assessing power quality in railway networks, especially at delivery substations or interfaces with the public grid [20].
- IEC 61000-2-2:Published by the International Electrotechnical Commission (IEC), this standard specifies electromagnetic compatibility levels for public medium-voltage distribution networks. It covers essential parameters such as voltage variations, frequency fluctuations, harmonics, and interharmonics, and provides a relevant technical basis for analyzing electrical disturbances generated by or affecting railway systems [30].
- UIC 612:Established by the International Union of Railways (UIC), this standard is specifically dedicated to railway systems. It defines requirements related to the quality of electrical power supplied to traction equipment and railway installations, taking into account criteria such as voltage stability, phase symmetry, transients, and the dynamic operating conditions inherent to railway operation [31].
These standards provide a technical reference framework for evaluating, comparing, and maintaining power quality in railway networks, thereby contributing to the safe, reliable, and sustainable operation of traction equipment and associated electrical systems. In addition, railway operators may complement these standards with internal specifications to account for operational constraints and local network characteristics.
2.3. Measurement Aggregation Process According to EN 50160 Requirements
2.3.1. Structure of the Measurement Chain
The electrical parameter to be measured may be directly accessible, as is often the case in low-voltage (LV) networks, or may require the use of measurement transducers for medium-voltage (MV) and high-voltage (HV) networks. These transducers—such as current transformers (CTs) and voltage transformers (VTs)—ensure the conversion of electrical quantities to levels that can be safely measured by instruments. The complete measurement chain, including sensors, transducers, acquisition circuits, and display or recording systems, is illustrated in Figure 3.
Figure 3.
Schematic Representation of the Complete Measurement Process in Electrical Networks.
An electrical measuring instrument generally integrates all these elements; however, the quality of the measurement strongly depends on the characteristics of the transducers, particularly in terms of linearity, bandwidth, and phase error. The EN 50160 standard [20], which defines the characteristics of the voltage supplied by public distribution networks, specifies only the admissible ranges of variation (frequency, magnitude, waveform, etc.) and does not take into account the uncertainties introduced by the transducers [32]. This omission is critical because, in industrial or high-voltage environments, measurement errors can reach several percent depending on the quality of the sensors and the digital interfaces used [33].
2.3.2. Electrical Quantities to Be Measured: Integration and Evaluation
The EN 50160 standard [20] defines the characteristics of the voltage supplied by public electricity distribution networks. To assess the quality of this voltage, it relies on a measurement integration process over different time periods. These integrations make it possible to compare the measured values with the compliance thresholds defined in the standard.
To quantify the measurement uncertainty, the voltage and current transducers used in this study comply with IEC 61869 and IEC 61000-4-30 Class A requirements [23,30]. The voltage transformers (VTs) provide a typical amplitude accuracy better than ±0.5%, while the phase displacement error remains below ±10 arcminutes under nominal operating conditions. These errors propagate to the calculated voltage unbalance factor but remain significantly lower than the variations induced by railway traction loads. In addition, temporal synchronization is ensured using a GPS-based timing reference integrated into the power quality analyzer, providing absolute time accuracy better than ±1 microsecond. This synchronization enables precise alignment of measurement and aggregation windows with actual disturbance events. Considering that the shortest aggregation period used in this study is 200 ms, the timing uncertainty represents less than 0.0005% of the aggregation interval and therefore introduces negligible additional uncertainty in the evaluated power quality parameters. Consequently, the overall measurement uncertainty remains dominated by transducer accuracy rather than synchronization limitations. The process can be understood through several steps:
- (a)
- Integration over Short Periods (10/12 cycles and 150/180 cycles)
- Measurements are first collected over very short time windows corresponding to 10 or 12 power system cycles (i.e., 200 ms for a 50 Hz network).
- Based on these data, longer sequences of 150 or 180 cycles (i.e., approximately 3 s) are formed by grouping 15 intervals of 10/12 cycles.
- At each stage, the root mean square (RMS) value is calculated using the classical formula:
xi: is the instantaneous value (or sample) of the measured signal,
n: is the total number of samples considered,
RMS (Root Mean Square): represents the effective value of xi,
This approach enables accurate capture of rapid voltage variations.
- (b)
- Integration over 10 min (Clock Windows)
- Data resulting from the previous periods are then grouped over a 10 min duration to form a first level of medium-term integration.
- These integrations are time-stamped in an absolute manner; for example, the 10 min interval ending at 01:10:00 includes all data measured between 01:00:00 and 01:10:00.
- If a measurement slightly overlaps the end of a 10 min window (e.g., a cycle that begins just before 01:10:00), it is included in the current window, in accordance with the practices defined in IEC 61000-4-30 (Class A) [23].
- (c)
- Integration over 2 h
- To evaluate longer-term trends, the values derived from the 10 min windows are subsequently integrated over 2 h periods.
- This aggregation is based on the average of the twelve 10 min RMS values composing the 2 h interval.
- These data are mainly used to assess long-duration voltage levels and to compare measurements with the tolerances allowed over a significant time span.
- (d)
- Calculation and Evaluation of RMS Values
At each integration stage (200 ms, 3 s, 10 min, and 2 h), as illustrated in Figure 4, the RMS value is calculated to accurately represent the measured effective voltage.
Figure 4.
Measurement Integration Process According to EN50160 [20].
The measured values obtained from the data acquisition chain are used to identify and characterize the main phenomena affecting the power quality of the electrical grid, such as voltage sags and swells, short or long interruptions, deviations from the nominal voltage, as well as frequency variations and the presence of harmonics. Each integrated measurement is associated with a precise timestamp, ensuring direct temporal correlation between the recorded events and the actual behavior of the grid. This temporal synchronization makes it possible to accurately locate the periods during which anomalies occur and to facilitate their analysis.
The measured values are then compared with the compliance thresholds defined by the EN 50160 standard [20], which specifies the characteristics of the voltage supplied by public distribution networks. According to this standard, the root mean square (RMS) voltage must remain within a range of ±10% of the nominal value for at least 95% of the time over a one-week period. Voltage sags are considered significant when they last between 10 milliseconds and one minute, while the frequency must be maintained within a tolerance of ±1% for 99.5% of the time.
This approach ensures a reliable and standardized assessment of power quality, enabling the detection, quantification, and monitoring of the evolution of electrical disturbances, while guaranteeing the stability and reliability of the grid.
2.3.3. Impact of Measurement Synchronization on Power Quality in Railway Networks
Temporal synchronization of measurements is a key factor in power quality analysis, particularly in railway networks where operating conditions are intense, variable, and subject to strict regulatory constraints. This synchronization ensures that measurements collected at different points of the network are comparable and temporally aligned, which is an essential condition for consistent and reliable statistical calculations.
In the context of the EN 50160 standard [20], which is often applied or adapted in the railway sector, certain requirements specify that 95% of values averaged over 10 min intervals must remain below a defined threshold. This implies a high level of statistical rigor in data collection and processing.
- (a)
- Documented technical and statistical arguments
Accuracy of synchronized measurements: Synchronization using a GPS clock or the NTP protocol improves the reliability of capturing transient events, which are particularly critical in 25 kV/50 Hz supply areas or in DC traction networks. According to Docquier (2021) [34], measurement desynchronization can lead to systematic analysis errors in distributed monitoring systems of railway smart grids.
Detection of short-lived anomalies: Transient events such as voltage sags, current peaks, or frequency variations may only appear for a few cycles. Desynchronized measurements risk smoothing or missing such events. Brahimi (2018) [35] emphasizes that, for critical infrastructures, early detection of these anomalies through data synchronization is a key lever of railway Prognostics and Health Management (PHM).
Regulatory compliance and traceability: Proper synchronization is necessary to ensure auditability and compliance with national or European standards, thereby avoiding economic penalties or operational constraints. El Abboubi (2016) [36] illustrates this through the study of onboard railway devices powered by unstable energy sources.
- (b)
- Contributions of applied statistics
Synchronized descriptive statistics: Temporally aligned measurements make it possible to reliably compute means, standard deviations, quantiles, and confidence intervals for each parameter (voltage, THD, frequency, etc.).
Distribution and threshold exceedance: With a synchronized measurement sample, it is possible to robustly determine the proportion of 10 min intervals exceeding a given threshold, in compliance with methods such as Extreme Value Theory (EVT) to estimate worst-case scenarios [37].
Scenario simulation and prediction: Well-synchronized data enable the simulation of the impacts of various disturbances (load changes, catenary incidents, supply faults). This supports predictive and adaptive decision-making based on time-series models.
2.4. Voltage Supply Unbalance in Railway Networks
2.4.1. Definition and Measurement Principles
A three-phase system is said to be unbalanced when the three phase voltages are not equal in magnitude and/or are not exactly phase-shifted by 120° with respect to each other.
This unbalance may result from:
- Asymmetric load distribution (e.g., single-phase connections),
- Faults on one phase,
- Electromagnetic disturbances caused by power conversion devices.
To quantify this phenomenon, the method of symmetrical components developed by Fortescue (1918) [38] is used.
This method decomposes any three-phase system into three fundamental components:
- Positive-sequence component (U1d): represents a balanced system with positive rotation, corresponding to normal operation.
- Negative-sequence component (U1i): reflects phase unbalance caused by asymmetric loads or faults.
- Zero-sequence component (U10): represents the homopolar component, where the three phase voltages have equal magnitude and are in phase.
In three-wire systems, the zero-sequence current component is equal to zero due to the absence of a return path. However, the zero-sequence voltage component may still exist depending on the grounding conditions and network configuration. In four-wire systems or grounded networks, both zero-sequence voltage and current components may be present.
In 2 × 25 kV AC railway networks, the interpretation of the zero-sequence voltage component requires particular attention because of the specific grounding scheme and system configuration. The midpoint of the traction transformer is generally grounded and connected to the rails, while the catenary and the negative feeder are maintained at opposite potentials with respect to this reference. As a result, the measured zero-sequence voltage may be influenced not only by network asymmetries, but also by current return conditions, the role of autotransformers, the local network topology, and the measurement setup used.
The voltage unbalance factor is defined as the ratio between the negative-sequence component and the positive-sequence component:
This quantity expresses the percentage of unbalance with respect to the balanced voltage.
2.4.2. Compliance Criteria According to EN 50160
According to the EN 50160 standard [20], which defines the characteristics of the voltage supplied by public distribution networks:
- Over a one-week period, 95% of the RMS values of the negative-sequence component (U1i), calculated every 10 min, must be less than 2% of the positive-sequence component (U1d).
- In areas where certain installations are single-phase or two-phase, this limit may be extended to 3%.
- Recommended (indicative) voltage unbalance value for the HV/EHV network—which is the case study considered here:
U2% ≤ 1%, corresponding to the compatibility level in HV/EHV networks.
Measurements must be carried out in accordance with IEC 61000-4-30 (Class A) [23], which imposes a rigorous sampling and calculation method to ensure result comparability.
However, this method, based on 10 min time windows, is mainly suitable for conventional networks with stable loads and does not reflect the dynamic behavior of variable-load networks, such as HST networks.
2.4.3. Limitations of Applying EN 50160 to Railway Networks
In high-speed railway systems, the direct application of these criteria presents major limitations due to the dynamic and highly variable nature of traction loads:
- Energy consumption varies abruptly between acceleration, cruising, and regenerative braking phases.
- These rapid variations generate transient unbalances, often of short duration (a few seconds or milliseconds).
- Ten-minute averaging methods smooth these phenomena and mask instantaneous unbalances.
Thus, an assessment conducted over a full week, as prescribed by EN 50160 [20], does not allow faithful characterization of the actual network behavior during periods of intense traffic.
Periods of high railway activity generate significant and fluctuating unbalances, whereas rest periods (trains stopped at stations, lines energized but unloaded) exhibit apparent stability.
From a theoretical perspective, the aggregation process defined in EN 50160 can be modeled as a time-weighted averaging operation over a fixed window of duration T. If a disturbance with amplitude Ad occurs during a time interval d within the aggregation window, while the system remains at its nominal value Abase during the remaining time (T−d), the aggregated value Aagg can be expressed as:
where Aagg is the aggregated value of the power quality parameter over the aggregation window, Ad is the value of the parameter during the disturbance period, Abase is the steady-state value under normal operating conditions, d is the duration of the disturbance within the aggregation window, and T is the total duration of the aggregation interval defined by the standard (typically 10 min in EN 50160). This expression shows that the contribution of the disturbance to the aggregated value is proportional to the ratio d/T. When the disturbance duration is significantly shorter than the aggregation window, the aggregated value remains close to the nominal value, resulting in attenuation of transient disturbances. Therefore, the aggregation process introduces a smoothing effect equivalent to temporal low-pass filtering, which may lead to underestimation of short-duration voltage unbalance events in railway systems characterized by intermittent loads.
2.4.4. Need for a Measurement Method Adapted to the Railway Context
To obtain a relevant assessment of power quality in railway systems, it is imperative to adapt the measurement method to real operating conditions. Three main improvement axes are generally recommended:
- (a)
- Temporal Synchronization
Measurement campaigns must be synchronized with traffic periods (departures, crossings, braking events). The use of GPS synchronization or the Precision Time Protocol (PTP) makes it possible to align data acquisition with actual network events.
- (b)
- High Sampling Frequency
Unlike standard-class recorders (sampling at 10 samples/s), modern systems must reach sampling frequencies from 1 kHz to 10 kHz or even higher in order to:
- Detect rapid unbalances,
- Capture transients related to traction converters,
- Observe the propagation of harmonics and interharmonics.
This fine temporal resolution is essential for traction systems using four-quadrant converters, which generate high-frequency voltage unbalances.
- (c)
- Advanced Data Analysis
Conventional analysis tools (RMS averaging, linear statistics) must be complemented by:
- Short-Time Fourier Transform (STFT) for frequency analysis,
- Continuous wavelet transforms to detect non-stationary transients,
- Extreme value statistical analysis (Extreme Value Theory, EVT) to quantify rare but critical unbalances.
Recent studies [37] show that the use of hybrid models based on machine learning makes it possible to identify and predict critical unbalances from non-stationary time series.
Voltage unbalance is a key indicator of the stability and performance of railway power supply networks. The conventional measurement methods prescribed by EN 50160 must therefore be adapted and enriched to account for the non-stationary and highly dynamic nature of traction networks.
An approach based on:
- Measurements synchronized with traffic cycles,
- High sampling frequency,
- Advanced signal analysis.
This approach enables a more accurate assessment of voltage unbalance, better disturbance prevention, and optimization of traction system performance.
This methodological adaptation represents a strategic challenge for the reliability and safety of high-speed railway networks, while ensuring regulatory compliance and the energy sustainability of the system.
3. Theoretical and Experimental Analysis of the Impact of Railway Load Intermittency on Power Quality Assessment
3.1. Theoretical Study of the Impact of Railway Load Intermittency on Power Quality Assessment
In the railway domain, HSTs represent intermittent loads whose energy consumption varies significantly depending on operating phases (acceleration, cruising, braking, stopping). These rapid variations modify network demand and directly affect power quality assessment.
Current standards (EN 50160, IEC 61000-4-30) are designed for the detection of continuous and stationary disturbances. However, they exhibit significant limitations when faced with short-duration or variable disturbances typical of railway systems. Indeed, fixed aggregation windows (10 min) smooth actual fluctuations, thereby diluting the intensity of disturbances spread over several periods. This leads to an underestimation of real effects and may bias compliance with the normative threshold of 95% of aggregated values.
To obtain a more representative assessment, it is necessary to adopt analysis methods synchronized with real railway traffic events. These approaches, based on dynamic data grouping prior to aggregation, make it possible to better capture rapid variations and provide a more accurate, consistent, and reproducible evaluation of power quality.
Thus, accounting for load intermittency, route variability, and operational uncertainties emerges as an essential evolution to adapt measurement and analysis tools to the dynamic realities of modern railway networks.
3.1.1. Theoretical Evaluation over a Half-Journey (18 min)
To illustrate this effect, a disturbance with a total duration of 18 min was simulated and distributed over 10 min aggregation intervals in accordance with normative prescriptions. This duration corresponds to a representative journey in the Moroccan railway context, equivalent to half the distance traveled between the two cities considered.
Depending on the disturbance start time:
- It is distributed over two periods if it begins at the start of an aggregation window,
- It is distributed over three periods if it begins between two successive windows.
The main objective of this step is to quantify, for all aggregation periods considered, the number of values compliant with a defined voltage threshold (Vs = 0.8 V). This threshold corresponds to the limit beyond which a disturbance is considered significant. Each aggregated value is therefore compared with this reference to determine its compliance status.
The compliance rate is then calculated as the ratio between the number of compliant values and the total number of aggregated values, making it possible to assess the network’s sensitivity to load intermittency.
- (a)
- Determination of Disturbance Durations in Each Period
For each configuration, the disturbance is divided among three periods P1, P2, and P3, according to the minutes covered in each period:
- d1: Disturbance duration in P1 (varies from 1 to 10 min).
- d2: Disturbance duration in P2, calculated as:
- d3: Disturbance duration in P3, calculated as:
- (b)
- Calculation of aggregated values
The aggregated value APₓ in a period Pₓ is given by the contribution of the disturbed durations (A = 1) and the non-disturbed durations (Abase = 0.2A):
The aggregation period contains two types of intervals:
- A disturbed duration dx, during which the network is affected by a disturbance (train passage),
- A non-disturbed duration (T − dx), corresponding to normal network operation.
Where:
- APx: aggregated value of the parameter over the period Px (voltage unbalance factor U2%);
- A: value of the parameter during the disturbance;
- Abase: value of the parameter under normal conditions (without disturbance);
- dx: duration of the disturbance within the period Px (in minutes);
- T: total duration of the aggregation period (10 min).
Equation (5) provides a simplified analytical representation of the aggregation process by expressing the aggregated value APx as a time-weighted average of the power quality parameter over the aggregation period T.
It should be clarified that the disturbance duration considered in this model corresponds to the cumulative time during which the parameter deviates from its steady-state value due to railway operation. In practice, train operation is inherently event-driven and consists of discrete phases such as acceleration, steady-state motion, regenerative braking, and stopping. Each of these phases introduces temporary deviations in electrical parameters. However, from the perspective of fixed-window aggregation as defined in EN 50160, the aggregated value depends only on the total cumulative duration of disturbed conditions within the aggregation window, regardless of the internal sequence of events. Therefore, representing the disturbance as an equivalent continuous interval of duration dx constitutes a valid and physically consistent analytical approximation that preserves the total disturbance contribution.
In this formulation, the parameter A explicitly represents the instantaneous value of the considered power quality indicator under disturbed conditions, such as the negative-sequence voltage unbalance factor U2%, while Abase represents its steady-state value under normal operating conditions in the absence of train-induced disturbances. The value of Abase, previously expressed in normalized form as a fraction of A, corresponds to the typical background unbalance level observed in the network and reflects the inherent asymmetry of the electrical system.
The threshold value Vs = 0.8A is defined in normalized form to establish a general analytical criterion for distinguishing disturbed and non-disturbed intervals. This normalized formulation ensures that the model remains independent of absolute voltage levels and is directly applicable to different railway systems and operating conditions. Such normalization is consistent with standard power quality assessment methodologies, including EN 50160, which define compliance limits relative to nominal or reference values.
Consequently, Equation (5) provides a physically justified and mathematically consistent framework for analyzing the effect of aggregation on intermittent disturbances in railway power systems.
- (c)
- Example of Calculation
Case:
- d1 = 5 min (disturbance in P1)
- d2 = min(10, 18 − 5) = 10 min (disturbance in P2).
- d3 = max(0, 18 − 5 − 10) = 3 min (disturbance in P3).
Calculation of the aggregated values:
- Period 1:
- Period 2:
- Period 3:
- (d)
- Compliance Evaluation
The threshold value Vs = 0.8 A represents the compliance limit used to determine whether an aggregated value is considered acceptable or non-compliant. In this normalized model, A = 1 corresponds to the disturbance amplitude during train operation, while Abase = 0.2 represents the normal operating condition. The selected threshold of 0.8 A corresponds to 80% of the disturbance amplitude and is used to simulate a critical unbalance level comparable to compatibility limits defined in standards such as EN 50160. This threshold allows distinguishing aggregation periods significantly affected by railway load intermittency from normal operating conditions.
For each aggregated value (AP1, AP2, AP3), it is verified whether it is less than or equal to the threshold Vs = 0.8 A:
- AP1 = 0.6 ≤ 0.8 A: Compliant.
- AP2 = 1.0 > 0.8 A: Non-compliant.
- AP3= 0.44 ≤ 0.8 A: Compliant.
Number of compliant values: N_compliant = 2.
Compliant proportion:
- (e)
- Generalization to Other Cases
The same process is applied to all possible configurations (d1 varying from 0 to 9 min). The results are summarized in Table 1.
Table 1.
Compliance Evaluation over a Half-Journey.
The table presents the compliance evaluation for an 18 min disturbance distributed over three 10 min aggregation periods.
The results highlight several important observations:
- Disturbance distribution: The durations within periods P1, P2, and P3 vary depending on when the disturbance begins relative to the start of the aggregation periods. This directly affects the calculated aggregated values.
- Compliance proportion:
- ○
- When the disturbance is more evenly distributed across two main periods (e.g., P1 = 10, P2 = 7), the compliance proportion remains relatively high (66.67%).
- ○
- When the disturbance is more concentrated within a single period (e.g., P3 = 0), the compliance proportion decreases significantly (33.33%).
- Impact of intermittent loads: Intermittent loads, such as those caused by high-speed trains, are not uniformly captured by rigid aggregation windows. This leads to significant fluctuations in aggregated values and to a systematic underestimation of disturbances.
3.1.2. Theoretical Evaluation over the Complete Journey (36 min)
Table 2 illustrates the results of the compliance proportion evaluation for a 36 min disturbance, representing the total duration of the complete journey studied, distributed over five successive 10 min aggregation intervals.
Table 2.
Compliance Evaluation over the Complete Journey.
The key observations are as follows:
- (a)
- Disturbance Distribution
- The disturbance is divided among periods P1, P2, P3, P4, and P5 depending on its start time relative to the beginnings of the aggregation periods.
- When the disturbance is more evenly distributed across several periods, the aggregated values exhibit a certain degree of uniformity; however, the compliance proportion remains low.
- (b)
- Compliance Proportion
- A compliant proportion of 40% is observed when the disturbance is more uniformly distributed across several periods.
- A compliant proportion of 20% appears when the disturbance is concentrated in one or two main periods, illustrating the inability of the method to properly capture the overall effect of intermittent loads.
- (c)
- Conclusion
The results show that fixed 10min aggregation methods, as defined by the EN 50160 standard, are not suitable for intermittent loads, particularly in railway networks.
They introduce a statistical bias by failing to properly capture the cumulative effect of prolonged disturbances, leading to a systematic underestimation of compliance. These limitations justify the adoption of alternative methods, such as dynamic or synchronized aggregation, to ensure representative and reliable power quality assessments, thereby requiring an adaptation of current standards.
It should be noted that the disturbance duration considered in this analytical model represents the cumulative time during which the power quality parameter deviates from its steady-state value, regardless of whether the disturbance is caused by a single train or multiple trains operating simultaneously. In practical railway systems, simultaneous train operation may result in increased load levels and potentially more complex electrical interactions. However, from the perspective of aggregation, the relevant quantity is the resulting value of the power quality parameter and its cumulative duration within the aggregation window. The aggregation process inherently captures the combined effect of simultaneous disturbances through the measured parameter value A. Therefore, the analytical formulation remains valid for representing the overall impact of intermittent railway loads on aggregated power quality assessment, while detailed modeling of electrical interactions between multiple trains falls outside the scope of this aggregation-focused analysis.
3.2. Experimental Study of the Impact of Railway Load Intermittency on Power Quality Assessment
Measurement context: Figure 5 presents recordings of the negative-sequence voltage unbalance (U2%), from 26 June 2023 at 19:00 to 27 June 2023 at 10:00, measured using a 200 ms aggregation period.
Figure 5.
Recording of U2% Voltage Unbalance over a 200 ms Aggregation Period.
3.2.1. Evaluation of Negative-Sequence Voltage Unbalance over a Real Journey
Figure 6 presents the 10min aggregations of the negative-sequence voltage unbalance (U2%) with different measurement start offsets ranging from 1 to 9 min. These offsets may reflect variations in the disturbance distribution, generally caused by the synchronization of power quality meters or by delays in HST operations.
Figure 6.
Time-Shifted Aggregation of U2% Voltage Unbalance over a Real Journey.
Analysis: Among the recordings, it is observed that only four offsets (1, 3, 4, and 5 min) recorded voltage unbalanced values exceeding the prescribed limit. This indicates that these offsets captured periods of high load variability, thereby reflecting the actual magnitude of the negative-sequence voltage unbalance.
The other offsets show unbalance values below the limits, indicating that aggregations performed with offsets of 2, 6, 7, 8, and 9 min did not reveal any significant exceedance.
It should be clarified that the temporal shift observed in Figure 5 does not correspond to a measurement delay or acquisition error. Instead, it results from the relative alignment between fixed aggregation windows and the actual occurrence of railway disturbance events. Since aggregation is performed over fixed time intervals (e.g., 200 ms), the apparent position of disturbance peaks may vary depending on their temporal alignment within the aggregation window. This effect is inherent to the aggregation process and reflects the intermittent nature of railway loads.
The measurement system operates in compliance with IEC 61000-4-30 Class A requirements. The aggregation interval of 200 ms corresponds to 10 power system cycles at 50 Hz, derived from continuous waveform acquisition. This aggregation ensures sufficient temporal resolution to accurately capture transient variations in power quality parameters associated with train operation.
Conclusion: The evaluation of voltage unbalance is strongly influenced by load variability, which fluctuates according to train operations. The peaks observed at specific offsets highlight that periods of high demand are not consistently captured across all offsets, revealing a vulnerability in the applied aggregation method.
The use of fixed aggregation periods may fail to provide a representative and reproducible measure of voltage unbalance in contexts where the load varies rapidly. The recordings show that even small temporal offsets can alter the perceived unbalance levels, making it difficult to draw robust conclusions about the overall condition of the network.
3.2.2. Unsynchronized Evaluation of U2% Voltage Unbalance over 10 Journeys
Figure 7 illustrates the temporal evolution of the voltage unbalance factor U2 (%), obtained from the aggregation of measurements from ten real journeys. The upper plot presents the instantaneous values of U2 (%), highlighting a highly variable behavior characterized by transient peaks and periods of low unbalance. The lower plot shows the RMS values aggregated over ten-minute intervals, with the reference limit of 1% indicated by a horizontal line.
Figure 7.
Aggregation over Ten Real Journeys.
The results reveal that, although the unbalance remains generally under control, several sequences exhibit values close to or slightly above the indicative threshold, reflecting the influence of localized asymmetric events related to real operating conditions of the network. This aggregation highlights the non-stationary and intermittent nature of voltage unbalance in extra-high-voltage (EHV) networks, justifying the need for fine-grained statistical and temporal analysis for a realistic assessment of power quality.
Figure 8 presents the evolution of the negative-sequence voltage unbalance U2 (%), obtained from a time-shifted temporal aggregation applied successively over 1, 2, 3, and 4 min windows. Each subfigure illustrates the effect of the aggregation step on the RMS values of the unbalance, highlighting the sensitivity of U2 (%) to rapid network variations. The results show that short windows (1–2 min) preserve fast fluctuations and reveal higher unbalance peaks, whereas increasing the aggregation time (3–4 min) generally induces signal smoothing, thereby reducing the apparent amplitude of short-duration maxima.
Figure 8.
Time-Shifted Aggregation of U2% Voltage Unbalance (from 1 to 4 min).
However, in some cases, increasing the aggregation window may also lead to an increase in the aggregated unbalanced value. This occurs when the longer window captures a larger portion of a disturbance event or combines several successive disturbance intervals that were previously distributed across separate shorter windows. As a result, the time-weighted average value increases due to the higher proportion of disturbed conditions within the aggregation period.
These observations confirm that the choice of aggregation window duration represents a trade-off between transient detection capability and statistical stability.
From a methodological perspective, the aggregation window length should be selected as a compromise between two antagonistic effects: smoothing error, which increases with long windows and attenuates disturbance magnitude, and temporal alignment error, which increases with short windows and makes the result more sensitive to the exact position of the event within the window. A practical strategy is, therefore, to choose the window duration that minimizes a combined criterion based on both the deviation from the event reference value and the sensitivity of the aggregated result to temporal shifts in the window.
Short windows allow accurate detection of fast and localized disturbances, whereas longer windows provide more stable and representative values but may attenuate short transients or, conversely, emphasize sustained disturbance periods. This analysis highlights the transient and intermittent nature of voltage unbalance and emphasizes the decisive impact of aggregation window selection on power quality assessment in railway traction networks.
Figure 9 shows the evolution of the negative-sequence voltage unbalance U2 (%) for time-shifted aggregation windows ranging from 5 to 9 min. Increasing the aggregation time leads to a progressive smoothing of rapid fluctuations, thereby reducing signal variability. However, certain events persist, with U2 (%) values reaching approximately 1.7 to 1.85%, indicating the presence of recurring unbalances associated with real operating conditions of the network. This figure highlights that longer aggregation windows can attenuate transient peaks while still preserving the signature of dominant asymmetric phenomena.
Figure 9.
Time-Shifted Aggregation of U2% Voltage Unbalance (from 5 to 9 min).
To complement this experimental interpretation, a preliminary statistical reading was carried out directly from the annotated U2% values visible in the experimental graphs. Based on these values, the conventional EN 50160 fixed 10 min aggregation yields an average U2% of approximately 1.2348% with a standard deviation of 0.2617%, whereas the proposed event-based approach yields an average U2% of approximately 1.1203% with a standard deviation of 0.1726%. The corresponding coefficient of variation decreases from 21.19% to 15.41%, suggesting that the event-based method provides a more consistent representation of voltage-unbalance behavior. Moreover, comparison with the 1% reference limit shows that both approaches reveal non-compliant episodes, although the fixed-window aggregation exhibits greater dispersion and a higher maximum value. These results should be interpreted as a preliminary graph-based statistical indication derived from the annotated figure values, rather than as a full statistical validation based on the complete raw measurement dataset.
To further support the theoretical analysis presented in Section 3.1, a deeper investigation of the experimental measurement results was conducted. The theoretical model demonstrated that the aggregated value of voltage unbalance depends on both the magnitude and duration of disturbance events within the aggregation window, as defined by the time-weighted averaging process in Equation (5). In particular, this process may attenuate short-duration disturbances or emphasize sustained disturbance periods depending on their temporal distribution relative to the aggregation window.
The experimental results presented in Figure 8 and Figure 9 confirm this theoretical behavior. Short aggregation windows (1–4 min) preserve rapid fluctuations and reveal transient peaks associated with train acceleration, braking, and power transitions, corresponding to localized disturbance events predicted by the theoretical model. As the aggregation window increases (5–9 min), the measured signal exhibits progressive smoothing, reducing the apparent amplitude of short-duration disturbances due to the averaging effect. However, in certain cases, longer aggregation windows capture a larger proportion of sustained disturbance events or combine successive perturbations within a single interval, resulting in increased aggregated values. This behavior confirms that the measured voltage unbalance is strongly influenced by both the duration of disturbances and their temporal alignment with the aggregation window.
Furthermore, the persistence of elevated unbalance levels despite the smoothing effect indicates the presence of recurring asymmetric operating conditions linked to railway traction loads. The variations in non-compliance percentages presented in Table 3 further demonstrate that voltage unbalance evaluation is highly sensitive to aggregation duration and synchronization conditions. These experimental findings are fully consistent with the theoretical predictions and confirm that fixed aggregation windows, such as the conventional 10min interval defined in EN 50160,may lead to partial attenuation or misrepresentation of transient disturbances in railway systems characterized by intermittent loads. Consequently, the proposed synchronized and event-based aggregation approach provides a more accurate and physically representative assessment of voltage unbalance under real railway operating conditions.
Table 3.
Summary of Non-Compliance Observed for Each Aggregation Time Shift.
The table shows the variation in non-compliance percentages (exceeding the 1% threshold) as a function of train delays or power quality meter synchronization offsets, under the same energy consumption conditions. It can be observed that the non-compliance percentages fluctuate between 6.6% and 10%, depending on the time shift. This highlights certain weaknesses of the 95% statistical assessment based on cyclic aggregations.
For the same level of energy consumption, temporal shifts influence the evaluation results, which calls into question the reproducibility of assessments used to determine compliance with power quality parameters. This indicates that the evaluation is not sufficiently credible in the context of high-speed railway systems.
Conclusion: The analysis of voltage unbalance recordings (U2%) highlights the need to reassess the evaluation method based on cyclic aggregations used to capture load variations. Although some time-shifted aggregation periods made it possible to identify exceedances, the inherent variability of railway loads calls for a more dynamic approach to unbalance assessment. A robust evaluation method that is insensitive to the aforementioned constraints could improve the detection of critical moments and provide more accurate information on the network condition.
The non-compliance deviations interpreted as a function of time shifts reveal the limitations of statistical evaluation based on cyclic aggregations.
To enhance the reliability of power quality assessment, it would be advisable to group intervals during which unbalances occur recurrently, rather than treating them individually. Indeed, grouping would help avoid biasing the data required for aggregation and evaluation.
Temporal shifts and journey durations fragment cyclic aggregation periods and risk diluting the real impact of unbalances, leading to an underestimation of power quality parameters.
Thus, by taking into account the challenges posed by irregular journeys and temporal fluctuations, grouping data over critical periods would help mitigate these biases. This approach would ensure better representativeness of actual disturbances and strengthen the reliability of evaluations.
3.2.3. Grouping Method
To ensure the reliability and repeatability of unbalanced evaluations, a grouping method is employed. It consists of aggregating the unbalances observed at the end of each recommended measurement period over a one-day interval.
In this study, an event corresponding to a HST passage is defined as a time interval during which the measured negative-sequence voltage unbalance factor (U2%) deviates significantly from its steady-state baseline value due to the electrical load imposed by the train. This identification is based on synchronized electrical measurements and reflects the actual operating conditions of the railway power supply system, rather than relying on predefined train schedules. The grouping process consists of associating measurement intervals corresponding to each identified train passage and aggregating them prior to compliance evaluation. The compliance metric is defined by comparing the aggregated U2% values with the compatibility limits specified in EN 50160, with particular attention to the magnitude and occurrence of threshold exceedances. This event-based approach ensures a physically meaningful and reproducible evaluation of power quality under real railway operating conditions.
Figure 10 shows the voltage unbalance (U2%) recordings over the measurement period, for which the evaluation recorded 11 exceedances of the subscribed limit, thereby reflecting the actual negative-sequence voltage unbalance generated by HSTs.
Figure 10.
Aggregation of U2% Voltage Unbalance after Synchronization and Traffic Grouping.
Grouping voltage unbalanced recordings aligned with HST passages, as illustrated in this figure, proves to be a particularly effective solution for several reasons:
- Reduction in unbalance losses over short periods
By considering only periods associated with HST passages, this method focuses on moments when load variations are most significant and most likely to cause unbalances. This avoids the dilution or masking of unbalances over longer periods, as occurs with conventional cyclic aggregation, where significant transient variations may not be properly captured.
In the graph, unbalanced peaks exceeding 1% are recorded during train passages. By grouping these events, it is possible to prevent momentary unbalances from going unnoticed within a 10 min aggregation.
- Improved repeatability of evaluations
HSTs do not always adhere to exact schedules, and variations in departure or arrival times can lead to discrepancies in measurements when fixed windows are used.
Event-based grouping of measurements (train passages) overcomes this issue. Measurements can thus be grouped meaningfully before final evaluation, ensuring reliable and reproducible comparisons even in the presence of timetable shifts.
This approach also improves evaluation repeatability. By grouping measurements based on HST passages, independently of fixed aggregation periods, evaluations can be compared more accurately from one journey to another, as they no longer depend on time shifts or journey durations.
- Aggregation solution prior to final evaluation
This method requires grouping data before the final evaluation. It enables filtering of relevant events (HST passages) and aggregation of data in a way that faithfully captures unbalances associated with train operations. This focuses evaluations on critical moments and eliminates periods where unbalances are less significant or absent.
It should be noted that the improved preservation of peak values observed with shorter aggregation periods, such as 1 min, is consistent with the theoretical aggregation model presented in Section 3.1. According to the time-weighted averaging principle, longer aggregation periods introduce a stronger smoothing effect, reducing the apparent magnitude of transient disturbances. Conversely, shorter aggregation windows reduce this smoothing effect and provide a representation that is closer to the instantaneous parameter variations.
Furthermore, the temporal shift observed between aggregation results is not an artifact but reflects the relative alignment between aggregation windows and actual disturbance events. In railway systems, disturbances are directly linked to operational events such as train acceleration and braking. Therefore, the position of aggregation windows relative to these events constitutes an operational parameter that directly influences the aggregated values. This confirms that aggregation duration and temporal alignment are critical factors affecting the accuracy and representativeness of power quality assessment in intermittent load conditions.
4. Limitations and Future Work
Despite the significant improvements achieved by the proposed synchronized aggregation methodology, certain limitations must be acknowledged to ensure a balanced and rigorous interpretation of the results.
First, the experimental validation presented in this study was conducted using measurements from a specific high-speed railway traction substation operating under defined network and traffic conditions. Although the results demonstrate the effectiveness of the proposed approach in capturing intermittent disturbances and improving the representativeness of power quality assessment, the generalization of the method to other railway systems may depend on factors such as network topology, electrical infrastructure configuration, grounding conditions, and operational practices. These parameters may influence the propagation, magnitude, and temporal characteristics of voltage unbalance and harmonic disturbances.
Second, the present work primarily considers operating conditions involving isolated or sequential train passages. In real railway systems, particularly in high-density corridors, multiple trains may operate simultaneously within the same electrical supply section. In such multi-train environments, the superposition of load variations may generate more complex and overlapping disturbance patterns, including cumulative voltage unbalance and harmonic interactions. While the proposed synchronized aggregation methodology provides a robust framework for capturing event-based disturbances, additional investigations are required to assess its performance and scalability under simultaneous multi-train operating conditions.
Third, specific railway environments such as tunnels and dense urban networks introduce additional technical challenges. Tunnel environments are characterized by confined electrical infrastructure, modified grounding conditions, and increased electromagnetic coupling, which may affect disturbance propagation and measurement accuracy. Similarly, urban railway systems typically exhibit higher train density, frequent acceleration and braking cycles, and multiple interconnected substations. These characteristics may result in increased temporal variability and spatial complexity of power quality disturbances, requiring enhanced synchronization strategies and extended monitoring coverage.
Furthermore, the proposed methodology relies on precise temporal synchronization of measurement data. Its effectiveness depends on the accuracy and reliability of synchronization mechanisms, such as GPS-based timing systems or equivalent high-precision time references. In practical deployments, synchronization errors, communication delays, or measurement system limitations may introduce uncertainties that could affect the aggregation and interpretation of results.
Future research will focus on extending the validation of the proposed methodology to more complex and large-scale railway systems, including multi-train operation scenarios, tunnel infrastructures, and high-density urban railway networks. In addition, the integration of advanced signal processing techniques and intelligent data analysis methods, such as machine learning and pattern recognition, will be investigated to enable automatic detection, classification, and prediction of power quality disturbances. These developments will contribute to enhancing the robustness, scalability, and practical applicability of the proposed methodology, and will support the evolution of power quality assessment practices toward more adaptive and context-aware approaches suitable for modern railway systems.
5. Conclusions
Following the experimental analysis of recordings carried out on the 225 kV line supplying the HST traction substation, several key findings highlight the limitations of current power quality normative frameworks, particularly when applied to networks characterized by highly dynamic loads. The results emphasize the need for an evolution of existing standards, especially with regard to aggregation periods, temporal synchronization, and data grouping prior to final evaluation.
The significant differences observed between unbalanced values measured using various aggregation periods demonstrate that current normative approaches are not fully suited to representing the complexity of high-speed railway traction networks. The intrinsic variability of railway loads—directly linked to train acceleration, cruising, and braking phases—induces rapid and intermittent disturbances that are not properly captured by long aggregation windows. This specific dynamic justifies the development of dedicated normative references capable of accurately reflecting the real impact of such loads on power quality.
Data analysis revealed notable limitations of the 10 min aggregation periods commonly used to assess voltage and current unbalances, as they tend to mask the rapid variations characteristic of highly intermittent networks. In this respect, a reduced aggregation period of 60 s is recommended for the evaluation of voltage and current unbalances. Conversely, parameters such as RMS voltage, frequency, and voltage THD may continue to be assessed over 10-min windows, as their variations have proven to be slower and more stable, and only weakly influenced by high-speed-train traffic.
Furthermore, the systematic integration of negative-sequence and zero-sequence current unbalance measurements—currently considered optional by IEC 61000-4-30—appears essential for an in-depth characterization of power quality in traction networks. These indicators make it possible to distinguish between unbalances intrinsic to the network and those induced by railway operations, constituting a fundamental lever for rigorous causal analysis and for establishing reliable diagnostics during incidents or malfunctions.
The results of this study establish a clear causal relationship between aggregation window duration and the attenuation of intermittent disturbances. Both the theoretical model and experimental observations demonstrate that longer aggregation periods introduce a smoothing effect that may underestimate the magnitude of transient railway-induced disturbances. The proposed 60 s aggregation interval represents a practical compromise between measurement accuracy and implementation feasibility, as it can be implemented using standard IEC 61000-4-30 Class A power quality analyzers without requiring high-frequency waveform recording or additional measurement hardware.
From a standardization perspective, these findings support the evolution of existing power quality standards, such as EN 50160 and IEC 61000-4-30, toward the integration of shorter aggregation intervals or event-synchronized aggregation methods for networks characterized by intermittent loads. Such adaptations would improve the representativeness of power quality assessments while maintaining compatibility with existing measurement infrastructures. These recommendations provide a practical and scalable framework for improving power quality monitoring in modern railway and event-driven electrical systems.
Finally, the study of the impact of load intermittency on evaluations based on cyclic aggregation windows revealed that such windows do not always coincide with critical periods associated with train journeys. This desynchronization can lead to underestimation of actual disturbances and, consequently, a biased assessment of normative compliance. To overcome these limitations, a methodology based on synchronization and grouping of data prior to aggregation was proposed. This approach aligns the analysis with significant railway events, reduces biases related to variable journey durations and operational delays, and ultimately ensures a more accurate, reliable, and reproducible assessment of power quality parameters affected by railway traction networks.
Supplementary Materials
The following supporting information can be downloaded at: https://www.mdpi.com/article/10.3390/electricity7020042/s1, Figure S1. General flowchart of the measurement method. Figure S2. Flowchart of the software processing of the power quality analyzer. Figure S3. Flowchart of the evaluation improvement method.
Author Contributions
Conceptualization, Y.T.; Methodology, A.B. and Y.T.; Software, Y.T.; Validation, Y.T. and A.A.; Formal analysis, Y.T.; Investigation, Y.T.; Resources, Y.T.; Data curation, R.L.; Writing—review & editing, A.B.; Visualization, A.A.; Supervision, A.A.; Project administration, A.A. All authors have read and agreed to the published version of the manuscript.
Funding
This research received no external funding. The APC was funded by the authors.
Data Availability Statement
The data supporting the findings of this study are not publicly available due to confidentiality restrictions related to railway power system measurements but may be made available from the corresponding author upon reasonable request.
Conflicts of Interest
The authors declare no conflict of interest.
Abbreviations
The following abbreviations are used in this manuscript:
| AC | Alternating Current |
| DC | Direct Current |
| CT | Current Transformer |
| VT | Voltage Transformer |
| RMS | Root Mean Square |
| THD | Total Harmonic Distortion |
| HST | High-Speed Train |
| PHM | Prognostics and Health Management |
| GPS | Global Positioning System |
| NTP | Network Time Protocol |
| PTP | Precision Time Protocol |
| EVT | Extreme Value Theory |
| STFT | Short-Time Fourier Transform |
| LV | Low Voltage |
| MV | Medium Voltage |
| HV | High Voltage |
| EHV | Extra-High Voltage |
| U1d | Positive-sequence voltage |
| U1i | Negative-sequence voltage |
| U10 | Zero-sequence voltage |
| U2% | Voltage unbalance factor |
| EMC | Electromagnetic Compatibility |
| EN 50160 | European Standard EN 50160 |
| IEC | International Electrotechnical Commission |
| UIC | International Union of Railways |
| 2 × 25 kV | Two-phase 2 × 25 kV AC system |
References
- Oulmakki, O. Impact of Transport Infrastructure on Economic Growth: The Case of Morocco. Doctoral Dissertation, Moulay Ismail University, Meknes, Morocco, 2015. Available online: https://theses.hal.science/tel-01432138 (accessed on 26 February 2026).
- Nishad, D.K.; Tiwari, A.N.; Khalid, S.; Gupta, S.; Shukla, A. AI-based hybrid power quality control system for electric railways using single-phase PV-UPQC with Lyapunov optimization. Sci. Rep. 2025, 15, 2641. [Google Scholar] [CrossRef] [Scilit]
- Cheok, A.D.; Kawamoto, S.; Matsumoto, T.; Obi, H. High-power AC/DC converter and DC/AC inverter for high-speed train applications. In Proceedings of TENCON; IEEE: New York, NY, USA, 2000; Volume 1, p. 423. [Google Scholar] [CrossRef] [Scilit]
- Frelin, W. Impact of Harmonic Pollution on Power Network Equipment. Doctoral Dissertation, Paris-Sud University, Orsay, France, 2009. Available online: https://tel.archives-ouvertes.fr/tel-00441877 (accessed on 26 February 2026).
- Mariscotti, A. Impact of harmonic power terms on energy measurement in AC railways. IEEE Trans. Instrum. Meas. 2020, 69, 6731. [Google Scholar] [CrossRef] [Scilit]
- Hu, H.; Shao, Y.; Tang, L.; Ma, J.; He, Z.; Gao, S. Overview of harmonic and resonance in railway electrification systems. IEEE Trans. Ind. Appl. 2018, 54, 5227–5245. [Google Scholar] [CrossRef] [Scilit]
- Huang, S.-Y.; Chen, B.N. Harmonic study of the Le Blanc transformer for the Taiwan railway electrification system. IEEE Power Eng. Rev. 2002, 22, 59–60. [Google Scholar] [CrossRef] [Scilit]
- Song, K.; Wu, M.; Yang, S.; Liu, Q.; Agelidis, V.G.; Konstantinou, G. High-order harmonic resonances in traction power supplies: A review based on railway operational data, measurements, and experience. IEEE Trans. Power Electron. 2020, 35, 2501–2518. [Google Scholar] [CrossRef] [Scilit]
- Taleb, Y.; Lamrani, R.; Abbou, A. Measurement and evaluation of voltage unbalance in 2 × 25 kV 50 Hz high-speed trains using variable integration period. Electricity 2024, 5, 154–173. [Google Scholar] [CrossRef] [Scilit]
- Li, T.; Shi, Y. Power quality management strategy for high-speed railway traction power supply systems based on MMC-RPC. Energies 2022, 15, 5205. [Google Scholar] [CrossRef] [Scilit]
- Salles, R.S.; Rönnberg, S. Review of distortion–waveform interaction assessment in railway power systems. Energies 2023, 16, 5411. [Google Scholar] [CrossRef] [Scilit]
- Salles, R.S.; Rönnberg, S. Modeling and assessment of grid-side waveform distortion interaction in low-frequency railway electrification systems. Int. J. Electr. Power Energy Syst. 2025, 171, 111039. [Google Scholar] [CrossRef] [Scilit]
- Kaleybar, H.J.; Brenna, M.; Foiadelli, F.; Fazel, S.S.; Zaninelli, D. Power quality phenomena in railway electrification systems: A comprehensive framework and classification. Energies 2020, 13, 6662. [Google Scholar] [CrossRef] [Scilit]
- Olczykowski, Z. Superposition of voltage disturbances generated by DC traction. Energies 2024, 17, 6007. [Google Scholar] [CrossRef] [Scilit]
- Femine, A.D.; Gallo, D.; Giordano, D.; Landi, C.; Luiso, M.; Signorino, D. Power quality assessment in railway traction power supply systems. IEEE Trans. Instrum. Meas. 2020, 69, 2355–2366. [Google Scholar] [CrossRef] [Scilit]
- Femine, A.D.; Gallo, D.; Landi, C.; Luiso, M. Discussion on DC and AC power supply quality assessment in railway traction systems. In Proceedings of the IEEE I2MTC, Auckland, New Zealand, 20–23 May 2019; p. 1. [Google Scholar] [CrossRef] [Scilit]
- Seferi, Y.; Blair, S.M.; Mester, C.; Stewart, B. Power quality and active harmonic power measurement in 25 kV 50 Hz AC railway systems. Energies 2020, 13, 5698. [Google Scholar] [CrossRef] [Scilit]
- Seferi, Y.; Clarkson, P.; Blair, S.M.; Mariscotti, A.; Stewart, B. Power quality event analysis in 25 kV 50 Hz AC railway networks. In Proceedings of the AMPS, Aachen, Germany, 25–27 September 2019. [Google Scholar] [CrossRef] [Scilit]
- Liu, S.; Zhao, Y.; Xu, T.; Tian, Y.; Ding, Y. Research on electromagnetic power quality: Integrated treatment device applied to high-speed railway traction power supply systems. In Proceedings of SPIE; IEEE: New York, NY, USA, 2024; Volume 17, p. 317. [Google Scholar] [CrossRef] [Scilit]
- European Committee for Electrotechnical Standardization. Voltage Characteristics of Electricity Supplied by Public Electricity Networks; CENELEC: Brussels, Belgium, 2020. [Google Scholar]
- Olczykowski, Z.; Starula, P. Power supply quality in traction substation circuits. J. Civ. Transp. Eng. 2023, 5, 29–52. [Google Scholar] [CrossRef] [Scilit]
- Fırat, G.; Yang, G.; Al-Ali, H.A.H. Comparative study of different transformer connections for railway power supply: Voltage unbalance mitigation. In 10th International Conference on Advances in Power System Control, Operation & Management (APSCOM 2015); IET Conference Proceedings; IET: Stevenage, UK, 2015. [Google Scholar] [CrossRef] [Scilit]
- IEC 61000-4-30; Electromagnetic Compatibility (EMC)—Part 4-30: Testing and Measurement Techniques—Power Quality Measurement Methods (Ed. 3.0). International Electrotechnical Commission (IEC): Geneva, Switzerland, 2015.
- IEC 61000-4-7; Electromagnetic Compatibility (EMC)—Part 4-7: Testing and Measurement Techniques—General Guide on Harmonics and Interharmonics Measurements and Instrumentation (Ed. 2.0). International Electrotechnical Commission (IEC): Geneva, Switzerland, 2009.
- Tulsky, V.N.; Shevlyugin, M.V.; Korolev, A.; Subhanverdiev, K.; Murzintsev, A.; Zhgun, K.; Silaev, M.; Khripushkine, N.; Baembitov, R. Application of ETAP™ eTraX™ software for numerical simulation of a distribution network supplying an AC traction power system. E3S Web Conf. 2020, 209, 07011. [Google Scholar] [CrossRef] [Scilit]
- Taleb, Y.; Bouzbiba, A.; Abbou, A. Design of a power quality analyzer using an Arduino board and signal display in the LabVIEW environment. In Digital Technologies and Applications: Proceedings of ICDTA’22; Springer: Berlin/Heidelberg, Germany, 2022; pp. 706–717. [Google Scholar]
- Bouzbiba, A.; Taleb, Y.; Abbou, A. Power quality analysis of a photovoltaic power plant connected to the distribution network: A case study of a 2 MWp photovoltaic power plant. Int. Rev. Electr. Eng. 2024, 19, 188–196. [Google Scholar] [CrossRef] [Scilit]
- Taleb, Y.; Lamrani, R.; Abbou, A. Study of current harmonics generated by two-phase loads on an HV transmission power grid: A case study of a substation supplying high-speed rail. Int. Rev. Electr. Eng. 2023, 18, 265–274. [Google Scholar] [CrossRef] [Scilit]
- Taleb, Y.; Lamrani, R.; Touil, R.; Abbou, A. Optimizing power quality on high-speed rail networks: Advances in measurement and evaluation methods. EPJ Web Conf. 2025, 330, 03011. [Google Scholar] [CrossRef] [Scilit]
- IEC 61000-2-2:2018; Electromagnetic Compatibility (EMC)—Part 2-2: Environment—Compatibility Levels for Low-Frequency Conducted Disturbances and Signalling in Public Low-Voltage Power Supply Systems. International Electrotechnical Commission (IEC): Geneva, Switzerland, 2018.
- International Union of Railways. UIC Code 612—Power Supply Installations for Traction Systems; UIC: Paris, France, 2015. [Google Scholar]
- Cetina, R.Q.; Roscoe, A.; Wright, P. A review of electrical metering accuracy standards in the context of dynamic power quality conditions of the grid. In Proceedings of the UPEC, Heraklion, Greece, 28–31 August 2017. [Google Scholar] [CrossRef] [Scilit]
- Carta, D.; Muscas, C.; Pegoraro, P.A.; Sulis, S. Identification and estimation of harmonic sources based on compressive sensing. IEEE Trans. Instrum. Meas. 2019, 68, 95–104. [Google Scholar] [CrossRef] [Scilit]
- Docquier, T. Methodologies for Performance Evaluation of Smart Grid Network Architectures. Doctoral Dissertation, University of Lorraine, Nancy, France, 2021. Available online: https://hal.science/tel-03572299v1/file/manuscrit_these_theo_docquier.pdf (accessed on 26 February 2026).
- Brahimi, M. Development of a PHM Approach for Railway Infrastructure. Doctoral Dissertation, University Bourgogne Franche-Comté, Dijon, France, 2018. Available online: https://theses.hal.science/tel-04620219/document (accessed on 26 February 2026).
- El Abboubi, A. Evaluation of the Energy Consumption of a Railway Beacon. Doctoral Dissertation, Polytechnic University of Hauts-de-France, Valenciennes, France, 2016. Available online: https://theses.hal.science/tel-01360271/file/EL_ABBOUBI_Adil2.pdf (accessed on 26 February 2026).
- Lee, S.; Kim, J.; Park, Y. Dynamic voltage unbalance monitoring for railway traction systems using advanced power quality indices. Electr. Power Syst. Res. 2021, 192, 106897. [Google Scholar] [CrossRef] [Scilit]
- Fortescue, C.L. Method of symmetrical coordinates applied to the solution of polyphase networks. Trans. Am. Inst. Electr. Eng. 1918, 37, 1027–1140. [Google Scholar] [CrossRef] [Scilit]
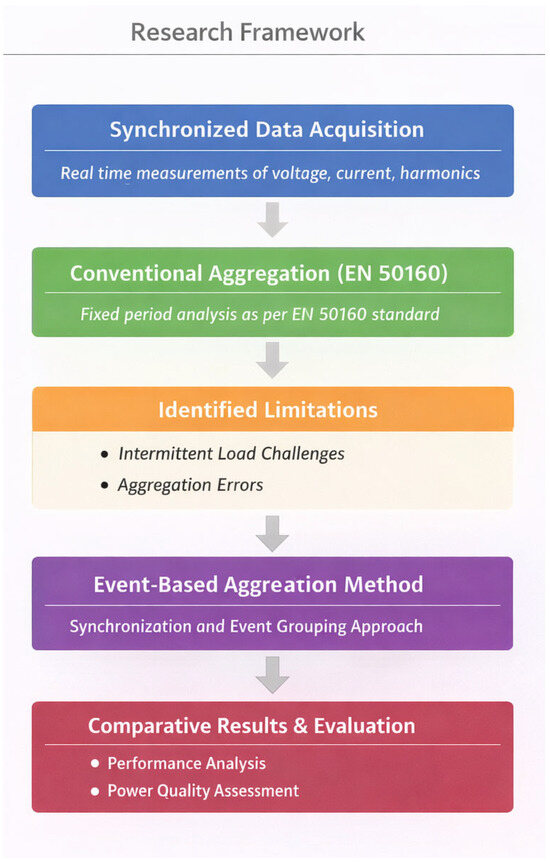
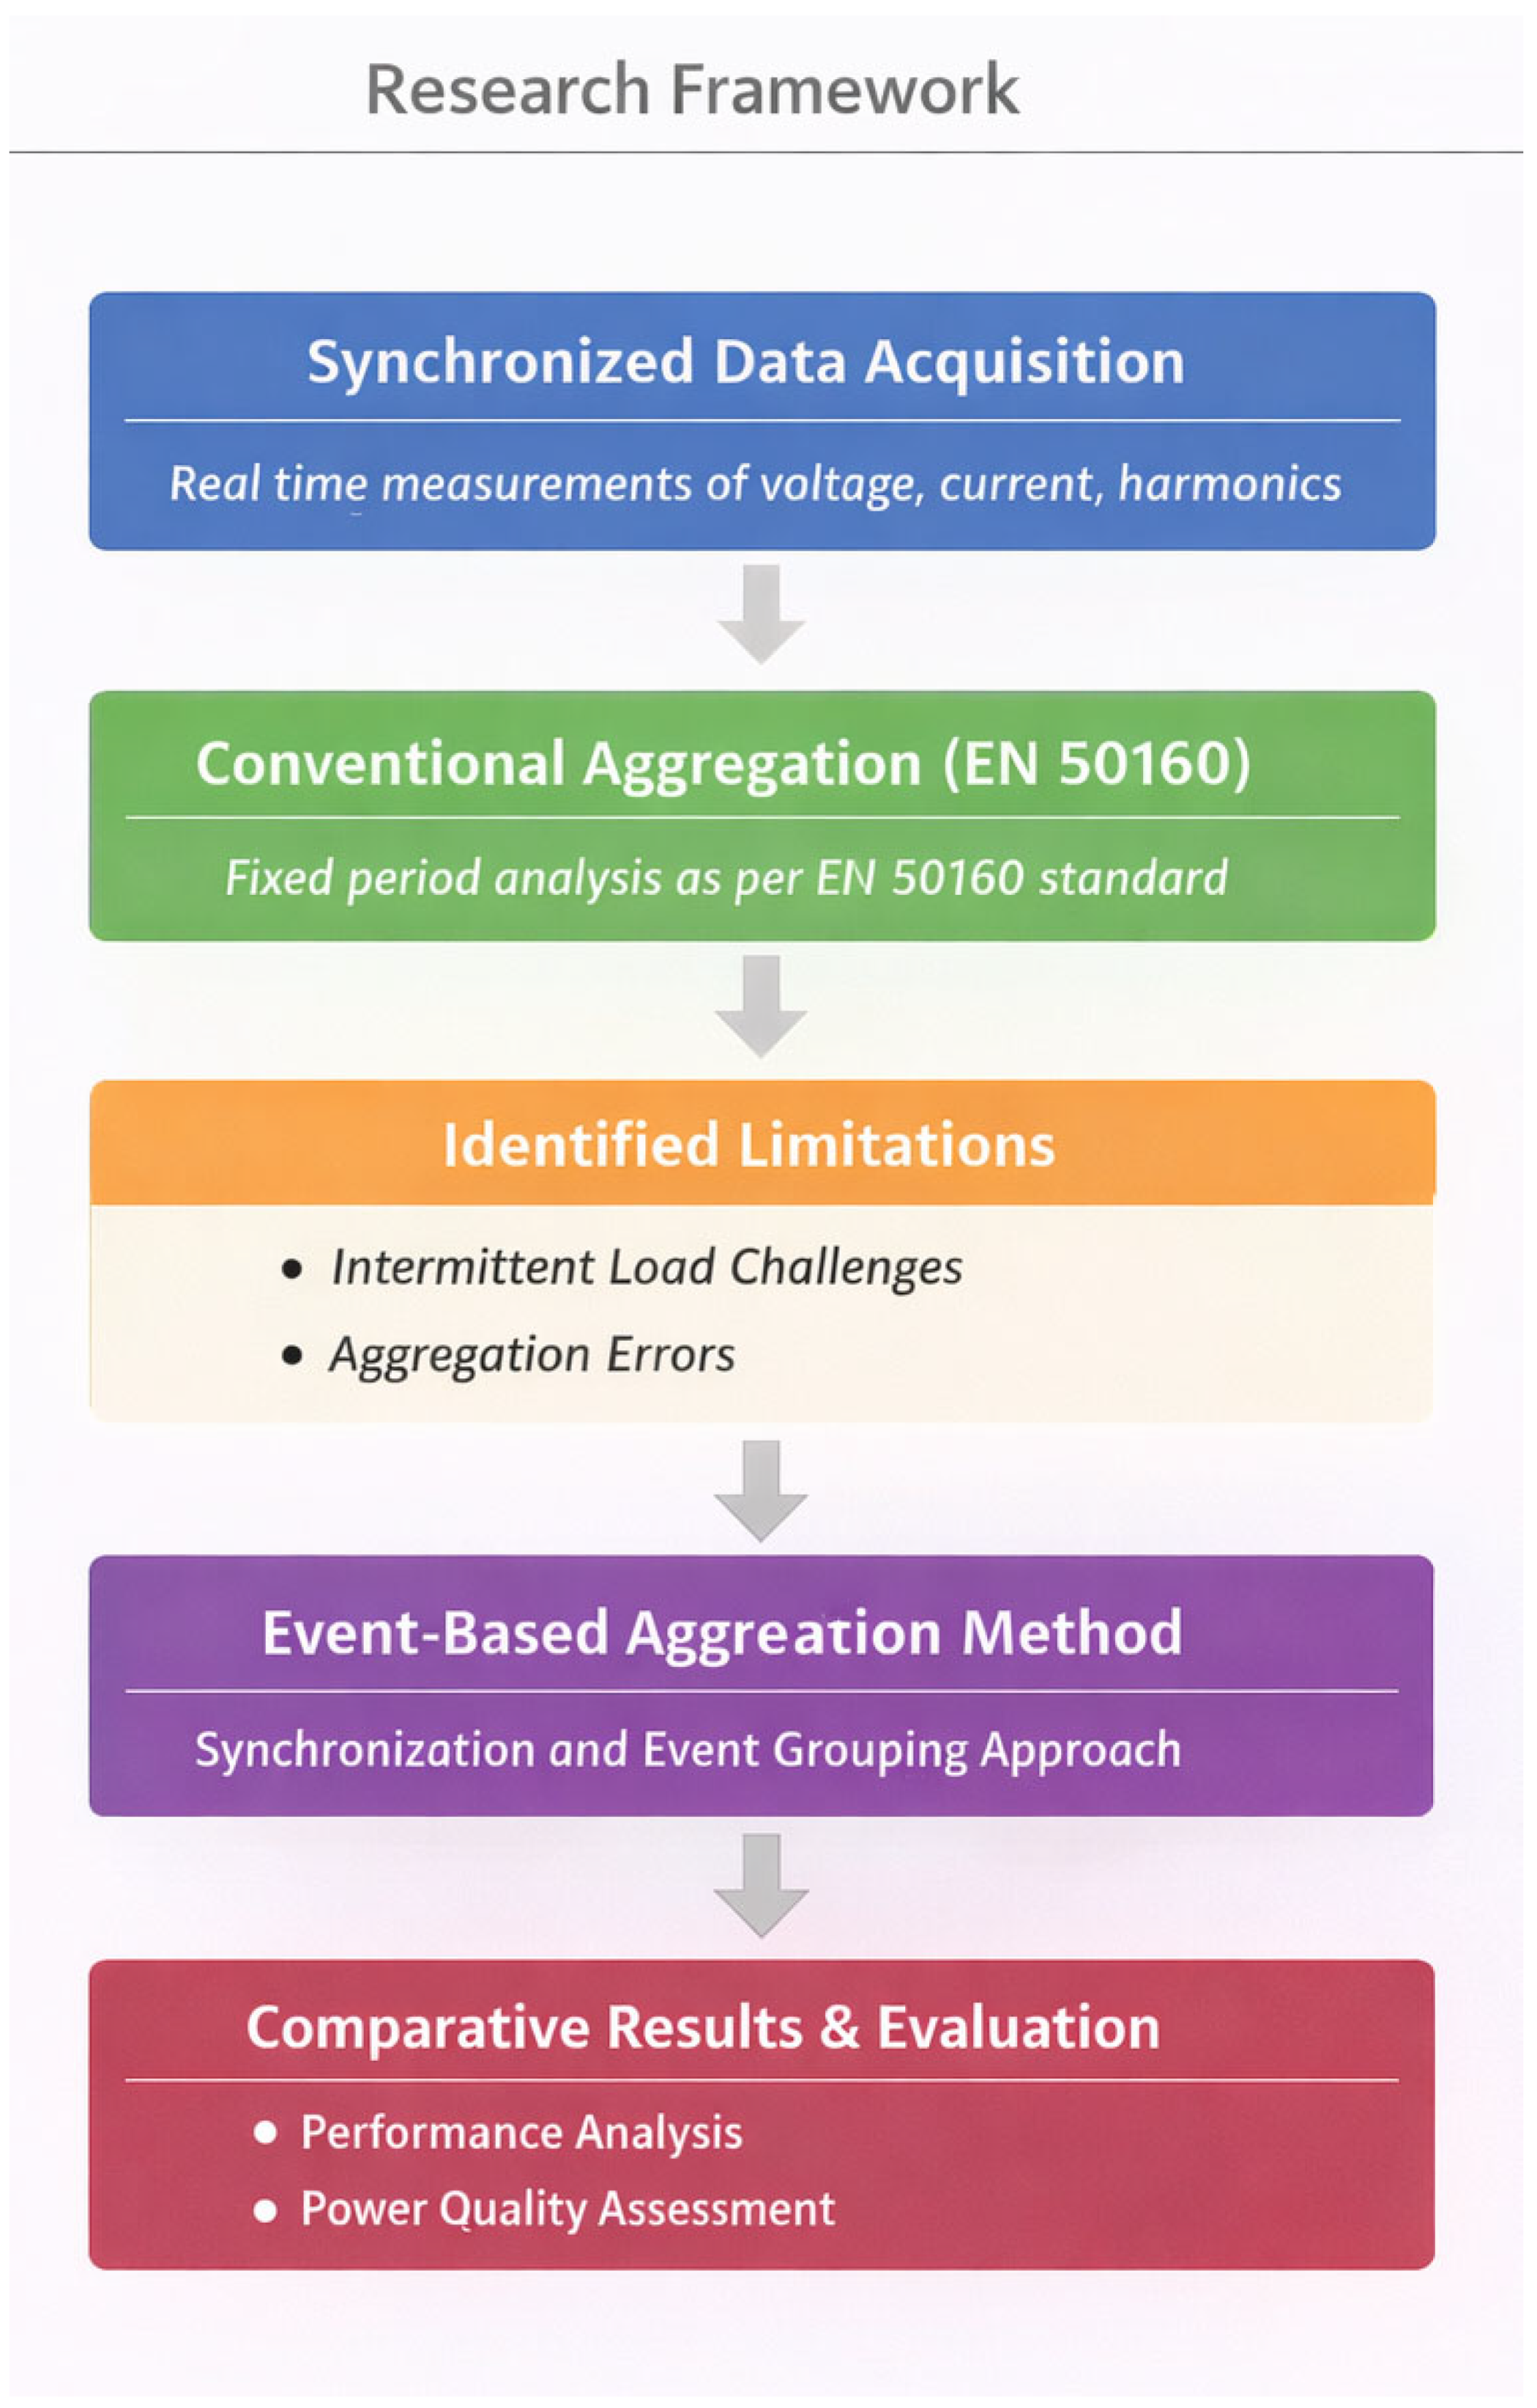
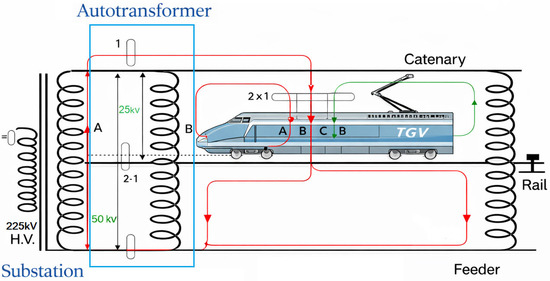
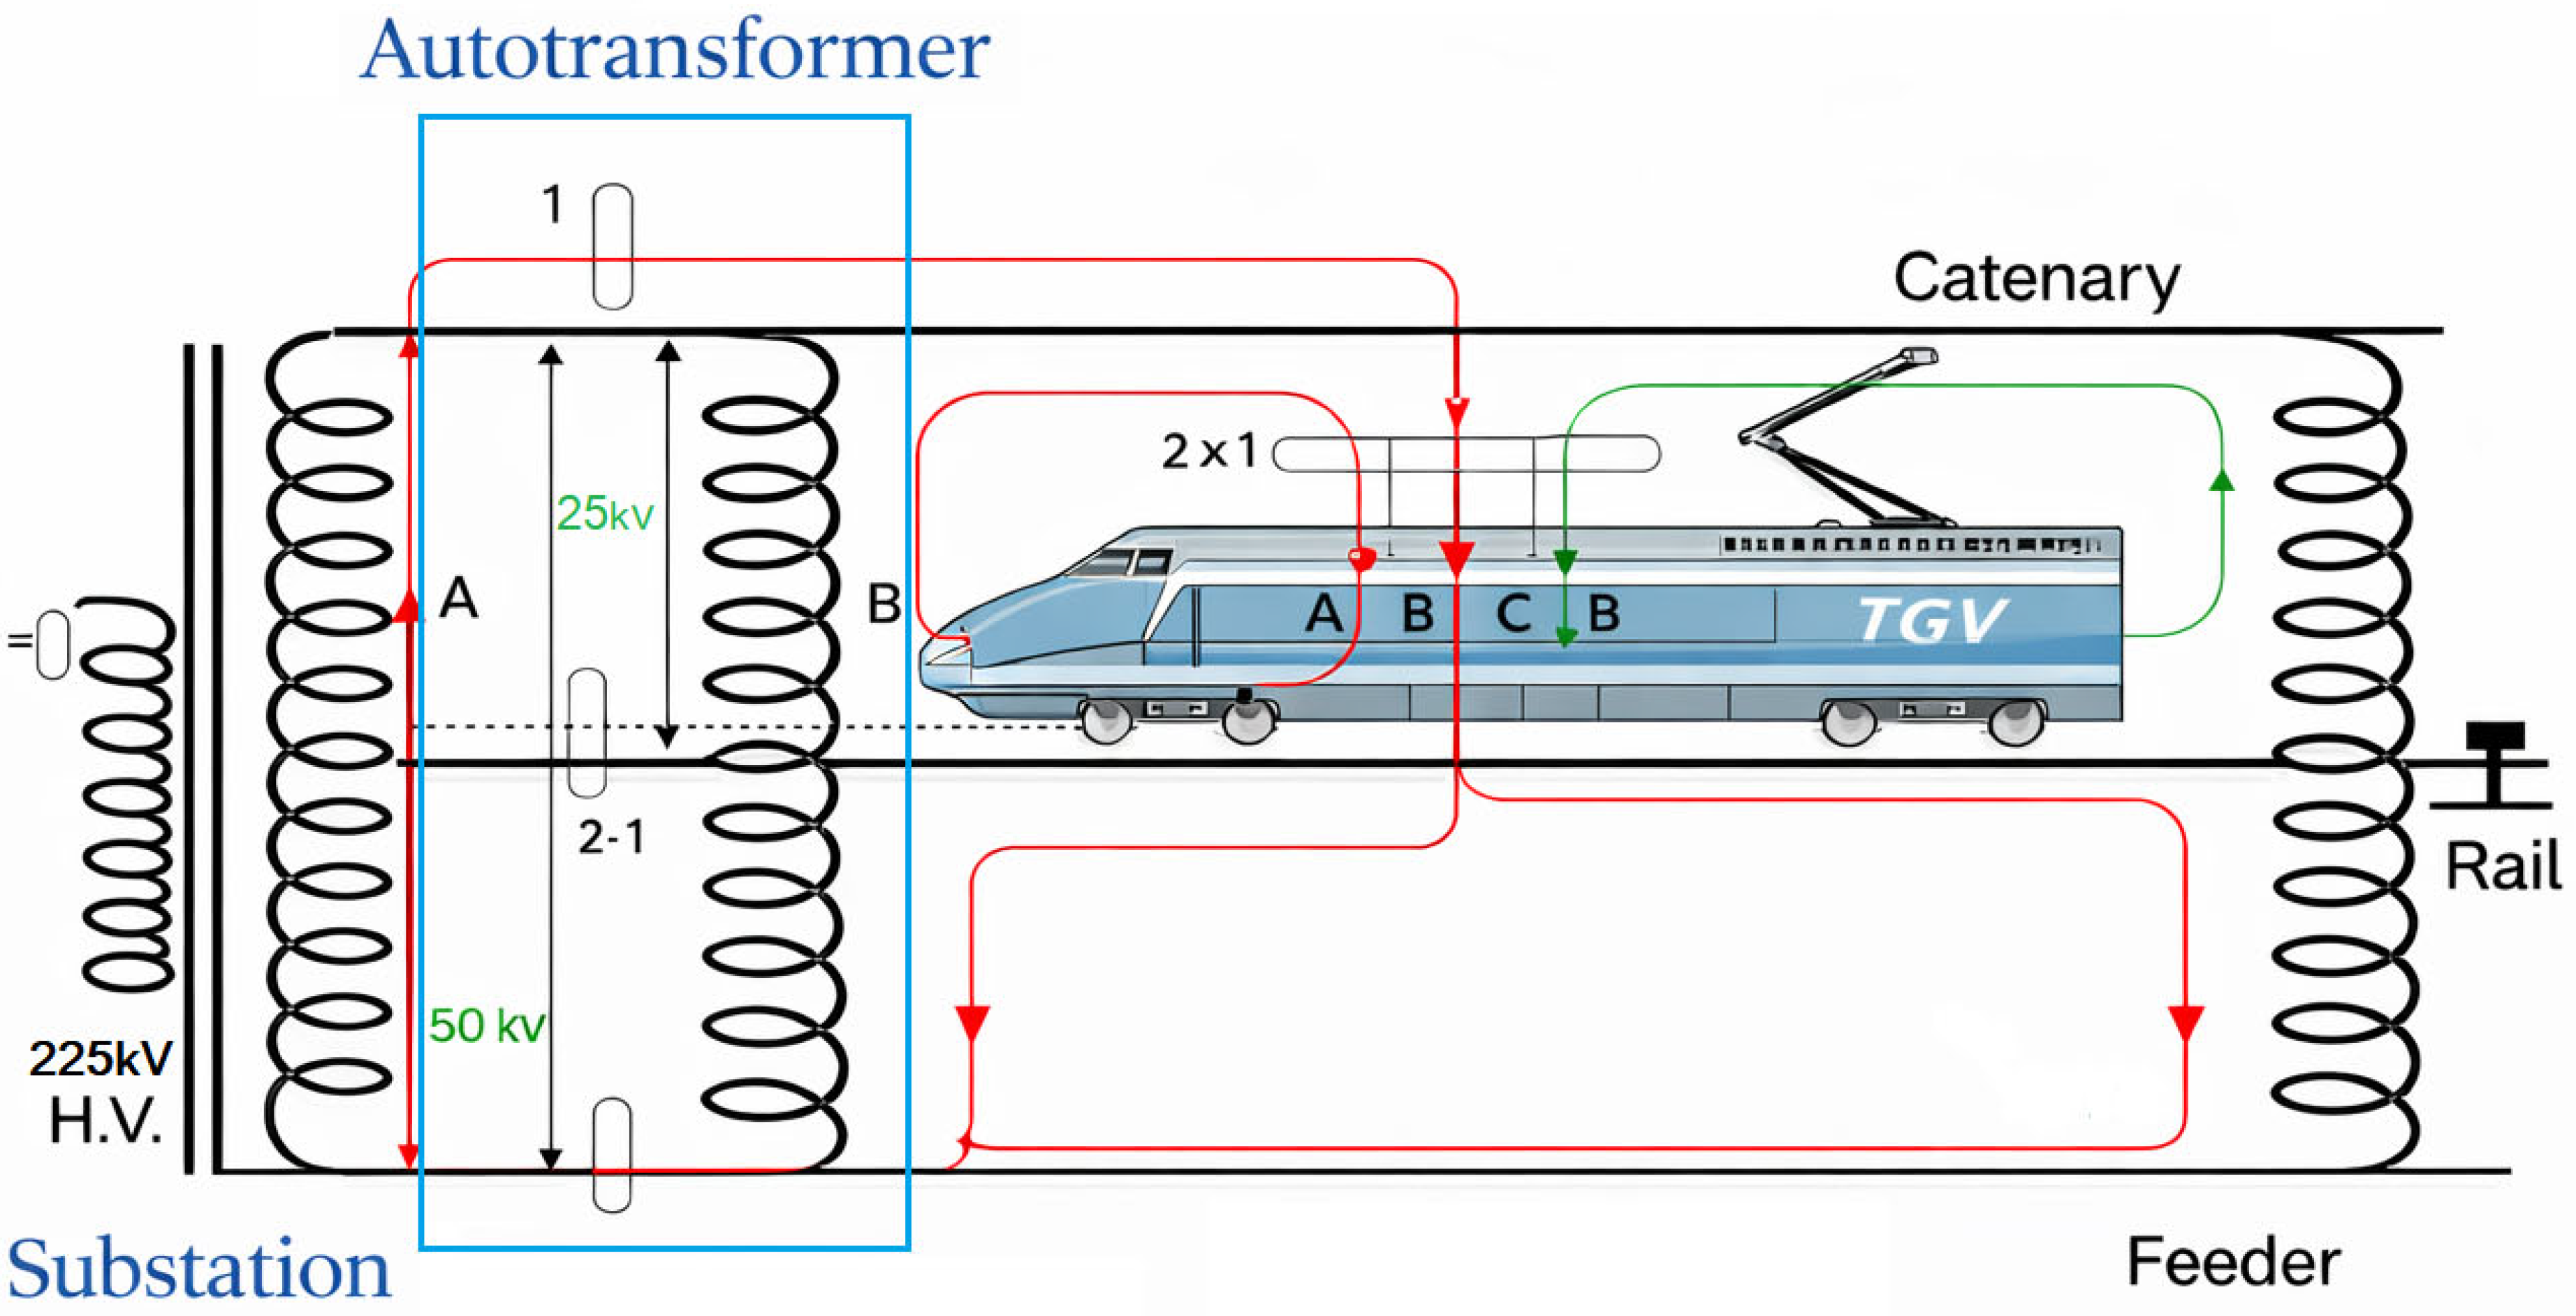
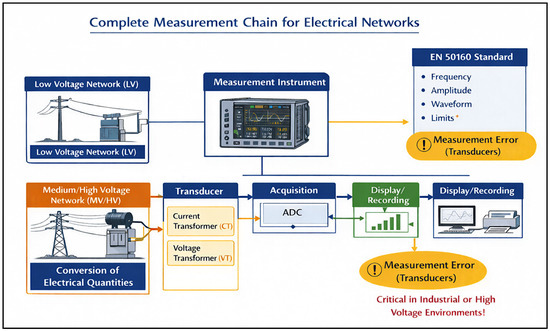
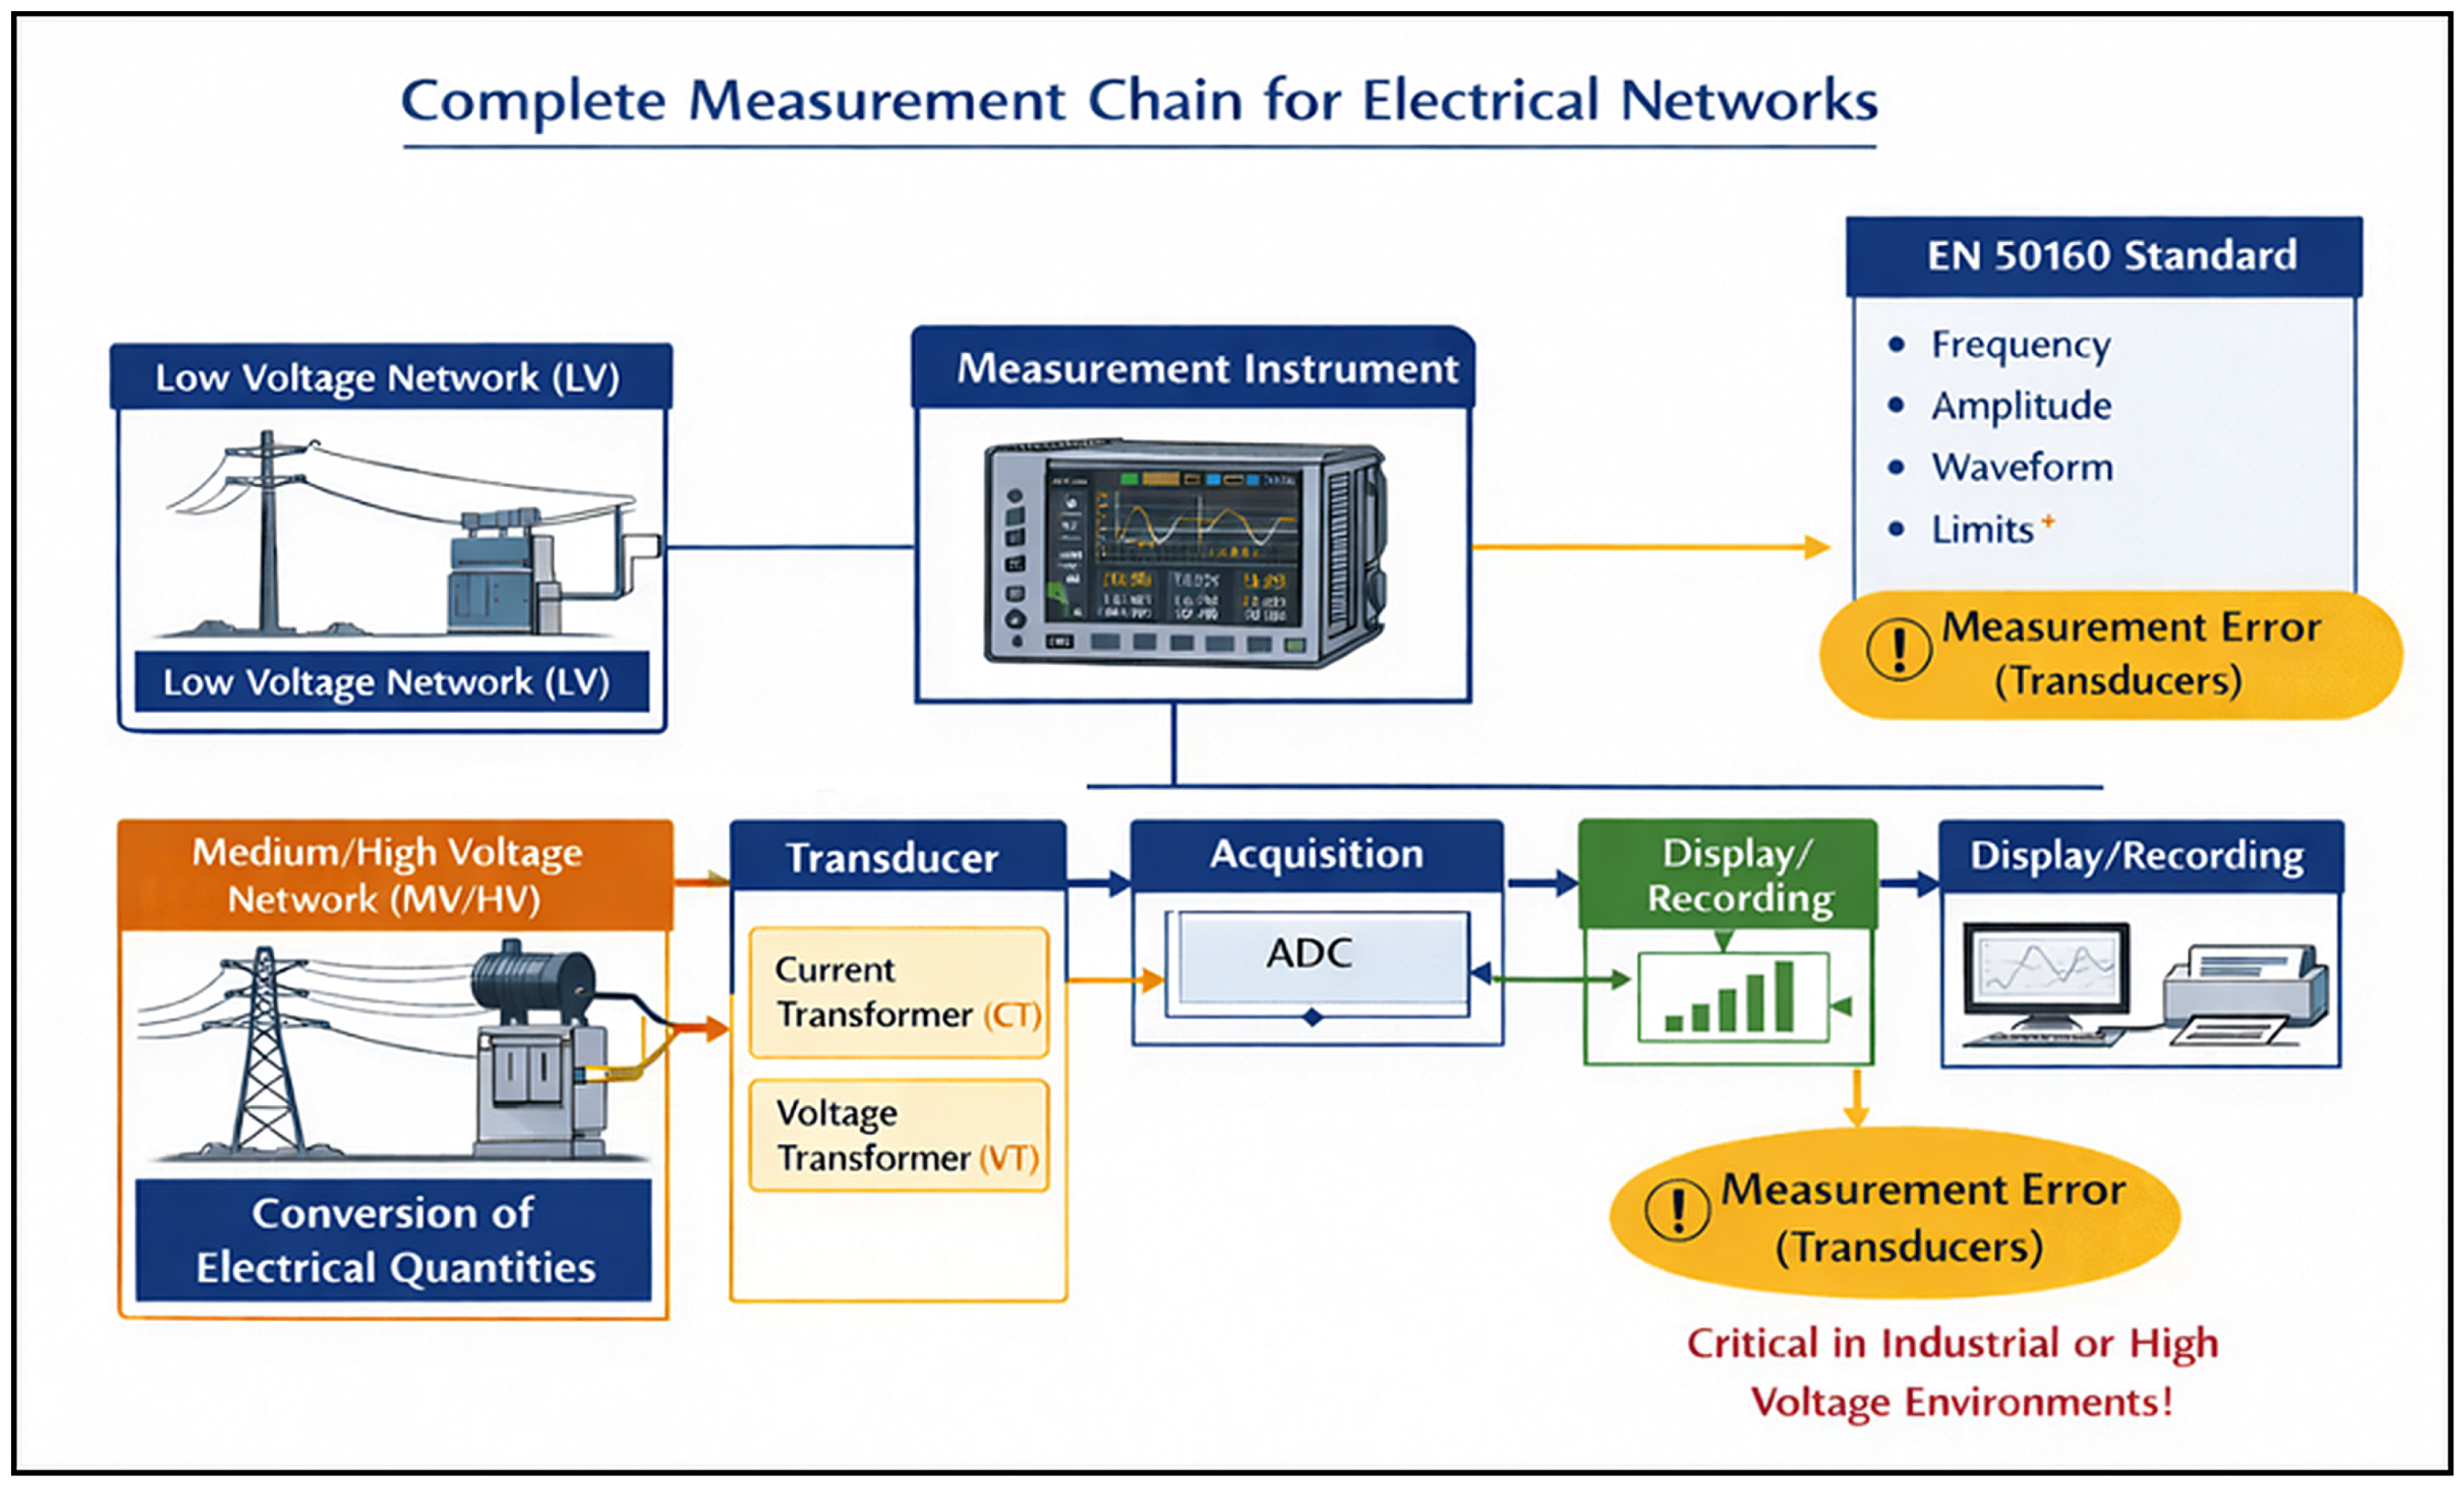
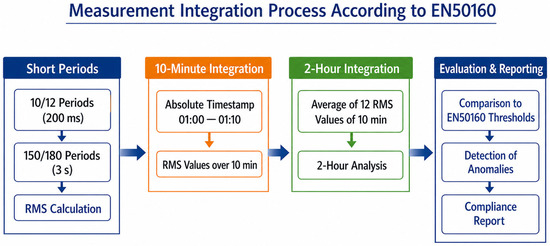
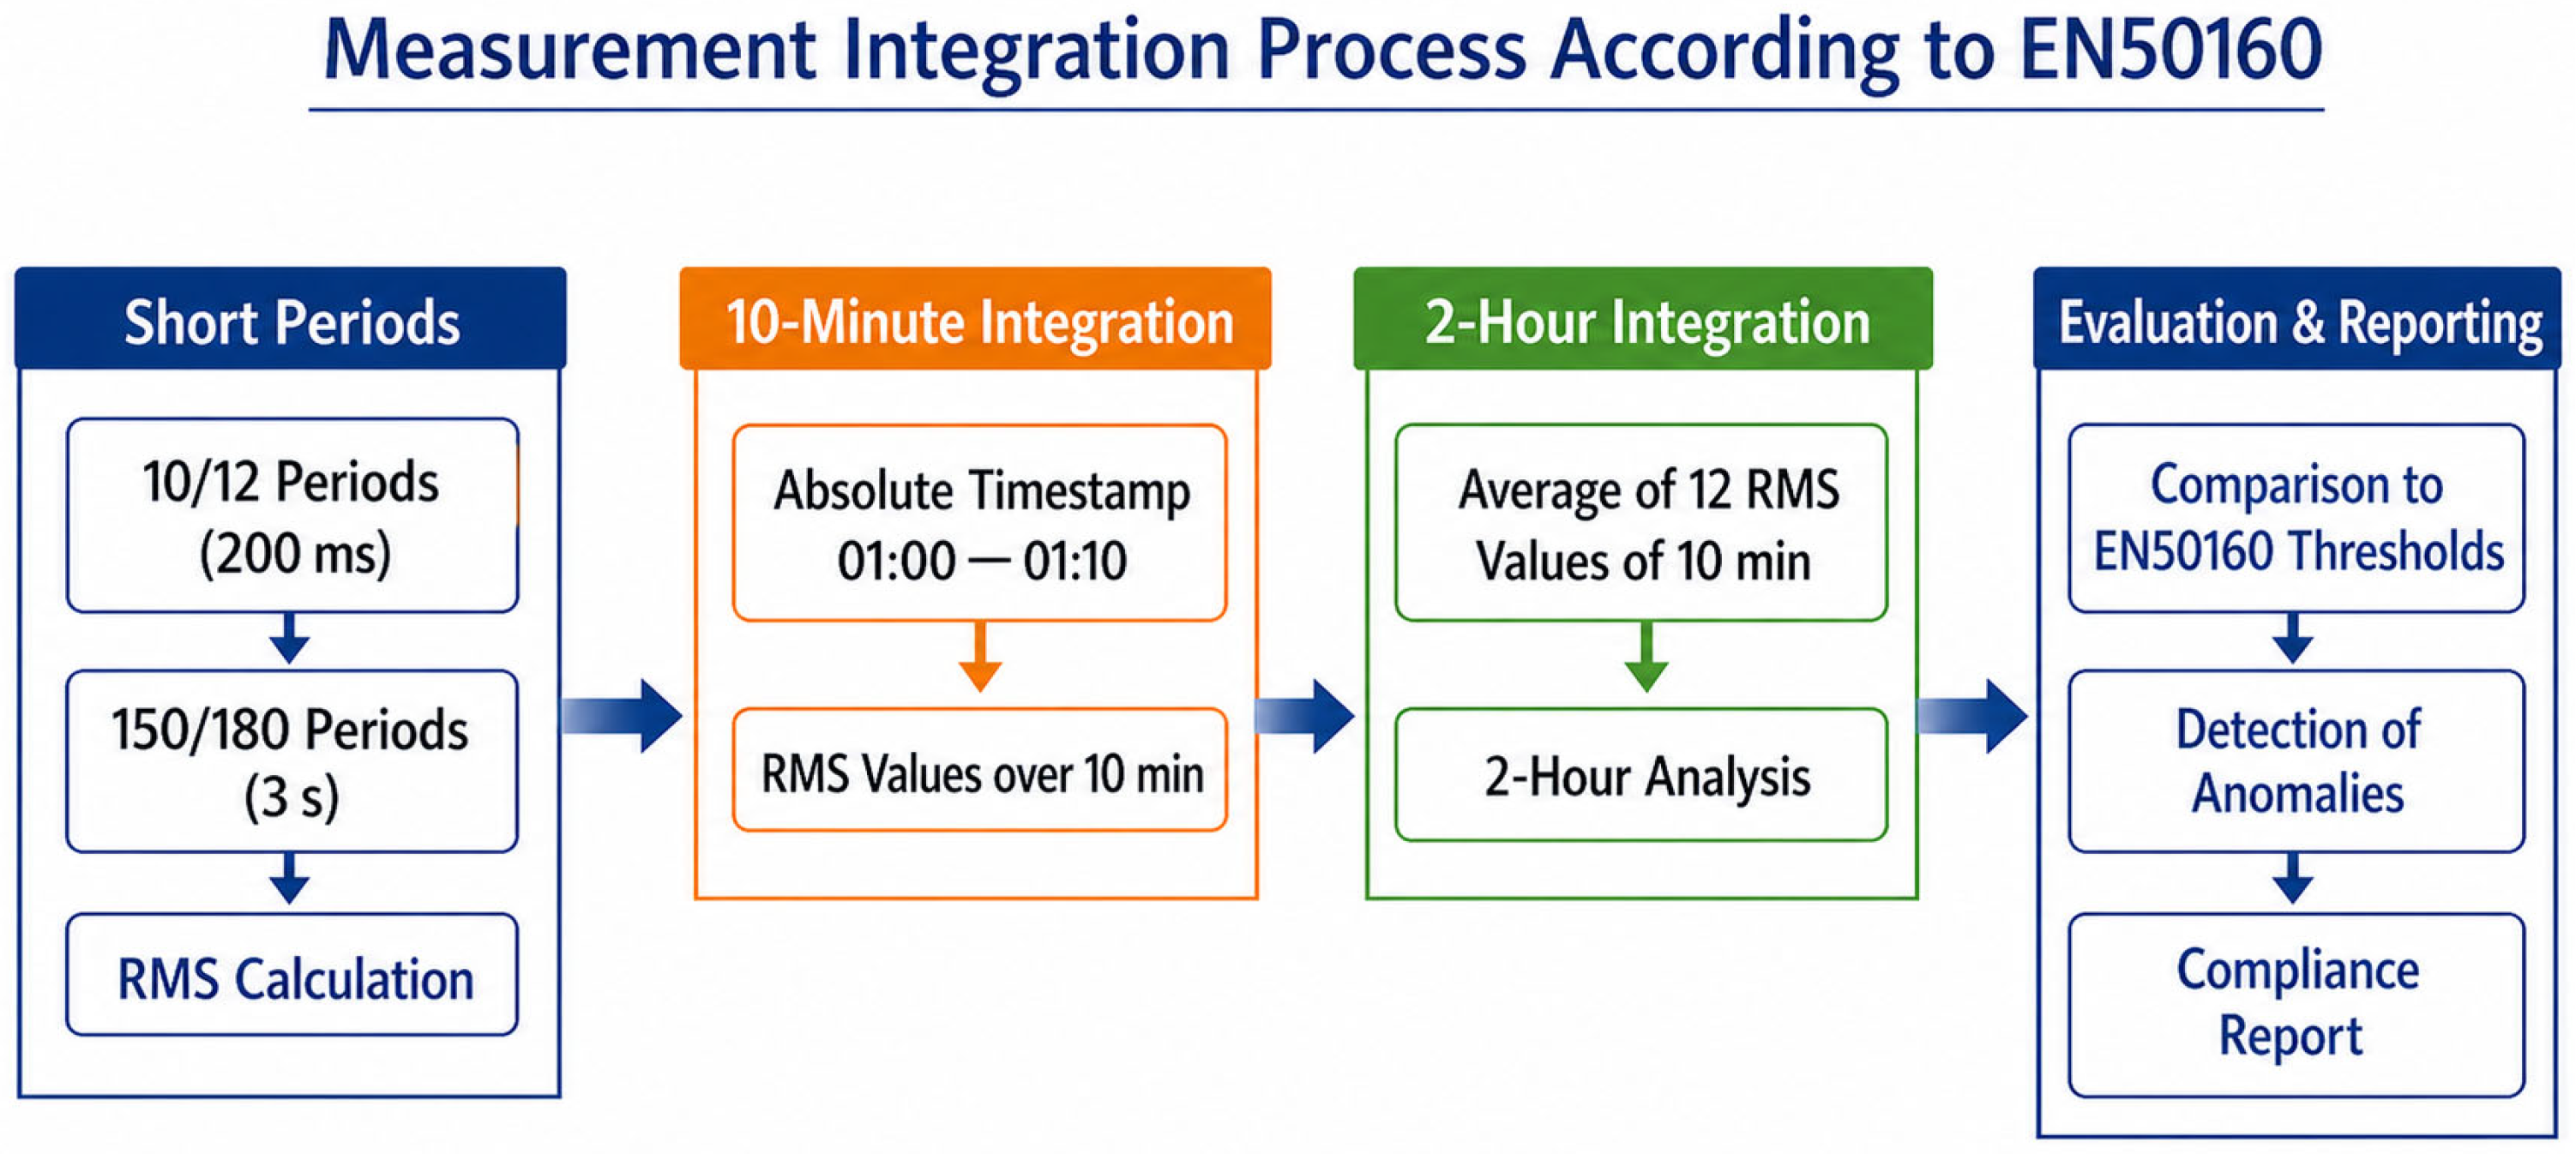
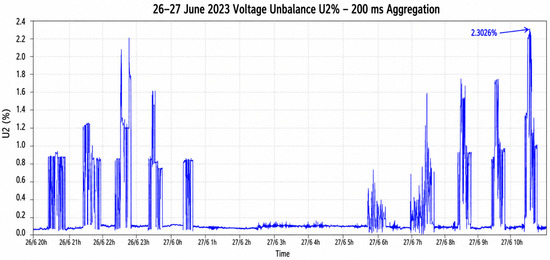
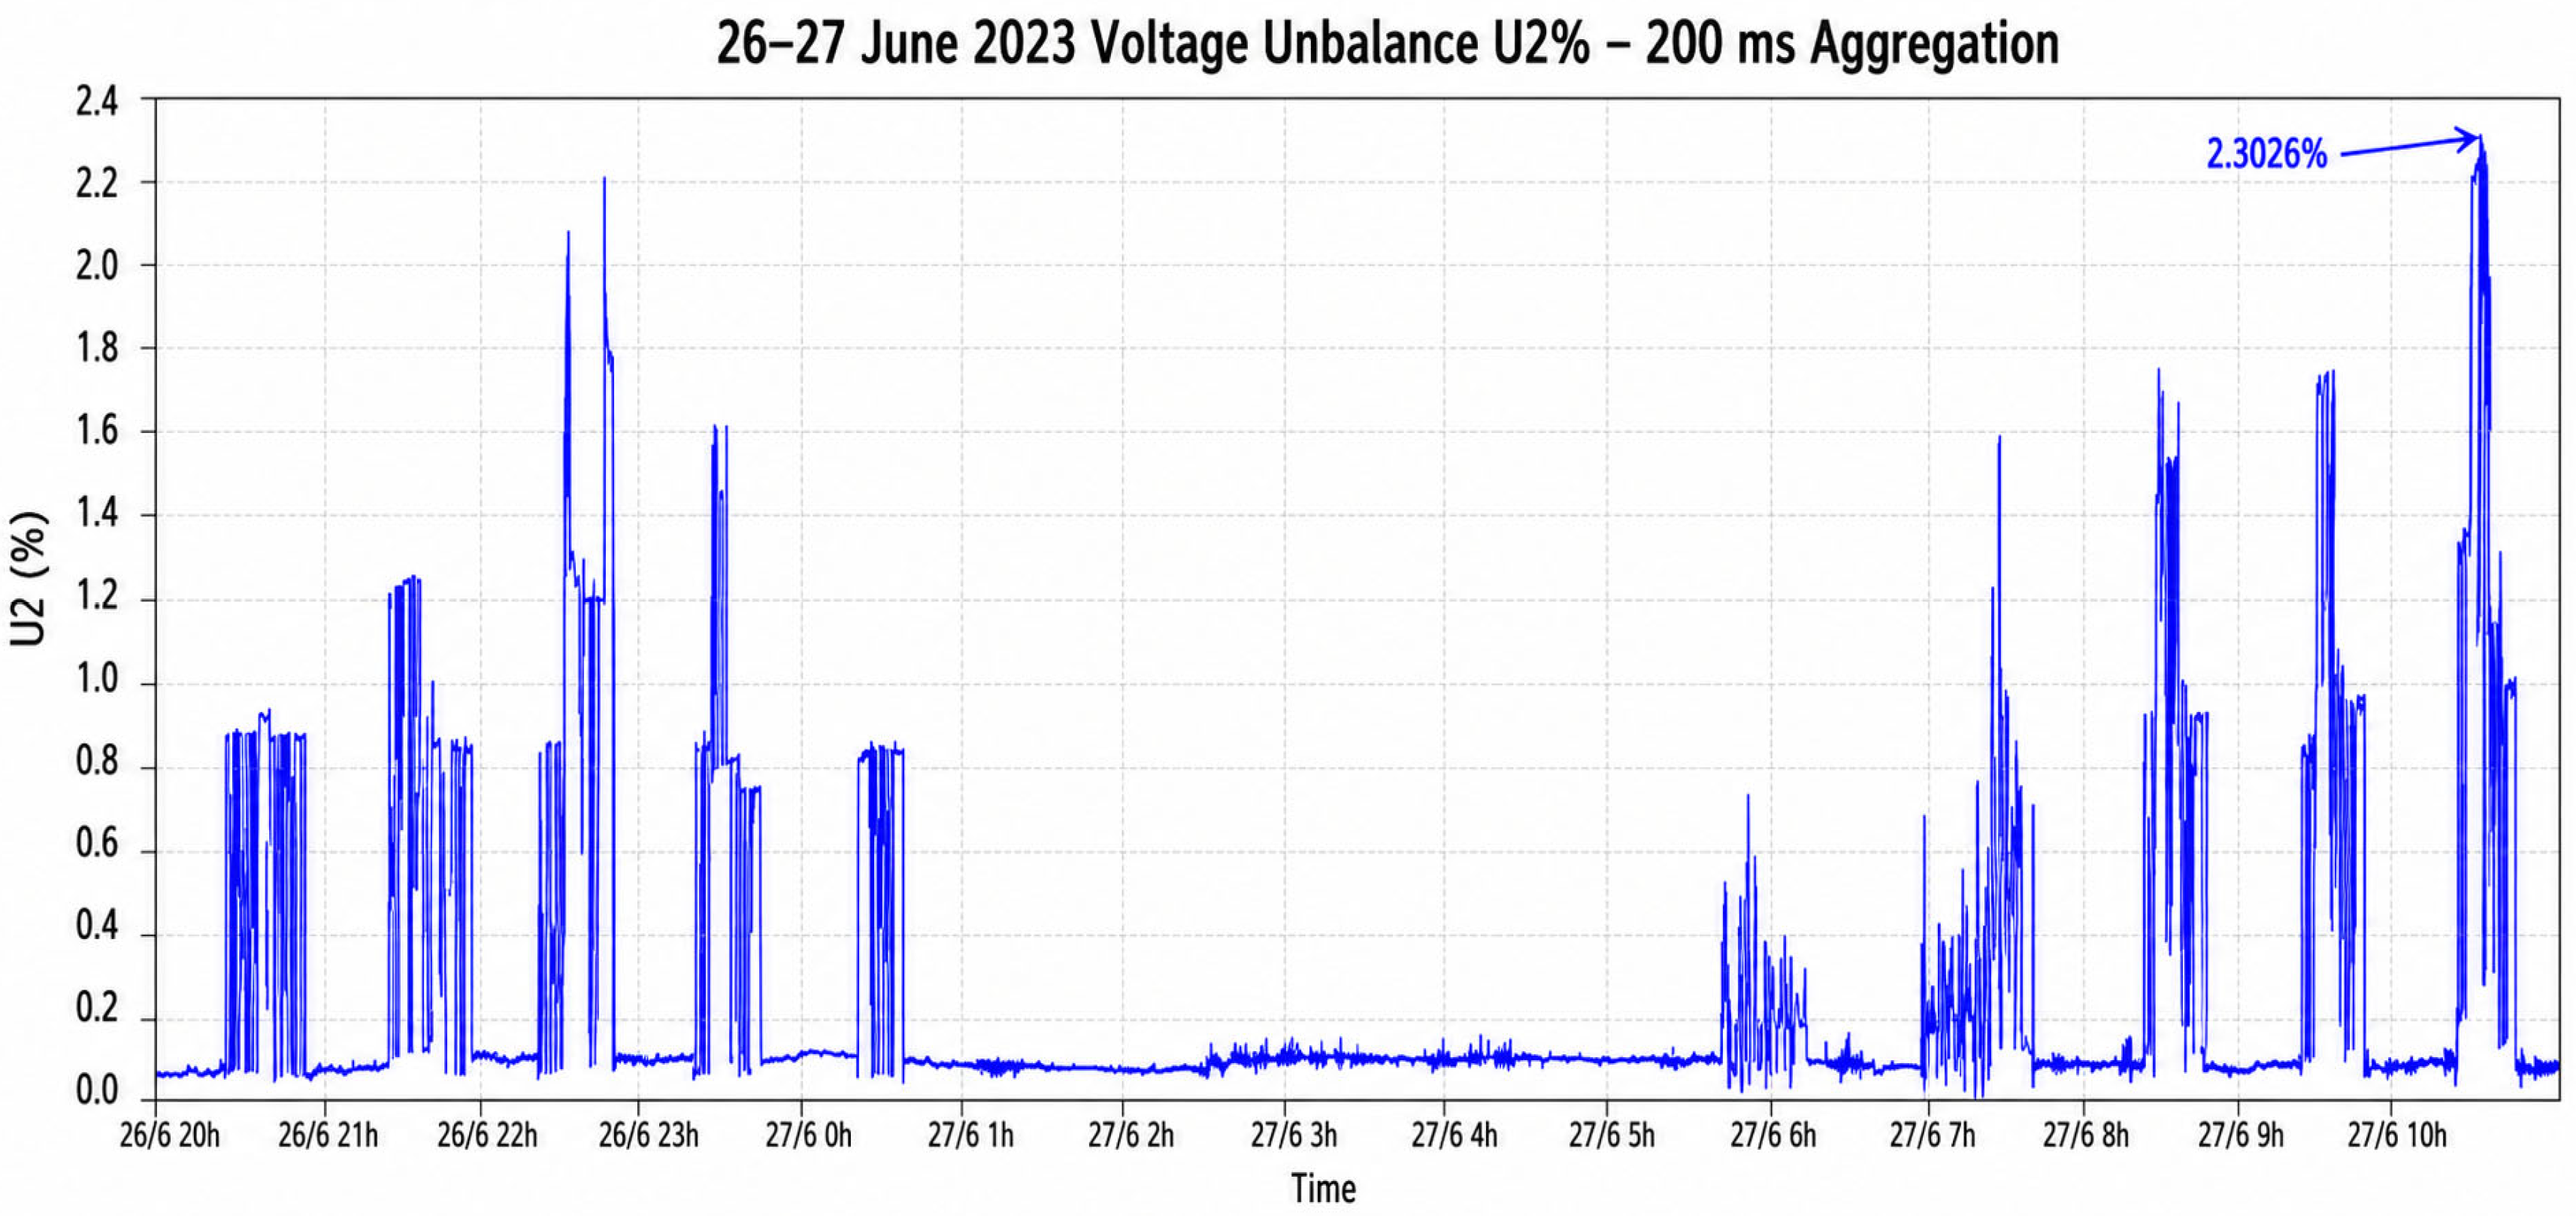
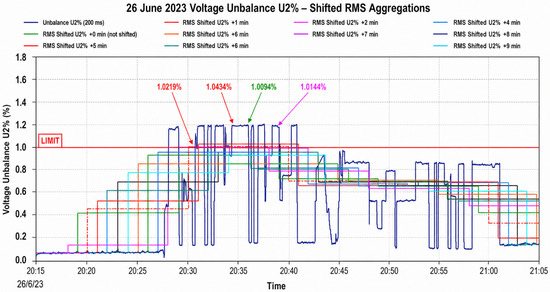
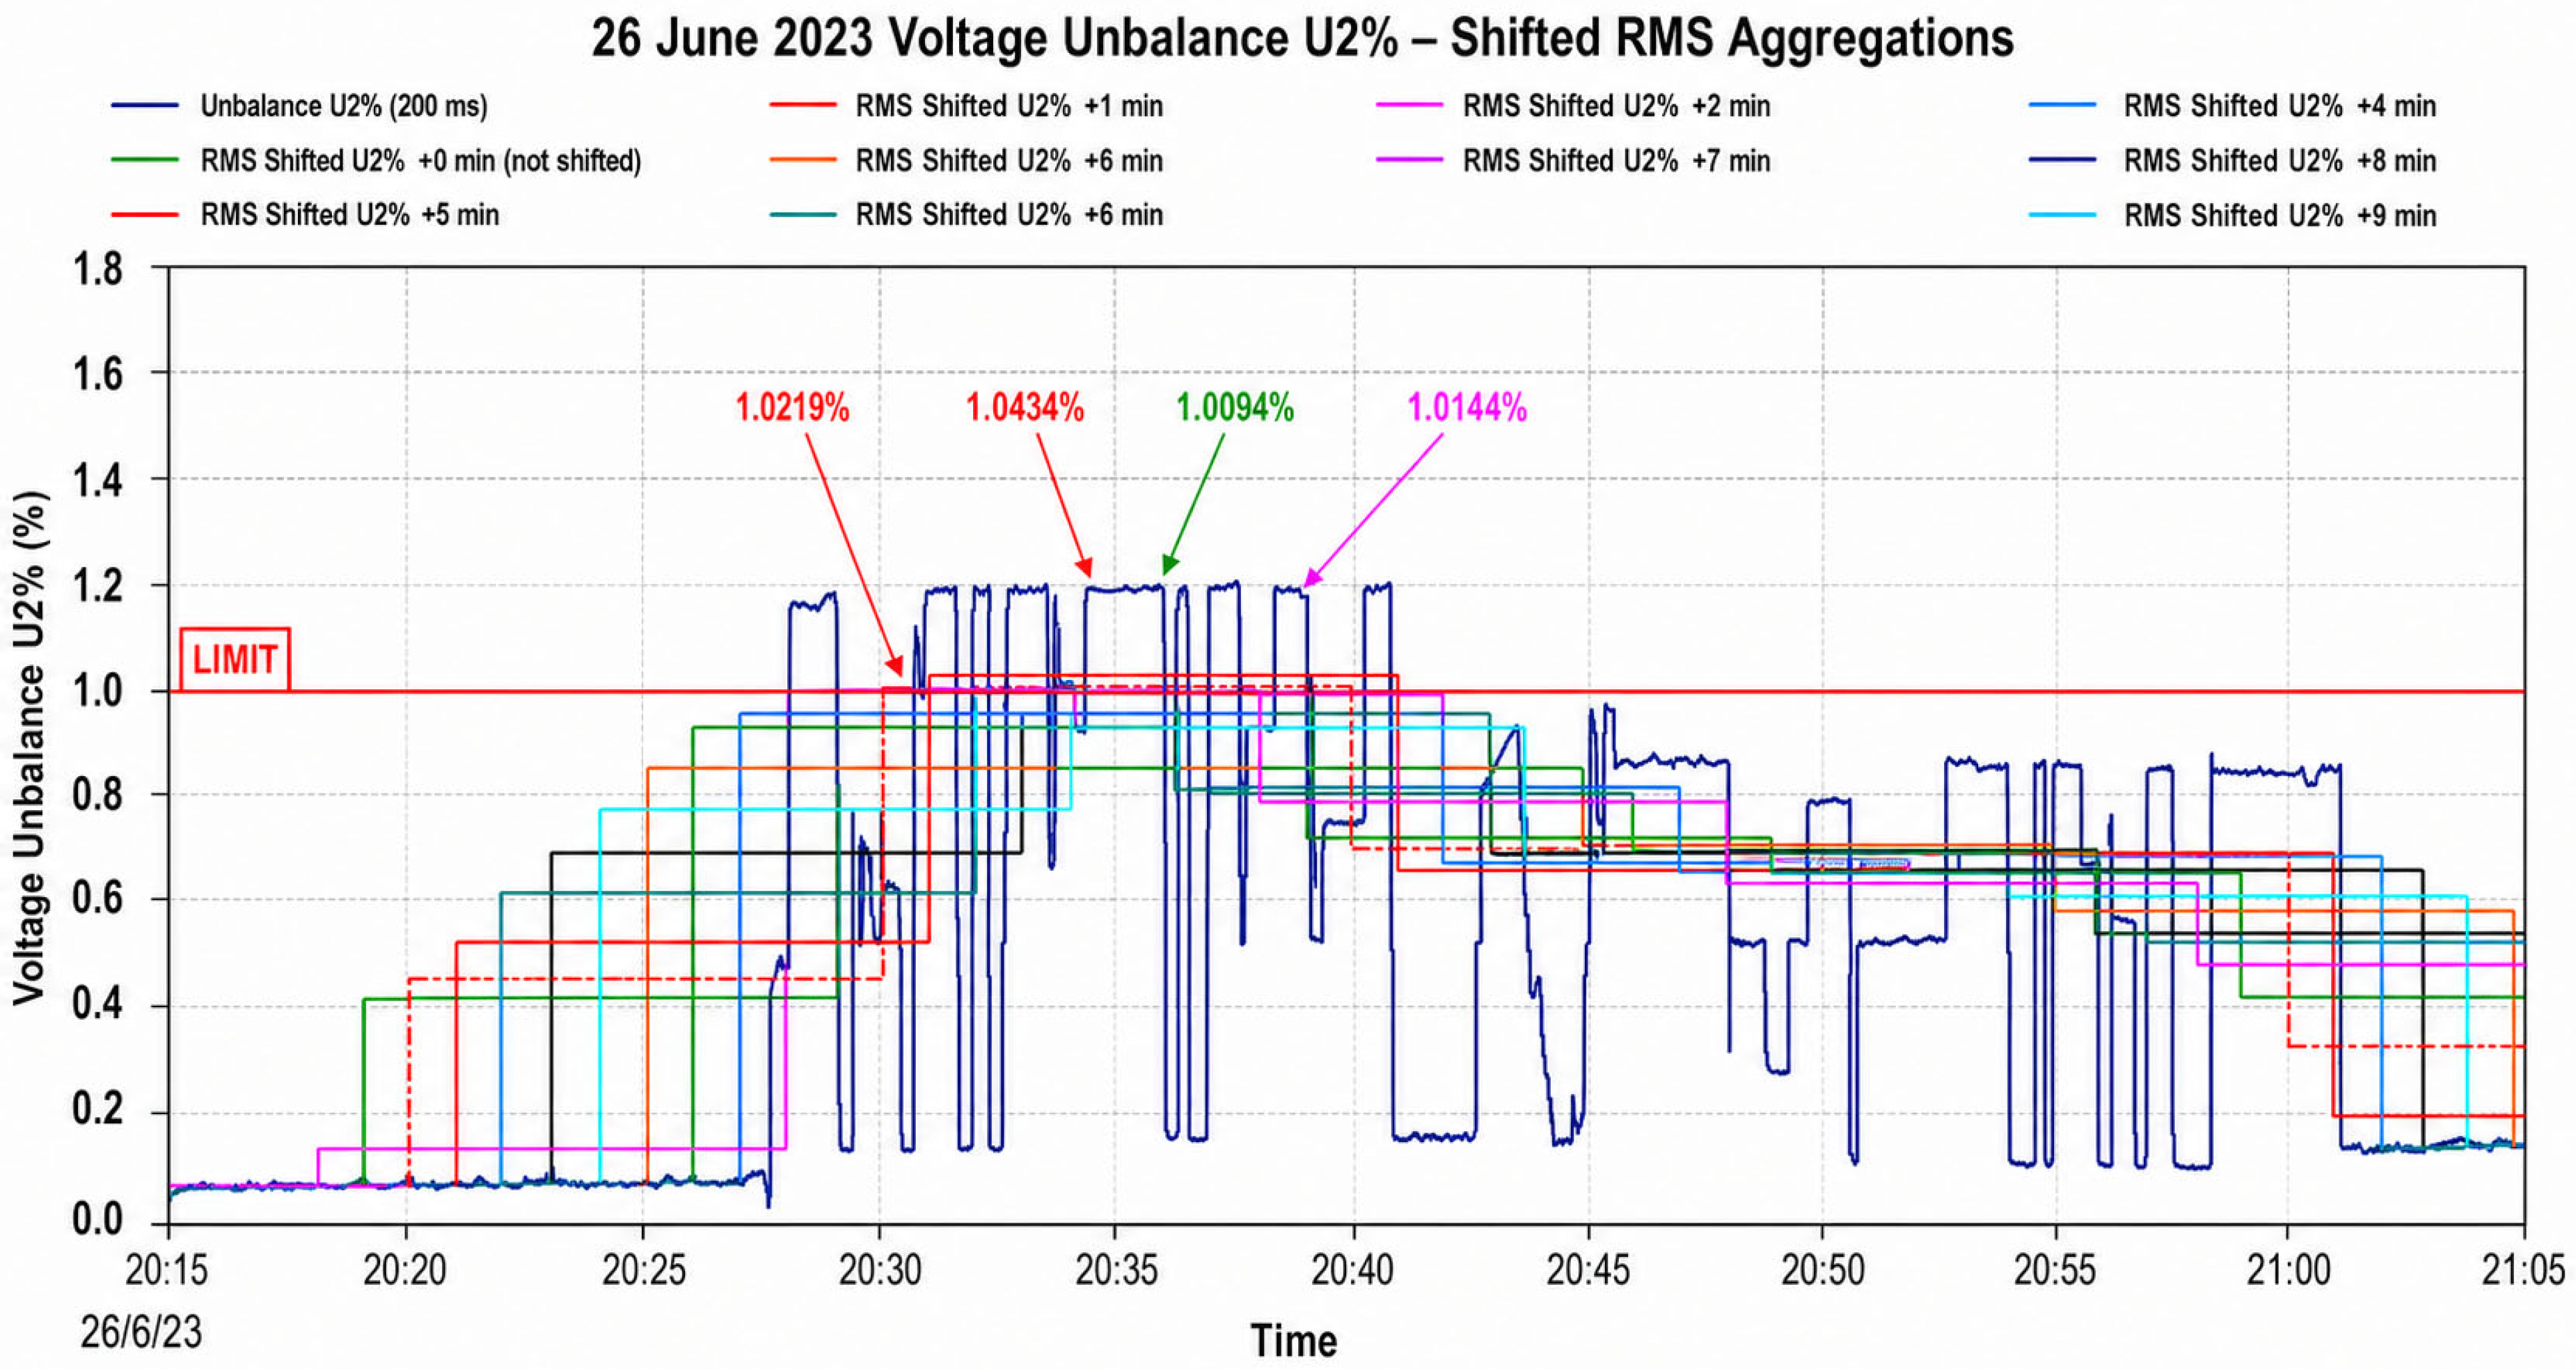
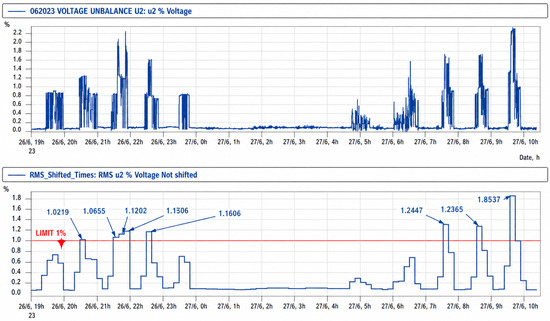
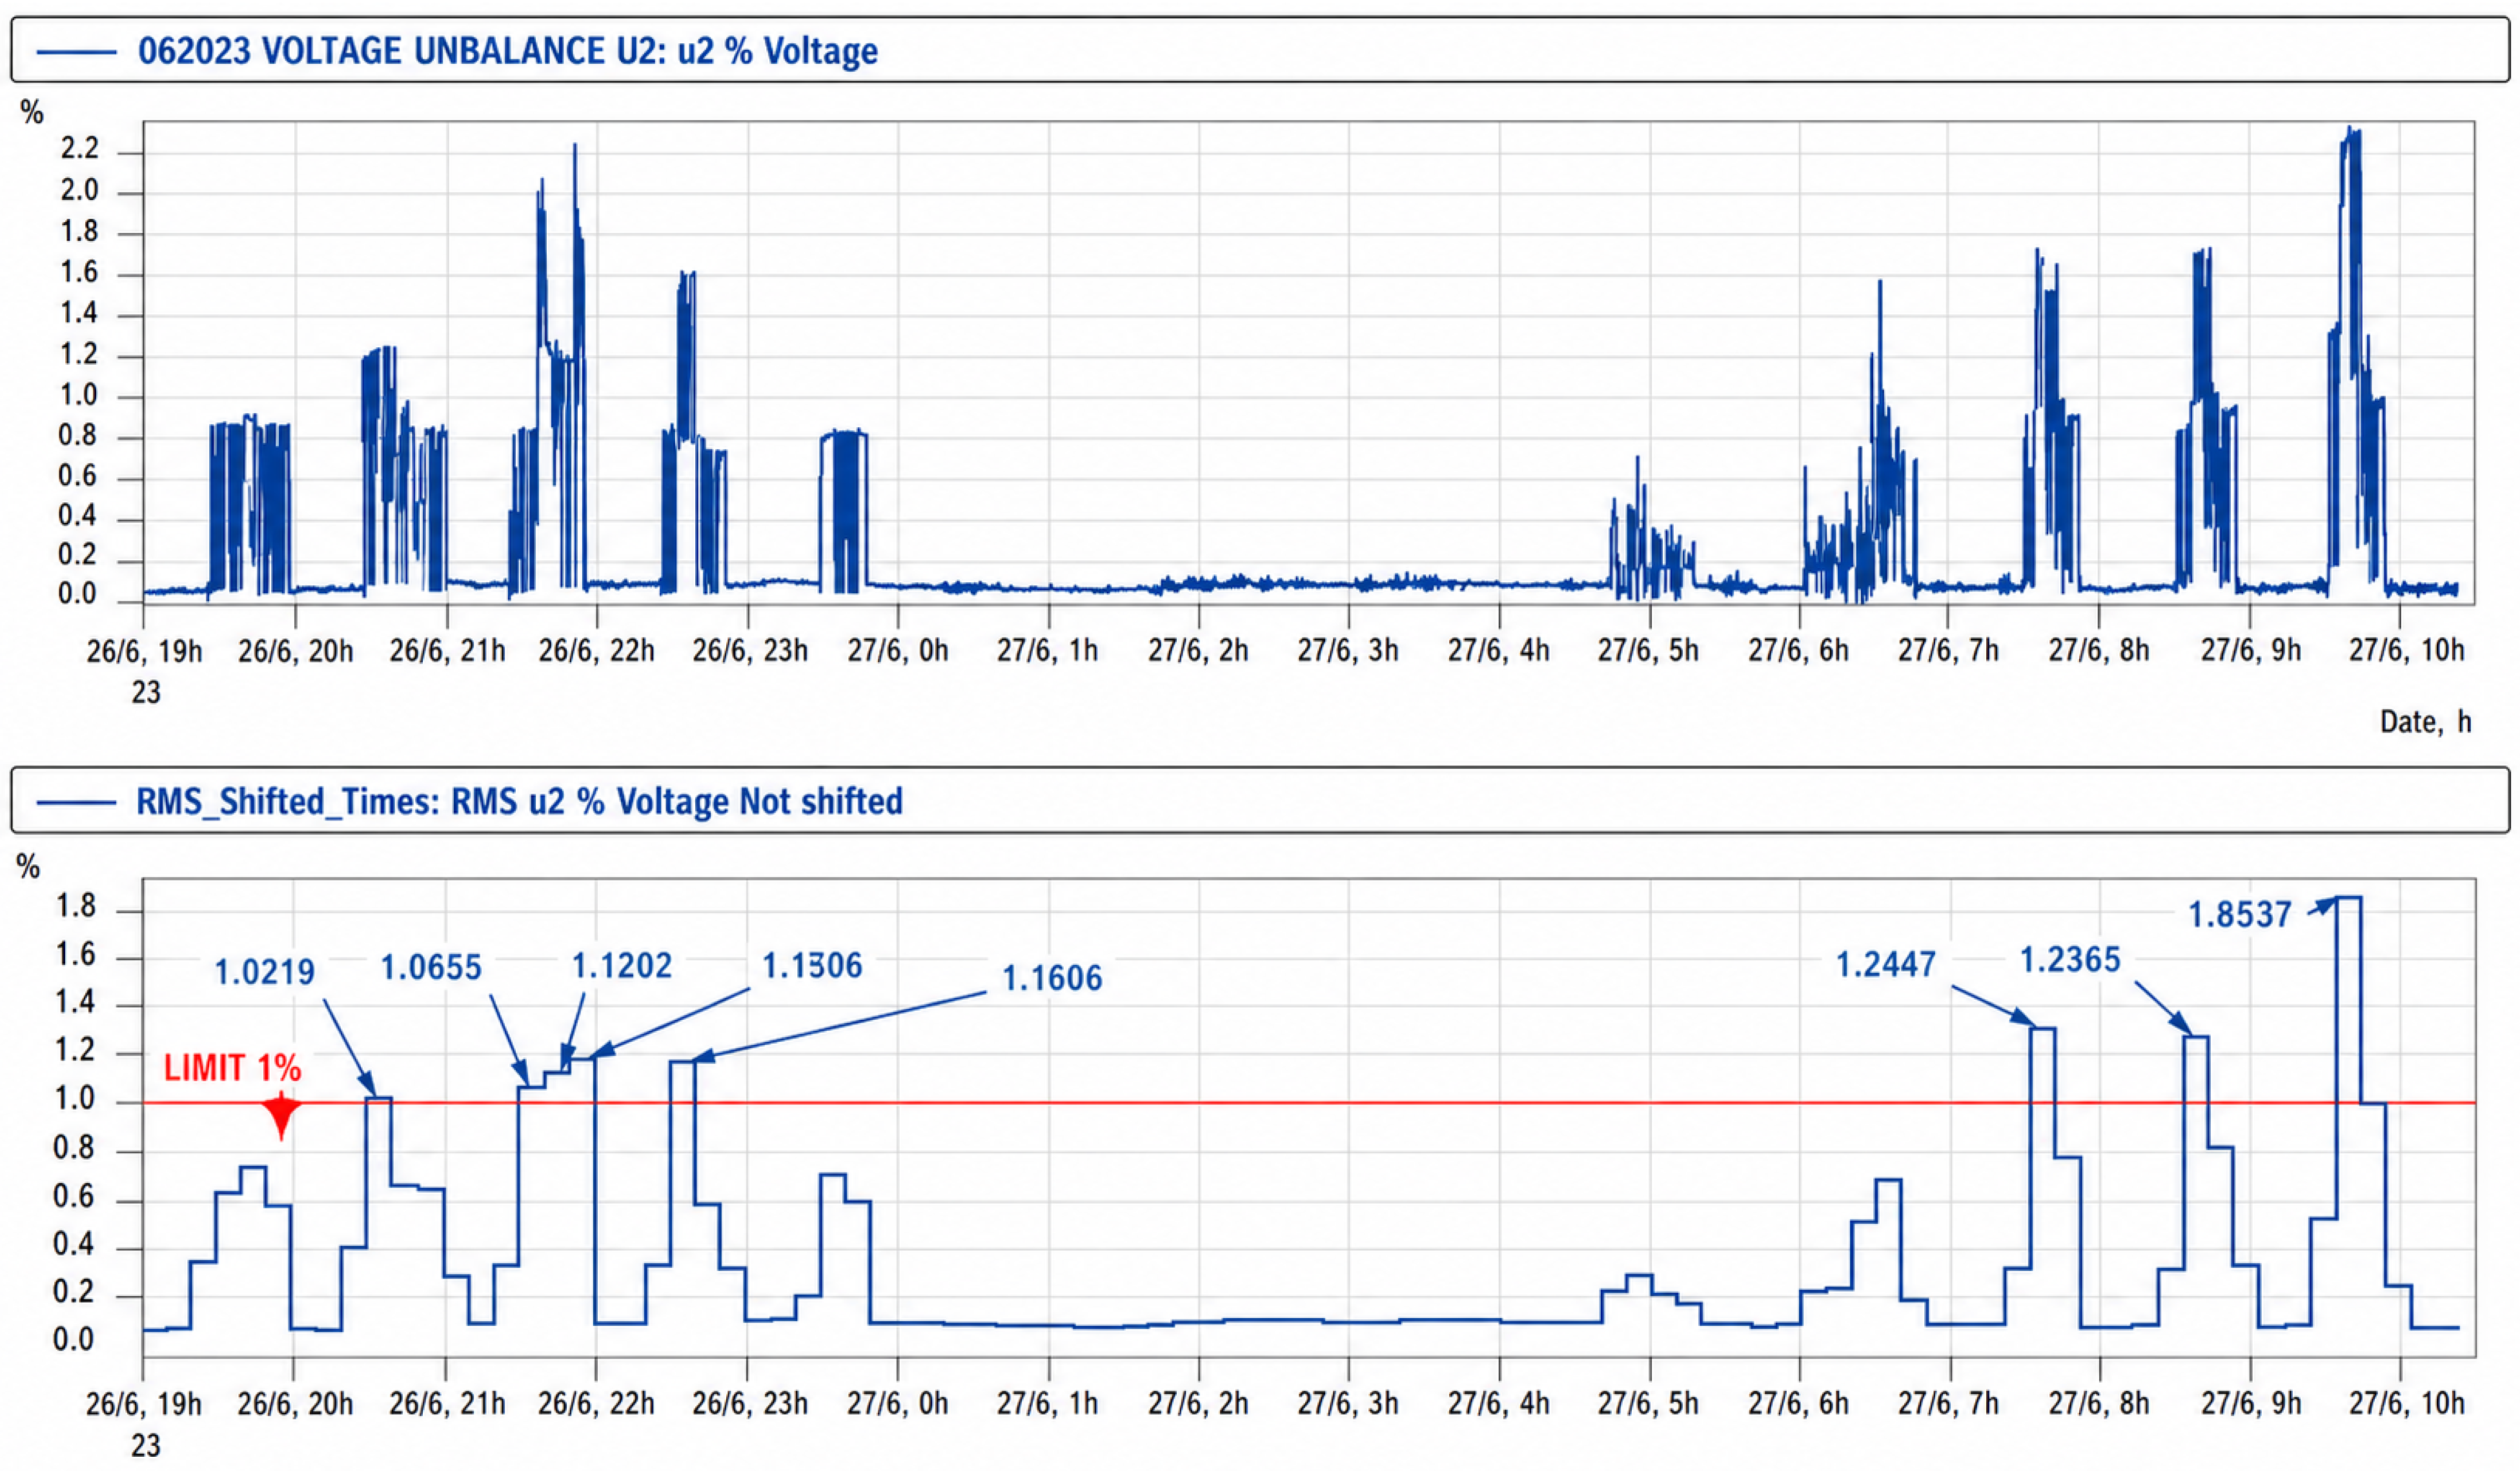
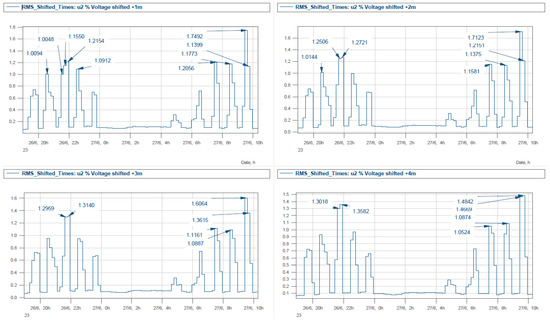
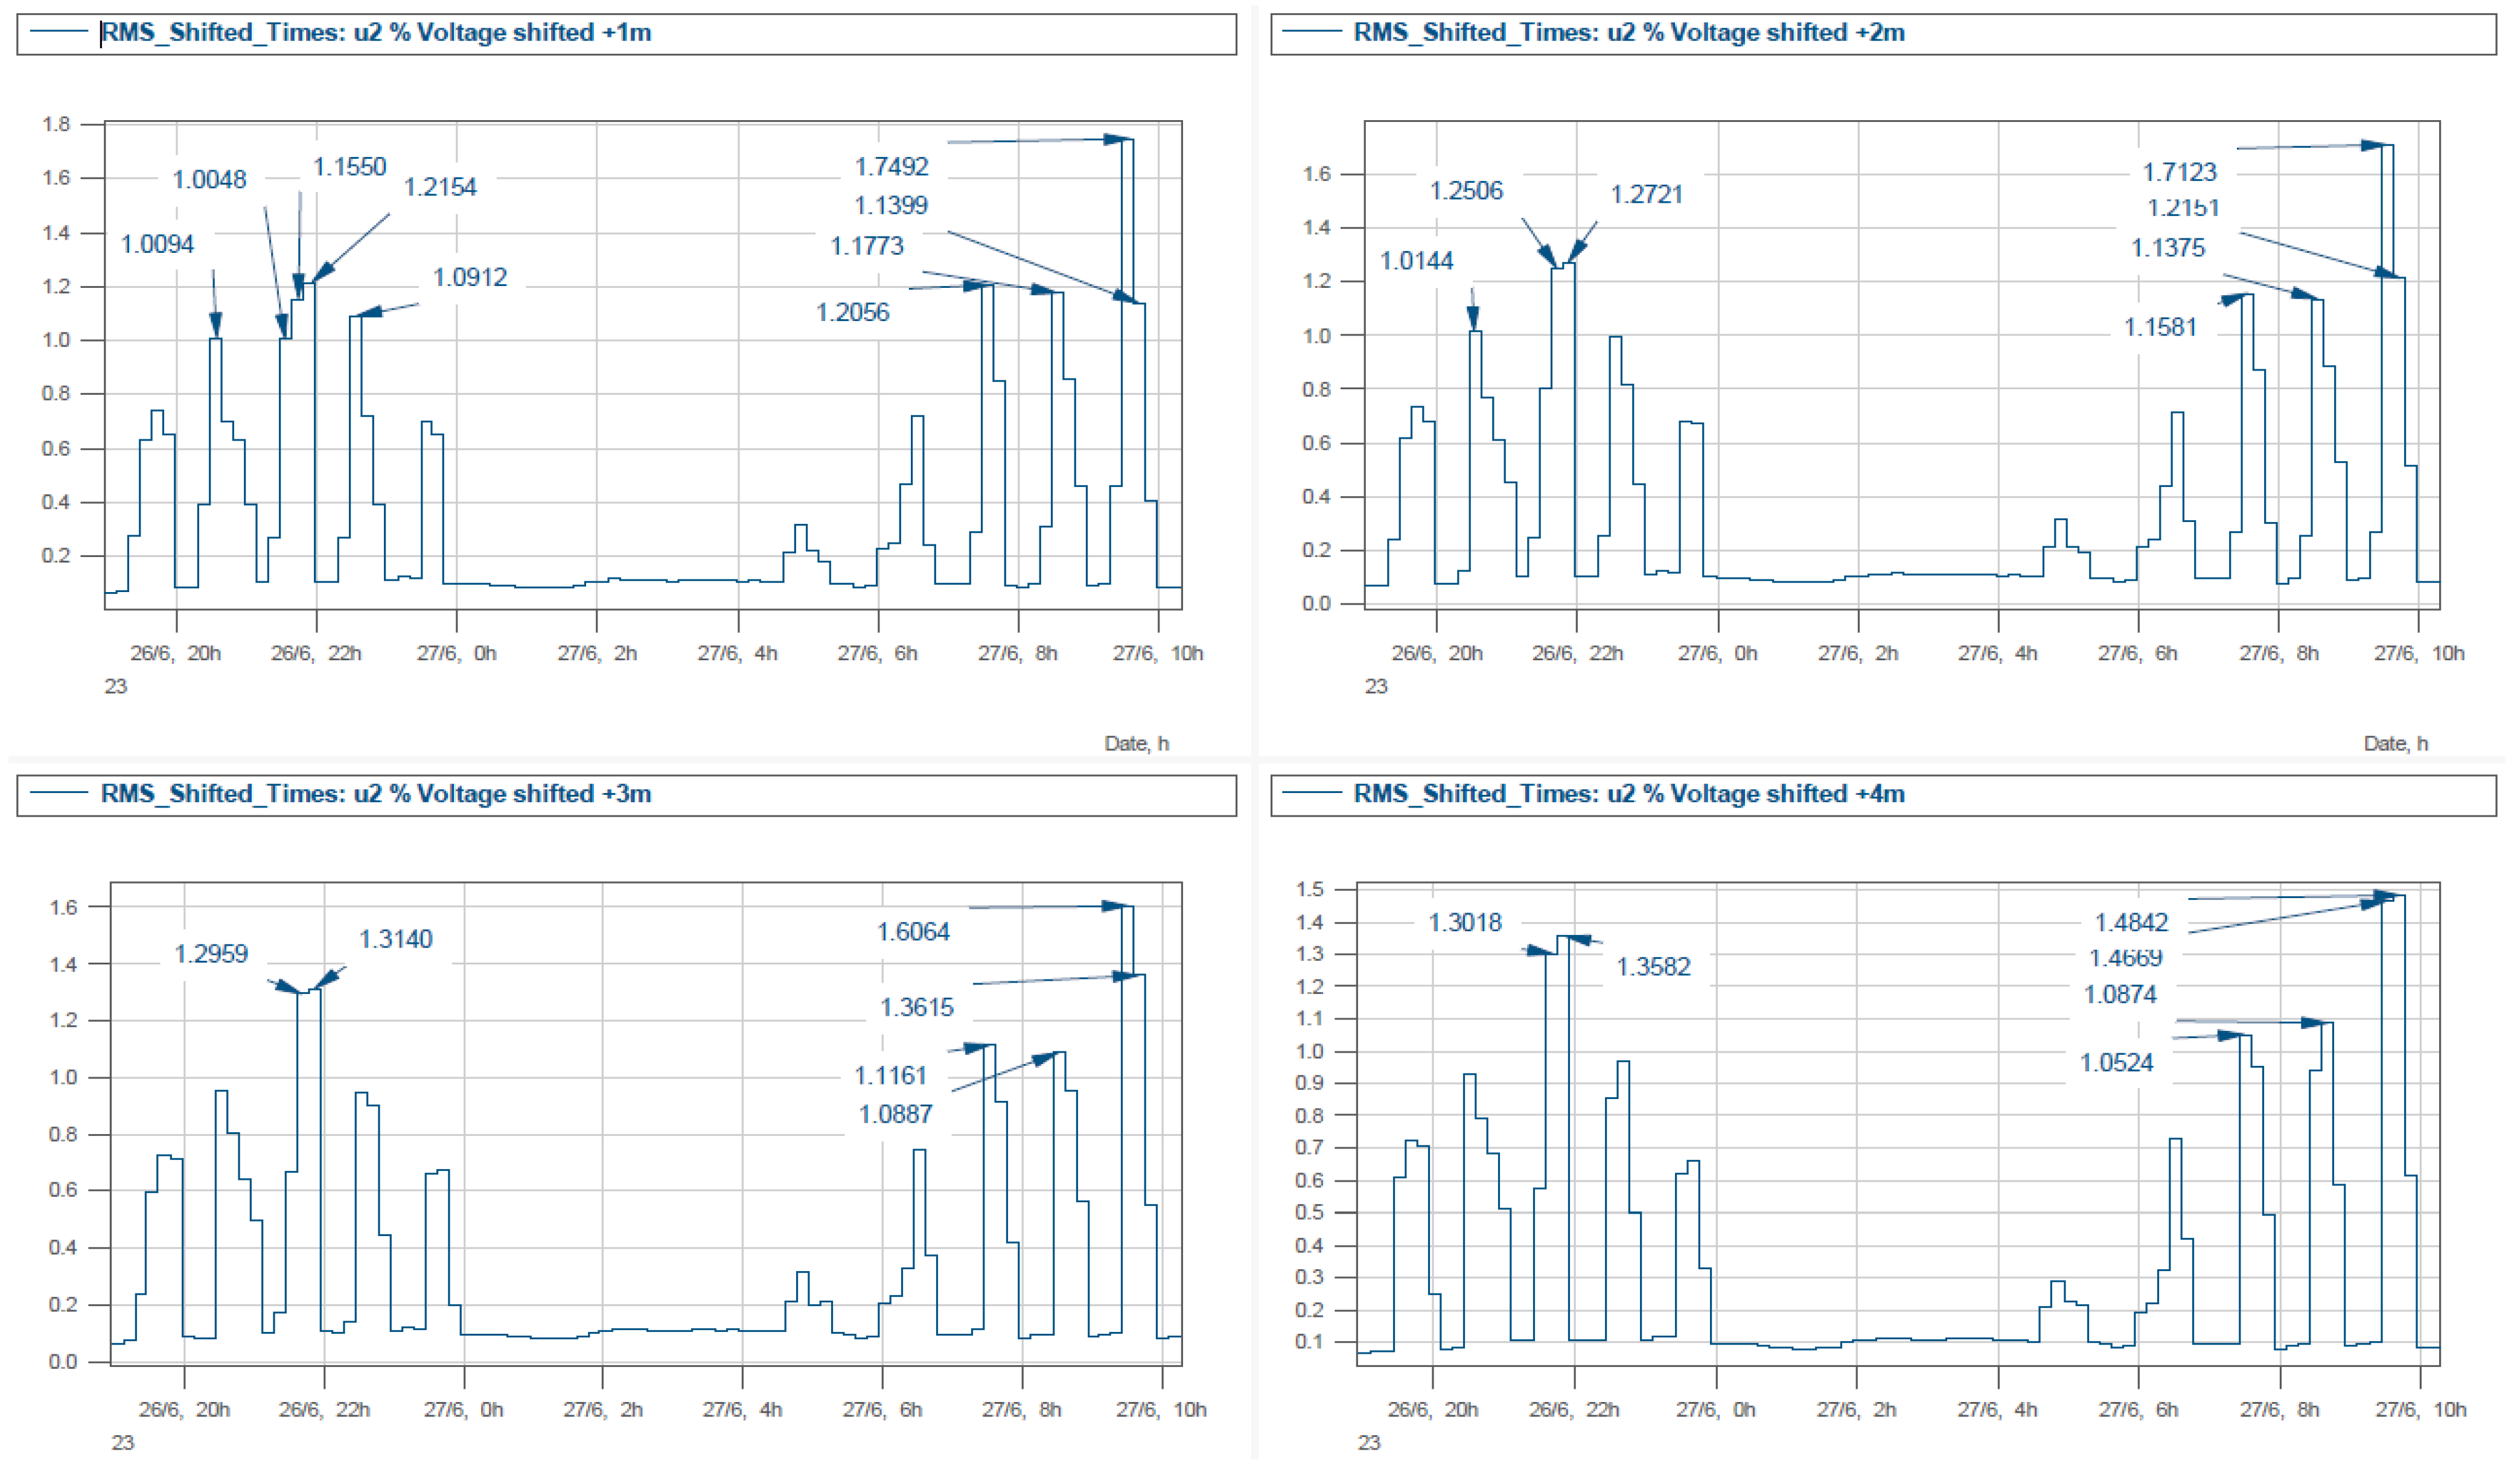
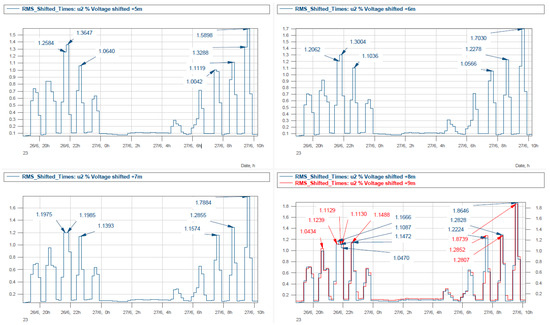
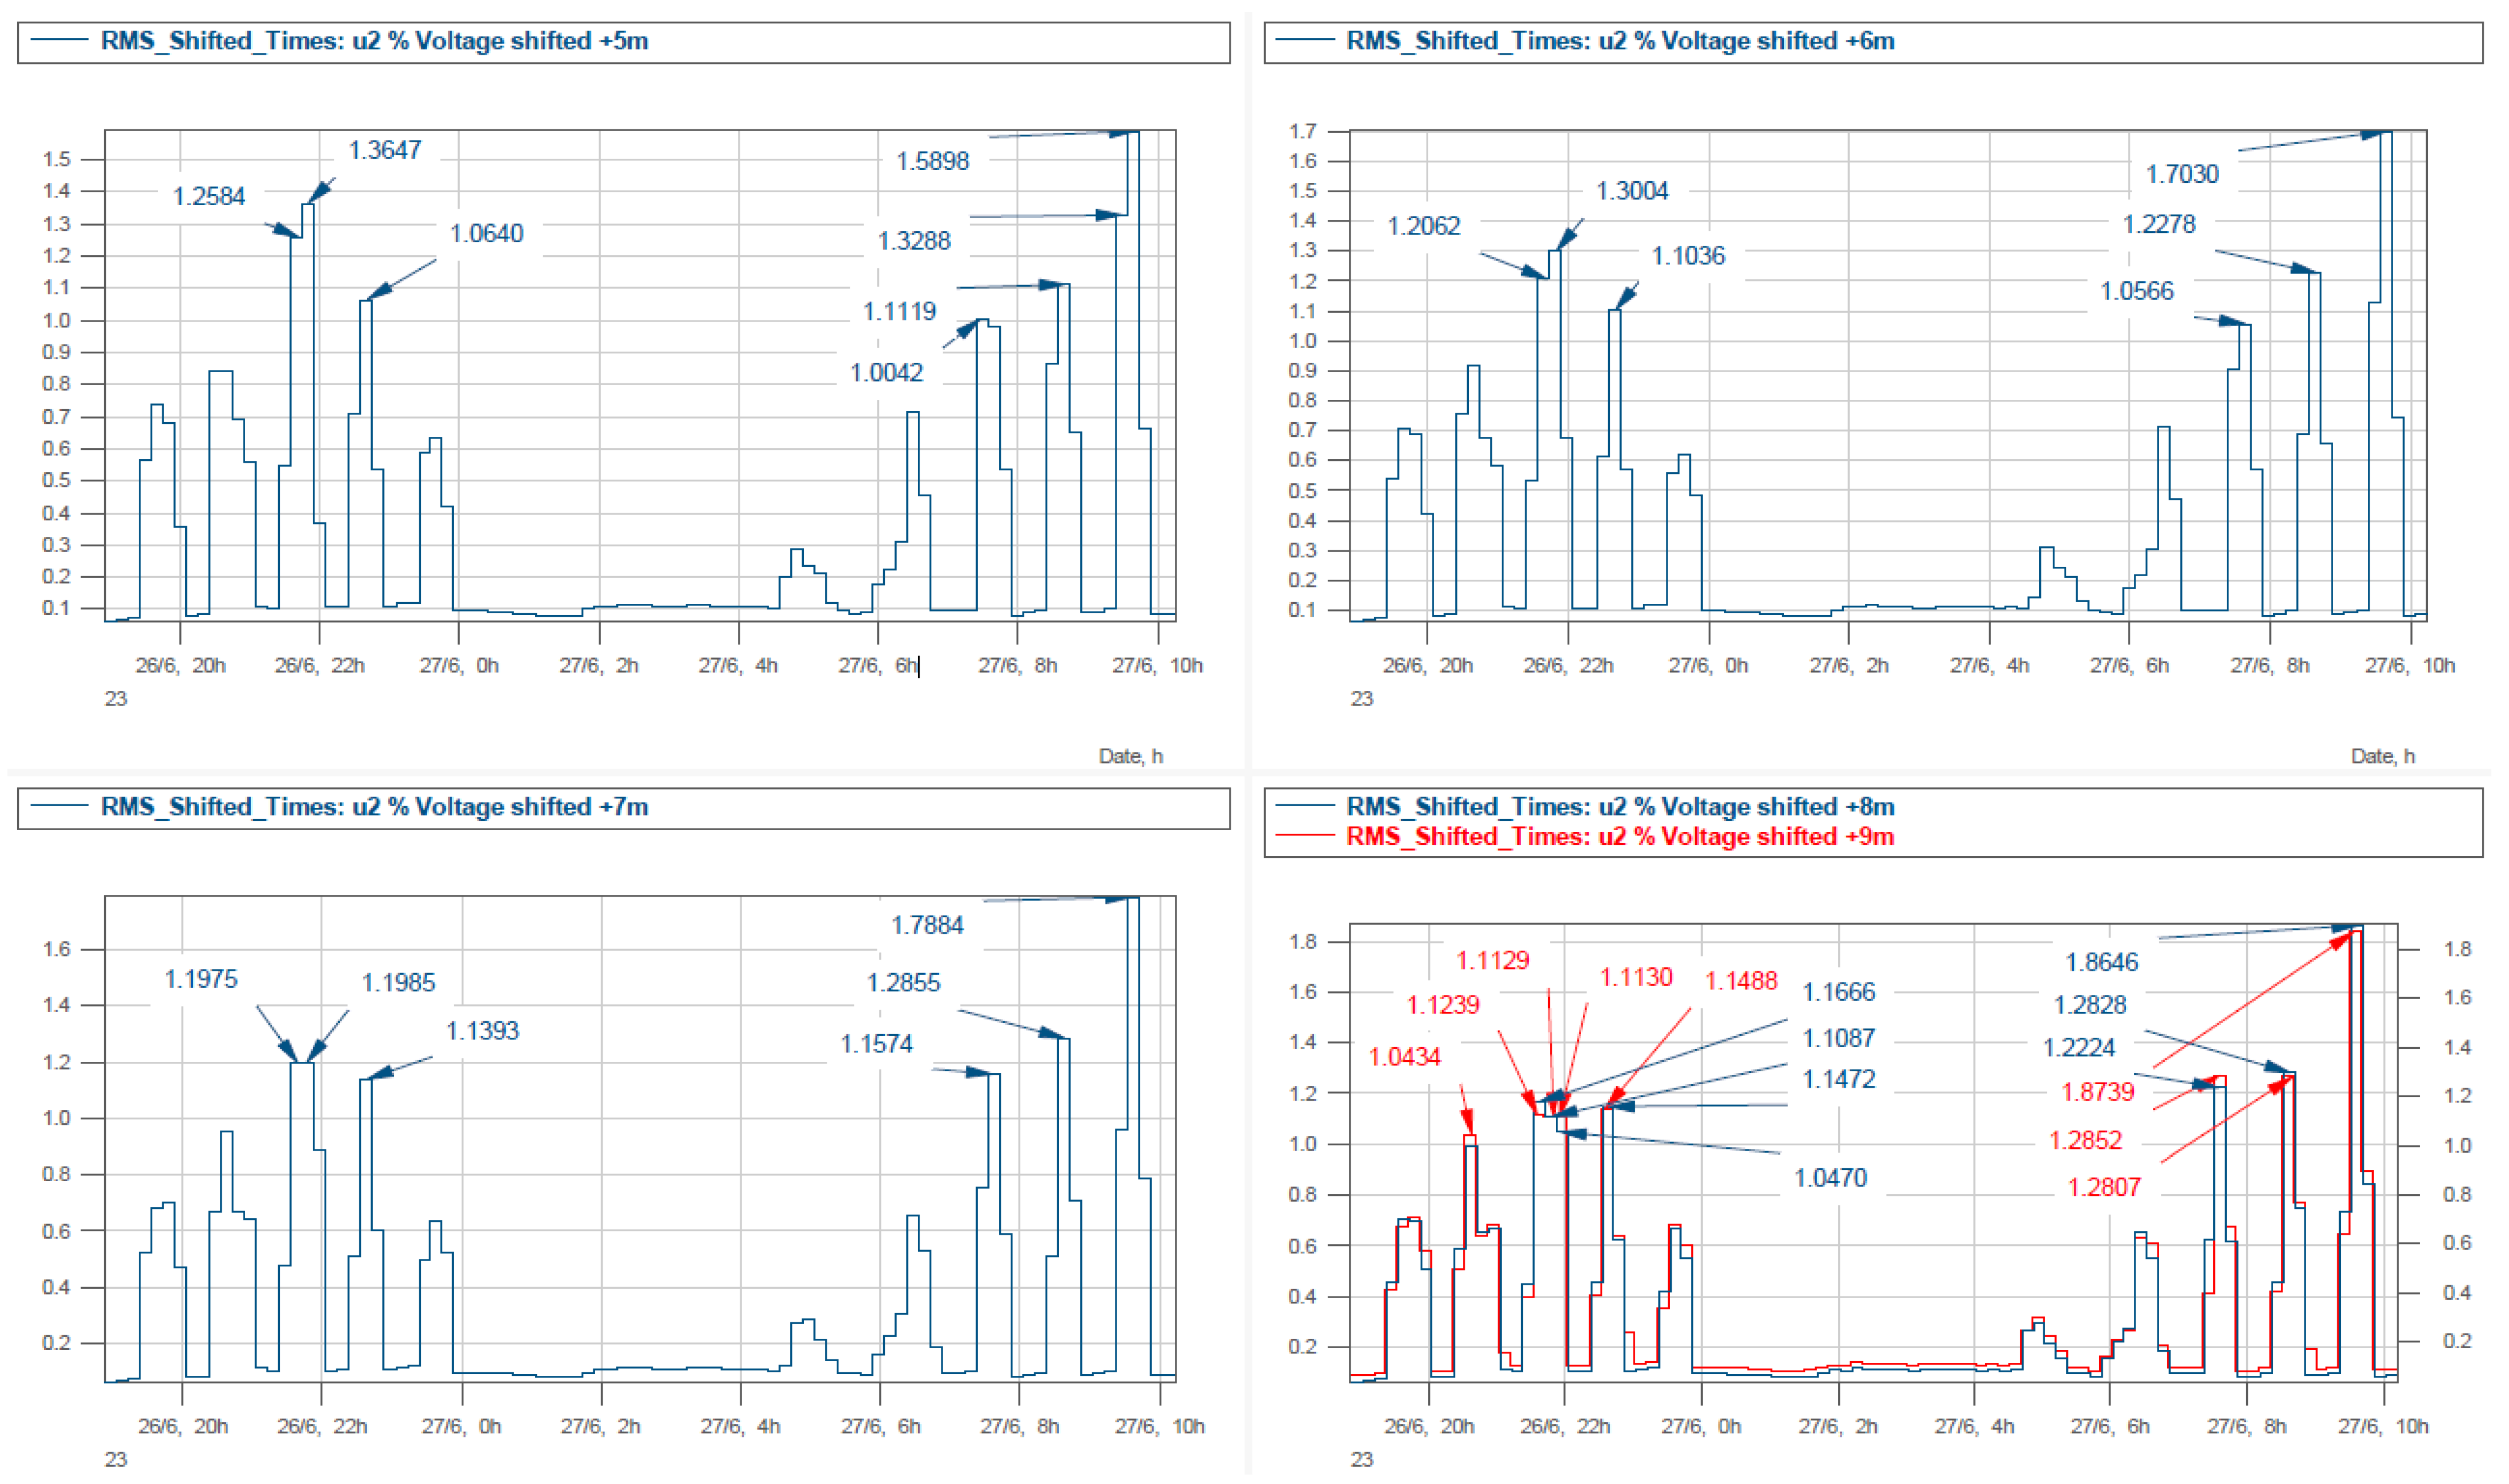
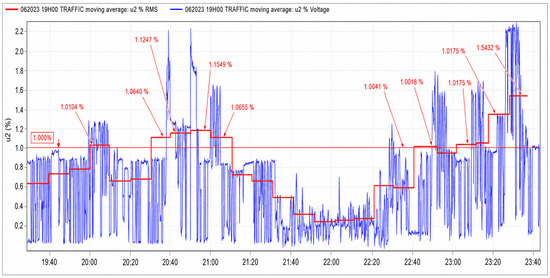
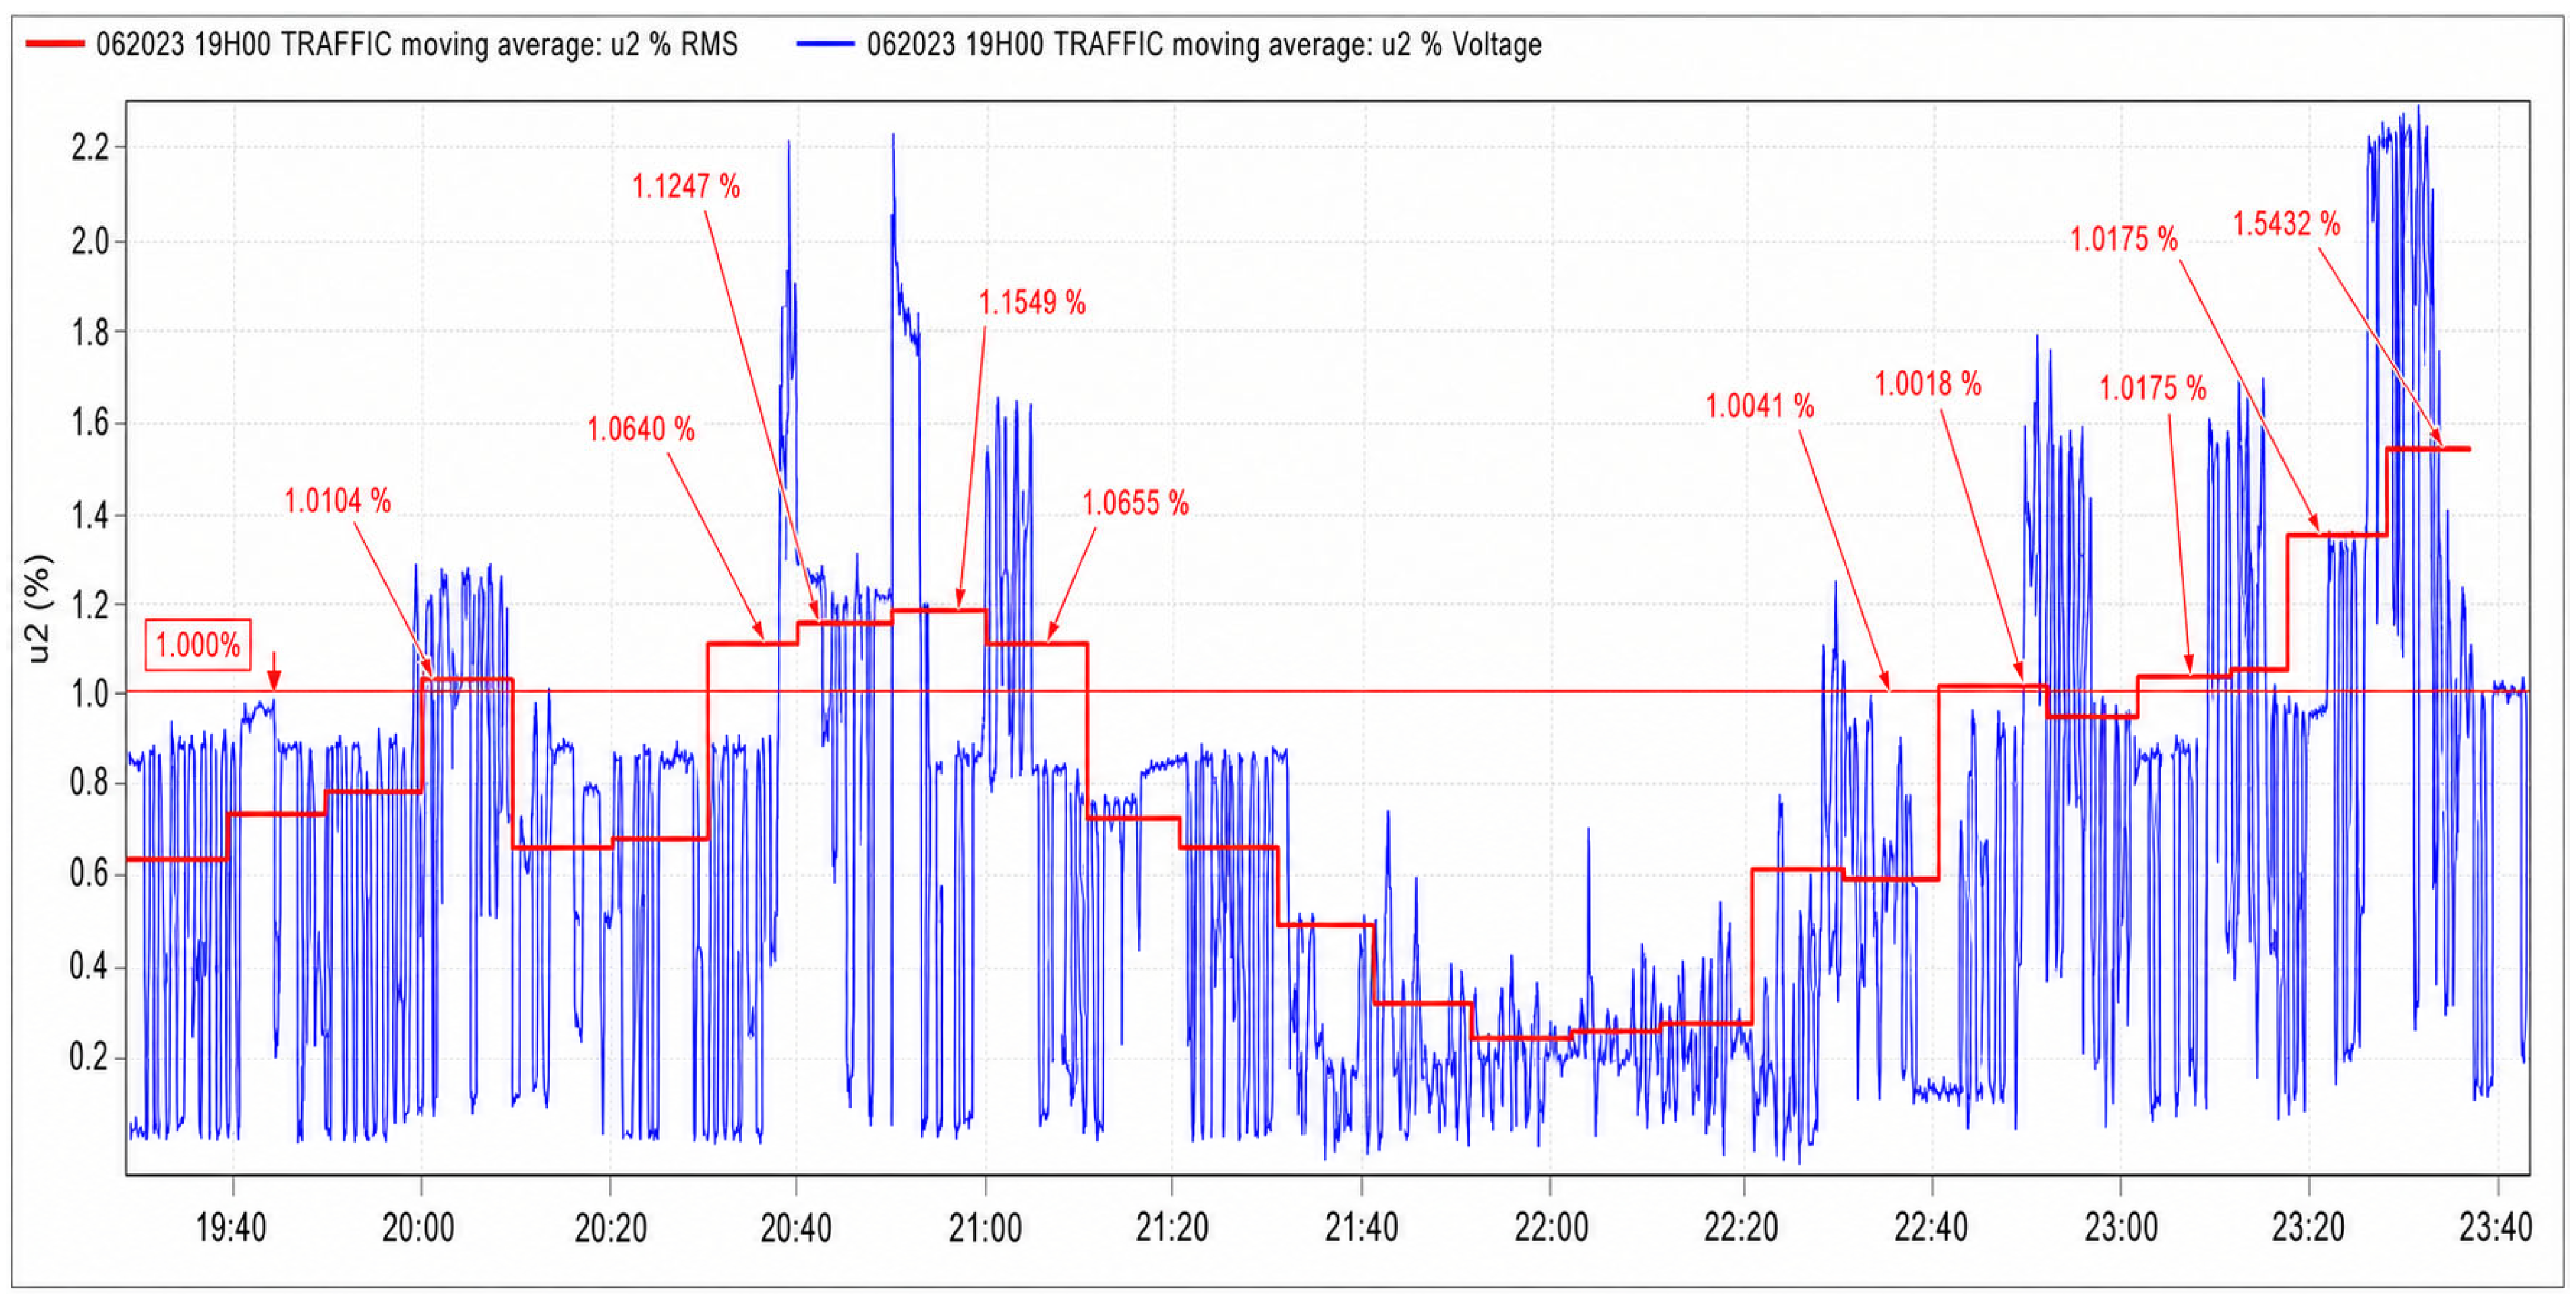

Disclaimer/Publisher’s Note: The statements, opinions and data contained in all publications are solely those of the individual author(s) and contributor(s) and not of MDPI and/or the editor(s). MDPI and/or the editor(s) disclaim responsibility for any injury to people or property resulting from any ideas, methods, instructions or products referred to in the content. |
© 2026 by the authors. Licensee MDPI, Basel, Switzerland. This article is an open access article distributed under the terms and conditions of the Creative Commons Attribution (CC BY) license.