Skip to Content
  • Article
  • Open Access

29 May 2026

Proposed Threshold for Microplastic Presence on Sandy Beaches Perceived as “Clean”: A Psychological Acceptability Approach


,
,
,
and
1
Institute of Integrated Science and Technology, Nagasaki University, 1-14 Bunkyo-machi, Nagasaki 852-8521, Japan
2
Faculty of Environment and Resource Studies, Mahidol University, 999 Puttamonthon 4 Rd. Salaya, Puttamonthon, Nakorn Pathom 73170, Thailand
*
Author to whom correspondence should be addressed.

Abstract

Microplastics (MPs) adsorb hazardous substances and are ingested by a wide range of organisms; therefore, indicators for managing their environmental concentrations are needed. Ideally, threshold values should be based on health impacts. However, the diversity of MPs and the complexity of their environmental behavior make it difficult to establish unified environmental concentration standards. In this study, we propose a threshold for the presence of MPs on sandy beaches based on “visual cleanliness,” derived from the amount of MPs that people find psychologically unacceptable. Three types of MPs were used: white polypropylene (PP), blue PP, and white polystyrene (PS; expanded polystyrene). The survey was conducted in Japan, and the number of valid responses was 245. For defining a narrow-range cleanliness threshold, volume concentration was more appropriate than mass concentration. White particles were expected to be less noticeable because they tended to blend with white shell fragments, which are ubiquitous on beaches. In contrast, blue particles were expected to be less acceptable owing to their rarity. However, we found no difference in unacceptability between white PP and blue PP. The threshold, defined as the volume concentration at which half of the respondents find MPs psychologically unacceptable, ranged from 1 to 2 cm3-MPs/m2-sand. Gender, age, travel time to the beach, and frequency of beach visits did not influence unacceptability. Strong concern about marine plastic pollution and experience in cleaning public spaces were associated with a tendency toward low tolerance for MP contamination on beaches.

1. Introduction

Since their invention in the 20th century, plastics have rapidly proliferated owing to their light weight and durability, with global production increasing several hundred-fold since 1950 [1]. Concomitant with the increase in plastic use, waste generation has increased, and the leakage of inadequately managed plastic waste into the environment has become a serious issue [2]. It is estimated that approximately eight million tons of plastic enter the oceans each year [3], making it a major contributor to marine plastic pollution problems. Small plastic particles are referred to as microplastics (MPs). Some MPs are manufactured as primary MPs, whereas others originate as secondary MPs when larger plastics fragment under ultraviolet radiation and wave action [4]. MPs have been detected across a wide range of environments—from the ocean surface to the deep sea, sandy beaches, terrestrial environments, and even the atmosphere [5,6,7]—indicating that pollution is expanding not only as macro-litter but also as fine particles.
Large plastic debris is ingested by seabirds and marine mammals, causing gastrointestinal blockage and malnutrition [8,9]. On the other hand, MPs are readily taken up by a wider variety of organisms, raising concerns about not only physical impacts but also physiological effects [10,11]. MPs also readily adsorb persistent organic pollutants (POPs) and additives [12], potentially increasing toxicological risks within organisms [13,14]. In addition to detection in the digestive tracts of marine organisms [10], MPs have been found in human feces [15], blood [16], and placentas [17], and their potential to reach the central nervous system has been discussed [18]. These findings underscore the importance of addressing MPs from the perspective of protecting both ecological and human health.
International efforts to reduce plastic use and strengthen waste management initiatives are underway. United Nations Environment Programme (UNEP) has initiated a process to establish a global plastic pollution treaty [19]. Countermeasures include reducing plastic use and waste generation, ensuring proper waste treatment, and recovering plastic waste already in the environment [20,21]. Monitoring environmental MPs is considered essential for evaluating the effectiveness of these measures [22]. However, no unified environmental concentration standards exist, and risk assessments remain highly uncertain [23]. Although specific regulations exist—such as bans on microbeads in cosmetics [24,25]—unified environmental concentration standards have yet to be established.
Because MPs adsorb hazardous substances [12] and are ingested by diverse organisms [10], indicators for managing their environmental concentrations are needed [26]. Ideally, thresholds should be based on health impacts [13]. However, the diversity of MPs and the complexity of their environmental behavior make it difficult to establish unified environmental concentration standards [23]. In contrast, “cleanliness thresholds” that can be used to maintain comfortable environments or guide cleanup activities are relatively easy to propose. On sandy beaches, MPs can be visually identified with relative ease [27], suggesting that thresholds may be derived from the amount of MPs that people find psychologically unacceptable. In urban design and concrete engineering, several studies have evaluated appearance-based acceptability [28,29,30]. Notably, Suyama et al. (2022) investigated the relationship between bubble area ratio and psychological acceptability, proposing appearance-based management criteria for exposed concrete [31]. Takase et al. (2020) examined the relationship between the degree of kudzu overgrowth on road slopes and psychological acceptability using photographs, aiming to reduce vegetation management costs [32]. Both studies also evaluated how respondent characteristics (age, gender, frequency of exposure to the target environment, etc.) influenced acceptability. Following these approaches, the present study aims to propose a threshold for MP presence on sandy beaches based on “visual cleanliness.”
This study has three primary research interests. First, we aim to determine the appropriate unit for expressing the threshold concentration of MPs. Visual perception detects the size—not the weight—of objects. Considering the presence of low-density materials, such as expanded polystyrene, we hypothesize that volume concentration will yield more consistent psychological acceptability results across different materials than mass concentration.
Second, because the inner surfaces of seashells are often white, we investigate whether white MPs are more psychologically acceptable than MPs of other colors (blue, in this study). Third, we attempt to identify the amount of MPs on sandy beaches for which half of the respondents perceive the beach as dirty (i.e., psychologically unacceptable).
In addition, we examine whether respondents’ personal characteristics influence their psychological acceptability. Based on our subjective expectations, individuals who live near the sea or have strong environmental concerns may be more sensitive to beach contamination and thus less tolerant of MPs, even at low concentrations.

2. Methods

In this study, a questionnaire survey was conducted to determine the concentration of microplastics on sand that respondents perceived as psychologically unacceptable, using photographs in which the amount of microplastics placed on sand was systematically varied. In addition, respondents were asked several questions regarding their personal characteristics, and the relationships between these characteristics and their unacceptable concentration thresholds were examined.
An online questionnaire survey was conducted by a research company specializing in internet-based surveys. The company maintains a panel of 2.4 million residents in Japan. Among these, individuals aged 18 years or older were invited to participate, and data collection continued until 500 valid responses were received. The survey took place from 10 to 15 November 2023. Titled “Questionnaire on the Visually Acceptable Amount of Microplastics on Sandy Beaches”, it consisted of ten questions administered in Japanese.
The questionnaire comprised two categories: respondent characteristics and psychological acceptability of MPs. Respondent characteristics included seven items: gender, age, travel time from home to the nearest beach, frequency of beach visits, subjective level of concern about marine plastic pollution, experience in cleaning public spaces, and a trap question. In the trap question, respondents were shown four plastic materials—polyethylene (PE), polypropylene (PP), polyvinyl chloride (PVC), and polystyrene (PS)—and asked which they believed contributed most to marine pollution. However, the question text also instructed respondents to “select polystyrene regardless of your personal opinion” (Instruction X). PS was intentionally placed last to prevent inattentive respondents from accidentally selecting the correct answer by choosing the first option. Although this method could not perfectly distinguish between attentive (optimizing) and inattentive (satisficing) respondents, those who followed Instruction X were referred to as “optimizing respondents,” and those who did not were referred to as “satisficing respondents.”
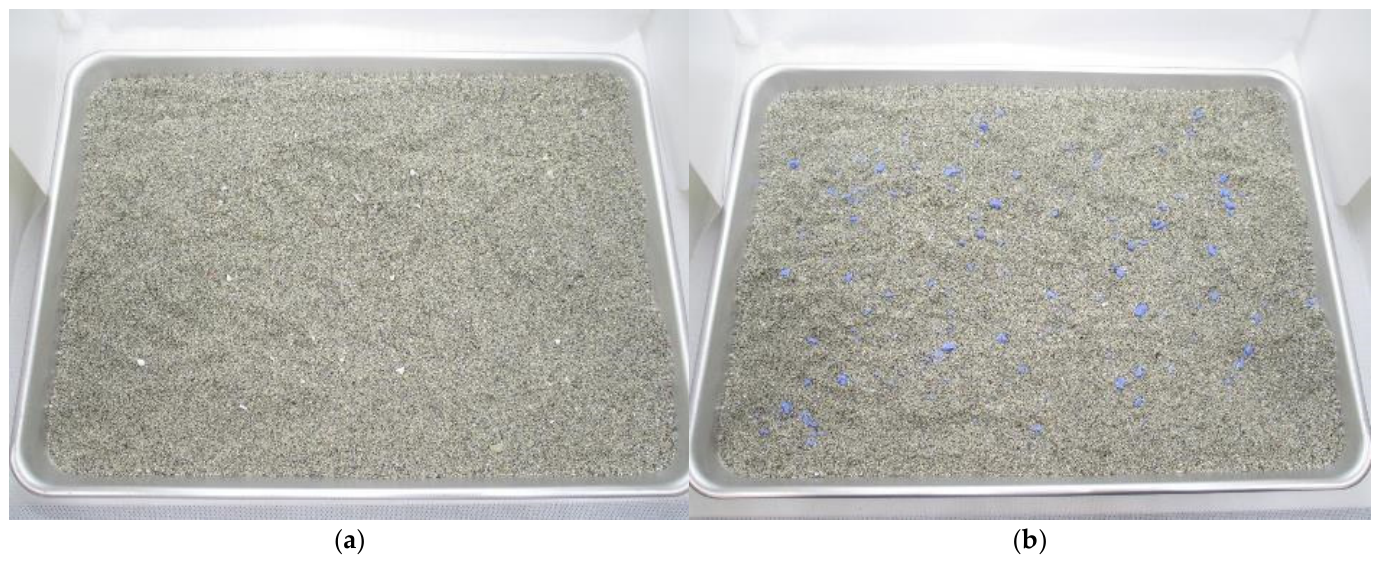
To assess the psychological acceptability of MPs, respondents were shown eight photographs of sand (actual beach sand) placed in an aluminum tray (34 cm wide and 24 cm deep), onto which increasing amounts of MPs had been added. They were asked to choose the photograph number for which they began to perceive the sand as dirty (i.e., psychologically unacceptable). Three types of MPs were used: white PP (from clothespins), blue PP (from clothespins), and white PS (expanded polystyrene). These materials were crushed into particles 2–5 mm in size, that is, a size visible to the naked eye. The densities of PP and PS were 0.91 and 0.018 g/cm3, respectively [33]. Because the three types of MPs were evaluated separately, respondents answered three acceptability questions. The mass of PP applied per unit sand area was set at 0, 200, 500, 1000, 2000, 5000, 10,000, and 20,000 mg-MPs/m2-sand (and 50,000 mg for PS volume calculations). These values were derived from previous field surveys in which visually identified hotspots on sandy beaches contained approximately 250–30,000 mg-MPs/m2-sand, and MPs below 200 mg-MPs/m2-sand were not visually detectable [27] (see the blue line in Figure 3i). Applying the same mass to PS resulted in extremely large volumes due to its low density. Therefore, in this study, the three types of MPs (two materials) were standardized by volume, calculated from mass and density. To prevent respondents from noticing that identical option numbers corresponded to identical volume concentrations across materials, some PS volume concentrations were adjusted. Table 1 shows the MP concentrations used, and Figure 1 presents example photographs from the questionnaire. The full questionnaire is provided in the Appendix A.
Table 1. Set MP concentrations used in the questionnaire photographs (MPs placed on sand). The top row shows the volume concentrations common to both PP and PS, followed by the corresponding mass concentrations. The table also indicates the option numbers used in the questionnaire.
Figure 1. Example photographs of sand with MPs shown in the questionnaire. Tray size: 34 cm (width) × 24 cm (depth). (a) White PP (option 4; 1000 mg-MPs/m2-sand). (b) Blue PP (option 8; 20,000 mg-MPs/m2-sand). Option numbers correspond to Table 1 and the Appendix A.
The collected survey data were statistically analyzed following the work of Kanda (2013) [34]. All statistical analyses were performed with EZR (Version 1.68; Jichi Medical University, Tochigi, Japan), a graphical user interface for R (Version 4.3.1; The R Foundation for Statistical Computing, Vienna, Austria).

3. Results and Discussion

3.1. Respondent Characteristics

The numbers of optimizing and satisficing respondents were 245 and 255, respectively (49% and 51%). Except for Section 3.4, the analyses below used only the responses of optimizing respondents (n = 245).
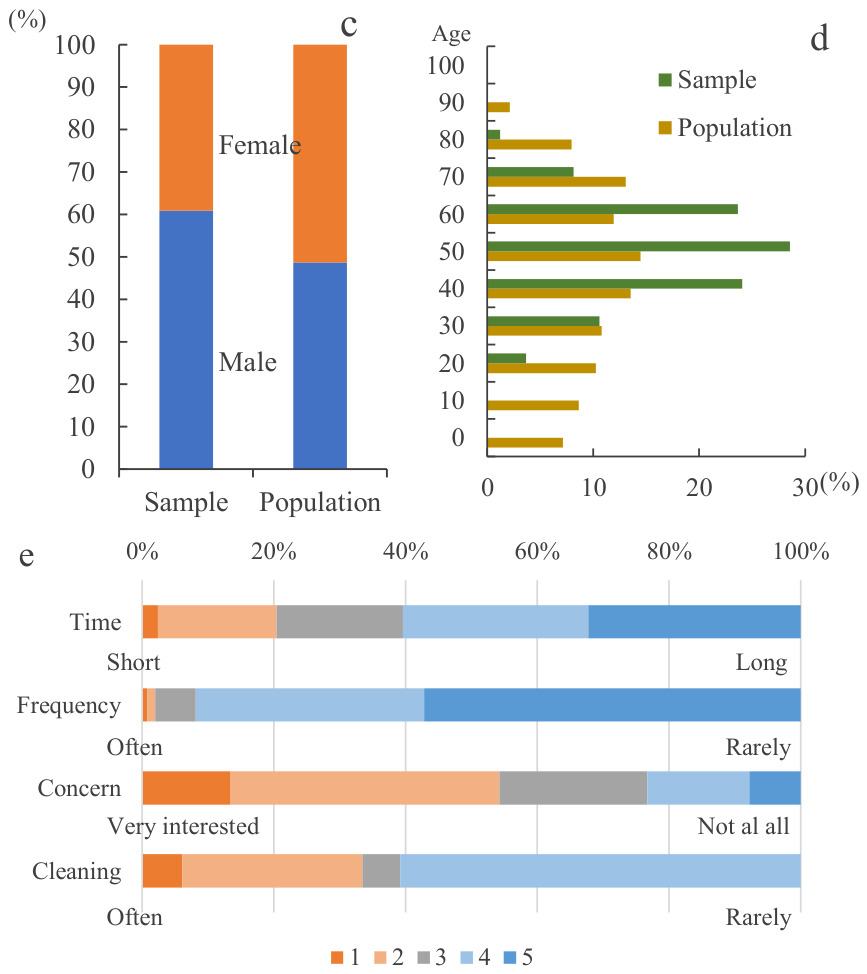
The ratio of male to female respondents was 63% to 37%, with males being overrepresented (Figure 2c); the chi-square goodness-of-fit test showed p < 0.01. This ratio differs from the actual ratio in Japan in 2023 (49%:51%) [35]. The age distribution is shown in Figure 2d. The sample distribution differed from the population distribution (chi-square goodness-of-fit test, p < 0.01), with respondents in their 40s, 50s, and 60s appearing more frequently than in the general population (not statistically tested).
Figure 2. Characteristics of respondents (optimizing respondents only, n = 245). (c) Gender, (d) age, and (e) access to the beach and interest in the environment.
Figure 2e summarizes responses regarding travel time to the beach, frequency of beach visits, subjective concern about marine plastic pollution, and experience in cleaning public spaces. More than 60% indicated that traveling to the beach takes at least one hour (options 4 and 5). Regarding beach visitation frequency, 92% reported visiting only a few times per year or almost never (options 4 and 5). Over 50% indicated strong or moderate concern about marine plastic pollution (options 1 and 2). More than 60% reported having no experience in cleaning public spaces (option 4; option 5 did not exist). Overall, the sample comprised individuals who live more than an hour from the beach, rarely visit beaches, and have little experience with cleanup activities, yet express concern about marine plastic pollution.

3.2. Whether Mass or Volume Concentration Produces More Consistent Results

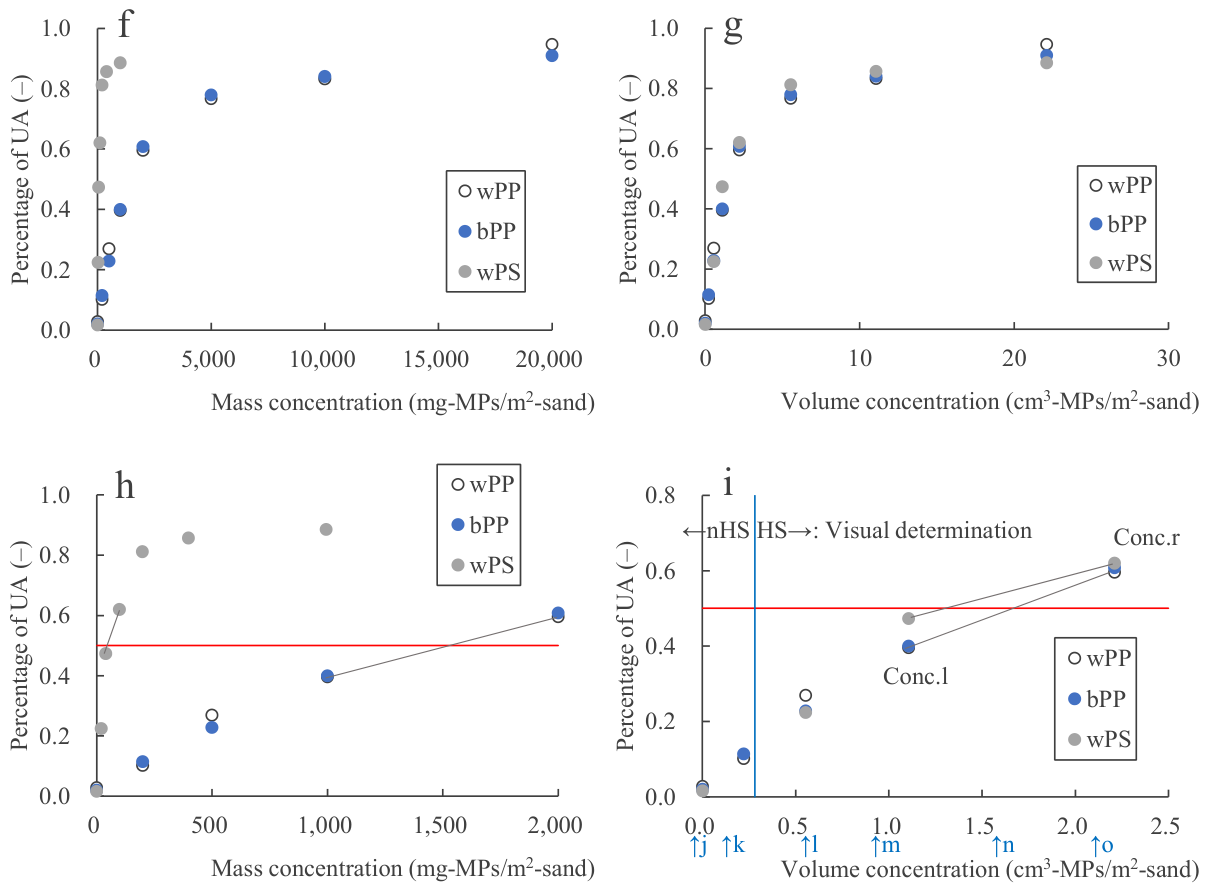
We hypothesized that white PP and white PS with the same volume would yield similar levels of psychological unacceptability. The concentration at which half of the respondents judged MP presence as unacceptable was estimated using linear approximation. Although the authors initially assumed a logistic curve, the observed data did not exhibit an S-shaped pattern; therefore, a simple linear approximation was adopted. Using mass concentration (Figure 3f,h), the threshold was approximately 1500 mg-MPs/m2-sand for white PP and 42 mg-MPs/m2-sand for white PS—more than a 30-fold difference. In contrast, using volume concentration (Figure 3g,i), the thresholds were approximately 1.7 cm3-MPs/m2-sand for white PP and 1.3 cm3-MPs/m2-sand for white PS—a 1.3-fold difference. Therefore, volume concentration yielded more consistent results across materials. For defining a narrow-range cleanliness threshold, volume concentration is more appropriate.
Figure 3. Proportion of respondents who judged MP presence on sand as unacceptable (optimizing respondents only, n = 245). (f) Mass concentration; (g) volume concentration; (h) mass concentration (up to a maximum of 2000 mg-MPs/m2-sand); and (i) volume concentration (up to a maximum of 2.5 cm3-MPs/m2-sand). UA indicates “unacceptable.” The red horizontal line represents the proportion of respondents who judged the presence of MPs as unacceptable (0.5), and the blue vertical line indicates the boundary between visually identified non-hotspots and hotspots in Asakura (2024) [27]. Alphabet labels (j, k, l, m, n, o) in panel (i) correspond to the volume concentrations shown in the photographs in Figure 5. In the legend, w denotes white and b denotes blue. Conc.l indicates left-side concentration, and Conc.r indicates right-side concentration.

3.3. Threshold for MP Presence Considered Psychologically Unacceptable

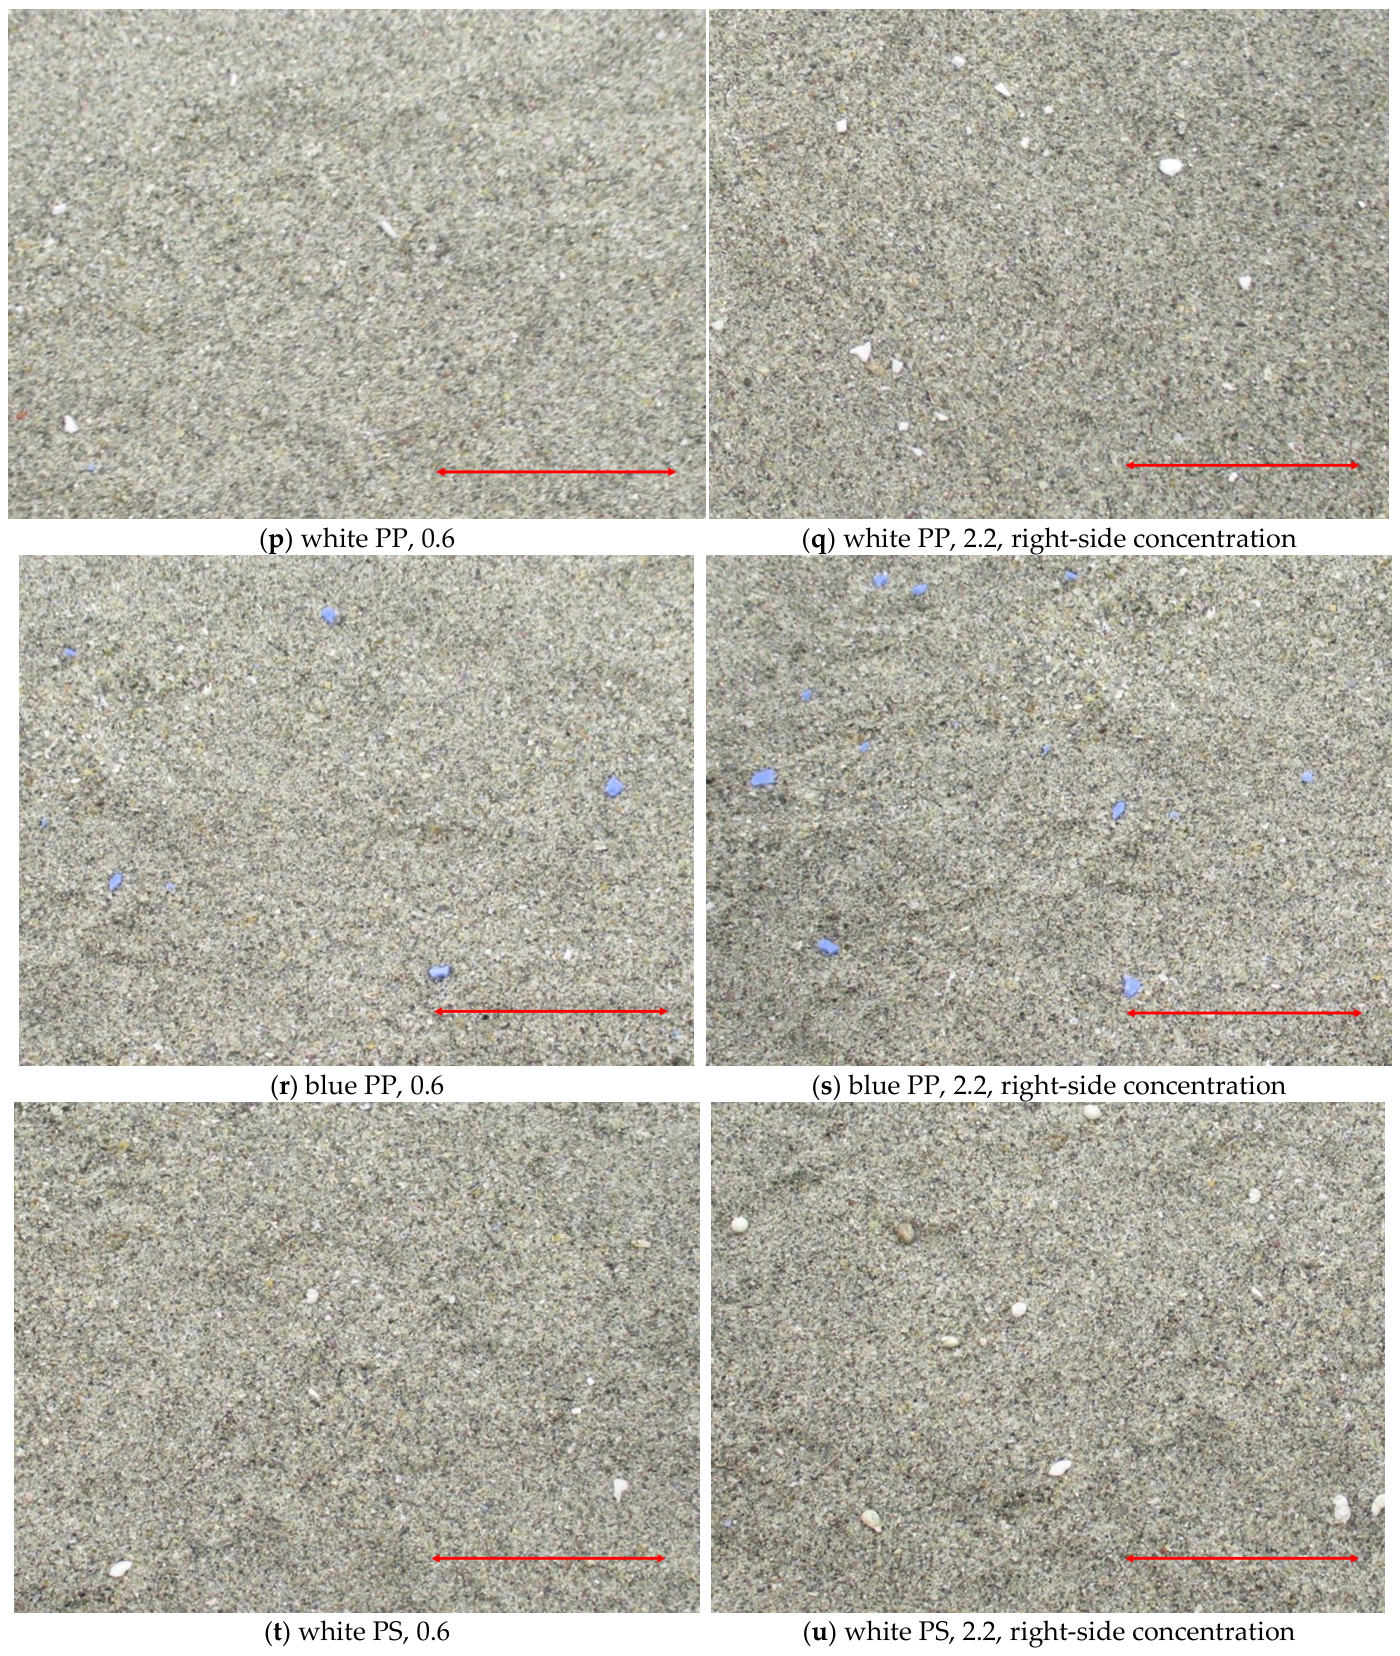
We used volume concentration in the discussion that follows. For all three types of MPs, unacceptability increased (acceptability decreased) with increasing volume concentration. The proportion of respondents judging MP presence as unacceptable reached 50% between 1.1 and 2.2 cm3-MPs/m2-sand (hereinafter, “left-side concentration” and “right-side concentration,” respectively) (Figure 3i). At both concentrations, no significant differences in unacceptability were observed among the three MP types (proportion tests, p > 0.29). Even after considering multiple comparisons (3 materials × 2 concentrations), no differences emerged. No difference was observed between white PP and blue PP, despite the expectation that white particles would blend with shell fragments and blue particles—being rarer—would be more noticeable. Similarly, no difference was observed between white PP and white PS.
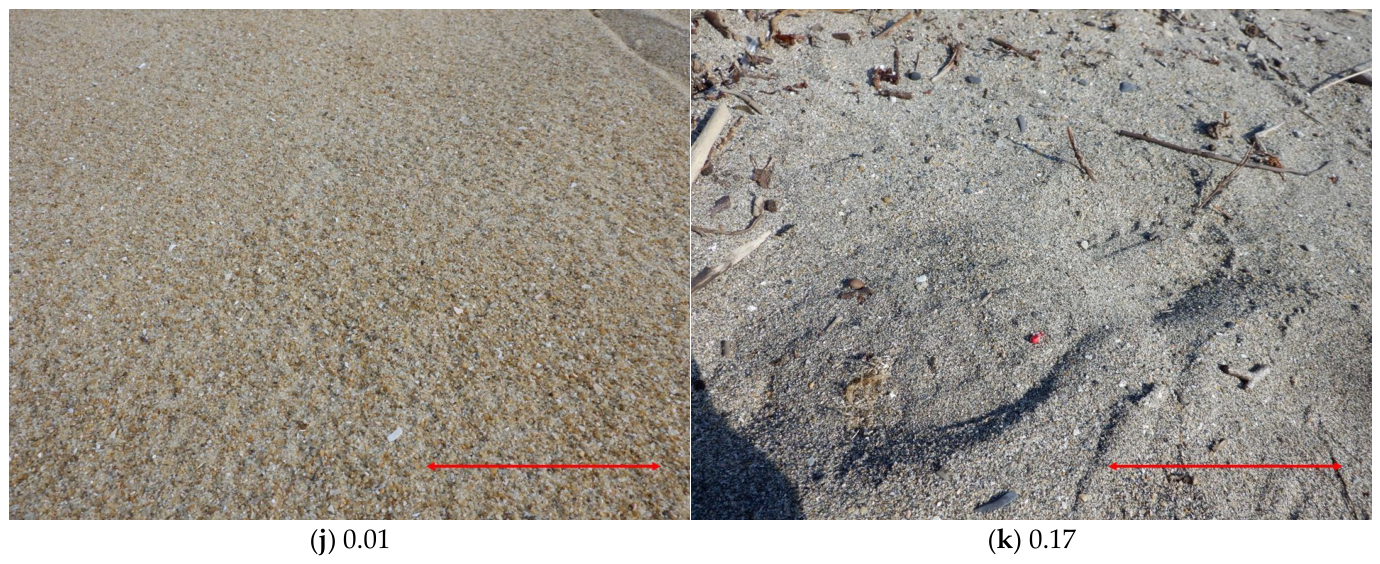
The volume concentrations at which unacceptability reached 50% were 1.7 cm3-MPs/m2-sand for white PP, 1.6 for blue PP, and 1.3 for white PS. Based on these results, the cleanliness threshold, defined as the concentration at which half of the respondents find MP presence unacceptable, would fall within 1–2 cm3-MPs/m2-sand. This result remained unchanged even when responses of satisficing respondents were included. Converting this to a one-dimensional length unit gave 1–2 × 10⁻⁴ cm or 1–2 × 10⁻⁶ m. Figure 4 shows enlarged versions of the photographs used in the questionnaire.
Figure 4. Enlarged versions of photographs used in the questionnaire. The red arrow indicates 5 cm. The numerical values represent volume concentration (cm3-MPs/m2-sand).
Two studies have explored the relationship between the visual intensity of undesirable features and psychological acceptability. Suyama et al. (2022) investigated bubble area ratios on exposed concrete surfaces and found that acceptability decreased as bubble area increased; thresholds of 0.30% for women and 0.53% for men were proposed as management criteria [31]. Takase et al. (2020) studied kudzu overgrowth on road slopes and observed that acceptability decreased with increasing vegetation, with half of the respondents becoming intolerant once the vines overtopped a fence [32]. The present study adopted a similar methodological approach.
For MPs contained in solid matrices, such as sediments, units expressing the amount of MPs relative to the amount of sediment generally consist of MPs in the numerator and sediment in the denominator. Among reported indicators of MP abundance, particle count (expressed as particles, fragments, number, MPs, etc.) is the most common; a Scopus abstract search yielded 23 matching records (ABS ((“microplastics” and “beach”) and (“particles/m2” or “fragments/m2” or “n/m2” or “MPs/m2”))). Examples include the works of Al-Fares and Al-Zaidan (2025), García-Varens et al. (2025), and Guruge et al. (2025) [36,37,38]. When a single particle breaks into two, particle count doubles, whereas mass and volume remain unchanged. Therefore, although particle count is the most widely used unit for reporting MP abundance, it may not always serve as an appropriate indicator of the actual quantity of MPs. Reports using mass (e.g., mg) are few, with only eight matching records (ABS ((“microplastics” and “beach”) and (“g/m2” or “mg/m2”))). These include studies by Álvarez-Hernández et al. (2019), Edo et al. (2019), González-Hernández et al. (2020), Hernández-Sánchez et al. (2021), Vanapalli et al. (2021), Arturo and Corcoran (2022), Grini et al. (2022), and Domínguez-Hernández et al. (2026) [39,40,41,42,43,44,45,46]. Assuming densely packed PE, PP, PS, PVC, polyethylene terephthalate (PET), etc., the density ranges from 0.87 g/cm3 (PE gloves) to 1.4 g/cm3 (PVC pipes) [33]. Converting the aforementioned cleanliness threshold to mass yields 870–2800 mg-MPs/m2-sand, corresponding to roughly a threefold maximum-to-minimum ratio. However, the apparent density of PP rope containing air voids is 0.49 g/cm3, and that of expanded polystyrene is extremely low at 0.018 g/cm3 [33]. Under these conditions, the cleanliness threshold range becomes 1.8–2800 mg-MPs/m2-sand, with a maximum-to-minimum ratio of 1600. Such a wide range makes mass-based threshold impractical. As noted in Section 3.2, the presence of expanded polystyrene poses a major obstacle when expressing the cleanliness threshold in terms of mass concentration. Finally, we found no reports using MP volume (e.g., cm3), the unit adopted in this study (ABS ((“microplastics” and “beach”) and (“cm3/m2”))). Consequently, direct comparison of our results with previous studies is difficult.
Both area (m2) and mass (kg) are commonly used to express the amount of sediment. When sediment type (e.g., sand) and sampling depth are consistent, area and mass can be interconverted using the sediment’s dry bulk density. However, considering that MPs tend to accumulate near the surface [47,48,49,50], deeper sampling yields consistent results when expressed per unit area but artificially lowers MP abundance when expressed per unit mass because additional clean sediment is included. In this study, only MPs on the sediment surface and visually exposed were recognized; even slightly buried MPs were not detected. This limitation cannot be resolved even when using area-based units.
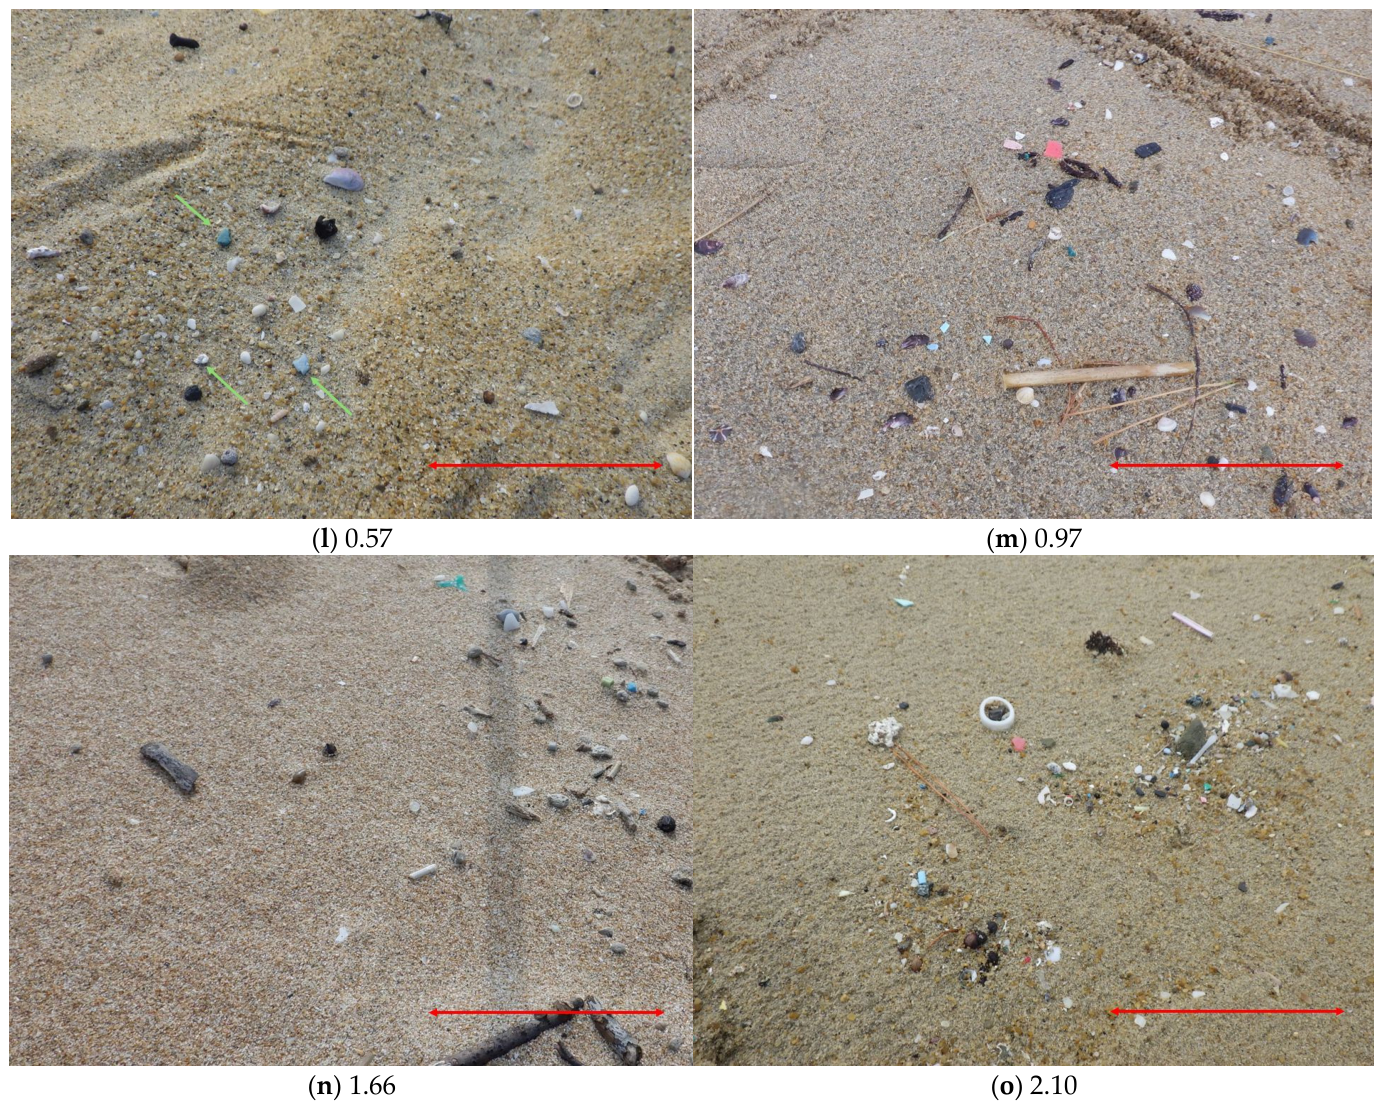
Below, we introduce reported cases using the unit MP mass per sediment area, and position our proposed cleanliness threshold within this context. Few studies have reported MPs on sandy beaches in units of mass per area (mg/m2). Although our study uses mg-MPs/m2-sand, we retain the original units (mg/m2) when citing previous literature. In India, MPs ranged from approximately 300 to 1500 mg/m2 at the high tideline [51], and 1323 ± 1228 mg/m2 at the high tideline and 178 ± 261 mg/m2 at the low tideline [52]. Some studies reported not only MP mass but also polymer types, allowing conversion to volume using densities reported by Asakura (2022) [33]. In Hong Kong, MPs at the high strandline ranged from 0.8 to 250,000 mg/m2, with a mean of 5600 mg/m2 [53]. The mass fractions of dense plastics and expanded polystyrene were 71% and 29%, respectively. Thus, their respective masses were approximately 4000 mg/m2 and 1600*1 mg/m2. Assuming densities of 1 g/cm3 for dense plastics and 0.02 g/cm3 for expanded polystyrene, the corresponding volumes were 4 and 81*1 cm3/m2, totaling 85 cm3/m2. On sandy beaches (shoreline) in the Canary Islands, Spain, MPs ranged from 8500 to 103,000 mg/m2, with a mean of 36,300 mg/m2. Polymer composition was PE (63%), PP (32%), and PS (3%, of which 30% was dense and 70% expanded) [40]. Their respective masses were 23,000, 12,000, 330 (dense), and 760*2 (expanded) mg/m2. Assuming densities of 0.9, 0.9, and 1.0 g/cm3 for dense plastics and 0.02 g/cm3 for expanded polystyrene, the corresponding volumes were 25, 13, 0.31, and 42*2 cm3/m2, totaling 81 cm3/m2. Using the same method, another study in the Canary Islands yielded an estimated volume of 76 cm3/m2 [42]. The volume concentrations obtained from the three case studies (81, 85, and 76 cm3/m2) are similar and correspond to 38–85 times the cleanliness threshold proposed in this study. The fact that the concentrations reported in the literature exceed the maximum value shown in Figure 3g likely reflects measurements of MPs accumulated along the tideline. It is also noteworthy that the proportion of expanded polystyrene changes dramatically when switching between mass-based and volume-based units (*1 and *2). Other studies lacked information on the proportion of expanded polystyrene or did not specify whether polymer composition was based on particle count or mass, preventing conversion to volume concentration. Figure 5 shows photographs taken during an MP survey conducted by one of the authors on sandy beaches in Nagasaki Prefecture, Japan [27]. Because MPs at those sites consisted mainly of PP and PE with no expanded polystyrene, MP volume was estimated from measured mass using a density of 0.9 g/cm3. If the cleanliness threshold proposed in this study were set at 1–2 cm3-MPs/m2-sand, then scenes (j), (k), and (l) would be acceptable to more than half of the respondents, whereas scenes (m), (n), and (o) would be unacceptable to at least half. Although the questionnaire photographs showed only sand and MPs, actual field sites also included shells and plant debris. In our experience, plant materials such as driftwood are easily recognized as natural, whereas shells near MPs are often mistaken for MPs and perceived as “dirty.” For example, in Figure 5l, all particles except those indicated by green arrows are shells or seeds. Shells often have vivid colors—white, red, blue, yellow, and purple—and their fragmented shapes resemble MPs, increasing the likelihood of misidentification. It is not uncommon for colorful shell fragments to accumulate along the shoreline, all of which are natural. Such factors may interfere with visual assessments of cleanliness.
Figure 5. Photographs of MPs on actual sandy beaches arranged in the order of increasing concentration. The red arrow indicates 5 cm. Numerical values represent volume concentration (cm3-MPs/m2-sand). From photographs (mo), more than half of the respondents began to find the scenes psychologically unacceptable. All particles except those indicated by green arrows are shells or seeds (l). Positions corresponding to the volume concentrations of each photograph are shown in Figure 3i.
Several studies also reported MP mass per sediment mass. In India, MPs were found at 81 mg/kg in the intertidal zone [54] and approximately 1–4 mg/kg along shoreline transects [55]. In Belgium, MPs ranged from 0.5 to 1 mg/kg at the high water mark [56]. Although quadrat areas were reported, the total mass of collected sediment was not, preventing conversion from sediment mass to sediment area. These authors likely possess unpublished data on area, mass, and other parameters. If MP abundance could be expressed in multiple units, comparability across studies would improve. Therefore, raw data should be archived online as supplementary materials.

3.4. Response Patterns of Satisficing Respondents

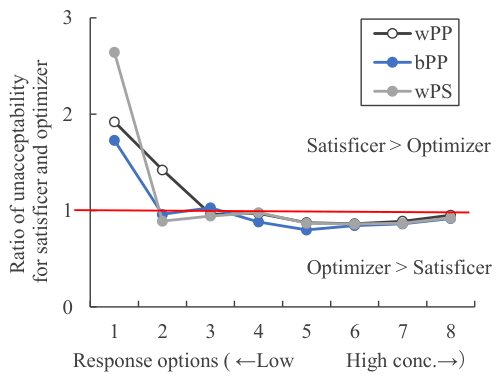
Although results from satisficing respondents were not used in this study’s main analyses, their response patterns provided insight into survey behavior. Compared with optimizing respondents (n = 245), satisficing respondents (n = 255) showed high unacceptability at low concentrations and low unacceptability at high concentrations (Figure 6). At low concentrations, this occurred when respondents marked “YES (unacceptable)” for the first photograph (option 1, 0 mg-MPs/m2-sand). At high concentrations, this occurred when respondents selected the last photograph without viewing all eight images (option 8 lying above the curve formed by options 1–7) or selected option 9 (“all acceptable”). These patterns suggest satisficing behavior—choosing the first or last option without reading the question carefully [57].
Figure 6. Ratio of unacceptability between satisficers and optimizers. Values above 1 on the vertical axis indicate that satisficers show lower tolerance than optimizers. In the legend, w denotes white and b denotes blue.

3.5. Influence of Respondent Characteristics on Acceptability

A multivariate logistic regression analysis was conducted using respondent characteristics—gender (nominal), age (ratio), travel time to the beach (ordinal), frequency of beach visits (ordinal), subjective concern about marine plastic pollution (ordinal), and experience in cleaning public spaces (ordinal)—as explanatory variables, and acceptability (acceptable = 0, unacceptable = 1) as the dependent variable. Because most respondents found low concentrations acceptable and high concentrations unacceptable, our analyses focused on the left- and right-side concentrations near the 50% unacceptability threshold.
Table 2 shows the results for the left-side concentration of white PP. Gender, age, travel time, beach visitation frequency, and cleanup experience did not influence unacceptability (p > 0.05), but concern about marine plastic pollution did (p < 0.05). The negative coefficient (−0.30) indicates that the higher numerical value for the concern-related option (i.e., the lower concern) was associated with lower unacceptability. In other words, individuals with stronger concerns about marine plastic pollution tended to be less tolerant of MP contamination on beaches.
Table 2. Results of multivariate logistic regression analysis for the left-side concentration of white PP.
These findings partially align with previous studies. Suyama et al. (2022) reported that not age but gender differences (women are less tolerant) influenced unacceptability [31], differing from the present study. Takase et al. (2020) found no effect of gender or exposure frequency [32], consistent with the present study, but noted that older individuals and those living farther away were less tolerant [32], contrasting the present findings. Given these mixed results, no consistent trend can be identified.
Table 3 summarizes factors influencing unacceptability (p < 0.05) across all MP types and both left-side and right-side concentrations. In all six cases, stronger concern about marine plastic pollution was associated with lower tolerance (p < 0.05). Additionally, for two right-side concentration cases (blue PP and white PS), more experience in cleaning public spaces was associated with lower tolerance (p < 0.05). Table 4 shows the odds ratios. Although the ordinal scales are qualitative, a one-level increase in the numerical value of concern or cleanup experience (i.e., less concern or less experience) reduced unacceptability to approximately 0.7 times. Conversely, stronger concern or cleanup experience increased unacceptability. These results suggest that environmental education related to marine plastic pollution may increase intolerance toward contamination and shift the cleanliness threshold toward lower concentrations. Although the purpose of the present study differs, previous research has reported that increased knowledge about environmental pollution [58] and environmental education [59] tend to promote behaviors that avoid plastic pollution. While there is broad agreement that efforts to avoid environmental pollution should be encouraged, cleanliness thresholds are merely standards; therefore, the present findings alone do not allow us to determine whether environmental education should be promoted.
Table 3. Results of multivariate logistic regression analysis for three types of MPs and for both left- and right-side concentrations.
Table 4. Results of multivariate logistic regression analysis for all three types of MPs and for both left and right-side concentrations (odds ratios).

3.6. Significance, Limitations, and Future Research

The findings of this study enable the establishment of an upper-limit threshold for MP presence on sandy beaches to maintain visual cleanliness. Because individuals concerned about marine plastic pollution tend to set stricter thresholds, it is important to involve actual beach users when determining the final threshold, especially since few respondents in this study regularly visited the sea.
A limitation of this study is that the gender ratio and age distribution of the sample differed from those of the general population. In addition, it will be necessary to compare the present findings, obtained in Japan, with results from countries that differ in cultural background. This study fixed particle size; therefore, the influence of particle size variation remains unknown. Understanding the minimum particle size detectable by visual inspection and the effect of particle size on acceptability will improve threshold accuracy. Particle shape was also not considered, even though it might influence acceptability. Only MPs visible on the sand surface were evaluated; buried MPs were excluded because they could not be visually detected. Because this study was a basic investigation, the questionnaire used photographs in which only sand and MPs were present. In future research, it will be necessary to examine the effects of differences in indoor and outdoor lighting, as well as the presence of shells or plant debris, on unacceptability. Although numerical thresholds can guide cleanup activities, field workers may find them difficult to apply directly. As Takase et al. (2020) demonstrated in their study of kudzu overtopping a fence [32], it will be beneficial to identify similarly intuitive visual cues or reference points for MPs.

4. Conclusions

We established a threshold for the presence of microplastics (MPs) on sandy beaches on the basis of “visual cleanliness,” derived from the amount of MPs that survey respondents found psychologically unacceptable. Three types of MPs were used: white PP, blue PP, and white PS (expanded polystyrene). The densities of PP and PS were 0.91 and 0.018 g/cm3, respectively. The survey was conducted in Japan, and the number of valid responses was 245. The main findings are summarized below.
  • Mass concentration versus volume concentration:
At the concentration at which half of the respondents judged MP presence as unacceptable, PP exceeded PS by more than a factor of 30 when expressed as mass concentration. In contrast, when expressed as volume concentration, PP exceeded PS by only approximately 1.3 fold. Thus, volume concentration produced more consistent results across different materials. For defining a narrow-range cleanliness threshold, volume concentration is therefore appropriate.
2.
Color-based acceptability:
White particles were expected to be less noticeable because they tended to blend with white shell fragments, which are ubiquitous on beaches. In contrast, blue particles were expected to be less acceptable owing to their rarity. However, we found no difference in unacceptability between white PP and blue PP.
3.
Proposed cleanliness threshold:
If the threshold is defined as the volume concentration at which half of the respondents find MP presence psychologically unacceptable, the range is 1–2 cm3-MPs/m2-sand. Converted to a one-dimensional length unit, this corresponds to 1–2 × 10⁻⁴ cm or 1–2 × 10⁻⁶ m.
4.
Influence of respondent characteristics:
Gender, age, travel time to the beach, and frequency of beach visits did not influence unacceptability. However, individuals with stronger concerns about marine plastic pollution, as well as those with experience in cleaning public spaces, tended to be less tolerant of MP contamination on beaches.

Author Contributions

Conceptualization, methodology, investigation, writing—original draft preparation, visualization, supervision, project administration and funding acquisition, H.A.; writing—review and editing, H.A., K.N., K.-i.S., M.Y. and A.U. All authors have read and agreed to the published version of the manuscript.

Funding

This research was funded by the Japan Society for the Promotion of Science (JSPS), a Grant-in-Aid for Scientific Research C (20K12208). The APC was funded by Nagasaki University.

Institutional Review Board Statement

The study was conducted in accordance with the Declaration of Helsinki, and approved by the Institutional Review Board of Faculty of Environmental Science, Nagasaki University (protocol code FESNU-20231106, 6 November 2023).

Data Availability Statement

In the informed consent for the questionnaire survey, participants were assured that their raw data would not be disclosed to any third parties.

Acknowledgments

Special thanks are extended to Toshiki Sato.

Conflicts of Interest

The authors declare no conflicts of interest. The funders had no role in the design of the study; in the collection, analyses, or interpretation of data; in the writing of the manuscript; or in the decision to publish the results.

Appendix A. Questionnaire Form

  • Questionnaire on Visually Acceptable Amount of Microplastics on Sandy Beaches
(1)
Please indicate your gender.
① Male ② Female
(  )
(2)
Please indicate your age.
① Below 20 ② 20s ③ 30s ④ 40s ⑤ 50s ⑥ 60 or older
(  )
(3)
How long does it take you to reach the beach from your residence when you go there for leisure or work?
① Less than a few minutes ② A few minutes to 30 min ③ 30 min to 1 h
④ 1 to 2 h ⑤ More than 2 h
(  )
(4)
How frequently do you visit the beach or the sea?
① Almost every day ② Several times a week ③ Several times a month
④ Several times a year ⑤ Hardly ever
(  )
(5)
Are you interested in the issue of marine plastic pollution?
① Very interested ② Somewhat interested ③ Neutral
④ Not very interested ⑤ Not interested at all
(  )
(6)
Have you ever participated in volunteer activities, events, or self-initiated efforts to pick up litter or clean public spaces?
① More than 10 times ② Several times ③ Once ④ Never
(  )
(7)
Which type of plastic do you think has the greatest potential to cause marine pollution?
For this question, regardless of your actual opinion, please select polystyrene.
① Polyethylene ② Polypropylene ③ Polyvinyl chloride ④ Polystyrene
(  )
(8)
The following photographs show sand mixed with fine plastic particles (microplastics).
The amount of microplastics increases from ① to ⑧.
Please indicate the number at which you begin to feel that the sand looks dirty (psychologically unacceptable).
(  )
Pollutants 06 00029 i001
Pollutants 06 00029 i002
⑨ All are acceptable
(9)
The following photographs show sand mixed with a different type of microplastic.
The amount of microplastics increases from ① to ⑧.
Please indicate the number at which you begin to feel that the sand looks dirty (psychologically unacceptable).
(  )
Pollutants 06 00029 i003
Pollutants 06 00029 i004
⑨ All are acceptable
(10)
The following photographs show sand mixed with yet another type of microplastic.
The amount of microplastics increases from ① to ⑧.
Please indicate the number at which you begin to feel that the sand looks dirty (psychologically unacceptable).
(  )
Pollutants 06 00029 i005
Pollutants 06 00029 i006
⑨ All are acceptable
This concludes the questionnaire.
Thank you very much for your cooperation.

References

  1. Thompson, R.C.; Moore, C.J.; vom Saal, F.S.; Swan, S.H. Plastics, the environment and human health: Current consensus and future trends. Philos. Trans. R Soc. Lond. B Biol. Sci. 2009, 364, 2153–2166. [Google Scholar] [CrossRef]
  2. Andrady, A.L. Persistence of Plastic Litter in the Oceans. In Marine Anthropogenic Litter; Bergmann, M., Gutow, L., Klages, M., Eds.; Springer: Cham, Switzerland, 2015; pp. 57–72. [Google Scholar] [CrossRef]
  3. Jambeck, J.R.; Geyer, R.; Wilcox, C.; Siegler, T.R.; Perryman, M.; Andrady, A.; Narayan, R.; Law, K.L. Plastic waste inputs from land into the ocean. Science 2015, 347, 768–771. [Google Scholar] [CrossRef]
  4. Andrady, A.L. Microplastics in the marine environment. Mar. Pollut. Bull. 2011, 62, 1596–1605. [Google Scholar] [CrossRef]
  5. Hidalgo-Ruz, V.; Gutow, L.; Thompson, R.C.; Thielet, M. Microplastics in the marine environment: A review of the methods used for identification and quantification. Environ. Sci. Technol. 2012, 46, 3060–3075. [Google Scholar] [CrossRef]
  6. Dris, R.; Gasperi, J.; Saad, M.; Mirande, C.; Tassin, B. Synthetic fibers in atmospheric fallout: A source of microplastics in the environment? Mar. Pollut. Bull. 2016, 104, 290–293. [Google Scholar] [CrossRef] [PubMed]
  7. Allen, S.; Allen, D.; Phoenix, V.R.; Le Roux, G.; Jiménez, P.D.; Simonneau, A.; Binet, S.; Galop, D. Atmospheric transport and deposition of microplastics in a remote mountain catchment. Nat. Geosci. 2019, 12, 339–344. [Google Scholar] [CrossRef]
  8. Gall, S.C.; Thompson, R.C. The impact of debris on marine life. Mar. Pollut. Bull. 2015, 92, 170–179. [Google Scholar] [CrossRef]
  9. Kühn, S.; Bravo Rebolledo, E.L.; van Franeker, J.A. Deleterious Effects of Litter on Marine Life. In Marine Anthropogenic Litter; Bergmann, M., Gutow, L., Klages, M., Eds.; Springer: Cham, Switzerland, 2015; pp. 75–116. [Google Scholar] [CrossRef]
  10. Cole, M.; Lindeque, P.; Halsband, C.; Galloway, T.S. Microplastics as contaminants in the marine environment: A review. Mar. Pollut. Bull. 2011, 62, 2588–2597. [Google Scholar] [CrossRef]
  11. Wright, S.L.; Kelly, F.J. Plastic and human health: A micro issue? Environ. Sci. Technol. 2017, 51, 6634–6647. [Google Scholar] [CrossRef] [PubMed]
  12. Teuten, E.L.; Saquing, J.M.; Knappe, D.R.; Barlaz, M.A.; Jonsson, S.; Björn, A.; Rowland, S.J.; Thompson, R.C.; Galloway, T.S.; Yamashita, R.; et al. Transport and release of chemicals from plastics to the environment and to wildlife. Philos. Trans. R Soc. Lond. B Biol. Sci. 2009, 364, 2027–2045. [Google Scholar] [CrossRef]
  13. Rochman, C.M.; Hoh, E.; Kurobe, T.; Teh, S.J. Ingested plastic transfers hazardous chemicals to fish and induces hepatic stress. Sci. Rep. 2013, 3, 3263. [Google Scholar] [CrossRef]
  14. Galloway, T.S.; Cole, M.; Lewis, C. Interactions of microplastic debris throughout the marine ecosystem. Nat. Ecol. Evol. 2017, 1, 0116. [Google Scholar] [CrossRef] [PubMed]
  15. Hartmann, C.; Lomako, I.; Schachner, C.; Said, E.E.; Abert, J.; Satrapa, V.; Kaiser, A.-M.; Walch, H.; Köppel, S. Assessment of microplastics in human stool: A pilot study investigating the potential impact of diet-associated scenarios on oral microplastics exposure. Sci. Total Environ. 2024, 951, 175825. [Google Scholar] [CrossRef]
  16. Leslie, H.A.; van Velzen, M.J.M.; Brandsma, S.H.; Dick Vethaak, A.; Garcia-Vallejo, J.J.; Lamoree, M.H. Discovery and quantification of plastic particle pollution in human blood. Environ. Int. 2022, 163, 107199. [Google Scholar] [CrossRef] [PubMed]
  17. Ragusa, A.; Svelato, A.; Santacroce, C.; Catalano, P.; Notarstefano, V.; Carnevali, O.; Papa, F.; Rongioletti, M.C.A.; Baiocco, F.; Draghi, S.; et al. Plasticenta: First evidence of microplastics in human placenta. Environ. Int. 2021, 146, 106274. [Google Scholar] [CrossRef]
  18. Jenner, L.C.; Rotchell, J.M.; Bennett, R.T.; Cowen, M.; Tentzeris, V.; Sadofsky, L.R. Detection of microplastics in human lung tissue using μFTIR spectroscopy. Sci. Total Environ. 2022, 831, 154907. [Google Scholar] [CrossRef]
  19. United Nations Environment Programme (UNEP). End Plastic Pollution: Towards an International Legally Binding Instrument. Available online: https://www.informea.org/en/decision/end-plastic-pollution-towards-international-legally-binding-instrument (accessed on 10 February 2026).
  20. Geyer, R.; Jambeck, J.R.; Law, K.L. Production, use, and fate of all plastics ever made. Sci. Adv. 2017, 3, e1700782. [Google Scholar] [CrossRef]
  21. European Commission. A European Strategy for Plastics in a Circular Economy. Available online: https://www.europarc.org/wp-content/uploads/2018/01/Eu-plastics-strategy-brochure.pdf (accessed on 10 February 2026).
  22. Kershaw, P.J.; Turra, A.; Galgani, F. GESAMP Guidelines for the Monitoring and Assessment of Plastic Litter and Microplastics in the Ocean; GESAMP Reports and Studies No. 99; GESAMP Joint Group of Experts on the Scientific Aspects of Marine Environmental Protection: London, UK, 2019; 130p. [Google Scholar]
  23. Koelmans, A.A.; Besseling, E.; Foekema, E.; Kooi, M.; Mintenig, S.; Ossendorp, B.C.; Redondo-Hasselerharm, P.E.; Verschoor, A.; van Wezel, A.P.; Scheffer, M. Risks of plastic debris: Unravelling fact, opinion, perception, and belief. Environ. Sci. Technol. 2017, 51, 11513–11519. [Google Scholar] [CrossRef] [PubMed]
  24. Napper, I.E.; Thompson, R.C. Release of synthetic microplastic plastic fibres from domestic washing machines: Effects of fabric type and washing conditions. Mar. Pollut. Bull. 2016, 112, 39–45. [Google Scholar] [CrossRef]
  25. McDevitt, J.P.; Criddle, C.S.; Morse, M.; Hale, R.C.; Bott, C.B.; Rochman, C.M. Addressing the Issue of Microplastics in the Wake of the Microbead-Free Waters Act-A New Standard Can Facilitate Improved Policy. Environ. Sci. Technol. 2017, 51, 6611–6617. [Google Scholar] [CrossRef]
  26. Koelmans, A.A.; Redondo Hasselerharm, P.E.; Mohamed Nor, N.H.; de Ruijter, V.N.; Mintenig, S.M.; Kooi, M. Risk Assessment of Microplastic Particles. Nat. Rev. Mater. 2022, 7, 138–152. [Google Scholar] [CrossRef]
  27. Asakura, H. Representation of investigation results of microplastics on sandy beaches accumulation rate and abundance in the entire study site. PeerJ 2024, 12, e17207. [Google Scholar] [CrossRef]
  28. Okajima, T.; Kawabe, S.; Mizoguchi, Y.; Kuno, M. Visual assessment of surface finishing concrete. Cem. Res. Technol. 1994, 5, 95–102. (In Japanese) [Google Scholar]
  29. Liu, L.; Masuda, Y.; Konishi, T.; Sakaki, T. Sensibility evaluation to colored architectural concrete using color sand and pigments. J. Struct. Constr. Eng. 2008, 73, 1233–1238. (In Japanese) [Google Scholar] [CrossRef]
  30. Byun, K.; Yoshizawa, N.; Munakata, J.; Koga, T.; Hirate, K. A study of allowable value of the sense of physical oppression and the sense of openness by solid angle. J. Environ. Eng. 2013, 78, 437–444. [Google Scholar] [CrossRef][Green Version]
  31. Suyama, H.; Takasu, K.; Koyamada, H. A consideration on acceptable limits of appearance of bug-holes, cracks, cold joints and staining on exposed concrete. J. Struct. Constr. Eng. 2022, 87, 241–250. (In Japanese) [Google Scholar] [CrossRef]
  32. Takase, Y.; Oikawa, S.; Enomoto, T.; Katata, G.; Sakagami, N. People’s Attitude Towards Strategies to Control Kudzu (Pueraria lobata (Willd.) Ohwi) During Road Slope Revegetation. Pap. Environ. Inf. Sci. 2020, 34, 174–179. (In Japanese) [Google Scholar] [CrossRef]
  33. Asakura, H. Plastic Bottles for Sorting Floating Microplastics in Sediment. J. Mar. Sci. Eng. 2022, 10, 390. [Google Scholar] [CrossRef]
  34. Kanda, Y. Investigation of the freely-available easy-to-use software “EZR” (Easy R) for medical statistics. Bone Marrow Transpl. 2013, 48, 452–458. [Google Scholar] [CrossRef]
  35. Statistics Bureau, Ministry of Internal Affairs and Communications, Japan. Population Estimates. Available online: https://www.stat.go.jp/data/jinsui/index.html (accessed on 10 February 2026).
  36. Al-Fares, E.A.; Al-Zaidan, A.S.Y. Occurrence of macro- and microplastics in sediment and mudskippers from Ashish Al-Doha, Kuwait. Kuwait J. Sci. 2025, 52, 100423. [Google Scholar] [CrossRef]
  37. García-Varens, M.A.; Alonso-Hernandez, C.M.; García-Chamero, A.; Reyes-Noa, D.; Hernández-Albernas, J.; del Rosario-Silva, A.M.; Oberhaensli, F.; Metian, M.; Mendoza, L.M.R.; Bernard, N.; et al. Assessment of microplastics particles (0.3–5 mm) in sandy beaches of Cuba. Mar. Pollut. Bull. 2025, 214, 117786. [Google Scholar] [CrossRef] [PubMed]
  38. Guruge, K.P.G.K.P.; Siriwardhana, S.M.U.P.; Bandara, T.; Suwandhahannadi, W.K.; Jayarathna, W.N.D.S.; Hewathilake, H.P.T.S.; Kumara, P.B.T.P. Assessment of marine debris and plastic pollution along the western coast of Sri Lanka. Reg. Stud. Mar. Sci. 2025, 86, 104176. [Google Scholar] [CrossRef]
  39. Álvarez-Hernández, C.; Cairós, C.; López-Darias, J.; Mazzetti, E.; Hernández-Sánchez, C.; González-Sálamo, J.; Hernández-Borges, J. Microplastic debris in beaches of Tenerife (Canary Islands, Spain). Mar. Pollut. Bull. 2019, 146, 26–32. [Google Scholar] [CrossRef]
  40. Edo, C.; Tamayo-Belda, M.; Martínez-Campos, S.; Martín-Betancor, K.; González-Pleiter, M.; Pulido-Reyes, G.; García-Ruiz, C.; Zapata, F.; Leganés, F.; Fernández-Piñas, F.; et al. Occurrence and identification of microplastics along a beach in the Biosphere Reserve of Lanzarote. Mar. Pollut. Bull. 2019, 143, 220–227. [Google Scholar] [CrossRef]
  41. González-Hernández, M.; Hernández-Sánchez, C.; González-Sálamo, J.; López-Darias, J.; Hernández-Borges, J. Monitoring of meso and microplastic debris in Playa Grande beach (Tenerife, Canary Islands, Spain) during a moon cycle. Mar. Pollut. Bull. 2020, 150, 110757. [Google Scholar] [CrossRef]
  42. Hernández-Sánchez, C.; González-Sálamo, J.; Díaz-Peña, F.J.; Fraile-Nuez, E.; Hernández-Borges, J. Arenas Blancas (El Hierro island), a new hotspot of plastic debris in the Canary Islands (Spain). Mar. Pollut. Bull. 2021, 169, 112548. [Google Scholar] [CrossRef]
  43. Vanapalli, K.R.; Dubey, B.K.; Sarmah, A.K.; Bhattacharya, J. Assessment of microplastic pollution in the aquatic ecosystems—An indian perspective. Case Stud. Chem. Environ. Eng. 2021, 3, 100071. [Google Scholar] [CrossRef]
  44. Arturo, I.A.; Corcoran, P.L. Categorization of plastic debris on sixty-six beaches of the Laurentian Great Lakes, North America. Environ. Res. Lett. 2022, 17, 045008. [Google Scholar] [CrossRef]
  45. Grini, H.; Metallaoui, S.; González-Fernández, D.; Bensouilah, M. First evidence of plastic pollution in beach sediments of the Skikda coast (northeast of Algeria). Mar. Pollut. Bull. 2022, 181, 113831. [Google Scholar] [CrossRef]
  46. Domínguez-Hernández, C.; Villanova-Solano, C.; Álvarez, S.; Álvarez-Méndez, S.J.; Alves, A.; Canning-Clode, J.; Abu-Raya, M.d.C.; Díaz-Peña, F.J.; Garcia, S.; Gómez, M.; et al. Plastic occurrence in Macaronesia: Three years of monitoring on forty-six beaches across nineteen islands in an Atlantic region. Sci. Total Environ. 2026, 1010, 181064. [Google Scholar] [CrossRef] [PubMed]
  47. Duncan, E.M.; Arrowsmith, J.; Bain, C.; Broderick, A.C.; Lee, J.; Metcalfe, K.; Pikesley, S.K.; Snape, R.T.E.; van Sebille, E.; Godley, B.J. The true depth of the Mediterranean plastic problem: Extreme microplastic pollution on marine turtle nesting beaches in Cyprus. Mar. Pollut. Bull. 2018, 136, 334–340. [Google Scholar] [CrossRef]
  48. Sewwandi, M.; Amarathunga, A.A.D.; Wijesekara, H.; Mahatantila, K.; Vithanage, M. Contamination and distribution of buried microplastics in Sarakkuwa beach ensuing the MV X-Press Pearl maritime disaster in Sri Lankan sea. Mar. Pollut. Bull. 2022, 184, 114074. [Google Scholar] [CrossRef]
  49. Nhon, N.T.T.; Nguyen, N.T.; Hai, H.T.N.; Hien, T.T. Distribution of microplastics in beach sand on the Can Gio coast, Ho Chi Minh city, Vietnam. Water 2022, 14, 2779. [Google Scholar] [CrossRef]
  50. Asakura, H. Accuracy of a Simple Microplastics Investigation Method on Sandy Beaches. Microplastics 2023, 2, 304–321. [Google Scholar] [CrossRef]
  51. Jayasiri, H.B.; Purushothaman, C.S.; Vennila, A. Quantitative analysis of plastic debris on recreational beaches in Mumbai, India. Mar. Pollut. Bull. 2013, 77, 107–112. [Google Scholar] [CrossRef]
  52. Karthik, R.; Robin, R.S.; Purvaja, R.; Ganguly, D.; Anandavelu, I.; Raghuraman, R.; Hariharan, G.; Ramakrishna, A.; Ramesh, R. Microplastics along the beaches of southeast coast of India. Sci. Total Environ. 2018, 645, 1388–1399. [Google Scholar] [CrossRef] [PubMed]
  53. Fok, L.; Cheung, P.K. Hong Kong at the Pearl River Estuary: A hotspot of microplastic pollution. Mar. Pollut. Bull. 2015, 99, 112–118. [Google Scholar] [CrossRef]
  54. Reddy, M.S.; Basha, S.; Adimurthy, S.; Ramachandraiah, G. Description of the small plastics fragments in marine sediments along the Alang-Sosiya ship-breaking yard, India. Estuar. Coast. Shelf Sci. 2006, 68, 656–660. [Google Scholar] [CrossRef]
  55. Tiwari, M.; Rathod, T.D.; Ajmal, P.Y.; Bhangare, R.C.; Sahu, S.K. Distribution and characterization of microplastics in beach sand from three different Indian coastal environments. Mar. Pollut. Bull. 2019, 140, 262–273. [Google Scholar] [CrossRef]
  56. Claessens, M.; Meester, S.D.; Landuyt, L.V.; Clerck, K.D.; Janssen, C.R. Occurrence and distribution of microplastics in marine sediments along the Belgian coast. Mar. Pollut. Bull. 2011, 62, 2199–2204. [Google Scholar] [CrossRef]
  57. Kaminska, O.; McCutcheon, A.L.; Billiet, J. Satisficing Among Reluctant Respondents in a Cross-National Context. Public Opin. Q. 2010, 74, 956–984. [Google Scholar] [CrossRef]
  58. Yoon, A.; Jeong, D.; Chon, J. The impact of the risk perception of ocean microplastics on tourists’ pro-environmental behavior intention. Sci. Total Environ. 2021, 774, 144782. [Google Scholar] [CrossRef]
  59. Liu, J.; Hu, Z.; Du, F.; Tang, W.; Zheng, S.; Lu, S.; An, L.; Ding, J. Environment education: A first step in solving plastic pollution. Front. Environ. Sci. 2023, 11, 1130463. [Google Scholar] [CrossRef]
Disclaimer/Publisher’s Note: The statements, opinions and data contained in all publications are solely those of the individual author(s) and contributor(s) and not of MDPI and/or the editor(s). MDPI and/or the editor(s) disclaim responsibility for any injury to people or property resulting from any ideas, methods, instructions or products referred to in the content.

Article Metrics

Citations

Article Access Statistics

Multiple requests from the same IP address are counted as one view.