


Abstract
Non-destructive techniques for the analysis of cultural heritage items are of the outmost importance in order to understand better the artworks, to assess their conservation conditions and to evaluate a possible restoration intervention. Among these techniques, pulsed infrared thermography plays an important role, since it is simple and quite powerful. A standard experimental setup employs flash lamps for the delivery of a pulse of visible light to heat the sample and an infrared camera to record the consequent radiation emission. In this study, this technique was applied for studying ancient manuscripts and, in particular, for revealing hidden text buried under the end leaves of the book. A mathematical model developed by the authors is briefly detailed. The finite element method was employed to numerically solve the model equations and perform numerical simulations. The numerical results highlight the influence of some parameters involved in this phenomenon and can be used for a quantitative analysis of the experimental findings.
1. Introduction
Pulsed infrared thermography is a well-established technique for the non-destructive analysis of cultural heritage items. The typical setup is composed of a set of lamps for delivering a pulse of visible light to the sample. Upon the absorption of the excitation light, heat is generated inside the sample, and consequently, infrared radiation is emitted, which is detected by an infrared camera. Possible features or defects lying under the visible surface of the investigated specimen alter the heat diffusion and, consequently, the temperature profile of the sample. Accordingly, they appear on the detected infrared images with a time delay depending on the depth of the feature under the visible surface. The possible artworks which can be investigated using this technique can be divided into two groups depending on their optical characteristics. The first group includes optically opaque artworks such as bronze statues. In these materials, all the excitation visible light is absorbed in correspondence of the surface of the specimen, and all the infrared radiation emitted from inside the specimen is absorbed by the layers above. Accordingly, only the radiation emitted in correspondence of the visible surface of the specimen is detected by the infrared camera, and thus, the detected signal is proportional to the surface temperature [1]. The optically semi-transparent materials belong to the second group. In this typology of artworks, like ancient books and parchments, the excitation visible light is also absorbed inside the specimen, and the inner layers inside the specimen contribute to the infrared radiation detected by the camera [2]. Any feature located inside a specimen belonging to this latter category can be detected by the camera because of three different phenomena. The first one is the discontinuity in heat conduction across the feature, similar to the case of optically opaque materials. The second one is related to the possibility that the feature will absorb part of the illumination excitation and be heated differently from the surrounding medium. The third phenomenon is an optical one and is related to the infrared emissivity of the feature, which is different from the emissivity of the surrounding medium; thus, even if the entire specimen is at the same temperature, the feature will be visible in the detected infrared image. In this paper, the case of optically semi-transparent materials is considered, and an accurate mathematical model is detailed for the description of infrared emission in a paper sheet containing an ink layer at a certain depth after the absorption of a pulse of visible light. In this model, the paper sheet is considered as a tri-dimensional medium, whereas the ink layer, whose thickness is much less than the paper’s thickness, is considered as a two-dimensional domain upon the application of the concentration of capacity mathematical technique. A finite-element scheme is adopted to numerically solve the model equations, and a MATLAB program is written to perform the numerical simulations used to assess the influence of the various physical parameters in the model. In a forthcoming study of the same authors, the model will be used to gain a quantitative understanding of measurements performed on an ancient manuscript containing hidden texts.
2. The Mathematical Model
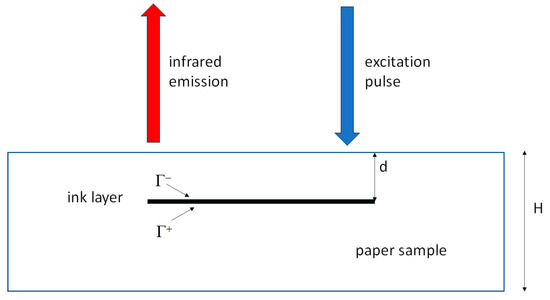
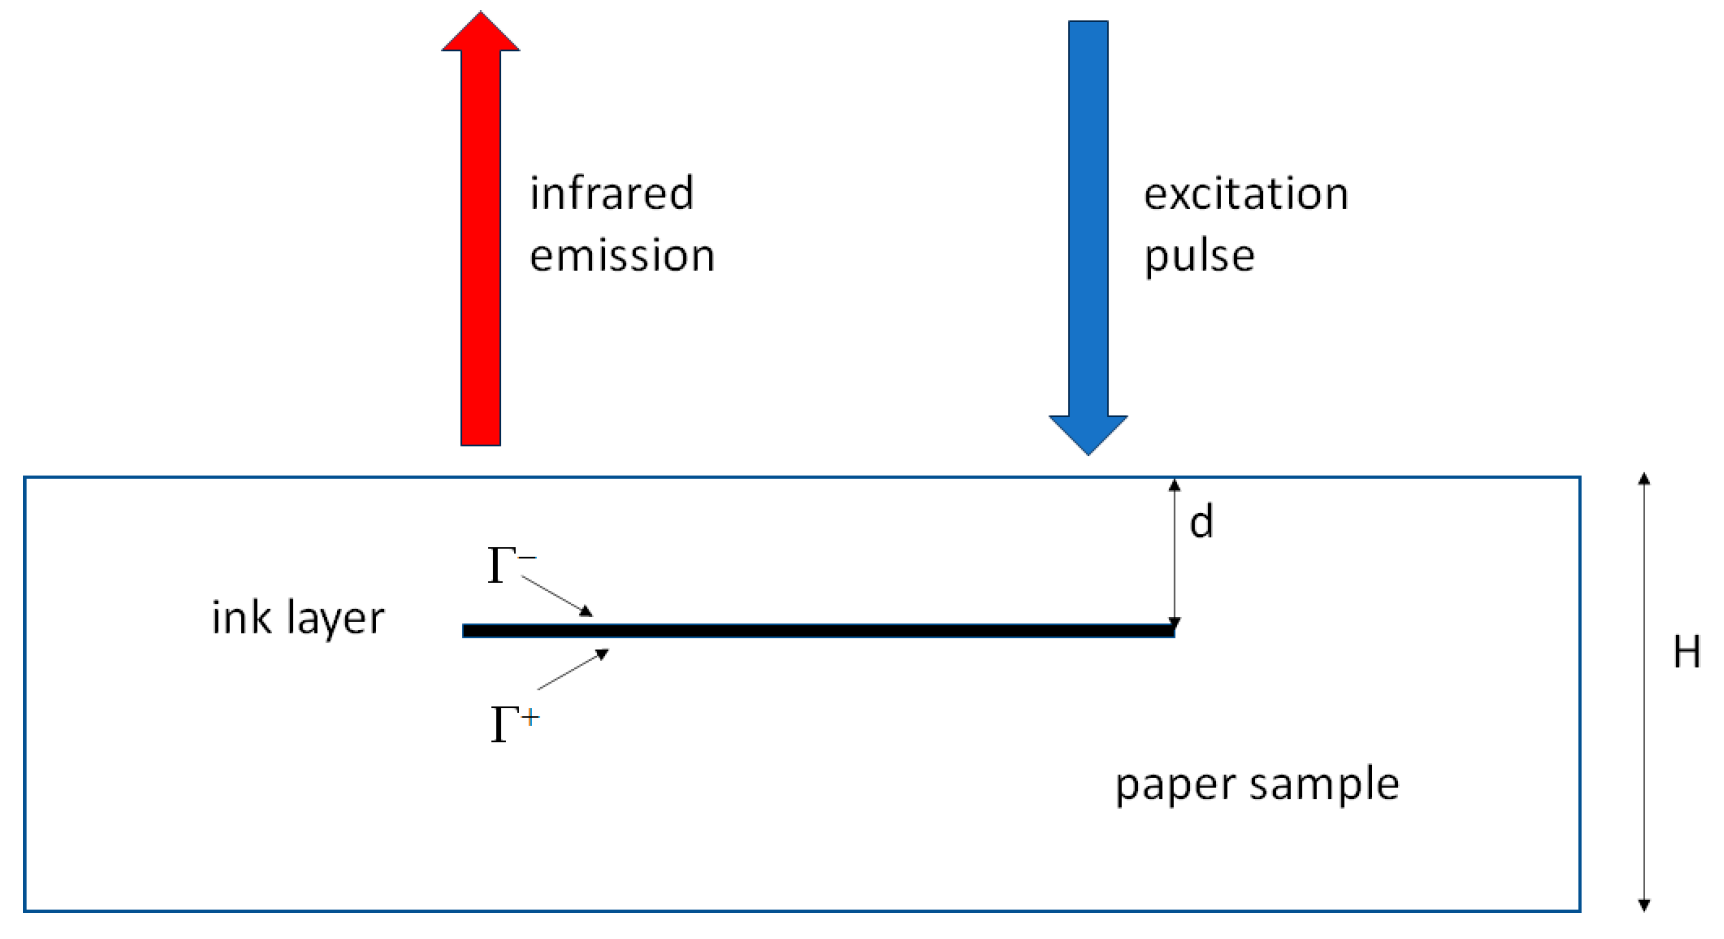
In this section, a mathematical model developed by the authors for the description of the infrared signal generated from a paper sheet containing an ink layer is described [2,3]. A rectangular paper specimen is considered, with lateral sides A and B and thickness H, containing an ink layer of lateral dimensions a and b and thickness h << H, buried at a certain depth d under the paper surface, as depicted in Figure 1.
Figure 1.
Schematic representation of the paper specimen containing an ink layer.
A Cartesian frame is introduced, with its origin in the center of the upper surface of the specimen, the (x, y) = axes parallel to the specimen’s lateral sides and vertical axis z pointing downward. Moreover, let t denote the time. If Ts(, z, t) and Ti(, t) indicate the temperature inside the paper and the ink domain, respectively, the following field equations for Ts and Ti can be written:
where the pedex s indicates quantities relevant to the paper, and the pedex i denotes quantities relevant to the ink layer. In (1) ρ, c, and k are the mass density, the specific heat, and the heat conductivity, respectively, and ∆ is the Laplacian operator, where the pedex indicates that the spatial derivatives are along the planar coordinates only. The terms fs and fi are the heat generated, respectively, inside the paper and the ink layer, whose expression is given as:
where I(, z) is the spatial profile of the illumination light intensity; δ(t) is the Dirac mass in t = 0; Γ+ and Γ− denote the interface between the ink layer and the surrounding paper for z = d+ and z = d−, respectively; and [I(, z)]z=d is the jump of I across z = d. In the region containing the ink layer, I(, z) is given as:
where α is the visible light absorption coefficient of the paper, and it is assumed that the ink layer is able to absorb all the visible light reaching it. In the region not containing the ink layer, the following expression holds:
where it is assumed that there are infinite reflections on the front and rear surfaces of the paper specimen [4]. Once the temperature inside the paper and the ink layer has been computed, the infrared radiation signal S detected by the camera is given as:
which is relevant to the portion of the sample containing the ink layer, where β is the infrared absorption coefficient of the paper, η is the ink layer’s concentrated emissivity, and κ is a scaling constant. From this expression, two contributions clearly appear, one relevant to the ink layer and one relevant to the surrounding paper. In the region not containing the ink layer, the following expression holds:
The equations describing the developed model were numerically solved using the finite-element method based on a weak formulation of the problem. The paper domain was discretized into prisms with triangular bases, whereas the ink domain was discretized into triangles. Linear shape functions were adopted to interpolate the nodal unknowns inside each element, and a standard isoparametric map was adopted in order to compute the integrals contained in the weak formulation inside each element and, accordingly, build the mass and stiffness matrices of the discretized problem. Finally, the Crank-Nicolson method was used for time integration.
3. Numerical Results
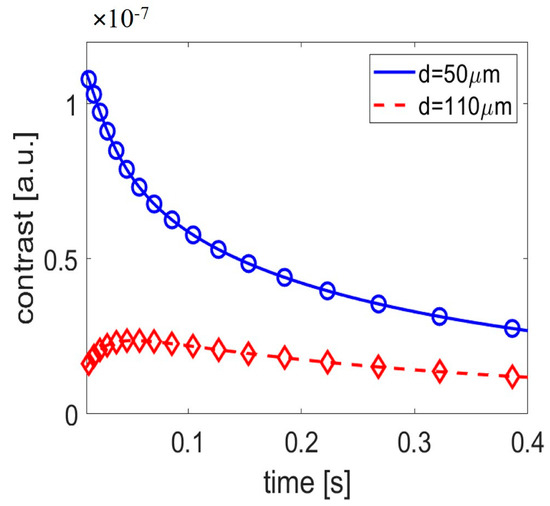
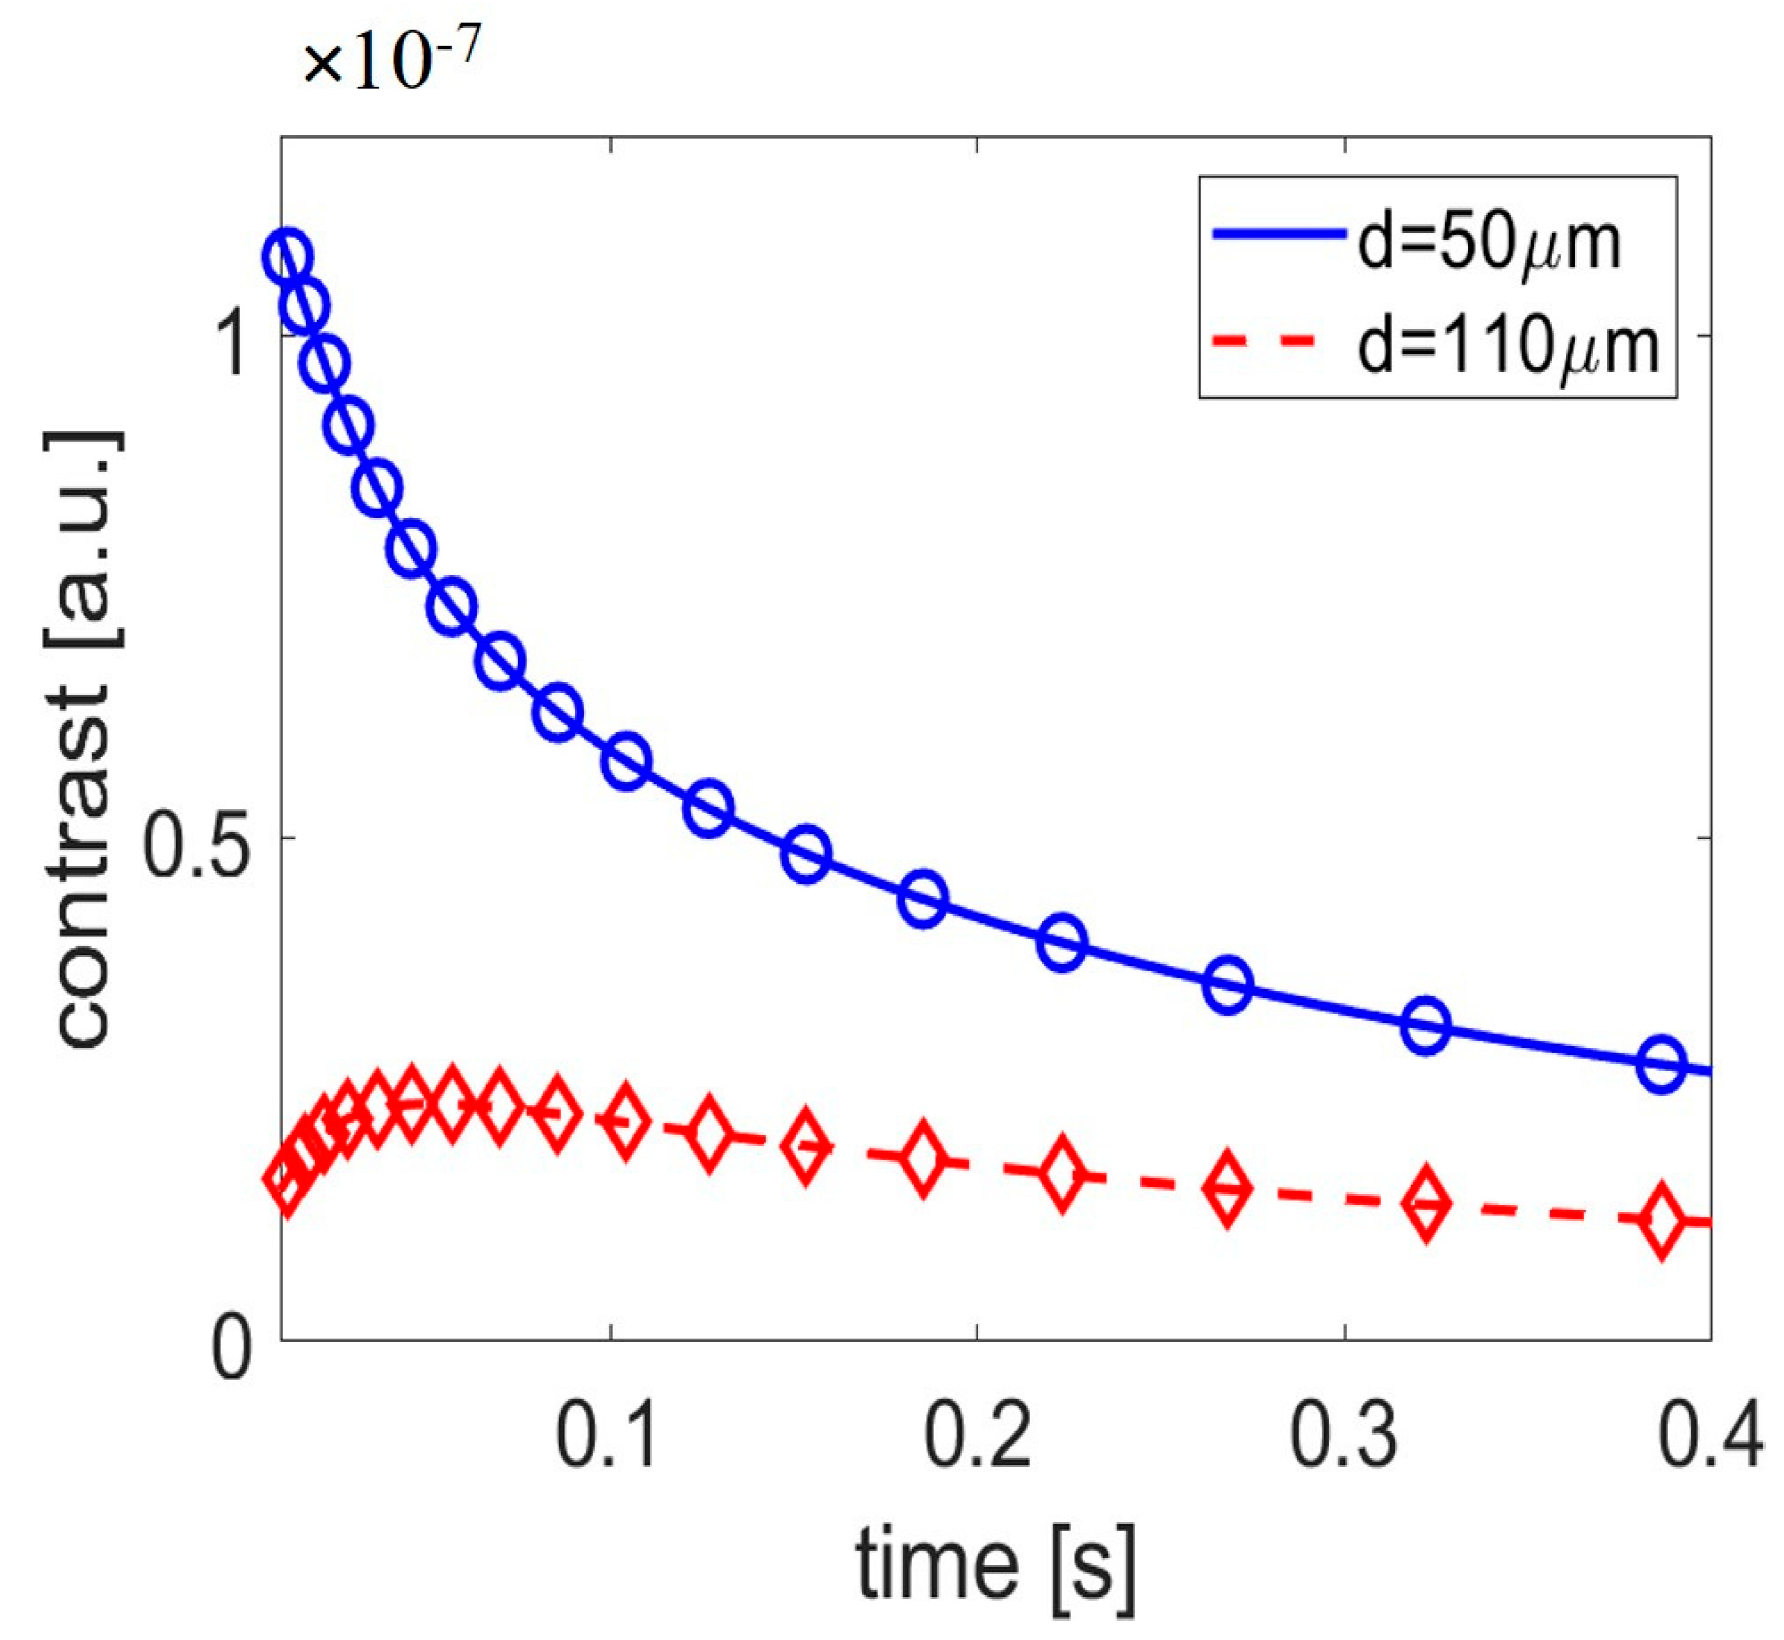
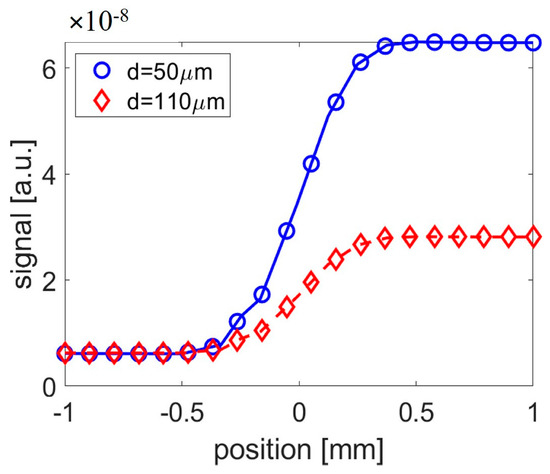
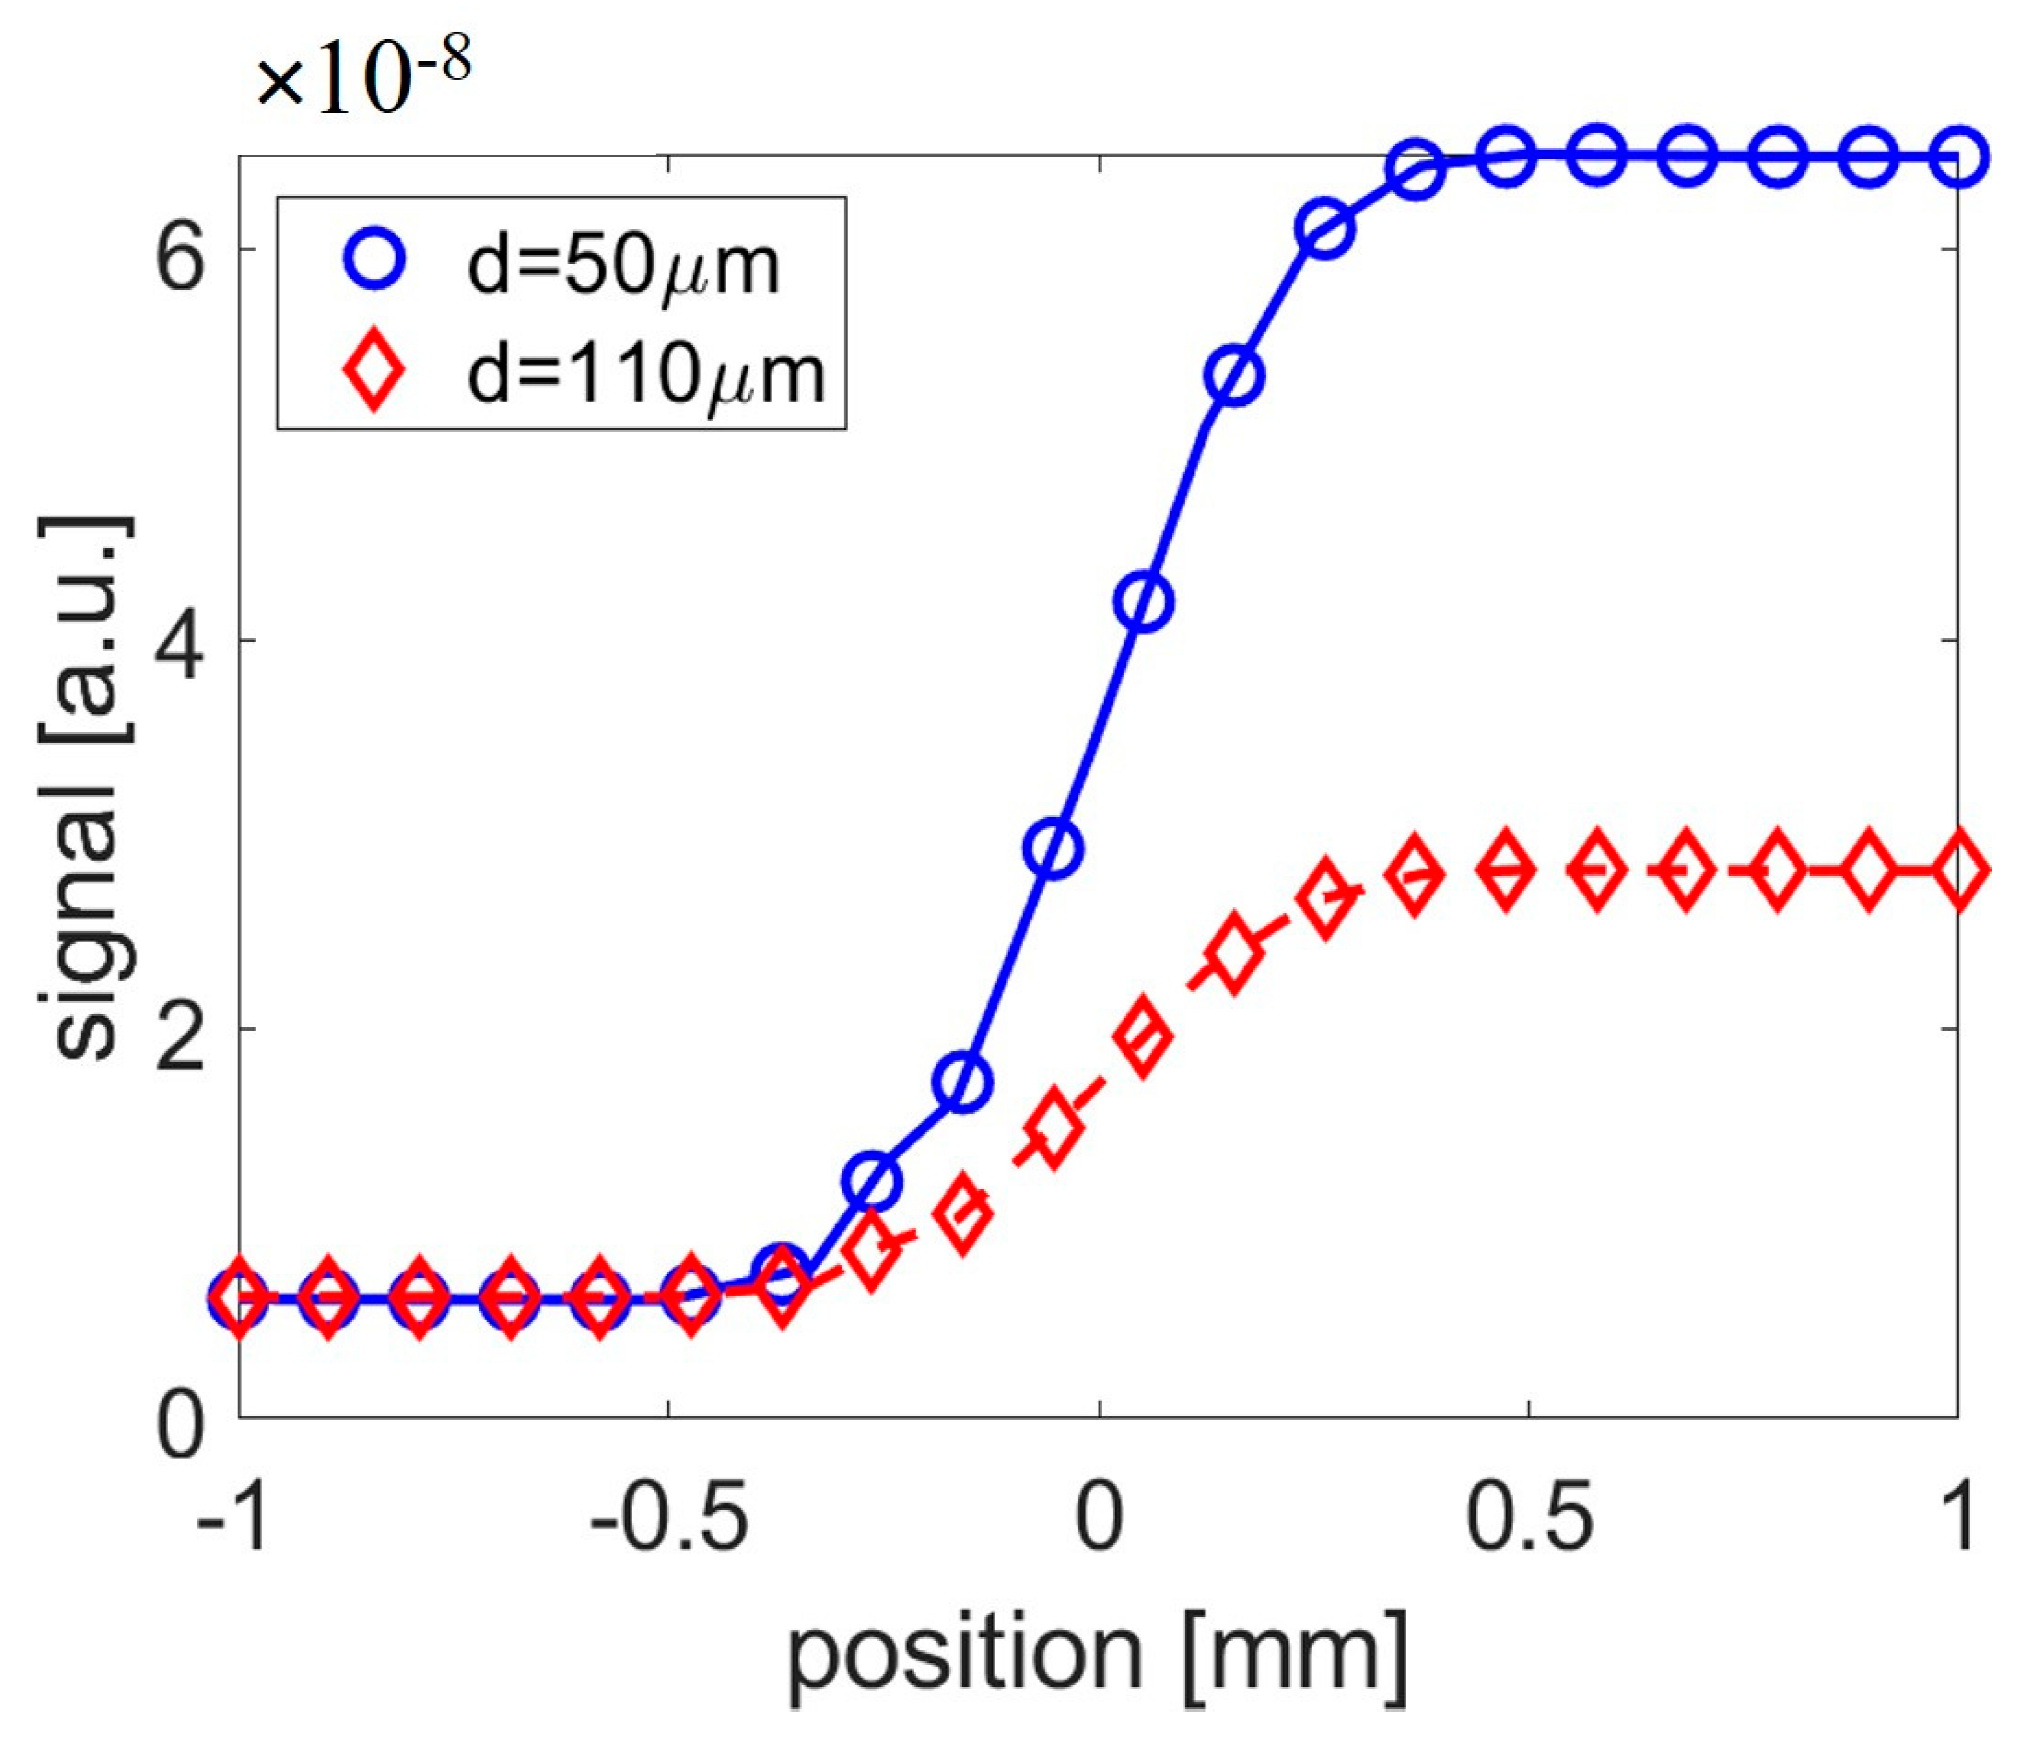
In this section, some numerical results obtained using the previously described model are reported. The reported results are referred to specimens, as depicted in Figure 1, using the parameter values reported in Table 1 in [2]. In Figure 2, the infrared signal contrast versus time is reported, defined as the difference between the signal at one point and the signal far away from the ink layer region, in correspondences of d = 50 µm and d = 110 µm, respectively. In Figure 3, the infrared signal is reported, computed at t = 0.1 s along a segment of 4 mm in length, perpendicularly crossing the side of the ink layer.
Figure 2.
Signal contrast versus time in correspondence of two values of d.
Figure 3.
Signal along a segment perpendicularly crossing the ink layer boundary computed at t = 0.1 s.
Looking at Figure 2, it can be noted that the curve relevant to d = 50 µm starts from a maximum at t = 0 and monotonically decreases with time. In this case, the direct emission of infrared radiation from the ink layer prevails with respect to the emission from the surrounding paper. On the contrary, the curve relevant to d = 110 µm exhibits its maximum at a later time. In this case, the infrared radiation from the surrounding paper is dominant. Considering Figure 3, it can be noted that the infrared signal on the ink layer is much larger for d = 50 µm than for d = 110 µm, whereas it is independent from d, being sufficiently far from the ink layer region. Moreover, the transition between the signal emitted from the ink layer and inside the ink layer is smooth due to heat lateral diffusion. This produces a blurring effect of the ink layer image detected by the camera, which increases with time.
Author Contributions
Conceptualization, G.C.; methodology, F.M., U.Z. and S.P.; investigation N.O., F.M. and S.P.; data curation, G.C. and N.O.; writing—original draft preparation, G.C.; writing—review and editing, G.C. and N.O. All authors have read and agreed to the published version of the manuscript.
Funding
This research received no external funding.
Institutional Review Board Statement
Not applicable.
Informed Consent Statement
Any research article describing a study involving humans.
Data Availability Statement
Data available on request.
Conflicts of Interest
The authors declare no conflict of interest.
References
- Mercuri, F.; Caruso, G.; Orazi, N.; Zammit, U.; Cicero, C.; Colacicchi Alessandri, O.; Ferretti, M.; Paoloni, S. Interface thermal conductance characterization by infrared thermography: A tool for the study of insertions in bronze ancient Statuary. Infrared Phys. Technol. 2018, 90, 31–39. [Google Scholar] [CrossRef] [Scilit]
- Caruso, G.; Mercuri, F.; Zammit, U.; Paoloni, S.; Ceccarelli, S.; Orazi, N. 3D heat flow effects in the imaging of subsurface graphical features in semi-transparent media by pulsed thermography. Measurement 2021, 185, 110111. [Google Scholar] [CrossRef] [Scilit]
- Caruso, G.; Paoloni, S.; Orazi, N.; Cicero, C.; Zammit, U.; Mercuri, F. Quantitative evaluations by infrared thermography in optically semi-transparent paper-based artefacts. Measurement 2019, 143, 256–258. [Google Scholar] [CrossRef] [Scilit]
- Salazar, A.; Mendioroz, A.; Apinaniz, E.; Pradere, C.; Noel, F.; Batsale, J.-C. Extending the flash method to measure the thermal diffusivity of semitransparent solids. Meas. Sci. Technol. 2014, 25, 035604. [Google Scholar] [CrossRef] [Scilit]
Disclaimer/Publisher’s Note: The statements, opinions and data contained in all publications are solely those of the individual author(s) and contributor(s) and not of MDPI and/or the editor(s). MDPI and/or the editor(s) disclaim responsibility for any injury to people or property resulting from any ideas, methods, instructions or products referred to in the content. |
© 2023 by the authors. Licensee MDPI, Basel, Switzerland. This article is an open access article distributed under the terms and conditions of the Creative Commons Attribution (CC BY) license (https://creativecommons.org/licenses/by/4.0/).